44
Fast Retailing Co., Ltd. Consolidated Financial Statements for the year ended 31 August 2016

Fast Retailing Co., Ltd.
Consolidated Financial Statements
for the year ended 31 August 2016


1
Millions of yenThousands of
U.S. dollars
2015 2016 2016ASSETSCurrent assets:
Cash and cash equivalents ¥ 355,212 ¥ 385,431 $ 3,735,160 Trade and other receivables 44,777 45,178 437,817 Other current financial assets 22,593 184,239 1,785,436 Inventories 260,006 270,004 2,616,575 Derivative financial assets 157,490 569 5,515 Income taxes receivable 18,564 21,626 209,582 Others 15,748 17,534 169,926 Total current assets 874,394 924,583 8,960,013
Non-current assets:Property, plant and equipment 129,340 121,853 1,180,869 Goodwill 27,165 17,908 173,549 Other intangible assets 40,991 34,205 331,484 Non-current financial assets 75,940 77,553 751,555 Investments in an associate − 13,132 127,266 Deferred tax assets 11,107 44,428 430,550 Others 4,766 4,453 43,155 Total non-current assets 289,311 313,535 3,038,432 Total assets ¥1,163,706 ¥1,238,119 $11,998,445
LIABILITIESCurrent liabilities:
Trade and other payables ¥ 181,577 ¥ 189,501 $ 1,836,433 Derivative financial liabilities 100 72,388 701,502 Other current financial liabilities 15,471 12,581 121,921 Income taxes payable 36,763 9,602 93,056 Provisions 22,615 22,284 215,951 Others 35,714 31,689 307,097 Total current liabilities 292,242 338,046 3,275,964
Non-current liabilities:Non-current financial liabilities 25,513 274,090 2,656,177 Provisions 10,203 10,645 103,164 Deferred tax liabilities 47,272 3,809 36,920 Others 13,668 13,865 134,368 Total non-current liabilities 96,658 302,411 2,930,630 Total liabilities 388,901 640,458 6,206,595
EQUITYCapital stock 10,273 10,273 99,563 Capital surplus 11,524 13,070 126,663 Retained earnings 602,623 613,974 5,949,938 Treasury stock, at cost (15,699) (15,633) (151,500)Other components of equity 142,214 (47,183) (457,247)Equity attributable to owners of the parent 750,937 574,501 5,567,418 Non-controlling interests 23,867 23,159 224,432 Total equity 774,804 597,661 5,791,850 Total liabilities and equity ¥1,163,706 ¥1,238,119 $11,998,445
See accompanying notes to consolidated financial statements.
FAST RETAILING CO., LTD. and consolidated subsidiaries31 August 2016 and 2015
CONSOLIDATED STATEMENT OF FINANCIAL POSITION

2
Millions of yenThousands of
U.S. dollars
2015 2016 2016
Revenue ¥1,681,781 ¥1,786,473 $17,312,471Cost of sales (833,243) (921,475) (8,929,895)Gross profit 848,538 864,998 8,382,575
Selling, general and administrative expenses (671,863) (702,956) (6,812,256)Other income 8,782 2,363 22,908Other expenses (20,992) (37,112) (359,651)Operating profit 164,463 127,292 1,233,576Finance income 17,354 2,364 22,913Finance costs (1,141) (39,420) (382,014)Profit before income taxes 180,676 90,237 874,475Income taxes (63,287) (36,162) (350,449)Profit for the year 117,388 54,074 524,026Attributable to:
Owners of the parent 110,027 48,052 465,670Non-controlling interests 7,360 6,021 58,356Profit for the year ¥ 117,388 ¥ 54,074 $ 524,026
Earnings per shareBasic (yen, dollar) 1,079.42 471.31 4.57 Diluted (yen, dollar) ¥ 1,078.08 ¥ 470.69 $ 4.56
Millions of yenThousands of
U.S. dollars
2015 2016 2016
Profit for the year ¥117,388 ¥ 54,074 $ 524,026 Other comprehensive income
Other comprehensive income that will not be reclassified to profit or loss — — —
Other comprehensive income to be reclassified to profit or loss in subsequent periods
Net gain/(loss) on revaluation of available-for-sale investments (655) 105 1,018 Exchange differences on translation of foreign operations 14,040 (43,312) (419,734)Cash flow hedges 40,350 (150,239) (1,455,954)
Other comprehensive income, net of taxes 53,735 (193,447) (1,874,670)Total comprehensive income for the year ¥171,124 ¥(139,372) $(1,350,644)
Attributable to:Owners of the parent 163,871 (141,345) (1,369,757)Non-controlling interests 7,253 1,972 19,113 Total comprehensive income for the year ¥171,124 ¥(139,372) $(1,350,644)
See accompanying notes to consolidated financial statements.
See accompanying notes to consolidated financial statements.
FAST RETAILING CO., LTD. and consolidated subsidiariesFor the years ended 31 August 2016 and 2015
FAST RETAILING CO., LTD. and consolidated subsidiariesFor the years ended 31 August 2016 and 2015
CONSOLIDATED STATEMENT OF PROFIT OR LOSS
CONSOLIDATED STATEMENT OF COMPREHENSIVE INCOME

3
Millions of yen
Other components of equity
Capital stock
Capital surplus
Retained earnings
Treasury stock,
at cost
Available- for-sale reserve
Foreign currency
translation reserve
Cash-flow hedge
reserve Total
Equity attributable
to owners of the parent
Non-controlling
interestsTotal
equity
As at 31 August 2014 ¥10,273 ¥ 9,803 ¥525,722 ¥(15,790) ¥ 798 ¥ 23,035 ¥ 64,536 ¥ 88,371 ¥ 618,381 ¥17,660 ¥ 636,041
Net change during the year
Comprehensive income profit for the year — — 110,027 — — — — — 110,027 7,360 117,388
Other comprehensive income — — — — (655) 14,815 39,683 53,843 53,843 (107) 53,735
Total comprehensive income — — 110,027 — (655) 14,815 39,683 53,843 163,871 7,253 171,124
Transactions with the owners
Acquisition of treasury stock — — — (11) — — — — (11) — (11)
Disposal of treasury stock — 700 — 102 — — — — 803 — 803
Dividends — — (33,126) — — — — — (33,126) (1,226) (34,352)
Share-based payments — 1,019 — — — — — — 1,019 — 1,019
Others — — — — — — — — — 180 180
Total transactions with the owners — 1,720 (33,126) 90 — — — — (31,315) (1,046) (32,361)
Total net changes during the year — 1,720 76,901 90 (655) 14,815 39,683 53,843 132,556 6,207 138,763
As at 31 August 2015 ¥10,273 ¥11,524 ¥602,623 (15,699) 143 37,851 ¥ 104,219 ¥142,214 ¥750,937 ¥23,867 ¥774,804
Net change during the year
Comprehensive income profit for the year
— — 48,052 — — — — — 48,052 6,021 54,074
Other comprehensive income — — — — 105 (40,663) (148,839) (189,397) (189,397) (4,049) (193,447)
Total comprehensive income — — 48,052 — 105 (40,663) (148,839) (189,397) (141,345) 1,972 (139,372)
Transactions with the owners
Acquisition of treasury stock — — — (6) — — — — (6) — (6)
Disposal of treasury stock — 546 — 72 — — — — 619 — 619
Dividends — — (36,702) — — — — — (36,702) (3,268) (39,970)
Share-based payments — 945 — — — — — — 945 — 945
Others — 53 — — — — — — 53 587 641
Total transactions with the owners — 1,546 (36,702) 66 — — — — (35,090) (2,680) (37,770)
Total net changes during the year — 1,546 11,350 66 105 (40,663) (148,839) (189,397) (176,435) (708) (177,143)
As at 31 August 2016 ¥10,273 ¥13,070 ¥613,974 ¥(15,633) ¥ 248 ¥ (2,811) ¥ (44,619) ¥ (47,183) ¥ 574,501 ¥23,159 ¥ 597,661
Thousands of U.S. dollars
Other components of equity
Capital stock
Capital surplus
Retained earnings
Treasury stock,
at cost
Available- for-sale reserve
Foreign currency
translation reserve
Cash-flow hedge
reserve Total
Equity attributable
to owners of the parent
Non-controlling
interestsTotal
equity
As at 31 August 2015 $99,563 $111,680 $5,839,945 $(152,140) $1,386 $ 366,815 $ 1,009,978 $ 1,378,179 $ 7,277,229 $231,297 $ 7,508,527
Net change during the year — — — — — — — — — — —
Comprehensive income profit for the year
— — 465,670 — — — — — 465,670 58,356 524,026
Other comprehensive income — — — — 1,018 (394,064) (1,442,381) (1,835,427) (1,835,427) (39,242) (1,874,670)
Total comprehensive income — — 465,670 — 1,018 (394,064) (1,442,381) (1,835,427) (1,369,757) 19,113 (1,350,644)
Transactions with the owners
Acquisition of treasury stock — — — (62) — — — — (62) — (62)
Disposal of treasury stock — 5,299 — 701 — — — — 6,001 — 6,001
Dividends — — (355,677) — — — — — (355,677) (31,675) (387,352)
Share-based payments — 9,164 — — — — — — 9,164 — 9,164
Others — 519 — — — — — — 519 5,697 6,216
Total transactions with the owners — 14,983 (355,677) 639 — — — — (340,054) (25,978) (366,032)
Total net changes during the year — 14,983 109,993 639 1,018 (394,064) (1,442,381) (1,835,427) (1,709,811) (6,864) (1,716,676)
As at 31 August 2016 $99,563 $126,663 $5,949,938 $(151,500) $2,404 $ (27,248) $ (432,403) $ (457,247) $ 5,567,418 $224,432 $ 5,791,850
See accompanying notes to consolidated financial statements.
FAST RETAILING CO., LTD. and consolidated subsidiariesFor the years ended 31 August 2016 and 2015
CONSOLIDATED STATEMENT OF CHANGES IN EQUITY
4
Millions of yenThousands of
U.S. dollars
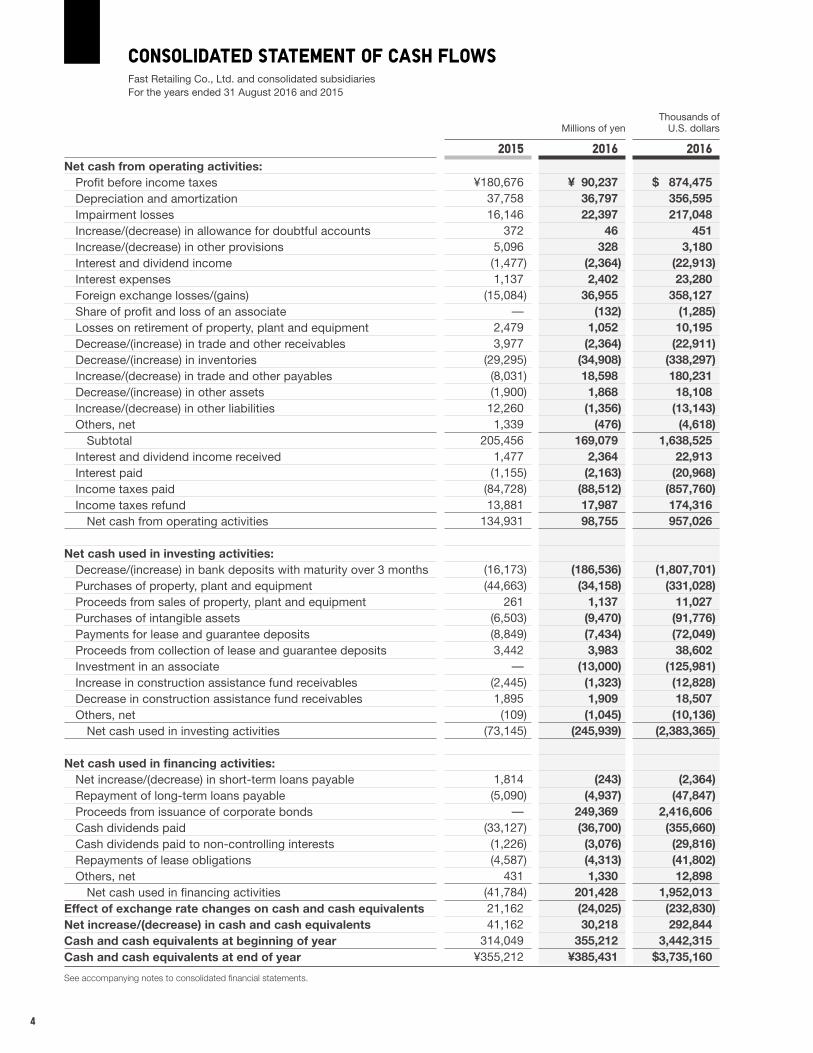
2015 2016 2016Net cash from operating activities:
Profit before income taxes ¥180,676 ¥ 90,237 $ 874,475Depreciation and amortization 37,758 36,797 356,595Impairment losses 16,146 22,397 217,048Increase/(decrease) in allowance for doubtful accounts 372 46 451Increase/(decrease) in other provisions 5,096 328 3,180Interest and dividend income (1,477) (2,364) (22,913)Interest expenses 1,137 2,402 23,280Foreign exchange losses/(gains) (15,084) 36,955 358,127Share of profit and loss of an associate — (132) (1,285)Losses on retirement of property, plant and equipment 2,479 1,052 10,195Decrease/(increase) in trade and other receivables 3,977 (2,364) (22,911)Decrease/(increase) in inventories (29,295) (34,908) (338,297)Increase/(decrease) in trade and other payables (8,031) 18,598 180,231Decrease/(increase) in other assets (1,900) 1,868 18,108Increase/(decrease) in other liabilities 12,260 (1,356) (13,143)Others, net 1,339 (476) (4,618)
Subtotal 205,456 169,079 1,638,525Interest and dividend income received 1,477 2,364 22,913Interest paid (1,155) (2,163) (20,968)Income taxes paid (84,728) (88,512) (857,760)Income taxes refund 13,881 17,987 174,316
Net cash from operating activities 134,931 98,755 957,026
Net cash used in investing activities:Decrease/(increase) in bank deposits with maturity over 3 months (16,173) (186,536) (1,807,701)Purchases of property, plant and equipment (44,663) (34,158) (331,028)Proceeds from sales of property, plant and equipment 261 1,137 11,027Purchases of intangible assets (6,503) (9,470) (91,776)Payments for lease and guarantee deposits (8,849) (7,434) (72,049)Proceeds from collection of lease and guarantee deposits 3,442 3,983 38,602Investment in an associate — (13,000) (125,981)Increase in construction assistance fund receivables (2,445) (1,323) (12,828)Decrease in construction assistance fund receivables 1,895 1,909 18,507Others, net (109) (1,045) (10,136)
Net cash used in investing activities (73,145) (245,939) (2,383,365)
Net cash used in financing activities:Net increase/(decrease) in short-term loans payable 1,814 (243) (2,364)Repayment of long-term loans payable (5,090) (4,937) (47,847)Proceeds from issuance of corporate bonds — 249,369 2,416,606Cash dividends paid (33,127) (36,700) (355,660)Cash dividends paid to non-controlling interests (1,226) (3,076) (29,816)Repayments of lease obligations (4,587) (4,313) (41,802)Others, net 431 1,330 12,898
Net cash used in financing activities (41,784) 201,428 1,952,013Effect of exchange rate changes on cash and cash equivalents 21,162 (24,025) (232,830)Net increase/(decrease) in cash and cash equivalents 41,162 30,218 292,844Cash and cash equivalents at beginning of year 314,049 355,212 3,442,315Cash and cash equivalents at end of year ¥355,212 ¥385,431 $3,735,160
See accompanying notes to consolidated financial statements.
Fast Retailing Co., Ltd. and consolidated subsidiariesFor the years ended 31 August 2016 and 2015
CONSOLIDATED STATEMENT OF CASH FLOWS

5
FAST RETAILING CO., LTD. and consolidated subsidiaries
1 Reporting Entity
FAST RETAILING CO., LTD. (the “Company”) is a company incorporated in Japan. The locations of the registered head-quarters and principal offices of the Company are disclosed at the Group’s website (http://www.fastretailing.com/eng/). The principal activities of the Company and its consoli-dated subsidiaries (the “Group”) are the UNIQLO business (casual wear retail business operating under the “UNIQLO” brand in Japan and overseas), GU business and Theory business (apparel designing and retail business in Japan and overseas), etc.
2 Basis of Preparation
(1) Compliance with IFRSThe consolidated financial statements of the Group have been prepared in compliance with International Financial Reporting Standards (“IFRS”) issued by the International Accounting Standards Board (“IASB”). The Group meets all criteria of a “specified company” defined under Article 1-2 of the Rules Governing Term, Form, and Preparation of Consolidated Financial Statements, and accordingly applies Article 93 of the Rules Governing Term, Form, and Preparation of Consolidated Financial Statements.
(2) Approval of the consolidated financial statementsThe consolidated financial statements were approved on 25 November 2016 by Tadashi Yanai, Chairman, President and CEO, and Takeshi Okazaki, Group Senior Vice President and CFO.
(3) Basis of measurementThe consolidated financial statements have been prepared on an historical cost basis, except for certain assets, liabili-ties, and financial instruments which are measured at fair value as indicated in “3. Significant Accounting Policies”.
(4) Functional currency and presentation currencyThe presentation currency for the Group’s consolidated financial statements is the Japanese yen (in units of millions of yen), which is also the Company’s functional currency. All values are rounded down to the nearest million yen, except when otherwise indicated.
(5) Use of estimates and judgmentsThe preparation of the consolidated financial statements in accordance with IFRS requires management to make judg-ments, estimates and assumptions that affect the application of accounting policies and the reported amounts of assets
and liabilities, income and expenses. Actual results may differ from these estimates. The estimates and underlying assumptions are reviewed on an ongoing basis. The effects of the review of accounting estimates are recognized in the accounting period in which the estimates were reviewed and in future accounting periods. Information about important estimation and judgments that have significant effects on the amounts recognized in the consolidated financial statements is as follows:• Useful lives of property, plant and equipment, and intangi-
ble assets (Notes 13, 14)• Recoverable amounts from cash-generating units for
impairment test (Note 15)• Recoverability of deferred tax assets (Note 19)• Valuation of inventories (Note 10)• Recoverability of trade and other receivables (Notes 9, 30)• Accounting treatment and valuation of provisions (Note 21)• Fair value measurement of financial instruments (Note 30)• Fair value unit price for share-based payments (Note 29)• Probability of outflow of future economic benefits from con-
tingent liabilities (Note 34)
(6) Basis of Financial Statement TranslationThe accompanying consolidated financial statements are expressed in yen, and solely for the convenience of the reader, have been translated into United States (U.S.) dollars at the rate of ¥103.19=$1, the approximate exchange rate prevailing on the Tokyo Foreign Exchange Market at the end of August 2016. This translation should not be construed as a representation that any amounts shown could be con-verted into U.S. dollars at that or any other rate.
3 Significant Accounting Policies
(1) Basis of consolidation( i ) Subsidiaries“Subsidiaries” refers to enterprises that are controlled by the Company ( including businesses establ ished by the Company). The Group controls enterprises where it is exposed to variable returns arising from its involvement in those enterprises or when the Group has rights to variable returns in those enterprises and is able to have an impact on the said variable returns through its power over those enter-prises. A subsidiary’s financial statements are incorporated into the Group’s consolidated financial statements from the date on which control begins until the date control ends. The subsidiaries adopted consistent accounting policies as the Company in the preparation of their f inancial statements. All intra-group balances, transactions within the Group as
NOTES TO THE CONSOLIDATED FINANCIAL STATEMENTS

6
well as unrealized profit and loss resulting from transactions within the Group are eliminated at the time of preparation of the consolidated financial statements. The report ing date for FAST RETAILING (CHINA) TRADING CO., LTD., Theory Shanghai International Trading Co., Ltd., UNIQLO TRADING CO., LTD., Fast Retailing (Shanghai) Business Management Consulting Co., Ltd., FAST RETAILING (SHANGHAI) TRADING CO., LTD., GU (Shanghai) Trading Co., Ltd., Comptoir des Cotonniers (Shanghai) Trading Co., Ltd., PRINCESSE TAM.TAM (SHANGHAI) TRADING CO., LTD. and LLC UNIQLO (RUS) is 31 December. The management accounts of these subsidiaries are used for the Group’s consolidation purpose. The financial statements of other subsidiaries are prepared using the same reporting period as the parent company. A change in the ownership interest of a subsidiary, with-out a loss of control, is accounted for as an equity transac-tion. Any difference between the adjustment to the non-controlling interest and the fair value of the consideration received is recognized directly in equity as interests attribut-able to owners of the parent. Profit or loss and each component of other comprehen-sive income are attributed to the owners of the parent and to the non-controlling interests, even if this results in the non-controlling interests having a deficit balance. The number of consolidated subsidiaries as at 31 August 2016 is 120.
( i i ) Investments in associates“Associates companies”, have not been controlled by the Group, refers to the enterprises which the Group has signifi-cant influence over the financial and operating policies. If the Group holds 20% or more of the voting rights of another enterprise, it is estimated that the Group has a significant influence over the other enterprise. Investments in associates companies, perform the accounting treatment by applying the equity method, and measured at historical cost at the time of acquisition. Thereafter the investment is changed in accordance with the change of the Group’s share of net assets of associates companies. At that time, the Group’s share of the net profit or loss of associates companies is recognized in the consoli-dated statement of profit or loss. In addition, among the other comprehensive income of associates companies, the Group’s share of the net profit or loss is recognized in other comprehensive income in the consolidated statement of comprehensive income. Gains on significant intercompany transactions have been eliminated in accordance with the equity interest in associate companies. The number of associates as at 31 August 2016 is 1.
(2) Business combinationsBusiness combinations are accounted for using the acquisi-tion method. The cost of an acquisition is measured as the aggregation of the fair value at the acquisition date of the assets transferred, liabilities assumed and equity instruments issued by the Company in exchange for control of the acquired company. If the cost of an acquisition exceeds the fair value of the identifiable assets and liabilities, it is recorded as goodwill on the consolidated statement of financial position. If it is below the fair value, this is immediately recorded as income on the consolidated statement of profit or loss. Acquisition-related costs are expensed as incurred. Additional acquisitions of non-controlling interests are accounted for as equity transactions, and no goodwill is recognized. Contingent liabilities of acquired companies are recog-nized in a business combination only if they are present obli-gations, were incurred as a result of a past event, and their fair value can be reliably measured. For each business combination, the Group elects whether to measure the non-controlling interests in the acquiree at fair value or at the proportionate share of the acquiree’s identifiable net assets. If the initial accounting for a business combination is incomplete by the reporting date of the fiscal year in which the business combination occurs, the items for which the acquisition accounting is incomplete are reported using pro-visional amounts. Those amounts provisionally recognized on the acquisition date are retrospectively adjusted to reflect new information if the acquisitions took place during a period (measurement period) when it is believed that, had facts and circumstances that existed at the acquisition date been known at that time, they would have affected the amounts recognized on that date. Additional assets and liabilities are recognized if new information results in the recognition of additional assets or liabilities. The measurement period should be within one year.
(3) Foreign currencies( i ) Transactions and balancesTransactions in foreign currencies are initially recorded by the Group’s entities at their respective functional currency spot rates at the date the transaction first qualifies for recognition. Monetary assets and liabilities denominated in foreign currencies are translated at the functional currency spot rates at each reporting date. Differences arising on settle-ment or translation of monetary items are recognized in profit or loss. Non-monetary items that are measured in terms of his-torical cost in a foreign currency are translated using the

7
exchange rates at the dates of the initial transactions. Non-monetary items measured at fair value in a foreign currency are translated using the exchange rates at the date when the fair value is determined. The gain or loss arising on transla-tion of non-monetary items measured at fair value is treated in line with the recognition of gain or loss on change in fair value of the item (i.e., translation differences on items whose fair value gain or loss is recognized in other comprehensive income or profit or loss are also recognized in other compre-hensive income or profit or loss, respectively).
( i i ) Foreign operationsOn consolidation, the assets and liabilities of foreign opera-tions are translated into Japanese yen at the rate of exchange prevailing at each reporting date and their income statements are translated at average exchange rates during the period. The exchange differences arising on translation for consolidation are recognized in other comprehensive income. On disposal of a foreign operation, the component of other comprehensive income relating to that particular for-eign operation is recognized in profit or loss.
(4) Financial instrumentsDerivative financial instruments and hedge accountingThe Group uses derivative financial instruments, such as forward currency contracts, to hedge its foreign currency risks. Such derivative financial instruments are initially recog-nized at fair value on the date on which a derivative contract is entered into and are subsequently re-measured at fair value. Derivatives are carried as financial assets when the fair value is positive and as financial liabilities when the fair value is negative. Any gains or losses arising from changes in the fair value of derivatives are taken directly to profit or loss, except for the effective portion of cash flow hedges, which is recog-nized in other comprehensive income and later reclassified to profit or loss when the hedge item affects profit or loss. At the inception of a hedge relationship, the Group for-mally designates and documents the hedge relationship to which the Group wishes to apply hedge accounting and the risk management objectives and strategy for undertaking the hedge. The documentation includes identification of the spe-cific hedging instrument, the hedged item or transaction, the nature of the risk being hedged and how the entity will assess the hedging instrument’s effectiveness in offsetting the exposure to changes in the hedged item’s fair value or cash flows attributable to the hedged risk. Such hedges are expected to be highly effective in achieving offsetting changes in fair value or cash flows and are assessed on an ongoing basis to determine that they actually have been highly effective throughout the financial reporting periods for
which they were designated. The Group has designated forward currency contracts as cash flow hedges and are accounted for as described below:
Cash flow hedgesWhen derivatives are designated as a hedging instrument to hedge the exposure to variability in cash flows that are attrib-utable to a particular risk associated with recognized assets or liabilities or highly probable forecast transactions which could affect profit or loss, the effective portion of changes in the fair value of the derivatives is recognized in other com-prehensive income and included in “Cash flow hedges” in other components of equity. The balances of cash flow hedges are subtracted from “other comprehensive income” on the consolidated statement of comprehensive income for the same period when the hedged cash flows would affect profit or loss, and reclassified as profit or loss in the same line items as the hedging instruments. The gain or loss relat-ing to the ineffective portion of changes in the fair value of the derivatives is recognized immediately in profit or loss. When a hedged item gives rise to the recognition of a non-financial asset or non-financial liability, the amount recog-nized as other comprehensive income is treated as an adjustment to the initial carrying amount of the non-financial asset or liability. If the forecast transaction or firm commitment is no longer expected to occur, cumulative profit or loss amounts previ-ously recognized in equity through other comprehensive income are reclassified as profits or losses. If the hedging instrument expires or is sold, is terminated or exercised with-out replacement or rollover, or if its designation as a hedge is revoked, the amounts previously recognized in equity through other comprehensive income are recorded as equity until the forecast transaction occurs or firm commitment is met.
Non-derivative financial instruments( i ) Initial recognition and measurementAll purchases and sales of financial assets that take place through ordinary methods (purchase or sale of a financial asset requiring delivery within the time frame established by market regulation or convention) are recognized or derecog-nized, and measured at the initial fair value plus transaction costs, on the trade date. Financial assets are classified, at initial recognition, into the following three categories:• Financial assets at fair value through profit or loss• Loans and receivables• Available-for-sale financial assets The classification depends on the nature and purpose of the financial assets and is determined at the time of initial recognition.

8
( i i ) Financial assets at fair value through profit or lossFinancial assets are classified as “financial assets at fair value through profit or loss” if they are held for trading or if they are designated as financial assets at fair value through profit or loss. Financial assets other than financial assets held for trad-ing may be designated as “financial assets at fair value through profit or loss” at initial recognition if any of the follow-ing applies:(a) If such designation eliminates or significantly reduces a
measurement or recognition inconsistency (“accounting mismatch”) is likely to arise;
(b) If the financial assets are part of a “group of financial assets or financial liabilities (or both)”, which are man-aged and have their performance evaluated on a fair value basis, in accordance with the Group’s documented risk management or investment strategy, and information about the grouping is provided internally on a fair value basis; or
(c) If the contract contains at least one embedded derivative (IAS 39 allows the entire hybrid (combined) contract (assets or liabilities) to be designated as a “financial assets at fair value through profit or loss”), unless they are designated as an effective hedging instrument.
Financial assets at fair value through profit or loss are carried in the consolidated statement of financial position at fair value with net changes in fair value presented as finance costs (negative net changes in fair value) or finance income (positive net changes in fair value) in the consolidated state-ment of profit or loss. Recognized profits or losses, including the above, are recognized in the consolidated statement of profit or loss as dividend income, interest income or gain or loss on changes in fair value. Fair value is determined using the method described in “30. Financial Instruments”.
(iii) Loans and receivablesTrade receivables, loans, and other receivables that are not quoted in an active market are classified as “loans and receivables”. After initial measurement, such financial assets are subsequently measured at amortized cost using the effective interest rate (“EIR”) method, less impairment. The EIR amortization is included in finance income in the state-ment of profit or loss.
(iv) Available-for-sale financial assetsAny non-derivative financial assets classified as “available-for-sale financial assets” are those that are neither classified as “financial assets at fair value through profit or loss”, nor “loans and receivables”, or those that are designated as “available for-sale financial assets”. Available-for-sale listed equity securities that are traded
on a market are measured using quoted market prices. Unlisted equity securities are measured at fair value using reasonable methods. Fair value is determined using the method described in “30. Financial Instruments”. Profits or losses arising from changes in fair value are recognized as other comprehensive income. Impairment losses or foreign currency gains or losses associated with monetary assets are treated as exceptions and recognized in profit or loss. When available-for-sale financial assets are derecog-nized, or when an impairment loss is recognized, the cumu-lative profits or losses that have been recognized as other comprehensive income up to that time are reclassified to the profit or loss for the period. Dividends associated with available-for-sale financial assets are recognized in profit or loss when the Group’s right to receive dividends is established. The fair value of available-for-sale financial assets denominated in foreign currencies is determined in that foreign currency and translated at the exchange rate prevailing at each reporting date. The effects of changes in exchange rates on foreign currencies denomi-nated monetary assets is recognized in foreign exchange gains or losses, while the effect of changes in exchange rates on other foreign currencies denominated available-for-sale financial assets is recognized in other comprehensive income.
(v) Impairment of financial assetsThose financial assets other than “Financial assets at fair value through profit or loss”, pursuant to IAS 39, are evalu-ated at each reporting date to determine whether there is objective evidence of impairment. If there is objective evi-dence that one or more events having a negative impact on the estimated future cash flows has occurred subsequent to the initial recognition of the financial asset, an impairment loss is recognized. For listed and unlisted equity securities classified as “available-for-sale financial assets”, a significant or prolonged decline in the fair value of the investment below its historical cost is considered to be objective evidence of impairment. For all other financial assets, including redeemable securities and finance lease receivables classified as available-for-sale financial assets, objective evidence of impairment may include the following:(a) Significant deterioration in the financial condition of the
issuer or counterparty;(b) Default or delinquency in interest or principal payments; or(c) Probability that the issuer will enter bankruptcy or finan-
cial reorganization. Certain categories of financial assets, such as trade receivables, are assessed for impairment on a collective basis even if they are not impaired individually. Objective

9
evidence of impairment for a portfolio of receivables could include changes in national or local economic conditions that correlate with default on receivables or an increase in the number of delinquent payments in the portfolio past the average credit period. For financial assets carried at amortized cost, the amount of the impairment loss is the difference between the asset’s carrying amount and the present value of estimated future cash flows, discounted at the financial asset’s original EIR. An asset’s carrying amount is reduced directly by the impair-ment loss amount, with the exception of trade receivables where the impairment loss is posted by using the allowance for doubtful accounts. An allowance for doubtful accounts is established when it is determined that receivables are uncol-lectable, including receivables for which the due date has been changed, and the allowance for doubtful accounts is reduced if the receivables are subsequently abandoned or collected. Changes in the allowance for doubtful accounts are recognized in profit or loss except for decreases due to use. Except for available-for-sale financial assets, if, in a sub-sequent period, the amount of the impairment loss decreases and the decrease can be related objectively to an event occurring after the impairment was recognized, the previously recognized impairment loss is reversed through profit or loss to the extent that the carrying amount of the investment after reversing the impairment loss does not exceed what the amortized cost would have been had the impairment not been recognized. For available-for-sale financial assets, impairment losses previously recognized in profit or loss cannot be reversed through profit or loss. Any change in fair values after an impairment loss is recognized through other comprehensive income as long as this does not give rise to an additional impairment loss.
(vi) Derecognition of financial assetsThe Group derecognizes a financial asset only if the contrac-tual rights to the cash flows from the financial asset expire or if the Group has transferred almost all risks and rewards of ownership. If the Group maintains control of the transferred financial asset, it recognizes the asset and associated liabili-ties to the extent of its continuing involvement.
Non-derivative equity instruments and financial liabilities( i ) Equity instruments (stocks)An equity instrument is a contract that evidences ownership of a residual interest in the assets of a company after deducting all of its liabilities.
( i i ) Financial liabilitiesFinancial liabilities are classified as either “financial liabilities
at fair value through profit or loss” or “other financial liabilities”.
(iii) Financial liabilities at fair value through profit or lossFinancial liabilities are classified as “financial liabilities at fair value through profit or loss” if they are held for trading or if they are designated as financial liabilities at fair value through profit or loss. A financial liability is classified as being held for trading purposes if any of the following applies:(a) It is acquired or incurred principally for the purpose of
selling or repurchasing it in the near term;(b) On initial recognition, it is part of a portfolio of identified
financial instruments that are managed together and for which there is evidence of a recent actual pattern of short-term profit-taking; or
(c) It is a derivative (except for a derivative that is a financial guarantee contract or a designated and effective hedging instrument).
Financial liabilities other than financial liabilities held for trading may be designated as “financial liabilities at fair value through profit or loss” at initial recognition if any of the follow-ing applies:(a) If such designation eliminates or significantly reduces a
measurement or recognition inconsistency (“accounting mismatch”) is likely to arise;
(b) If the financial liabilities are part of a “group of financial assets or financial liabilities (or both)” which are managed and have their performance evaluated on a fair value basis, in accordance with the Group’s documented risk management or investment strategy, and information about the grouping is provided internally on a fair value basis; or
(c) If the contract contains at least one embedded derivative (IAS 39 allows the entire hybrid (combined) contract (assets and liabilities) to be designated as “financial liabili-ties at fair value through profit or loss”).
Financial liabilities designated as “financial liabilities at fair value through profit or loss” are measured at fair value, with any changes recognized in profit or loss. Recognized profits and losses, including the above, are recognized in the con-solidated statement of profit or loss as interest expenses or gain or loss on change in fair value. Fair value is determined using the method described in “30. Financial Instruments”.
(iv) Other financial liabilitiesOther financial liabilities, including loans payable, are initially measured at fair value, net of directly attributable transaction costs. Subsequent to initial recognition, other financial liabili-ties are measured at amortized cost using the EIR method, and interest expenses are recognized using the EIR method.

10
(v) Derecognition of financial liabilitiesThe Group derecognizes a financial liability when it is extin-guished, that is, when the obligation specified in the contract is either discharged, cancelled or expires.
(vi) Fair value of financial instrumentsThe fair value of financial instruments that are traded on an active financial market at each reporting date are based on quoted market prices and dealer prices. The fair value of financial instruments for which there is no active market are calculated using appropriate valuation techniques.
(vii) Offsetting financial instrumentsFinancial assets and financial liabilities are only offset when there is an enforceable legal right to offset the recognized amounts and when there is an intention to either settle on a net basis, or realize the asset and settle the liability simulta-neously; and the net amount is reported on the consolidated statement of financial position.
(5) Cash and cash equivalentsCash and cash equivalents comprise cash on hand, bank deposits available for withdrawal on demand, and short-term, highly liquid investments due with a maturity of three months of the acquisition date or less that are readily con-vertible to cash and which are subject to an insignificant risk of changes in value.
(6) InventoriesInventories are valued at the lower of cost and net realizable value; the weighted average method is principally used to determine cost. Net realizable value is based on the esti-mated selling price in the ordinary course of business less any estimated costs to be incurred to sell the goods.
(7) Property, plant and equipment (other than leased assets)
( i ) Recognition and measurementProperty, plant and equipment are measured at cost less accumulated depreciation and any accumulated impairment losses. The cost of an item of property, plant and equipment comprises its purchase price and any directly attributable costs of bringing the asset to its working condition and loca-tion for its intended use, the initial estimate of the costs of dismantling and removing the item and restoring the site on which it is located.
( i i ) DepreciationAssets other than land and construction in progress, are depreciated using the straight-line method over the esti-
mated useful lives shown below:Buildings and structures 3-50 yearsFurniture, equipment and vehicles 5 years The useful lives, residual values, and depreciation meth-ods are reviewed at each reporting date, with the effect of any changes in estimates being accounted for on a prospec-tive basis.
(8) Goodwill and intangible assets (other than leased assets)
( i ) GoodwillGoodwill is stated at the carrying amount, which is the acqui-sition cost after deducting accumulated impairment losses. Goodwill represents the excess amount of the historical cost of an interest acquired by the Group over the net amount of the fair value of the identifiable assets acquired and liabilities assumed. Goodwill is not amortized but is allocated to identifiable cash-generating units based on the geographical region where business takes place and the type of business con-ducted, and then tested for impairment each year or when there is an indication that it may be impaired. Impairment losses on goodwill are recognized in the consolidated state-ment of profit or loss and cannot be subsequently reversed in a future period.
( i i ) Intangible assetsIntangible assets are measured at cost, with any accumu-lated amortization and accumulated impairment losses deducted from the historical cost to arrive at the stated car-rying amount. Intangible assets acquired separately are measured at cost at initial recognition, and the cost of intangible assets acquired in a business combination is measured as fair value at the acquisition date. For internally generated intangible assets, the entire amount of the expenditure is recorded as an expense in the period in which it arises, except for development expenses that meet the requirements for capitalization. Intangible assets with finite useful lives are amortized over their respective estimated useful lives using the straight-line method, and they are tested for impairment when there is an indication that they may be impaired. The estimated useful life and amortization method for an intangible asset with a finite useful life is reviewed at the end of each reporting period, and any changes are applied prospectively as a change in accounting estimate. The estimated useful lives of the main intangible assets with finite useful lives are as follows:• Software for internal use Length of time it is usable
internally (3-5 years)
11
Intangible assets with indefinite useful lives and intangible assets that are not yet available for use are not amortized. They are tested for impairment annually or when there is an indication that they may be impaired, either individually or at the cash-generating unit level.
(9) LeasesThe determination of whether an arrangement is, or contains, a lease is made based on the substance of the arrangement on the inception date of the lease, or in other words, whether the fulfillment of the arrangement depends on the use of a specific asset or group of assets and whether the arrange-ment conveys the right to such asset (whether explicitly stated in the contract or not). If the lease agreement substantially conveys the risks and rewards of the ownership of the asset to the lessee, the lease is classified as a finance lease. Leases other than finance leases are classified as operating leases. Finance leases are capitalized at the commencement of the lease at the fair value of the leased property or, if lower, at the present value of the minimum lease payments. Lease payments are apportioned between finance charges and reduction of the lease liability so as to achieve a constant rate of interest on the remaining balance of the liability. Finance charges are recognized in finance costs in the state-ment of profit or loss. A leased asset is depreciated over the shorter of the esti-mated useful life of the asset and the lease term on a straight-line basis. Operating lease payments as lessee are recognized as an operating expense in the statement of profit or loss on a straight-line basis over the lease term. Operating lease income as lessor are recognized as an operating revenue in the statement of profit or loss on a straight-line basis over the lease term.
(10) ImpairmentThe carrying amounts of the Group’s non-financial assets, excluding inventories and deferred tax assets, are reviewed to determine whether there is any indication of impairment at each reporting date. If there is any indication of impairment, the recoverable amount for the asset is estimated. For good-will, intangible assets with indefinite useful lives, and intangi-ble assets that are not yet available for use, the recoverable amount is estimated each year at the same time. The recoverable amount for an asset or cash-generating unit (“CGU”) is the higher of value-in-use and fair value less costs of disposal. The fair value less costs of disposal calcu-lation is based on available data from binding sales transac-tions, conducted at arm’s length, for similar assets or observable market prices less incremental costs for
disposing of the asset. In assessing value-in-use, the esti-mated future cash flows are discounted to their present value using a pre-tax discount rate that reflects the time value of money and the risks specific to the asset. A CGU is the smallest group of assets which generates cash inflows from continuing use, which are largely indepen-dent of the cash inflows from other assets or groups of assets. The CGU (or group of CGUs) for goodwill is determined based on the unit by which the goodwill is monitored for internal management purposes and must not be larger than an operating segment before aggregation. Because the corporate assets do not generate indepen-dent cash inflows, if there is an indication that corporate assets may be impaired, the recoverable amount is deter-mined for the CGU to which the corporate assets belong. If the carrying amount of an asset or a CGU exceeds the recoverable amount, an impairment loss is recognized in profit or loss for the period. Impairment losses recognized in relation to a CGU are first allocated to reduce the carrying amount of any goodwill allocated to the CGU and then allo-cated to the other assets of the CGU pro rata on the basis of their carrying amounts. An impairment loss related to goodwill cannot be reversed in future periods. Previously recognized impairment losses on other assets are reviewed at each reporting date to determine whether there is any indication that a loss has decreased or no longer exists. A previously recognized impairment loss is reversed only if there has been a change in the assumptions used to determine the asset’s recover-able amount since the last impairment loss was recognized. The reversal is limited so that the carrying amount of the asset does not exceed its recoverable amount, nor exceed the carrying amount that would have been determined, net of depreciation, had no impairment loss been recognized for the asset in prior years.
(11) ProvisionsProvisions are recognized when the Group has a present legal or constructive obligation as a result of a past event, it is probable that an outflow of resources embodying eco-nomic benefits will be required to settle the obligation, and a reliable estimate can be made of the amount of the obliga-tion. Provisions are recognized as the best estimate of the expenditure required to settle the present obligation (future cash flows), taking into account the risks and uncertainties surrounding the obligation at each reporting date. If the time value of money is material, provisions are mea-sured as the estimated future cash flows discounted to the present value using a pre-tax rate that reflects, when appro-priate, the time value of money and the risks specific to the

12
liability. When discounting is used, the increase due to the passage of time is recognized as a finance cost.
Each provision is described below:( i ) Allowance for bonusesThe amount expected to be borne as bonuses in the current reporting period is recorded as a provision for the payment of bonuses to employees of the Group.
( i i ) Asset retirement obligationsThe obligations to restore property to its original state under real estate leasing agreements for offices, such as corporate headquarters and stores, are estimated and recorded as a provision. The expected length of use is estimated as the time from acquisition to the end of the useful life and 0.37–0.99% is generally used as the discount rate in calculations.
(12) Share-based paymentsThe Group grants share-based payments in the form of share subscription rights (stock options) to employees of the Company and its subsidiaries. In doing so, the Group aims to heighten morale and motivate employees to improve the Group’s business performance, thereby increasing share-holder value by reinforcing business development that is focused on the interests of the shareholders. These share-based payments do this by rewarding contributions to the Group’s profit and by connecting the benefits received by these individuals to the Company’s stock price. Stock options are measured at fair value based on the price of the Company’s shares on the grant date. Fair value of stock options is further disclosed in “29. Share-based Payments”. The fair value of the stock options determined at the grant date is expensed, together with a corresponding increase in capital surplus in equity, over the vesting period on a straight-line basis, taking into consideration the Group’s best estimates of number of stock options that will ultimately vest.
(13) Revenue recognitionRevenue is measured at the fair value of consideration received or receivable by the Group, less returns, trade dis-counts and rebates. If a single transaction has multiple iden-tifiable elements, the transaction is apportioned among the elements and revenue is recognized for each element. When two or more transactions make commercial sense only when considered together as a single entity, revenue is recognized for the transactions together. The recognition standards and method of presentation for revenue are described below.( i ) Revenue recognition standardsRevenue from the sale of goods is recognized when all the
following conditions have been satisfied:• The Group has transferred to the buyer the significant risks
and rewards of ownership of the goods;• The Group retains neither continuing managerial involve-
ment to the degree usually associated with ownership nor effective control over the goods sold;
• The amount of revenue can be measured reliably;• It is probable that the economic benefits associated with
the transaction will flow to the Group; and• The costs incurred or to be incurred in respect of the trans-
action can be measured reliably.
( i i ) Method of presentation for revenueIf the Group is acting as a principal in a transaction, revenue is measured at the fair value of consideration received or receivable from the customer.
(14) Income taxesIncome taxes comprise current and deferred taxes. These are recognized in profit or loss, except for the taxes arising from items that are recognized as other comprehensive income. Current taxes are measured at the amount expected to be paid to (or recovered from) taxation authorities on taxable income or loss for the current year, using the rates that have been enacted or substantively enacted by each reporting date in the countries where the Group operates and gener-ate taxable income, with adjustments to tax payments in past periods. Through the use of an asset and liability approach, deferred tax assets and liabilities are recorded for the tempo-rary differences between the carrying amounts of assets and liabilities for accounting purposes and the amounts of assets and liabilities for tax purposes. Deferred tax assets and liabili-ties are not recognized for temporary differences under any of the following circumstances:• Temporary differences arising from goodwill;• Temporary differences arising from the initial recognition of
an asset/liability which, at the time of the transaction, does not affect either the accounting profit or the taxable income (other than in a business combination); or
• Temporary differences associated with investments in sub-sidiaries, but only to the extent that it is possible to control the timing of the reversal of the differences and it is proba-ble that the reversal will not occur in the foreseeable future.
From the current consolidated fiscal year, the Company and 100% owned domestic subsidiaries will apply the con-solidated taxation system. Deferred tax assets and liabilities are measured at the tax rates that are expected to apply in the year when temporary difference is realized or settled, based on tax laws that have

13
been enacted or substantively enacted by each reporting date. Deferred tax assets and liabilities are offset when there is a legally enforceable right to offset current tax assets and liabilities and when income taxes are levied by the same tax-ation authority on either the same taxable entity or on differ-ent taxable entities which intend either to settle current tax assets and liabilities on a net basis, or to realize the assets and settle the liabilities simultaneously. Deferred tax assets are recognized for unused tax losses, tax credits and deductible temporary differences to the extent that it is probable that future taxable profits will be available against which they can be utilized. Deferred tax assets are reviewed at each reporting date and reduced to the extent that it is no longer probable that the related tax benefits will be realized.
(15) Earnings per shareBasic earnings per share is calculated by dividing profit or loss attributable to common shareholders of the parent by the weighted average number of common stocks outstanding during the period, adjusted for treasury stock. Diluted earn-ings per share is calculated by adjusting for all dilutive poten-tial ordinary shares having a dilutive effect.
4 Application of New and Amended Standards and Interpretations
Not applicable.
5 Issued but Not Yet Effective IFRS
At the date of authorization of these consolidated financial statements, certain new standards, amendments and interpreta-tions to existing standards were issued but not yet effective and have not been early adopted by the Group. The Company is in the process of assessing the impact of the adoption of these standards and interpretations, but is not yet in a position to state whether these new and revised IFRS would have a significant impact on the Group’s results of opera-tion and financial position.
IFRS TitleMandatory
adoption date(year beginning on)
The Group’sadoption date
Summary
IAS 1 (Amendments)
Amendments to IAS 1 Presentation of Financial Statements
1 January 2016Year ending31 August 2017
Clarification of methods of presentation of financial statements and disclosures.
IAS 16 (Amendments)
Amendments to IAS 16 Property, Plant and Equipment
1 January 2016Year ending31 August 2017
Clarification of acceptable methods of depreciation and amortization.
IAS 28 (Amendments)
Amendments to IAS 28 Investments in Associates and Joint Ventures
1 January 2016Year ending31 August 2017
Clarification of items requested regarding accounting treatment of investment entities.
IAS 34 (Amendments)
Amendments to IAS 34 Interim Financial Reporting
1 January 2016Year ending31 August 2017
Clarifying the handling of information required by IAS 34, when given in the “Other” section of the financial reports for the term.
IAS 38 (Amendments)
Amendments to IAS 38 Intangible Assets
1 January 2016Year ending31 August 2017
Clarification of acceptable methods of depreciation and amortization.
IFRS 5 (Amendments)
Amendments to IFRS 5 Non-current Assets Held for Sale and Discontinued Operations
1 January 2016Year ending31 August 2017
Clarification of accounting treatment of non-current assets, when the categorization requirements regarding “holding for purpose of allocation to owner” are no longer met, or when the category is changed from “holding for purpose of sale” to “holding for purpose of allocation to owner.”
IFRS 7 (Amendments)
Amendments to IFRS 7 Financial Instruments: Disclosures
1 January 2016Year ending31 August 2017
Clarification of standards for determination of continuing involvement in financial assets to be transferred.Clarification of scope of applicable range for offsetting financial assets and financial liabilities in financial reports for the term.

14
6 Segment Information
(1) Description of reportable segmentsThe Group’s reportable segments are components for which discrete financial information is available and is reviewed reg-ularly by the Board to make decisions about the allocation of resources and to assess performance. The Group’s main retail clothing business is divided into three reportable operating segments: UNIQLO Japan, UNIQLO International and Global Brands, each of which is used to frame and form the Group’s strategy. The main businesses covered by each reportable seg-ment are as follows:
UNIQLO Japan: UNIQLO clothing business within Japan UNIQLO International: UNIQLO clothing business outside of Japan Global Brands: GU, Theory, Comptoir des Cotonniers, Princesse tam.tam and J Brand clothing operations
(2) Method of calculating segment revenue and resultsThe methods of accounting for the reportable segments are the same as those stated in “3. Significant Accounting Policies”. The Group does not allocate assets and liabilities to indi-vidual reportable segments.
IFRS 10 (Amendments)
Amendments to IFRS 10 Consolidated Financial Statements
1 January 2016Year ending31 August 2017
Clarification of items requested regarding accounting treatment of investment entities.
IFRS 12 (Amendments)
Amendments to IFRS 12 — Disclosures of interestsin other entities
1 January 2016Year ending31 August 2017
Sets out the disclosure requirements for investment entities.
IAS 7(Amendments)
Statement of Cash Flows 1 January 2017Year ending31 August 2018
Request for disclosure of changes in liabilities related to financing activities.
IAS12 (Amendments)
Income Taxes 1 January 2017Year ending31 August 2018
Recognition of deferred tax assets for unrealized losses.
IFRS 2 (Amendments)
Share-based Payment 1 January 2018Year ending31 August 2019
Classification and measurement of share-based payment transactions.
IFRS 9 (2014) Financial Instruments 1 January 2018Year ending31 August 2019
Replaces IAS39 Financial Instruments: Recognition and Measurement, and all previous versions of IFRS 9.Amendments for the classification and measurement of financial instruments, adoption of expected credit loss impairment model for financial assets and hedge accounting.
IFRS 15 (Amendments)
Revenue from Contracts with Customers
1 January 2018Year ending31 August 2019
Revised accounting standard for revenue recognition and disclosures.
IFRS 16 (Amendments)
Leases 1 January 2019Year ending31 August 2020
Amendments to accounting treatment for lease arrangements.
IFRS 10 (Amendments)
Amendments to IFRS 10Consolidated FinancialStatements
* —Sale or contribution of assets between an investor and its associate or joint venture.
IAS 28 (Amendments)
Amendments to IAS 28Investments in Associatesand Joint Ventures
* —Sale or contribution of assets between an investor and its associate or joint venture.
* IASB released in December 2015 that it will defer the effective date of the amendments until such time as it has finalized any amendments that result from its research project on the equity method.

15
(3) Segment informationYear ended 31 August 2015
(Millions of yen)
Reportable segmentsTotal
Others(Note 1)
Adjustments(Note 2)
Consolidatedstatement ofprofit or loss
UNIQLOJapan
UNIQLOInternational
GlobalBrands
Revenue ¥780,139 ¥603,684 ¥295,316 ¥1,679,140 ¥2,641 ¥ — ¥1,681,781Operating profit/(losses) 117,249 43,376 14,418 175,045 114 (10,695) 164,463
Segment income (profit before income taxes)
119,651 42,914 14,362 176,928 114 3,633 180,676
Other disclosure:Depreciation and amortization 7,475 16,865 6,682 31,024 181 6,552 37,758Impairment losses 106 3,426 6,083 9,616 — 6,530 16,146
Notes: 1. “Others” include real estate leasing business, etc. 2. “Adjustments” mainly include revenue and corporate expenses which are not allocated to individual reportable segments. Please refer to “15. Impairment Losses”
for details related to IT system investment.
Year ended 31 August 2016(Millions of yen)
Reportable segmentsTotal
Others(Note 1)
Adjustments(Note 2)
Consolidatedstatement ofprofit or loss
UNIQLOJapan
UNIQLOInternational
GlobalBrands
Revenue ¥799,817 ¥655,406 ¥328,557 ¥1,783,782 ¥2,691 ¥ — ¥1,786,473 Operating profit/(losses) 102,462 37,438 9,520 149,421 235 (22,364) 127,292
Segment income/(losses) (profit before income taxes)
100,456 37,138 9,297 146,892 235 (56,890) 90,237
Other disclosure:Depreciation and amortization 7,190 17,623 6,605 31,419 156 5,221 36,797 Impairment losses 1,747 5,833 14,816 22,397 — — 22,397
Notes: 1. “Others” include real estate leasing business, etc. 2. “Adjustments” mainly include revenue and corporate expenses which are not allocated to individual reportable segments.
(4) Geographic informationYear ended 31 August 20151. External revenue
(Millions of yen)
Japan PRC Overseas (Others) Total
¥967,178 ¥204,916 ¥509,687 ¥1,681,781
2. Non-current assets (excluding financial assets and deferred tax assets)
(Millions of yen)
Japan PRC Overseas (Others) Total
¥56,670 ¥25,143 ¥120,548 ¥202,362
Year ended 31 August 20161. External Revenue
(Millions of yen)
Japan PRC Overseas (Others) Total
¥1,033,058 ¥239,720 ¥513,694 ¥1,786,473
2. Non-current assets (excluding financial assets and deferred tax assets)
(Millions of yen)
Japan PRC Overseas (Others) Total
¥63,945 ¥22,194 ¥92,281 ¥178,421
7 Business Combination
Year ended 31 August 2015Not applicable.
Year ended 31 August 2016Not applicable.
8 Cash and Cash Equivalents
The breakdown of cash and cash equivalents as at each year end is as follows:
(Millions of yen)
As at31 August 2015
As at31 August 2016
Cash and bank balances ¥305,204 ¥270,051Money market funds (MMF), cash funds, negotiable certificates of deposits
50,007 115,379
Total ¥355,212 ¥385,431

16
9 Trade and Other Receivables
The breakdown of trade and other receivables as at each year end is as follows:
(Millions of yen)
As at31 August 2015
As at31 August 2016
Accounts receivable—trade ¥40,931 ¥40,509 Notes receivable 66 45 Other accounts receivable 4,459 5,290 Allowance for doubtful accounts (679) (667)
Total ¥44,777 ¥45,178
See note “30. Financial Instruments” for credit risk manage-ment and the fair value of trade and other receivables.
10 Inventories
The breakdown of inventories as at each year end is as follows:
(Millions of yen)
As at31 August 2015
As at31 August 2016
Products ¥255,736 ¥265,831Supplies 4,270 4,172
Total ¥260,006 ¥270,004
No inventories were pledged as collateral to secure debt.
Write-down of inventories to net realizable value is as follows:(Millions of yen)
Year ended31 August 2015
Year ended31 August 2016
Write-down of inventories to net realizable value
¥3,427 ¥3,866
11 Other Financial Assets and Other Financial Liabilities
The breakdown of other financial assets and other financial liabilities as at each year end is as follows:
(Millions of yen)
As at31 August 2015
As at31 August 2016
Other financial assets:Available-for-sale financial assets ¥ 574 ¥ 1,636 Loans and receivables
Loans and receivables 98,225 260,373 Allowance for doubtful accounts (265) (218)
Total loans and receivables 97,960 260,155 Total 98,534 261,792
Other current financial assets total 22,593 184,239 Other non-current financial assets total
75,940 77,553
(Millions of yen)
As at31 August 2015
As at31 August 2016
Other financial liabilities:
Financial liabilities measured at amortized cost
Interest-bearing bank and other borrowings
¥38,035 ¥283,465
Deposits 1,394 1,805Deposits/guarantees received 1,555 1,400
Total 40,985 286,672
Other current financial liabilities total
15,471 12,581
Other non-current financial liabilities total
25,513 274,090
12 Other Assets and Other Liabilities
The breakdown of other assets and other liabilities as at each year end is as follows:
(Millions of yen)
As at31 August 2015
As at31 August 2016
Other assets:Prepayments ¥11,818 ¥11,954Long-term prepayments 4,755 4,453Others 3,941 5,580
Total 20,514 21,987Current 15,748 17,534Non-current 4,766 4,453
(Millions of yen)
As at31 August 2015
As at31 August 2016
Other liabilities:Accruals ¥24,248 ¥24,484Employee benefits accruals 3,793 4,494Others 21,341 16,575
Total 49,382 45,554Current 35,714 31,689Non-current 13,668 13,865

17
13 Property, Plant and Equipment
Increase/(decrease) in acquisition costs, accumulated depreciation and impairment of property, plant and equipment are as follows:
(Millions of yen)
Acquisition costsBuildings and
structures
Furniture,equipment and
vehiclesLand
Construction inprogress
Leased assets Total
At 1 September 2014 ¥163,207 ¥30,943 ¥ 3,689 ¥ 6,021 ¥20,276 ¥224,139 Additions 19,917 9,326 — 11,339 4,818 45,401 Disposals (8,906) (1,368) (343) — (3,726) (14,344)Transfers 10,004 833 — (10,837) — —Exchange realignment 11,540 (1,372) — 760 — 10,929 At 31 August 2015 195,764 38,362 3,345 7,284 21,369 266,126 Additions 17,646 5,342 — 16,584 6,529 46,103 Disposals (8,941) (1,148) (1,383) — (3,141) (14,614)Transfers 11,092 — — (11,092) — —Exchange realignment (19,574) (3,303) — (1,746) — (24,624)At 31 August 2016 195,986 39,253 1,962 11,029 24,757 272,990
(Millions of yen)
Accumulated depreciationand impairment
Buildings andstructures
Furniture,equipment and
vehiclesLand
Construction inprogress
Leased assets Total
At 1 September 2014 ¥ (83,907) ¥(15,510) ¥(315) ¥— ¥(10,007) ¥(109,741)Depreciation provided during the year (18,289) (7,170) — — (4,060) (29,520)Impairment (3,334) (772) (387) — (365) (4,858)Disposals 5,918 1,361 — — 4,016 11,296 Exchange realignment (4,516) 554 — — — (3,961)At 31 August 2015 (104,129) (21,537) (702) — (10,416) (136,785)Depreciation provided during the year (19,953) (7,149) — — (3,939) (31,041)Impairment (6,150) (1,387) — — (384) (7,922)Disposals 6,902 769 702 — 3,351 11,726 Exchange realignment 9,102 3,783 — — — 12,886 At 31 August 2016 (114,226) (25,520) — — (11,389) (151,136)
(Millions of yen)
Net carrying amountBuildings and
structures
Furniture,equipment and
vehiclesLand
Construction inprogress
Leased assets Total
At 31 August 2015 ¥91,635 ¥16,825 ¥2,643 ¥ 7,284 ¥10,952 ¥129,340At 31 August 2016 81,759 13,733 1,962 11,029 13,368 121,853
Net carrying amounts of finance-leased assets are as follows:(Millions of yen)
Net carrying amountBuildings and
structures
Furniture,equipment and
vehiclesOthers Total
At 31 August 2015 ¥ 988 9,964 ¥— ¥10,952At 31 August 2016 1,223 12,144 — 13,368
There are no restrictions on ownership rights and no pledges on the Group’s property, plant and equipment.

18
14 Goodwill and Intangible Assets
(1) The increase/(decrease) in acquisition costs, accumulated amortization and impairment of goodwill and intangible assets are as follows:
(Millions of yen)
Acquisition costs GoodwillIntangible assets other than goodwill
Intangibleassets totalSoftware Trademarks
Otherintangible assets
Total
At 1 September 2014 ¥38,410 ¥33,688 ¥20,158 ¥22,762 ¥76,608 ¥115,018 External purchases — 6,759 — 368 7,128 7,128 Disposals — (2,223) — (673) (2,896) (2,896)Exchange realignment 3,688 3 3,292 2,661 5,956 9,645 At 31 August 2015 42,098 38,227 23,450 25,119 86,797 128,896 External purchases — 10,164 6 131 10,302 10,302 Disposals — (7,233) — (324) (7,558) (7,558)Exchange realignment (3,952) (286) (3,398) (3,851) (7,535) (11,487)At 31 August 2016 38,146 40,871 20,058 21,075 82,006 120,152
(Millions of yen)
Accumulated amortizationand impairment
GoodwillIntangible assets other than goodwill
Intangibleassets totalSoftware Trademarks
Otherintangible assets
Total
At 1 September 2014 ¥(11,694) ¥(15,941) ¥ (5,315) ¥ (8,382) ¥(29,640) ¥(41,334)Amortization provided during the year — (6,146) — (1,761) (7,907) (7,907)Impairment (1,420) (6,135) (1,469) (2,232) (9,837) (11,258)Disposals — 2,196 — 190 2,385 2,385 Exchange realignment (1,818) 23 (785) (43) (805) (2,623)At 31 August 2015 (14,933) (26,005) (7,571) (12,229) (45,806) (60,739)Amortization provided during the year — (4,735) — (1,019) (5,755) (5,755)Impairment (7,565) — (3,902) (2,995) (6,897) (14,463)Disposals — 7,213 — 324 7,538 7,538 Exchange realignment 2,260 207 984 1,928 3,120 5,381 At 31 August 2016 (20,237) (23,319) (10,488) (13,992) (47,800) (68,038)
Note: Amortization of intangible assets is included in “selling, general and administrative expenses” on the consolidated statement of profit or loss.
(Millions of yen)
Net carrying amount GoodwillIntangible assets other than goodwill
Intangibleassets totalSoftware Trademarks
Otherintangible assets
Total
At 31 August 2015 ¥27,165 ¥12,222 ¥15,879 ¥12,889 ¥40,991 ¥68,156 At 31 August 2016 17,908 17,552 9,570 7,083 34,205 52,114
(2) Significant goodwill and intangible assetsGoodwill and intangible assets recorded in the consolidated statement of financial position are mainly for goodwill and trade-marks related to Theory business. Certain trademarks will continue to be used as long as the business remains viable; therefore, management estimated the useful lives as indefinite.
The carrying amount of the goodwill and intangible assets with indefinite useful lives by cash-generating unit (“CGU”) is asfollows:
(Millions of yen)
Net carrying amountGoodwill Intangible assets with indefinite useful lives
UNIQLOJapan
UNIQLOInternational
GlobalBrands
UNIQLOJapan
UNIQLOInternational
GlobalBrands
At 31 August 2015 ¥— ¥— ¥27,165 ¥— ¥— ¥23,244At 31 August 2016 — — 17,908 — — 15,244
19
15 Impairment Losses
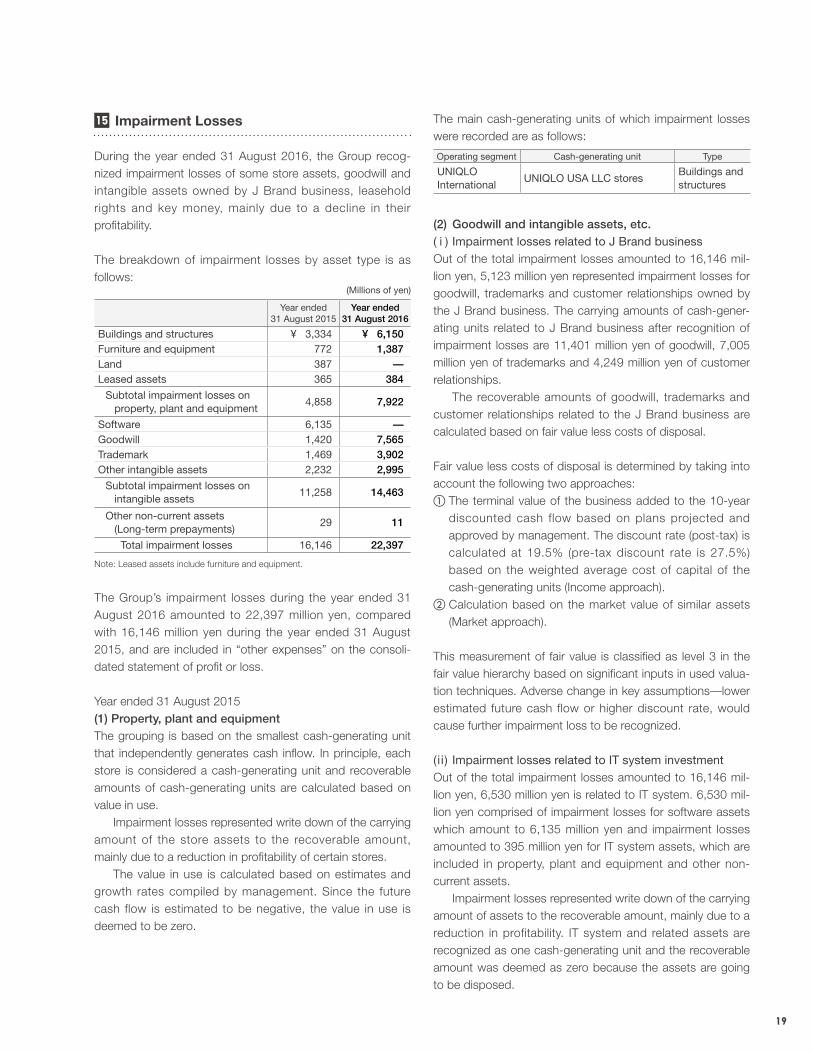
During the year ended 31 August 2016, the Group recog-nized impairment losses of some store assets, goodwill and intangible assets owned by J Brand business, leasehold rights and key money, mainly due to a decline in their profitability.
The breakdown of impairment losses by asset type is as follows:
(Millions of yen)
Year ended31 August 2015
Year ended31 August 2016
Buildings and structures ¥ 3,334 ¥ 6,150 Furniture and equipment 772 1,387 Land 387 —Leased assets 365 384
Subtotal impairment losses on property, plant and equipment
4,858 7,922
Software 6,135 —Goodwill 1,420 7,565 Trademark 1,469 3,902 Other intangible assets 2,232 2,995
Subtotal impairment losses on intangible assets
11,258 14,463
Other non-current assets (Long-term prepayments)
29 11
Total impairment losses 16,146 22,397
Note: Leased assets include furniture and equipment.
The Group’s impairment losses during the year ended 31 August 2016 amounted to 22,397 million yen, compared with 16,146 million yen during the year ended 31 August 2015, and are included in “other expenses” on the consoli-dated statement of profit or loss.
Year ended 31 August 2015(1) Property, plant and equipmentThe grouping is based on the smallest cash-generating unit that independently generates cash inflow. In principle, each store is considered a cash-generating unit and recoverable amounts of cash-generating units are calculated based on value in use. Impairment losses represented write down of the carrying amount of the store assets to the recoverable amount, mainly due to a reduction in profitability of certain stores. The value in use is calculated based on estimates and growth rates compiled by management. Since the future cash flow is estimated to be negative, the value in use is deemed to be zero.
The main cash-generating units of which impairment losses were recorded are as follows:
Operating segment Cash-generating unit Type
UNIQLO International
UNIQLO USA LLC storesBuildings and structures
(2) Goodwill and intangible assets, etc.( i ) Impairment losses related to J Brand businessOut of the total impairment losses amounted to 16,146 mil-lion yen, 5,123 million yen represented impairment losses for goodwill, trademarks and customer relationships owned by the J Brand business. The carrying amounts of cash-gener-ating units related to J Brand business after recognition of impairment losses are 11,401 million yen of goodwill, 7,005 million yen of trademarks and 4,249 million yen of customer relationships. The recoverable amounts of goodwill, trademarks and customer relationships related to the J Brand business are calculated based on fair value less costs of disposal.
Fair value less costs of disposal is determined by taking into account the following two approaches:a The terminal value of the business added to the 10-year
discounted cash flow based on plans projected and approved by management. The discount rate (post-tax) is calculated at 19.5% (pre-tax discount rate is 27.5%) based on the weighted average cost of capital of the cash-generating units (Income approach).
b Calculation based on the market value of similar assets (Market approach).
This measurement of fair value is classified as level 3 in the fair value hierarchy based on significant inputs in used valua-tion techniques. Adverse change in key assumptions—lower estimated future cash flow or higher discount rate, would cause further impairment loss to be recognized.
( i i ) Impairment losses related to IT system investmentOut of the total impairment losses amounted to 16,146 mil-lion yen, 6,530 million yen is related to IT system. 6,530 mil-lion yen comprised of impairment losses for software assets which amount to 6,135 million yen and impairment losses amounted to 395 million yen for IT system assets, which are included in property, plant and equipment and other non-current assets. Impairment losses represented write down of the carrying amount of assets to the recoverable amount, mainly due to a reduction in profitability. IT system and related assets are recognized as one cash-generating unit and the recoverable amount was deemed as zero because the assets are going to be disposed.
20
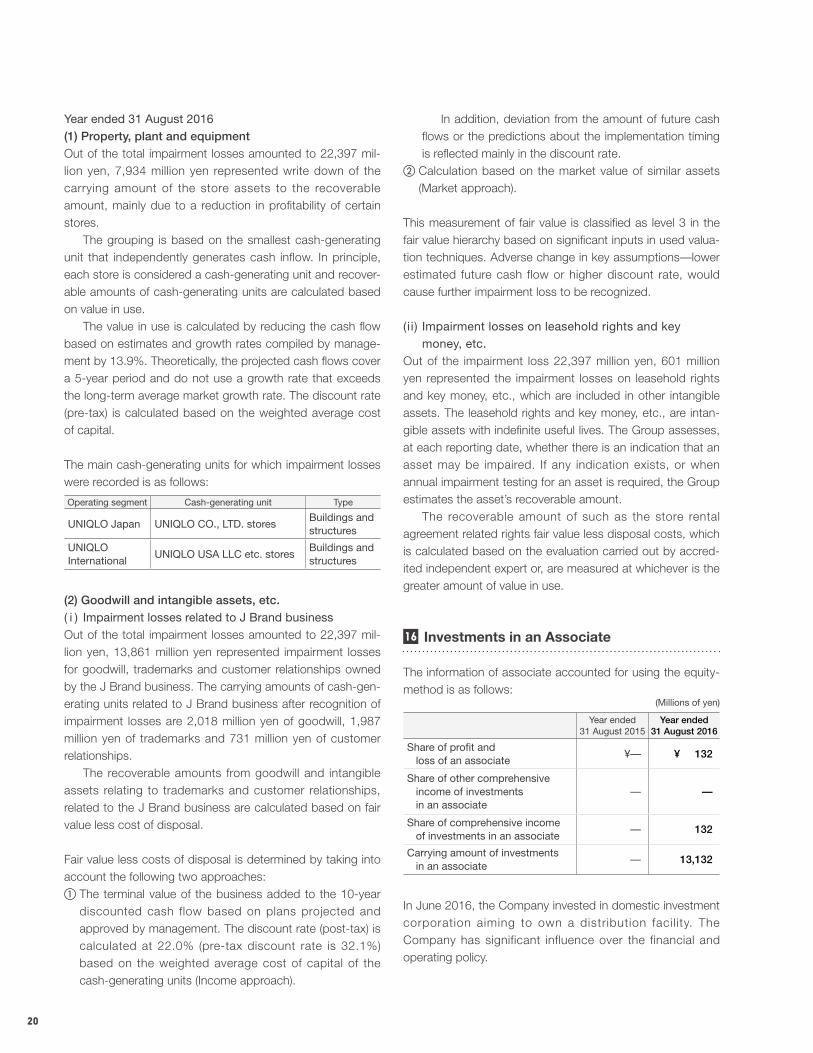
Year ended 31 August 2016(1) Property, plant and equipmentOut of the total impairment losses amounted to 22,397 mil-lion yen, 7,934 million yen represented write down of the carrying amount of the store assets to the recoverable amount, mainly due to a reduction in profitability of certain stores. The grouping is based on the smallest cash-generating unit that independently generates cash inflow. In principle, each store is considered a cash-generating unit and recover-able amounts of cash-generating units are calculated based on value in use. The value in use is calculated by reducing the cash flow based on estimates and growth rates compiled by manage-ment by 13.9%. Theoretically, the projected cash flows cover a 5-year period and do not use a growth rate that exceeds the long-term average market growth rate. The discount rate (pre-tax) is calculated based on the weighted average cost of capital.
The main cash-generating units for which impairment losses were recorded is as follows:
Operating segment Cash-generating unit Type
UNIQLO Japan UNIQLO CO., LTD. storesBuildings and structures
UNIQLO International
UNIQLO USA LLC etc. storesBuildings and structures
(2) Goodwill and intangible assets, etc.( i ) Impairment losses related to J Brand businessOut of the total impairment losses amounted to 22,397 mil-lion yen, 13,861 million yen represented impairment losses for goodwill, trademarks and customer relationships owned by the J Brand business. The carrying amounts of cash-gen-erating units related to J Brand business after recognition of impairment losses are 2,018 million yen of goodwill, 1,987 million yen of trademarks and 731 million yen of customer relationships. The recoverable amounts from goodwill and intangible assets relating to trademarks and customer relationships, related to the J Brand business are calculated based on fair value less cost of disposal.
Fair value less costs of disposal is determined by taking into account the following two approaches:a The terminal value of the business added to the 10-year
discounted cash flow based on plans projected and approved by management. The discount rate (post-tax) is calculated at 22.0% (pre-tax discount rate is 32.1%) based on the weighted average cost of capital of the cash-generating units (Income approach).
In addition, deviation from the amount of future cash flows or the predictions about the implementation timing is reflected mainly in the discount rate.
b Calculation based on the market value of similar assets (Market approach).
This measurement of fair value is classified as level 3 in the fair value hierarchy based on significant inputs in used valua-tion techniques. Adverse change in key assumptions—lower estimated future cash flow or higher discount rate, would cause further impairment loss to be recognized.
( i i ) Impairment losses on leasehold rights and key money, etc.
Out of the impairment loss 22,397 million yen, 601 million yen represented the impairment losses on leasehold rights and key money, etc., which are included in other intangible assets. The leasehold rights and key money, etc., are intan-gible assets with indefinite useful lives. The Group assesses, at each reporting date, whether there is an indication that an asset may be impaired. If any indication exists, or when annual impairment testing for an asset is required, the Group estimates the asset’s recoverable amount. The recoverable amount of such as the store rental agreement related rights fair value less disposal costs, which is calculated based on the evaluation carried out by accred-ited independent expert or, are measured at whichever is the greater amount of value in use.
16 Investments in an Associate
The information of associate accounted for using the equity-method is as follows:
(Millions of yen)
Year ended31 August 2015
Year ended31 August 2016
Share of profit and loss of an associate
¥— ¥ 132
Share of other comprehensive income of investments in an associate
— —
Share of comprehensive income of investments in an associate
— 132
Carrying amount of investments in an associate
— 13,132
In June 2016, the Company invested in domestic investment corporation aiming to own a distribution facil ity. The Company has significant influence over the financial and operating policy.

21
The maximum exposure of losses exposed to the Company’s investment in the associate is limited to the car-rying amount of investment by the Company included in the consolidated statement of financial position as “Investments in an associate” amounted to 13,132 million yen. The Group’s share of profit and comprehensive income of the associate are 132 million yen and are included in the consoli-dated statement of profit or loss and consolidated statement of comprehensive income, respectively.
Total assets of the associate amounted to 73,127 million yen, which mainly comprised of non-current assets such as warehouse and etc. The Company invested in the associate at the time of incorporation and no goodwill is recognized. The Company has not received dividend from the associ-ate during the year ended 31 August 2016. The Group has entered into lease contracts with the associate relating to warehouse rental etc.
18 Operating Lease Commitments
(1) As lesseeThe Group’s total future minimum lease payments on non-cancellable operating leases as at each year end are as follows:
(Millions of yen)
As at31 August 2015
As at31 August 2016
Due within one year ¥ 34,018 ¥ 37,956 Due after one year through five years 96,064 104,234 Due after five years 85,187 126,506
Total 215,270 268,696
The total minimum lease payments and contingent rents for operating lease contracts recognized as expenses during the year are as follows:
(Millions of yen)
Year ended31 August 2015
Year ended31 August 2016
Total minimum lease payments ¥103,298 ¥ 90,544Contingent rents 63,139 80,811
Total 166,437 171,356
Contingent rents, renewal options, and escalation clauses (clauses enabling upward revision of rental charges) are included in the operating lease agreements. There are no limitations imposed by lease contracts (limi-tations regarding dividends, additional borrowing, or addi-tional leases, etc.).
(2) As lessorThe Company sub-leases some of the properties it leased through operating leases, and so while it pays rent to the
17 Finance Lease Obligations
The breakdown of finance lease obligations is as follows:(Millions of yen)
Future minimum lease paymentsPresent value of
future minimum lease payments
As at31 August 2015
As at31 August 2016
As at31 August 2015
As at31 August 2016
Finance lease obligationsDue within one year ¥ 4,302 ¥ 4,954 ¥ 4,188 ¥ 4,821 Due after one year through five years 8,185 9,956 8,073 9,679 Due after five years — 1,568 — 1,567
Total 12,488 16,479 12,262 16,069 Deductions—future finance costs (226) (410) — —Total net finance lease payables 12,262 16,069 12,262 16,069 Current portion — — 4,188 4,821 Non-current portion — — 8,073 11,247
The Group has no sublease contracts, accrued variable lease fees or escalation clauses (clauses enabling upward revision of rental charges), and no limitations imposed by lease contracts (limitations regarding dividends, additional borrowing, or addi-tional leases, etc.).

22
property owner, it also receives rent from the sub-tenant.
A breakdown of the future minimum rental receivables under non-cancellable leases is as follows:
(Millions of yen)
As at31 August 2015
As at31 August 2016
Due within one year ¥ 8 ¥ 3Due after one year through five years — 14Due after five years — 3
Total 8 21
The total of contingent rents recorded as revenue during each reporting period is as follows:
(Millions of yen)
Year ended31 August 2015
Year ended31 August 2016
Contingent rents ¥1,162 ¥1,136
19 Deferred Taxes and Income Taxes
(1) Deferred taxesThe main factors in the increase/(decrease) of deferred tax assets and deferred tax liabilities are as follows:
(Millions of yen)
As at1 September 2014
Recognizedin profit or loss
(Note)
Recognized in othercomprehensive
income
As at31 August 2015
Temporary differencesAccrued business tax ¥ 2,073 ¥ 305 ¥ — ¥ 2,378 Allowance for bonuses 2,697 595 — 3,293 Provision of allowance for doubtful accounts 122 76 — 199 Impairment losses on non-current assets 998 2,244 — 3,243 Unrealized gains/(losses) on available-for-sale securities (1) — (69) (70)Depreciation 5,524 361 — 5,886 Net gain/(loss) on revaluation of cash flow hedges (35,861) — (16,180) (52,042)Temporary differences on shares of subsidiaries (2,203) 208 — (1,994)Accelerated depreciation (3,505) (1,751) — (5,256)Intangible assets (4,747) 806 — (3,940)Others 4,593 921 — 5,515 Subtotal (30,308) 3,770 (16,250) (42,788)Tax losses carried forward 4,177 2,445 — 6,623 Net deferred tax assets/(liabilities) (26,130) 6,215 (16,250) (36,165)
Note: The difference between the total amount recognized in profit or loss and the amount of deferred tax is due to exchange realignment.
(Millions of yen)
As at1 September 2015
Recognizedin profit or loss
(Note)
Recognized in othercomprehensive
income
As at31 August 2016
Temporary differencesAccrued business tax ¥ 2,378 ¥(1,249) ¥ — ¥ 1,129 Allowance for bonuses 3,293 91 — 3,385 Provision of allowance for doubtful accounts 199 (12) — 186 Impairment losses on non-current assets 3,243 310 — 3,553 Unrealized gains/(losses) on available-for-sale securities (70) — 33 (36)Depreciation 5,886 533 — 6,419 Net gain/(loss) on revaluation of cash flow hedges (52,042) — 74,659 22,617 Temporary differences on shares of subsidiaries (1,994) 101 — (1,893)Accelerated depreciation (5,256) (240) — 5,496 Intangible assets (3,940) 3,293 — 647 Others 5,515 (371) — 5,143 Subtotal (42,788) 2,456 74,693 34,361 Tax losses carried forward 6,623 (366) — 6,257 Net deferred tax assets/(liabilities) (36,165) 2,090 74,693 40,618
Note: The difference between the total amount recognized in profit or loss and the amount of deferred tax is due to exchange realignment.

23
Tax effects of unrecognized tax losses carried forward and deductible temporary differences for which deferred tax assets were not recognized is as follows:
(Millions of yen)
As at31 August 2015
As at31 August 2016
Unrecognized tax losses carried forward
¥ 9,590 ¥15,488
Deductible temporary differences 12,577 14,607 Total 22,167 30,095
Tax effects of unrecognized tax losses carried forward of which no deferred tax asset is recognized in the consolidated statement of financial position, if unutilized, will expire as follows:
(Millions of yen)
As at31 August 2015
As at31 August 2016
First year ¥ — ¥ —Second year — —Third year — —Fourth year — —Fifth year and thereafter 9,590 15,488
Total 9,590 15,488
Temporary differences on shares of subsidiaries for which deferred tax liabilities were not recognized. The aggregate amounts of temporary differences associ-ated with undistributed retained earnings of subsidiaries for which deferred tax liabilities have not been recognized as at 31 August 2015 and 31 August 2016 were 414,218 million yen and 284,455 million yen, respectively. No liability has been recognized with respect to these dif-ferences because the Group is in a position to control the timing of the reversal of the temporary differences and it is probable that such differences will not be reversed in the foreseeable future.
(2) Income taxes(Millions of yen)
Year ended31 August 2015
Year ended31 August 2016
Current tax ¥68,110 ¥40,772Deferred tax (4,822) (4,609)
Total 63,287 36,162
Reconciliations between the statutory income tax rates and the effective tax rates are as follows. The effective tax rate shown is the corporate income tax rate applied to the Group’s profit before income taxes. In addition, following promulgation of the “Act for Partial Amendment of the Income Tax Act, etc.” (Act No. 15 of 2008) and “Act for Partial Amendment of the Local Tax Act, etc.” (Act No. 13 of 2016) on 29 March 2016, a reduction in the corpo-ration tax rate was applied to the Company and its domestic subsidiaries from the fiscal year commencing 1 April 2016. As a result, the statutory tax rate used in the calculation of deferred tax assets and liabilities has been revised from 32.2% to 30.8% with regard to temporary differences expected to be eliminated in the consolidated fiscal years commencing 1 September 2016, and 2017 and to 30.6% with regard to temporary differences expected to be elimi-nated in the consolidated fiscal year commencing 1 September 2018.
The impact of this tax rate amendment on the financial state-ments is slight.
(Millions of yen)
Year ended31 August 2015
Year ended31 August 2016
Statutory income tax rate 35.6% 33.0%Unrecognized deferred tax assets 2.0% 8.9%
Difference in statutory income tax rates of subsidiaries
(4.2%) (7.9%)
Impairment loss of goodwill 0.3% 3.2%Inhabitant tax on per capita basis 0.4% 1.0%Others 0.8% 1.7%Effective tax rate 35.0% 40.0%
20 Trade and Other Payables
The breakdown of trade and other payables as at each year end is as follows:
(Millions of yen)
As at31 August 2015
As at31 August 2016
Trade payables ¥122,620 ¥130,745Other payables 58,957 58,756
Total 181,577 189,501
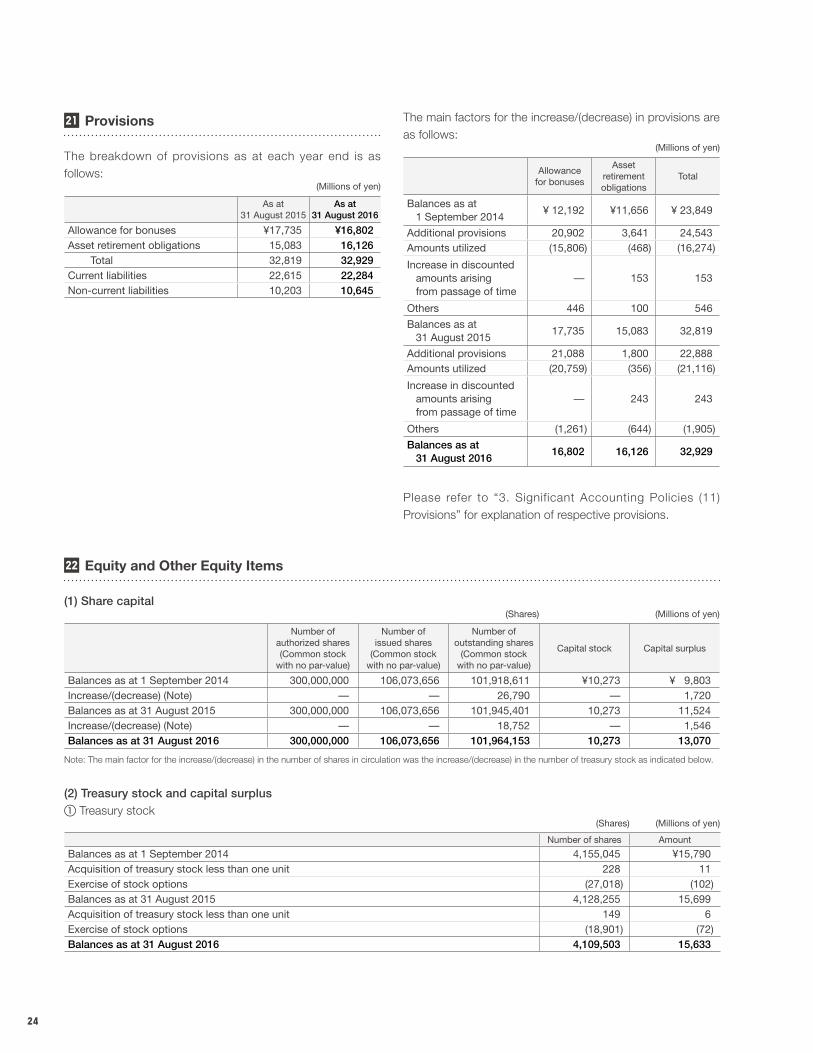
24
21 Provisions
The breakdown of provisions as at each year end is as follows:
(Millions of yen)
As at31 August 2015
As at31 August 2016
Allowance for bonuses ¥17,735 ¥16,802Asset retirement obligations 15,083 16,126
Total 32,819 32,929Current liabilities 22,615 22,284Non-current liabilities 10,203 10,645
The main factors for the increase/(decrease) in provisions are as follows:
(Millions of yen)
Allowancefor bonuses
Assetretirement obligations
Total
Balances as at 1 September 2014
¥ 12,192 ¥11,656 ¥ 23,849
Additional provisions 20,902 3,641 24,543 Amounts utilized (15,806) (468) (16,274)
Increase in discounted amounts arising from passage of time
— 153 153
Others 446 100 546
Balances as at 31 August 2015
17,735 15,083 32,819
Additional provisions 21,088 1,800 22,888 Amounts utilized (20,759) (356) (21,116)
Increase in discounted amounts arising from passage of time
— 243 243
Others (1,261) (644) (1,905)
Balances as at 31 August 2016
16,802 16,126 32,929
Please refer to “3. Significant Accounting Policies (11) Provisions” for explanation of respective provisions.
22 Equity and Other Equity Items
(1) Share capital(Shares) (Millions of yen)
Number ofauthorized shares(Common stock
with no par-value)
Number ofissued shares
(Common stockwith no par-value)
Number ofoutstanding shares
(Common stockwith no par-value)
Capital stock Capital surplus
Balances as at 1 September 2014 300,000,000 106,073,656 101,918,611 ¥10,273 ¥ 9,803Increase/(decrease) (Note) — — 26,790 — 1,720Balances as at 31 August 2015 300,000,000 106,073,656 101,945,401 10,273 11,524Increase/(decrease) (Note) — — 18,752 — 1,546Balances as at 31 August 2016 300,000,000 106,073,656 101,964,153 10,273 13,070
Note: The main factor for the increase/(decrease) in the number of shares in circulation was the increase/(decrease) in the number of treasury stock as indicated below.
(2) Treasury stock and capital surplusa Treasury stock
(Shares) (Millions of yen)
Number of shares Amount
Balances as at 1 September 2014 4,155,045 ¥15,790Acquisition of treasury stock less than one unit 228 11Exercise of stock options (27,018) (102)Balances as at 31 August 2015 4,128,255 15,699Acquisition of treasury stock less than one unit 149 6Exercise of stock options (18,901) (72)Balances as at 31 August 2016 4,109,503 15,633

25
b Capital surplus(Millions of yen)
Capital reserveGain/(loss) on
disposalof treasury stock
Stock options Others Total
Balances as at 1 September 2014 ¥4,578 ¥1,856 ¥1,642 ¥1,726 ¥ 9,803Disposal of treasury stock — 700 — — 700Share-based payments — — 1,019 — 1,019Balances as at 31 August 2015 4,578 2,556 2,662 1,726 11,524Disposal of treasury stock — 546 — — 546Share-based payments — — 945 — 945Others — 8 (8) 53 53Balances as at 31 August 2016 4,578 3,112 3,599 1,779 13,070
Please refer to “29. Share-based payments” for details of share-based payments (stock options).
(3) Other components of equityThe breakdown of other comprehensive income included in non-controlling interests is as follows:
(Millions of yen)
Year ended31 August 2015
Year ended31 August 2016
Exchange differences on translation of foreign operations
¥(774) ¥(2,648)
Cash flow hedges 667 (1,400)Other comprehensive income (107) (4,049)
(4) DividendsThe Company’s basic policy is to pay dividends twice a year, an interim dividend and a year-end dividend. These dividends are decided by resolution of the Board, unless otherwise stipulated by laws and regulations.
The total amount of dividends paid was as follows:Year ended 31 August 2015
(Millions of yen) (Yen)
ResolutionsAmount of dividends
Dividendsper share
Board of Directors’ meeting held on 3 November 2014
¥15,287 ¥150
Board of Directors’ meeting held on 9 April 2015
17,838 175
Year ended 31 August 2016(Millions of yen) (Yen)
ResolutionsAmount of dividends
Dividendsper share
Board of Directors’ meeting held on 4 November 2015
¥17,840 ¥175
Board of Directors’ meeting held on 7 April 2016
18,861 185
Proposed dividends on common stock are as follows:
Year ended31 August 2015
Year ended31 August 2016
Total amount of dividends (Million yen)
¥17,840 ¥16,824
Dividends per share (Yen) 175 165
Regarding the proposed dividends per common stock, the Board has approved the proposal subsequent to the year-end date, and this sum is not recognized as a liability at year end.
23 Revenue
The breakdown of revenue for each reporting period is as follows:
(Millions of yen)
Year ended31 August 2015
Year ended31 August 2016
RevenueSales of goods ¥1,677,016 ¥1,782,033Service revenue 4,765 4,440
Total 1,681,781 1,786,473

26
24 Selling, General and Administrative Expenses
The breakdown of sell ing, general and administrative expenses for the year is as follows:
(Millions of yen)
Year ended31 August 2015
Year ended31 August 2016
Selling, general and administrative expenses
Advertising and promotion ¥ 68,474 ¥ 71,611Rental expenses 166,437 171,356Depreciation and amortization 37,758 36,797Outsourcing 29,324 33,602Salaries 230,815 242,033Others 139,053 147,555
Total 671,863 702,956
25 Other Income and Other Expenses
The breakdown of other income and other expenses for the year is as follows:
(Millions of yen)
Year ended31 August 2015
Year ended31 August 2016
Other incomeForeign exchange gains* ¥5,809 ¥ —
Gains on sales of property, plant and equipment
43 135
Share of income of investments accounted for using the equity method
— 132
Others 2,929 2,095Total 8,782 2,363
(Millions of yen)
Year ended31 August 2015
Year ended31 August 2016
Other expensesForeign exchange Iosses* ¥ — ¥11,095
Loss on retirement of property, plant and equipment
2,479 1,052
Impairment losses 16,146 22,397Others 2,366 2,567
Total 20,992 37,112
* Currency adjustments incurred in the course of operating transactions are included in “other income” or “other expenses”.
26 Finance Income and Finance Costs
The breakdown of finance income and finance costs for each reporting period is as follows:
(Millions of yen)
Year ended31 August 2015
Year ended31 August 2016
Finance incomeForeign exchange gains* ¥15,084 ¥ —Interest income 1,434 2,349Dividend income 42 14Others 792 —
Total 17,354 2,364
(Millions of yen)
Year ended31 August 2015
Year ended31 August 2016
Finance costsForeign exchange Iosses* ¥ — ¥36,955Interest expenses 1,137 2,402Others 3 62
Total 1,141 39,420
* Currency adjustments incurred in the course of non-operating transactions are included in “finance income” or “finance costs”.
27 Other Comprehensive Income
The breakdown of amounts recorded during the year, reclassification adjustments and income tax effect generated by individ-ual comprehensive income items included in “other comprehensive income” for the year are as follows:
Year ended 31 August 2015(Millions of yen)
Amountrecorded during
the year
Reclassificationadjustment
Amount beforeincome tax
Income tax effectAmount afterincome tax
Net gain/(loss) on revaluation of available-for-sale investments
¥ (585) ¥ — ¥ (585) ¥ (69) ¥ (655)
Exchange differences on translation of foreign operations
14,040 — 14,040 — 14,040
Cash flow hedges 142,536 (86,004) 56,531 (16,180) 40,350Total 155,991 (86,004) 69,986 (16,250) 53,735

27
Year ended 31 August 2016(Millions of yen)
Amountrecorded during
the year
Reclassificationadjustment
Amount beforeincome tax
Income tax effectAmount afterincome tax
Net gain/(loss) on revaluation of available-for-sale investments
¥ 71 ¥ — ¥ 71 ¥ 33 ¥ 105
Exchange differences on translation of foreign operations
(43,312) — (43,312) — (43,312)
Cash flow hedges (168,603) (56,295) (224,899) 74,659 (150,239)Total (211,844) (56,295) (268,140) 74,693 (193,447)
28 Earnings per Share
(Yen)
Year ended 31 August 2015 Year ended 31 August 2016
Equity per share attributable to owners of the parent ¥7,366.07 Equity per share attributable to owners of the parent ¥5,634.35Basic earnings per share for the year 1,079.42 Basic earnings per share for the year 471.31Diluted earnings per share for the year 1,078.08 Diluted earnings per share for the year 470.69
Note: The basis for calculation of basic earnings per share and diluted earnings per share for the year is as follows:
Year ended31 August 2015
Year ended31 August 2016
Basic earnings per share for the yearProfit for the year attributable to owners of the parent (Millions of yen) 110,027 48,052 Profit not attributable to common shareholders (Millions of yen) — —Profit attributable to common shareholders (Millions of yen) 110,027 48,052 Average number of common stock during the year (Shares) 101,932,225 101,955,026
Diluted earnings per share for the yearAdjustment to profit (Millions of yen) — —Increase in number of common stock (Shares) 126,749 134,476 (Share subscription rights) (126,749) (134,476)
29 Share-based Payments
The Group has a program for issuing share subscription rights as share-based compensation stock options for employees of the Company and its subsidiaries as a means of recognizing their contribution to Group’s profit. By linking the Company’s stock price to the benefits received by personnel, this program aims to boost staff morale and motivation, improve Group per-formance and enhance shareholder value by strengthening business development with a focus on shareholder return.
1. Details, scale and changes in stock options(1) Description of stock options
1st share subscription rights A type 1st share subscription rights B type
Category and number of grantees
Employees of the Company: 7Employees of the Group subsidiaries: 3
Employees of the Company: 266Employees of the Group subsidiaries: 413
Number of stock options by type of shares (Note)
Common stock: maximum 3,370 shares Common stock: maximum 77,542 shares
Grant date 8 November 2010 8 November 2010
Vesting conditionsTo serve continuously until the vesting date (7 November 2013) after the grant date (8 November 2010)
To serve continuously until the vesting date (7 December 2010) after the grant date (8 November 2010)
Eligible service period From 8 November 2010 to 7 November 2013 From 8 November 2010 to 7 December 2010Exercise period From 8 November 2013 to 7 November 2020 From 8 December 2010 to 7 November 2020Settlement Equity settlement Equity settlement

28
2nd share subscription rights A type 2nd share subscription rights B type
Category and number of grantee
Employees of the Company: 14Employees of the Group subsidiaries: 4
Employees of the Company: 139Employees of the Group subsidiaries: 584
Number of stock options by type of shares (Note)
Common stock: maximum 13,894 shares Common stock: maximum 51,422 shares
Grant date 15 November 2011 15 November 2011
Vesting conditionsTo serve continuously until the vesting date (14 November 2014) after the grant date (15 November 2011)
To serve continuously until the vesting date (14 December 2011) after the grant date (15 November 2011)
Eligible service period From 15 November 2011 to 14 November 2014 From 15 November 2011 to 14 December 2011Exercise period From 15 November 2014 to 14 November 2021 From 15 December 2011 to 14 November 2021Settlement Equity settlement Equity settlement
3rd share subscription rights A type 3rd share subscription rights B type
Category and number of grantee
Employees of the Company: 18Employees of the Group subsidiaries: 8
Employees of the Company: 136Employees of the Group subsidiaries: 615
Number of stock options by type of shares (Note)
Common stock: maximum 10,793 shares Common stock: maximum 39,673 shares
Grant date 13 November 2012 13 November 2012
Vesting conditionsTo serve continuously until the vesting date (12 November 2015) after the grant date (13 November 2012)
To serve continuously until the vesting date (12 December 2012) after the grant date (13 November 2012)
Eligible service period From 13 November 2012 to 12 November 2015 From 13 November 2012 to 12 December 2012Exercise period From 13 November 2015 to 12 November 2022 From 13 December 2012 to 12 November 2022Settlement Equity settlement Equity settlement
4th share subscription rights A type 4th share subscription rights B type
Category and number of grantee
Employees of the Company: 19Employees of the Group subsidiaries: 11
Employees of the Company: 180Employees of the Group subsidiaries: 706
Number of stock options by type of shares (Note)
Common stock: maximum 7,564 shares Common stock: maximum 29,803 shares
Grant date 3 December 2013 3 December 2013
Vesting conditionsTo serve continuously until the vesting date (2 December 2016) after the grant date (3 December 2013)
To serve continuously until the vesting date (2 January 2014) after the grant date (3 December 2013)
Eligible service period From 3 December 2013 to 2 December 2016 From 3 December 2013 to 2 January 2014Exercise period From 3 December 2016 to 2 December 2023 From 3 January 2014 to 2 December 2023Settlement Equity settlement Equity settlement
5th share subscription rights A type 5th share subscription rights B type
Category and number of grantee
Employees of the Company: 36Employees of the Group subsidiaries: 16
Employees of the Company: 223Employees of the Group subsidiaries: 785
Number of stock options by type of shares (Note)
Common stock: maximum 21,732 shares Common stock: maximum 33,062 shares
Grant date 14 November 2014 14 November 2014
Vesting conditionsTo serve continuously until the vesting date (13 November 2017) after the grant date (14 November 2014)
To serve continuously until the vesting date (13 December 2014) after the grant date (14 November 2014)
Eligible service period From 14 November 2014 to 13 November 2017 From 14 November 2014 to 13 December 2014Exercise period From 14 November 2017 to 13 November 2024 From 14 December 2014 to 13 November 2024Settlement Equity settlement Equity settlement

29
6th share subscription rights A type 6th share subscription rights B type
Category and number of grantee
Employees of the Company: 15Employees of the Group subsidiaries: 19
Employees of the Company: 274Employees of the Group subsidiaries: 921
Number of stock options by type of shares (Note)
Common stock: maximum 2,847 shares Common stock: maximum 25,389 shares
Grant date 13 November 2015 13 November 2015
Vesting conditionsTo serve continuously until the vesting date (12 November 2018) after the grant date (13 November 2015)
To serve continuously until the vesting date (12 December 2015) after the grant date (13 November 2015)
Eligible service period From 13 November 2015 to 12 November 2018 From 13 November 2015 to 12 December 2015Exercise period From 13 November 2018 to 12 November 2025 From 13 December 2015 to 12 November 2025Settlement Equity settlement Equity settlement
6th share subscription rights C type
Category and number of grantee
Employees of the Company: 26
Number of stock options by type of shares (Note)
Common stock: maximum 6,072 shares
Grant date 13 November 2015
Vesting conditionsTo serve continuously until the vesting date (12 November 2018) after the grant date (13 November 2015)
Eligible service period From 13 November 2015 to 12 November 2018Exercise period 13 November 2018Settlement Equity settlement
Note: The number of stock options is equivalent to the number of shares.
Expenses recognized for share-based payments are as follows:
(Millions of yen)
Year ended31 August 2015
Year ended31 August 2016
Expenses recognized Share-based payments
¥1,849 ¥1,539
(2) Scale of stock options program and changesFor purposes of counting the number of stock options in existence in the consolidated fiscal year under review (ended August 2016), each stock option is recorded as converted to shares.a The number and weighted average exercise prices of
stock optionsStock options
(Shares)
Number of shares
Year ended31 August 2015
Year ended31 August 2016
Non-vestedNon-vested at beginning of the year 30,375 34,172
Granted 54,794 34,308Forfeited (4,790) (957)Vested (46,207) (35,089)
Non-vested at end of the year 34,172 32,434
(Shares)
Number of shares
Year ended31 August 2015
Year ended31 August 2016
VestedOutstanding at beginning of the year 64,774 83,147
Vested 46,207 35,089Exercised (27,018) (18,940)Forfeited (816) (415)
Outstanding at end of the year 83,147 98,881
All stock options are granted with an exercise price of 1 yen per share.
b Stock price on exercise dateStock options exercised during the year ended 31 August 2016 are as follows:
(Shares) (Yen)
Type Number of sharesWeighted average
stock price on exercise date
Stock options 18,940 ¥36,491
c Expected life of stock optionsThe weighted average expected life of outstanding stock options as at 31 August 2016 was 6.87 years. In addition, the weighted average expected life of out-standing stock options as at 31 August 2015 was 7.63 years.

30
3. Estimation method of the number of share subscription rights which have already been vested
Because it is difficult to reasonably estimate the number of options that will expire in the future, the method reflecting actual numbers of forfeiture is adopted.
30 Financial Instruments
(1) Capital risk managementThe Group engages in capital management to achieve con-tinuous growth and maximize corporate value.
The ratio of the Group’s net interest-bearing borrowings to equity is as follows:
(Millions of yen)
As at31 August 2015
As at31 August 2016
Interest-bearing borrowings ¥ 38,035 ¥ 283,465Cash and cash equivalents 355,212 385,431Net interest-bearing borrowings (317,176) (101,965)Equity 774,804 597,661
To maximize corporate value, the Group engages in cash flow-oriented management. As at 31 August 2015 and 2016, the Group maintained a position where the value of cash and cash equivalents exceeded interest-bearing borrowings. As at 31 August 2016, the Group is not subject to any externally imposed capital requirement.
(2) Significant accounting policiesSee Note “3. Significant Accounting Policies” for significant accounting policies regarding standards for recognizing financial assets, financial liabilities, equity financial instru-ments, as well as the fundamentals of measurement and recognition of profit or loss.
2. Methods of estimating fair value of stock options, etc.The methods of estimating fair value of 6th share subscrip-tion rights A type, B type and C type, granted during the year ended 31 August 2016, were as follows:a Valuation model: Black-Scholes modelb The following table lists the inputs to the model used:
6th sharesubscription rights
A type
6th sharesubscription rights
B type
Stock price volatility (Note 1) 35% 33%Expected life of options (Note 2) 6.5 years 5.04 yearsExpected dividends (Note 3) 350 yen/share 350 yen/shareRisk-free interest rate (Note 4) 0.083% 0.044%
6th sharesubscription rights
C type
Stock price volatility (Note 1) 34%Expected life of options (Note 2) 3.0 yearsExpected dividends (Note 3) 350 yen/shareRisk-free interest rate (Note 4) 0.008%
Notes: 1. Stock price volatility is computed based on the actual results of 6.5 years for A type (from May 2009 to October 2015), 5.04 years for B type (from November 2010 to October 2015) and 3 years for C type (from November 2012 to October 2015).
2. Expected life of options is estimated to be the reasonable period from the grant date until the exercise date.
3. Expected dividends are the actual dividends for the year ended 31 August 2015.
4. Risk-free interest rate refers to the yield of Japanese government bonds corresponding to the expected life of options.
Also, the method of estimating fair value for the 5th share subscription rights A type and B type granted during the year ended 31 August 2015 are as follows:a Valuation model: Black-Scholes modelb The following table lists the inputs to the model used:
5th sharesubscription rights
A type
5th sharesubscription rights
B type
Stock price volatility (Note 1) 36% 34%Expected life of options (Note 2) 6.5 years 5.04 yearsExpected dividends (Note 3) 300 yen/share 300 yen/shareRisk-free interest rate (Note 4) 0.254% 0.168%
Notes: 1. Stock price volatility is computed based on the actual results of 6.5 years for A type (from May 2008 to October 2014) and 5.04 years for B type (from November 2009 to October 2014).
2. Expected life of options is estimated to be the reasonable period from the grant date until the exercise date.
3. Expected dividends are the actual dividends for the year ended 31 August 2014.
4. Risk-free interest rate refers to the yield of Japanese government bonds corresponding to the expected life of options.
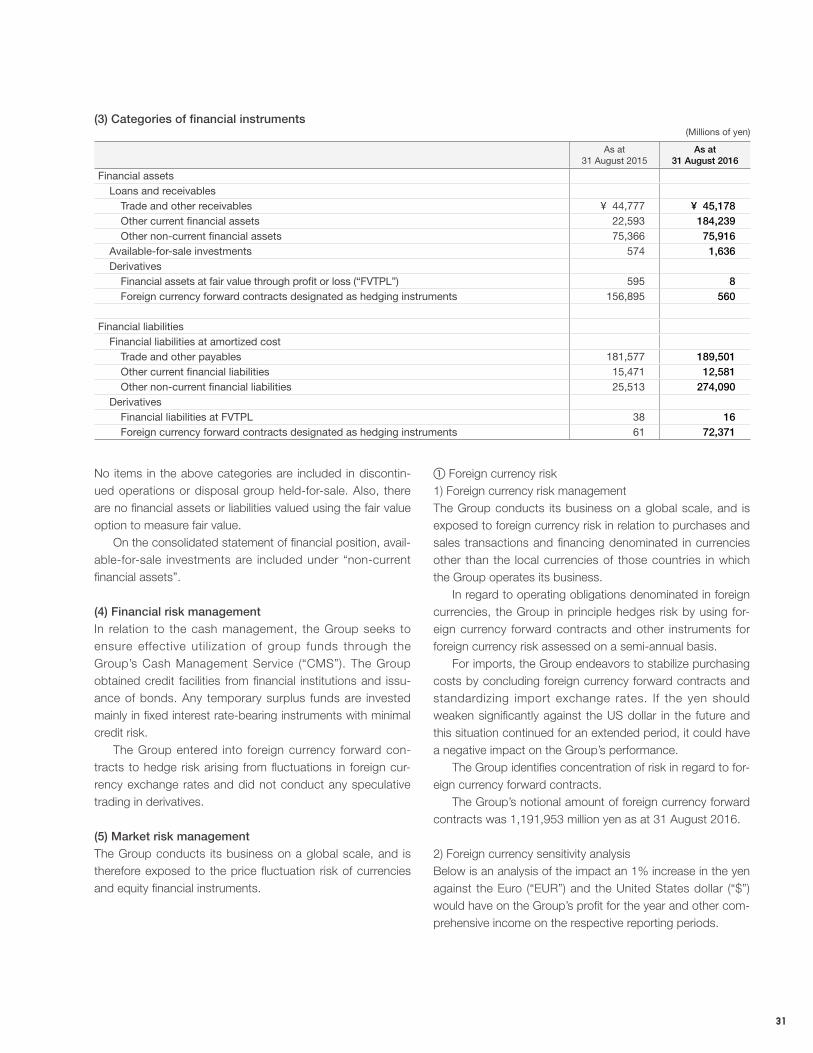
31
(3) Categories of financial instruments(Millions of yen)
As at31 August 2015
As at31 August 2016
Financial assetsLoans and receivables
Trade and other receivables ¥ 44,777 ¥ 45,178 Other current financial assets 22,593 184,239 Other non-current financial assets 75,366 75,916
Available-for-sale investments 574 1,636 Derivatives
Financial assets at fair value through profit or loss (“FVTPL”) 595 8 Foreign currency forward contracts designated as hedging instruments 156,895 560
Financial liabilitiesFinancial liabilities at amortized cost
Trade and other payables 181,577 189,501 Other current financial liabilities 15,471 12,581 Other non-current financial liabilities 25,513 274,090
DerivativesFinancial liabilities at FVTPL 38 16 Foreign currency forward contracts designated as hedging instruments 61 72,371
No items in the above categories are included in discontin-ued operations or disposal group held-for-sale. Also, there are no financial assets or liabilities valued using the fair value option to measure fair value. On the consolidated statement of financial position, avail-able-for-sale investments are included under “non-current financial assets”.
(4) Financial risk managementIn relation to the cash management, the Group seeks to ensure effective utilization of group funds through the Group’s Cash Management Service (“CMS”). The Group obtained credit facilities from financial institutions and issu-ance of bonds. Any temporary surplus funds are invested mainly in fixed interest rate-bearing instruments with minimal credit risk. The Group entered into foreign currency forward con-tracts to hedge risk arising from fluctuations in foreign cur-rency exchange rates and did not conduct any speculative trading in derivatives.
(5) Market risk managementThe Group conducts its business on a global scale, and is therefore exposed to the price fluctuation risk of currencies and equity financial instruments.
a Foreign currency risk1) Foreign currency risk managementThe Group conducts its business on a global scale, and is exposed to foreign currency risk in relation to purchases and sales transactions and financing denominated in currencies other than the local currencies of those countries in which the Group operates its business. In regard to operating obligations denominated in foreign currencies, the Group in principle hedges risk by using for-eign currency forward contracts and other instruments for foreign currency risk assessed on a semi-annual basis. For imports, the Group endeavors to stabilize purchasing costs by concluding foreign currency forward contracts and standardizing import exchange rates. If the yen should weaken significantly against the US dollar in the future and this situation continued for an extended period, it could have a negative impact on the Group’s performance. The Group identifies concentration of risk in regard to for-eign currency forward contracts. The Group’s notional amount of foreign currency forward contracts was 1,191,953 million yen as at 31 August 2016.
2) Foreign currency sensitivity analysisBelow is an analysis of the impact an 1% increase in the yen against the Euro (“EUR”) and the United States dollar (“$”) would have on the Group’s profit for the year and other com-prehensive income on the respective reporting periods.

32
1. Derivative transactions of which hedge accounting is not applied
Average exchange ratesForeign currencies
(Millions ofrespective currency)
Contract principal(Millions of yen)
Fair value(Millions of yen)
31 August2015
31 August2016
31 August2015
31 August2016
31 August2015
31 August2016
31 August2015
31 August2016
Foreign currency forward contractsOver 1 year
Buy USD (sell EUR)0.90( /$)
0.88( /$)
8 0 ¥1,117 ¥ 97 ¥ (0) ¥ 0
Within 1 year
Buy USD (sell EUR)0.89( /$)
0.88( /$)
13 23 1,507 2,428 (38) 8
Buy USD (sell KRW)1,131.13(KRW/$)
1,198.33(KRW/$)
2 0 282 1 11 (0)
Buy USD (sell TWD)31.58
(TWD/$)31.69
(TWD/$)39 7 4,680 806 181 0
Buy USD (sell AUD)—
(AUD/$)1.35
(AUD/$)— 13 — 1,448 — (17)
Buy USD (sell SGD)1.33
(SG$/$)—
(SG$/$)22 — 2,585 — 162 —
Buy USD (sell THB)33.47
(THB/$)—
(THB/$)28 — 3,167 — 239 —
These calculations assume no changes in the value of other foreign currencies not included herein.
Year ended31 August 2015
Year ended31 August 2016
Average exchange rate (Yen)$ 117.36 115.06EUR 137.14 127.23
Impact on profit for the year (Millions of yen)
$ (1,281) (1,098)EUR (70) (50)
Impact on other comprehensive income (Millions of yen)
$ (10,865) (9,609)EUR (8) —
3) Currency derivatives and hedgesThe Group uses foreign currency forward contract transac-tions to hedge against the risk of future fluctuations in exchange rates in regard to foreign currency transactions
and applies hedge accounting to transactions that meet hedge requirements, and did not conduct any speculative trading in derivatives.
Cash flow hedgesA cash flow hedge is a hedge for avoiding risk of volatility in future cash flows. The Company uses foreign currency for-ward contracts to hedge cash flow fluctuations relating to forecast transactions. Fluctuations in the fair value of derivative transactions designated as cash flow hedges are recognized as other comprehensive income, and included in other components of equity, and are reclassified to profit or loss at the time net profit is recognized on the hedged item. The gain/(loss) on derivative transactions (after tax effects) projected to be reclassified to profit or loss within one year was 11,979 million yen (loss) as at 31 August 2016, and 94,285 million yen (gain) as at 31 August 2015.

33
2. Derivative transactions of which hedge accounting is applied
Average exchange ratesForeign currencies
(Millions ofrespective currency)
Contract principal(Millions of yen)
Fair value(Millions of yen)
31 August2015
31 August2016
31 August2015
31 August2016
31 August2015
31 August2016
31 August2015
31 August2016
Foreign currency forward contractsOver 1 year
Buy USD (sell JPY)106.01
(¥/$)109.31
(¥/$)5,659 6,133 ¥599,999 ¥670,443 ¥62,547 ¥(59,123)
Buy USD (sell EUR)0.88( /$)
0.87( /$)
2 39 299 3,917 1 0
Buy USD (sell GBP)—
(£/$)0.70(£/$)
— 20 — 1,951 — 154
Buy USD (sell KRW)—
(KRW/$)1,149.36(KRW/$)
— 302 — 32,000 — (845)
Buy USD (sell SGD)—
(SG$/$)1.37
(SG$/$)— 20 — 2,163 — (17)
Within 1 year
Buy USD (sell JPY)95.11
(¥/$)104.78
(¥/$)3,618 3,529 344,154 369,772 90,583 (8,945)
Buy USD (sell EUR)0.85( /$)
0.89( /$)
123 115 14,210 11,779 564 (22)
Buy USD (sell GBP)—
(£/$)0.70(£/$)
— 47 — 4,488 — 379
Buy USD (sell KRW)1,120.14(KRW/$)
1,169.03(KRW/$)
413 468 47,342 50,492 2,577 (2,416)
Buy USD (sell TWD)32.20
(TWD/$)32.54
(TWD/$)117 114 14,127 12,109 221 (345)
Buy USD (sell SGD)—
(SG$/$)1.38
(SG$/$)— 72 — 7,581 — (51)
Buy USD (sell THB)—
(THB/$)35.56
(THB/$)— 71 — 7,544 — (184)
Buy USD (sell MYR)3.70
(MYR/$)4.13
(MYR/$)10 46 1,091 4,885 152 (57)
Buy USD (sell AUD)1.30
(AUD/$)1.35
(AUD/$)23 36 2,617 3,798 222 (41)
Buy USD (sell RUB)—
(RUB/$)75.3
(RUB/$)— 25 — 2,998 — (319)
Buy USD (sell CAD)—
(CAD/$)1.26
(CAD/$)— 11 — 1,134 — 21
Buy USD (sell IDR)14,052.00
(IDR/$)—
(IDR/$)5 — 663 — 25 —
Buy EUR (sell JPY)139.05
(¥/ )—
(¥/ )6 — 851 — (49) —
Buy KRW (sell USD)0.001
($/KRW)0.001
($/KRW)2 1 255 107 (12) 4

34
b Past-due or impaired financial assetsBelow is an aged analysis of financial assets whose due date had not passed as at each reporting date, and financial assets that are overdue whereof no asset impairment was recognized.
(Millions of yen)
Total Within due dateOverdue amounts
Within 90 days 91 days to 1 year Over 1 year
Balances as at 31 August 2015Trade and other receivables (total) ¥45,457 ¥42,864 ¥2,152 ¥165 ¥ 275 Allowance for doubtful accounts (679) (452) (2) (43) (180)Trade and other receivables (net) 44,777 42,411 2,150 121 95 Other financial assets (total) 98,800 98,681 10 77 30 Allowance for doubtful accounts (265) (265) — — —Other financial assets (net) 98,534 98,415 10 77 30 Balances as at 31 August 2016Trade and other receivables (total) ¥ 45,846 ¥ 43,595 ¥1,844 ¥121 ¥ 284 Allowance for doubtful accounts (667) (431) (6) (53) (176)Trade and other receivables (net) 45,178 43,164 1,838 68 107 Other financial assets (total) 262,010 261,955 — 5 49 Allowance for doubtful accounts (218) (214) — (3) —Other financial assets (net) 261,792 261,740 — 2 49
The Group does not hold any collateral or other credit enhancements on the above financial assets. When the Group recognizes impairment of a financial asset, it does not subtract the value of the impairment directly from the carrying amount. Rather, this is recorded as an allowance for doubtful accounts.
b Interest rate risk managementThe Group’s interest-bearing borrowings are mainly bonds with fixed interest rates, and the Group maintains positions in cash and cash equivalents that exceed the outstanding bal-ance of its interest-bearing borrowings. At present, the impact of interest payments on the Group is quite small. Consequently, the Group’s current level of interest rate risk is minor, and the Group has not performed any interest rate sensitivity analysis.
c Price risk management in equity instrumentsThe Group is exposed to the risk of price volatility in equity financial instruments. The Group holds no equity financial instruments for short-term trading purposes. The Group makes regular periodic checks of the market value of the equity financial instruments it holds, as well as the financial health of the issuers.
(6) Credit risk managementWhen the Group initiates ongoing transactions where
receivables will be generated on an ongoing basis, the finance department manages the Group’s risk exposure by setting credit limits and credit periods, as needed. Trade receivables encompass many customers spanning a wide range of industries and geographic regions. The Group conducts regular credit checks of the companies it does business with, and when necessary takes appropriate protective measures, such as requiring collateral. The Group does not have excessively concentrated credit risk exposure to any single company or corporate group. As for deposits and guarantees, the Group mitigates risk by conducting regular monitoring of the companies with which it does business for early detection of any worsening of their financial health.
a Financial assets and other credit risk exposureThe carrying amounts after adjustment for impairment shown in the consolidated financial statements represent the Group’s maximum exposure to credit risk before consider-ation of collateral assets.

35
The main factors increasing/decreasing the Group’s allowances for doubtful accounts were as follows:(Millions of yen)
Allowance fordoubtful accounts
(current)
Allowance fordoubtful accounts
(non-current)Total
Balances as at 1 September 2014 ¥ 511 ¥ 76 ¥ 588 Provision for the year 436 276 712 Decrease (intended purposes) (26) (24) (51)Others (241) (63) (304)Balances as at 31 August 2015 679 265 945 Provision for the year 150 49 199 Decrease (intended purposes) (6) (32) (38)Others (155) (64) (219)Balances as at 31 August 2016 667 218 885
Where recoverability is uncertain, the Group conducts ongoing monitoring of the credit status of companies with which it does business, including receivables whose maturity date has been changed. Based on the credit facts uncovered by this monitoring, the Group assesses the recoverability of trade receivables, etc., and makes provisions accordingly, in the form of allowances for doubtful accounts. In addition, because the Group does business on a world-wide scale and its credit risk is distributed, it is not overly reliant on any specific counterparty and faces minimal exposure to the impact of chain-reaction credit risk due to the worsening of the credit conditions of any given counterparty. Consequently, there is no need to record additional allowances for doubtful accounts based on credit risk concentration.
(7) Liquidity risk managementThe Group manages liquidity risk by formulating and revising its funding plans on a timely basis and maintains an appropriate level of liquidity on hand. The ultimate responsibility for management of liquidity risk lies with the CFO appointed by the Board of Directors. The finance department, under the direction of the CFO, performs the day-to-day aspects of liquidity risk management by main-taining appropriate levels of surplus funds and bank loans, and by monitoring budgets and cash flows.

36
(Millions of yen)
Carryingamount
Contractualcash flows
Less than1 year
1 to 2years
More than2 years
but within3 years
More than3 years
but within4 years
More than4 years
but within5 years
Over5 years
As at 31 August 2015Non-derivative financial liabilities
Trade and other payables ¥181,577 ¥181,577 ¥181,577 ¥ — ¥ — ¥ — ¥ — ¥—
Long-term borrowings (excluding current portion)
15,884 15,884 — 2,536 3,654 4,847 4,847 —
Current portion of long-term borrowings 5,236 5,236 5,236 — — — — —Short-term borrowings 4,652 4,652 4,652 — — — — —Corporate bonds — — — — — — — —Long-term finance lease obligations 8,073 8,073 — 3,495 2,720 1,488 368 —Short-term finance lease obligations 4,188 4,188 4,188 — — — — —
Derivative financial liabilitiesForeign currency forward contracts 100 —Total 219,713 219,613 195,654 6,031 6,375 6,335 5,215 —
As at 31 August 2016Non-derivative financial liabilities
Trade and other payables ¥189,501 ¥189,501 ¥189,501 ¥ — ¥ — ¥ — ¥ — ¥ —
Long-term borrowings (excluding current portion)
11,955 11,955 — 3,112 4,323 4,323 196 —
Current portion of long-term borrowings 2,164 2,164 2,164 — — — — —Short-term borrowings 3,788 3,788 3,788 — — — — —Corporate bonds 249,486 249,486 — — 29,959 — 99,828 119,698 Long-term finance lease obligations 11,247 11,247 — 4,032 2,904 1,797 945 1,567 Short-term finance lease obligations 4,821 4,821 4,821 — — — — —
Derivative financial liabilitiesForeign currency forward contracts 72,388 —Total 545,355 472,967 200,276 7,144 37,187 6,121 100,970 121,266
Note: Guaranteed obligations are not included in the above, as the probability of having to act on those guarantees is remote.
(8) Fair value of financial instruments(Millions of yen)
As at 31 August 2015 As at 31 August 2016Carrying amounts Fair value Carrying amounts Fair value
Short-term borrowings ¥ 4,652 ¥ 4,652 ¥ 3,788 ¥ 3,788Long-term borrowings (Note 1) 21,121 21,270 14,120 14,298Corporate bonds (Note 2) — — 249,486 253,850Lease obligations (Note 1) 12,262 12,197 16,069 16,001Total 38,035 38,120 283,465 287,939
Notes: 1. The above includes the outstanding balance of borrowings due within 1 year. 2. Corporate bonds issued during the year ended 31 August, 2016 are as follows.
(Millions of yen)
Company name Name of bonds Date of issuanceAmount issued
InterestRate (%)
Date of maturity
FAST RETAILING CO., LTD. 1st non-collateralized corporate bonds 18 December 2015 ¥ 30,000 0.110 18 December 2018FAST RETAILING CO., LTD. 2nd non-collateralized corporate bonds 18 December 2015 100,000 0.291 18 December 2020FAST RETAILING CO., LTD. 3rd non-collateralized corporate bonds 18 December 2015 50,000 0.491 16 December 2022FAST RETAILING CO., LTD. 4th non-collateralized corporate bonds 18 December 2015 70,000 0.749 18 December 2025
The fair value of short-term financial assets, short-term financial liabilities, long-term financial assets and long-term financial lia-bilities, which are measured by amortized cost, approximate their carrying amounts. The fair value of corporate bonds is measured at the market price. The fair value of long-term borrowings and lease obligations are classified by term, and are calculated on the basis of the current value applying a discount rate that takes into account time remaining to maturity and credit risk.

37
(9) Fair value hierarchy of financial instrumentsAll assets and liabilities for which fair value is measured or disclosed in the financial statements are categorized within the fair value hierarchy described as follows, based on the lowest level input that is significant to the fair value measurement as a whole:Level 1 — based on quoted prices (unadjusted) in active markets for identical assets or liabilitiesLevel 2 — based on valuation techniques for which the lowest level input that is significant to the fair value measurement is
observable, either directly or indirectlyLevel 3 — based on valuation techniques for which the lowest level input that is significant to the fair value measurement is
unobservable
a The following tables illustrate the fair value measurement hierarchy of the Group’s financial instruments:(Millions of yen)
As at 31 August 2015 Level 1 Level 2 Level 3 Total
Available-for-sale financial assets ¥363 ¥ — ¥210 ¥ 574Financial assets/(liabilities) at FVTPL — 556 — 556
Foreign currency forward contracts designated as hedging instruments
— 156,834 — 156,834
Net amount 363 157,390 210 157,964
As at 31 August 2016 Level 1 Level 2 Level 3 Total
Available-for-sale financial assets ¥1,424 ¥ — ¥212 ¥ 1,636 Financial assets/(liabilities) at FVTPL — (8) — (8)
Foreign currency forward contracts designated as hedging instruments
— (71,810) — (71,810)
Net amount 1,424 (71,818) 212 (70,182)
For the valuation of level 2 derivative financial instruments for which a market value is available, we use a valuation model that uses observable data on the measurement date as indicators such as interest rates, yield curves, currency rates and volatility in comparable instruments. Non-listed shares are included in level 3. There is no significant increase or decrease in level 3 items through purchase, disposal or settlement. Also, there is no transfer from level 3 to level 2.
b The financial instruments measured at amortized costThe fair value measurements for corporate bonds, long-term borrowings and lease obligations are classified as level 2.
31 Related Party Disclosures
Remuneration of key management personnel
Remuneration of the Group’s key management personnel is as below:(Millions of yen)
Year ended31 August 2015
Year ended31 August 2016
Short-term employee benefits ¥364 ¥364Total 364 364
Transactions with officers and major shareholders (individuals only), etc. of the reporting entity submitting these consolidated financial statements.

38
Year ended 31 August 2015 (from 1 September 2014 to 31 August 2015)
CategoryName of
Company orIndividual
LocationCapital
Stock orinvestment
Businessdetails orprofession
Percentageof shares
with votingrights (%)
Relationshipwith related
parties
Details oftransaction
Amount oftransaction(Millions of
yen)
Account
Balance at31 August
2015(Millions of yen)
OfficerToru
Murayama— —
Non-executiveDirector
Direct0.00
Outsourcing
Consulting and advisory agreements
about training of management
personnel
18Trade
and otherpayables
1
Notes: 1. Transactions subject to consumption taxes are recorded at amounts exclusive of consumption taxes. 2. Terms of transactions and policy for the terms Transaction amounts were determined based on the negotiation with the related party considering market prices.
Year ended 31 August 2016 (from 1 September 2015 to 31 August 2016)
CategoryName of
Company orIndividual
LocationCapital
Stock orinvestment
Businessdetails orprofession
Percentageof shares
with votingrights (%)
Relationshipwith related
parties
Details oftransaction
Amount oftransaction(Millions of
yen)
Account
Balance at31 August
2016(Millions of yen)
OfficerToru
Murayama— —
Non-executiveDirector
Direct0.00
Outsourcing
Consultingand advisoryagreements
about trainingof management
personnel
18Trade
and otherpayables
1
Notes: 1. Transactions subject to consumption taxes are recorded at amounts exclusive of consumption taxes. 2. Terms of transactions and policy for the terms Transaction amounts were determined based on the negotiation with the related party considering market prices.
32 Major Subsidiaries
The Group’s major subsidiaries are as listed in “Corporate Profile 3. Subsidiaries and Associates”.
33 Commitments
The Group had the following commitments at each reporting date:
(Millions of yen)
As at31 August 2015
As at31 August 2016
Commitment for the acquisition of property, plant and equipment
¥8,825 ¥ 9,889
Commitment for acquisition of intangible assets
85 399
Total 8,910 10,288
34 Contingent Liabilities
Year ended 31 August 2015Not applicable
Year ended 31 August 2016Not applicable

39
35 Subsequent Events
Year ended 31 August 2015(1) The Issue of Share-based Compensation Stock Options (Share Subscription Rights)Based on Articles 236, 238 and 240 of the Companies Act and on the decision taken by the Board of Directors at its meeting held on 8 October 2015, the Company decided to issue share subscription rights as share-based compensation stock options for the purpose of rewarding employees of the Company and its subsidiaries for their contribution to the Group’s profit. By link-ing the Company’s stock price more closely to the benefits received by highly productive personnel, the share subscription rights program is designed both to boost staff morale and their motivation to improve group performance and to boost share-holder value by strengthening business development with a focus on shareholder return. Please see “Stock Information and Dividend Policy 1. Stock Information (9) Stock Options Program” for details.
(2) Issuance of Non-collateralized Corporate BondsAt the Board of Directors meeting on 25 November 2015, a comprehensive decision was made to issue non-collateralized cor-porate bonds, as detailed below.
(1) Amount to be issued Up to 250 billion yen (may be issued in multiple tranches, up to a total of this amount)(2) Time frame 26 November 2015 to 5 November 2017(3) Amount of payment 100 yen per 100 yen face value(4) Interest rate No more than 0.6 percentage point above the market yield of JGBs of comparable maturity(5) Term Three years or more, up to 10 years(6) Redemption Lump sum payment at maturity(7) Use of funds Capital investment, operating funds, investments and/or repayment of other borrowings
(8) Determination of terms of issuance Decisions regarding amount to be issued, maturity, interest rate, payment date and other terms of issuance shall be made solely by the chairman, president and representative director, within parameters determined by the Board of Directors.
Year ended 31 August 2016(1) The Issue of Share-based Compensation Stock Options (Share Subscription Rights)Based on Articles 236, 238 and 240 of the Companies Act and on the decision taken by the Board of Directors at its meeting held on 13 October 2016, the Company decided to issue share subscription rights as share-based compensation stock options for the purpose of rewarding employees of the Company and its subsidiaries for their contribution to the Group’s profit. By link-ing the Company’s stock price more closely to the benefits received by highly productive personnel, the share subscription rights program is designed both to boost staff morale and their motivation to improve group performance and to boost share-holder value by strengthening business development with a focus on shareholder return. Please see “Stock Information and Dividend Policy 1. Stock Information (9) Stock Options Program” for details.
(2) OthersQuarterly information for the year ended 31 August 2016
(Cumulative) First quarter Second quarter Third quarter Fiscal year
Revenue (Millions of yen) ¥520,303 ¥1,011,653 ¥1,434,616 ¥1,786,473
Quarterly income before income taxes and non-controlling interests (Millions of yen)
77,666 82,041 122,095 90,237
Quarterly net income (Millions of yen) 48,024 47,043 71,010 48,052Earnings per share (Yen) 471.07 461.43 696.50 471.31
(Accounting period) First quarter Second quarter Third quarter Fourth quarter
Quarterly earnings/(losses) per share (Yen) ¥471.07 ¥(9.63) ¥235.07 ¥(225.16)

40
INDEPENDENT AUDITOR’S REPORT


Midtown Tower, 9-7-1 Akasaka, Minato-ku, Tokyo 107-6231, JapanTelephone: +81-3-6862-9983 Facsimile: +81-3-6865-0076
www. fa s t re t a i l i n g . c om FAST RETAILING CO., LTD.


