35
© 2013 EDB All rights reserved. 1 Faster PostgreSQL: Improved Writes and Reads • Amit Kapila | 2016.05.20

© 2013 EDB All rights reserved. 1
Faster PostgreSQL: Improved Writes and Reads
• Amit Kapila | 2016.05.20

2
● Read Scalability
● Write Scalability
● Future Work on Write Scalability
● Other Performance Work In 9.6
● Performance tour from 9.1 to 9.5
Contents
3
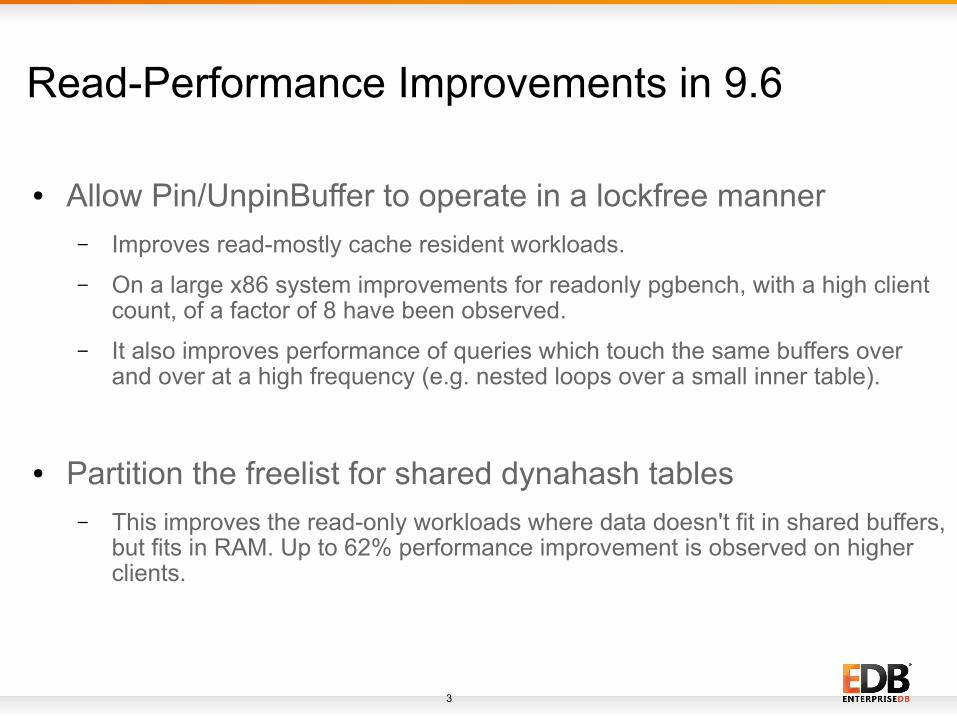
Read-Performance Improvements in 9.6
● Allow Pin/UnpinBuffer to operate in a lockfree manner– Improves read-mostly cache resident workloads.
– On a large x86 system improvements for readonly pgbench, with a high client count, of a factor of 8 have been observed.
– It also improves performance of queries which touch the same buffers over and over at a high frequency (e.g. nested loops over a small inner table).
● Partition the freelist for shared dynahash tables– This improves the read-only workloads where data doesn't fit in shared buffers,
but fits in RAM. Up to 62% performance improvement is observed on higher clients.
4
Read Scalability
1 8 16 24 32 40 48 56 64 72 80 88 96 104 112 120 1280
50000100000150000200000250000300000350000400000450000500000
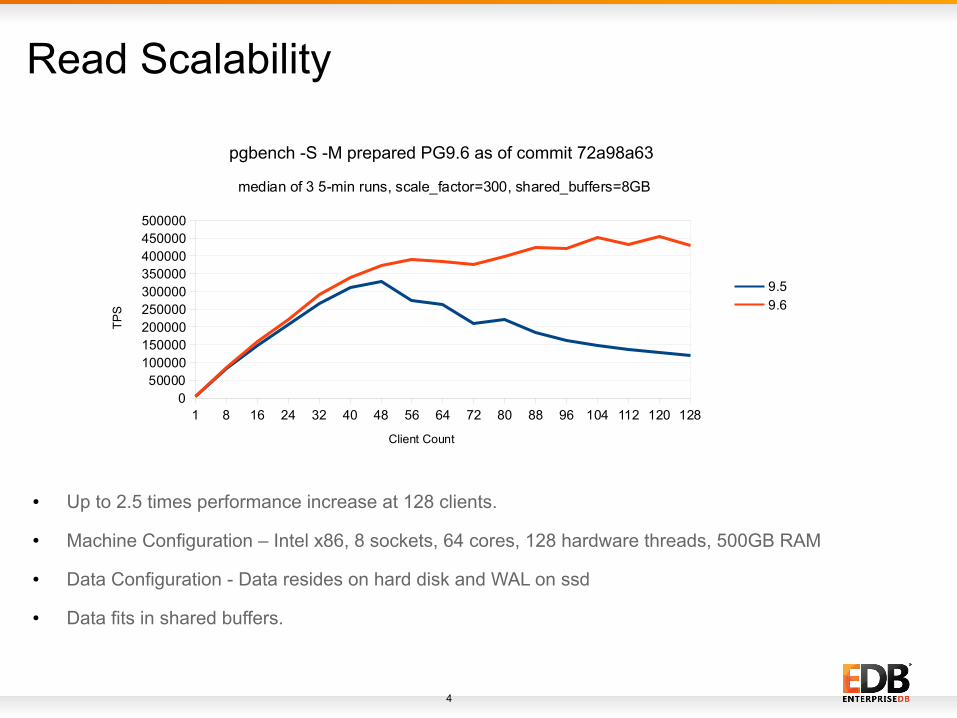
pgbench -S -M prepared PG9.6 as of commit 72a98a63
median of 3 5-min runs, scale_factor=300, shared_buffers=8GB
9.5
9.6
Client Count
TP
S
● Up to 2.5 times performance increase at 128 clients.
● Machine Configuration – Intel x86, 8 sockets, 64 cores, 128 hardware threads, 500GB RAM
● Data Configuration - Data resides on hard disk and WAL on ssd
● Data fits in shared buffers.
5
Read Scalability
1 8 16 24 32 40 48 56 64 72 80 88 96 104 112 120 1280
50000
100000
150000
200000
250000
300000
350000
400000
450000
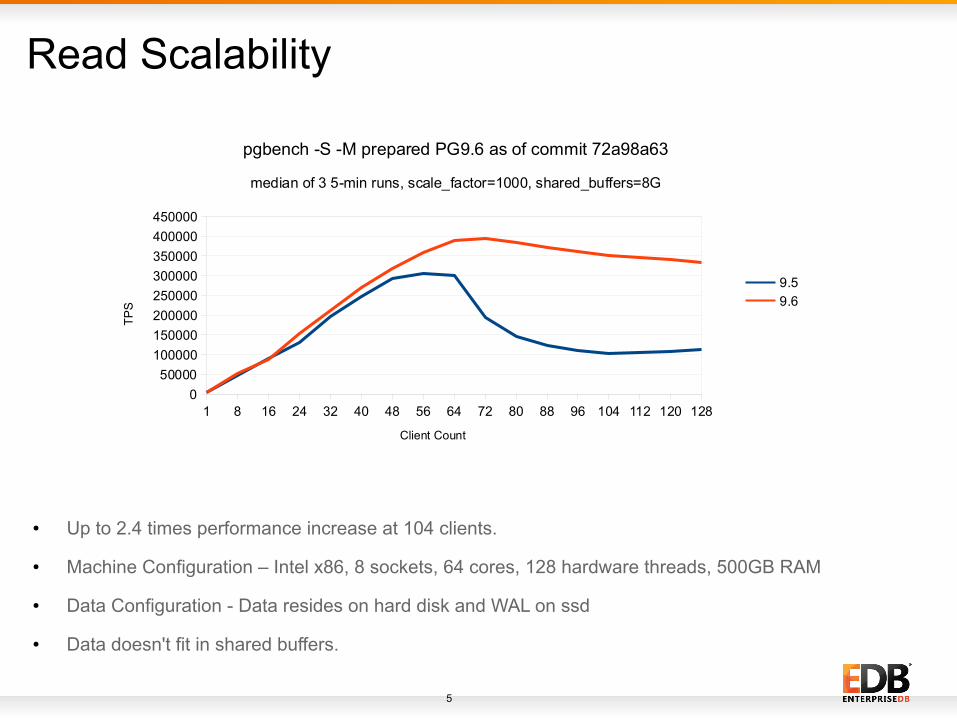
pgbench -S -M prepared PG9.6 as of commit 72a98a63
median of 3 5-min runs, scale_factor=1000, shared_buffers=8G
9.5
9.6
Client Count
TP
S
● Up to 2.4 times performance increase at 104 clients.
● Machine Configuration – Intel x86, 8 sockets, 64 cores, 128 hardware threads, 500GB RAM
● Data Configuration - Data resides on hard disk and WAL on ssd
● Data doesn't fit in shared buffers.
6
● Read Scalability
● Write Scalability
● Future Work on Write Scalability
● Other Performance Work In 9.6
● Performance tour from 9.1 to 9.5
Contents

7
Reduce ProcArrayLock Contention
● This lock is required in Shared mode for taking snapshot and in Exclusive mode at transaction commit time.
● When many processes try to commit at once, each one of them needs to take it one-by-one which results in contention.
● The technique used to reduce this contention is to group the operation (clear the transaction id) that needs to be performed under lock.
8
Reduce ProcArrayLock Contention
● This lock is required in Shared mode for taking snapshot and in Exclusive mode at transaction commit time.
● When many processes try to commit at once, each one of them needs to take it one-by-one which results in contention.
● The technique used to reduce this contention is to group the operation (clear the transaction id) that needs to be performed under lock.
9
Reduce ProcArrayLock Contention
● To group clear the transaction id, each process trying to do so will add itself to the list.
● First process added to the list will acquire ProcArrayLock and clear the transaction id's for all the processes that are added to the list.
● On power-8 machine, I have observed 30% performance improvement at 64 clients and 133% at 256 clients for pgbench read-write tests. For details refer my blog: Improved Writes in PostgreSQL For 9.6
10
Reduce CLogControlLock Contention
● This lock is required in Shared mode to read transaction status and in Exclusive mode to write transaction status.
● On larger multi-processor systems, it is possible to have many CLOG page requests in flight at one time which could lead to disk access for CLOG page if the required page is not found in memory.
● Increasing Clog buffers from 32 to 128 buffers leads to good performance improvement.
● On power-8 machine, ~90% performance improvement has been observed with unlogged tables for pgbench read-write tests at 128 clients.
11
Reduce I/O stalls due to checkpoint
● Currently all writes to data files are done via OS page cache which can sometimes lead to accumulation of many dirty buffers.
● During checkpoint, we perform fsync after writing all the buffers to OS page cache which can lead to massive slow down in other operations happening concurrently.
● In 9.6, writes made via checkpointer, bgwriter and normal user backends can be flushed after a configurable number of writes to OS page cache.
● Each of these sources of writes controlled by a separate GUC, checkpointer_flush_after, bgwriter_flush_after and backend_flush_after respectively.
12
Performance of read-write
1 8 16 32 64 96 1280
5000
10000
15000
20000
25000
30000
35000
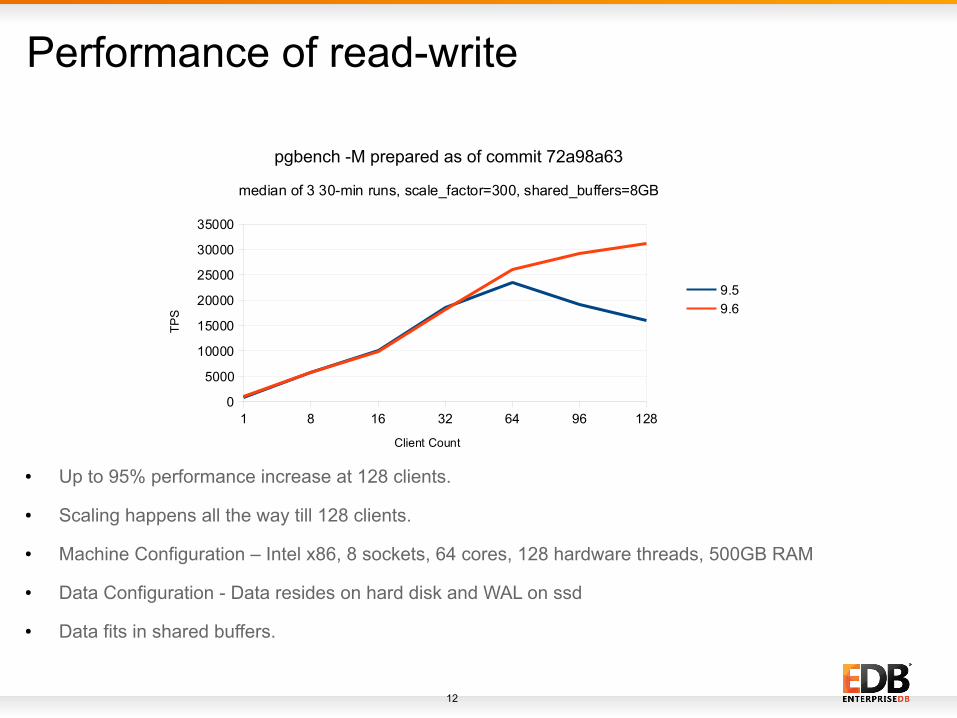
pgbench -M prepared as of commit 72a98a63
median of 3 30-min runs, scale_factor=300, shared_buffers=8GB
9.5
9.6
Client Count
TP
S
● Up to 95% performance increase at 128 clients.
● Scaling happens all the way till 128 clients.
● Machine Configuration – Intel x86, 8 sockets, 64 cores, 128 hardware threads, 500GB RAM
● Data Configuration - Data resides on hard disk and WAL on ssd
● Data fits in shared buffers.
13
Bulk Load Scalability
● Bulk loading either via COPY or INSERT tanks when multiple processes tries to bulk load.
● Currently each relation extension request is processed serially due to which it tanks at high load.
● Experimentation has revealed that extending the relation multiple blocks at-a-time improves scalability.
● Number of blocks to extend at a time is decided based on the load in system with upper limit as 512 blocks.
14
Performance of Bulk Load
1 2 4 8 16 32 640
100
200
300
400
500
600
700
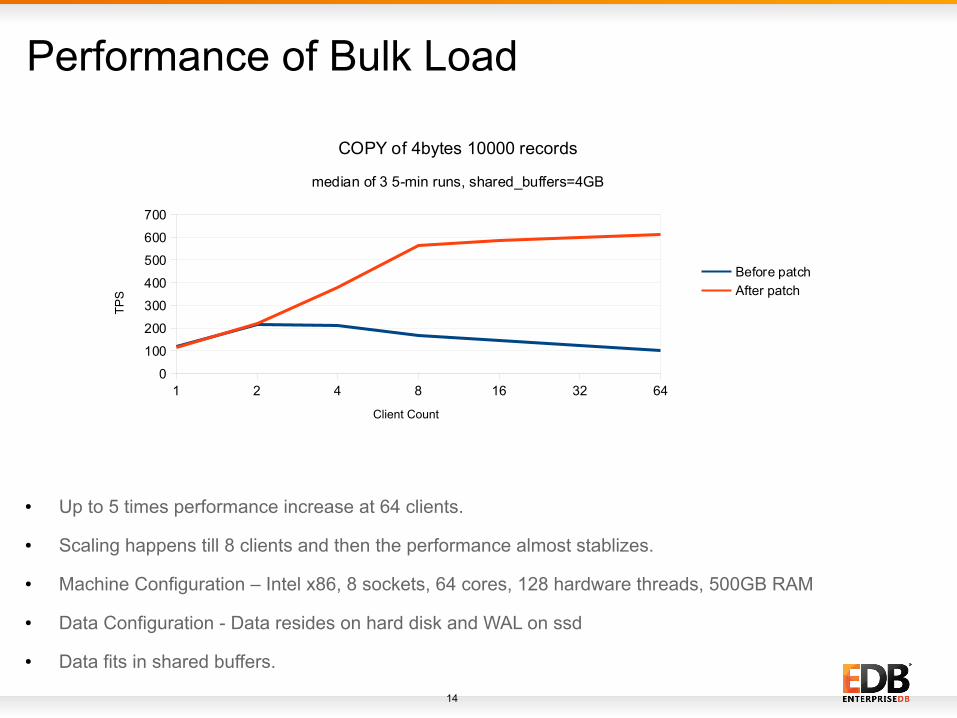
COPY of 4bytes 10000 records
median of 3 5-min runs, shared_buffers=4GB
Before patch
After patch
Client Count
TP
S
● Up to 5 times performance increase at 64 clients.
● Scaling happens till 8 clients and then the performance almost stablizes.
● Machine Configuration – Intel x86, 8 sockets, 64 cores, 128 hardware threads, 500GB RAM
● Data Configuration - Data resides on hard disk and WAL on ssd
● Data fits in shared buffers.
15
Performance of Bulk Load
1 2 4 8 16 32 640
20406080
100120140160
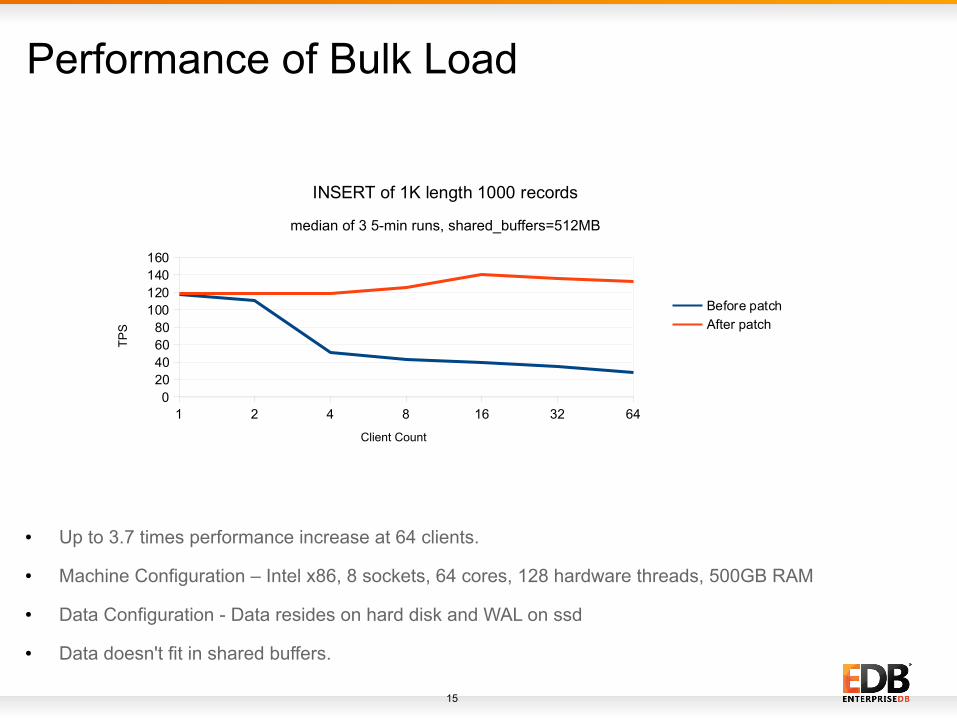
INSERT of 1K length 1000 records
median of 3 5-min runs, shared_buffers=512MB
Before patch
After patch
Client Count
TP
S
● Up to 3.7 times performance increase at 64 clients.
● Machine Configuration – Intel x86, 8 sockets, 64 cores, 128 hardware threads, 500GB RAM
● Data Configuration - Data resides on hard disk and WAL on ssd
● Data doesn't fit in shared buffers.
16
● Read Scalability
● Write Scalability
● Future Work on Write Scalability
● Other Performance Work In 9.6
● Performance tour from 9.1 to 9.5
Contents
17
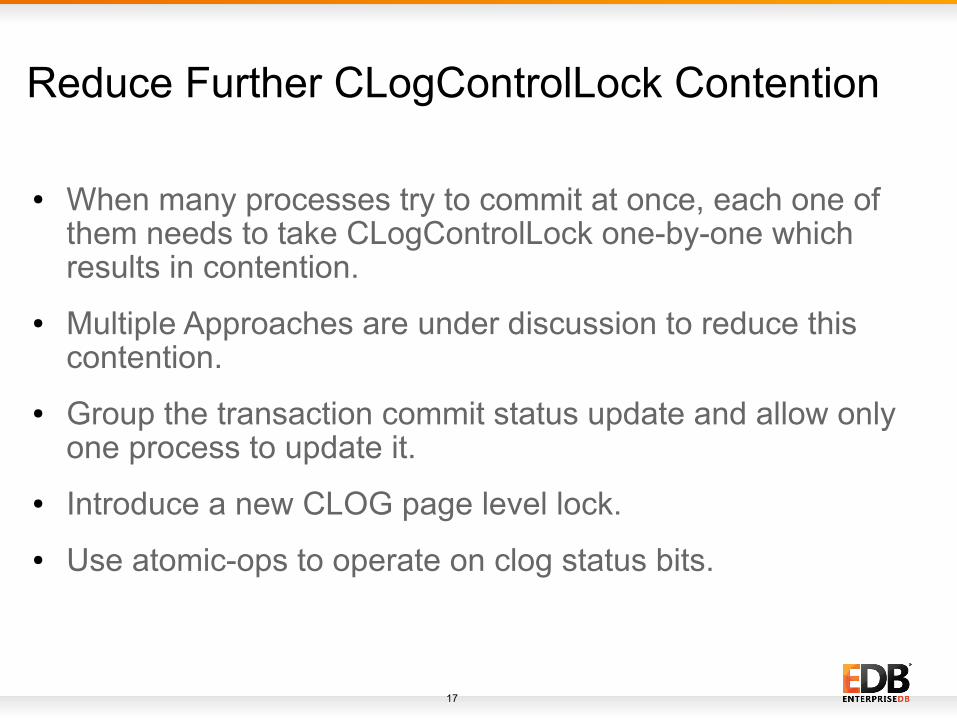
Reduce Further CLogControlLock Contention
● When many processes try to commit at once, each one of them needs to take CLogControlLock one-by-one which results in contention.
● Multiple Approaches are under discussion to reduce this contention.
● Group the transaction commit status update and allow only one process to update it.
● Introduce a new CLOG page level lock.
● Use atomic-ops to operate on clog status bits.
18
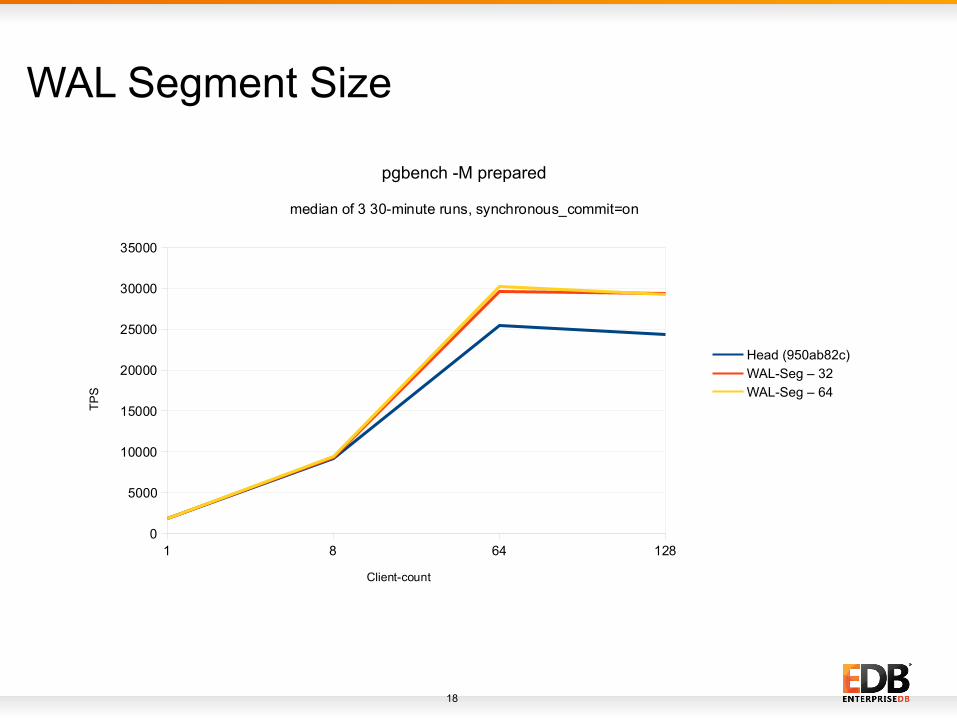
WAL Segment Size
1 8 64 1280
5000
10000
15000
20000
25000
30000
35000
pgbench -M prepared
median of 3 30-minute runs, synchronous_commit=on
Head (950ab82c)
WAL-Seg – 32
WAL-Seg – 64
Client-count
TP
S
19
WAL Segment Size● There is a ~20% increase in TPS with wal-size = 32MB and
performance starts increasing after 8 clients.
● As per my analysis, the reason for increase is that it has to perform lesser flushes for completed segments.
● One idea is that users who can see such a benefit can build the code with wal-size=32MB or PostgreSQL can use this as a default value.
● There are few disadvantages of increasing wal segment size like users require re-initdb, checkpoint issues segment switch which can lead to space wastage, increase in recovery time in some cases.
● Ideally, we should find a way where we can leverage the advantage of this idea without having any disadvantages.
20
WAL Re-Writes● PostgreSQL always write WAL in 8KB blocks, which could
lead to a lot of re-write of data for small-transactions.– Consider the case where the amount to be written is usually < 4KB, writing in
8KB chunks could lead double the amount of writes
● Options tried to reduce the re-writes– Write WAL in chunk size of 4K which is usually the OS page size. This leads
to 35% reduction in WAL writes and the TPS increase for pgbench read-write workload is 1~5%.
– Write WAL in Exact size as requested by transaction. This leads to reduction of re-writes by half, but introduce new reads because of unaligned writes which lead to decrease in performance.
● Whereas we can reduce WAL Re-writes, but till now I am not able to find a scenario where it can show significant win in terms of TPS. Inputs are welcome.
21
WALWriteLock Contention
● Hacked the code to comment out WAL flush calls to see the overhead of WAL flushing. The TPS for read-write pgbench tests at 64 clients increased from 27871 to 41835.
● From above experiments, it is clear that flush is the main cost in WAL writing which is no surprise, but still the above data shows the exact overhead of flush.
● One idea to reduce WALWriteLock contention is to use a separate WALFlushLock for the flush call. Any other ideas are welcome.
22
● Read Scalability
● Write Scalability
● Future Work on Write Scalability
● Other Performance Work In 9.6
● Performance tour from 9.1 to 9.5
Contents
23
Performance features in 9.6
● Don't vacuum all-frozen pages– This should greatly reduce the cost of anti-wraparound vacuuming on large
clusters where the majority of data is never touched between one cycle and the next, because we'll no longer have to read all of those pages only to find out that we don't need to do anything with them.
● Add the "snapshot too old" feature– This feature allows the user to control the bloat by vacuuming the data
retained due to old transactions and error out such old transactions if or when they try to access the data removed by vacuum. This feature is controlled by a new old_snapshot_threshold GUC.
24
Performance features in 9.6
● Use quicksort, not replacement selection, for external sorting– This makes sorting faster except perhaps for very small amounts of working
memory.
● Support using index-only scans with partial indexes in more cases– Use index-only scans for cases where restriction clause that is not part of
index-key is implied by the index-predicate.
25
Performance features in 9.6
● Use Foreign Key relationships to infer multi-column join selectivity– When FKs are present and we have multi-column join information, plan
estimates will be drastically improved which would result in better plan and substantial performance improvements for joins in many common cases.
● Speedup 2 Phase Commit by skipping two phase state files in normal path– Measured performance gains of 50-100% for short 2PC transactions by
completely avoiding writing files and fsyncing.
26
Performance features in 9.6
● Combining aggregates to avoid duplicating effort– Queries like "SELECT AVG(x), SUM(x) FROM x" will see a big speedup.
● Avoid pin scan for replay of XLOG_BTREE_VACUUM– Previously, the replay of XLOG_BTREE_VACUUM (Deletion of item(s) from a
btree page during VACUUM) used to cause replication delays of seconds or in some cases minutes. This was a significant problem with large indexes.
27
● Read Scalability
● Write Scalability
● Future Work on Write Scalability
● Other Performance Work In 9.6
● Performance tour from 9.1 to 9.5
Contents
28
Test Configuration
● Machine Configuration – Intel x86, 8 sockets, 64 cores, 128 hardware threads, 500GB RAM
● Data Configuration - Data resides on hard disk and WAL on ssd
● Non-default postgresql.conf settings:
– max_connections = 200shared_buffers=8GBcheckpoint_timeout =15minmaintenance_work_mem = 1GBcheckpoint_completion_target = 0.9
– For version 9.5 min_wal_size=15GB and max_wal_size=20GB and for versions < 9.5 checkpoint_segments=300
29
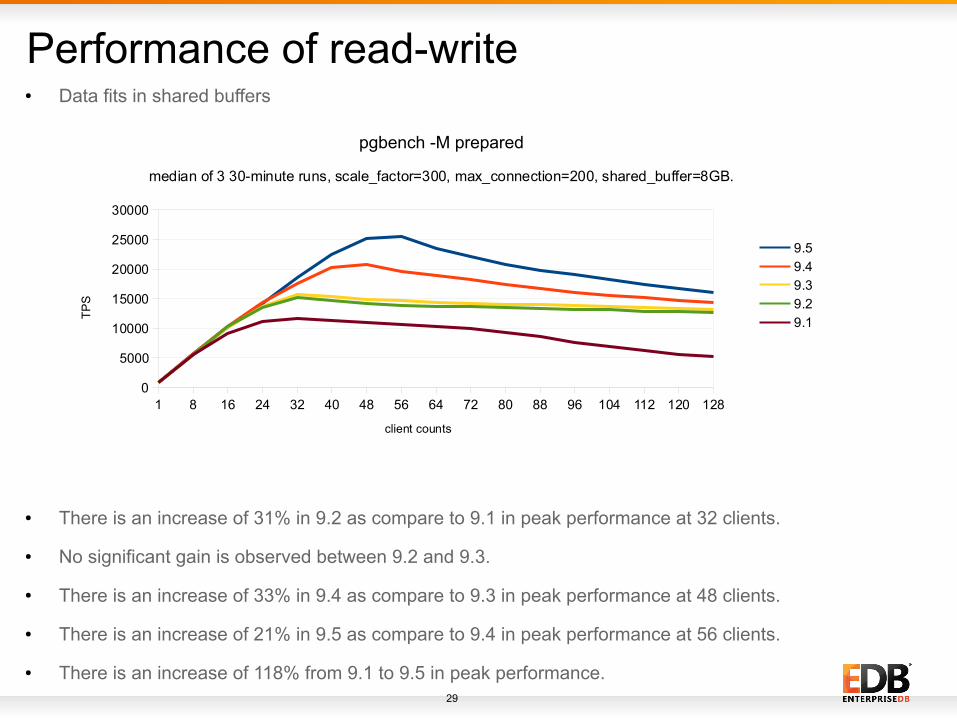
Performance of read-write
● There is an increase of 31% in 9.2 as compare to 9.1 in peak performance at 32 clients.
● No significant gain is observed between 9.2 and 9.3.
● There is an increase of 33% in 9.4 as compare to 9.3 in peak performance at 48 clients.
● There is an increase of 21% in 9.5 as compare to 9.4 in peak performance at 56 clients.
● There is an increase of 118% from 9.1 to 9.5 in peak performance.
1 8 16 24 32 40 48 56 64 72 80 88 96 104 112 120 1280
5000
10000
15000
20000
25000
30000
pgbench -M prepared
median of 3 30-minute runs, scale_factor=300, max_connection=200, shared_buffer=8GB.
9.5
9.4
9.3
9.2
9.1
client counts
TP
S● Data fits in shared buffers
30
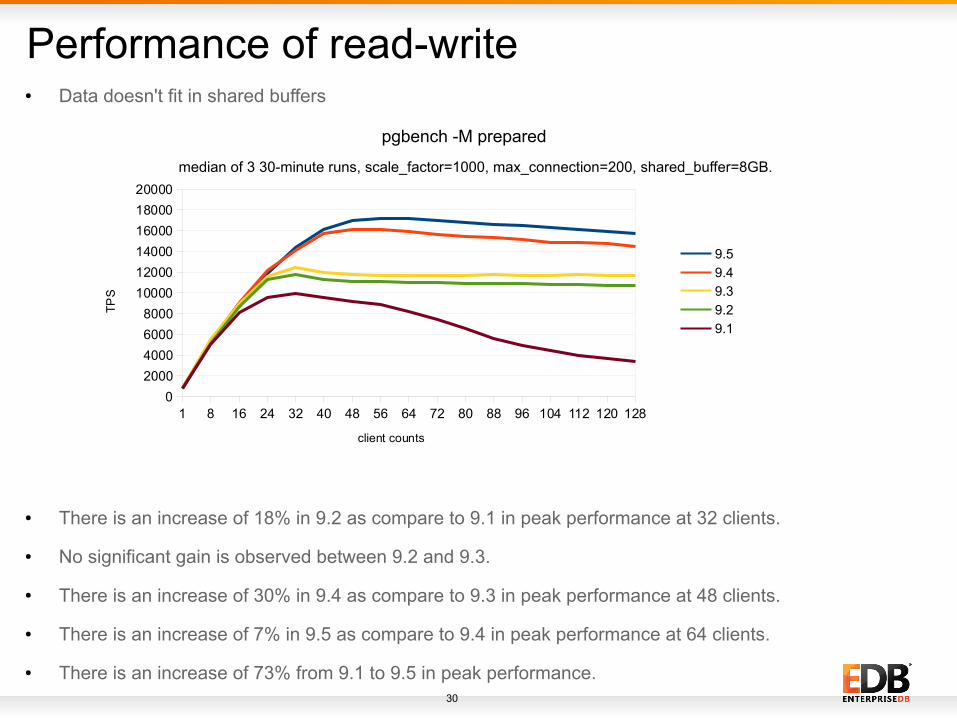
Performance of read-write
● There is an increase of 18% in 9.2 as compare to 9.1 in peak performance at 32 clients.
● No significant gain is observed between 9.2 and 9.3.
● There is an increase of 30% in 9.4 as compare to 9.3 in peak performance at 48 clients.
● There is an increase of 7% in 9.5 as compare to 9.4 in peak performance at 64 clients.
● There is an increase of 73% from 9.1 to 9.5 in peak performance.
1 8 16 24 32 40 48 56 64 72 80 88 96 104 112 120 1280
2000
4000
6000
8000
10000
12000
14000
16000
18000
20000
pgbench -M prepared
median of 3 30-minute runs, scale_factor=1000, max_connection=200, shared_buffer=8GB.
9.5
9.4
9.3
9.2
9.1
client counts
TP
S● Data doesn't fit in shared buffers
31
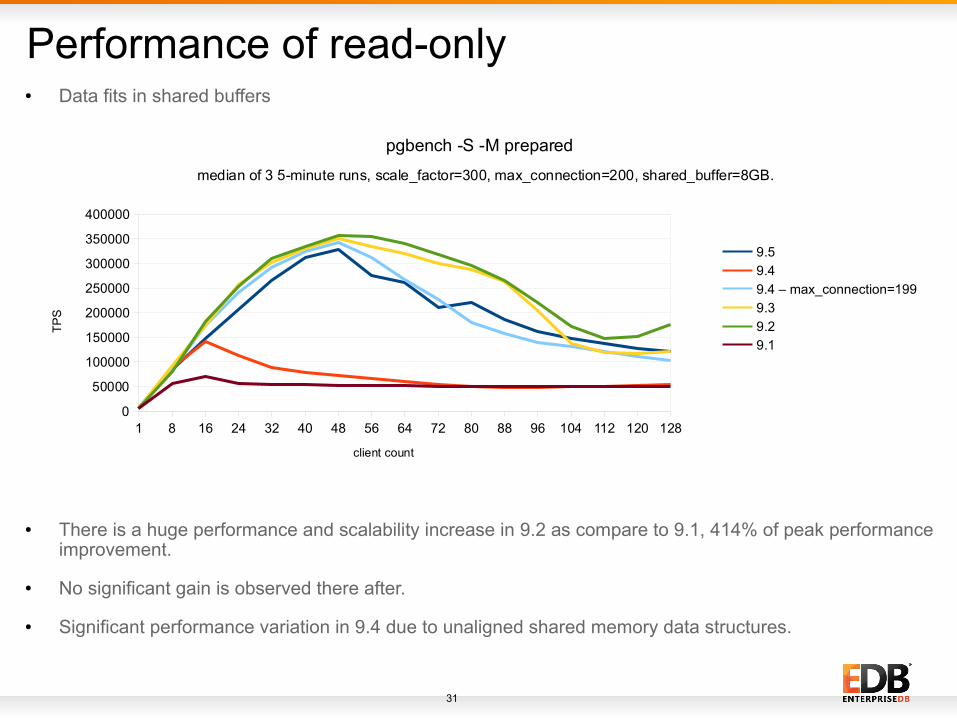
Performance of read-only
● There is a huge performance and scalability increase in 9.2 as compare to 9.1, 414% of peak performance improvement.
● No significant gain is observed there after.
● Significant performance variation in 9.4 due to unaligned shared memory data structures.
1 8 16 24 32 40 48 56 64 72 80 88 96 104 112 120 1280
50000
100000
150000
200000
250000
300000
350000
400000
pgbench -S -M prepared
median of 3 5-minute runs, scale_factor=300, max_connection=200, shared_buffer=8GB.
9.5
9.4
9.4 – max_connection=199
9.3
9.2
9.1
client count
TP
S
1 8 16 24 32 40 48 56 64 72 80 88 96 104 112 120 1280
50000
100000
150000
200000
250000
300000
350000
400000
pgbench -S -M prepared
median of 3 5-minute runs, scale_factor=300, max_connection=200, shared_buffer=8GB.
9.5
9.4
9.4 – max_connection=199
9.3
9.2
9.1
client count
TP
S
● Data fits in shared buffers
32
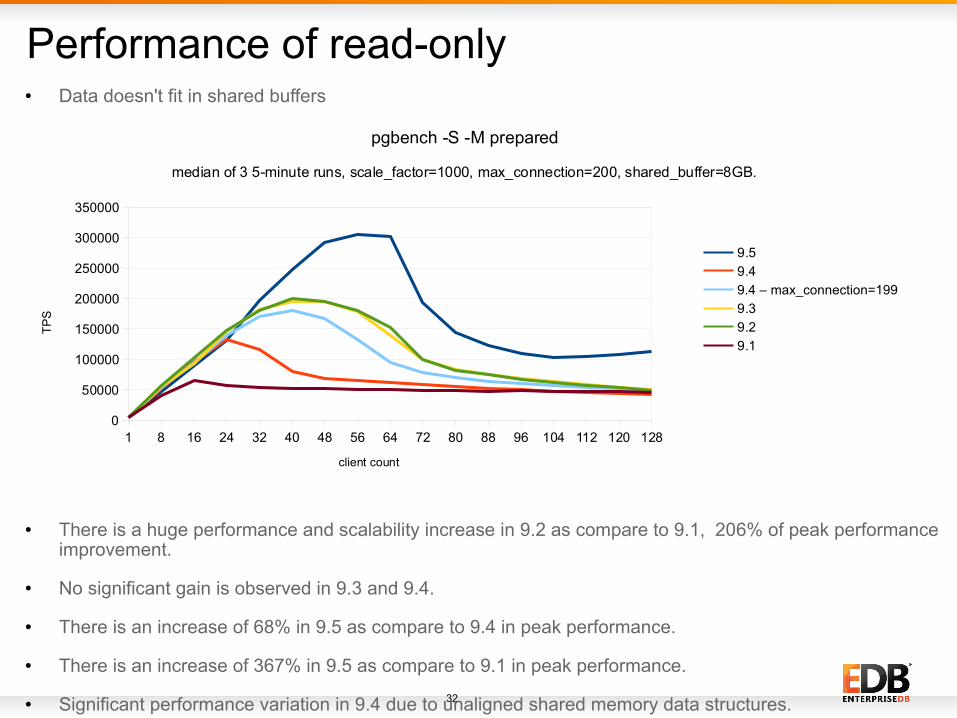
Performance of read-only
● There is a huge performance and scalability increase in 9.2 as compare to 9.1, 206% of peak performance improvement.
● No significant gain is observed in 9.3 and 9.4.
● There is an increase of 68% in 9.5 as compare to 9.4 in peak performance.
● There is an increase of 367% in 9.5 as compare to 9.1 in peak performance.
● Significant performance variation in 9.4 due to unaligned shared memory data structures.
1 8 16 24 32 40 48 56 64 72 80 88 96 104 112 120 1280
50000
100000
150000
200000
250000
300000
350000
pgbench -S -M prepared
median of 3 5-minute runs, scale_factor=1000, max_connection=200, shared_buffer=8GB.
9.5
9.4
9.4 – max_connection=199
9.3
9.2
9.1
client count
TP
S
● Data doesn't fit in shared buffers

33
● Thanks To Mithun C Y and Dilip Kumar for helping me in getting the performance data for this presentation.

34
Questions?

35
Thanks!


