Page 1
Accepted Manuscript
Fate of Triclocarban, Triclosan and Methyltriclosan during wastewater and biosolidstreatment processes
Nuria Lozano, Clifford P. Rice, Mark Ramirez, Alba Torrents
PII: S0043-1354(13)00423-5
DOI: 10.1016/j.watres.2013.05.015
Reference: WR 9956
To appear in: Water Research
Received Date: 10 December 2012
Revised Date: 8 May 2013
Accepted Date: 10 May 2013
Please cite this article as: Lozano, N., Rice, C.P., Ramirez, M., Torrents, A., Fate of Triclocarban,Triclosan and Methyltriclosan during wastewater and biosolids treatment processes, Water Research(2013), doi: 10.1016/j.watres.2013.05.015.
This is a PDF file of an unedited manuscript that has been accepted for publication. As a service toour customers we are providing this early version of the manuscript. The manuscript will undergocopyediting, typesetting, and review of the resulting proof before it is published in its final form. Pleasenote that during the production process errors may be discovered which could affect the content, and alllegal disclaimers that apply to the journal pertain.
Page 2
MANUSCRIP
T
ACCEPTED
ACCEPTED MANUSCRIPT
HIGHLIGHTS
• We have analyzed the two antibacterial mass balances in all treatments in a WWTP� • The absolute removal of Triclocarban and Triclosan was lower than 40 %�
• Nitrification denitrification was the most effective treatment in antibacterial removal • The highest MeTCS formation took place in nitrification-denitrification process
Page 3
MANUSCRIP
T
ACCEPTED
ACCEPTED MANUSCRIPT
1
FATE OF TRICLOCARBAN, TRICLOSAN AND METHYLTRICLOSAN DURING 1
WASTEWATER AND BIOSOLIDS TREATMENT PROCESSES 2
3
Nuria Lozanoa,b,d, Clifford P. Riceb, Mark Ramirezc and Alba Torrentsd* 4
5
aDepartment of Water and Environmental Sciences and Technology, University of Cantabria, 6
Santander, Cantabria, 39005, Spain 7
bEnvironmental Management and Byproduct Utilization Laboratory, BARC, ARS/USDA, 10300 8
Baltimore Avenue, Beltsville, MD 20705, USA 9
cDCWater. District of Columbia, Water and Sewer Authority, 5000 Overlook Avenue, S.W., 10
Washington, DC 20032, USA 11
dDepartment of Civil and Environmental Engineering, University of Maryland, College Park, 12
MD 20742, USA 13
14
15
16
17
18
19
20
21
*Corresponding author. Tel.: 01 301 405 1979; Fax: 01 301 405 2585 22
E-mail address: [email protected] (A. Torrents) 23
Page 4
MANUSCRIP
T
ACCEPTED
ACCEPTED MANUSCRIPT
2
Abstract 24
25
Triclocarban (TCC) and Triclosan (TCS) are two antibacterial chemicals present in household 26
and personal care products. Methyltriclosan is a biodegradation product of TCS formed under 27
aerobic conditions. TCC and TCS are discharged to Waste Water Treatment Plants (WWTP) 28
where they are removed from the liquid phase mainly by concentrating in the solids. This study 29
presents a thorough investigation of TCC, TCS and MeTCS concentrations in the liquid phase 30
(dissolved + particulate) as well as solid phases within a single, large WWTP in the U.S. Total 31
TCC and TCS concentrations decreased by > 97% with about 79% of TCC and 64% of TCS 32
transferred to the solids. The highest TCC and TCS removal rates from the liquid phase were 33
reached in the primary treatment mainly though sorption and settling of solids. The TCC mass 34
balances showed that TCC levels remain unchanged through the secondary treatment (activated 35
sludge process) and about an 18% decrease was observed through the nitrification-denitrification 36
process. On the other hand, TCS levels decreased in both processes (secondary and nitrification-37
denitrification) by 10.4 and 22.6%, respectively. The decrease in TCS levels associated with 38
observed increased levels of MeTCS in secondary and nitrification-denitrification processes 39
providing evidence of TCS biotransformation. Dissolved-phase concentrations of TCC and TCS 40
remained constant during filtration and disinfection. TCC and TCS highest sludge concentrations 41
were analyzed in the primary sludge (13.1 ± 0.9 µg g-1 dry wt. for TCC and 20.3 ± 0.9 µg g-1 dry 42
wt. for TCS) but for MeTCS the highest concentrations were analyzed in the secondary sludge 43
(0.25 ± 0.04 µg g-1 dry wt.). Respective TCC, TCS and MeTCS concentrations of 4.15 ± 0.77; 44
5.37 ± 0.97 and 0.058 ± 0.003 kg d-1 are leaving the WWTP with the sludge and 0.13 ± 0.01; 45
0.24 ± 0.07 and 0.021 ± 0.002 kg d-1 with the effluent that is discharged. 46
Page 5
MANUSCRIP
T
ACCEPTED
ACCEPTED MANUSCRIPT
3
Key words: Triclocarban, Triclosan, Methyltriclosan, WWTP, Mass-balance. 47
48
1. Introduction 49
50
Triclocarban (N-(4-chlorophenyl)-N-(3,4-dichlorophenyl) urea (TCC) and Triclosan (5-51
chloro-2-[2,4-dichloro-phenoxy]-phenol (TCS)) are organic compounds that are present in 52
household and personal care products because of their antibacterial properties. In the U.S., it is 53
estimated that approximately 30% of all bar soaps contain antibacterial compounds (Lanxess and 54
Henkel, 2010). Methyltriclosan (5-chloro-2-(2,4-dichlorophenoxy)anisole) (MeTCS) is a 55
biodegradation product of TCS that is formed under aerobic conditions (Bester, 2005; Chen et 56
al., 2011). MeTCS is more hydrophobic and is believed to be more persistent than TCS. A 57
recent study illustrated that in soils MeTCS’s half-life is about 4 times longer than TCS (Lozano 58
et al., 2012). 59
TCC and TCS are widely dispersed in the environment and several studies have suggested 60
endocrine disruptor properties for TCC (Ahn et al., 2008; Chen et al., 2008; Hinther et al., 2011), 61
TCS (Veldhoen et al., 2006; Crofton et al., 2007; Ahn et al., 2008; Zorrilla et al., 2008; Hinther 62
et al., 2011) and MeTCS (Hinther et al., 2011). TCC, TCS and MeTCS are hydrophobic 63
compounds with octanol-water coefficients (log Kow) of 4.9, 4.8 (Halden and Paull, 2005) and 64
5.0 (Balmer et al., 2004), respectively. In a WWTP, TCC and TCS are mostly removed from the 65
liquid-phase and accumulate in the solids (Heidler et al., 2006; Heidler and Halden, 2007) 66
reaching concentrations of 39.4 ± 59.9 and 16.1 ± 65.1 µg g-1 for TCC and TCS in the biosolids 67
(EPA, 2009). Although some MeTCS is present in the WWTP influent and it forms during 68
treatment yet effluents concentrations are generally lower than 100 ng L-1 (Lindström et al., 69
Page 6
MANUSCRIP
T
ACCEPTED
ACCEPTED MANUSCRIPT
4
2002; McAvoy et al., 2002; Bester, 2005; Kantiani et al., 2008). MeTCS has been analyzed in 70
biosolids at concentrations from 0.004 (Sánchez-Brunete et al., 2010) to 0.45 µg g-1 dry wt. 71
(McAvoy et al., 2002). 72
TCS and MeTCS have been found to be toxic to aquatic organism (DeLorenzo et al., 2008; 73
Farré et al., 2008; Binelli et al., 2009) and bioaccumulated in fish (Boehmer et al., 2004) and 74
algae (Coogan et al., 2007). TCC and TCS are bioaccumulated in earth worms (Kinney et al., 75
2008; Higgins et al., 2009; 2011; Snyder et al., 2011) and can undergo plant uptake through the 76
root and translocate into above-ground parts (Wu et al., 2010). 77
Although several studies have reported the fate of TCS and TCC in WWTPs (Singer et al., 78
2002; Bester, 2003; Sabaliunas et al., 2003; Bester, 2005; Heidler et al., 2006; Waltman et al., 79
2006; Ying and Kookana, 2007), little is known about their fate at different stages in the various 80
WWTPs solids removal processes. This study aims at filing this gap. Process-specific 81
information should be very valuable for the study of strategies to improve the treatments 82
efficiency and thus reduce the re-introduction of these compounds into the environment in both 83
liquid (effluents) and solid (biosolids land application) phases. Furthermore, while it is 84
recognized that MeTCS is more persistent and potentially more toxic, there are no studies 85
reporting its formation in a real WWTP. In this study TCC, TCS and MeTCS concentrations 86
were analyzed in liquid and solid phase in all stages within a large WWTP allowing a mass 87
balance to be determined in the primary and secondary treatment and also in the overall WWTP. 88
MeTCS formation was accounted for in the secondary and nitrification-denitrification treatment 89
stages. To our knowledge this is the first study where the three compounds are analyzed in each 90
stage and in both phases, liquid and solids, in a large WWTP. Our results illustrate that although 91
high removals are obtained from the liquid phase, a large fraction remains in the solids. While 92
Page 7
MANUSCRIP
T
ACCEPTED
ACCEPTED MANUSCRIPT
5
these compounds are considered biodegradable under aerobic conditions, current operational 93
retention times only allows for limited biodegradation. 94
95
2. Materials and Methods 96
97
2.1 Wastewater Treatment Plant and sample collection 98
99
Five sampling campaigns in February and March of 2009 were carried out (February, 18th 100
and 25th; March, 4th, 9th and 23rd) at a large wastewater treatment plant in the Mid-Atlantic region 101
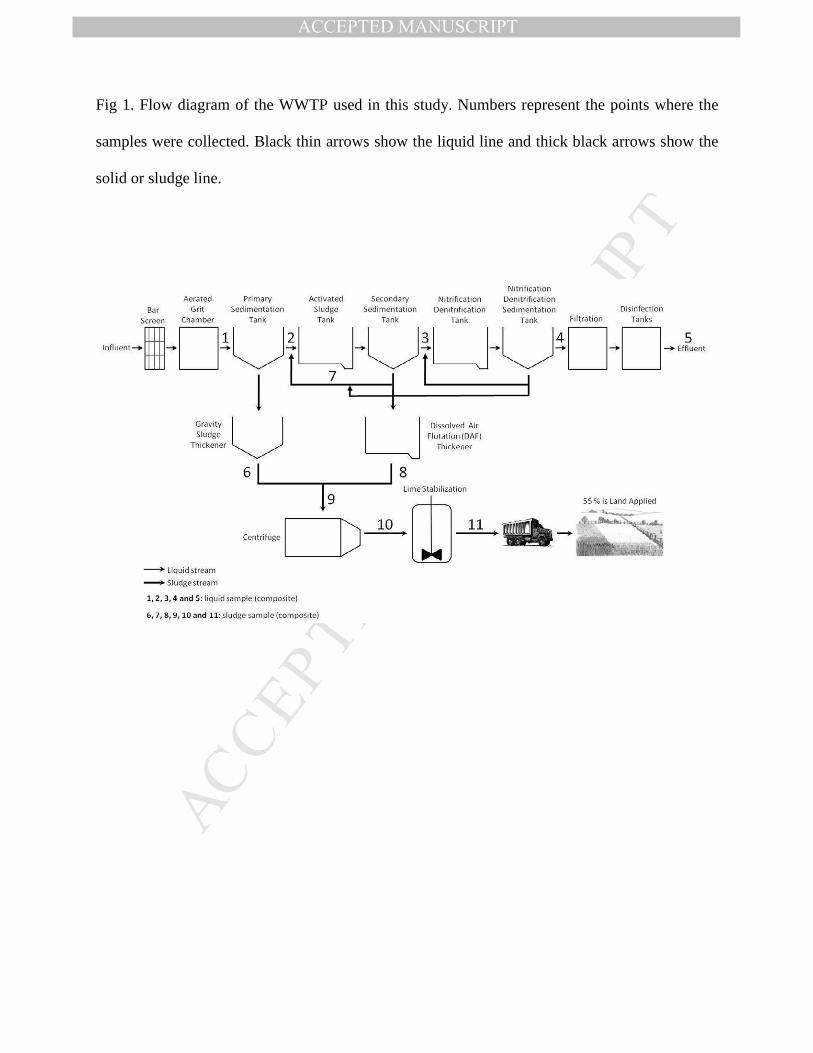
of the U.S. (WWTP A). Fig 1 presents a sketch of the WWTP that consists of preliminary 102
treatment, primary treatment, secondary treatment (activated sludge), nitrification-denitrification, 103
filtration and disinfection (chlorination with sodium hypochlorite followed by dechlorination 104
with sodium bisulfite). It serves over 2 million people and has a capacity to treat 1.4 million 105
cubic meters (m3) daily. The average raw sewage per day is about 1.25 million cubic meters. The 106
solids -or sludge- are settled with anionic polymer in the primary sedimentation tanks and are 107
pumped to gravity thickener tanks, where solids are coagulated with cationic polymer and 108
allowed to settle through gravity to the bottom and thickens. Biological solids from the 109
secondary and nitrification reactors are separated by gravity settling using cationic polymer 110
addition and then thickened in dissolved air flotation (DAF) thickeners. Both solids are mixed 111
and dewatered using centrifugation. Finally, the dewatered solids are stabilized using lime. 112
Approximately 15% on a dry weight basis of lime is added to neutralize pathogens. The final 113
biosolids are a Class B biosolid and over 90% of these are land applied. 114
Page 8
MANUSCRIP
T
ACCEPTED
ACCEPTED MANUSCRIPT
6
Liquid samples (~ 4 L) were collected at locations 1, 2, 3, 4 and 5 as shown in Fig 1. They 115
were 24 h composite samples. Three grab sludge samples (~ 0.5 L each) were collected during 116
the same 24 h period, mixed and homogenized to obtain a sludge composite 24 h sample. Solid 117
samples were collected at locations 6, 7, 8, 9, 10 and 11 as shown in Fig 1. 118
All samples (liquid and solid) were placed on ice and transferred to the lab for analysis. 119
Liquid samples were analyzed within 24 h after collection. Sludge samples were kept frozen (-120
20 oC) until processing. 121
122
2.2 Standards and Reagents 123
124
Triclocarban (99%), Triclosan (97%) and Methyltriclosan (99%) standards were obtained 125
from Aldrich (Aldrich Chemical Company, Inc, Milwaukee, WI, USA). TCC, TCS and MeTCS 126
chemical structures are provided in the supporting information, Table S1. Isotope-labeled 13C13-127
TCC (≥99%), 13C12-TCS (≥99%) and 13C12-MeTCS (≥99%) were obtained from Wellington Lab. 128
(Guelph, ON, Canada). All organic solvents were high purity, pesticide grade (Burdick and 129
Jackson; Fisher Scientific and EMD Chemicals Inc.). Sand was obtained from JT Baker 130
(Mallinckrodt Baker, Inc., Phillipsburg, NJ, USA). Potassium phosphate monobasic (99.2%), 131
potassium phosphate dibasic anhydrous (99.6%), ammonium acetate (99%), sulfuric and acetic 132
acid (both certified ACS grade) were obtained from Fisher Scientific (Fisher Scientific, Fair 133
Lawn, NJ, USA). Carbon-free deionized water (DI-water) was secured using a NANOpure 134
system (Barnstead International, Dubuque, IA, USA). Glassware and sand were baked at 400 ºC 135
for 4 h in an industrial oven (Grieve, Round Lake, IL, USA) to drive off any organic materials. 136
137
Page 9
MANUSCRIP
T
ACCEPTED
ACCEPTED MANUSCRIPT
7
2.3 Analytical Methods 138
139
For each composite sample, 250 ml to 3 L were suction filtered through two pre-weighed glass 140
filters in series: GF/A 1.6 µm and GF/F 0.7 µm (Whatman, Clifton, NJ, USA). Filters were dried 141
overnight in the extraction hood, stored under vacuum till reaching a constant weight and then, 142
extracted following the same method that was used for sludge samples. The filtered solids were 143
weighed to calculate total suspended solids (TSS) and these values allowed total solids (TS) to 144
be calculated according to Standard Methods (Method 2540B)(Clesceri et al., 1999). Liquid 145
samples were acidified using sulfuric acid to decrease the pH ~ 2 and processed according to 146
Halden and Paull, 2004 (Halden and Paull, 2004). Liquid samples were cleaned up using 147
Oasis®HLB cartridges (6 ml, 200 mg sorbent) (Waters Corporation, Milford, MA, USA). The 148
analytes were desorbed from the cartridges with 10 ml of a 50:50 v/v solution of 149
methanol:acetone containing 10 mM acetic acid. The solvent in these extracts was reduced by 150
evaporation and the extracts were transferred to 1.5 ml of methanol for analysis of their TCC and 151
TCS content by LCMS. 152
Solid sample extractions followed the method of Lozano et al. (Lozano et al. 2010). Before 153
extraction, samples 6, 7, 8 and 9 were centrifuged (benchtop centrifuge, C412, Jouan, S.A., 154
France) at 2000 rpm for 10 min. The supernatant was discarded and the solids weighed, a portion 155
of this material (0.3-0.5 g. wet weight (wet wt.)) was placed into an accelerated solvent 156
extraction (ASE) cell. These ASE cells were packed and extracted with a model #300 157
Accelerated Solvent Extraction apparatus (Dionex Corp. Sunnyvale, CA, USA) using 158
water/isopropyl alcohol (IPA) (20:80, v/v). The recovered extracts were fractionated using solid 159
phase Oasis®HLB cartridges (Waters Corporation, Milford, MA, USA). A dichloromethane 160
Page 10
MANUSCRIP
T
ACCEPTED
ACCEPTED MANUSCRIPT
8
(DCM)/diethyl ether (DEE) (80:20) solution was used to elute TCC, TCS and MeTCS from the 161
cartridges. The solvent in the final extract was removed by nitrogen blow down and the sample 162
was transferred with methanol to a final volume of 1.5 ml. Finally, the samples were run on the 163
LCMS to analyze TCC and TCS. After that, the samples were run on the GCMS to determine 164
their MeTCS content (additional details are provided in supplementary information, section 1). 165
All samples (liquid, filter and sludge) were spiked with 100 ng of 13C12-TCC, 13C12-TCS and 166
13C12-MeTCS internal standards before extraction to allow for isotope dilution quantitation. 167
168
2.4 Instrumental Analysis 169
170
Extracts were analyzed by LCMS to measure TCC and TCS. LC-chromatographic 171
separation was performed on a reverse-phase liquid chromatographic column (Waters Xterra 5 172
µm MS C18 column - 150 × 2.1 mm) using a Waters 2695 XE LC instrument (Waters Corp., 173
Milford, MA). Atmospheric pressure ionization tandem mass spectrometry analysis was 174
performed on a benchtop triple quadrupole mass spectrometer (Quattro LC from Micromass Ltd., 175
Manchester, UK) operated using a negative electrospray ionization source (ESI-). Acquisitions 176
were done in SIR (selected ion recording). After TCC and TCS were measured these methanol 177
extracts were evaporated and transferred to 1 ml of hexane for MeTCS. These hexane extracts 178
were analyzed using an Agilent 6890 gas chromatograph (GC) coupled with an Agilent 5975 179
mass selective detector (MSD) operated in positive electron impact ionization mode. The 180
analytes were separated using a (DB-5-MS) capillary column with a length of 15 m, diameter of 181
0.25mm, and film thickness of 0.1µm (J&W Scientific, Folsom, CA). LCMS and GCMS 182
Page 11
MANUSCRIP
T
ACCEPTED
ACCEPTED MANUSCRIPT
9
conditions and additional details including ions used for identification and quantification are 183
provided in supplementary information, inTable S2. 184
185
2.5 Quality Assurance and Quality Control 186
187
Method Detection Limits (MDLs) were determined using the procedure established by U.S 188
EPA (EPA, 1984). The Limit of Quantification (LOQ) was set at 2 times the MDL values. All 189
samples were fortified with labeled 13C12-TCC, 13C12-TCS 13C12-MeTCS internal standard for 190
analyte quantification and to correct for possible matrix interactions and any losses during 191
sample extraction. At least seven standards at concentrations other than zero were run for each 192
set of analyses and linearity correlations were required to yield r-squared values ≥ 0.99. 193
Standards were injected every ten samples in order to verify stability of the instrument during the 194
analyses. A laboratory blank, duplicate and spike were included in each batch that always 195
included less than 15 samples. Statistical analysis was performed using GraphPad Prism 5.0 196
Software, Inc., San Diego, CA. 197
198
2.6 Determinations 199
200
The percentage removal of each compound from the WWTP liquid-phase was calculated 201
from the total concentration (dissolved and particulate) in raw sewage water (Cinf) and final 202
effluent (Ceff) according Eq. 1 203
204
Removal %� =Cinf − Ceff
Cinf
× 100 1� 205
Page 12
MANUSCRIP
T
ACCEPTED
ACCEPTED MANUSCRIPT
10
206
Furthermore, the mass load of each compound that was lost due to the sum of all transformation 207
processes (Wlost) (kg d-1) during the primary, secondary and whole WWTP was determined using 208
Eq. 2 (Heidler and Halden, 2007). 209
210
Wlost = Qinf × Cinf � − Qeff × Ceff � − Wsludge 2� 211
212
where Qinf is the influent flow rate (m3 d-1); Qeff is the effluent flow rate (m3 d-1); Cinf and Ceff are 213
the total compound concentration (dissolved and particulate) in the influent and the effluent 214
respectively (kg m-3) and Wsludge is the mass output in the sludge (primary and secondary 215
treatment) or in the biosolids (whole WWTP) in (kg d-1). More detailed information about the 216
mass calculations is shown in supporting information section 3. 217
218
3. Results and Discussion 219
220
3.1 Quality Assurance and Quality Control 221
222
TCS method development for solids samples was previously published (Lozano et al., 223
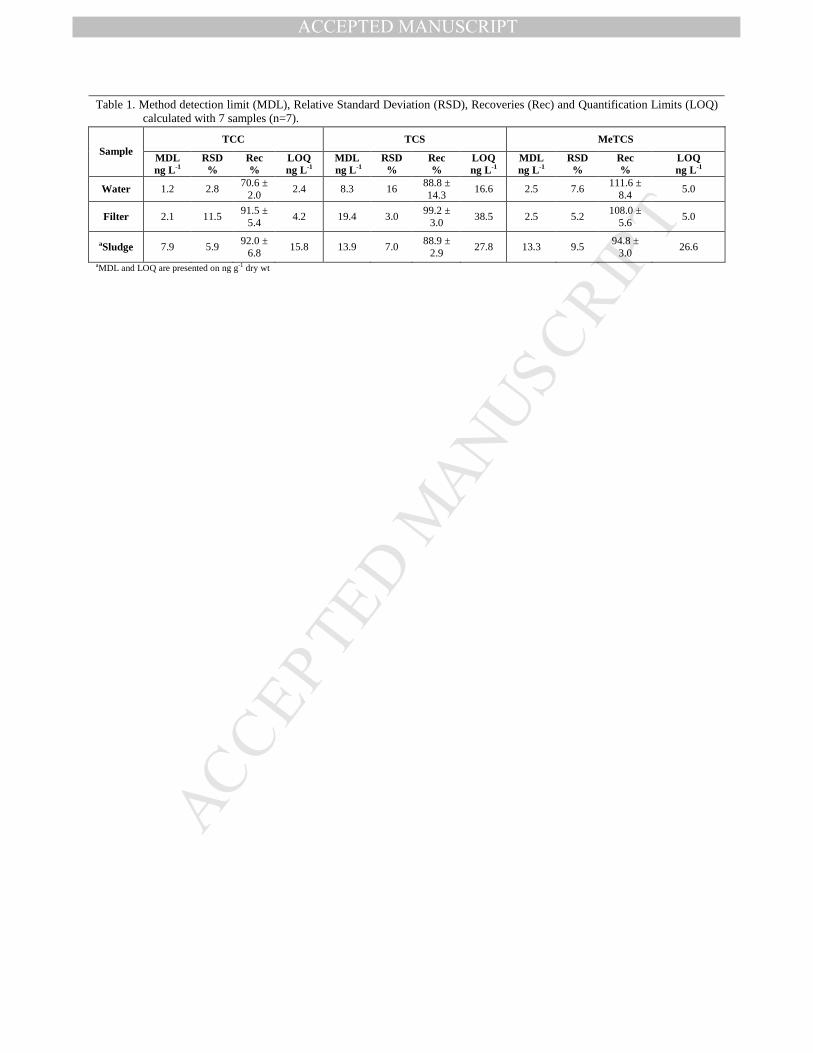
2010). Table 1 shows the TCC, TCS and MeTCS MDLs, LOQs, recoveries and Relative 224
Standard Deviation (RSDs) for water, sludge and filter samples. To validate the method, 7 225
replicates samples plus two procedural blanks were spiked and processed for each compound 226
following USEPA protocols (EPA, 1984). Concentrations below the LOQ are not reported. 227
Page 13
MANUSCRIP
T
ACCEPTED
ACCEPTED MANUSCRIPT
11
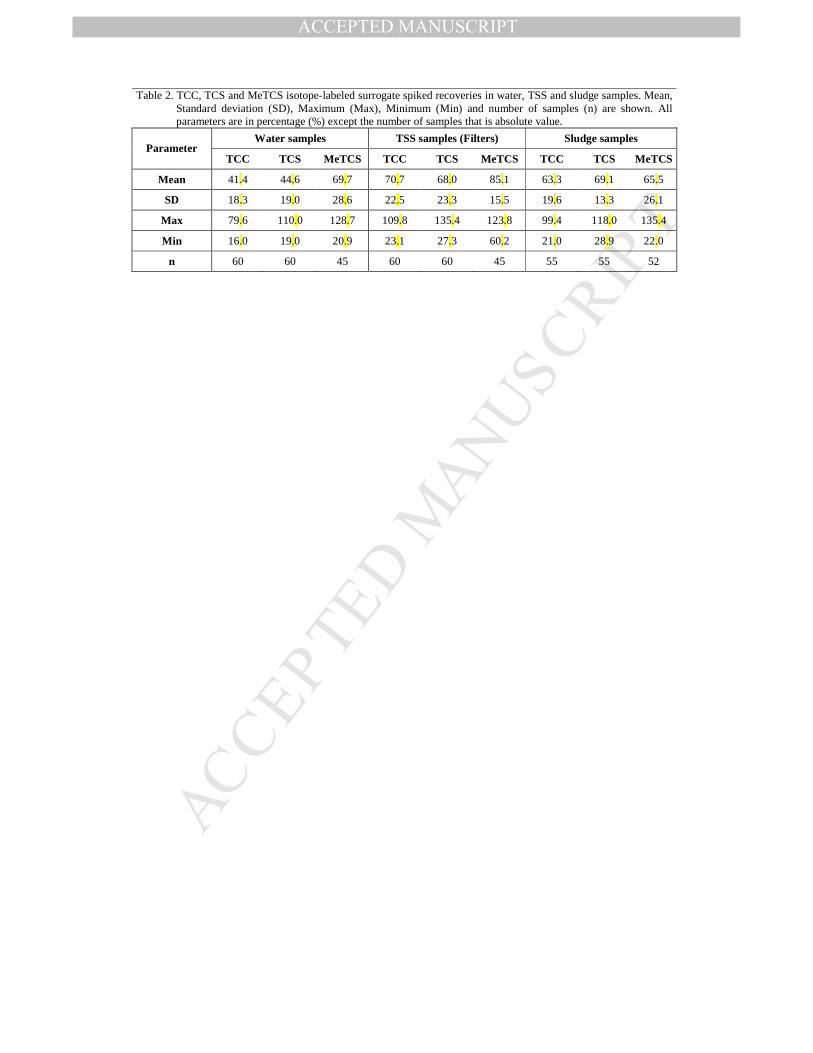
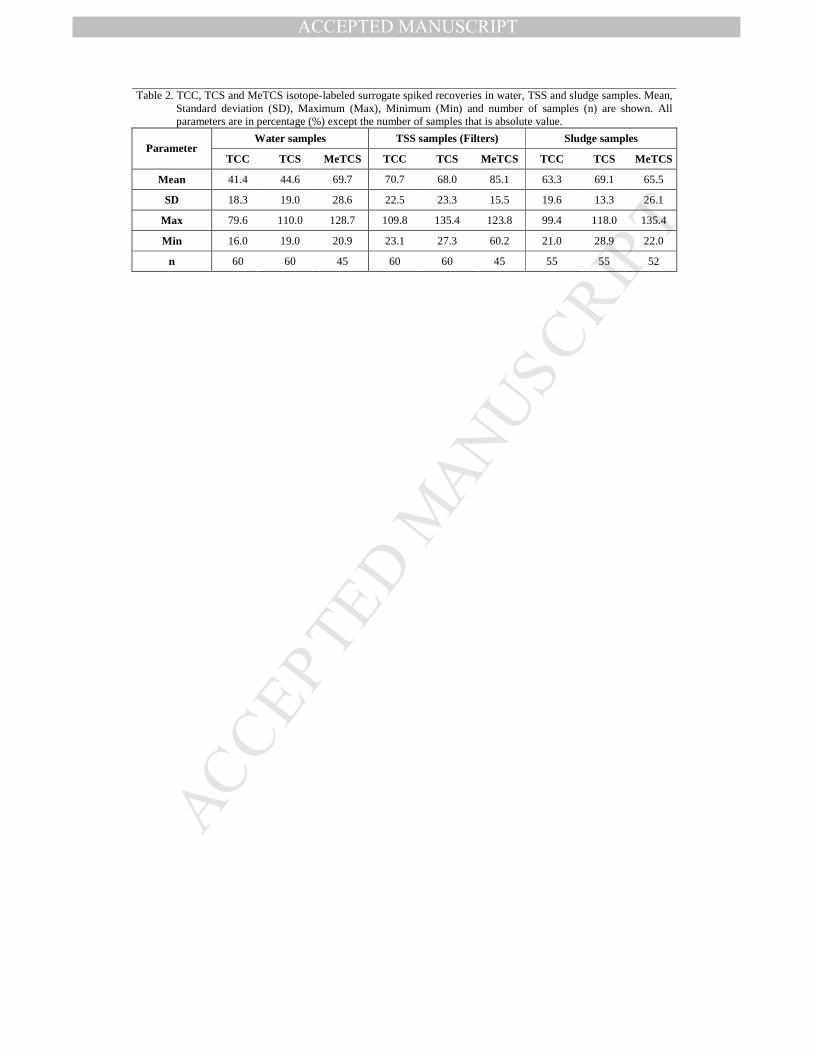
The percent recoveries of the isotope-labeled surrogate spiked are shown in Table 2. The 228
highest recoveries were obtained for TSS samples (filters) and lowest for water samples. In water 229
samples recoveries ranged from about 70% to 40% for MeTCS and TCC respectively. In TSS 230
samples, MeTCS also exhibited the highest recovery (mean ± stdev = 85.1 ± 15.5%) followed by 231
TCC (mean ± stdev = 70.7 ± 22.5%) and the lowest recovery was for TCS (mean ± stdev = 68.0 232
± 23.3%). For sludge samples, the behavior of the isotope-labeled surrogate spiked was similar 233
for TCC, TCS and MeTCS. The recoveries were 69.1 ± 13.3% for TCS, 65.5 ± 26.1% for 234
MeTCS and 63.3 ± 19.6% for TCC. 235
236
3.2 Triclocarban (TCC) 237
238
Liquid-phase TCC concentrations found along the WWTP processing stream are presented 239
in Fig 2. All TCC, TCS and MeTCS concentrations and masses shown in this section 2.1 240
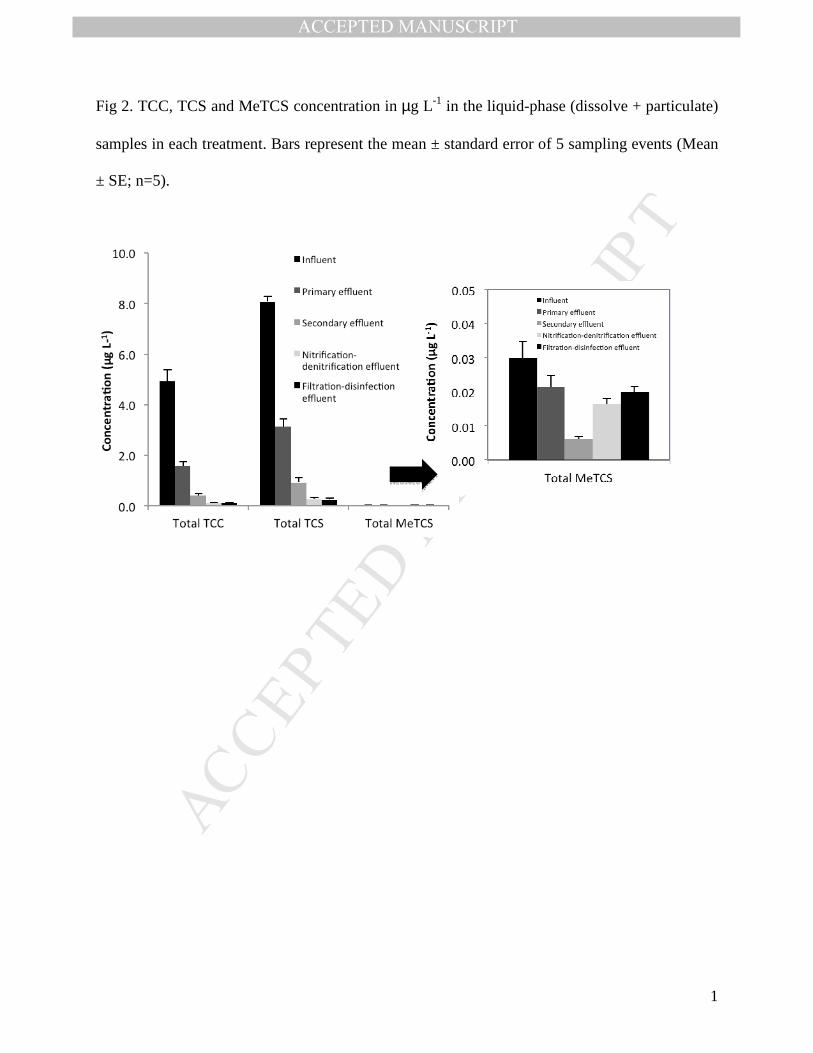
represent the mean ± standard error (mean ± SE) of 5 sampling events. The concentrations of 241
TCC found in the influent present an average of 4.92 ± 1.00 µg L-1. These concentrations were 242
decreasing gradually through the plant reaching final concentrations in the effluent of 0.12 ± 0.02 243
µg L-1; representing a liquid-phase removal of 97.4 ± 0.4% and a mass removed from the liquid 244
phase of 4.98 ± 0.44 kg d-1. Fig 2 illustrates that a significant removal is achieved during the 245
primary treatment. Particulate TCC concentrations accounted for 69.8% of the influent and this 246
fraction was removed in the primary treatment. Fig S1 illustrates that over 70% of TCC in the 247
influent is present attached to particles while in the effluent over 70% of the total in this phase is 248
dissolved. Such a finding is expected for compounds with moderately high octanol-water 249
coefficient (Kow) and low solubility (So) like TCC (logKow = 4.9 and So = 0.65-1.55 mg L-1) 250
Page 14
MANUSCRIP
T
ACCEPTED
ACCEPTED MANUSCRIPT
12
(Halden and Paull, 2005). Overall, with primary treatment, TSS decreased by 75.2 ± 5.7% and 251
TCC concentrations decreased by 80.2 ± 11.7%. Similar removal rates were observed during the 252
secondary treatment (76.2 ± 9.2%) (Fig 2). While the percentages are similar, most of the TCC 253
mass is removed in the primary treatment (4.19 ± 1.19 kg d-1 in the primary treatment compared 254
to 1.45 ± 0.45 kg d-1 in the secondary treatment). The TCC mass found in the sludge that comes 255
from the primary treatment (3.68 ± 0.37 kg d-1) was much higher than the mass coming from the 256
secondary treatment (1.38 ± 0.12 kg d-1) corresponding to 91.7 ± 8.8% of the TCC removed from 257
the liquid-phase in the primary treatment and 99.7 ± 9.9% of the TCC removed in the secondary 258
treatment. An additional 70.4 ± 10.6% of the liquid-phase TCC concentrations were removed 259
during nitrification-denitrification. The nitrification-denitrification return line to the head of the 260
nitrification-denitrification process could not be sampled and thus masses could not be 261
determined. Finally no TCC removal was observed during filtration-disinfection. TCC 262
concentrations analyzed in the effluent in the nitrification-denitrification when compared with 263
the concentrations analyzed in the WWTP effluent (Fig S3, samples 4 and 5) were not 264
statistically different (t student test; p>0.05). 265
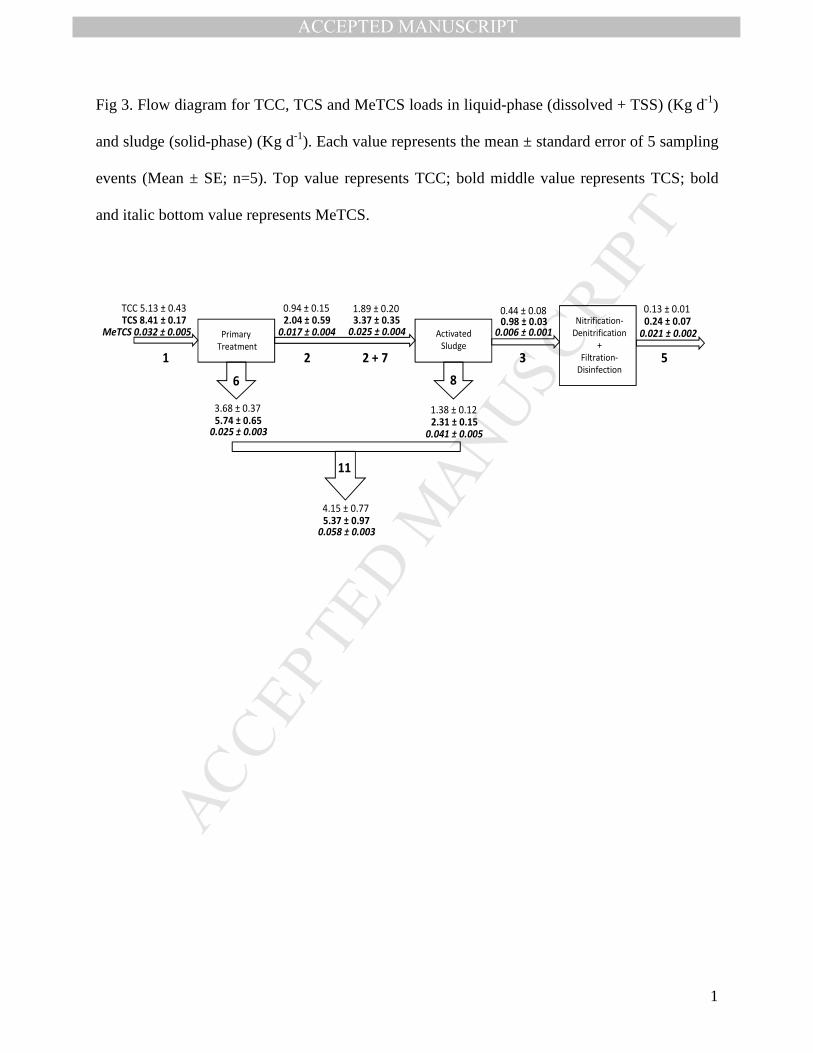
Fig 3 shows TCC mass calculated in each sample. Applying Eq 2, we found that the amount 266
of TCC removed in the primary treatment was 0.51 ± 0.7 Kg d-1 [TCCremoved = 1-(2+6). Fig 3]. 267
However there were no statistical differences between the TCC mass in the influent (1) and the 268
sum of load in the primary effluent and the primary sludge (samples 2+6) (t student test; p>0.05). 269
This indicates that TCC was not transformed in the primary treatment and the high removal rates 270
are accounted for by its attachment to the solids. When the mass balance was performed in the 271
secondary treatment [TCCremoved = (2+7)-(3+8). Fig 3], the TCC removed was 0.07 ± 0.17 kg d-1 272
but applying a t student test between the mass in (value 1 in the Fig 3) and the mass out (sum of 273
Page 15
MANUSCRIP
T
ACCEPTED
ACCEPTED MANUSCRIPT
13
the value 2+6 in the Fig 3), no statistical differences were found (p>0.05) suggesting that TCC 274
was not degraded in the secondary treatment. Finally, for the whole WWTP mass balance 275
[TCCremoved = 1-(5+11). Fig 3] there was a TCC mass removal of 0.83 ± 0.47 kg d-1 that 276
represents a removal of 18.3 ± 11.9%. Since no TCC removal was observed in the primary and 277
secondary treatment and no statistical differences were found between concentrations in the 278
nitrification-denitrification effluent and the final effluent (sample 4 and 5, Fig 1), then the total 279
net TCC removal appears to be taking place in the nitrification-denitrification process. TCC is 280
known to be degraded under aerobic conditions (Gledhill, 1975) and it is unknown if it could be 281
degraded under anoxic conditions. Also, a bacteria present in the wastewater has been identified 282
to be involved in the TCC and its non-chlorinated congener degradations (Miller et al., 2010). 283
Moreover, the nitrification-denitrification presented longer hydraulic (6.9 h vs 4.3 h) and higher 284
cellular retention times (12-18 d vs. 1.5-2 d) than the secondary treatment thus higher 285
degradation rates would be expected. 286
Although small changes were found in the concentrations analyzed in the sludge samples 287
collected before (sample 9, Fig S3) and after the centrifuge (sample 10, Fig S3) and in the lime 288
biosolids (sample 11, Fig S3), no statistical differences were found between any of these samples 289
when applying ANOVA and Tukey multiple comparison tests (p>0.05). We think that these 290
differences are temporal and spatial variability that inherent to this type of sampling. Our 291
analysis illustrate that TCC mass reintroduced to the environment by effluent discharge (0.13 ± 292
0.01 kg d-1) is about 30 times lower than the TCC that is reintroduced by land application (4.15 ± 293
0.77 kg d-1; Fig 3) of the biosolids (assuming that a 90% of biosolids produced into the WWTP 294
are applied to the soils). 295
296
Page 16
MANUSCRIP
T
ACCEPTED
ACCEPTED MANUSCRIPT
14
3.3 Triclosan (TCS) 297
298
TCS concentrations found in the liquid-phase samples are presented in the Fig 2. The average 299
influent was 8.05 ± 0.47 µg L-1. These concentrations gradually decreased in each treatment to 300
reach final concentrations in the effluent of 0.23 ± 0.13 µg L-1. This represents a liquid-phase 301
removal of 97.1 ± 1.7% and a mass removed from the liquid phase of 8.12 ± 0.20 kg d-1. Fig 2 302
illustrates that similar to TCC primary treatment removes a large fraction of TCS. TCS has a 303
Kow value of 4.8 (Halden and Paull, 2005) so most of the concentration (around 80%) is attached 304
to solids (Fig S2). Considering only the liquid-phase, the percentage removal in the primary 305
treatment was 75.4 ± 7.6%. During secondary treatment, the removal in the liquid-phase was 306
very close to the removal in the primary treatment, 73.1 ± 4.8% (Fig 2). However when 307
comparing the mass removed in the liquid-phase for both treatments, we found that TCS 308
removed in the primary treatment was 6.38 ± 0.7 kg d-1 while that removed from the liquid-phase 309
in the secondary treatment was 2.76 ± 0.34 kg d-1 , almost 2.3 times lower than the amount of 310
TCS removed in the primary treatment. The TCS mass found in the sludge that comes from the 311
primary treatment (5.74 ± 0.65 kg d-1) was also higher than the mass coming from the secondary 312
treatment (2.31± 0.15 kg d-1). This means that 100.2 ± 24.9% of the TCS removed from the 313
liquid-phase in the primary treatment and 86.4 ± 6.2% of the TCS removed in the secondary 314
treatment is still present in the sludge. These results suggest that no TCS degradation took place 315
in the primary treatment while some TCS degradation happened in the secondary treatment. 316
Nitrification-denitrification process showed a TCS removal percentage of the 79.6 ± 11.8% from 317
the liquid phase. Finally no TCS removal was observed in the filtration-disinfection process. 318
TCS concentrations analyzed in the effluent in the nitrification-denitrification process when 319
Page 17
MANUSCRIP
T
ACCEPTED
ACCEPTED MANUSCRIPT
15
compared with the concentrations analyzed in the WWTP effluent (Fig S4, samples 4 and 5) 320
were not statistically different (t student test; p>0.05). 321
Fig 3 shows TCS mass calculated in each sample collected. Applying the Eq 2, we found 322
that the amount of TCS removed in the primary treatment was 0.63 ± 1.15 kg d-1 [TCSremoved = 1-323
(2+6). Fig 3]. However there was no statistical difference between the TCS mass in the influent 324
(1) and the sum of loads in the primary effluent and the primary sludge (samples 2+6) (t student 325
test; p>0.05). This indicates that TCS was not eliminated in the primary treatment and therefore 326
both TCS and TCC left the primary treatment mainly attached to the solids. When the mass 327
balance was performed in the secondary treatment [TCSremoved = (2+7)-(3+8). Fig 3], the TCS 328
removed was 0.45 ± 0.22 kg d-1. In contrast with TCC, TCS load in (value 1, Fig 3) and the TCS 329
load out (sum of the values 2+6, Fig 3) in the secondary treatment, were statistically different (t 330
test; p<0.05) showing that TCS was removed. This observation was later validated by our 331
finding that some MeTCS was formed in the secondary treatment. Statistical differences were 332
found between the MeTCS in and the MeTCS out in the secondary treatment (t student; p<0.05). 333
Finally, the whole WWTP mass balance [TCSremoved = 1-(5+11). Fig 3] showed a TCS mass 334
removed of 2.75 ± 0.88 kg d-1 that represents a removal of 33.0 ± 10.7%. Since no TCS was 335
removed in the primary treatment, only 0.63 ± 0.15 kg d-1 was removed in the secondary 336
treatment and no removal was observed in the filtration-disinfection process (sample 4 and 5, Fig 337
1), then the TCS removal that was not accounted for in the secondary treatment, had to be 338
removed in the nitrification-denitrification process. The TCS mass removed in nitrification-339
denitrification process was 2.29 ± 0.90 kg d-1 which is higher than the TCS amount removed in 340
the secondary treatment. This shows that like TCC results, the most effective treatment to 341
remove TCS was the nitrification-denitrification process. 342
Page 18
MANUSCRIP
T
ACCEPTED
ACCEPTED MANUSCRIPT
16
TCS is known to degrade under aerobic conditions in activated sludge treatments (Federle et 343
al., 2002) and in a recent manuscript (Chen et al., 2011) it was found to also degrade under 344
anoxic (Chen et al., 2011) conditions. The fact that nitrification-denitrification processes 345
encompass both stages at this plant and that this process provides a longer hydraulic and cellular 346
retention time would favor TCS removal. Although small changes were found in the 347
concentrations analyzed in the sludge samples collected before (sample 9, Fig S4) and after the 348
centrifuge treatment (sample 10, Fig S4) and in the lime biosolids (sample 11, Fig S4), no 349
statistical differences were found between any sample when applying an ANOVA and Tukey’s 350
multiple comparison post test (p>0.05). 351
The TCS mass reintroduced with the effluent discharge is 0.24 ± 0.07 kg d-1 which is 352
approximately 20 times lower than the TCS that would be reintroduced by biosolids land 353
application (5.37 ± 0.97 kg d-1; Fig 3). 354
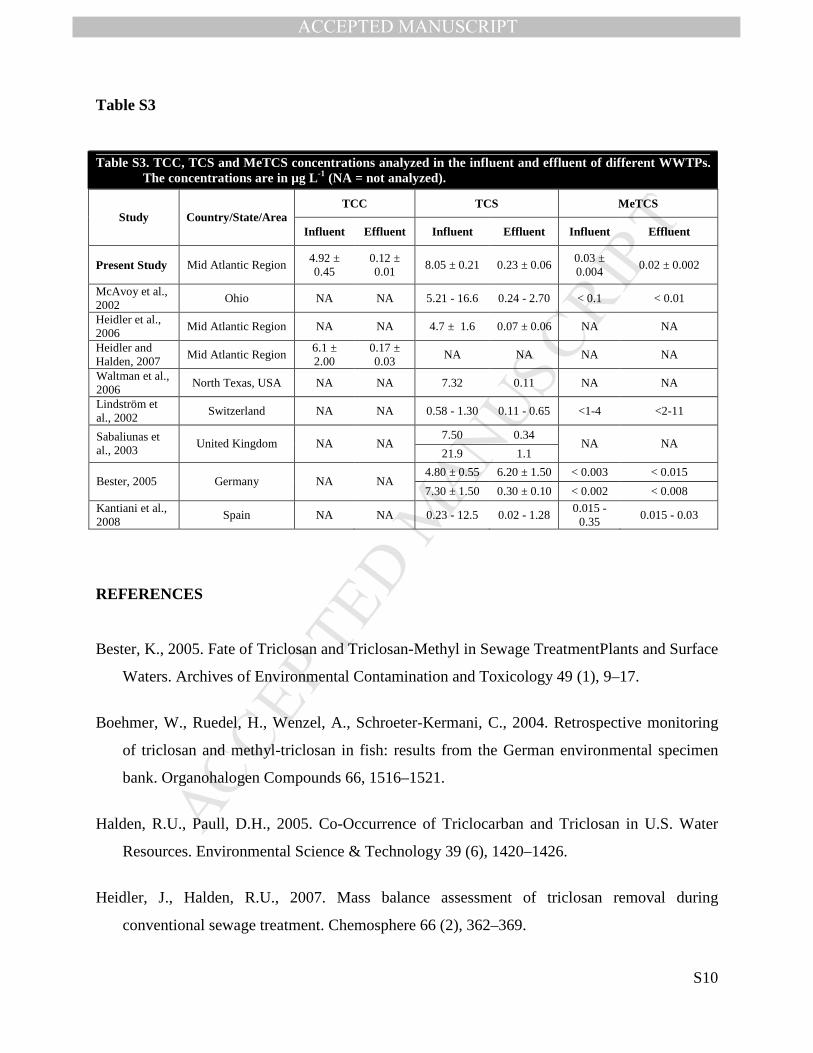
TCC, TCS and MeTCS concentrations analyzed in the influent and effluent of different 355
WWTPs are shown in supporting information, Table S3. The TCC, TCS and MeTCS 356
concentrations presented here, are in concordance with the range of concentrations analyzed by 357
other authors. 358
359
3.4 Methyltriclosan (MeTCS) 360
361
MeTCS concentrations found in the liquid-phase samples are presented in the Fig 2. The 362
concentrations found in the influents present an average of 0.03 ± 0.02 µg L-1. While these 363
MeTCS concentrations decreased after primary treatment, they increased during the secondary 364
and nitrification-denitrification treatments and remained constant after the filtration-disinfection 365
Page 19
MANUSCRIP
T
ACCEPTED
ACCEPTED MANUSCRIPT
17
process (t student test; p>0.05). The concentration in the effluent was 0.02 ± 0.13 µg L-1 and it 366
was not statistically different from the concentrations analyzed in the influent (t student test; 367
p>0.05). The percentages of the MeTCS concentrations that are dissolved and attached to the 368
solids are presented in the Fig S3. 369
For the overall plant, MeTCS does not show a significant change; however, our results 370
clearly illustrate a removal in the primary treatment (57.4 ± 21.0%) and a formation in the 371
secondary and tertiary treatments (Fig 2) from the liquid-phase. Our findings with MeTCS 372
support our results that TCS did not undergo any significant degradation during the primary 373
treatment where all the removal was due to partitioning onto the solids. In contrast, during the 374
secondary and tertiary stages, elimination of TCS was correlated with an observed MeTCS 375
formation. 376
Increases in MeTCS concentrations were observed in the liquid-phase during secondary and 377
nitrification-denitrification treatment processes, suggesting that MeTCS was formed in both 378
treatments. To support such findings, a mass balance accounting for return lines to the head of 379
both processes was performed. Secondary treatment mass balance [MeTCSremoved = (2+7)-(3+8). 380
Fig 3], indicated that while MeTCS removed from the liquid-phase was 67.7 ± 24.8%, the 381
overall MeTCS mass removed in the overall secondary treatment was -0.02 ± 0.01 kg d-1; 382
supporting that MeTCS was formed. No MeTCS mass balance could be done in the nitrification-383
denitrification process because we didn’t have the concentration in the return line, however it 384
was feasible to do the mass balance for the overall WWTP. This mass balance [MeTCSremoved = 385
1-(5+11). Fig 3] showed a MeTCS formation of 0.05 ± 0.01 kg d-1. No MeTCS was formed in 386
the primary treatment and 0.02 ± 0.01 kg d-1 was formed in the secondary; therefore 0.03 ± 0.01 387
kg d-1 was derived from the nitrification-denitrification process. This result suggests that the 388
Page 20
MANUSCRIP
T
ACCEPTED
ACCEPTED MANUSCRIPT
18
MeTCS formation would be higher in the nitrification-denitrification process where also higher 389
TCS removal rates were observed. However no statistical differences were found between the 390
MeTCS formation found in both processes (t student test; p>0.05). Although no statistical 391
differences were found we think that the hypothesis for higher MeTCS formation in the 392
nitrification-denitrification process is valid. MeTCS is known to be formed under aerobic 393
conditions (Bester, 2005), also it has been recently shown to be formed under anoxic conditions 394
(Chen et al., 2011) but at lower rates than aerobically. If nitrification-denitrification process 395
presents aerobic and anoxic conditions, longer hydraulic and cellular retentions times than the 396
secondary treatment offers and the microorganisms involve in the process are acclimated to TCS 397
and MeTCS concentrations, then this process should offer optimum conditions for providing 398
higher MeTCS formation rates. MeTCS itself has been found to be degraded in soils with longer 399
half-lives than TCS (Lozano et al., 2012), thus MeTCS could be degrading as well. There is a 400
need for additional studies to assess the formation and degradation of MeTCS and it possible 401
build up in biosolids. 402
Our results indicate that only 4% of the influent TCS is transformed to MeTCS through the 403
plant, in agreement with the 1% reported by Chen et al. (Chen et al., 2011). The slightly larger 404
transformation in this study could be attributed to a better acclimation of the microorganisms in 405
the biological treatments of this WWTP-A which offers longer cellular retention times. 406
The MeTCS sludge concentrations between sludge sampled before and after the centrifuge 407
and the biosolids are presented in Fig S5 (concentrations in samples 9, 10 and 11 in Fig S5). The 408
MeTCS concentration found in the biosolids was 0.16 ± 0.03 µg g-1 dry wt. which is within the 409
range of concentrations published in other studies (from 0.04 (Sánchez-Brunete et al., 2010) to 410
0.45 (McAvoy et al., 2002) µg g-1 dry wt). The MeTCS mass reintroduced with the discharged 411
Page 21
MANUSCRIP
T
ACCEPTED
ACCEPTED MANUSCRIPT
19
effluent is 0.02 ± 0.003 kg d-1, approximately 3 times lower than MeTCS reintroduced by land 412
application of the biosolids (0.058 ± 0.003 kg d-1; Fig 3). 413
To our best knowledge, there are no studies that show the TCC, TCS and MeTCS mass 414
balance in terms of treatment processes in a large WWTP. One study does report TCC 415
distribution in a large WWTP, the percentage of the TCC remaining in the effluent was around 3 416
± 1%, 21 ± 30% was lost or transformed and the amount remaining in the sludge was 73 ± 30% 417
(Heidler et al., 2006). In our study, 2.7 ± 0.7% of the TCC was still present in the effluent, 18.3 ± 418
11.9% was lost or transformed and 79.1 ± 24.0% remained in the biosolids. These values are 419
very close to the Heidler et al., 2006 study. Furthermore, our data illustrates that TCC 420
degradation is taking place during nitrification-denitrification. 421
Laboratory studies indicate that TCS can be highly degraded (98.5%) during activated sludge 422
treatment (Federle et al., 2002), however our results illustrate that in a real WWTP such 423
degradation is significantly reduced to 33.0 ± 10.7%, with 2.9 ± 0.8% in the effluent and 64.1 ± 424
11.4% remained in the biosolids; supporting a prior study (Heidler and Halden, 2007). While 425
some degradation of TCC and TCS is observed under normal WWTP operational conditions, 426
additional studies should be performed to better assess degradation and determine degradation 427
products formed. 428
429
4. Conclusions. 430
431
In this study a complete analysis of two antibacterial compounds TCC and TCS and one TCS 432
biodegradation product, MeTCS were analyzed in a large WWTP. Liquid and solid phase 433
Page 22
MANUSCRIP
T
ACCEPTED
ACCEPTED MANUSCRIPT
20
concentrations were determined in each process and their overall fate assessed. The main 434
findings are: 435
436
• Most TCC, TCS and MeTCS mass entering the WWTP is attached to the particles in the 437
waste water (> 70%) and the most of the mass outgoing is contained in the biosolid (> 438
64%), with only a small percentage leaving in the effluent (≈ 3%). This indicates that the 439
main pathway to reintroduce TCC, TCS and MeTCS to the environment is with the land 440
application of biosolids. 441
• TCC mass balance revealed that TCC was degraded during nitrification-denitrification 442
and not in the activated sludge process (secondary treatment) as others have observed. 443
• The TCS mass balance showed that TCS was degraded in both, the secondary and 444
nitrification-denitrification processes, with degradation during nitrification-denitrification 445
being higher. 446
• MeTCS was removed from the liquid-phase in the primary treatment and the mass 447
balance revealed that MeTCS was formed as a product of TCS conversion (removal) in 448
the secondary and nitrification-denitrification processes. 449
• This study shows that antibacterial compounds can be removed during biological 450
treatments in a WWTP but at a lower rate than laboratory studies have illustrated. 451
452
Acknowledgements 453
This study was supported by DC Water and Sewer Authority (DCWater), Washington DC. The 454
authors also wish to acknowledge the assistance from the WWTP personnel in obtaining the 455
samples and/or providing the information necessary and their valuable comments for this article. 456
Page 23
MANUSCRIP
T
ACCEPTED
ACCEPTED MANUSCRIPT
21
457
REFERENCES 458
459
Ahn, K.C., Zhao, B., Chen, J., Cherednichenko, G., Sanmarti, E., Denison, M.S., Lasley, B., 460
Pessah, I.N., Kültz, D., Chang, D.P.Y., Gee, S.J., Hammock, B.D., 2008. In Vitro Biologic 461
Activities of the Antimicrobials Triclocarban, Its Analogs, and Triclosan in Bioassay 462
Screens: Receptor-Based Bioassay Screens. Environmental Health Perspectives 116 (9), 463
1203–1210. 464
Balmer, M.E., Poiger, T., Droz, C., Romanin, K., Bergqvist, P.-A., Müller, M.D., Buser, H.-R., 465
2004. Occurrence of Methyl Triclosan, a Transformation Product of the Bactericide 466
Triclosan, in Fish from Various Lakes in Switzerland. Environmental Science & Technology 467
38 (2), 390–395. 468
Bester, K., 2003. Triclosan in a sewage treatment process—balances and monitoring data. Water 469
Research 37 (16), 3891–3896. 470
Bester, K., 2005. Fate of Triclosan and Triclosan-Methyl in Sewage TreatmentPlants and Surface 471
Waters. Archives of Environmental Contamination and Toxicology 49 (1), 9–17. 472
Binelli, A., Cogni, D., Parolini, M., Riva, C., Provini, A., 2009. In vivo experiments for the 473
evaluation of genotoxic and cytotoxic effects of Triclosan in Zebra mussel hemocytes. 474
Aquatic Toxicology 91 (3), 238–244. 475
Boehmer, W., Ruedel, H., Wenzel, A., Schroeter-Kermani, C., 2004. Retrospective monitoring 476
of triclosan and methyl-triclosan in fish: results from the German environmental specimen 477
bank. Organohalogen Compounds 66, 1516–1521. 478
Chen, J., Ahn, K.C., Gee, N.A., Ahmed, M.I., Duleba, A.J., Zhao, L., Gee, S.J., Hammock, B.D., 479
Page 24
MANUSCRIP
T
ACCEPTED
ACCEPTED MANUSCRIPT
22
Lasley, B.L., 2008. Triclocarban Enhances Testosterone Action: A New Type of Endocrine 480
Disruptor? Endocrinology 149 (3), 1173–1179. 481
Chen, X., Nielsen, J.L., Furgal, K., Liu, Y., Lolas, I.B., Bester, K., 2011. Biodegradation of 482
triclosan and formation of methyl-triclosan in activated sludge under aerobic conditions. 483
Chemosphere 84 (4), 452–456. 484
Clesceri, L.S., Greenberg, A.E., Eaton, A.D., 1999. Standard Methods for Examination of Water 485
and Wastewater. American Public Health Association, American Water Works Association, 486
Water Environment Federation, Washington, DC. 487
Coogan, M.A., Edziyie, R.E., La Point, T.W., Venables, B.J., 2007. Algal bioaccumulation of 488
triclocarban, triclosan, and methyl-triclosan in a North Texas wastewater treatment plant 489
receiving stream. Chemosphere 67 (10), 1911–1918. 490
Crofton, K.M., Paul, K.B., DeVito, M.J., Hedge, J.M., 2007. Short-term in vivo exposure to the 491
water contaminant triclosan: Evidence for disruption of thyroxine. Environmental 492
Toxicology and Pharmacology 24 (2), 194–197. 493
DeLorenzo, M.E., Keller, J.M., Arthur, C.D., Finnegan, M.C., Harper, H.E., Winder, V.L., 494
Zdankiewicz, D.L., 2008. Toxicity of the antimicrobial compound triclosan and formation of 495
the metabolite methyl-triclosan in estuarine systems. Environmental Toxicology 23 (2), 224–496
232. 497
EPA, 1984. Guidelines establishing test procedures for analysis of pollutant under the Clean 498
Water Act; Final rule and interim final rule and proposed rule. Washington, DC. 499
EPA, 2009. Biosolids: targeted national sewage sludge survery report. Overview. U.S. EPA 500
Office of Water. Washington, DC, Washington, DC. 501
Farré, M., Asperger, D., Kantiani, L., González, S., Petrović, M., Barceló, D., 2008. Assessment 502
Page 25
MANUSCRIP
T
ACCEPTED
ACCEPTED MANUSCRIPT
23
of the acute toxicity of triclosan and methyl triclosan in wastewater based on the 503
bioluminescence inhibition of Vibrio fischeri. Analytical and Bioanalytical Chemistry 390 504
(8), 1999–2007. 505
Federle, T.W., Kaiser, S.K., Nuck, B.A., 2002. Fate and effects of triclosan in activated sludge. 506
Environmental Toxicology and Chemistry 21 (7), 1330–1337. 507
Gledhill, W.E., 1975. Biodegradation of 3, 4, 4′-trichlorocarbanilide, TCC®, in sewage and 508
activated sludge. Water Research 9 (7), 649–654. 509
Halden, R.U., Paull, D.H., 2004. Analysis of Triclocarban in Aquatic Samples by Liquid 510
Chromatography Electrospray Ionization Mass Spectrometry. Environmental Science & 511
Technology 38 (18), 4849–4855. 512
Halden, R.U., Paull, D.H., 2005. Co-Occurrence of Triclocarban and Triclosan in U.S. Water 513
Resources. Environmental Science & Technology 39 (6), 1420–1426. 514
Heidler, J., Halden, R.U., 2007. Mass balance assessment of triclosan removal during 515
conventional sewage treatment. Chemosphere 66 (2), 362–369. 516
Heidler, J., Sapkota, A., Halden, R.U., 2006. Partitioning, Persistence, and Accumulation in 517
Digested Sludge of the Topical Antiseptic Triclocarban during Wastewater Treatment. 518
Environmental Science & Technology 40 (11), 3634–3639. 519
Higgins, C.P., Paesani, Z.J., Abbott Chalew, T.E., Halden, R.U., Hundal, L.S., 2011. Persistence 520
of triclocarban and triclosan in soils after land application of biosolids and bioaccumulation 521
in Eisenia foetida. Environmental Toxicology and Chemistry 30 (3), 556–563. 522
Higgins, C.P., Paesani, Z.J., Chalew, T.E.A., Halden, R.U., 2009. Bioaccumulation of 523
triclocarban in Lumbriculus variegatus. Environmental Toxicology and Chemistry 28 (12), 524
2580–2586. 525
Page 26
MANUSCRIP
T
ACCEPTED
ACCEPTED MANUSCRIPT
24
Hinther, A., Bromba, C.M., Wulff, J.E., Helbing, C.C., 2011. Effects of Triclocarban, Triclosan, 526
and Methyl Triclosan on Thyroid Hormone Action and Stress in Frog and Mammalian 527
Culture Systems. Environmental Science & Technology 45 (12), 5395–5402. 528
Kantiani, L., Farré, M., Asperger, D., Rubio, F., González, S., de Alda, M.J.L., Petrović, M., 529
Shelver, W.L., Barceló, D., 2008. Triclosan and methyl-triclosan monitoring study in the 530
northeast of Spain using a magnetic particle enzyme immunoassay and confirmatory analysis 531
by gas chromatography–mass spectrometry. Journal of Hydrology 361 (1-2), 1–9. 532
Kinney, C.A., Furlong, E.T., Kolpin, D.W., Burkhardt, M.R., Zaugg, S.D., Werner, S.L., Bossio, 533
J.P., Benotti, M.J., 2008. Bioaccumulation of Pharmaceuticals and Other Anthropogenic 534
Waste Indicators in Earthworms from Agricultural Soil Amended With Biosolid or Swine 535
Manure. Environmental Science & Technology 42 (6), 1863–1870. 536
Lanxess and Henkel, 2010. Triclocarban (CASRN 101-202) (3,4,4´-trichlorocarbanilide). Safety 537
& Exposure information related to potential designated chemical, Meeting of Scientific 538
Guidance Panel (SGP) Biomonitoring California. Meeting of Scientific Guidance Panel 539
(SGP) Biomonitoring California. Office of Environmental Hazard Assessment (OEHHA), 540
California Environmental Contaminant Biomonitoring Program. 541
http://oehha.ca.gov/multimedia/biomon/pdf/HenkelLANXESSTCCcomments052410.pdf. 542
Lindström, A., Buerge, I.J., Poiger, T., Bergqvist, P.-A., Müller, M.D., Buser, H.-R., 2002. 543
Occurrence and Environmental Behavior of the Bactericide Triclosan and Its Methyl 544
Derivative in Surface Waters and in Wastewater. Environmental Science & Technology 36 545
(11), 2322–2329. 546
Lozano, N., Rice, C.P., Ramirez, M., Torrents, A., 2010. Fate of triclosan in agricultural soils 547
after biosolid applications. Chemosphere 78 (6), 760–766. 548
Page 27
MANUSCRIP
T
ACCEPTED
ACCEPTED MANUSCRIPT
25
Lozano, N., Rice, C.P., Ramirez, M., Torrents, A., 2012. Fate of Triclosan and Methyltriclosan 549
in soil from biosolids application. Environmental Pollution 160 (1), 103–108. 550
McAvoy, D.C., Schatowitz, B., Jacob, M., Hauk, A., Eckhoff, W.S., 2002. Measurement of 551
triclosan in wastewater treatment systems. Environmental Toxicology and Chemistry 21 (7), 552
1323–1329. 553
Miller, T.R., Colquhoun, D.R., Halden, R.U., 2010. Identification of wastewater bacteria 554
involved in the degradation of triclocarban and its non-chlorinated congener. Journal of 555
Hazardous Materials 183 (1-3), 766–772. 556
Sabaliunas, D., Webb, S.F., Hauk, A., Jacob, M., Eckhoff, W.S., 2003. Environmental fate of 557
Triclosan in the River Aire Basin, UK. Water Research 37 (13), 3145–3154. 558
Sánchez-Brunete, C., Miguel, E., Albero, B., Tadeo, J.L., 2010. Determination of triclosan and 559
methyl triclosan in environmental solid samples by matrix solid-phase dispersion and gas 560
chromatography-mass spectrometry. Journal of Separation Science 33 (17-18), 2768–2775. 561
Singer, H., Müller, S., Tixier, C., Pillonel, L., 2002. Triclosan: Occurrence and Fate of a Widely 562
Used Biocide in the Aquatic Environment: Field Measurements in Wastewater Treatment 563
Plants, Surface Waters, and Lake Sediments. Environmental Science & Technology 36 (23), 564
4998–5004. 565
Snyder, E.H., O'Connor, G.A., McAvoy, D.C., 2011. Toxicity and bioaccumulation of biosolids-566
borne triclocarban (TCC) in terrestrial organisms. Chemosphere 82 (3), 460–467. 567
Veldhoen, N., Skirrow, R.C., Osachoff, H., Wigmore, H., Clapson, D.J., Gunderson, M.P., Van 568
Aggelen, G., Helbing, C.C., 2006. The bactericidal agent triclosan modulates thyroid 569
hormone-associated gene expression and disrupts postembryonic anuran development. 570
Aquatic Toxicology 80 (3), 217–227. 571
Page 28
MANUSCRIP
T
ACCEPTED
ACCEPTED MANUSCRIPT
26
Waltman, E.L., Venables, B.J., Waller, W.T., 2006. Triclosan in a north Texas wastewater 572
treatment plant and the influent and effluent of an experimental constructed wetland. 573
Environmental Toxicology and Chemistry 25 (2), 367–372. 574
Wu, C., Spongberg, A.L., Witter, J.D., Fang, M., Czajkowski, K.P., 2010. Uptake of 575
Pharmaceutical and Personal Care Products by Soybean Plants from Soils Applied with 576
Biosolids and Irrigated with Contaminated Water. Environmental Science & Technology 44 577
(16), 6157–6161. 578
Ying, G.-G., Kookana, R.S., 2007. Triclosan in wastewaters and biosolids from Australian 579
wastewater treatment plants. Environment International 33 (2), 199–205. 580
Zorrilla, L.M., Gibson, E.K., Jeffay, S.C., Crofton, K.M., Setzer, W.R., Cooper, R.L., Stoker, 581
T.E., 2008. The Effects of Triclosan on Puberty and Thyroid Hormones in Male Wistar Rats. 582
Toxicological Sciences 107 (1), 56–64. 583
584
Page 29
MANUSCRIP
T
ACCEPTED
ACCEPTED MANUSCRIPT
Table 1. Method detection limit (MDL), Relative Standard Deviation (RSD), Recoveries (Rec) and Quantification Limits (LOQ) calculated with 7 samples (n=7).
TCC TCS MeTCS Sample
MDL ng L-1
RSD %
Rec %
LOQ ng L-1
MDL ng L-1
RSD %
Rec %
LOQ ng L-1
MDL ng L-1
RSD %
Rec %
LOQ ng L-1
Water 1.2 2.8 70.6 ±
2.0 2.4 8.3 16
88.8 ± 14.3
16.6 2.5 7.6 111.6 ±
8.4 5.0
Filter 2.1 11.5 91.5 ±
5.4 4.2 19.4 3.0
99.2 ± 3.0
38.5 2.5 5.2 108.0 ±
5.6 5.0
aSludge 7.9 5.9 92.0 ±
6.8 15.8 13.9 7.0
88.9 ± 2.9
27.8 13.3 9.5 94.8 ±
3.0 26.6
aMDL and LOQ are presented on ng g-1 dry wt
Page 30
MANUSCRIP
T
ACCEPTED
ACCEPTED MANUSCRIPT
Table 2. TCC, TCS and MeTCS isotope-labeled surrogate spiked recoveries in water, TSS and sludge samples. Mean, Standard deviation (SD), Maximum (Max), Minimum (Min) and number of samples (n) are shown. All parameters are in percentage (%) except the number of samples that is absolute value.
Water samples TSS samples (Filters) Sludge samples Parameter
TCC TCS MeTCS TCC TCS MeTCS TCC TCS MeTCS
Mean 41.4 44.6 69.7 70.7 68.0 85.1 63.3 69.1 65.5
SD 18.3 19.0 28.6 22.5 23.3 15.5 19.6 13.3 26.1
Max 79.6 110.0 128.7 109.8 135.4 123.8 99.4 118.0 135.4
Min 16.0 19.0 20.9 23.1 27.3 60.2 21.0 28.9 22.0
n 60 60 45 60 60 45 55 55 52
Page 31
MANUSCRIP
T
ACCEPTED
ACCEPTED MANUSCRIPT
Fig 1. Flow diagram of the WWTP used in this study. Numbers represent the points where the
samples were collected. Black thin arrows show the liquid line and thick black arrows show the
solid or sludge line.
Page 32
MANUSCRIP
T
ACCEPTED
ACCEPTED MANUSCRIPT
1
Fig 2. TCC, TCS and MeTCS concentration in µg L-1 in the liquid-phase (dissolve + particulate)
samples in each treatment. Bars represent the mean ± standard error of 5 sampling events (Mean
± SE; n=5).
Page 33
MANUSCRIP
T
ACCEPTED
ACCEPTED MANUSCRIPT
1
Fig 3. Flow diagram for TCC, TCS and MeTCS loads in liquid-phase (dissolved + TSS) (Kg d-1)
and sludge (solid-phase) (Kg d-1). Each value represents the mean ± standard error of 5 sampling
events (Mean ± SE; n=5). Top value represents TCC; bold middle value represents TCS; bold
and italic bottom value represents MeTCS.
Primary
Treatment
Activated
Sludge
Nitrification-
Denitrification
+
Filtration-
Disinfection1 2 5
6 8
11
3.68 ± 0.37 1.38 ± 0.12
TCC 5.13 ± 0.43 0.94 ± 0.15 0.44 ± 0.08 0.13 ± 0.01
4.15 ± 0.77
1.89 ± 0.20
2 + 7
5.74 ± 0.65 2.31 ± 0.15
TCS 8.41 ± 0.17 2.04 ± 0.59 0.98 ± 0.03 0.24 ± 0.07
5.37 ± 0.97
3.37 ± 0.35
0.025 ± 0.003 0.041 ± 0.005
MeTCS 0.032 ± 0.005 0.017 ± 0.004 0.006 ± 0.001 0.021 ± 0.002
0.058 ± 0.003
0.025 ± 0.004
3
Page 34
MANUSCRIP
T
ACCEPTED
ACCEPTED MANUSCRIPT
S1
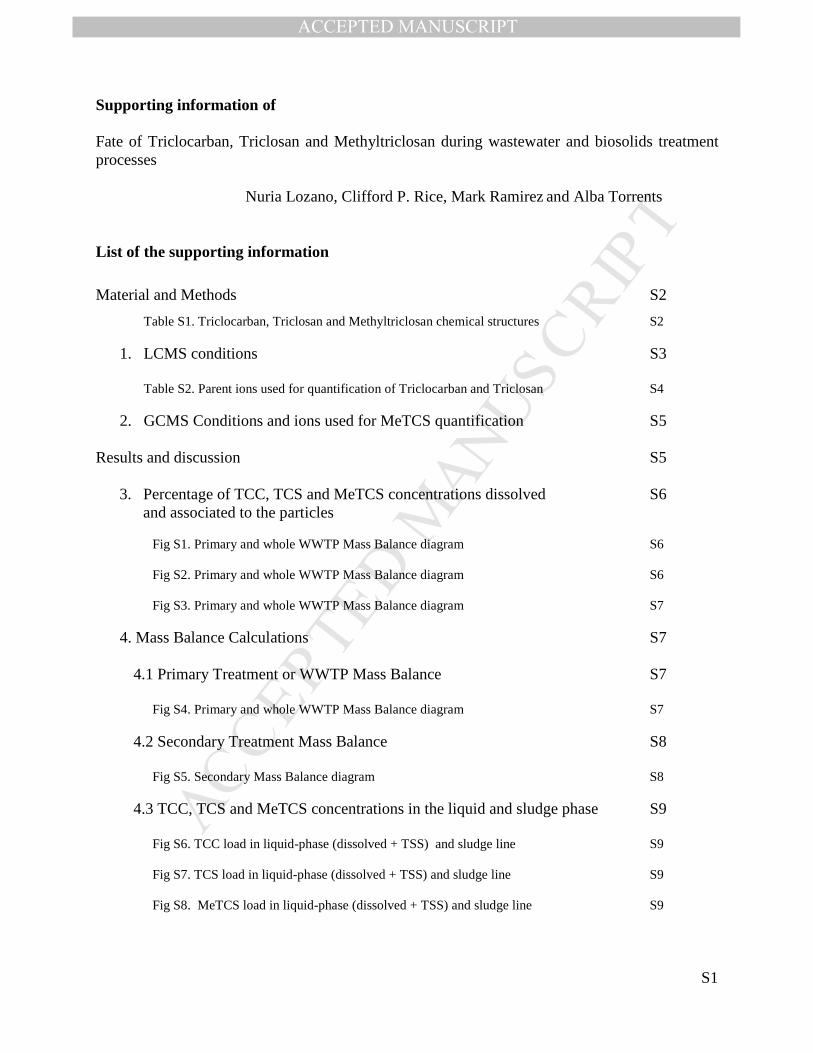
Supporting information of
Fate of Triclocarban, Triclosan and Methyltriclosan during wastewater and biosolids treatment processes
Nuria Lozano, Clifford P. Rice, Mark Ramirez and Alba Torrents
List of the supporting information
Material and Methods S2
Table S1. Triclocarban, Triclosan and Methyltriclosan chemical structures
1. LCMS conditions
S2
S3
Table S2. Parent ions used for quantification of Triclocarban and Triclosan S4
2. GCMS Conditions and ions used for MeTCS quantification S5
Results and discussion S5
3. Percentage of TCC, TCS and MeTCS concentrations dissolved and associated to the particles
S6
Fig S1. Primary and whole WWTP Mass Balance diagram S6
Fig S2. Primary and whole WWTP Mass Balance diagram S6
Fig S3. Primary and whole WWTP Mass Balance diagram S7
4. Mass Balance Calculations
4.1 Primary Treatment or WWTP Mass Balance
Fig S4. Primary and whole WWTP Mass Balance diagram
S7
S7
S7
4.2 Secondary Treatment Mass Balance
Fig S5. Secondary Mass Balance diagram
S8
S8
4.3 TCC, TCS and MeTCS concentrations in the liquid and sludge phase
Fig S6. TCC load in liquid-phase (dissolved + TSS) and sludge line
Fig S7. TCS load in liquid-phase (dissolved + TSS) and sludge line
Fig S8. MeTCS load in liquid-phase (dissolved + TSS) and sludge line
S9
S9 S9 S9
Page 35
MANUSCRIP
T
ACCEPTED
ACCEPTED MANUSCRIPT
S2
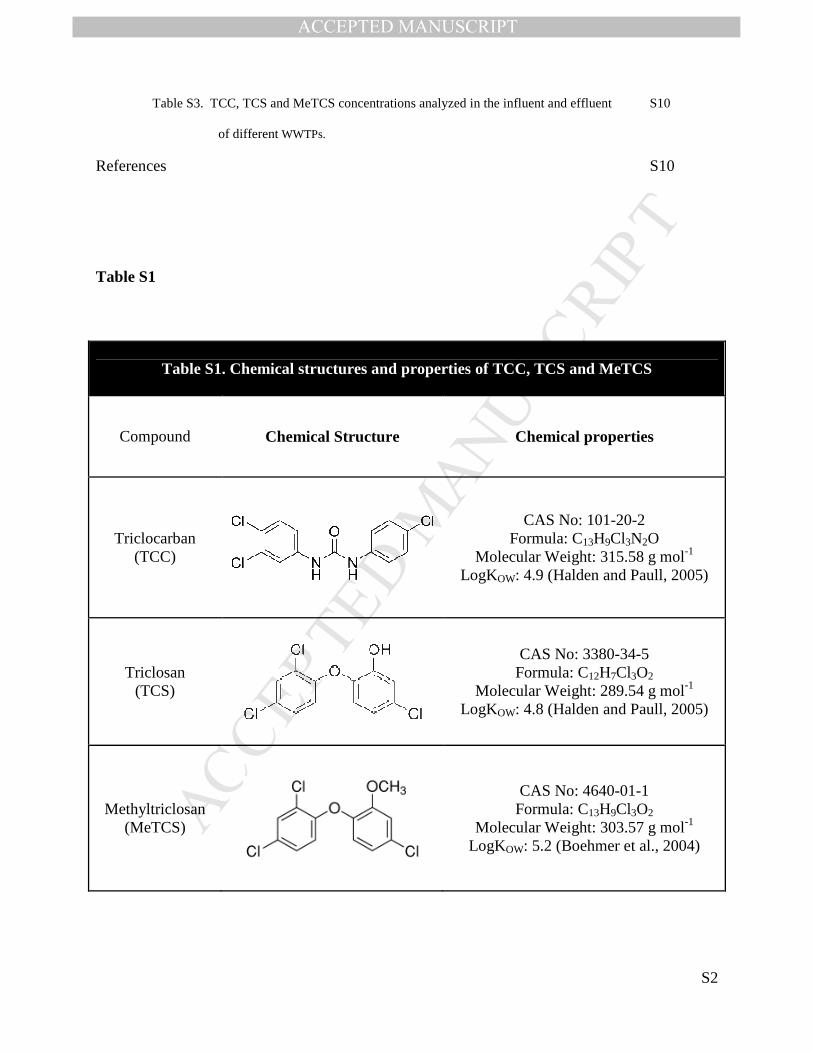
Table S1
Table S1. Chemical structures and properties of TCC, TCS and MeTCS
Compound Chemical Structure Chemical properties
Triclocarban (TCC)
CAS No: 101-20-2 Formula: C13H9Cl3N2O
Molecular Weight: 315.58 g mol-1
LogKOW: 4.9 (Halden and Paull, 2005)
Triclosan (TCS)
CAS No: 3380-34-5 Formula: C12H7Cl3O2
Molecular Weight: 289.54 g mol-1
LogKOW: 4.8 (Halden and Paull, 2005)
Methyltriclosan (MeTCS)
CAS No: 4640-01-1 Formula: C13H9Cl3O2
Molecular Weight: 303.57 g mol-1
LogKOW: 5.2 (Boehmer et al., 2004)
Table S3. TCC, TCS and MeTCS concentrations analyzed in the influent and effluent
of different WWTPs.
S10
References S10
Page 36
MANUSCRIP
T
ACCEPTED
ACCEPTED MANUSCRIPT
S3
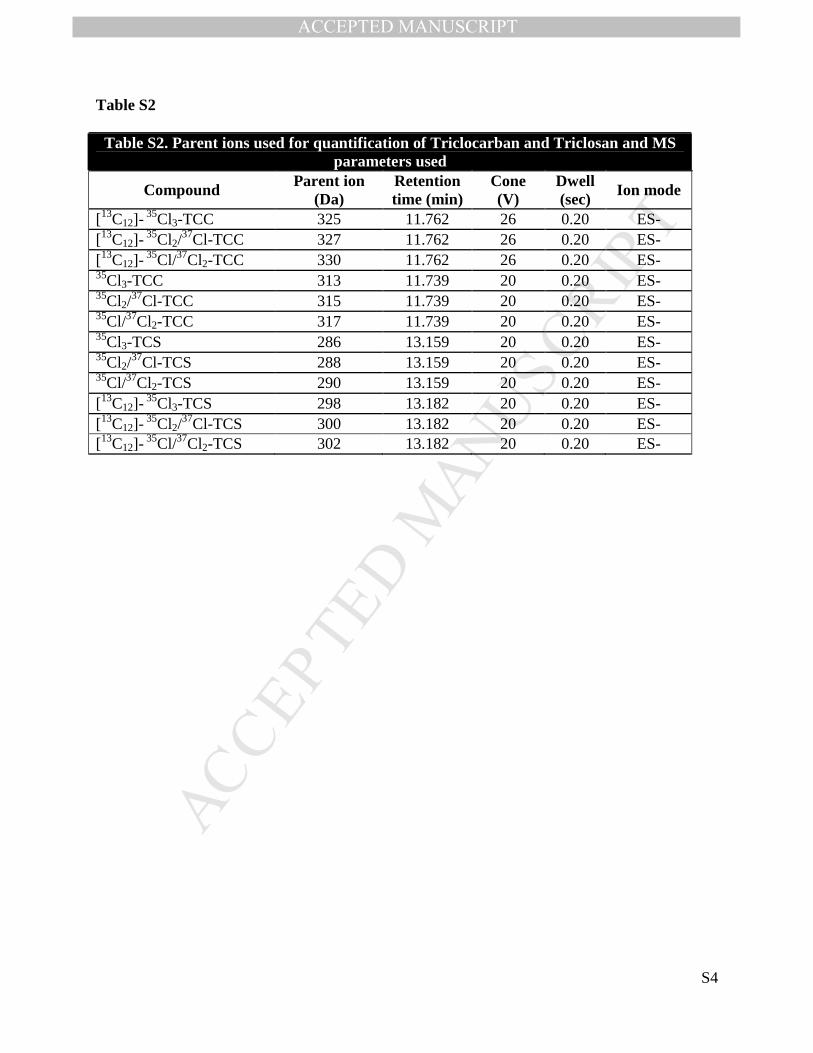
1. LCMS conditions
The LC column temperature was maintained at 50 °C. The initial solvent management was 55%
solvent A (70-1% formic acid:30 methanol) and 45% solvent B (methanol) and these conditions
were changed by linear gradient to 50:50 (A:B) in 15 minutes whereupon the instrument is
returned to initial settings in one minute and maintained there for 4 min for equilibration to the
initial conditions. Total run time was 20 min. The flow rate was maintained at 0.3 ml min-1. The
injection volume was 10 µl. Source parameters were as follow: capillary voltage is set at 2.93
kV; cone voltage at 22 V; extractor voltage is set at 1 V; rf lens at 0.1 V; source and desolvation
temperatures are 140 and 400 °C, respectively. A nitrogen generator is used to supply the
nebulizer and desolvation gas (flow rates were approximately 60 and 600 L h-1, respectively).
Both quadrupoles were set at a resolution of 12.0. Parents ions used for compounds identification
and quantification are listed in table S2 along with the optimum retention times, cone voltages
and dwell times for each mass that was monitored. Analytes concentrations were determined by
isotope dilution methods using 13C12-TCC and 13C12-TCS as an internal standard to quantitate the
unlabelled Triclosan and Triclocarban. Peak integration and quantification was performed
automatically using the MassLynx v4.0 software (Micromass Ltd., Machester, UK).
Page 37
MANUSCRIP
T
ACCEPTED
ACCEPTED MANUSCRIPT
S4
Table S2
Table S2. Parent ions used for quantification of Triclocarban and Triclosan and MS parameters used
Compound Parent ion (Da)
Retention time (min)
Cone (V)
Dwell (sec)
Ion mode
[13C12]- 35Cl3-TCC 325 11.762 26 0.20 ES-
[13C12]- 35Cl2/
37Cl-TCC 327 11.762 26 0.20 ES- [13C12]-
35Cl/37Cl2-TCC 330 11.762 26 0.20 ES- 35Cl3-TCC 313 11.739 20 0.20 ES- 35Cl2/
37Cl-TCC 315 11.739 20 0.20 ES- 35Cl/37Cl2-TCC 317 11.739 20 0.20 ES- 35Cl3-TCS 286 13.159 20 0.20 ES- 35Cl2/
37Cl-TCS 288 13.159 20 0.20 ES- 35Cl/37Cl2-TCS 290 13.159 20 0.20 ES- [13C12]-
35Cl3-TCS 298 13.182 20 0.20 ES- [13C12]-
35Cl2/37Cl-TCS 300 13.182 20 0.20 ES-
[13C12]- 35Cl/37Cl2-TCS 302 13.182 20 0.20 ES-
Page 38
MANUSCRIP
T
ACCEPTED
ACCEPTED MANUSCRIPT
S5
2. GCMS conditions and ions used for MeTCS quantification
GC operating parameters were as follows: helium carrier gas flowing at 1 ml/min through
column, injection inlet temperature was 250 °C, 2 µl of sample was injected at 14 kPa in splitless
mode. The column temperature was programmed as follow: initial setting was 70 °C (held for 5
min), then ramped at different rates as follows: first 20°C/min to 100 °C then 10 °C/min to 160
°C, next 1 °C/min to 169 °C and finally 18 °C/min to 325 °C. The interface to the detector was
280 °C. The ms detector was operated in electron impact ionization mode (EI, 70 eV) with the
ion source temperature at 230 °C. The acquisition mode was single ion monitoring (SIM) and for
quantification, the mass fragment 302.0 and 306.0 was used for MeTCS and 314.0 and 316.0 for
13C12-MeTCS. The analyte concentrations were determined by isotope dilution methods using
13C12-MeTCS as an internal standard to quantitate the unlabelled MethylTriclosan. Peak
integration and quantification was performed automatically using the MSD ChemStation
software (Agilent Technologies).
Page 39
MANUSCRIP
T
ACCEPTED
ACCEPTED MANUSCRIPT
S6
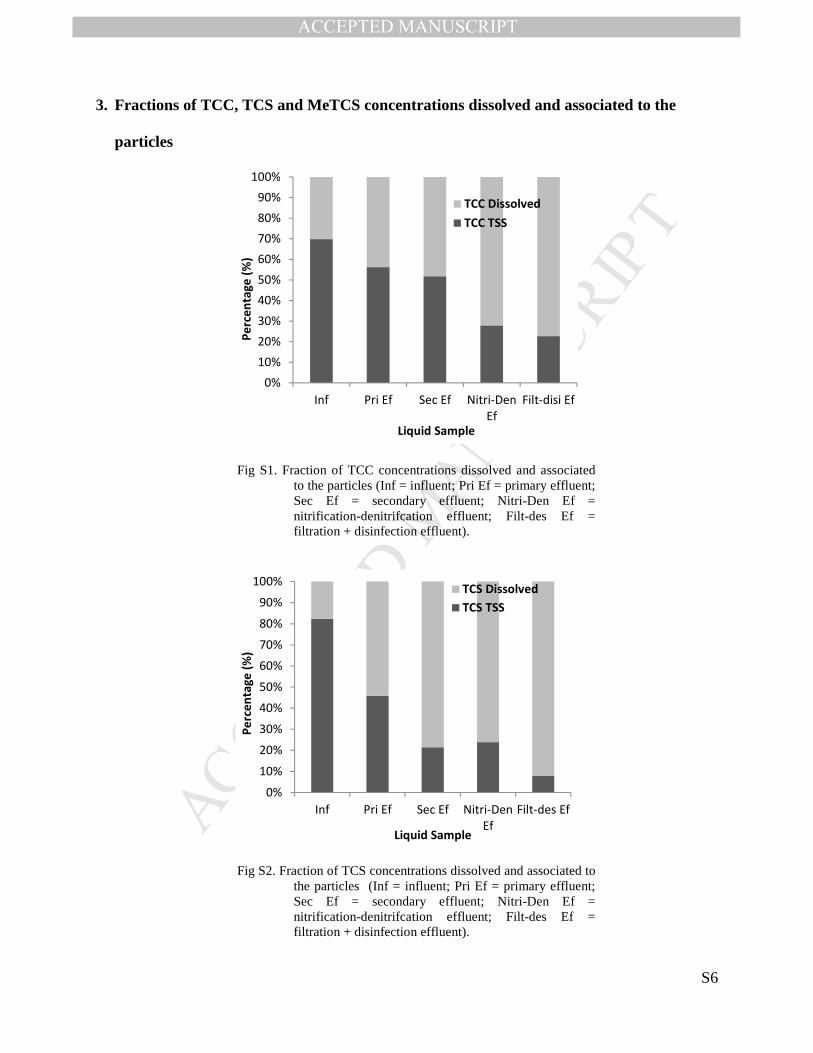
3. Fractions of TCC, TCS and MeTCS concentrations dissolved and associated to the
particles
0%
10%
20%
30%
40%
50%
60%
70%
80%
90%
100%
Inf Pri Ef Sec Ef Nitri-Den
Ef
Filt-disi Ef
Pe
rce
nta
ge
(%
)
Liquid Sample
TCC Dissolved
TCC TSS
Fig S1. Fraction of TCC concentrations dissolved and associated to the particles (Inf = influent; Pri Ef = primary effluent; Sec Ef = secondary effluent; Nitri-Den Ef = nitrification-denitrifcation effluent; Filt-des Ef = filtration + disinfection effluent).
0%
10%
20%
30%
40%
50%
60%
70%
80%
90%
100%
Inf Pri Ef Sec Ef Nitri-Den
Ef
Filt-des Ef
Pe
rce
nta
ge
(%
)
Liquid Sample
TCS Dissolved
TCS TSS
Fig S2. Fraction of TCS concentrations dissolved and associated to the particles (Inf = influent; Pri Ef = primary effluent; Sec Ef = secondary effluent; Nitri-Den Ef = nitrification-denitrifcation effluent; Filt-des Ef = filtration + disinfection effluent).
Page 40
MANUSCRIP
T
ACCEPTED
ACCEPTED MANUSCRIPT
S7
0%
10%
20%
30%
40%
50%
60%
70%
80%
90%
100%
Inf Pri Ef Sec Ef Nitri-Den
Ef
Filt-disi Ef
Pe
rce
nta
ge
(%
)
Liquid Sample
MeTCS Dissolved
MeTCS TSS
Fig S3. Fraction of MeTCS concentrations dissolved and associated to the particles (Inf = influent; Pri Ef = primary effluent; Sec Ef = secondary effluent; Nitri-Den Ef = nitrification-denitrifcation effluent; Filt-des Ef = filtration + disinfection effluent).
4. Mass Balance Calculations
4.1 Primary Treatment or WWTP Mass Balance
Q0 X0 S0 Qe Xe Se
MSCS
Influent Effluent
Sedimentation
Tank
Sludge
Q= Flow rate (m3 d-1); influent (Q0) and effluent (Qe)
S = OC Dissolved (kg m-3); influent (S0) and effluent (Se)
X =OC attached to the solids (kg m-3); influent (X0) and effluent (Xe)
M = Load of the sludge (kg d-1)
C = OC concentration in the sludge (kg kg-1)
1 2 or 5
6 or 11
Fig S4. Primary and whole WWTP Mass Balance diagram. Bold numbers represent the sample number that was collected in the WWTP. OC means organic compound (TCC, TCS or MeTCS).
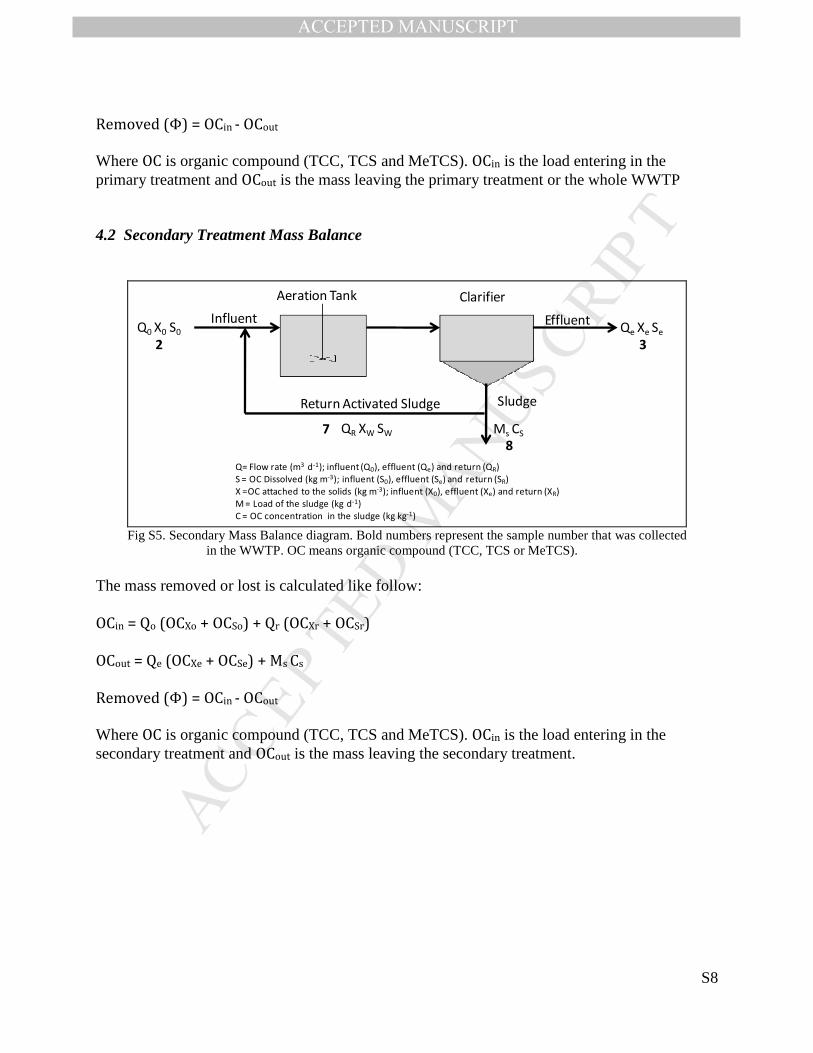
The mass removed or lost is calculated like follow: OCin = Qo (OCXo + OCSo)
OCout = Qe (OCXe + OCSe) + Ms Cs
Page 41
MANUSCRIP
T
ACCEPTED
ACCEPTED MANUSCRIPT
S8
Removed (Φ) = OCin - OCout Where OC is organic compound (TCC, TCS and MeTCS). OCin is the load entering in the primary treatment and OCout is the mass leaving the primary treatment or the whole WWTP 4.2 Secondary Treatment Mass Balance
Influent
Aeration Tank Clarifier
Effluent
SludgeReturn Activated Sludge
Q0 X0 S0 Qe Xe Se
Ms CSQR XW SW
Q= Flow rate (m3 d-1); influent (Q0), effluent (Qe) and return (QR)
S = OC Dissolved (kg m-3); influent (S0), effluent (Se) and return (SR)
X =OC attached to the solids (kg m-3); influent (X0), effluent (Xe) and return (XR)
M = Load of the sludge (kg d-1)
C = OC concentration in the sludge (kg kg-1)
2
7
3
8
Fig S5. Secondary Mass Balance diagram. Bold numbers represent the sample number that was collected
in the WWTP. OC means organic compound (TCC, TCS or MeTCS). The mass removed or lost is calculated like follow: OCin = Qo (OCXo + OCSo) + Qr (OCXr + OCSr)
OCout = Qe (OCXe + OCSe) + Ms Cs
Removed (Φ) = OCin - OCout Where OC is organic compound (TCC, TCS and MeTCS). OCin is the load entering in the secondary treatment and OCout is the mass leaving the secondary treatment.
Page 42
MANUSCRIP
T
ACCEPTED
ACCEPTED MANUSCRIPT
S9
4.3 TCC, TCS and MeTCS concentrations in liquid and sludge phase
Fig S6. TCC load in liquid-phase (dissolved + TSS) (µg L-1) and sludge line (µg g-1 dry wt.) (Mean ± SE; n=5).
Fig S7. TCS load in liquid-phase (dissolved + TSS) (µg L-1) and sludge line (µg g-1 dry wt.) (Mean ± SE; n=5).
Fig S8. MeTCS load in liquid-phase (dissolved + TSS) (µg L-1) and sludge line (µg g-1 dry wt.) (Mean ± SE; n=5).
Page 43
MANUSCRIP
T
ACCEPTED
ACCEPTED MANUSCRIPT
S10
Table S3 Table S3. TCC, TCS and MeTCS concentrations analyzed in the influent and effluent of different WWTPs.
The concentrations are in µg L-1 (NA = not analyzed).
TCC TCS MeTCS Study Country/State/Area
Influent Effluent Influent Effluent Influent Effluent
Present Study Mid Atlantic Region 4.92 ± 0.45
0.12 ± 0.01
8.05 ± 0.21 0.23 ± 0.06 0.03 ± 0.004
0.02 ± 0.002
McAvoy et al., 2002
Ohio NA NA 5.21 - 16.6 0.24 - 2.70 < 0.1 < 0.01
Heidler et al., 2006
Mid Atlantic Region NA NA 4.7 ± 1.6 0.07 ± 0.06 NA NA
Heidler and Halden, 2007
Mid Atlantic Region 6.1 ± 2.00
0.17 ± 0.03
NA NA NA NA
Waltman et al., 2006
North Texas, USA NA NA 7.32 0.11 NA NA
Lindström et al., 2002
Switzerland NA NA 0.58 - 1.30 0.11 - 0.65 <1-4 <2-11
7.50 0.34 Sabaliunas et al., 2003
United Kingdom NA NA 21.9 1.1
NA NA
4.80 ± 0.55 6.20 ± 1.50 < 0.003 < 0.015 Bester, 2005 Germany NA NA
7.30 ± 1.50 0.30 ± 0.10 < 0.002 < 0.008
Kantiani et al., 2008
Spain NA NA 0.23 - 12.5 0.02 - 1.28 0.015 - 0.35
0.015 - 0.03
REFERENCES Bester, K., 2005. Fate of Triclosan and Triclosan-Methyl in Sewage TreatmentPlants and Surface
Waters. Archives of Environmental Contamination and Toxicology 49 (1), 9–17.
Boehmer, W., Ruedel, H., Wenzel, A., Schroeter-Kermani, C., 2004. Retrospective monitoring
of triclosan and methyl-triclosan in fish: results from the German environmental specimen
bank. Organohalogen Compounds 66, 1516–1521.
Halden, R.U., Paull, D.H., 2005. Co-Occurrence of Triclocarban and Triclosan in U.S. Water
Resources. Environmental Science & Technology 39 (6), 1420–1426.
Heidler, J., Halden, R.U., 2007. Mass balance assessment of triclosan removal during
conventional sewage treatment. Chemosphere 66 (2), 362–369.
Page 44
MANUSCRIP
T
ACCEPTED
ACCEPTED MANUSCRIPT
S11
Heidler, J., Sapkota, A., Halden, R.U., 2006. Partitioning, Persistence, and Accumulation in
Digested Sludge of the Topical Antiseptic Triclocarban during Wastewater Treatment.
Environmental Science & Technology 40 (11), 3634–3639.
Kantiani, L., Farré, M., Asperger, D., Rubio, F., González, S., de Alda, M.J.L., Petrović, M.,
Shelver, W.L., Barceló, D., 2008. Triclosan and methyl-triclosan monitoring study in the
northeast of Spain using a magnetic particle enzyme immunoassay and confirmatory analysis
by gas chromatography–mass spectrometry. Journal of Hydrology 361 (1-2), 1–9.
Lindström, A., Buerge, I.J., Poiger, T., Bergqvist, P.-A., Müller, M.D., Buser, H.-R., 2002.
Occurrence and Environmental Behavior of the Bactericide Triclosan and Its Methyl
Derivative in Surface Waters and in Wastewater. Environmental Science & Technology 36
(11), 2322–2329.
McAvoy, D.C., Schatowitz, B., Jacob, M., Hauk, A., Eckhoff, W.S., 2002. Measurement of
triclosan in wastewater treatment systems. Environmental Toxicology and Chemistry 21 (7),
1323–1329.
Sabaliunas, D., Webb, S.F., Hauk, A., Jacob, M., Eckhoff, W.S., 2003. Environmental fate of
Triclosan in the River Aire Basin, UK. Water Research 37 (13), 3145–3154.
Waltman, E.L., Venables, B.J., Waller, W.T., 2006. Triclosan in a north Texas wastewater
treatment plant and the influent and effluent of an experimental constructed wetland.
Environmental Toxicology and Chemistry 25 (2), 367–372.
Page 45
MANUSCRIP
T
ACCEPTED
ACCEPTED MANUSCRIPT
Table 2. TCC, TCS and MeTCS isotope-labeled surrogate spiked recoveries in water, TSS and sludge samples. Mean, Standard deviation (SD), Maximum (Max), Minimum (Min) and number of samples (n) are shown. All parameters are in percentage (%) except the number of samples that is absolute value.
Water samples TSS samples (Filters) Sludge samples Parameter
TCC TCS MeTCS TCC TCS MeTCS TCC TCS MeTCS
Mean 41.4 44.6 69.7 70.7 68.0 85.1 63.3 69.1 65.5
SD 18.3 19.0 28.6 22.5 23.3 15.5 19.6 13.3 26.1
Max 79.6 110.0 128.7 109.8 135.4 123.8 99.4 118.0 135.4
Min 16.0 19.0 20.9 23.1 27.3 60.2 21.0 28.9 22.0
n 60 60 45 60 60 45 55 55 52