Fathom: A Browser-based Network Measurement Platform Mohan Dhawan * Rutgers University [email protected]Justin Samuel UC Berkeley [email protected]Renata Teixeira ✿ CNRS & UPMC [email protected]Christian Kreibich ICSI & UC San Diego [email protected]Mark Allman ICSI [email protected]Nicholas Weaver ICSI & UC San Diego [email protected]Vern Paxson ICSI & UC Berkeley [email protected]ABSTRACT For analyzing network performance issues, there can be great utility in having the capability to measure directly from the perspective of end systems. Because end systems do not provide any external pro- gramming interface to measurement functionality, obtaining this capability today generally requires installing a custom executable on the system, which can prove prohibitively expensive. In this work we leverage the ubiquity of web browsers to demonstrate the possibilities of browsers themselves offering such a programmable environment. We present Fathom, a Firefox extension that imple- ments a number of measurement primitives that enable websites or other parties to program network measurements using JavaScript. Fathom is lightweight, imposing < 3.2% overhead in page load times for popular web pages, and often provides 1 ms timestamp accuracy. We demonstrate Fathom’s utility with three case studies: providing a JavaScript version of the Netalyzr network characteri- zation tool, debugging web access failures, and enabling web sites to diagnose performance problems of their clients. Categories and Subject Descriptors C.2.0 [Computer-Communication Networks]: General; C.4 [Performance of Systems]: Measurement techniques; D.2.8 [Software Engineering]: Metrics—performance measures General Terms Design, Measurement, Performance, Security Keywords Network troubleshooting, network performance, end-host network measurement, web browser, browser extension * This work was done while the author was visiting ICSI. ✿ This work was done while the author was visiting UC Berkeley & ICSI. Permission to make digital or hard copies of all or part of this work for personal or classroom use is granted without fee provided that copies are not made or distributed for profit or commercial advantage and that copies bear this notice and the full citation on the first page. To copy otherwise, to republish, to post on servers or to redistribute to lists, requires prior specific permission and/or a fee. IMC’12, November 14–16, 2012, Boston, Massachusetts, USA. Copyright 2012 ACM 978-1-4503-XXXX-X/12/11 ...$15.00. 1 Introduction Network measurements from the perspective of end systems often play a vital role both for researchers who want to develop general insight into how the Internet functions, and for practitioners aim- ing to diagnose individual performance issues. To gain insight into network operation, researchers traditionally either (i) beg acquain- tances to install a custom measurement tool, or (ii) use or instan- tiate infrastructure to conduct the measurements (e.g., PlanetLab). Neither of these options scales to supporting broad measurement of the network’s edge, limiting the scope of the insight we can ob- tain. Practitioners, on the other hand, have less interest in develop- ing general knowledge about networked systems and more interest in understanding the performance of their own systems, including understanding why their users experience suboptimal performance. While systems developed by the research community for general measurement may aid practitioners in small ways, these systems do not run on regular users’ end systems and hence do not offer help with specific measurement or debugging of user problems. While researchers and practitioners come to the need for mea- surement of user end systems from opposite ends of the spectrum— i.e., one looking for broad, general results, and the other seek- ing specific information—both find obtaining such measurements problematic due to the lack of general support in end systems. While getting users to install programs can suffice for particular, limited situations, the approach does not scale up: one cannot rely upon users repeatedly conducting such installations as a building block for facilitating measurement. One difficulty in this regard concerns users not wanting to continually undergo the hassle of the process. Another difficulty is the challenge that implementors face in developing portable executables that run correctly across a wide range of system configurations. A third issue is one of safety: such installations, whether for standalone binaries or native code that extends an existing system, generally require privileged access and trust in the behavior of the introduced program. In this work we aim to overcome these difficulties by minimiz- ing the impediments to writing and installing measurement pro- grams across a large number of end systems. Our vehicle for do- ing so is Fathom, a browser-based extensible measurement plat- form. Fathom provides a measurement-oriented API that standard JavaScript loaded from any web page can tap into to facilitate em- pirical observation. We argue that building a measurement platform into the web browser hits a sweet spot for both deployability and flexibility, thus providing Fathom with the potential to flourish where other mea-
Transcript
Fathom: A Browser-based Network Measurement Platform
ABSTRACTFor analyzing network performance issues, there can be great utilityin having the capability to measure directly from the perspective ofend systems. Because end systems do not provide any external pro-gramming interface to measurement functionality, obtaining thiscapability today generally requires installing a custom executableon the system, which can prove prohibitively expensive. In thiswork we leverage the ubiquity of web browsers to demonstrate thepossibilities of browsers themselves offering such a programmableenvironment. We present Fathom, a Firefox extension that imple-ments a number of measurement primitives that enable websites orother parties to program network measurements using JavaScript.Fathom is lightweight, imposing < 3.2% overhead in page loadtimes for popular web pages, and often provides 1 ms timestampaccuracy. We demonstrate Fathom’s utility with three case studies:providing a JavaScript version of the Netalyzr network characteri-zation tool, debugging web access failures, and enabling web sitesto diagnose performance problems of their clients.
Categories and Subject DescriptorsC.2.0 [Computer-Communication Networks]: General; C.4[Performance of Systems]: Measurement techniques; D.2.8[Software Engineering]: Metrics—performance measures
General TermsDesign, Measurement, Performance, Security
KeywordsNetwork troubleshooting, network performance, end-host networkmeasurement, web browser, browser extension
∗This work was done while the author was visiting ICSI._This work was done while the author was visiting UC Berkeley& ICSI.
Permission to make digital or hard copies of all or part of this work forpersonal or classroom use is granted without fee provided that copies arenot made or distributed for profit or commercial advantage and that copiesbear this notice and the full citation on the first page. To copy otherwise, torepublish, to post on servers or to redistribute to lists, requires prior specificpermission and/or a fee.IMC’12, November 14–16, 2012, Boston, Massachusetts, USA.Copyright 2012 ACM 978-1-4503-XXXX-X/12/11 ...$15.00.
1 IntroductionNetwork measurements from the perspective of end systems oftenplay a vital role both for researchers who want to develop generalinsight into how the Internet functions, and for practitioners aim-ing to diagnose individual performance issues. To gain insight intonetwork operation, researchers traditionally either (i) beg acquain-tances to install a custom measurement tool, or (ii) use or instan-tiate infrastructure to conduct the measurements (e.g., PlanetLab).Neither of these options scales to supporting broad measurementof the network’s edge, limiting the scope of the insight we can ob-tain. Practitioners, on the other hand, have less interest in develop-ing general knowledge about networked systems and more interestin understanding the performance of their own systems, includingunderstanding why their users experience suboptimal performance.While systems developed by the research community for generalmeasurement may aid practitioners in small ways, these systemsdo not run on regular users’ end systems and hence do not offerhelp with specific measurement or debugging of user problems.
While researchers and practitioners come to the need for mea-surement of user end systems from opposite ends of the spectrum—i.e., one looking for broad, general results, and the other seek-ing specific information—both find obtaining such measurementsproblematic due to the lack of general support in end systems.While getting users to install programs can suffice for particular,limited situations, the approach does not scale up: one cannot relyupon users repeatedly conducting such installations as a buildingblock for facilitating measurement. One difficulty in this regardconcerns users not wanting to continually undergo the hassle of theprocess. Another difficulty is the challenge that implementors facein developing portable executables that run correctly across a widerange of system configurations. A third issue is one of safety: suchinstallations, whether for standalone binaries or native code thatextends an existing system, generally require privileged access andtrust in the behavior of the introduced program.
In this work we aim to overcome these difficulties by minimiz-ing the impediments to writing and installing measurement pro-grams across a large number of end systems. Our vehicle for do-ing so is Fathom, a browser-based extensible measurement plat-form. Fathom provides a measurement-oriented API that standardJavaScript loaded from any web page can tap into to facilitate em-pirical observation.
We argue that building a measurement platform into the webbrowser hits a sweet spot for both deployability and flexibility, thusproviding Fathom with the potential to flourish where other mea-
surement systems have floundered. The ubiquity of web browsers,and the central role they play for a vast array of disparate networkactivities, provide an unparalleled scaling potential that holds greatpromise for benefiting common measurement and troubleshootingscenarios (§ 2). Like other measurement platforms, Fathom re-quires users to install a piece of software, a step that generallypresents a significant hurdle to widespread adoption. However, theuser only has to do so once to enable a vast range of measure-ments. By bundling useful Fathom applications with the platformitself (most notably, a connectivity debugger that works even incomplete absence of connectivity), we provide users an immediateincentive for installation.
We begin by framing desiderata for a browser-based measure-ment platform (§ 3), which guide both Fathom’s design and its im-plementation. Our design (§ 4) includes a set of APIs covering awide range of measurement and troubleshooting applications, sig-nificantly expanding the capabilities of in-page JavaScript code. Toensure safety, we equip Fathom with a security model that balancesuser approval, permission management, and code-signing (§ 4.2and § 4.3). Consideration of possible implementation strategiesmotivates our decision to implement Fathom as a JavaScript-onlyextension for the Firefox browser, paying close attention to theconstraints imposed by modern-day browser environments (§ 5).We demonstrate that careful design of a JavaScript-driven mea-surement platform enables experimenters to conduct measurementswith modest overhead for the user (§ 6.1) and high accuracy (§ 6.2).We report on additional experiences gained using Fathom in threedifferent use cases (§ 7). We discuss portability and adoption in-centives (§ 8), and close with a survey of related browser extensionwork and measurement platforms (§ 9).Contributions: Fathom explores the feasibility of building ageneric network measurement and troubleshooting platform intomodern browsers. We view our contribution as developing a re-alization of broad capability that the community has been workingtowards for a number of years. Fathom builds on the lessons ofprevious efforts and reflects a promising, practical approach that (i)fosters innovation via open-endedness, as opposed to implement-ing a particular tool; (ii) provides unparalleled access to the edgevia the ubiquity of browsers; (iii) enables novel analyses supportedvia passive collection of context and active experimentation; (iv)combines existing security primitives in a novel way to safely ex-pand in-page JavaScript capabilities.
Fathom is open source and we invite interested readers tovisit http://fathom.icsi.berkeley.edu to downloadthe platform and provide feedback.
2 Motivating ScenariosWe begin by sketching examples of measurement efforts that bene-fit from both an end system vantage point and a large footprint. Thelist here is far from exhaustive; our design is general, and henceadaptable to a range of other tasks, too.Web performance debugging: With a browser-based vantagepoint website operators can significantly improve their ability todiagnose slow load times. Along those lines, Google’s analyticscode recently started collecting basic page rendering times [24].This captures facts, but cannot provide troubleshooting assistance,for which page authors currently lack critical information. Theweb pages’ isolation from the host system here works against thedeveloper, preventing access to helpful indicators such as systemload and I/O characteristics. For example, the Google Maps fo-rum [19] shows discussions whereby Google engineers explicitlyask users to quantify the “slowness” of page loads, including an-cillary system-level information such as CPU and network activity.
By allowing Google engineers access to a measurement platformin the user’s browser they could directly extract the required in-formation. Researchers can also leverage this capability to betterunderstand web performance and complexity (e.g., [7, 10]) both atscale and across sites.Web access failures: Similar to the performance debugging case,a browser-based platform can also directly assist users in diagnos-ing website failures. In this scenario, the browser could provide a“diagnose” button that launches measurements to identify commoncauses of access failures (e.g., loss of connectivity or DNS issues).While web failures have been studied in a passive fashion [1, 42],giving users a way to conduct real-time assessment offers the po-tential to both (i) better diagnose the problem with contemporane-ous active measurements and (ii) inform users what might be doneto fix the problem (or at least who to ask to fix the problem).Local network debugging: Poor performance can also stem fromissues in the local network and hence combining external- andlocal-network measurements can help pinpoint the location of theproblem [10]. Further, when multiple local systems use the mea-surement platform we can discover this—e.g., using multicast DNSor UPnP—and coordinate the vantage points for a richer analysisof the failure.ISP performance: A wide range of tools perform active measure-ments from end systems to a controlled server, including speedtests [4], general performance diagnostics [20, 28, 31], traffic tam-pering [46], and traffic shaping detectors [12, 25]. While each ofthese tools performs custom tests, they share the basic need to con-duct active probing from end systems.Large-scale topology mapping: Many efforts within the researchcommunity over the years have tried to understand the Internet’stopology by conducting traceroute(-like) measurements from mul-tiple vantage points [8, 44, 47]. A browser-based platform wouldfacilitate such studies from a breadth of vantage points currentlynot practical.
3 Platform Design GoalsWe identify the broad design goals for an end-system based mea-surement platform as follows:Rich measurement capabilities: The examples in § 2 show thatwe require support for both passive and active observations. Pas-sive measurements provide precise and continuous understandingof the activity in the browser, ranging from system-level infor-mation such as CPU load, memory availability, and traffic load,to browser-level activity such as HTTP session tracking and fine-grained page-level activity (e.g., DOM1 updates and event loop ac-tivity). Note that this enables far broader analyses than availableto in-browser JavaScript debuggers (e.g., Firebug). While networkproblems may often manifest in passive measurements, their rootcause frequently reveals itself only using active probing. We there-fore require a wide range of network I/O primitives, reaching as fardown in the networking stack as feasible.Extensibility: As sketched in § 2, we strive for a general measure-ment facility rather than providing a simple interface to ready-mademeasurements. Therefore, instead of providing APIs for specificmeasurements, the platform should provide APIs that support theimplementation of as wide an array of measurements as possible.Security and privacy: While Fathom strives to maximize utility topractitioners and experimenters, the platform must not compromisethe privacy of the user (e.g., expose browsing history). Addition-
1Document Object Model, a browser-independent tree abstractionrepresenting a web page.
(1) var fathom = window.fathom;(2) var DATA = "Hello world";(3) var ADDR = "226.0.0.2", PORT = 23456;
(4) fathom.socket.multicast.open(socketCB);
(5) function socketCB(sock) {(6) if (sock && !sock[’error’]) {(7) fathom.socket.multicast.send(sendCB,
sock, DATA, ADDR, PORT);(8) }(9) }
(10) function sendCB(result) { ... }
Figure 1: Asynchronous multicast network output in Fathom.
ally, the platform must not allow for the abuse of host or networkresources.Measurement accuracy: We require the measurement platform toaccurately track time and the outcome of network I/O events. Pre-cise timing supports the ability to both understand when an eventhappened and to schedule future events.Low system overhead: We desire the platform’s runtime overheadto be as low as possible for two reasons: (i) high overhead canalter test results for intensive experiments (e.g., bandwidth mea-surements) and (ii) the platform resides in a user’s application andhence we do not want to unduly impact the user’s browsing activity.Portability: Measurement code should work portably on any im-plementation of the platform. This implies that measurement codeshould execute without requiring compilation to different executionenvironments.
Fathom’s design (§ 4) addresses the first three goals and its im-plementation (§ 5) the remaining goals.
4 FathomWe design Fathom to provide a rich set of APIs for measure-ments. Since Fathom significantly expands the capabilities of in-page JavaScript code, it requires a carefully thought-out securityand privacy model.
4.1 API design
Fathom’s APIs remain conceptually independent of the underly-ing platform implementation and cover a broad range of networkI/O capabilities as well as means to obtain system information andhistorical performance baselines. Our case studies (§ 7) and devel-opment experience drove the design.
To make its services available to in-page JavaScript code,Fathom creates a new JavaScript object, registers its APIs as meth-ods on this object as requested by the measurement code (see § 4.3),and adds it to the page’s window object as window.fathom.Web application code can invoke these APIs to perform both pas-sive and active measurements on the end system. To do so, thecaller provides a callback function which Fathom will invoke whenthe result of the call becomes available. This approach providesnatural asynchronicity in the presence of potentially blocking net-work I/O. Fathom passes a single object to the callbacks. A setof properties on the object conveys error codes and return values.Figure 1 shows an example of sending data over a multicast socket.Fathom currently provides four main API families (listed in Ta-ble 1):fathom.socket provides socket management. These func-
tions export low-level socket functionality and serve as the basisfor active measurements, including opening TCP and UDP sock-ets, setting socket options, and performing both blocking and non-blocking I/O operations.
fathom.proto supplies clients and servers for commonapplication-layer protocols including DNS, multicast DNS, HTTP,and UPnP.fathom.system realizes controlled access to system-
provided tools and information to invoke select services on thehost that can provide information otherwise unavailable or incon-venient to re-implement. Fathom sanitizes the call arguments, han-dles onerous output parsing, and returns results to the caller whileabstracting platform specifics. Examples in this family include thehost’s ping and traceroute implementations. In contrast to otherruntime plugins such as Java (see § 5.1), Fathom’s API never al-lows invocation of arbitrary system commands.
Lastly, fathom.utils collects additional helpful APIs, par-ticularly access to aggregate statistics for passively collecteddata (metrics.*) and configuration settings for the browser(browser.*), such as proxy configuration.fathom.utils.metrics.* performs low-level system
sampling and monitors the browser’s HTTP activity. Fathom cur-rently conducts passive data collection in three domains: each webpage, the browser itself, and the host’s system and network resourceusage. For web pages, collection includes socket connection times,DNS resolution times, HTTP response times and goodput, as wellas the trigger times for DOMContentLoaded and Load pageevents.2 From the browser, it collects its overall memory use aswell as network transmission statistics. Finally, from the host sys-tem it collects CPU load, memory use and availability, per-processload, and network interface statistics including packet/byte coun-ters, transmission errors, and—for wireless links—signal strengthand noise levels. Per-page CPU load proves tricky to measure.Fathom can expose any browser specific performance measurementAPI [37] to web pages to measure JavaScript overhead, but authorswould still need to instrument their code for reliable profiling. Fur-thermore, the CPU load induced by active embedded objects suchas Flash manifests outside of the browser.
Fathom keeps a history of these metrics to provide baseline per-formance metrics for the pages. JavaScript code using Fathomcan then obtain aggregate statistics of these data points in orderto diagnose detected anomalies in the document loading process.Fathom stores browser and system metrics in client-side persistentstorage, while the web page metrics end up in the site’s HTML5localStorage facility. This separation of storage for the base-line metrics enables websites to selectively retain or discard col-lected datasets for individual browsing sessions, reduces Fathom’spersistent storage requirements, and minimizes information leak-age across different origins.
Since Fathom monitors the browser’s entire HTTP activity, webpages not requiring Fathom’s capabilities will also incur an over-head in page load times. To exclude any added overhead, we pro-pose that sites that require Fathom’s diagnostic capabilities couldexplicitly request them. To signal to the server that the client sup-ports Fathom, Fathom adds an X-Fathom header in the HTTP re-quest for each page. Web sites that wish to enable diagnostic mea-surements for the page and its additional resources echo this headerin their response. Via local browser configuration the user can re-quest passive data collection for sites as needed.Comparison: Flash and Java constitute the main competitors toFathom, so it behooves us to compare their capabilities directly.Fathom’s network I/O capabilities subsume Flash’s, with the ex-ception of the latter’s built-in multimedia streaming capabilities.
2When downloading a page’s DOM has finished, the browser trig-gers a DOMContentLoaded event. When the page’s additionalcomponents (such as images) have finished downloading as well,the browser triggers a Load event.
fathom.utils.browser.* G#6 G#6 G#6 Ufathom.utils.timer.* –fathom.utils.metrics.* # # # U
JavaScript & DOM access G#7 G#8 –
1 Given signed code and trust confirmed bythe user, i.e., unconstrained host access withuser-level privileges.
2 No support for listening sockets.3 For listening sockets.4 If implemented by the experimenter.5 By directly calling system binaries in OS-
specific locations.6 Implicitly or partially; for example, XML-
HttpRequest connections transparentlyinherit browser proxy settings. In Flash,socket connections do not inherit, others do.
7 By abusing the getURL function; no accessto return values.
8 JavaScript–Java interaction via LiveConnect;details depend on platform and implementa-tion.
Table 1: Primary Fathom namespaces and APIs. Due to lack of space, we show select individual functions only for the systemfamily of calls, given its diversity. The final column indicates input mechanisms required by the default client policy (see § 4.3):“U” symbolizes that a capability requires user input, “SM→U” means that server manifests suffice to permit the capability whiletheir absence necessitates user input, and “–” indicates permission without additional confirmation. Fathom by design provides fullaccess to JavaScript functions and the DOM without the need of an additional API; we include the ability here to compare to otherplatforms.
In particular, Fathom supports listening sockets, UDP, protocol-specific APIs, as well as controlled access to host commands andhistorical performance baselines. With Java, the situation dependson the execution context: without host-specific customization, un-trusted applets only allow a limited set of network I/O APIs andrequire communication with the applet’s origin server. As pointedout in § 5.1, signed and trusted applets (as well as Java applica-tions) provide an over-privileged environment that supports all ofFathom’s capabilities, without abstracting from platform specificsand without reliable DOM interaction. Table 1 summarizes the re-spective capabilities.
4.2 Privacy
Our first goal is to ensure Fathom does not allow measurements toexfiltrate sensitive information from a user’s browser or host. Todo so, Fathom’s design mandates that its network I/O stack oper-ates independently of the browser’s stack. Hence, any state thebrowser would normally associate with a connection is unavail-able to Fathom. For example, when Fathom script code runningin a web page from site a.com issues HTTP connections to siteb.com, such connections do not transmit current session cook-ies for b.com even though the user might currently be logged into that site in a separate tab. This mechanism effectively defeatsclassic attacks leveraging same-origin violations, such as cross-site scripting (XSS) or cross-site request forgery (CSRF). Like anyJavaScript code, Fathom scripts can only access host-local state (in-cluding cookies) for the site the script originated from (a.com, inthis case).
By providing websites with the ability to collect additionalclient-side data in the form of both active and passive measure-ments, Fathom increases the ability for websites to fingerprintvisitors [15]. In addition, clients using anonymizing proxies ex-pose themselves to additional de-anonymization risks due to webpages having access to TCP and UDP sockets that can bypass thebrowser’s proxy settings, as well as communicating with local net-
work services (such as the local DNS resolver) that may exposeidentifying information. Current tools for obtaining anonymityor resisting fingerprinting try to automate disabling or changingsensitive browser functionality [45], but require vigilance on theuser’s part. Thus, it seems reasonable to expect developers of suchtechnologies (or users employing it) to consider disabling Fathomas needed. Additionally, when the browser has a proxy setup,Fathom’s default policy (see below) could disallow active measure-ment except through the proxy or by explicit agreement of the user.Doing so would also reduce the chances of fingerprinting througharbitrary active communication.
The storage of local data about a user’s browsing history isanother important privacy concern. Most popular browsers haveadopted private browsing modes that, when enabled, aim to elimi-nate the local storage of information that could later reveal a user’sbrowsing history [2]. Additionally, users expect that “clearing theirhistory” removes all data the browser keeps that one could use toinfer their history—behavior that Fathom conforms with.
4.3 Security
We next discuss Fathom’s model for controlling scripts such thatthe platform has adequate protection against facilitating active at-tacks. We note that in the limit any communication we allowcan become part of a distributed attack, but the same applies tobrowsers without Fathom [29, 50]. We strive to provide enoughcontrol that Fathom does not exacerbate the situation significantly.In our present design, Fathom sets its security posture for a givenscript based on the following inputs:I.1: Client Policy. Once users have installed Fathom, they maytune the client policy by customizing a general local security pol-icy that comes with Fathom. This policy specifies the conditionsunder which Fathom makes API calls available to scripts. Forgroups of APIs, the policy defines which destinations they mayaccess, whether they require permission to execute, and the formof that permission. Permission forms include user confirmation,
Resource Schema Descriptionhttp://*.google.com:* fathom.http.*APIs may contact
any *.google.com name on arbitraryports
*://{upnp}:* any API can contact hosts found viafathom.upnp.* calls
udp://10.1/16:53,5353 fathom.udp.* APIs may contacthosts within 10.1/16 on the DNS andmDNS ports
Table 2: Example resource schemas in Fathom script manifests.
script manifests, and code signing, with multiple forms possible inorder to indicate priorities. Users can adjust this policy at any time.Table 1 shows the default policies for the various API groups.I.2: User Confirmation. Fathom can directly ask users whetherit should allow some activity at script run time. We do not con-sider this a particularly appealing mechanism because (i) framingquestions in a way users will understand is challenging, and (ii)a system that overly interferes with a user’s workflow may leadusers to disable Fathom, or train them to grant permission requestsblindly [16]. (Note that Fathom’s status icon in the browser’s tool-bar always indicates to the user when a web page employs FathomAPIs.)I.3: Script Manifests. Each Fathom script includes a script mani-fest that succinctly declares desired resources. Fathom ensures thatin-page JavaScript code can only access resources declared in themanifest, subject to the effective client policy. Currently, these re-sources include Fathom APIs and active measurement targets. APIsand their permissible targets get expressed in tandem in resourceschemas of the following form:
[API _subset ] : //[destinations] : [ports]
A resource schema requests access to certain destinations andports for a subset of the Fathom API. Similar to import state-ments in other languages, Fathom supports API aggregation, al-lowing authors to request access to specific functions (e.g., tofathom.proto.dns.query()) or to all routines in a fam-ily (e.g., fathom.proto.dns.*). Destinations come in threeforms: (i) domains with wildcarding (such as *.a.com), (ii) IPaddress ranges (e.g., 192.168/16), and (iii) derived IP addresses(e.g., {upnp}), covering cases where one Fathom API returns anaddress that the author wants to subsequently pass to another API,but which the script author cannot specify in advance.3 Table 2shows examples of Fathom resource schemas.
Fathom enforces resource schemas by initially only making asingle API function available: fathom.init(). This func-tion receives the script manifest (in JSON form), and subsequentlyhooks only the requested APIs into the window.fathom object.Scripts thus have no way to access APIs they did not request.I.4: Server Manifests. In addition to script manifests, we allowtargets to explicitly control permissible incoming traffic via servermanifests. These manifests reside at a well-known location on webservers, currently /fathom.json. Server manifests can whitelistconnectivity for scripts originating from specific domains or IP ad-dresses. Users can configure their client policy to allow APIs toproceed without prompting whenever server manifests permit inter-
3For example, UPnP’s discovery phase produces IP addresses towhich the script may want to connect via HTTP in order to retrievea device’s service profile. Resource schemas allow precise expres-sion of such dependencies, in contrast to broad notions such as “lo-cal network.” Fathom tracks hostnames and IP addresses returnedby its APIs.
action with the given destination. This scenario forms the defaultfor most APIs initiating connections.I.5: Code Signing. Finally, experimenters can sign Fathom scriptscryptographically to express authorship. Such signatures providetwo key benefits. First, signatures establish an identity behindFathom code, which allows users to reason about scripts in terms oftheir trust in the author, instead of (or in addition to) making judg-ments based on the resources the script intends to use (API callsand targets). This trust in authorship likely proves easier for non-technical users to understand. Second, signed code allows usersto configure permissions at the granularity of author identities in-stead of script origin. Furthermore, Fathom can identify scripts ab-stractly, across origins, and even when users save Fathom-bearingpages to disk.Examples: With the above inputs Fathom can derive effective poli-cies for each arriving script at run time. For instance, Fathom canlet an arriving script proceed without user prompting if (i) the clientpolicy (I.1) permits execution without prompting for the API re-sources the script requests (via its script manifest, I.3) and (ii) thedesired destination agrees via a server manifest (I.4), given (iii) thisserver manifest actually exists and indeed agrees. In a more simplescenario, if a script bears the signature (I.5) of an author whom theuser added to their local whitelist indicating full trust in the code,then the script will execute without any prompting.
By design, policy inputs can come into conflict. The client policyresolves such cases. Consider a script that declares (via I.3) itsneed to use fathom.socket.tcp.* to open a connection to agiven target that has agreed to such communication (via I.4). If theuser’s client policy (I.1) requests prompting for permission to usefathom.socket.tcp.* then Fathom will prompt the user (viaI.2) before running the code regardless of the server’s consent andany possible signing.
Our hope is that with more extensive experience, a subset of in-puts will emerge that proves sufficient, since fewer mechanismswould simplify explication and maintenance of the security frame-work. Moreover, expanded user experience will allow us to betterunderstand how Fathom’s input mechanisms can accommodate theusers’ potentially limited awareness of the implications of the dif-ferent permission levels.Comparison: Fathom’s security model borrows from the Java andFlash platforms, with careful consideration of current browsers’same-origin policies. Like Java, we employ code signing and pro-vide user consent as a means to enable functionality, but in contrastto Java’s carte blanche permissions after user consent to signedcode (§ 5.1), Fathom retains precise API-level control and allowsneither execution of arbitrary binaries nor file system access. LikeFlash, we employ server manifests to establish an explicit con-sent signal for the Fathom core that permits cross-site connec-tions [33]. Script manifests exist in several technologies, includ-ing Java, Flash, and Android apps, as well as Firefox and Chromeextensions. However, our notion of resource schemas renders re-source control more explicit than any of these technologies.
5 ImplementationWeb browsers are complex systems, hence the design of a browser-based measurement platform requires careful thought. We first dis-cuss the implementation choices within the browser, and then wedescribe our prototype of Fathom, which we implement as a Fire-fox extension.
5.1 Implementation space
To maximize ease of adoption, we would like Fathom to dependon the browser’s architecture as little as possible while still imple-
Rich Accuracy PortabilityTechnology APIs Browser OSStandard JS 7 Low 3 3Extension (JS) 3 Good 7 3Plugin (runtime) 3 High 7 7Plugin (custom) 3 High 7 7Browser 3 High N/A 7
Table 3: Design space for a browser-based platform. Note:the accuracy of JavaScript-based extensions depends upon theunderlying extension API.
menting the design discussed above. In the following, we discussseveral points along this design space. Table 3 summarizes the ca-pabilities of each approach.Standard JavaScript: While it is possible to implement sometypes of measurements in JavaScript (see discussion in § 7.1), thelack of low-level socket interfaces and access to host properties,leaves this approach suboptimal. Additionally, measurement accu-racy would require careful implementation as timer accuracy de-pends heavily on browser architecture and load.Browser extensions: Extensions enhance the functionality of theweb browser and allow implementation of measurement tasks inportable JavaScript, platform-dependent C/C++, or both. TheAPI richness available to JavaScript extensions varies considerablyacross browsers. Those extensions execute with browser privilegesand have access to most system resources, including the networkand file systems, and remain portable across different operating sys-tems for a particular browser. Since most modern browsers compileJavaScript to native code using JIT compilers, extensions do notimpose any significant performance overhead. JavaScript exten-sions present good candidate vehicles for realizing a measurementplatform, assuming sufficient API richness and accuracy. C/C++extensions increase measurement capability at the expense of porta-bility.Runtime plugins: In this category, Java, Flash, and Silverlighttechnologies allow developers to implement experiments and eas-ily distribute them to users who have the required runtime plugininstalled. Indeed, Java is a popular choice for measurement ex-periments due to its rich APIs and performance, but it comes withcrucial shortcomings that largely also apply to the Flash platform.First, Java’s sandboxing keeps execution effectively fully separatefrom the containing web page. By contrast, measurement codethat executes within a web page can directly interact with currentweb applications. Second, the runtimes’ security policies tend toprohibit activities that could aid network measurements (such astraceroute or ping invocations). Java’s code-signing featureprovides a way to work around this limitation: after the user ac-cepts an initial dialog presenting the code author’s identity, evenself-signed applets may access arbitrary runtime APIs and thusbehave like host-native applications with full user privileges, in-cluding permission to create and delete files or contact arbitrarynetwork locations. While no doubt useful in principle, this carteblanche ability far exceeds the permissions required to implementmeasurement and troubleshooting code. Third, the availability ofthe runtime presents a limiting factor, as virtually no modern websites use Java applets.4 Fourth, even when installed, code porta-bility remains uncertain. For example, JavaScript interaction fromplugin code remains highly platform-dependent, and the Androidoperating system supports only an API-limited dialect of Java.4OSX and Windows no longer include a Java runtime by default,while several recent critical security incidents relating to Java [17,26, 35] further erode users’ willingness to install the platform.
Custom plugins: We could develop our own native measurementplugin in C/C++. While enabling great performance and host ac-cess, portable interaction with the browser remains uncertain. Forexample, Microsoft recently dropped support for the cross-browserNPAPI [53] in its browsers. Sandboxing technologies like NaCl[55] and Xax [13] allow the execution of native applications withinthe browser without compromising on performance, but their sand-boxed environment respects the browser’s security policies and dis-ables application code from performing TCP/IP or UDP network-ing, or even local file I/O.Browser changes: One could build the entire platform into anopen-source browser, which would provide ideal feature support.This approach would present a substantial development effort andwould likely find little immediate support from browser vendors.While not immediately feasible, if a general purpose measure-ment platform proves useful—especially to web site operators—thefunctionality could be moved into browsers in the future.
After considering the major browsers and the design spacesketched above, we chose to implement our prototype of Fathomas a JavaScript-only extension for the Firefox browser. Several as-pects informed this choice: (i) Firefox enjoys great popularity andexists on a wide range of different platforms; (ii) its XPCOM inter-face provides a rich API to extensions; (iii) as we describe furtherbelow, this API allows us to perform low-level socket I/O directlyfrom JavaScript. The latter currently sets Firefox apart from otherbrowsers, for which we would need to implement at least parts ofFathom in native code. The extension realizes the design detailsoutlined in § 4 and currently consists of 3,200 lines of JavaScript.
5.2 Firefox’s architectureBefore describing Fathom’s architecture in detail, we briefly ex-plain the major components of the Firefox browser relevant toFathom’s design. Firefox’s DOM subsystem creates an abstractrepresentation of the visited web pages, which the rendering en-gine uses for layout and page imaging. A single, shared JavaScriptengine parses and interprets both web page and extension code, thebrowser’s UI thread. While the browser restricts web page code tostringent security policies, the extension code runs with browser-level privileges. The network engine implements application-layernetwork protocols such as HTTP and FTP. To do this, it employsthe Netscape Portable Runtime (NSPR), Mozilla’s platform-neutralAPI for low-level network I/O and libc-like functions. The XP-COM subsystem implements a number of core architecture facil-ities such as threads and memory management. It also exposesthese features to the JavaScript runtime. Furthermore, it includesjs-ctypes [40], a JavaScript wrapper to the ctypes library, allowingextensions implemented in JavaScript to call functions in shared Clibraries.
5.3 Architectural challengesFirefox’s architecture poses a number of challenges for extensiondevelopment, particularly given the design goals for a networkmonitoring platform as we outlined in § 3.
First, without the js-ctypes wrapper, we could not performsocket-level I/O from JavaScript and would need to resort to nativecode. Even given js-ctypes, implementation of some socket APIsrequires handling platform dependent data types (such as union-based network address structures) which creates a challenge forachieving a truly OS-neutral Fathom. We overcame this problemby providing sufficient padding in the relevant JavaScript datatypesto accommodate varying union sizes on different platforms.
Second, despite low-level socket access, ICMP responses andraw sockets remain unavailable. Thus, Fathom cannot provide ac-cess to packet-level traces, which would be useful for detailed diag-
Fathom Firefox
fathom object& APIs
DOMRendering
Engine
JavaScript Engine
NetworkEngine
NSPR
XPCOM
js-ctypes
Socket workers
FathomScripts
Active/passivemeasurement
scripts
NetworkStorageShell
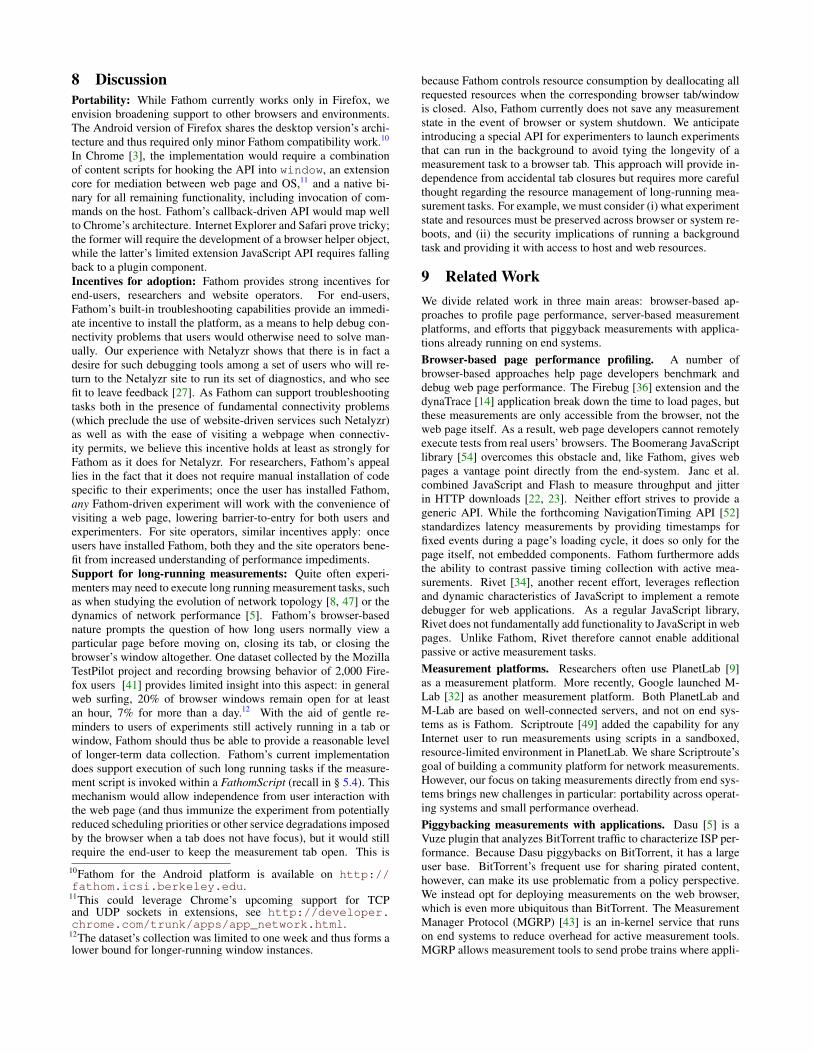
Figure 2: Fathom’s architecture in Firefox. Fathom augmentsthe browser’s XPCOM subsystem with measurement capabil-ities and extends each web page’s DOM with a fathom ob-ject and associated measurement APIs. Worker threads enableasynchronous API implementation.
nosis. Fathom overcomes the problem by leveraging access to thebrowser’s command execution API to directly invoke select ser-vices on the host, like ping or traceroute and sidestep this architec-tural challenge.
Third, JavaScript executing as part of a web page or browserextensions accesses the objects on the web page from the browser’sUI thread. Call blocking or long-running functions while executingin this thread would render the entire browser’s UI unresponsive.
Fourth, while Firefox extensions can use a threading mecha-nism called Chrome Workers5 [39], these threads do not follow thestandard OS model of a shared address space with synchroniza-tion primitives. Instead, a message-passing system similar to WebWorkers exclusively manages communication with worker threads,imposing additional latency.6
Fifth, to conserve system resources, recent Firefox versionsclamp callback timer accuracy for in-page JavaScript to low pre-cision when the user is viewing a page in a different tab. Thisclamping can add further function call latency.
5.4 Fathom’s architecture
Figure 2 shows the schematic architecture of Fathom running inFirefox. Once installed, the extension creates a component in theXPCOM subsystem that performs two main tasks. First, it in-stalls measurement scripts that handle data collection for passivein-browser measurement. Second, it provides measurement andnetwork I/O APIs to in-page JavaScript. We next discuss the mainimplementation decisions of Fathom’s prototype.Asynchronous API callflow: As mentioned in § 5.3, in-page andextension JavaScript code as well as the application’s UI threadshare a single thread of execution. Since Fathom likewise consistsof JavaScript code, its focus on network I/O requires careful APIdesign on our part to avoid the possibility of rendering the entireapplication unresponsive. In order to invoke potentially blocking
5“Chrome” here refers to a privilege level within the Firefoxbrowser, not to the Google Chrome web browser.6While XPCOM exports an interface to manage OS-level threads,we opted for Chrome Workers as they provide a natural, WebWorker-like asynchronous interface and also give thread safetyguarantees.
Webpage Fathom
recv()
post()
post()callback()
udp.recv()
NSPR
PR_Recv()
MainThread
SocketWorker
Figure 3: Asynchronous callflow in Fathom between the mainthread and a socket worker, for a recv() invocation on a UDPsocket.
I/O calls without delaying the rest of the browser and without suf-fering delays due to browser load, Fathom performs all such callsin independently executing Chrome Worker threads and uses asyn-chronously invoked user-provided callbacks when I/O operationscomplete. Fathom allocates these worker threads on per-socketgranularity as socket workers. Firefox’s event management on suchthreads thus ensures that I/O operations queue up and get processedas I/O progresses. Figure 3 illustrates the callflow.Timer throttling: The throttling of frequently executing timercallbacks in background tabs, as mentioned in § 5.3, could affectmeasurements implemented in inactive in-page JavaScript code.For example, a measurement in a background tab that invokesthe fathom.socket.udp.receive() API call in a callbackinvoked periodically via JavaScript’s setInterval() mecha-nism, Firefox would clamp the timeout at 1000ms, perhaps sig-nificantly slowing down and affecting the measurement. As aworkaround, Fathom users can package an entire measurement intoa single function (with nested state and functions) and provide thesource of that function—a FathomScript—to Fathom (JavaScript’stoSource() feature makes this easy). Fathom then launchesa low-privileged Web Worker, prepares it such that it offers theFathom API, and proceeds to execute the function in the Worker.This guarantees independence from in-page timer clamping. Scriptauthors need only be aware of this feature in special cases requiringthe use of low-latency I/O inside Fathom (see § 7.1).Maintaining baseline measurements: For passive measurements,the current implementation of Fathom samples browser and sys-tem information every 5 seconds and makes the last 2,000 sam-ples available to all web pages. Each sample takes approximately450 bytes. While the Fathom implementation stores a sliding win-dow with the last 20 user sessions per domain for baseline met-ric measurements, all the parameters of the baseline metrics areconfigurable. We plan to evaluate different techniques for keepingbaseline measurements in our future work.Security model: Our present implementation supports all of theapproaches outlined in § 4.3 other than code-signing, which weanticipate adding in the near future. While Firefox already sup-ports signing JavaScript code [38], we have opted not to employ themechanism directly in Fathom, due to technical shortcomings.7 Wedo, however, follow Firefox’s approach of signing the JavaScriptcode of an entire web page, including scripts it pulls in additionally,which provides protection against runtime page modifications.Controlling resource consumption: Our design incorporates
7Firefox requires bundling the required files into a JAR file, re-quires a jar: protocol handler for the download, insists on spe-cific Content-Type header MIME values, and uses a rather sim-plistic dialog to convey signer identity to the user.
tracking Fathom’s resource usage—e.g., number of open connec-tions or amount of data transmitted and received in the last timeunit. Currently we do not restrict resource usage, which is con-sistent with other runtime plugins such as Flash and Java. As weaccrue experience with Fathom we may decide exposing resourceusage policy to users and/or developers as it becomes necessary.In the current implementation, if a user judges that a given experi-ment is overloading her system, she can simply close the web page.Given how simple it is for users to stop measurement pages, exper-imenters have a strong incentive to use system’s resources consci-entiously.
6 Performance EvaluationWe evaluate Fathom’s performance using two metrics—overheadon web browsing and timing accuracy. We conduct all experimentswith Firefox v7.0.1 on a 2.20GHz Intel Core2 Duo machine with2GB RAM, running Ubuntu 10.04, and connected to a 100 Mbpslocal network.
6.1 Overhead
We evaluate Fathom’s page load overhead for eight popular websites (CNN, Craigslist, ESPN, Google Maps, New York Times,Slashdot, Yahoo! and YouTube) with diverse JavaScript complex-ity and number of HTTP requests. For each site, we comparethe time interval between initiating a page load and the firing ofthe Load event in a Fathom-enhanced browser against a normalbrowser. The Load event fires at the end of the page loadingprocess when all page components have rendered. To obtain theground truth, we enhance the browser with a lightweight extensionthat captures only the page load times. We also compare Fathom’soverhead with that of Firebug [36], a popular browser extension todebug web page performance. Firebug performs extensive diag-nostic measurements, which increase the page load time. We useFirebug as a reference and not as a direct comparison.
We perform 50 page loads for each benchmark and record thetimestamp values for the Load event and the clock-time spentwithin Fathom’s code for collecting the metrics. To measure theworst case performance overhead Fathom imposes, we conduct allexperiments on a browser with a warm cache. Table 4 shows theaverage absolute load times and Fathom’s relative overhead for thebenchmarks. The count of HTTP requests, scripts, and images in-dicates the range between the minimum and the maximum numberof requests of each type until the page finishes loading. Requeststhat start after the page has loaded are not included in these num-bers, as Fathom’s activity for such requests will not affect the loadtime.
Overall, Fathom imposes 1–3% overhead for all the benchmarks.We note that as the number of HTTP requests increase, the averageexecution time within Fathom also increases. We expect this behav-ior, because Fathom observes all HTTP activity to collect passivemeasurements. We also observe that with the increase of HTTP re-quests, Fathom does not always incur a corresponding increase inthe absolute overhead. This is because Fathom’s overhead is notadditive. Since we implement Fathom in JavaScript, its executionwill only block the single-threaded JavaScript interpreter, while therest of the browser can continue loading the page. Thus, Fathom’soverhead gets masked in part by network latency and the browser’sparallelism during the document loading process.
6.2 Accuracy
Network measurement platforms require accurate timestamps andtimers. Fathom leverages the browser’s JavaScript API to recordtimestamps and the XPCOM API to implement a timer. As with all
No browsing Passive browsing Active browsingAvg. Stdev. Avg. Stdev. Avg. Stdev.
Table 5: Difference in timestamps from Fathom and tcpdumpfor sent and received packets under different browsing condi-tions.
measurement, competing activity (browser, host and network) canaffect accuracy of timestamps and firing of timers.Timestamp accuracy: We measure the accuracy of Fathom’s time-stamps by sending probe packets between two machines on thesame local network and recording timestamps for those packets inFathom and via packet capture with tcpdump on the same ma-chine. Since the timestamps from Fathom and tcpdump stemfrom the same clock, the difference between the timestamps foreach packet are due to the time required to traverse the networkstack between the interface and the browser.
We test timestamp accuracy under different browsing conditionswith a train of 106 probe packets with a payload of 200 bytes each.In the “no browsing” scenario, there is no other browsing activ-ity in progress. For the “passive browsing” scenario, we load fourweb sites (CNN, Google Maps, NYTimes and YouTube) in separatebrowser tabs and send the probe train after the sites finish loading.For the “active browsing” scenario, we send the probe train whilesimultaneously loading the same four sites in other tabs.
Table 5 shows the results of the experiment. The “send” rowindicates the difference in timestamps from the time Fathom dis-patches the probe to the resulting timestamp from tcpdump. Sim-ilarly, the “recv” row indicates the delay from the timestamp givenby tcpdump to its arrival in Fathom. In all the browsing sce-narios we find the accuracy of the timestamps in Fathom—whichinherit the XPCOM granularity of 1 ms—to be within 1 ms of thetcpdump reported event time. Further, the standard deviation forall experiments is also below 1 ms. In the passive and active brows-ing scenarios, Fathom’s receive timestamp accuracy remains lowerthan in the “no browsing” case, but the accuracy is still less than1 ms.
We next explore Fathom’s timestamp accuracy under heavycross-traffic on the host. We repeat the experiment for 10 probetrains of 10 packets while performing an iperf [21] transfer with 4TCP connections between two hosts on the same local network. Inthis experiment, the average difference in the “send” timestamps in-creases to 729 ms. This test represents a worst-case scenario whenusers fully utilize their network; the heavy concurrent network traf-fic from iperf completely fills the egress queue, which preventstimely transmission of Fathom-generated probes.Timer: We measure the accuracy of Fathom’s timer by testing howprecisely it can dispatch 200-byte probes at 200 ms intervals. Weuse the timer to send 51 probe trains of 100 probes each and mea-sure the average (µ) and standard deviation (σ) for the observedintervals between consecutive probes. Since the accuracy for XP-COM timers is 1 ms, a σ of more than 1 ms would mean that thetimer loses precision. We study timer accuracy in four scenarios:(i) no browsing, (ii) passive browsing, as described above (and forwhich asynchronous activity due to both ads and scripts can lead toconcurrent activity), (iii) active browsing, as described above, and(iv) CPU stress case, where we emulate a competing process in thehost that overloads the CPU.
For the no-browsing and stress tests, we find the mean timer in-terval to be within 1 ms of the expected value of 200 ms. Further,for both cases the 5th percentile was 199 ms and the 95th per-
Table 4: Average page load overhead of Fathom for popular web pages over 50 runs.
centile was 201 ms. For the passive and active scenarios, we use10 probe trains of size 10, with probes sent at 200 ms intervals. Inthe passive-browsing scenario, the average lies within 2 ms of theexpected, the 5th percentile was 1 ms, and the 95th percentile was267 ms. For the active browsing scenario, the average lies within33 ms of the expected, the 5th percentile was 12 ms, and the 95th
percentile was 669 ms. This large drop in accuracy compared to theno-browsing and stress experiments occurs because multiple tabs inthe same browser window share the same browser runtime.
To sum up, Fathom often achieves 1 ms timestamp accuracy,but the accuracy of timestamping sent packets degrades under bothheavy network traffic and concurrent tabs within the browser. Thedegradation in timing accuracy due to competing activity is a well-known difficulty when measurements are running in shared envi-ronments like end-systems. For example, it is well-known thatmeasurements running in PlanetLab will suffer due to concurrentactivity [48]. Measurement scripts that use Fathom should be awareof these issues and perform extra tests to verify the accuracy of theirexperiments. For example, scripts can invoke Fathom APIs to re-quest CPU load and network cross-traffic on the host to test existingoperating conditions.
7 Case StudiesIn this section, we demonstrate Fathom’s utility by implementingthree example usage cases that together exercise different aspectsof its API: providing a JavaScript version of ICSI’s Netalyzr test-suite, debugging web access failures, and enabling Google Maps todiagnose poor web page performance. Our goal is to illustrate howFathom can support disparate measurement needs.
7.1 Netalyzr
We test Fathom’s suitability as a platform for conducting a widerange of active measurements by reproducing many of the testspresent in our Netalyzr testsuite [28]. Netalyzr relies on a Javaapplet for its client-side tests, so supporting this range of measure-ments can serve as a litmus test for Fathom’s flexibility. We devel-oped a Fathom-powered JavaScript version of the suite,8 focusingin particular on tests not feasible in standard JavaScript.API requirements: In the following, we consider Netalyzr’s fullset of test categories and discuss Fathom’s significance in the tests.
Address-based tests: This category primarily investigateswhether the client resides behind a NAT, and if so, how the NATrenumbers the client-side address and port numbers. It requires theequivalent of getsockname(), i.e., access to the local addressand port of a socket. Standard JavaScript does not provide these,but Fathom’s TCP APIs do.
UDP and TCP port reachability: Tests in this category measuresthe extent to which the client can communicate freely on approx-imately 30 ports used by standard protocols. For TCP, standardJavaScript APIs can approximate these tests somewhat clumsily,
8http://netalyzr.fathom.icsi.berkeley.edu
while for UDP no mechanisms exist. Fathom provides raw TCPand UDP access, making these tests easy.
Access link properties: Netalyzr leverages Java’s raw UDPaccess to implement basic latency testing, upstream/downstreambandwidth measurement, and in-path buffer size measurements.Standard JavaScript APIs provide no equivalent functionality, butFathom’s UDP access allowed us to realize the tests.
HTTP functionality & correctness: These tests determine thepresence of HTTP proxies and, if found, the use of caching andcaching correctness. The JavaScript XMLHttpRequest API is in-sufficient to implement Netalyzr’s proxy tests as it provides in-adequate control over raw message headers and browser caching.Fathom’s TCP APIs allow us to realize these tests.
DNS functionality & correctness: This category broadly cov-ers DNS feature support tests, lookup performance measurements,lookup result correctness, and tests for known security problems.While standard JavaScript APIs can use the success status of HTTPrequests as an implicit signal of success for the underlying DNSlookup, one cannot obtain the actual IP address resulting from therequest, which virtually all tests in this category require. Fathom’sDNS API allows us to conduct these tests.
IPv6 support: This category includes reachability tests to IPv6-only servers as well as performance comparisons to servers reach-able over IPv6 as well as IPv4. As the address family effectivelyremains abstracted, standard JavaScript can handle these tests viaURL requests from the servers in question.API usability: The Java-to-JavaScript porting effort also allowus to compare programming paradigms. JavaScript’s basic single-threaded execution model with callback-driven asynchronicity dif-fers substantially from Java’s lightweight threading model. Ac-cordingly, restructuring the client’s overall execution flow requiredsignificant reworking of the basic design, while porting the teststhemselves felt quite straightforward. Netalyzr’s tests execute inindividual threads using I/O that may block, with a main threadmonitoring test durations. In writing our JavaScript version, we re-structured each test into a larger set of individual functions chainedtogether via callbacks invoked by Fathom upon I/O progress. Themain test sequence likewise leverages test completion callbacks.We implemented the Fathom-driven Netalyzr subset in two weeks,the majority of which went into replicating the overall test execu-tion, reporting harness, and GUI. Each test took on the order of anhour to port.Fathom bandwidth tests: Netalyzr’s testsuite includes measure-ments of the available send and receive bandwidths. We implementtwo versions of the bandwidth test:
• In-Fathom. To estimate the maximum possible send/receiverate that Fathom can achieve, we invoke NSPR’s UDPsend/recv APIs within a tight loop to saturate the availablenetwork bandwidth. Since executing a tight loop increases CPUload, we repeat the experiment and invoke the NSPR send
Table 6: Fathom’s send/receive data rates for different pay-loads.
API within a setTimeout with delay 0, which enables otherevents in the event queue to get processed.• Web page. To get an estimate of the send/receive traffic that
JavaScript on a web page can achieve, we perform the sametests but invoking Fathom’s socket send/recv APIs, bothwithin a loop and using a timer.
We perform all tests between a laptop and a desktop connectedover a 100 Mbps Ethernet and compare them with the speedachieved by iperf. We determine the maximum available sendbandwidth using a Fathom client and an iperf server. We deter-mine the maximum available receive bandwidth using a Fathom-based server and an iperf client. Table 6 shows the results. Weobserve that under the In-Fathom category, using the NSPR APIswe get much higher traffic rates than the web pages using Fathom’sAPIs. We expect this, since NSPR APIs are synchronous, whiledue to the asynchronous nature of Fathom APIs every additionalcallback in the call sequence affects the bandwidth rates.
We also observe that send rates increase as the payloads increaseand match iperf send rates at high payload size. But the maximumachievable receive rate did not exceed 73.4 Mbps. Although wecould not experimentally verify the cause of the imbalance in thesend and receive rates, the discrepancy could arise due to the js-ctypes library used for Fathom’s socket APIs. We suspect js-ctypes,which does not benefit from JavaScript’s JIT optimizations [18, 6],may pose a significant performance bottleneck.
A natural way to improve the send/receive bandwidths is to par-allelize the tests. We tried using HTML5 Web Workers, whichspawn OS-level threads to concurrently perform the bandwidthtests. We observed that the reported bandwidth did not increasewhen running the test in a tight loop. We attribute this to a lim-itation of the Workers, which cannot access the page’s JavaScriptnamespace, including the window object. Workers, thus, cannotaccess Fathom APIs defined on the window.fathom object. Allaccesses to Fathom APIs must require another level of indirectionusing the asynchronous message passing postMessage API be-tween the Worker thread and the main UI thread (which has ac-cess to the window.fathom object). This indirection limits theachieved bandwidth.
To enable better bandwidth tests from a web page, script authorsshould therefore implement bandwidth tests via FathomScripts (re-call § 5.4), as they obviate the message passing overhead.
Summary: Our implementation of key Netalyzr tests that provedifficult or infeasible to realize in standard JavaScript (local net-work configuration, UPnP probing, DNS features, and particu-larly UDP-based latency and bandwidth tests) confirm Fathom’sversatility. For tests leveraging low-level APIs, particularlyfathom.socket.*, the coding effort compares to that re-quired in Java, while tests that could leverage Fathom’s APIs (e.g.fathom.proto.upnp.*) instead of needing full protocol im-plementations required a fraction of the code.
7.2 Web access failure debugging
While troubleshooting suites such as Netalyzr work well when theuser has access to sufficient connectivity to download and run thetestsuite, such an approach fails in the presence of more funda-mental connectivity problems. Indeed, a frequent request we re-ceive from Netalyzr users is to expand the connectivity tests in thatdirection, particularly in Netalyzr’s command-line interface. Forsuch scenarios, we developed a “Debug my connection” measure-ment application. We include this script as a built-in part of theFathom distribution (which provides an immediate incentive forusers to install Fathom), but emphasize that we implement it solelyin JavaScript using the existing Fathom API. The script is currently400 LOC.Implementation: We structure the connectivity debugger by start-ing at the host’s link-level network interface configuration andprogressing upward through the protocol stack, identifying andreporting problems at each layer. The test begins by obtain-ing basic system usage statistics from Fathom’s usage baseline,including memory usage and process load. Using fathom.system.getActiveIntefaces(), we detect whether thesystem actually connects to any network. If so, we report re-cent link quality and throughput counters for the active interfaces,as reported by fathom.system.getNetworkUsage(), and,again using the baseline counters, report on cross traffic originat-ing from outside of the browser. We then move up to the net-work layer and test the availability of a default route in the sys-tem’s routing table, as well as IP-level connectivity (via fathom.system.doPing()) to the gateway and DNS resolver(s) (viafathom.system.getResolvers()), and relevant browser-level configuration settings such as proxies (via fathom.utils.browser.getProxyConfig()). Moving up to the transportlevel, we attempt retrieval of an image from www.google.com,and the test completes.
At each stage, we report on the outcome of the tests involved. Inthe current version, users click on a “Debug my connectivity” but-ton provided in the browser toolbar in order to initiate diagnosis,but we envision hooking the connectivity debugger into relevantparts of the browser in order to automatically provide contextualinformation to the user. For example, upon failing DNS lookups,we can automatically test the DNS configuration, and for unavail-able servers we can test whether the user experiences a full outageor one just affecting the destination site.Collaborative debugging: We can further troubleshoot possibleconnectivity problems in the local network by leveraging Fathom’srendezvous and server-side abilities. In particular, we can leverageFathom’s UPnP and zeroconf capabilities (via fathom.proto.{mdns,upnp}.*) as follows. First, using UPnP we can try to lo-cate UPnP-enabled gateway devices. If available, such devices canreport uplink type, upstream/downstream throughput counters, andother information [51]. Second, using UPnP and Zeroconf we canlocate other Fathom-enabled devices. Since Fathom supports lis-tening sockets, we can then engage in both local and remote latencyand throughput tests. Correlating the resulting numbers allows usto pinpoint packet loss problems.
To test this approach, we have implemented a Fathom-poweredweb application in 320 lines of code that lets two Fathom instancesdetect each other using UPnP and initiate probes to measure uni-directional loss and latency between each pair of Fathom-enablednodes. The script then compares these values with historic val-ues of loss rates and delays for the local networks, obtained fromFathom’s passive data collection. Values greater than expectedcause the application to report poor local network performance.Crucially, in order to conduct this testing the user neither needs to
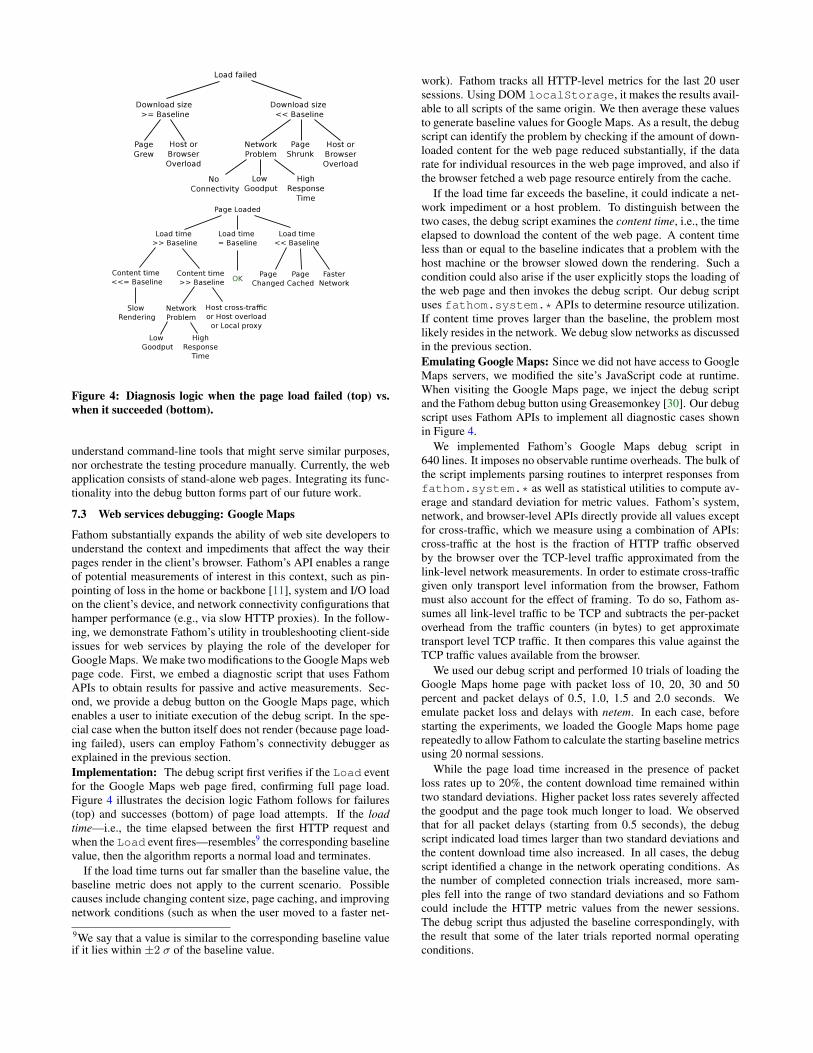
Figure 4: Diagnosis logic when the page load failed (top) vs.when it succeeded (bottom).
understand command-line tools that might serve similar purposes,nor orchestrate the testing procedure manually. Currently, the webapplication consists of stand-alone web pages. Integrating its func-tionality into the debug button forms part of our future work.
7.3 Web services debugging: Google Maps
Fathom substantially expands the ability of web site developers tounderstand the context and impediments that affect the way theirpages render in the client’s browser. Fathom’s API enables a rangeof potential measurements of interest in this context, such as pin-pointing of loss in the home or backbone [11], system and I/O loadon the client’s device, and network connectivity configurations thathamper performance (e.g., via slow HTTP proxies). In the follow-ing, we demonstrate Fathom’s utility in troubleshooting client-sideissues for web services by playing the role of the developer forGoogle Maps. We make two modifications to the Google Maps webpage code. First, we embed a diagnostic script that uses FathomAPIs to obtain results for passive and active measurements. Sec-ond, we provide a debug button on the Google Maps page, whichenables a user to initiate execution of the debug script. In the spe-cial case when the button itself does not render (because page load-ing failed), users can employ Fathom’s connectivity debugger asexplained in the previous section.Implementation: The debug script first verifies if the Load eventfor the Google Maps web page fired, confirming full page load.Figure 4 illustrates the decision logic Fathom follows for failures(top) and successes (bottom) of page load attempts. If the loadtime—i.e., the time elapsed between the first HTTP request andwhen the Load event fires—resembles9 the corresponding baselinevalue, then the algorithm reports a normal load and terminates.
If the load time turns out far smaller than the baseline value, thebaseline metric does not apply to the current scenario. Possiblecauses include changing content size, page caching, and improvingnetwork conditions (such as when the user moved to a faster net-
9We say that a value is similar to the corresponding baseline valueif it lies within ±2 σ of the baseline value.
work). Fathom tracks all HTTP-level metrics for the last 20 usersessions. Using DOM localStorage, it makes the results avail-able to all scripts of the same origin. We then average these valuesto generate baseline values for Google Maps. As a result, the debugscript can identify the problem by checking if the amount of down-loaded content for the web page reduced substantially, if the datarate for individual resources in the web page improved, and also ifthe browser fetched a web page resource entirely from the cache.
If the load time far exceeds the baseline, it could indicate a net-work impediment or a host problem. To distinguish between thetwo cases, the debug script examines the content time, i.e., the timeelapsed to download the content of the web page. A content timeless than or equal to the baseline indicates that a problem with thehost machine or the browser slowed down the rendering. Such acondition could also arise if the user explicitly stops the loading ofthe web page and then invokes the debug script. Our debug scriptuses fathom.system.* APIs to determine resource utilization.If content time proves larger than the baseline, the problem mostlikely resides in the network. We debug slow networks as discussedin the previous section.Emulating Google Maps: Since we did not have access to GoogleMaps servers, we modified the site’s JavaScript code at runtime.When visiting the Google Maps page, we inject the debug scriptand the Fathom debug button using Greasemonkey [30]. Our debugscript uses Fathom APIs to implement all diagnostic cases shownin Figure 4.
We implemented Fathom’s Google Maps debug script in640 lines. It imposes no observable runtime overheads. The bulk ofthe script implements parsing routines to interpret responses fromfathom.system.* as well as statistical utilities to compute av-erage and standard deviation for metric values. Fathom’s system,network, and browser-level APIs directly provide all values exceptfor cross-traffic, which we measure using a combination of APIs:cross-traffic at the host is the fraction of HTTP traffic observedby the browser over the TCP-level traffic approximated from thelink-level network measurements. In order to estimate cross-trafficgiven only transport level information from the browser, Fathommust also account for the effect of framing. To do so, Fathom as-sumes all link-level traffic to be TCP and subtracts the per-packetoverhead from the traffic counters (in bytes) to get approximatetransport level TCP traffic. It then compares this value against theTCP traffic values available from the browser.
We used our debug script and performed 10 trials of loading theGoogle Maps home page with packet loss of 10, 20, 30 and 50percent and packet delays of 0.5, 1.0, 1.5 and 2.0 seconds. Weemulate packet loss and delays with netem. In each case, beforestarting the experiments, we loaded the Google Maps home pagerepeatedly to allow Fathom to calculate the starting baseline metricsusing 20 normal sessions.
While the page load time increased in the presence of packetloss rates up to 20%, the content download time remained withintwo standard deviations. Higher packet loss rates severely affectedthe goodput and the page took much longer to load. We observedthat for all packet delays (starting from 0.5 seconds), the debugscript indicated load times larger than two standard deviations andthe content download time also increased. In all cases, the debugscript identified a change in the network operating conditions. Asthe number of completed connection trials increased, more sam-ples fell into the range of two standard deviations and so Fathomcould include the HTTP metric values from the newer sessions.The debug script thus adjusted the baseline correspondingly, withthe result that some of the later trials reported normal operatingconditions.
8 DiscussionPortability: While Fathom currently works only in Firefox, weenvision broadening support to other browsers and environments.The Android version of Firefox shares the desktop version’s archi-tecture and thus required only minor Fathom compatibility work.10
In Chrome [3], the implementation would require a combinationof content scripts for hooking the API into window, an extensioncore for mediation between web page and OS,11 and a native bi-nary for all remaining functionality, including invocation of com-mands on the host. Fathom’s callback-driven API would map wellto Chrome’s architecture. Internet Explorer and Safari prove tricky;the former will require the development of a browser helper object,while the latter’s limited extension JavaScript API requires fallingback to a plugin component.Incentives for adoption: Fathom provides strong incentives forend-users, researchers and website operators. For end-users,Fathom’s built-in troubleshooting capabilities provide an immedi-ate incentive to install the platform, as a means to help debug con-nectivity problems that users would otherwise need to solve man-ually. Our experience with Netalyzr shows that there is in fact adesire for such debugging tools among a set of users who will re-turn to the Netalyzr site to run its set of diagnostics, and who seefit to leave feedback [27]. As Fathom can support troubleshootingtasks both in the presence of fundamental connectivity problems(which preclude the use of website-driven services such Netalyzr)as well as with the ease of visiting a webpage when connectiv-ity permits, we believe this incentive holds at least as strongly forFathom as it does for Netalyzr. For researchers, Fathom’s appeallies in the fact that it does not require manual installation of codespecific to their experiments; once the user has installed Fathom,any Fathom-driven experiment will work with the convenience ofvisiting a web page, lowering barrier-to-entry for both users andexperimenters. For site operators, similar incentives apply: onceusers have installed Fathom, both they and the site operators bene-fit from increased understanding of performance impediments.Support for long-running measurements: Quite often experi-menters may need to execute long running measurement tasks, suchas when studying the evolution of network topology [8, 47] or thedynamics of network performance [5]. Fathom’s browser-basednature prompts the question of how long users normally view aparticular page before moving on, closing its tab, or closing thebrowser’s window altogether. One dataset collected by the MozillaTestPilot project and recording browsing behavior of 2,000 Fire-fox users [41] provides limited insight into this aspect: in generalweb surfing, 20% of browser windows remain open for at leastan hour, 7% for more than a day.12 With the aid of gentle re-minders to users of experiments still actively running in a tab orwindow, Fathom should thus be able to provide a reasonable levelof longer-term data collection. Fathom’s current implementationdoes support execution of such long running tasks if the measure-ment script is invoked within a FathomScript (recall in § 5.4). Thismechanism would allow independence from user interaction withthe web page (and thus immunize the experiment from potentiallyreduced scheduling priorities or other service degradations imposedby the browser when a tab does not have focus), but it would stillrequire the end-user to keep the measurement tab open. This is
10Fathom for the Android platform is available on http://fathom.icsi.berkeley.edu.
11This could leverage Chrome’s upcoming support for TCPand UDP sockets in extensions, see http://developer.chrome.com/trunk/apps/app_network.html.
12The dataset’s collection was limited to one week and thus forms alower bound for longer-running window instances.
because Fathom controls resource consumption by deallocating allrequested resources when the corresponding browser tab/windowis closed. Also, Fathom currently does not save any measurementstate in the event of browser or system shutdown. We anticipateintroducing a special API for experimenters to launch experimentsthat can run in the background to avoid tying the longevity of ameasurement task to a browser tab. This approach will provide in-dependence from accidental tab closures but requires more carefulthought regarding the resource management of long-running mea-surement tasks. For example, we must consider (i) what experimentstate and resources must be preserved across browser or system re-boots, and (ii) the security implications of running a backgroundtask and providing it with access to host and web resources.
9 Related WorkWe divide related work in three main areas: browser-based ap-proaches to profile page performance, server-based measurementplatforms, and efforts that piggyback measurements with applica-tions already running on end systems.Browser-based page performance profiling. A number ofbrowser-based approaches help page developers benchmark anddebug web page performance. The Firebug [36] extension and thedynaTrace [14] application break down the time to load pages, butthese measurements are only accessible from the browser, not theweb page itself. As a result, web page developers cannot remotelyexecute tests from real users’ browsers. The Boomerang JavaScriptlibrary [54] overcomes this obstacle and, like Fathom, gives webpages a vantage point directly from the end-system. Janc et al.combined JavaScript and Flash to measure throughput and jitterin HTTP downloads [22, 23]. Neither effort strives to provide ageneric API. While the forthcoming NavigationTiming API [52]standardizes latency measurements by providing timestamps forfixed events during a page’s loading cycle, it does so only for thepage itself, not embedded components. Fathom furthermore addsthe ability to contrast passive timing collection with active mea-surements. Rivet [34], another recent effort, leverages reflectionand dynamic characteristics of JavaScript to implement a remotedebugger for web applications. As a regular JavaScript library,Rivet does not fundamentally add functionality to JavaScript in webpages. Unlike Fathom, Rivet therefore cannot enable additionalpassive or active measurement tasks.Measurement platforms. Researchers often use PlanetLab [9]as a measurement platform. More recently, Google launched M-Lab [32] as another measurement platform. Both PlanetLab andM-Lab are based on well-connected servers, and not on end sys-tems as is Fathom. Scriptroute [49] added the capability for anyInternet user to run measurements using scripts in a sandboxed,resource-limited environment in PlanetLab. We share Scriptroute’sgoal of building a community platform for network measurements.However, our focus on taking measurements directly from end sys-tems brings new challenges in particular: portability across operat-ing systems and small performance overhead.Piggybacking measurements with applications. Dasu [5] is aVuze plugin that analyzes BitTorrent traffic to characterize ISP per-formance. Because Dasu piggybacks on BitTorrent, it has a largeuser base. BitTorrent’s frequent use for sharing pirated content,however, can make its use problematic from a policy perspective.We instead opt for deploying measurements on the web browser,which is even more ubiquitous than BitTorrent. The MeasurementManager Protocol (MGRP) [43] is an in-kernel service that runson end systems to reduce overhead for active measurement tools.MGRP allows measurement tools to send probe trains where appli-
cation packets piggyback on measurement probes. Neither MGPRnor Dasu provide a programmable measurement platform.
10 ConclusionIn this paper, we describe Fathom, a browser extension that usesweb browser APIs to build a measurement platform. Fathom pro-vides a programmable interface for writing and launching measure-ments from the convenience of the web browser. We have imple-mented a Fathom prototype for the Firefox web browser. Our eval-uation shows that it can achieve timestamp accuracies of 1 ms, andgenerally has runtime overheads of < 3.2% for popular websites.We also demonstrate its utility in three case studies: providing aJavaScript version of the Netalyzr network characterization tool,debugging of web access failures, and enabling web sites to diag-nose performance problems of their clients.
Acknowledgements: We thank the anonymous reviewers and ourshepherd, KC Claffy, for their comments and feedback on the pa-per. This work was supported in part by the National Science Foun-dation under grants CNS-0831535 and CNS-1111672. Any opin-ions, findings, conclusions or recommendations expressed in thismaterial are those of the authors and do not necessarily reflect theviews of the National Science Foundation. We also thank Comcastand Google for their support.
11 References[1] S. Agarwal, P. Mohan, N. Liogkas, and V. Padmanabhan.
Webprofiler: cooperative diagnosis of web failures. In Proc.COMSNETS, 2010.
[2] G. Aggrawal, E. Bursztein, C. Jackson, and D. Boneh. Ananalysis of private browsing modes in modern browsers. InProc. USENIX Security, 2010.
[3] A. Barth, A. Felt, P. Saxena, and A. Boodman. Protectingbrowsers from extension vulnerabilities. In Proc. NDSS,2010.
[4] S. Bauer, D. Clark, and W. Lehr. Understanding broadbandspeed measurements. MITAS project white paper, 2010.
[5] Z. S. Bischof, J. S. Otto, M. A. Sánchez, J. P. Rula, D. R.Choffnes, and F. E. Bustamante. Crowdsourcing ISPcharacterization to the network edge. In Proc. ACMSIGCOMM Workshop on Measurements Up the Stack, 2011.
[7] M. Butkiewicz, H. V. Madhyastha, and V. Sekar.Understanding website complexity: Measurements, metrics,and implications. In Proc. IMC, 2011.
[8] K. Chen, D. R. Choffnes, R. Potharaju, Y. Chen, F. E.Bustamante, D. Pei, and Y. Zhao. Where the sidewalk ends:Extending the Internet AS graph using traceroutes from P2Pusers. In Proc. CoNEXT, 2009.
[9] B. Chun, D. Culler, T. Roscoe, A. Bavier, L. Peterson,M. Wawrzoniak, and M. Bowman. PlanetLab: An overlaytestbed for broad-coverage services. ACM SIGCOMMComputer Communication Review, 33(3), July 2003.
[10] H. Cui and E. Biersack. Trouble shooting interactive websessions in a home environment. In Proc. ACM SIGCOMMWorkshop on Home Networks, 2011.
[11] L. DiCioccio, R. Teixeira, M. May, and C. Kreibich. Probeand Pray: Using UPnP for Home Network Measurements. InPassive and Active Measurement Conference (PAM), Vienna,Austria, March 2012.
[12] M. Dischinger, M. Marcon, S. Guha, K. P. Gummadi,
R. Mahajan, and S. Saroiu. Glasnost: Enabling end users todetect traffic differentiation. In Proc. USENIX NSDI, 2010.
[13] J. R. Douceur, J. Elson, J. Howell, and J. R. Lorch.Leveraging legacy code to deploy desktop applications onthe web. In Proc. USENIX OSDI, 2008.
[14] dynaTrace Software. Diagnose and prevent AJAXperformance issues. http://ajax.dynatrace.com/.
[15] P. Eckersley. How unique is your web browser? In Proc.Privacy Enhancing Technologies Symposium (PETS), 2010.
[16] A. P. Felt, S. Egelman, M. Finifter, D. Akhawe, andD. Wagner. How to Ask For Permission. In Proc. USENIXWorkshop on Hot Topics in Security, 2012.
[17] FireEye. Zero-day season is not over yet.http://blog.fireeye.com/research/2012/08/zero-day-season-is-not-over-yet.html.
[18] A. Giammarchi. An introduction to js-ctypes.http://webreflection.blogspot.com/2011/09/introduction-to-js-ctypes.html.
[19] Google. Google Maps help forum.http://www.google.com/support/forum/p/maps/thread?tid=24f446d4cc24d07a.
[25] P. Kanuparthy and C. Dovrolis. ShaperProbe: End-to-enddetection of ISP traffic shaping using active methods. InProc. IMC, 2011.
[26] A. Kingsley-Hughes. Flashback Malware Worth Up To$10,000 A Day To Criminals. http://www.forbes.com/sites/adriankingsleyhughes/2012/05/01/flashback-malware-worth-up-to-10000-a-day-to-criminals/, May 2012.
[27] C. Kreibich, N. Weaver, G. Maier, B. Nechaev, andV. Paxson. Experiences from Netalyzr with engaging users inend-system measurement. In Proc. ACM SIGCOMMWorkshop on Measurements Up the Stack, 2011.
[28] C. Kreibich, N. Weaver, B. Nechaev, and V. Paxson.Netalyzr: Illuminating the edge network. In Proc. IMC,2010.
[29] V. Lam, S. Antonatos, P. Akritidis, and K. Anagnostakis.Puppetnets: misusing web browsers as a distributed attackinfrastructure. In Proc. ACM CCS, 2006.
[30] A. Lieuallen, A. Boodman, and J. Sundström.Greasemonkey. http://www.greasespot.net/.
[31] M. Mathis, J. Heffner, P. O’Neil, and P. Siemsen. Pathdiag:Automated TCP diagnosis. In Proc. PAM, 2008.
[38] Mozilla. Signed Scripts in Mozilla.http://www.mozilla.org/projects/security/components/signed-scripts.html.
[39] Mozilla Developer Network. ChromeWorker.https://developer.mozilla.org/en/DOM/ChromeWorker.
[40] Mozilla Developer Network. js-ctypes.https://developer.mozilla.org/en/js-ctypes.
[41] Mozilla TestPilot. Tab Switch Study.https://testpilot.mozillalabs.com/testcases/tab-switch-study.
[42] V. N. Padmanabhan, S. Ramabhadran, S. Agarwal, andJ. Padhye. A study of end-to-end web access failures. InProc. CoNEXT, 2006.
[43] P. Papageorge, J. McCann, and M. Hicks. Passive aggressivemeasurement with MGRP. In Proc. ACM SIGCOMM, 2009.
[44] V. Paxson. End-to-end routing behavior in the Internet. Proc.ACM SIGCOMM, 1996.
[45] M. Perry. Torbutton design documentation. https://www.torproject.org/torbutton/en/design/.
[46] C. Reis, S. Gribble, T. Kohno, and N. Weaver. Detectingin-flight page changes with web tripwires. In Proc. USENIXNSDI, pages 31–44, 2008.
[47] Y. Shavitt and E. Shir. DIMES: Let the Internet measureitself. ACM SIGCOMM Computer Communication Review,35(5), 2005.
[48] J. Sommers and P. Barford. An active measurement systemfor shared environments. In Proc. IMC, 2007.
[49] N. Spring, D. Wetherall, and T. Anderson. Scriptroute: Apublic Internet measurement facility. In Proc. USENIXSymposium on Internet Technologies and Systems, 2003.
[50] J. Ullrich. Javascript DDoS Tool Analysis.http://isc.sans.org/diary/Javascript+DDoS+Tool+Analysis/12442.
[51] UPnP Forum. Internet Gateway Device (IGD) V 2.0.http://upnp.org/specs/gw/igd2.
[52] W3C. Navigation timing, editor’s draft november 14th, 2011.https://dvcs.w3.org/hg/webperf/raw-file/tip/specs/NavigationTiming/Overview.html.
[53] Wikimedia Foundation, Inc. Netscape Plugin ApplicationProgramming Interface.http://en.wikipedia.org/wiki/NPAPI.
[54] Yahoo! Exceptional Performance Team. This, is boomerang.http://yahoo.github.com/boomerang/doc/.
[55] B. Yee, D. Sehr, G. Dardyk, J. B. Chen, R. Muth, T. Orm,S. Okasaka, N. Narula, N. Fullagar, and G. Inc. NativeClient: A sandbox for portable, untrusted x86 native code. InProc. IEEE S&P, 2009.