-· FATIGUE AND RESIDUAL STRESS INVESTIGATION OF COMPOSITE PRESTRESSED STEEL BEAMS by M. H. Anderson and C. E. Ekberg, Jr. Project HR-74 Highway Research Board Iowa State Highway Commission November 1, 1963 Project 494-S IOWA STATE UNIVERSITY I of Science and Technology j Ames, Iowa IOWA ENGINEERING EXPERIMENT STATION
Transcript
-·
FATIGUE AND RESIDUAL STRESS INVESTIGATION OF COMPOSITE PRESTRESSED STEEL BEAMS
by
M. H. Anderson
and
C. E. Ekberg, Jr.
Project HR-74 Highway Research Board
Iowa State Highway Commission
November 1, 1963
Project 494-S
IOWA STATE UNIVERSITY I of Science and Technology j Ames, Iowa
IOWA
ENGINEERING EXPERIMENT
STATION
•
•
Abstract Introduction
CONTENTS
Theories of fatigue failure Factbr s affecting fatigue strength Effects of residual stress
Residual stresses due to welding Welding of 11T-l 11 steel F atigue strength of welded members
Preparation of specimens Materials De sign and fabrication
Fatigue tests Testing procedure Results
Residual stress determination Procedure Results
Discussion of results Conclusions Acknowledgements Appendix; Welding and fatigue s trength
Why research is needed Resear ch possibilities
Redistribution of residual welding stresses Reduction of notch effects
References
-2-
P a ge
3 3 4 5 6 7 7 8 9 9 9
11 11 12 14 14 15 16 18 19 20 20 20 21 22 24
•
•
ABSTRACT
Two composite, preetressed, steel beams. fabricated by slightly
different methods, were fatigue tested to destruction. Stresaes and
deflections were measured at regular intervals, and the behavior of
each beam as failure progressed was recorde d. Residual stresses
were then evaluated by testing segments of each beam. An attempt was
made to assess the effects of the residual etresses on .fatigue strength.
INTRODUCTION
In recent years the failure phenomena
known as fatigue has become increasingly
important to engineers due to the technolog
ical advancements of mankind. The machines
and structures which engineers are designing
today make increasingly exacting demands on
the materials used, particularly in regard to
frequency of loading. The refore it is not
the tests of these two beams, especially the
state of stress, proved to be enlightening.
The study reported herein was initiated
to evaluate further this Iowa State Highway
Commission design by fatigue testing two
specimens planned for the positive moment
region of a bridge. After the specimens had
surprising to find that large amounts of money failed under the repeated loading, residual
and effort are being expended for better streeeee were measured in more than 180
understanding of the behavior of materiale of
construction under repeated loads. The new
weldable high strength constructional alloy
steels make new concept• in the design of
steel structures possible, in that the design
er has a choice of m aterials as well as of
geometry.
One interesting and economical method
of utilizing these ne w m aterials has been
ele mental atrips which had been removed
from the beam. Other means of improving
fatigue strength are presented in the Appendix.
RESEARCH AND THEORIES
Experiment• about one hundred years
a.go first established the failure of materials
under repeated loads, and the conclusions
reached are valid today, although materials
have changed considerably3 7
. Since then a
deve loped by engineers of the Iowa State High- great deal of data has been accwnulated . But
way Commission 43 . A pre stressing tech- nearly all the data have necessarily been rather
nique was employed to obtain a favorable specific in nature, and the interpretation of
stress pattern in members composed of rolled the data has tended to be empirical rather than
beam• of A3 S steel with "T-1" constructional
a lloy steel cover plates.
The engineers who developed the method
fabricated and analyzed five beams to deter
mine the feasibility of the procedure S Two
of these beams simulating those found in the
negative moment region of a bridge were later 46
tested under repeated load T he results of
theoretical.
To aid in the interpretation of the results
of the e xperimenta l work reported herein, a
literature study of the general subject of metal
fatigue was undertaken, particularly as related
to steel weldments. Much of the basic study
of the mechanisms of fatigue failure wa s found
in the field of metallurgy. Extensive applied
-3-
research in the aeronautical and automotive
fields has made a major contribution to the
search for better understanding of the fatigue
phenomena. Therefore reported research in
related fields such as these was reviewed, as
as well as that on structural steel beams and
connections.
Theories of Fatigue Failure
Early theories were generally formulated
in accordance with theories of elasticity 9 .
generally to a minute imperfe ction, plane of
weakness, or a particular crystal orientation.
Because the problem is complex, a number
of simplifying assumptions must be made; and
therefore none of the theories advanced so far
has fully explained all facets of fatigue behav
ior. Nevertheless, such theories do provide
insights into the basic behavior of metals and
suggest avenues for further research.
The strain-hardening theory, based on
observations of the processes of slip band Failure was assumed to occur as a result of
formation and strain hardening, has contribhaving exceeded some limiting value of stress
uted a great deal to the understanding of the or deformation. Among these theories were:
l. The theory of maximum stress or the
principal stress theory (Rankine)
2. The theory of maximum strain (Saint
Venant)
3. The maximum shear-stress theory
4. The di stortion- energy theory.
None of these theories has proved t o be
satisfactory or conclusive in dealing with
fatigue phenomena. Each of these early
theories begins with the assumption that a
given material is homogeneous and isotropic,
which is now known to be untrue, particularly
for rolled or extruded products. In addition,
microscopi c stress irregularities have been
detected in these in-homogeneities or vari
ations of grain orientation. These stress
irregularities are thought to affect the fatigue
mechanisms of fatigue failure, particularly
for ductile m etals 21 . According to this theory
a metal contains a number of plastic in-homo
geneities within elastic surroundings. These
in-homogeneities cause unequal micro stress
distributions. In ductile metals yielding oc
curs at locations of peak st res se s in the form
of slip bands before fracture occurs. Under
cyclic loading localized strain hardening takes
place at these slip bands, and con.tinued plastic
yielding i s accompanied by an increase in
::;tress. Eventually this stress rises to a
value above fracture strength, and a micro
crack is formed. The process is then re
peated at the ends of this micro crack where
a new stress concentration is found until it
cracks, and so progressively on to failure.
The major limitation to this theory comes
from the fact that cold-worked metals have behavior of metals. Even Hooke's Law may
been shown to strain-soften under cyclic not be applicable for repeated loadings, since
stressing rather than strai n - harden. a certain amount of hysteresis is involved;
and inelastic or plastic deformation are often
observed in the fatigue process. The fatigue process has been character-
ized as occurring in three stages11 First,
Most recent efforts have therefore been work hardening accompanies a slip and frag-
concentrated on attempts to explain fatigue mentation of crystals. Sub-microscopic
pheonomena on the basis of the mechanism cracks then occur due to the disruption of the
involved. Severa l theories have been pro
posed emphasizing the l ocalized nature of
crystalline lattice. Finally these cracks join
to form visible spreading cracks, eventually
fatig ue crack formation, attributing the cause causing failure. T he first stage is very brief,
-4-
and the last stage is also relatively short,
with most of the process occurt'ing during the
second stage. Fat ig.ue cracking may be " a
progressive piling up of an avalanche of dis
ruptions" leading to local fragmentation1l, p.
49
There are really two different mechan
isms involved in the fatigue phenomenon58
These may be separated at the knee of the
S/N curve of steel. Fatigue failures re
presented by the ste_ep portion of the curve
are described as a delayed ~-~atic fracture
mechanism, and the fatigue failures associ
ated with the flat portion of the cu1·ve are
attributed to a general structural deteriora
tion. The former is characterized as having
a coarse s lip similar to that produced by a
static test. But the latter results in a fine
slip and exhibits very little strain hardening.
The deterioration in the second mechanism
was illustrated by micrographi:. showing the
transformation of slip zones which appeared
early in t he fatigue process as sharp fis
sures. (No more than 1/10 of the expected
specimen life is required for this transforma - ·
tion. In fact, the time required seems to
determine the life of the specimen). Finally
a crack is formed traversing a grain to con
nect two or more fissures.
The following observations on the devel
opment of the fatigue mechanisms· were based
on failures associated with the flat portion of
theS/Ncurve59
• 60
:
1. Fine slip movements concentrate into
slip zones which are areas of mechanical
weakness and potential fissures.
2. To-and-fro movements in the slip zones
tend to distort surfaces, sometimes building
up sharp notches.
3. Notches become fissures early in the
fatigue process.
4. Fissures then join to form a microcrack .
- 5-
One might conclude that the the o ries so
far evolved, though useful in certain appli
cations, are only approximations based on
simplifying assumptions. Even so they may
become very complex in analysis of a par
ticular case. Each particula~ fatigue prob
lem is more readily under stood at pre sent
as an individual case; and, when treated as
such in the laboratory, satisfactory predic
tions concerning its engineering behavior can
be evolved.
Factors Affecting Fatigue Strength
Several factors affect the fatigue behav
ior of a structural member. According to
Reemsnyder 45 • P· 22, some of these are as
follows:
A. Load spectrum
1. Range of stress 2. State of stress 3. Repetition of stress
a) Regular or random b) Frequency c) Rest periods
4. Understressing or overstr~ssing
B. Nature and condition
l. Prior stress history a) Presence or absence of
residual stresses b) Work hardening
2. Size and shape of spectrum a) Presence of notches b) Size effects (models)
3. Metallurgical structure a) Microstructure, grain size,
and chemical composition b) Mechanical properties
4. Welding a.) Mechanical b) Metallurgical
C. Environment
l. Temperature 2. Atmosphere
A comprehensive examinat ion of the influ
ence of the known variables on the results
of fatigue tests has been presented 5 S, PP· 94 - 132
Effects of Residual Stress
In static load tests it is generally agreed
that in most materials residual stresse,a are
of little significance. An exception occurs in
columns where residual tensile stresses in
the extreme fibers seriously affect the sta
bility of the member. Reductions in strength
of up to 35% have been noted in tests on A 7 6
steel .
Under repeated load the pattern is not
before significant damage can occu:r, but in
quenched and tempered steels fatigue damage
may occur before residual stresses have
relaxed to safe values31 .
One series of investigations resulted in
the conclusion that residual stresses are
basically similar to improved static stresses
in their effect on fatigue behavior of metals 4~ This research a l so found that residual stress
es in a steel which has been hardened by heat
so clear. Most researchers agree that com- treatment will relax much less than those in
pre.ssivt" residual stresses tend to increase
fatigue strength, and the tensile residual
stresses reduce it45• P· 17 . In mild steel
there is a marked tendency for the residuals
to f<;'-de during cycling, particularly if local
stresses approach the yield strength. A re-
a steel which has been softened or annealed.
This was particularly applicable if the ap
plied stresses were low and the fatigue life
was long.
In an investigation of notched specimens
cent study has reported evidence of this it was found that static properties such as
tendency, even under low stress amplitudes 42 . tensile strength and elongation give no reliable
This study showed that residual stresses con- indication of permissible stresses under
tinued to fade at 10 million cycles under a cyclic loading13 When tensile residual stress
stress amplitude pf only 8000 psi. Generally was present around the root of a sharp notch,
the amount of fading increased with increase specimens of mild steel were appreciably
in stress a.mplitude and number of cycles . stronger than those of high strength stee147.
For mild steel "the upper limit of the fatigue
range of stress (with zero mean stress) is
approximately equal to the yield point ...
so that . . . yielding may occur and reduce . 7, p. 81
the effective applied stress " . For
this reason residual stresses should not re
duc e the fatigue strength more than 5 to 10
percent. The same conclu s ion was arrived
at based on studies of stress relieved speci-49
mens ·
A possible explanation of this phenomenon
may be reached by extending to its logical
conclusion the argument set forth regarding
high strength steel 7
For example, from the
modified Goodman diagram representing the
fatigue strength of 11T-l " steel the upper
limits of the fatigue range of stress (with
zero mean stress) are only about one-third
of the yield point stress. Therefore "T-1"
steel in this fatigue range of stress never
There is considerable evidence, however, approaches the yield point of the material,
that residual stresses have far more effect
on t he fatigue strength of hard or high
strength steels. Residual stresses in mild
steels under alternating stress may relax
and consequently there is insufficient yielding
of areas of locally high tensile residual stress
and little opportunity for their relaxation.
-6-
Residual Stresses Due to We lding
In the process of welding a great deal
of heat is generated. Most of this heat is
localized in the fusion zone of the weld and
gradually diminishes through the heat- af
fected zone and the rest of the material.
The fusion zone is that area of the weld
section which is fused with the weld metal
a .nd undergoes a degree of inter - granular
mixing of weld metal and parent metal. The
heat-affected zone is that area just around
Welding of "T - 1" Steel
A great deal of study has recently been
devoted to the problem of the production of
good welds in "T -1 " steels. Detailed studies
of the heat affected zone (HAZ) indicate that
the good notch toughness found in "T-1" steel
is due to the formation of low-carbon marten
sites created in the quenching and tempering
process39 If the welding is done with no
preheat and low energy input, this quality is
retained in the steel. However, under weld-
the fusion zone which undergoes metallurgical ing conditions involving high restraint,
change during the weld process39. moisture on the steel, too-high moisture
content in the electrodes, or low weld metal
Because the temperature gradient bet;,..,een ductility, preheating may be required. But
the fusion zone and the body of the parent preheating or high energy inputs decrease
shape is steep, the weld area upon cooling
m ust experience a ce rtain amount of plastic
flow. The extent of the area involved de
pends on the geometry of the shapes, the
type, heat, and speed of welding, and on the
rate of cooling. If the weld area is the last
to cool, and if there has been sufficient tem
perature difference and restraint across th e
shapes, the residual welding stress will be
at the yield point of the we ld metal or in the
parent metal of the heat-affected zone. This
may or may not be greater than the yield
point of the unwelded parent metal 54
In A 7 steel plates, the residual stresses
in or near the weld metal may be about 50%
above the yield strength of the parent metal44
This residual stress is not only in the direc
tion of travel of the weld, but may in fact be
triaxial, possibly at yield point, depending
on the geometry of the section and to a lesser
degree on the other factors mentioned. This
suggests a basic similarity of stress condi
tion between butt welds and cover plate-to
flange fillet we l ds.
-7-
the cooling rate which results in the low
carbon martensite being replaced by high
carbon martensite or bainite and a corre
sponding decrease in notch toughness. There
is a marked tendency on the part of "T- 1"
steel weldments to crack on cooling. A series
of tests employing the Lehigh and Tekken re
straint specimens32
indicates that most
cracking initiated at the root of the weld about
three minutes after welding at temperatures
below 90 ° C. Many of the cracks did not ap
pear on the surface. Beneficial effects were
reported from either preheating or post
heating. Another investigation found that
rapid cooling of the welds by water q uenching
also eliminated cracking in cruciform tests
using either 1/2" or 1" plates 8 These are
very severe tests, so it appears that with
reasonable care cracking can be eliminated
from most applications involving "T - 1" steel.
The manufacturer points out that with proper
electrodes, correct welding heat, and recom
mended procedure, " T -1" steel can usually
be easily and reliably welde d52
Fatigue Strength of Welded Members
The effects of the residual welding stres
ses on t.he fatigue strength of the structure
are a~ilar to those of the residual st res se s
discussed before except that they are in
general more severe and are more subject
to discontinuities. Studies of the fatigue
characteristics of welded joints in structural
steel have shown that the effects of stress
raisers, such as notches and discontinuities,
may be greater than the effects of residual
ld . t · 5o Th lt f 1 w e ing s resses e resu s o severa
fatigue tests of butt welds show that the for
mation of metallurgical and geometrical
stress raisers and the intrinsic change in
homogeneity of material due to welding have
been interpreted to cause the reduction in
fatigue life found in welded joints23
• A
method for determining a fatigue factor to be
used in reducing allowable design stresses
for various weld configurations has been
fillet welds so that the ends of the cover plate
were not critical 56 . It was determined that
for 2, 000, 000 load cycles the fatigue strength
of the beams with cover plates attached by
continuous fillet welds was only 73% of that
for plain rolled be~ms,and with cover plates
attached by intermittent fillet welds, only 53%.
The corresponding applied stresses were
31, 200 psi for plain rolled beams, 22, 800 psi
for beams with cover plates attached by con
tinuous fillet welds, and 16, 500 psi for the
beams with cover plates attached by inter
mittent fillet welds. On the basis of static
load tests the rolled beams carried 71. 2%
of ultimate for 2, 000, 000 applications of
load; the beams with cover plates attached
by continuous welds carried 38. 5%, and by
intermittent welds, 33. 5%. No investiga
tion seems to have been made regarding
residual stresses in these tests, however.
4 developed Fatigue tests condu c ted on "T-1" steel
have demonstrate d that butt-welded plates
At the University of Illinois investigations have much l ower fatigue strength than as-
of the fatigue behavior of welded beams and received plates 20 In fact much of the ad-
girders and ai<sociated details have yielded vantage of using high strength steel seems to
h · f t . 17 ' 26• 33 ' Sl Th b l t . th" 1 b ld d rnuc ln orma ion . . ese tests e os in is process, at east at utt-we e
generally point up the danger of indiscrim
inate welding, partic ularly on or near the
splices. Results of constant stress bending
tests of butt-welde d steel plates of 50 ksi and
tension flange . In a recent summary of the s e 90ksi yie ld strength s indicated that the fa-
fatigue studie s the conclusion is that for
welded girder highway bridges loaded from
1/4 to 1/2 tension to tension, all member s
tested but those with partial le ngth cover
plates, and possibly those with splices, ap
pear to have adequate fatigue c.apacity at
basic design stresses for 2, 000, 000 cycles
of loading38 If AWS Formula I is used for
the allowable design stresses at the ends of
partial le·ngth cover plates, they too should
be safe.
An earlier investigation checked the
fatigue strength of rolled beams with cover
tigue strengths of the lower strength steel
for 100, 000 cycles was at or near yield, but
that the fatigue strength of the higher strength
steel was considerably below yield, and in
fact had an advantage of only 4 ksi over the . 16
lower strength steel . In these tests it was
noted also that weld bead shape seemed to be
the most important variable.
Welding in most cases has been found to ' .
reduce the fatigue strength of the unwelded
parent metal. This reduction is most notable
and consistent when the number of cycles is
relatively large . The effects are also more
plates attached by continuous and intermittent marked in higher strengt}:i steels.
-8-
PREPARATION OF SPECIMENS
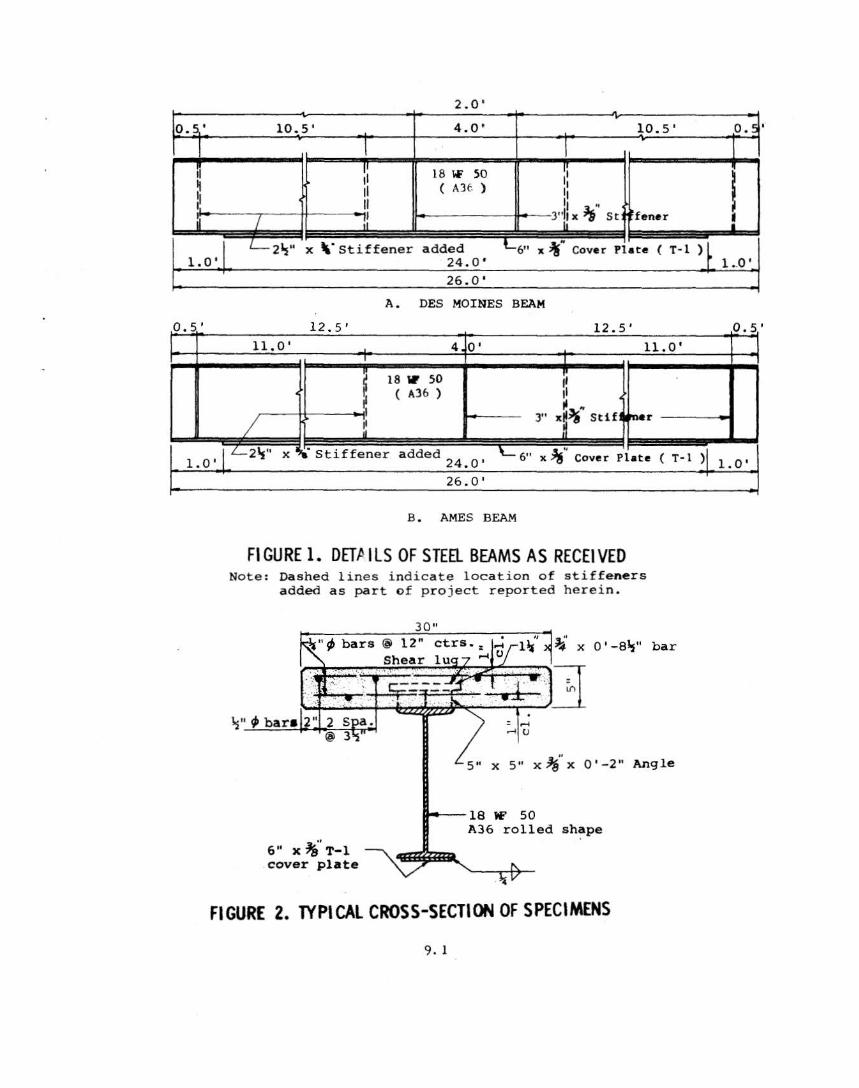
The basic components of the specimens
were a rolled shape, a cover plate, and a
concrete slab. In a previous research pro
ject a cover plate had been so welded to the
bottom flange of each rolled shape that the
resulting beam had been prestressed. ln
this project a concrete slab was cast on the
top flange of these beams to form a com
posite beam (figure l).
The fir st beam had been fabricated at a
plant in Des Moines, Iowa, and was desig
nated as the "Des Moines beam". The
second beam was fabricated by welders of
the same Des Moines firm in the Iowa State
Hi ghway Commission facilities in Ames,
Iowa . This beam is the "Ames beam".
MATERIALS
The steel beams were prestressed to
utilize more efficiently two different types of
steel. High strength steel was used for the
6 x 3/8 in. cover plates. The steel, a
quenched and tempered weldable low-carbon
alloy, was developed by United States Steel
Corporat ion and patented as "T-1" construc
tional alloy steel53
The rolled shapes used
were ordered to meet the minimum require
ments of ASTM-A36- 60T 2• PP· 258- 2 60.
The shapes were standard 18-inch wide
flange sections, each 26 feet long and weigh
ing 50 pounds per foot. The rolled section
of the beam identified as the Des Moines
beam was suppled by the Bethlehem Steel
Company, and the rolled section of the Ames
beam was furnished by the Inland Steel
Company.
Concrete for the slab was obtained from
a local ready-mix establishment. A high
strength mix was used to develop the neces
sary strength and to lower the shipping
mission tandard Specifications29• PP· 324- 326.
The coarse aggregate was Ferguson crushed
rock with 1-in. maximum size.
TABLE I. PROPERTIES OF MATERIALS
Stee130 Concrete Property
Modulus of glasticity times 10 (psi) Yield poi nt (ksi) Yield strength for 2% offset (ksi) Tensile strength (ksi)
0.3b ste el (ksi) 2.9 0.7 Maximum tensile stress in A36
18. 7C steel (ksi) 17. 1 15.4 Fatigue crack location "T-1" "T-1" Cycles to fir st crack 646,000 l , 392,200 Cycles to collapse 836, 500 1, 500,400
An inspection of the bottom flange area,
particularly around the welds, was made
daily. A small flashlight and mirror were
used in this examination. It was found that
this inspection could best be made while the
specimen was under cyclic loading so that any
crack could be observed opening and closing.
The general daily operating procedure
was as follows:
1. Each morning, test a static load and
record strain and deflection readings at zero
load, minimum cyclic load, and maximum
cyclic load.
2. Start pulsator and adjust to desired mini
mum and maximum cyclic l oads.
3. Inspect for cracks while under cyclic load.
4. After about 7 hours of operation stop
pulsator and repeat static load test, taking
readings as in Step 1.
5. Re-start pulsator as in Step 2.
6. Stop pulsator about midnight.
This procedure took around 14 to 16 hours
of cyclic loading per day. The specimen under
test was then rested for 8 to 10 hours each day.
Rate of load repetition was held constant at
110 cycles per minute during the testing periods.
Under cyclic loading both specimens were
found to be very stable. The Amsler equip
ment operated without any difficulty, and there
was no tendency on the part of the beams to
work their way out from under the load. Lat
eral stability was provided by light steel
straps which were snugly attached to the test
ing frame and to 1/ 4-inch steel loops cast
into the edge of the slab at the supports and
at the 1/3 points of the span.
RESULTS
aSource: P . F. Barnard5.
bDead load.
c Dead load + liv e load + impact.
Neither specimen carried the design
cyclic load for the projected 2, 000, 000 cycles.
Both failures appeared at stress raisers in
-12-
p ·~ p Ill ~
Compressive Strength 5 10.5' 4' 10. 5'
CJ) CJ) r.:i r:i::: -E-< CJ)
r.:i ~ ~ :>
Li) ~ H <"") ..--! CJ)
CJ)
II II r.:i ll::
x ~ °' ra . ·~ ~ E E 0
°' °' .CJ
~ :::::>
H x ~
0.82 ksi 1
40 1 2 3 4
TEST LOAD P ( kips MINIMUM COMPRESSIVE STRESS ( ksi
FIGURE 5. DESIGN STRESS-LOAD AND FATIGUE STRENGTH DIAGRAM FOR CONCRETE
~" Asphal tic cork pad (typ.) Ames Dial
6" Dia. Jack Head
5" Concrete Slab Taut Wire
18 W' 50 ( A36 )
. Mirror 3" x 3" Angle 2" Dia. Roller
10 . 5' 4 . 0' 10.5'
25 . 0'
FIGURE 6. SET-UP FOR CYCLIC LOAD TESTS 12. 1
5
Figures 7 and 8. The Des Moines beam in position for the fatigue tests.
Figures 9 and 10. The Ames beam in position for the fatigue tests.
12. 2
30"
13 " 13"
l~" l~"
1r- I ~I - s~· ~I ?li
CROSS-SECTION OF SPECIMENS
LEGEND:
y
SR- 4 ELECTRICAL RESISTANCE ST~IN GAGE
GAGE HOLES FOR WHITTEMORE OR BERRY MECHANICAL STRAIN GAGE
FIGURE 11.DETAILS OF STRAIN INSTRUMENTATION AT Ml DSPAN FOR CYCLIC LOAD TESTS
12. 3
the form of weld flaws (table Ill). cover plate and up into the bottom flaaae of
the rolled shape (figure 15). At about 100, 000
A crack in the Des Moines beam was first cycles later, the crack had prog ressed ap
noticed at 646, 000 cycles . This crack at that proximately Z l / Z inches across the bottom
time extended from the edge about 3 inches
or halfway across the b ottom "T-1" cover
p late. When the crack was discovered, the
section seemed to have stabilized somewhat ,
because in the next 80, 000 cycles the c rack
extended only an additional l / 2 inch. The
flange of the A36 beam was not yet visibly
cracked. At about 730, 000 cycles a crack
was noticed just above the crack in the cover
cover plate and about the sa.ine amount ac'l'oas
the rolled beam flange. The rate of the cr•ck
enlargement then accelerated rapidly how
ever, and the beam failed to take the design
load leas than 10 , 000 cycles later. The final
portion of the failure was quite ductile,and the
crack could be seen to advance with each load
application as in the Des Moines beam.
pla.te at the edge of the rolled beam flange. Failure was at a weld flaw (figure• 14, 15) .
Thia crack and the one in the cover plate then The stress raiser was apparently not a crack
progre•sed at about the same rate, so that in the weld, but rather it was at a point where
when the cover plate had completely ruptured an arc had been struck on the edge of the " T-1"
the crack in the rolled shape could be seen to cover plate forming a notch. The crack waa
be about 3 inc he a in from the edge of the flange. not at the root of this rounded notch but at the
The rupture then extended rapidly in a tearing sharp shoulder (figures 16, 17).
process with much " necking. " Finally at
836, 500 cycles, 190, 500 cyles after a crack
had first been noticed, the beam failed to
In neither the Des Moines nor the Ames
beam did the flexural behavior of the beams
carry the design load, so the te st was s topped. give any indication of impending collapse.
A l though no unusual flaw was apparent
at the point of failure before testing , a highly
discolored area across the weld and into the
" T-1" cover plate face was found on the crack
surface (figure s 12 and 13). The well-defined
shape of the discolored area suggests that
t his crack may have started during the fabri
cation process, probably when the weld
cooled. Where the crack appeared,almost
no fusion was found between the weld metal
and the flange of the rolled beam. This may
This is a usual characteristic in fatigue fail
ures of this t ype . Neither static load de-
flection nor strain readings showed any signi
ficant change though failure was imminent.
For example, just 10, 000 cycles prior to col
lapse of the Ames beam, the cambe.r had
decreased only 0. 015 inch or about Z. 5 per
cent of the total deflection due to the applied
jack loads. Strain readings under static load
failed to show any appreciable change.
Although the static load deflections &Ad
explain the late development of the crack in strain measured throughout the tests remained
the rolled beam. nearly constant, the zero readings indicated
that some plastic flow or creep was taking
The fatigue strength of the Ames beam place, and an increasing amount of " set" or
was much better. A crack was first noted loss of camber was shown in the beam as the
on this specimen in the weld area after cyclic loading progressed (figure 18). The
1, 39Z, 200 cycles. At that time the c rack ex- difference in the behavior of the two specime·n•
tended about l inch in fr om th e edge of the was the result of a difference in their stress
- 13 -
Figure 12. At left, the welds in the Des Moines beam before testing. Mirror images of the welds are at the top and bottom of the beam. Arrow at top left shows where fatigue crack developed. Fatigue crack after test is shown at right.
Figure 13. Fatigue fracture surface of Des Moines beam.
13. 1
I
N
Figure 14. The welds in the Ames beam before testing. Mirror images are at the top and bottom.
point of the steel. While the static strength beam indicated failure for any of the selected
would be reduced and the deflection increased, strips at less than 2. 000, 000 cycles of load
the fatigue strength would be increased.
A theory has been proposed that the loss
of strength found in a section with a welded
cover plate, as compared with the loss in a
rolled beam, is due to the effects of the
residual welding stresses 46
. According to
this concept, if the tensile residual stress is
added to the applied stresses, the true oper
ating stresses are obtained. If the resulting
application. Nor did failure actually occur
in any one of these strips. However, resid
ual microstresses in excess of the measured
average stresses were indicated. Therefore,
the lack of correlation found in the diagrams
between the proposed theory and the results
of this study was attributed to the inability
of the investigator to determine the resid-
ual microstresses. The condition of the
welds suggested a severity of stress dis -
range of stress is plotted on a modified continuities not normally foWld in similar
Goodman diagram for as-received plates, weld constructions. Had it been possible to
failure of the welded member will be indicated determine accurately the residual stress,
after about the same number of stress appli- good correlation might have been found .
cations as foWld for as-received plates.
Diagrams have been prepared to check
this proposal using the results obtained in
This theory suggests that whether the
material is smooth, welded,or notched, the
fatigue strength of the material depends en-
these tests. For the Ames beam this proced- tirely on the state of stress at the point of
ure has been performed for the strip desig- failure . When the tensile residual stresses
nated AP- 21 (figure 19). The theoretical load- can relax, or can be made to relax, the
fatigue strength should be improved . (See
Appendix.)
Fatigue failures are generally the result
of a localized microstress condition. The
stress diagram assumes an initial prestress
o f 24. 7 ksi with no load. The minimum and
maximum cyclic loads produced :flexural
stresses in the selected strip of 10. l ksi and
25 . 2 ksi respectively, or theoretical cyclic
stresses ranging from 34. 8 ksi to 49. 9 ksi.
If the applied flexural stresses of 10.1 ksi
tests carried out in this program determined
the fatigue strength of the specimens only at - 16-
40
40
p p .
fl o. s· 14· t 1-0. sj
Tensile Strength
120
100
20 10 20 60 8 100
TEST LOAD P ( kips ) MINIMUM TENSILE STRESS ( ksi
FIGURE 28.STRESS-LOAO AND FATIGUE STRENGTH DIAGRAM FOR T-1 COVER PLATE OF DES MOINES BEAM
120
p p Tensi le Strength ( T-1
I I
30 20 TEST LOAD P
( k.i,ps )
.... Ul
.Y.
10
120
100
80
85. 2 ksi
20 40 60. 80
MINIMUM TENSILE STRESS ( ksi )
Fl GURE 29. STRESS-LOAD AND FATIGUE STRENGTH DIAGRAM FOR T-1 COVER PLATE OF AMES BEAM
16. 1
100 120
the precise location where the crack appeared. service. The static ultimate strength of the
In each fatigue test, therefore, the entire
beam was not evaluated,but only the weakest
point in t he beam·at a particular loading.
This is of significance when one consid
ere the condition of the welds and the resid
ual stress concentrations associated with
weld flaws such as those found on the two
specimens. The average residual stress
values reported were extremely high and
could readily be expected to contribute to
premature failure. But the notch effects in
the weld area suggested strongly that the
residual microstresses were far in excess of
the average values measured. In the high
strength steel some readjustment of the
initial residual stresses probably took place
as plastic flow or slip, b ut the readjustment
was not enough to relax the stresses to safe
values. Since the applied stresses were
added to the high tensile residual welding
stresses, failure in the resulting stress
r ange is not surprising, particularly at a
stress concentration.
This "weakest plane " where failure oc
curred does determine the strength of the
entire specimen. T herefore in a set of
given conditions, the larger the specimen,
the more likely becomes the possibility of a
critical flaw or group of flaws forming a
plane of weakness.
specimens, though not determined, would
probably have measured up to the expecta
tions of the designer. And even 600, 000
cycles of stress repetition at full design load
may be quite satisfactory. The relationship
between the frequency of application of a load
in a constant - load fatigue test and actual ser
vice loads is not clearly established.
The increase in strains and deflection1,
and the general decrease in residual stress,
are indications that some redistribution of
internal stress took place in these tests. It
is likely that most of this redistribution
came as the result of plastic flow in the
weld area. The extent of this fading of the
residual welding stresses was not determined.
The picture in this respect is clouded by
hysteresis, work hardening, and other ef
fects.
As previously pointed out, the specimens
were prestressed to obtain a more favorable
stress pattern, thus allegedly utilizing more
fully the properties of the high strength alloy
steel. The influence of this prestressed
condition on the behavior of the specimens
under repeated load is not indicated clearly.
The residual stress evaluations indicated that
most of the internal stresses "locked in' ' by
the p re st res sing operation were undesirably
concentrated in the weld area. The same
general pattern woul d be expected in an un-
ln welded members the possibility of prestressed bea.m, although the residual
the occurrence of such flaws and defects is tensile stresses might be higher in the weld
inherent. It must be conceded that the stress area of the A36 steel at midspan. The re~a
raisers in the welds were exceptionally severe tive fatigue strength might then depend on
in these specimens. On neither specimen whether relaxation of these welding stresses
did the welding conform to the minimum re- can occur in the un-prestreseed beam.
quirements of the American Welding Society3
Perhaps members similar to those
tested would have peformed adequately in -17-
CONCLUSIONS
Several conclusions may be drawn from
the results of these tests. While the number
of specimens was much too limited to justify
a quantitative analysis, taken in relation to
data and observations previously reported,
the following observations are valid:
1. The high residual stresses in the weld
area contribute substantially to eventual
fatigue failur.e at points of high stress con
centration. Notch effects of many types are
commonly found in welded construction, and
fatigue damage may occur at such stress
raisers before residual stresses can relax
to safe levels.
2. The applied stress values s~perpose·d on
the measured final residual stress values
determine a stress range. This range plot
ted on appropriate modified Goodman dia
grams for as-received plates gives a useful
explanation of the effects of residu al weldin,..:
stresses on fatigue strength.
3. In t he design of welded built-up members
the usefulness of modified Goodman diagrams
for as-received plates such as presented
herein is limited by the indeterminate nature
of the residual welding stresses. A more
direct approach based on modified Goodman
diagrams for butt-welde d plates may b e
practical. but further study is requ ired.
4 . When subjected to repeated l oads a cer
tain amount of relaxation of the high tensile
welding stresses takes place in beams of this
type, both in the A36 and ''T-1" steels.
5. Impending failure may not be detected by
deflection or strain measurements, even
after a sizable fatigue crack has formed .
6. T he fatigue results of these tests were
not adversely affected by the inelastic be
havior of the concrete slab on the compress
ion flange.
-18-
7. Further economy in the field of welded
member design depends on the development
of a sure and economical method of reducing
the loss of fatigue strength associated with
the welding process (see Appendix).
No firm conclusions regarding the bene
fits associated with the prestres sing operation
used in the preparation of these specimens
c ould be drawn. Theoretically the process
should result in a more economical use of
the materials, but this seems to be offset
somewhat by the effects of welding on the
high strength steel.
Fatigue strength has not been generally
accepted a s a design criterion, but there can
be no doubt as to the effect of repeated load
ing on the service life of the structure. The
A WS Speci!ications3
provide guidance with
respect to what constitutes good welded de
sign for fatigue; but the interpretation and
application of these requirements are left to
the engineer . A basic knowledge of fatigue
behavior will there fore serve as an aid in
ensu ring that structures are designed for
efficiency and endurance.
Future studies may show that significant
improvements in welded design may be real
ized by one or more of the methods outlined
in the Appendix or perhaps some other pro
cedure may yet be developed. Because of
costs of this type of construction, an inten
sive resear·.t:h program is warranted. The
contribution to society of the structural
engineer depends not only on the quantity
but also on the efficiency and quality of the
structures he designs.
ACKNOWLEDGEMENTS
The investigation reported herein was
carried out at the Iowa Engineering Experi
ment Station at Iowa State University. The
Highway Re1earch Board of the Iowa State
Higby.ray -Commission was the sponsor.
The facilities of the Research Center of
and strips for the residual stress determin
ations, was accomplished by personnel of
the Engineering Shop of the Iowa Enginee:ring
Experiment Station. The shear luge were fur
nished by the Pittsburg-Des Moine• Steel
Co., Des Moines, Iowa.
the Association of American Railroads were The advice and assistance of Frank A.
made available for the fatigue testing portion Easton, who has had much experience in
of this study . Of particular value were the bridge construction, were helpful.
interest and cooperation of E. J. Ruble,
Executive Research Engineer, and Freeman
P. Drew, Research Engineer, Structures.
The 1taff of the Structures Laboratory per
formed the setting-up and fatigue testing
operations expeditiously and competently.
The preparation of the specimens, in
cluding the forming and casting of the slabs,
all necessary welding and loading for ship
ment, as well as the removal of segments
Several individuals on the staff of the
Iowa State Highway Commission were of
assistance. The interest and cooperation of
S . E. Roberts, Head of the Research Depart
ment and C. A. Pestotnik, Bridge Engineer,
were appreciated, as were the contributions
of Y. H. Gee, John Roland, and Jim Johnson.
Especially helpful was the advice of P. F.
Barnard and W. D. Reneker.
-19-
APPENDIX
WELDING AND FATIGUE STRENGTH
Welded cover plates or girders are widely minimum degree of safety is maintained in'
used and constitute a very practical mode of every case. It may be that at least some ·•
construction. However, the welding process modification of the specifications may be in
by its very nature produces residual stres- order to correct this deficiency.
sea and notch effe.cts which lower fatigue
strength appreciably. The efficiency of
welded design would be much improved if the
original fatigue strength of the parent of base
metal could be re stored in an economical and
dependable manner. Therefore, a study was
made to evaluate the various methods which
have been proposed to increase the fatigue
strength of welded members and to el,lggest
avenues for further research.
WHY RESEARCH IS NEEDED
Structural design in steel leaves much
to be desired so far as fatigue strength is
concerned. A significant loss of fatigue
strength invariably results when welding pro
cedures are employed in the tensile region of
a structural member . This loss of strength
is not reflected in the specifications so far 1 3 as welded cover plates are concerned '
Two members, therefote, designed to the
same specifications may have the same static
strength; but the fatigue strength or service
life of the two members may be much differ
ent.
In the last decade a number of high
strength constructional alloy steels have been
deve loped. The fatigue properties of the
newer steels reveal that they are influenced
to a greater degree by welding or notch ef
fects. While the static strength is increased
appreciably, the fatigue strength may be
increased only slightly, if at a1116
Thie does not mean that current practice
is unsafe . The point is that the most efficient
use is not being made of the materials. The
specifications are intended to insure that a
However, knowledge of fatigue phenomena
has not developed sufficiently to justify sub-
stituting fatigue properties for static prop
erties as a design criteria. Allowable stress
s s for such a modification would probably
have to be based on interpretation of a modi
fied Goodman diagram, not only for each steel
but also for each detail of fabrication. (To
some extent this has been done for A 7 steel3,
pp. 53-65) · The development of a compre -
hensive sei of Goodman diagrams would be
an enormous task, and their use might prove
very complicated and perhaps even confusing.
" It m ust be agreed that present analytical
methods for fatigue design are, by them
selves, inadequate to provide an efficient
structure that is safe from fatigue fail-ure 25, p. 121
RESEARCH POSSIBILITIES
Since lar ge residual welding stresses
commonly occu r and the fatigue strength of
members when welded generally decreases,
several investigators have. tried to find how
to reduce these residual welding stresses or
their accompanying notch e.ffects to increase
fatigue life. Several methods have been used
with varying degrees of success. These
methods· might be grouped into two general
categories: redistribution, or relief of
residual welding stresses, and reduction of
notch effects due to welding.
It is usually difficult to estimate the
economy of a particular method. Each pro
cess costs an additional amount, which must
be balanced against increase in fatigue
-20-
strength. Sin.ce the specifications currently
provide for the same allowable stress for
rolled beams as for welded beams, the same
sec'tion is u s ually required whether or not the
fatigue strength is improved. Therefore the
designer must determine the economy of a
method in terms of increased structure life
and more efficient use of materials.
Redistribution of residual welding stresses
ln general the procedui-es in this cate-
welds, where increases in fatigue strength
of 100 - 600% are reported15
. For this reaaon
·the method may be particularly useful in r.epair work.
Additional study will be required to deter -
mine how satisfactory. thia method will. be as
a standard procedure for" built-up members .
A jig could be designed to hold the. tor.che s.
The beam might then either be moved through
the jig, probably on rollers, or the jig could
gory r.ely on the occurrence of a certain be moved along the beam similar to an a1,1to-
amount of plastic flow in the weld area. This matic welding machine.
yielding results in a relaxation or redistri-
bution of the residual st res se s due to welding . No studies of this method are known to
ln many cases an increase in fatigue strength have been conducted on high strength steels.
is then experienced. Presumably a similar increase in fatigue
strength could be expected.
Low temperature stress relief. Low
temperature stress relieving methods were
developed during World War II in the ship-
b · 1d· . d 22 s f 40 50 k . u1 1ng 1n us try tresses o to s1
were reduced to about zero in butt-welded
plates of mild stee l. This was accomplished
by heating strips on each side of the we ld to
about 3 50 • F. The expansion of the heated
zones then forced plastic flow in the unheated
weld area.
Recently two Russian i nvestigators have
demonstrated that this general method can be
utilized to increase the fatigue strength of
welded b uilt-up members of mild stee115
Following a heat treatment, longitudinal
welds, originally under high tensile residual
stress, were found to be under compressive
residual stress. Tensile residual stresses
were set up in the unnotched portions of the
section away from the welds, thus improving
overall fatigue strength about 20%.
The chief value of this procedure would
seem to lie in the relief of high stress con
centrations such as are found at the ends of
High-temperature stress relieving. At
tempts to increase fatigue strength by re
ducing residual welding stresses by high
temperature stress relieving have been very
successful49• PP· 99-ioo. This method de-
pends on the fact that the yield point of the
steel at high temperature (about 1200°F) is
lowered and plastic flow takes place in
areas of high residual stress. It has become
a rather standard practice to relieve stresses
in welded pressure vessels in this manner 53 • pp. 18-21
This process is expensive, and
care must be exercised to keep the cooling
rate slow enough that new residuals are not
developed.
The tendency of shapes to warp during
this process may create fabrication diffi
culties. Generally this method is not applic
able to welded structural beams.
Prestraining. In experiments on wide
plates of mild steel, investigators have
found it possible to reduce the residual weld
ing stresses .by a tensile preloading or pre-
-21-
. . 36, 57 I d h 1 straining t was reporte t at re ease
of a tensile load in the direction of a weld
would reduce the residual welding stresses
in an amount approximately equal to the
applied nominal tensile stress. The yielding
which takes place in the weld area is evi
denced by a permanent "set" in the member.
On mild steel a slight increase in fatigue
strength was noted after this treatment.
The " Bauschinger effect" has been shown
to increase fatigue strength provided the
d . ' . d12 Th' stress irectlon is not reverse . is
requirement makes the pre straining method
particularly applicable to bridge beams,
since stress reversal occurs only in areas
of reduced moment.
Further prestraining s h ould prove most
useful for high strength steels, but the steel
must be capable of strain-aging in order that
this beneficial effect be realized.
34 48 prove fatigue strength ' These methods
are used to set up favorable compressive
residual stresses on the surface of the m em
ber. The stresses act to reduce the tension
stress of an applied load at the point where
fatigue cracks might be formed. However,
it is difficult to determine how much improve
ment in fatigue strength is due to the residual
stresses so developed and how much to the
hardening of the material. These procedures
are not generally applicable to bridge mem
bers , although a type of peening which may
be useful has recently been tested for ship
t t . 10 F . cons rue ion atlgue strength is said to
be restored to 70 to 80% of that of the base
material following a drop after welding to
50 to 60%.
Reduction of Notch Effects
The methods used to reduce notch effects
are directed to controlling the formation of
stress concentrations or to reducing their
effects on fatigue strength. The procedures
On the other hand, in applying this method make no attempt to alter the internal stres-
to welded steels, particularly high strength
welded steels, it is assumed that the required
plastic flow can actually take p lace. The
available ductility of the metal may be ex
hausted by this process; and embrittlement
may result, especially in a we ld area. This
is, in effect, t he cause of initial weld crack-. 41, pp. 338-339 ing
ses of a member once they are formed.
Improved geometry. Several tests have
shown that the quality, shape, and position
of the weld bead have an effect on fatigue 23, 26, 50, 9
strength Generally these studies
have shown that fatigue strength can be im
proved by :
1. removal of weld reinforcement
Therefore further laboratory investigation 2. use of proper electrode
of this method is required for high strength 3. depositing the weld in a flat position
steels. While the procedure is relatively
simple and inexpensive, the effects on fatigue
life are not apparent, and the author knows of
no investigations in this regard.
Miscellaneous procedures. Coaxing,
peening, and cold working have been used,
primarily in the machine design field, to im -
4. inclining the weld 45 ° to the direction of
tension.
In tests at Iowa State University the
effects of the ratio of longitudinal weld bead
area to plate area on fatigue strength of
mild steel will be investigated. The premise
is that a reduction in the size of the weld may
-22-
also reduce the resulting notch effects or
stress concentrations.
Current practice usually requires only
that welds in welded bridge members be
deposited in accordance with accepted pro
cedures. Quality control of the end product
continues to be a problem in spite of ad
vancements in the field of non:.destructive
testing . Several new and sophisticated
techniques have been introduced, but the
problem is a difficult one for the bridge
engineer because of the shape and location
of the welds and the size of the members
involved. The problem is of such importance
that constant review and study of the various
techniques is warranted.
metal surfaces. The improvement in fatigue
strength was greatest when the coating com
pound contained a carbon chain of at least
twelve.
A practical coating must have a greater
fatigue strength than the metal itself, pre
ferably over a long period of time. It must
remain impervious to atmospheric conditions
and must maintain these properties over a
fairly wide range of temperatures.
Present theory of the mechanism of
fatigue failure indicates that fatigue is
primarily a surface phenomenon and that
l . h f . 21 fissures appear ear yin t e at1gue process .
It is likely that a film which forms an effect
ive barrier to oxygen and water molecules
Use of surface coatings. Another method will reduce or eliminate corrosion in the
of improving fatigue strength may be found stress concentration formed around these
through the use of surface coatings. A German fissures.
investigator has found that the application of
an epoxy coating to the weld and weld-affected
areas of butt - welded plates will increase their
fatigue strength about 7 5%19
. This improve
ment is attributed to the smoothing effect of
the epoxy coating and to the reduction in the
notch effects found at a weld. Another ex
planation might be that stress corrosion is
often associated with fatigue failure. If the
latter, an epoxy coating would shield the
material and substantially slow the process
of stress corrosion.
Tests reported on an unalloyed steel
indicated that this preliminary explanation
of the improvement noted may not prove sat-. f 27, pp. 400-401 s . is actory . pec1mens were
fatigue tested in purified and dried gases,
oxygen, nitrogen, hydrogen, and argon, as
well as in laboratory air. Very little dif
ference in fatigue strength was noted.
Therefore investigations of the use of
surface coatings may result not only in the
development of a very practical and signi-
Supporting evidence may be found in re - ficant method of improving fati gue strength,
ports published of studies at the National but may also lead to further understanding of 18, 28
Bureau of Standards . These tests showed the basic mechanism of fatigue failure. Al-
that an improvement in fatigue strength may though much additional study will be required,
be realized by coating the specimens with an preliminary investigations are very enc our -
oleophobic film, a film which is unwetted by . aging.
all but the lowest-boiling hydrocarbons. These
same films are also hydrophobic and are ef-
fective in preventing corrosion. They form
a tightly packed monomolecular film on
- 23-
REFERENCES
1. Standard specifications for highway bridges. 8th ed. American Assocation of State Highway Officials. 1961.
2. 1960 suppl ement to book of American Society for Testing and Materials standards including tentatives. Part I: Ferrous metals specifications. American Society for Testing and Materials. 1960.
3. Specifications for welded hi hway and railwa brid es. 6th ed. The American Wel mg Society. New Yor . 19
4. Assimacopoulos, Basis Menelaus. "Repeated load tests on 2 x 4-inch plain concrete cylinders." M. S. thesis. Library, Lehigh University. 1959.
5. Barnard, P. F. " Prestressed steel bridges." American Institute of Steel Construction Proceedings . 1961: 75-82. 1961.
6. Beedle, Lynn S. and Lambert Tall. Society of Civil Engineers Proceedings. ST 7: 139-173. 1960.
"Basic column strength. " American (Strudural Division Journal) 86, No.
7. Benson, L. E. ' 'Some considerations regarding the generation and import-ance of residual welding stresses." Residual stresses in metals and metal construction. William R. Osgood, ed. pp. 75 - 83. Reinhold Publishing Corp., New York. 19 54.
8. B radstreet, B. J. "Application of the cruciform test to a study of cracking in "T-1" steel weldments. 11 The Welding Journal. 41: 62s-69s. 1962.
9. Casaud, Roger. Fatigue of metals. Chapman and Hall, Ltd., London , 1953.
10. DeLeiris, H. "Study of the means of increasing fatigue resistance of certain welded assemblies used in ship construction." (Translated title) . Bulletin de !'Association Technique Maritime et Aeronautique. 60: 441-456. 1960. (Original not available; abstracted in Applied Mechanics Review 14: 956. 1961.)
11. Dolan, T homas J. "Basic concepts of fatigue damage in metals.'' Metal fatigue. George Sines and J. L. Waisman eds. pp. 39-67. McGraw-Hill Book Co., Inc. , New York. 1959.
12. Dolan, T homas J . "Residual stress, str ain hardening and fatigue." Internal stresses and fatigue in metals. G. M. Rassweiler and R. T. Alsop eds. pp. ~84-310. Elsevier Publishing Co., New York. 1959.
13. Dugdale, D. S. "Effect of residual stress on fatigue strength." The Welding Journal 38 : 45s-48s . 1959.
14. Erker, A. "Fatigue factor in welded design." The Welding Journal 33: 295s-304s. 1954.
15. Evgrafov, G . K. and V. 0. Osipov. " Residual stresses utilized for improving fatigue strengths of welded structures . '' (In Russian) Svarochnoe Proizvodstvo 10: 10-12. Oct . 1960. (Original not available; translated in Welding Production 10: 12-19. 1960).
16. Fall, H . W., D. L. Brugioni, M. D. Randall and R. E. Monroe. "Improvement of low-cycle fatigue strength of high strength steel weldments. " The Welding Journal. 41: l45s-153s. 1962.
17. Fisher, W. E. and J. E. Stallmeyer. "Behavior of welded built-up beams under repeated loads." Structural Research Series No. 147. Department of Civil Engineering, University of Illinois. 1958.
-24-
•
'
18. Frankel, H. E., J . A. Bennett and W. L. Holshouser. 11E Uect of oleophobic films on metal fatigue. 11 Journal of Research, U. S. Department of Commerce, National Bureau of Standards, 64C: 147-150. 1960.
19 . Gilde, Werner. " Increasing the fatigue strength of butt-welded joints. 11
The British Welding Journal. 7: 208-211. 1960.
20. Gilligan, J. A. and J. R. England. ''The fabrication and design of structures of "T-1" steel." Highway Research Board Proceedings. 39: 86-102. 1960.
21. Gohn, G. R . "Fatigue of metals. I. The mechanism of fatigue." Materials Research and Standards. 3: 106-115. 1963.
22. Greens, T. W. and A. A. Holzbaur. " Controlled low-temperature stress relieving. 11 The Welding Journal. 11: 171s -185s. 1946.
23. Grover, Horace J. "Estimation of fatigue life of welded, riveted and bolted structures." Metal fatigue. George Sines and J. L. Waisman eds. pp. 307-324. McGraw-Hill Book Co., Inc., New York. 1959.
24. Grover, H. J., S. A. Gordan and L. R. Jackson. Fati~ue of metals and structures. Rev. ed. U. S. Government Printing Office. I 60.
25. Hardrath, H. F. "Fatigue of metals. II. failure." Materials Research and Standards.
Crack propagation and final 3: 116-121. 1963.
26. Harris, L. A., G. E. Nordmark, and N. M. Newmark. " Fatigue strength of butt welds in structural steels." The Welding Journal. 34: 83s-96s. 1955.
27. Hempel, M. R. "Slip bands, twins, and precipitation processes in fatigue stressing." Fracture . B. L. Averbach, D. K. Felbeck, G. T. Hahn and D. A. Thomas eds. pp . 376-411. John Wiley and Sons, Inc., New York. 1959.
28. Holshouser, W. L. and H . F. Utech. "Effect of oleophobic films on fatigue crack formation. " American Society for Testing and Materials Proceedings. 55: 749-754. 1961.
29. "Standard specifications for construction on primary, farm to market and secondary roads and maintenance work on the primary road system; 1960." I owa State Highway Commission. 1960.
30. ''Supporting data for project on prestressed steel beams." Thermofax data. Iowa State Highway Commission, Research Department. 1961.
31. Keith, R. E. "Effects of martensite, bainite and residual stresses on fatigue of welds." The Welding Journal. 38: l42s-143s . 1959.
32. Kihara, H., H. Suzuki and H. Nakamura. " Weld cracking tests of high strength steels and electrodes.'' The Welding Journal. 41: 36s-48s. 1962.
33 . Kouba, N. G. and J. E. Stallmeyer. ''The behavior of stiffened beams under repeated loads . " Structural Research Series No. 173. Department of Civil Engineering, University of Illinois . 1959 .
34. Levy, J. C. and S. L. Kanitkar. "Strain ageing and the fatigue limit of steel." Iron and Steel Institute Journal. 197: 296-300. 1961.
35. Luxion, W. W. and B . G. Johnston. "Plastic behavior of wide flange beams. " The Welding Journal . 27: 538s-554s. 1948.
36. Meriam, J. L., E. P. DeGarmo and Finn Jonassen. "Redistribution of residual welding stresses by tensile loading." The Welding Journal. 11: 697s-699s. 1946.
-25-
37. Moore , H . F. and J . B. Kommers. The fatigue of metals. 1st ed. McGrawHill Book Co., Inc., New York. 1927.
38. Munse, W. H. and J. E. Stallmeyer. "Fatigue in welded beams and girders. " Highway Research Board Bulletin 315: 45-62. 1961.
39 . Nippes, E. F. "The weld heat-affected zone." The Welding Journal. 38 : l s-18s. 1959.
40. Nordby, Gene M. "Fatigue of concrete; a review of research." American Concrete Institute Journal. 30: 191-219. 1958.
41. Osgood, William R . Residual stresses in metal and metal construction. Reinhold Publishing Corp., New York. 1954.
42. Pattinson, E. J . and D. S. Dugdale. "Fading of residual stresses due to repeated loading. 11 Metallurgia. 66: 228-230. 1962.
44. Rao, N. R. Nagaraja and Lambert Tall. " Residual stresses in welded plates. " The Welding J ournal. 40: 468s-480s. 1961.
45 . Reemsnyder, H. S. " The fatigue behavior of structural s teel weldments; a literature survey." Fritz Engineering Laboratory Report No. 284. 1, Lehigh University. 1961.
46. Reneker, W. DanielandC. E. Ekberg, Jr. "The flexural fatigue strength of prestressed steel I-beams." Mimeograph. Engineering Experiment Station, Iowa State University of Science and Technology, 1962.
47. Rosenthal, D. and G. Sines. " E ffect of residual stress on the fatigue strengt h of notched specimens . " American Society for Testing and Materials Proceedings. 51: 593-608. 1951.
48. Society of Automotive Engineers, Inc. Division 4 of Iron and Steel Technical Committee. " Influence of residual stress on fatigue of steel. " SAE J783: New York. 1962.
49. Sparagen, W. "Residual stresses in welding. " Residual stresses in metals and metal construction. William R . Osgood e d . pp. 85-102. Reinhold Pub-lishing Corp., New York . 1954.
50. Sparagen, W. and D. Rosenthal. The Welding J ournal. 21 : 297s-348s.
"Fatigue strength of welded joints. " 1942.
51. Stallmeyer, J. E ., W. H. Munse and B . J. Goodal. " Behavior of welded built-up beams u nder repeated loads." The Welding Journal 36: 27s-36s . 1957.
52. "How to weld USS " T-1" and T -1 T ype A' steels." United States Steel Publication No. ADUCO 01006. 1962.
53. " USS " T-1" steel." United States Steel Publication No. ADUCO 01060-59. 1959.
54. Weck, R . "Residual stresses due to welding . " The Welding Journal. 28: 9s-14s. 1949.
55. We ibull, W. Fatigue testing and analysis of results . Pergamon Press, Inc., New York. 1961.
56. Wilson, W. M. " Flexural fatigue strength of steel beams. " Bulletin 377. Engineering Experiment Station, University of Illinois. 1948 . .
-26-
•
•
•
57: Wilson,W. M. and C. C. Hao. "Residual stresses in welded structures." The Welding Journal. 12: 295s-320s . 1947.
58. Wood, W. A. "Some basic studies of fatigue in metals. " Fracture. B. L. Averbach, D. K. Felbeck, G. T. Hahn and D. A. Thomas eds. pp.
412-433. John Wiley and Sons, Inc., New York. 1959.
59. Wood,W. A. and H . M. Bendler. "Effect of superimposed static tension on the fatigue process in copper subjected to alternating torsion. " Metallurgical Society of AIME Transactions. 224: 18-26. 1962.
60. Wood,W. A . and H. M. Bendler. "The fatigue process in copper as studied by electron metallography. " Metallurgical Society of AIME Transactions. 224: 180-186. 1962 .