10th International Conference on Composite Science and Technology ICCST/10 A.L. Araúo, J.R. Correia, C.M. Mota Soares, et al. (Editors) c IDMEC 2015 Fatigue evaluation and enhanced shear strain measurements of bonded composite joints T. Löbel, H. Sonnenberg, D. Holzhüter, C. Hühne DLR, German Aerospace Center Lilienthalplatz 7, 38108 Braunschweig, Germany [email protected]Keywords: Adhesive Bonding; Digital image correlation (DIC); Fatigue; Crack growth. Summary: In this study, the crack growth behavior and shear stress distribution under typ- ical loading conditions is studied for a composite bonded joint. A novel approach of strain measurement is presented by using a high-resolution digital image correlation system (DIC) which allows detailed investigations of the shear strain distribution within the bondline. By testing 7 different load levels with 3 specimens each in fatigue the crack growth rates, the crack growth threshold and the Paris Law correlation are obtained for an aerospace epoxy adhesive. 1. INTRODUCTION 1.1 Today’s usage and limitations of bonded composite joint for aircraft applications Implementing more CFRP load-bearing parts to achieve competitive lightweight structures de- mands efficient solutions in terms of joining technology. With bolting on the one hand and adhesive bonding on the other, there are two major joining techniques available for thermoset composites which are the majority of composites used for aeronautical applications. From a mechanical perspective, adhesive bonding is the favorable joining technique for several rea- sons. Adhesive bonds lead to weight reduction, offer a more uniform load distribution, are capable of joining thin-walled parts and minimize material weakening. The presence of fasten- ers has a noticeable impact on the part design and could even be a key dimensioning factor and thereby hamper the full lightweight potentials of composites [1]. Therefore, the development of adhesive bonds being capable for certification is of high interest. For civil aircraft, bonding of composites is well-established for various secondary joints. Air- bus’ A380 features bonded joints for instance in the rear pressure bulkhead, the ailerons, the vertical tail plane and the radome [3] as shown in Fig. 1. For the latest aircraft of the Airbus family (Airbus A350XWB), a large share of stiffeners are (composite to composite) bonded joints leading to an overall bondline length of about 5 km per aircraft [2].
Transcript
10th International Conference on Composite Science and Technology
ICCST/10
A.L. Araúo, J.R. Correia, C.M. Mota Soares, et al. (Editors)
Keywords: Adhesive Bonding; Digital image correlation (DIC); Fatigue; Crack growth.
Summary: In this study, the crack growth behavior and shear stress distribution under typ-ical loading conditions is studied for a composite bonded joint. A novel approach of strainmeasurement is presented by using a high-resolution digital image correlation system (DIC)which allows detailed investigations of the shear strain distribution within the bondline. Bytesting 7 different load levels with 3 specimens each in fatigue the crack growth rates, the crackgrowth threshold and the Paris Law correlation are obtained for an aerospace epoxy adhesive.
1. INTRODUCTION
1.1 Today’s usage and limitations of bonded composite joint for aircraft applications
Implementing more CFRP load-bearing parts to achieve competitive lightweight structures de-mands efficient solutions in terms of joining technology. With bolting on the one hand andadhesive bonding on the other, there are two major joining techniques available for thermosetcomposites which are the majority of composites used for aeronautical applications. From amechanical perspective, adhesive bonding is the favorable joining technique for several rea-sons. Adhesive bonds lead to weight reduction, offer a more uniform load distribution, arecapable of joining thin-walled parts and minimize material weakening. The presence of fasten-ers has a noticeable impact on the part design and could even be a key dimensioning factor andthereby hamper the full lightweight potentials of composites [1]. Therefore, the developmentof adhesive bonds being capable for certification is of high interest.
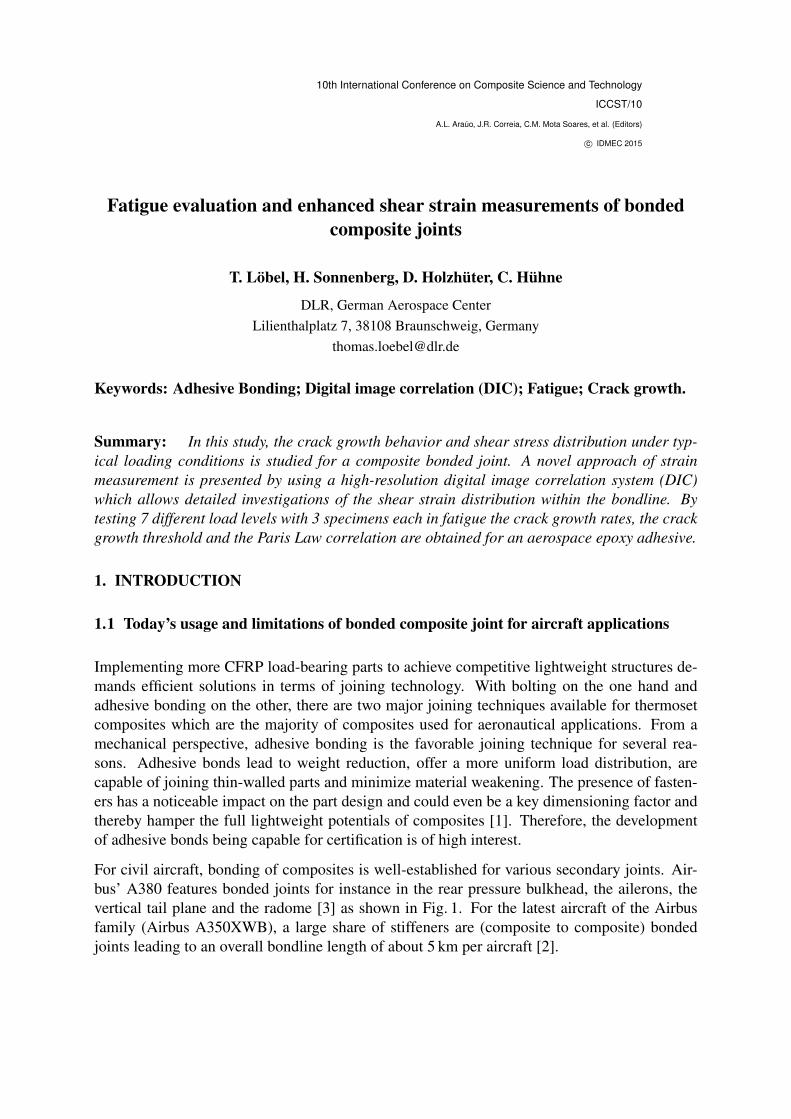
For civil aircraft, bonding of composites is well-established for various secondary joints. Air-bus’ A380 features bonded joints for instance in the rear pressure bulkhead, the ailerons, thevertical tail plane and the radome [3] as shown in Fig. 1. For the latest aircraft of the Airbusfamily (Airbus A350XWB), a large share of stiffeners are (composite to composite) bondedjoints leading to an overall bondline length of about 5 km per aircraft [2].
T. Löbel, H. Sonnenberg, D. Holzhüter, C. Hühne
However, due to certification requirements [4, 5] the implementation of bonded joints in aircraftcomposite structures is still limited to secondary joints or combined with so called "chickenrivets" if used in primary joints. Those additional fasteners have to be capable to carry relevantloads in case of a global failure of the bondline [2]. Design benefits that come along withadhesive bonding don‘t come into effect, since fastening elements must be taken into accountfor part design. Thus, the potential of adhesive bonding is not used to its full extent.
Besides manufacturing uncertainties (e.g. surface treatment, curing cycle and humidity), ag-ing and fatigue life of bonded composite joints is still challenging to predict and influenced bymany factors (e.g. load level, strain rate and environmental conditions) [6, 7, 8]. Furthermore,in-service damages (e.g. impact events) could hardly be avoided and may lead to a noticeabledecrease of the joint’s strength [6, 9]. Eventually, all those factors led in some cases to sig-nificant scatter in the performance of bonded composite joints in the past with some workingwell and some failing after short time in service [10]. Those experiences have caused a distrusttowards adhesive bonding as joining technology.
Figure 1. Usage of adhesive bonding in the Airbus A380 [3]
1.2 Framework for the experimental investigations in this study
As discussed above, the potential existence of local weak bonds due to flaws or deviationsduring manufacturing or due to in-service damage events must be taken into account for bondedjoints. Stress concentrations at disbond edges may lead to growing cracks under fatigue loadingconditions. According to the regulations [4, 5], one promising way to achieve airworthinessof bonded CFRP joints is the establishment of disbond-constraining design features. Basedon this situation, finding, designing and evaluating possible disbond stopping design features
2
T. Löbel, H. Sonnenberg, D. Holzhüter, C. Hühne
is the overall goal of the European Project BOPACS1. To evaluate such features, the crackgrowth behavior and the stress distribution within the bondline under typical loading conditionsis studied.
2. SPECIMEN DESIGN AND TEST DEFINITION
2.1 General Considerations
The Crack Lap Shear (CLS) specimen as shown in Fig. 2 is chosen for all tests. The con-figuration is predominantly loaded in shear and especially representative for long low loadedoverlap joints (e.g. stringer to skin configurations). CLS tests are often used to obtain fracturetoughness data. The test configuration allows defined crack propagation. Various studies (e.g.[11]) show that the mixed mode ratio (peel to shear) within the bondline is almost constantfor different crack length. Analytical closed form solutions [12] also indicate that the fracturetoughness is independent of the crack length. Thus, the CLS specimen would also be applicablefor investigations of crack-stopping design features.
350
200
4.2 2
105050
25
Artificial
Disbond
StrapLap
Figure 2. CLS geometry (all length in mm)
A zigzag shaped release film is used to introduce the crack in the adhesive at the edge fromstrap to lap. Thereby, crack initiation is believed to be more even and thus predictable. A ratherlong lap section is chosen to avoid clamping effects on the crack growth for about 100 mmcrack length. Besides, the long overlap allows the implementation of crack-constraining designfeatures in subsequent studies. An additional tab is bonded at the strap‘s end (clamping area) toavoid an eccentric test setup. No additional tabs are used on the opposite (lap) side.
1Boltless assembling of Primary Aerospace Composite Structures
3
T. Löbel, H. Sonnenberg, D. Holzhüter, C. Hühne
2.2 Static Tests
Static tests are carried out displacement driven with 2 mm/min at room temperature. The undis-turbed tensile strength of the CLS configuration is determined by testing 9 specimens withoutany artificial disbond. The specimen‘s strain is determined by the use of strain gauges on thestrap and lap.
2.3 Preliminary dynamic-mechanical analysis (DMA)
Toughened adhesives show a strain-rate dependency due to visco-elastic effects [9]. Since thestrain-rate dependency might effect the test results, a suitable test frequency for fatigue testsneeds to be determined that minimizes testing time and also avoids undesired strain-rate hard-ening. Therefore, dynamic-mechanical analysis (DMA) is used to determine the strain-ratedependency of the adhesive‘s elastic modulus.
A rectangular bar of pure adhesive (60 mm x 5 mm x 2 mm) is tested in three point bendingaccording to ASTM D5023-01. The modulus (both, elastic and loss) is determined at isothermalconditions (20◦ C) as a function of frequency.
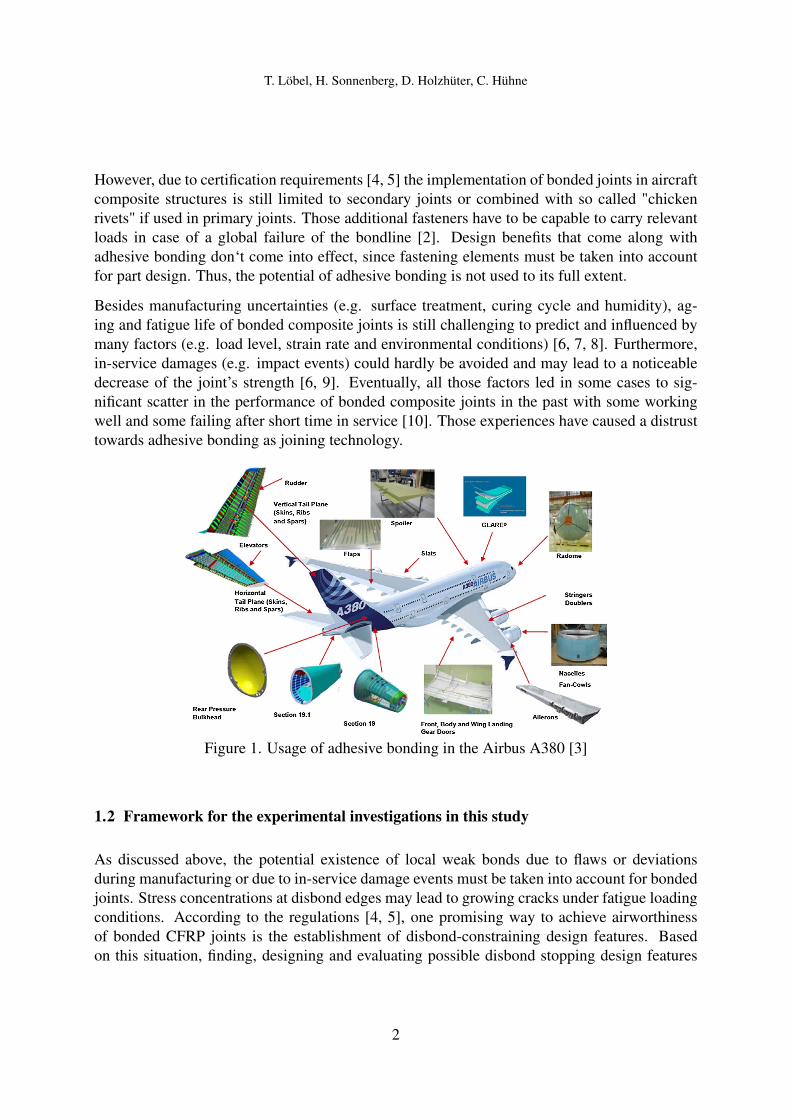
Table 1. DMA results: strain-rate dependency of elastic modulus
test frequency [Hz] 1 2 3 4 5 6 7 8 9 10relative increase of modulus [%] 0 0.61 0.98 1.27 1.43 1.72 1.84 1.88 2.00 2.25
As indicated in Table 1, a slight stiffness increase is measured for frequencies between 1 Hz and10 Hz. However, the influence is rather small (less than 2.5 %). Therefore, the test frequencyfor fatigue tests is set to 8 Hz in agreement with project partners. A thermal influence due tofrictional heat is not expected.
2.4 Fatigue Tests
As for the static load case, all tests are carried out at room temperature. The tests are conductedat 7 different load levels (see Table 2) with 3 specimens for each load level in order to get aprofound data base for fatigue evaluation. The maximum loads (Fmax) are chosen as a value ofstrain in the middle of the strap between the overlap and the clamping region. Although all testsare executed load driven, a strain correlation is made based on measurements that are executedby the use of strain gauges. The load levels are also given in Table 2 as share of the ultimatestatic strength (Fultimate) that is determined beforehand in static tests.
All tests are carried out with a constant amplitude at 8 Hz sinusoidal with a load ratio R of 0.1(tensile-tensile loading) using a servo-hydraulic test machine. The test is terminated either after
4
T. Löbel, H. Sonnenberg, D. Holzhüter, C. Hühne
106 load cycles or after the crack length equals 90 mm. Thus, the maximum testing time perspecimen amounts to approximately 35 hours.
Specimens are manufactured using Hexply 8552/IM7 unidirectional prepreg material. The com-posite plates consist of 16 plies [0/+45/90/-45/0/+45/90/-45]s leading to a plate thickness of2 mm. The 0◦ surface plies in longitudinal direction are chosen to minimize undesired de-lamination failure close to the bondline while testing as described by Baker [1] and Lin et al.[13]. A PTFE release film between the plate’s surface and the steel tooling ensures a constantoverall surface finish. Curing of the prepreg system (180◦ C, 7 bar autoclave cycle) is done inaccordance with the data sheet specifications.
After cleaning with isopropanol, atmospheric plasma is used for surface treatment of bondingsurfaces (Plasmatreat generator FG5001). The process parameters were obtained in previousstudies for optimized surface activation.
Loctite EA 9695 0.05 PSF K as common high strength film adhesive for aerospace applicationsis used as adhesive system. The one-component epoxy film has an average thickness of 0.15 mmafter curing. As for the prepreg material, curing is done in an autoclave cycle (180◦ C, 3.5 bar)to ensure high quality bonding. Afterwards, all plates are trimmed and cut to the final specimendimensions as specified in Fig. 2.
4. MEASUREMENT INSTRUMENTATION
4.1 Digital Image Correlation
The digital image correlation (DIC) system Aramis by Gom is used in static tests allowing acontact-free measurement of the strain field by examination of the specimen‘s edge (side view).The investigation area is divided into a field of facettes which are small rectangular fractions ofthe surface. All displacement and deformation calculations are based on the facette form andposition in comparison to a (initial) reference stage. To distinguish between two neighboringfacettes, a very fine and high contrast surface structure is needed. A very fine and randomsurface pattern is obtained by the use of 2 paint-sprays (black and white).
5
T. Löbel, H. Sonnenberg, D. Holzhüter, C. Hühne
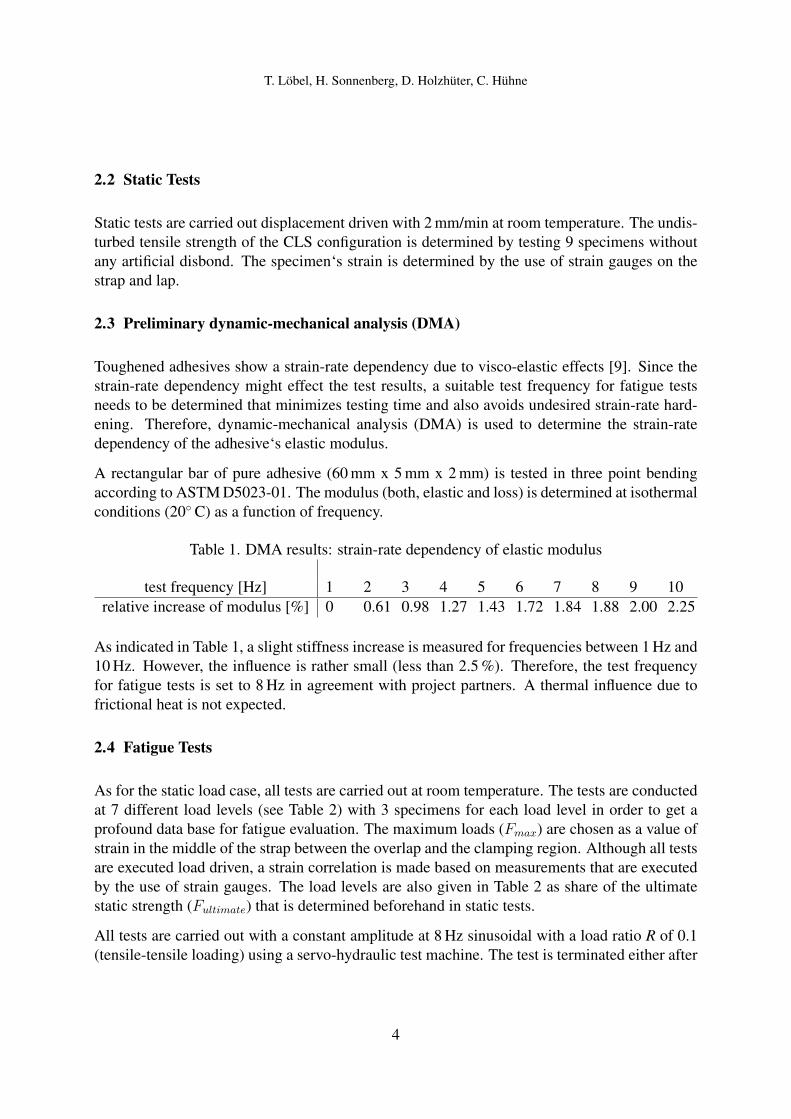
For detailed examinations of the bondline, a field of view of 10 mm by 7.5 mm is chosen leadingto a very fine field of facettes which one facette having the size of 0.017 mm by 0.017 mm. Dueto the high-contrast surface pattern, almost 10 facettes are obtained in the bondline thickness of0.15 mm. Thus, deformations of the adhesive itself are directly measured at the overlap edgefrom strap to lap where high deformations and stresses occur (see Fig. 3).
10 mm
Field of facettes
Lap
Strap
Figure 3. Aramis setup: left - field of facettes; right- overall field of view with fine paint-spraysurface pattern
4.2 Crack growth measurement
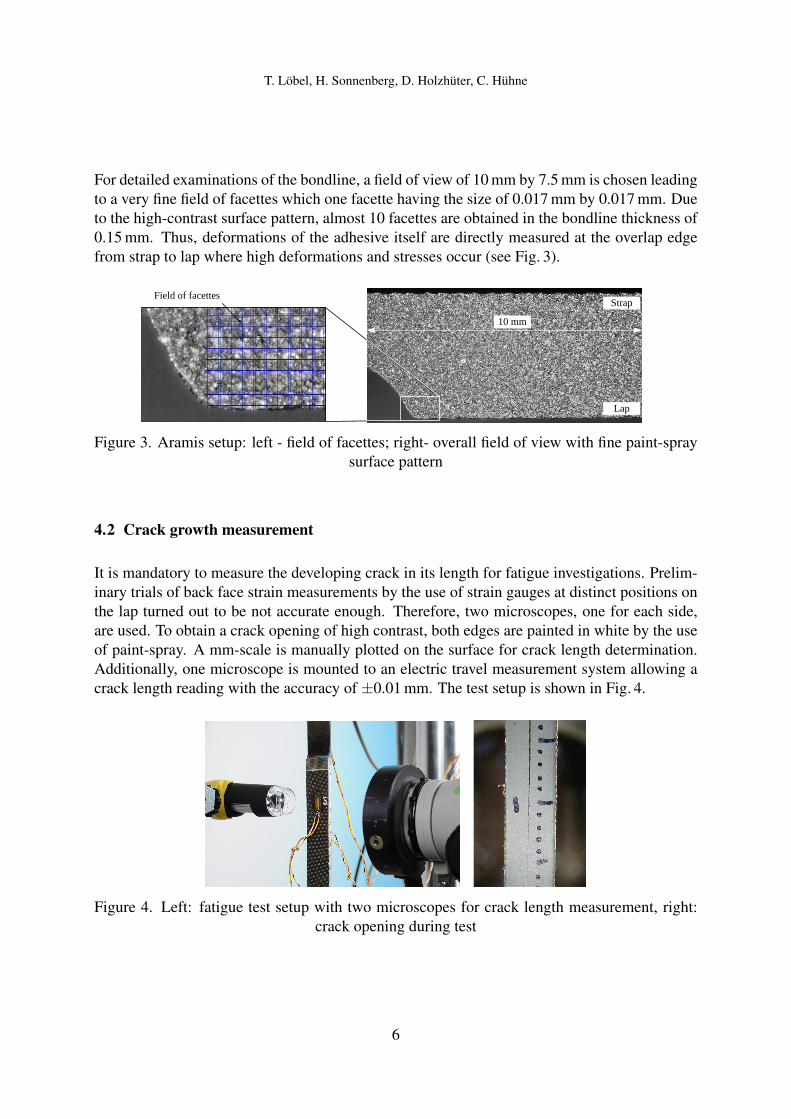
It is mandatory to measure the developing crack in its length for fatigue investigations. Prelim-inary trials of back face strain measurements by the use of strain gauges at distinct positions onthe lap turned out to be not accurate enough. Therefore, two microscopes, one for each side,are used. To obtain a crack opening of high contrast, both edges are painted in white by the useof paint-spray. A mm-scale is manually plotted on the surface for crack length determination.Additionally, one microscope is mounted to an electric travel measurement system allowing acrack length reading with the accuracy of ±0.01 mm. The test setup is shown in Fig. 4.
Figure 4. Left: fatigue test setup with two microscopes for crack length measurement, right:crack opening during test
6
T. Löbel, H. Sonnenberg, D. Holzhüter, C. Hühne
The crack measurement is done every 28 800 load cycles. For high load levels (4000µm/mand 5000µm/m) the measurement is done more frequently.
5. RESULTS
5.1 Static tests
The static tensile strength of the CLS configuration is determined to 26.83 kN with a standarddeviation (SD) of 3.6 %. A thin layered cohesive failure with a minor share of delamination(first ply) is observed as fracture pattern which is typical for this test configuration (see Fig. 5).
Figure 5. I-fracture surface after static test; II - fracture pattern within clamping area createdmanually after testing
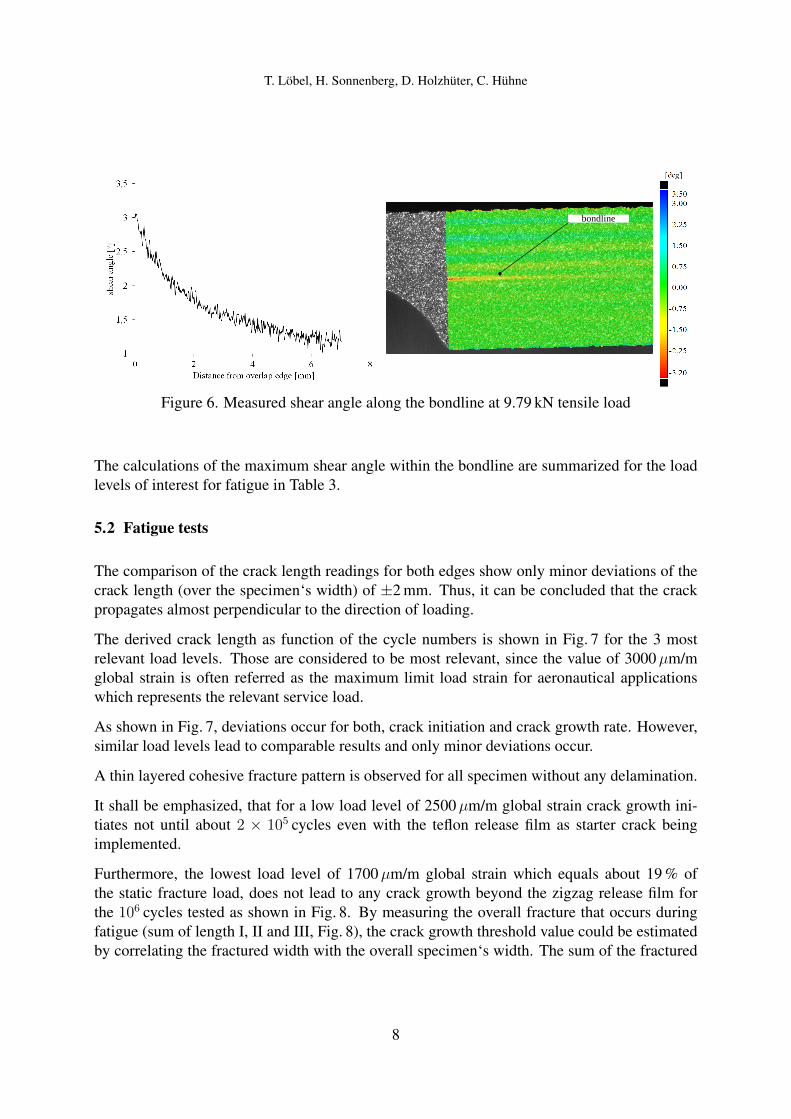
The Aramis measurements allow the determination of the shear angle as function of the appliedload as well as function of the position along the bondline. However, since the directly mea-sured shear angle values within the bondline show some scatter, it is determined indirectly bycomparing the displacement along two lines (one on each adherend) with one being close to theupper bondline edge (δ1) and the other close to the lower bondline edge (δ2). As the distancebetween both lines is known (l), the relative displacement of points on the line can be used todetermine the shear angle (γ) of the bondline by straight forward calculations as shown in equa-tion (1). The displacement measurements show less scatter and thereby allow a more accuratecalculation of the shear angle.
tan(γ) ≈ γ =∆δ
l(1)
As expected, maximum shear appears at the overlap edge between strap to lap (Figure 6). Theshear angle and the shear stress of the bond respectively, progressively decrease with increasingdistance from the overlap edge. Failure initiates when the adhesive strength is locally exceeded.
7
T. Löbel, H. Sonnenberg, D. Holzhüter, C. Hühne
bondline
Figure 6. Measured shear angle along the bondline at 9.79 kN tensile load
The calculations of the maximum shear angle within the bondline are summarized for the loadlevels of interest for fatigue in Table 3.
5.2 Fatigue tests
The comparison of the crack length readings for both edges show only minor deviations of thecrack length (over the specimen‘s width) of ±2 mm. Thus, it can be concluded that the crackpropagates almost perpendicular to the direction of loading.
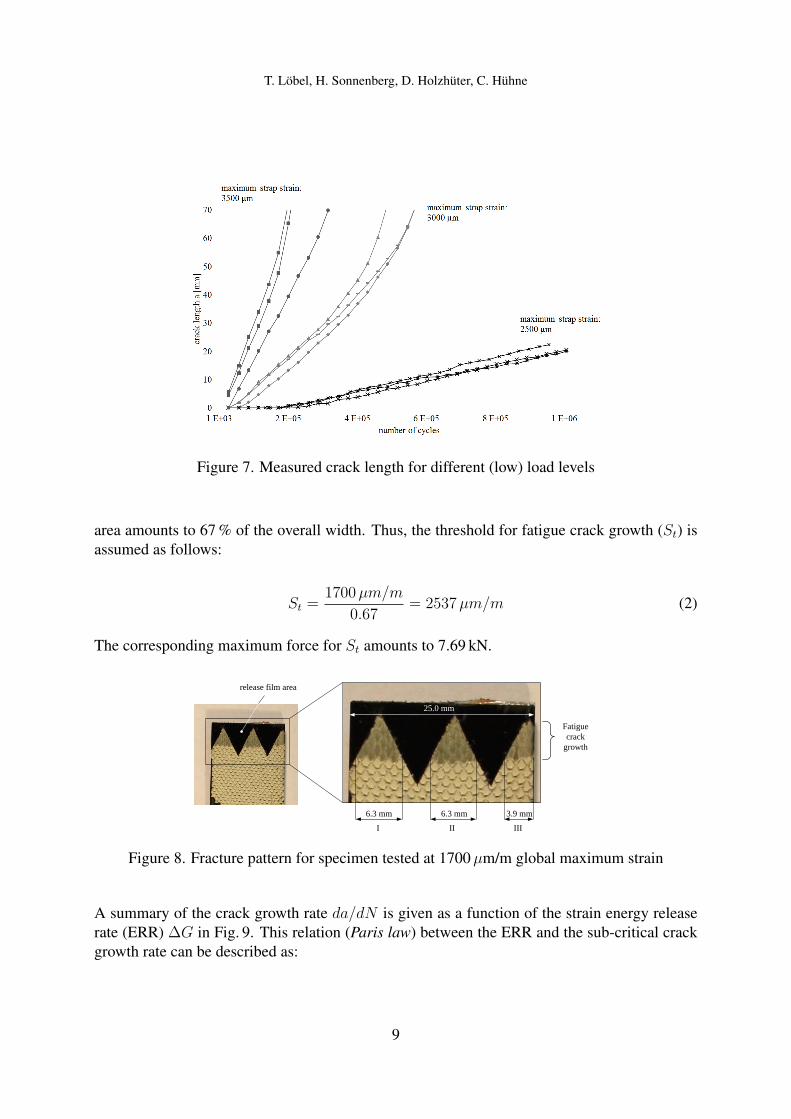
The derived crack length as function of the cycle numbers is shown in Fig. 7 for the 3 mostrelevant load levels. Those are considered to be most relevant, since the value of 3000µm/mglobal strain is often referred as the maximum limit load strain for aeronautical applicationswhich represents the relevant service load.
As shown in Fig. 7, deviations occur for both, crack initiation and crack growth rate. However,similar load levels lead to comparable results and only minor deviations occur.
A thin layered cohesive fracture pattern is observed for all specimen without any delamination.
It shall be emphasized, that for a low load level of 2500µm/m global strain crack growth ini-tiates not until about 2 × 10⁵ cycles even with the teflon release film as starter crack beingimplemented.
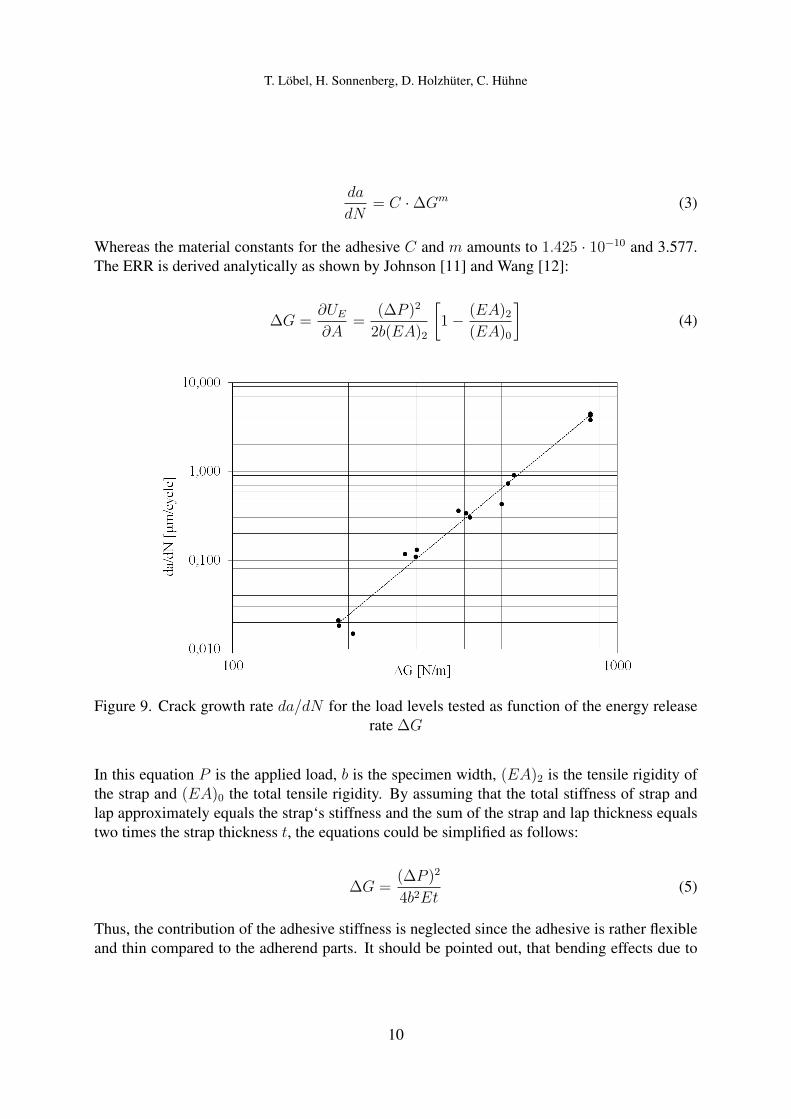
Furthermore, the lowest load level of 1700µm/m global strain which equals about 19 % ofthe static fracture load, does not lead to any crack growth beyond the zigzag release film forthe 106 cycles tested as shown in Fig. 8. By measuring the overall fracture that occurs duringfatigue (sum of length I, II and III, Fig. 8), the crack growth threshold value could be estimatedby correlating the fractured width with the overall specimen‘s width. The sum of the fractured
8
T. Löbel, H. Sonnenberg, D. Holzhüter, C. Hühne
Figure 7. Measured crack length for different (low) load levels
area amounts to 67 % of the overall width. Thus, the threshold for fatigue crack growth (St) isassumed as follows:
St =1700µm/m
0.67= 2537µm/m (2)
The corresponding maximum force for St amounts to 7.69 kN.
6.3 mm 6.3 mm 3.9 mm
25.0 mm
I II III
Fatigue
crack
growth
release film area
Figure 8. Fracture pattern for specimen tested at 1700µm/m global maximum strain
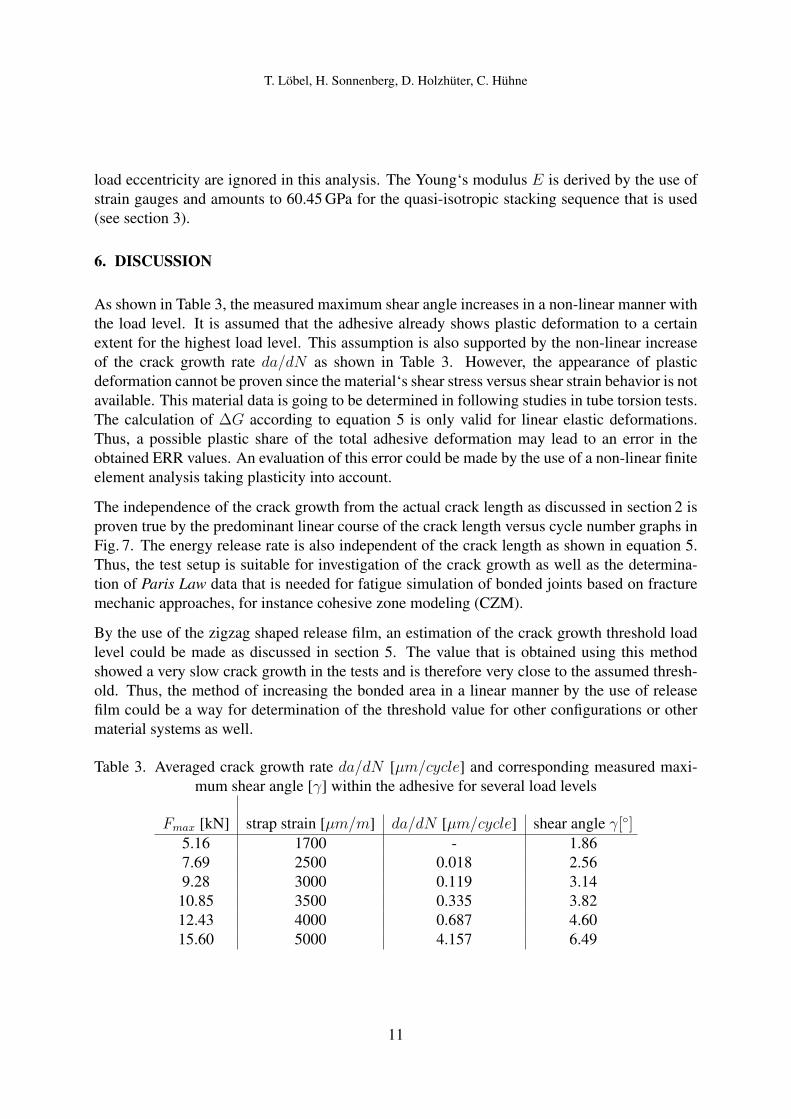
A summary of the crack growth rate da/dN is given as a function of the strain energy releaserate (ERR) ∆G in Fig. 9. This relation (Paris law) between the ERR and the sub-critical crackgrowth rate can be described as:
9
T. Löbel, H. Sonnenberg, D. Holzhüter, C. Hühne
da
dN= C · ∆Gm (3)
Whereas the material constants for the adhesive C and m amounts to 1.425 · 10−10 and 3.577.The ERR is derived analytically as shown by Johnson [11] and Wang [12]:
∆G =∂UE
∂A=
(∆P )2
2b(EA)2
[1 − (EA)2
(EA)0
](4)
Figure 9. Crack growth rate da/dN for the load levels tested as function of the energy releaserate ∆G
In this equation P is the applied load, b is the specimen width, (EA)2 is the tensile rigidity ofthe strap and (EA)0 the total tensile rigidity. By assuming that the total stiffness of strap andlap approximately equals the strap‘s stiffness and the sum of the strap and lap thickness equalstwo times the strap thickness t, the equations could be simplified as follows:
∆G =(∆P )2
4b2Et(5)
Thus, the contribution of the adhesive stiffness is neglected since the adhesive is rather flexibleand thin compared to the adherend parts. It should be pointed out, that bending effects due to
10
T. Löbel, H. Sonnenberg, D. Holzhüter, C. Hühne
load eccentricity are ignored in this analysis. The Young‘s modulus E is derived by the use ofstrain gauges and amounts to 60.45 GPa for the quasi-isotropic stacking sequence that is used(see section 3).
6. DISCUSSION
As shown in Table 3, the measured maximum shear angle increases in a non-linear manner withthe load level. It is assumed that the adhesive already shows plastic deformation to a certainextent for the highest load level. This assumption is also supported by the non-linear increaseof the crack growth rate da/dN as shown in Table 3. However, the appearance of plasticdeformation cannot be proven since the material‘s shear stress versus shear strain behavior is notavailable. This material data is going to be determined in following studies in tube torsion tests.The calculation of ∆G according to equation 5 is only valid for linear elastic deformations.Thus, a possible plastic share of the total adhesive deformation may lead to an error in theobtained ERR values. An evaluation of this error could be made by the use of a non-linear finiteelement analysis taking plasticity into account.
The independence of the crack growth from the actual crack length as discussed in section 2 isproven true by the predominant linear course of the crack length versus cycle number graphs inFig. 7. The energy release rate is also independent of the crack length as shown in equation 5.Thus, the test setup is suitable for investigation of the crack growth as well as the determina-tion of Paris Law data that is needed for fatigue simulation of bonded joints based on fracturemechanic approaches, for instance cohesive zone modeling (CZM).
By the use of the zigzag shaped release film, an estimation of the crack growth threshold loadlevel could be made as discussed in section 5. The value that is obtained using this methodshowed a very slow crack growth in the tests and is therefore very close to the assumed thresh-old. Thus, the method of increasing the bonded area in a linear manner by the use of releasefilm could be a way for determination of the threshold value for other configurations or othermaterial systems as well.
Table 3. Averaged crack growth rate da/dN [µm/cycle] and corresponding measured maxi-mum shear angle [γ] within the adhesive for several load levels
The CLS test is a suitable configuration for fatigue crack growth studies of bonded joints, sinceit represents a realistic shear dominant loading case and allows stable and linear crack prop-agation. The results are therefore useful to obtain material data as input for fatigue models.Moreover, the CLS test is applicable for examinations of crack-constraining design features.Further experimental work will focus on evaluating the crack-stopping ability of several designfeatures that are under investigation within the BOPACS project.
The strain measurements using high-resolution DIC turned out to be very useful to investigatethe shear deformation of the adhesive along the bondline. The results give insight into the dis-tribution of strain which is not feasible with other strain measurement systems and is thereforeof high interest especially for comparison with simulation results.
8. ACKNOWLEDGEMENTS
The presented results are obtained within the project BOPACS of the Seventh Framework Pro-gram (FP7). The authors kindly acknowledge the European Commission for funding the re-search. Appreciations are extended to those who contributed to this work.
References
[1] A. A. Baker, S. Dutton, K. Donald, Composite materials for aircraft structures. 2th ed.American Institute of Aeronautics and Astronautics, 2004.
[2] T. Kruse, Bonding of CFRP Primary Aerospace Structures: Overview in the Technol-ogy Status in the Context of the Certification Boundary Conditions Addressing Needsfor Development. In 19th International Conference on Composite Materials, ICCM 19,5635-5643, 2013.
[3] D. N. Markatos, K. I. Tserpes, E. Rau, S. Markus, B. Erhardt, S. Pantelakis, The effectsof manufacturing-induced and in-service related bonding quality reduction on the mode-Ifracture toughness of composite bonded joints for aeronautical use. Composites: Part B,45, 556-564, 2013.
[4] U.S. Department of Transportation - Federal Aviation Administration (FAA). AMC 20-29Annex II to ED Decision 2010/003/R of 19/07/2010. FAA , 2009.
[6] J. Casas-Rodriguez, J. P. Ashcroft, V. V. Silberschmidt, Damage in adhesively bondedCFRP joints: Sinusoidal and impact-fatigue. Composites Science and Technology, 68(13),2663-2670, 2008.
12
T. Löbel, H. Sonnenberg, D. Holzhüter, C. Hühne
[7] I. A. Ashcroft, M. M. Abdel, A. D. Crocombe, D. J. Hughes, S. J. Shaw, The effect ofenvironment on the fatigue of bonded composite joints. Part 1: testing and fractography.Composites Part A: Applied Science and Manufacturing, 32(1), 45-58, 2001.
[8] N. V. Datla, M. Papini, J. A. Schroeder, J. K. Spelt, Modified DCB and CLS specimensfor mixed-mode fatigue testing of adhesively bonded thin sheets. International Journal ofAdhesion and Adhesives, 30(6), 439-447, 2010.
[9] D. Elder, B. Qi, High strain rate behavior of bonded composite joints. In: Camanho P,Tong L. Composite joints and connections. Cambridge: Woodhead Publishing; 2011, p.484-507.
[10] J. Tomblin, K. Strole, G. Dodosh, L. Ilcewitz, Assessment of Industry Practices for AircraftBonded joints and Structures. FAA Report DOT/FAA/AR-05/13, Washington, 2005.
[11] W. S. Johnson, Stress Analysis of the Crack Lap Shear Specimen. An ASTM Round Robin.NASA Technical Memorandum 89006, 1986.
[12] C. H. Wang, Introduction to fracture mechanics. DSTO-GD-0103. Aeronautical and Mar-itime Research Laboratory, 1996.
[13] K. Y. Lin, W. Liu, Delamination Arrest of Fasteners in Aircraft Composite Structures. In19th International Conference on Composite Materials, ICCM 19, 1577-1580, 2013.