Advanced Steel Construction Vol. 11, No. 3, pp. 383-394 (2015) 383 FATIGUE LIFE EVALUATION FOR CRACKED LONG-SPAN CONTINUOUS PC BRIDGES Xin Ruan 1 , Hai-ying Ma 2,* and Xue-fei Shi 1 1 Department of Bridge Engineering, Email: [email protected]Tongji University, Shanghai, China. 2 ATLSS Center, Lehigh University, PA, USA *(Corresponding author: E-mail: [email protected]) ABSTRACT: Long span pre-stressed concrete box girder bridges are widely constructed in China. Some typical deficiencies, such as unacceptable deflections and cracks in the concrete, often occur in those bridges with increasing service time. The deficiencies change the distribution of internal forces in the girders, which induces new problems, such as fatigue of reinforcements in the girders. In this paper, a fatigue life evaluation for a cracked long-span continuous PC bridges was conducted, which integrated weigh-in-motion (WIM) data and non-destructive examination (NDE) techniques. WIM data was used to investigate properties of vehicle load. The FE models of the cracked structure were developed to analyse the behaviour due to cracks. Various fatigue truck loads were considered in the models. Fatigue life evaluation based on real WIM data was developed to obtain the fatigue stress ranges due to the presence of cracks. Based on the analysis, the service life of the bridge was assessed before and after cracking at critical locations. A pre-stressed concrete box girder bridge, with three spans: 65m+100m+65m, was taken as an example to introduce the method. The present study provides better understandings of the post-cracking behaviour of long span continuous PC bridges. The outcome of this research can be efficiently utilized to reduce the risk of failure and achieve better management of the bridges. Keyword: Continuous PC Bridge, Crack, Vehicular load, Fatigue life evaluation, Weight-in-motion, Stress range DOI:10.18057/IJASC.2015.11.3.11 1. INTRODUCTION Pre-stressed concrete box girder bridges are widely constructed in China. These kinds of bridges are usually designed with full pre-stresses, and cracks are prohibited in the girders. Fatigue is usually not necessary to consider in these bridges. However, with the service time increasing, some typical deficiencies occur in those bridges, such as cracks in the concrete and visible deflections in main spans. The deficiencies affect the durability and even influence the safety of structure. Previous and current research mainly focuses on the effect of cracks to the capacity of structures [1]. Reasons causing these deficiencies may be different from bridge to bridge, but changes of vehicle load and loss of pre-stressing are the most common and critical reasons. Usually these defected structures still hold a certain level of load carrying capacity , but a rapid improvement for durability and more attentions are still necessary [2]. It also should be noticed that the change of internal force distribution and structural behaviours may induce fatigue problems, which has not been studied before. In the past, research was conducted to estimate and analyse the behaviour of concrete structures due to fatigue load [3-14]. Warner and Hulsbos [3] estimated the probable fatigue life of pre-stressed concrete beams. It was found that a steel fatigue failure could occur by successive fracture of the steel reinforcement in the beam. Lindorf and Curbach [4] found that the fatigue of bond between reinforcement and concrete were affected by transverse tension and it was important to separate verification of steel and concrete fatigue. Tilly [5] also studied the fatigue performance of high strength steel reinforcements. Reinforcement fatigue usually needs not to be checked according to AASHTO Specifications unless the pre-stressed tendons suffer a stress higher than the
Transcript
Advanced Steel Construction Vol. 11, No. 3, pp. 383-394 (2015) 383
FATIGUE LIFE EVALUATION FOR CRACKED LONG-SPAN CONTINUOUS PC BRIDGES
ABSTRACT: Long span pre-stressed concrete box girder bridges are widely constructed in China. Some typical deficiencies, such as unacceptable deflections and cracks in the concrete, often occur in those bridges with increasing service time. The deficiencies change the distribution of internal forces in the girders, which induces new problems, such as fatigue of reinforcements in the girders. In this paper, a fatigue life evaluation for a cracked long-span continuous PC bridges was conducted, which integrated weigh-in-motion (WIM) data and non-destructive examination (NDE) techniques. WIM data was used to investigate properties of vehicle load. The FE models of the cracked structure were developed to analyse the behaviour due to cracks. Various fatigue truck loads were considered in the models. Fatigue life evaluation based on real WIM data was developed to obtain the fatigue stress ranges due to the presence of cracks. Based on the analysis, the service life of the bridge was assessed before and after cracking at critical locations. A pre-stressed concrete box girder bridge, with three spans: 65m+100m+65m, was taken as an example to introduce the method. The present study provides better understandings of the post-cracking behaviour of long span continuous PC bridges. The outcome of this research can be efficiently utilized to reduce the risk of failure and achieve better management of the bridges. Keyword: Continuous PC Bridge, Crack, Vehicular load, Fatigue life evaluation, Weight-in-motion, Stress range DOI:10.18057/IJASC.2015.11.3.11
1. INTRODUCTION Pre-stressed concrete box girder bridges are widely constructed in China. These kinds of bridges are usually designed with full pre-stresses, and cracks are prohibited in the girders. Fatigue is usually not necessary to consider in these bridges. However, with the service time increasing, some typical deficiencies occur in those bridges, such as cracks in the concrete and visible deflections in main spans. The deficiencies affect the durability and even influence the safety of structure. Previous and current research mainly focuses on the effect of cracks to the capacity of structures [1]. Reasons causing these deficiencies may be different from bridge to bridge, but changes of vehicle load and loss of pre-stressing are the most common and critical reasons. Usually these defected structures still hold a certain level of load carrying capacity , but a rapid improvement for durability and more attentions are still necessary [2]. It also should be noticed that the change of internal force distribution and structural behaviours may induce fatigue problems, which has not been studied before. In the past, research was conducted to estimate and analyse the behaviour of concrete structures due to fatigue load [3-14]. Warner and Hulsbos [3] estimated the probable fatigue life of pre-stressed concrete beams. It was found that a steel fatigue failure could occur by successive fracture of the steel reinforcement in the beam. Lindorf and Curbach [4] found that the fatigue of bond between reinforcement and concrete were affected by transverse tension and it was important to separate verification of steel and concrete fatigue. Tilly [5] also studied the fatigue performance of high strength steel reinforcements. Reinforcement fatigue usually needs not to be checked according to AASHTO Specifications unless the pre-stressed tendons suffer a stress higher than the
384 Fatigue Life Evaluation for Cracked Long-span Continuous PC Bridges
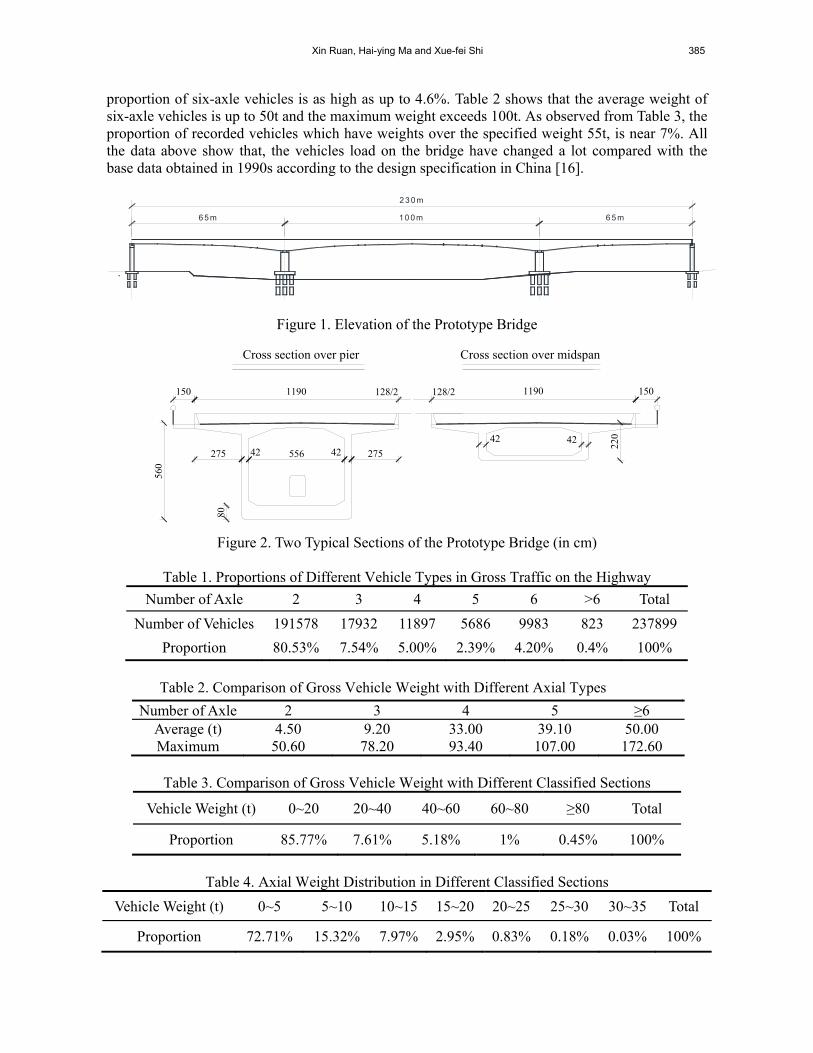
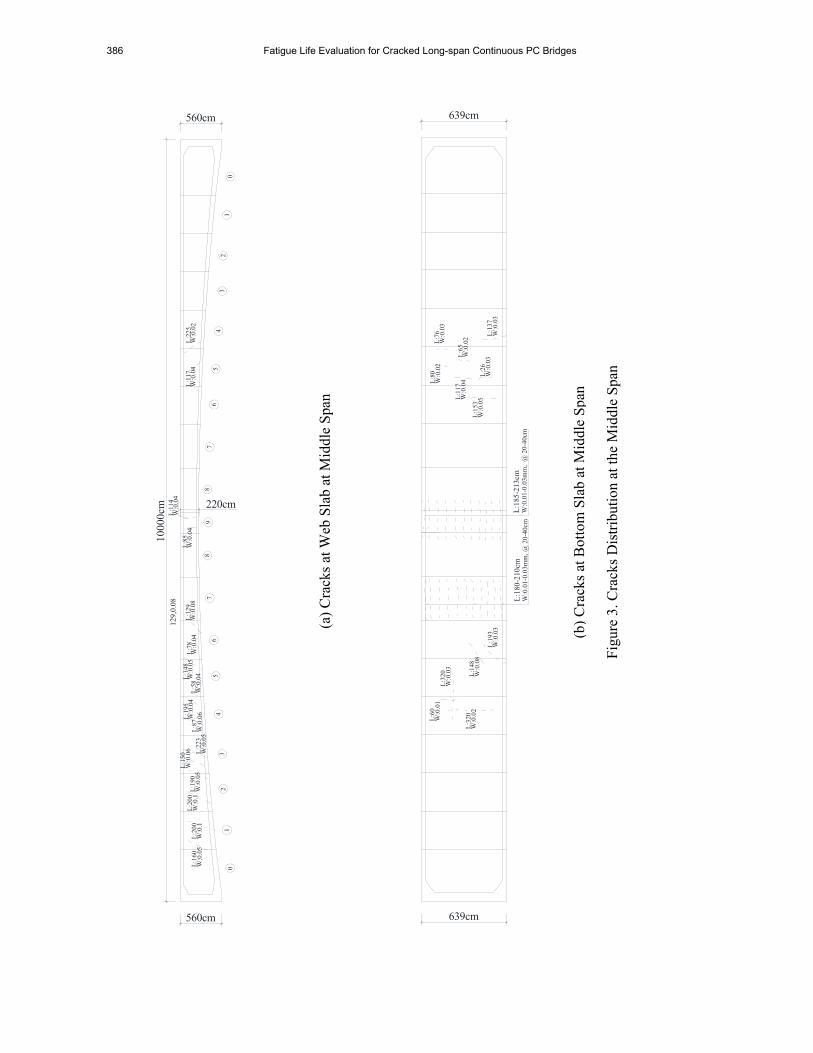
constant-amplitude fatigue threshold, which is usually hard to reach by vehicular loadings [15]. However, for these kinds of defected pre-stress concrete box girder bridges, reinforcements at the cracked parts may have a very high stress range due to cracks of concrete and increase of vehicle load. To assess fatigue life, the fatigue load, reinforcement stress and stress amplitude needs to be determined accurately. Therefore, the identification of current structural condition and vehicle load are very important. In this paper, a fatigue life evaluation for cracked long-span continuous PC bridges was presented, integrating weigh-in-motion (WIM) data and NDE techniques. 2. A TYPICAL LONG SPAN CONTINUOUS PC BRIDGE 2.1 Prototype Bridge In this paper, a typical pre-stressed concrete box girder bridge was taken as an example. The bridge, built in 1996, is located in the highway system in China, and it was constructed with cast on site. The elevation of the bridge is shown in Figure 1. It is a post-tensioned pre-stressed concrete continuous box girder bridge with three spans: 65m+100m+65m. The main girder has a single-cell box cross section, with the height varying from 5.6m (section over pier) to 2.2m (section at middle span). The girder carries two traffic lanes in the same direction. Some typical cross sections are shown in Figure 2. 2.2 Cracks Distribution Several surveys were carried out to record the deflection changes from 1999 to 2008. It is found that the accumulative vertical deflective in the middle span came up to 70 mm due to the traffic in eight years. Some cracks, including transverse cracks on the top and bottom slabs of middle span, and diagonal cracks at the diaphragm of over pier section were observed in the first two years after the bridge was completed. In April 2000, cracks at the webs propagated to the bottom slabs in the middle section of mid span, and continued to propagate at least for four years. In 2007, a detailed survey was made to the bridge. The diagonal cracks occurred at the web in the side and middle span, and a lot of longitudinal cracks occurred at the top and bottom plates. Figure 3a shows the cracks distribution at the web of middle span, some of these cracks already extended to the junction points between web and top plate. Figure 3b shows longitudinal cracks distributed near middle span. Ruan and Shi [2] analysed the crack cause and assessed the cracked structure. The cracks in the web occurred due to the lack of vertical pre-stress tendons for shear resistance in the cracked region, and the cracks at bottom plate were caused by the local pre-stressed force and lower flexural rigidity. 3. LIVE LOAD INVESTAGETION BASED ON WEIGH-IN-MOTION STUDY During the service life of bridges, truck loads are the main changeable loadings, which are of great randomness, high uncertainty and time variability. WIM system can record the truck load information, such as weight, axial load, speed and axial distance, which provides more accurate data resources for analysis. A WIM system was set up on the highway near the bridge location to investigate actual vehicle load. A set of data for two weeks vehicles was recorded and analysed as follow, which included the data of 577,882 axles and 237,899 trucks. The statistical result of different vehicle types according to number of axles is shown in Table 1. Table 2 gives the average and maximum weight of each type of vehicle. Table 3 presents the proportion of vehicle weight. The axle weight proportion comparisons are provided in Table 4. From Table 1, although five-axle vehicles do not take a high proportion, around 2.39%, but the
Xin Ruan, Hai-ying Ma and Xue-fei Shi 385
proportion of six-axle vehicles is as high as up to 4.6%. Table 2 shows that the average weight of six-axle vehicles is up to 50t and the maximum weight exceeds 100t. As observed from Table 3, the proportion of recorded vehicles which have weights over the specified weight 55t, is near 7%. All the data above show that, the vehicles load on the bridge have changed a lot compared with the base data obtained in 1990s according to the design specification in China [16].
2 3 0 m
6 5 m 1 0 0 m 6 5 m
Figure 1. Elevation of the Prototype Bridge
560
80
275 42 556 42 275
150 1190
22042 42
1190 150128/2128/2
Cross section over pier Cross section over midspan
Figure 2. Two Typical Sections of the Prototype Bridge (in cm)
Table 1. Proportions of Different Vehicle Types in Gross Traffic on the Highway
Number of Axle 2 3 4 5 6 >6 Total
Number of Vehicles 191578 17932 11897 5686 9983 823 237899
386 Fatigue Life Evaluation for Cracked Long-span Continuous PC Bridges
1000
0cm
560cm
560cm
01
23
45
67
8
01
23
45
67
89
L:1
60
129,
0.08
220cm
W:0
.05
L:2
00W
:0.1
L:2
00W
:0.1
L:1
90W
:0.0
5L
:223
W:0
.05
L:1
50W
:0.0
6L
:87
W:0
.06
L:1
95W
:0.0
4L
:58
W:0
.04L:1
48W
:0.0
5L
:78
W:0
.04
L:1
29W
:0.0
8L
:85
W:0
.04
L:1
14W
:0.0
4
L:1
17W
:0.0
4L
:225
W:0
.02
639cm
639cm
W:0
.01-
0.03
mm
, @ 2
0-40
cmL
:180
-210
cm
L:6
0W
:0.0
1
L:3
20W
:0.0
2
L:3
20W
:0.0
3
L:1
48W
:0.0
8
L:1
93W
:0.0
3
W:0
.01-
0.03
mm
, @
20-
40cm
L:1
85-2
13cm
L:1
53W
:0.0
5L:1
17W
:0.0
4
L:2
6W
:0.0
3L:6
5W
:0.0
2
L:8
0W
:0.0
2L
:76
W:0
.03
L:1
37W
:0.0
3
(a)
Cra
cks
at W
eb S
lab
at M
iddl
e S
pan
(b)
Cra
cks
at B
otto
m S
lab
at M
iddl
e Sp
an
Fig
ure
3. C
rack
s D
istr
ibut
ion
at th
e M
iddl
e S
pan
Xin Ruan, Hai-ying Ma and Xue-fei Shi 387
4. NUMERICAL SIMULATION Comprehensive numerical simulations are carried out to understand the influence of cracking, the deflections, and also the changing of live load. The pavement surface properties obtained by site inspections, such as thickness, material strength, etc., have been considered in the analysis. A detailed Finite Element Model (FEM) using software ANSYS 10.0 was developed to determine the stresses at various critical locations and to assess the fatigue life of bridges before and after cracking. Figure 4 gives detailed images of the model. The 8-node solid element (C3D8) was selected in the model to emulate the pre-stressed concrete. The 3-dimentional 2-node truss element (LINK8) was used for the pre-stressed tendons bonded in the concrete. The model has 50,495 nodes, and 145,768 elements. The stress-strain relationship of concrete is based on the stress-strain curves of CEB-FIP (1990).
(a) Web Slab and Its Cracks in the FEM
(b) Reinforcement Bars in the FEM
(c) Pre-stress Bar Model in the FEM
Figure 4. FEM of the Bridge Structure
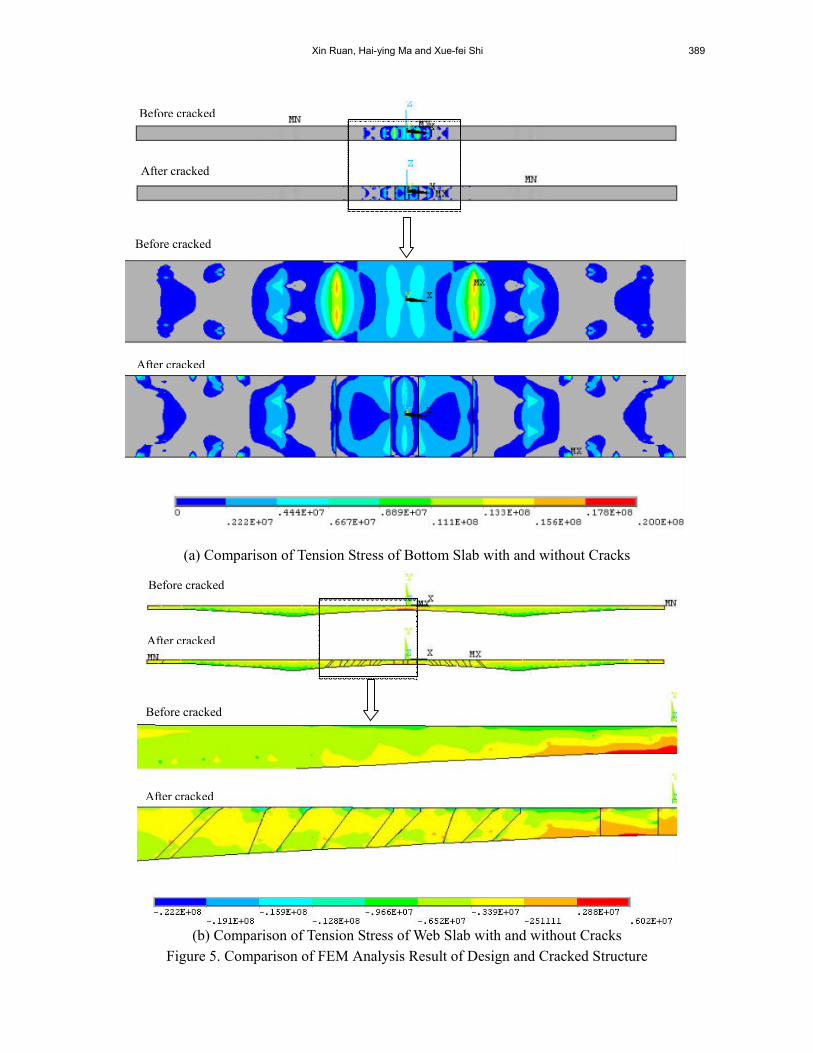
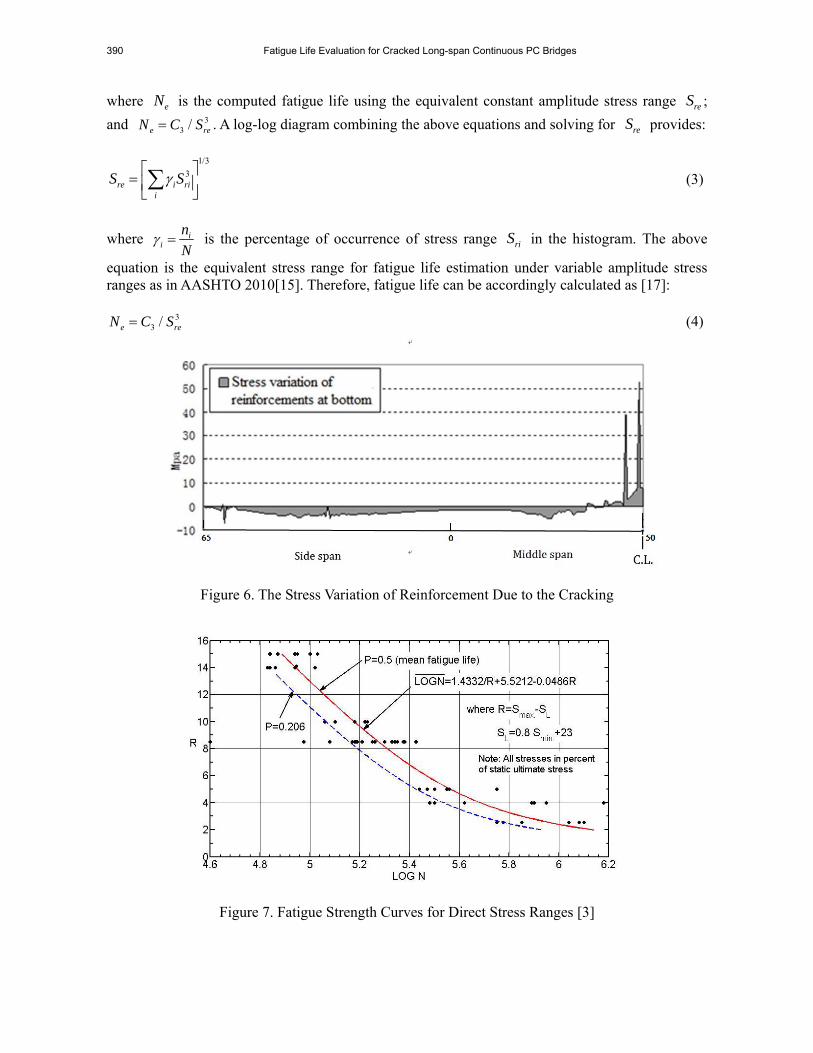
The main cracks on the web slabs and bottom slabs were considered, and pre-stress bars and main reinforcements were considered as link element in the model to simulate the redistribution of force due to the crack. Figure 5 presents the comparison of FEM analysis results of design and cracked structure. It is found that there are obvious differences of the stresses distribution in the slabs before and after cracks occurred. The tension stresses were released because of the crack, and there are still enough compressive stresses in the girders after cracking. Figure 6 shows the stress variation of reinforcements at the bottom plate before and after cracking. The reinforcement stress changes are
388 Fatigue Life Evaluation for Cracked Long-span Continuous PC Bridges
large at the middle of middle span due to lots of cracks. The maximum change is up to 50 MPa. The cracks made the forces in concrete transferred to the reinforcements and pre-stressed tendon. In the cracked area, the tension forces carried by concrete transferred to reinforcements and tendons, which increased the stresses of reinforcements and tendons. In the area around the cracks, the tension stress of concrete also decreased while compression stresses increased. In the area between adjacent cracks, the stress of concrete was also increased due to the bonding with reinforcements. If the bond slip is small, the crack would be engendered. Therefore, cracks changed the stresses distribution in the sections, and caused larger deflections, which reduced the safety of the structure. Due to the cracks, the behavior of bridge changed a lot. This can be very important proof to assess the fatigue problem of the bridge. 5. FATIGUE LIFE ANALYSIS BASED ON WIM DATA 5.1 Fatigue Assessment Procedure using WIM Data Fatigue loads are reconsidered based on WIM data, while not only based on the design specification since the vehicles loads changed compared to that in the specification. Classified trucks are simplified into four categories and the corresponding stress ranges are summarized based on two-week WIM data around the bridge area. The weight of each truck model would be scaled to the actual weight from WIM data. In this way it gives the derived equivalent stress range and the estimated fatigue life for comparison of the bridge models before and after cracking. Fatigue stress-number of cycle (S-N) curves proposed by Warner and Hulsbos [3] for pre-stressed concrete bridges are used to estimate fatigue life by providing designers with an approximate relationship between stress ranges and the number of stress cycles to failure. The S-N curves were developed via experimental testing of typical strands with results from the tests being used to produce the curves within a certain confidence interval. Techniques are available to convert stress ranges at certain location to equivalent stress ranges that can be used with the S-N curves to more accurately estimate fatigue life cycles. 5.2 Formulations of Fatigue Accumulation
To account for different stress ranges due to various truck loads, a linear damage accumulation law is usually assumed in literatures [8]:
i
i i
nT
N (1)
where in is the number of applied load cycles at constant stress level iS and iN is the fatigue
life at constant stress level iS , obtained from the S-N curve; T is the fraction of life consumed by
exposure to the cycles. For a linear S-N curve with a slope of –3, as stipulated in AASHTO LRFD Bridge Design Specifications [AASHTO (2010)] [15], Schiling et al (1978) stipulated that:
ii i
i i e
nn
CN N
(2)
Xin Ruan, Hai-ying Ma and Xue-fei Shi 389
(a) Comparison of Tension Stress of Bottom Slab with and without Cracks
(b) Comparison of Tension Stress of Web Slab with and without Cracks Figure 5. Comparison of FEM Analysis Result of Design and Cracked Structure
Before cracked
After cracked
Before cracked
After cracked
Before cracked
After cracked
Before cracked
After cracked
390 Fatigue Life Evaluation for Cracked Long-span Continuous PC Bridges
where eN is the computed fatigue life using the equivalent constant amplitude stress range reS ;
and 33 /e reN C S . A log-log diagram combining the above equations and solving for reS provides:
1/3
3re i ri
i
S S (3)
where ii
n
N is the percentage of occurrence of stress range riS in the histogram. The above
equation is the equivalent stress range for fatigue life estimation under variable amplitude stress ranges as in AASHTO 2010[15]. Therefore, fatigue life can be accordingly calculated as [17]:
33 /e reN C S (4)
Figure 6. The Stress Variation of Reinforcement Due to the Cracking
Figure 7. Fatigue Strength Curves for Direct Stress Ranges [3]
Xin Ruan, Hai-ying Ma and Xue-fei Shi 391
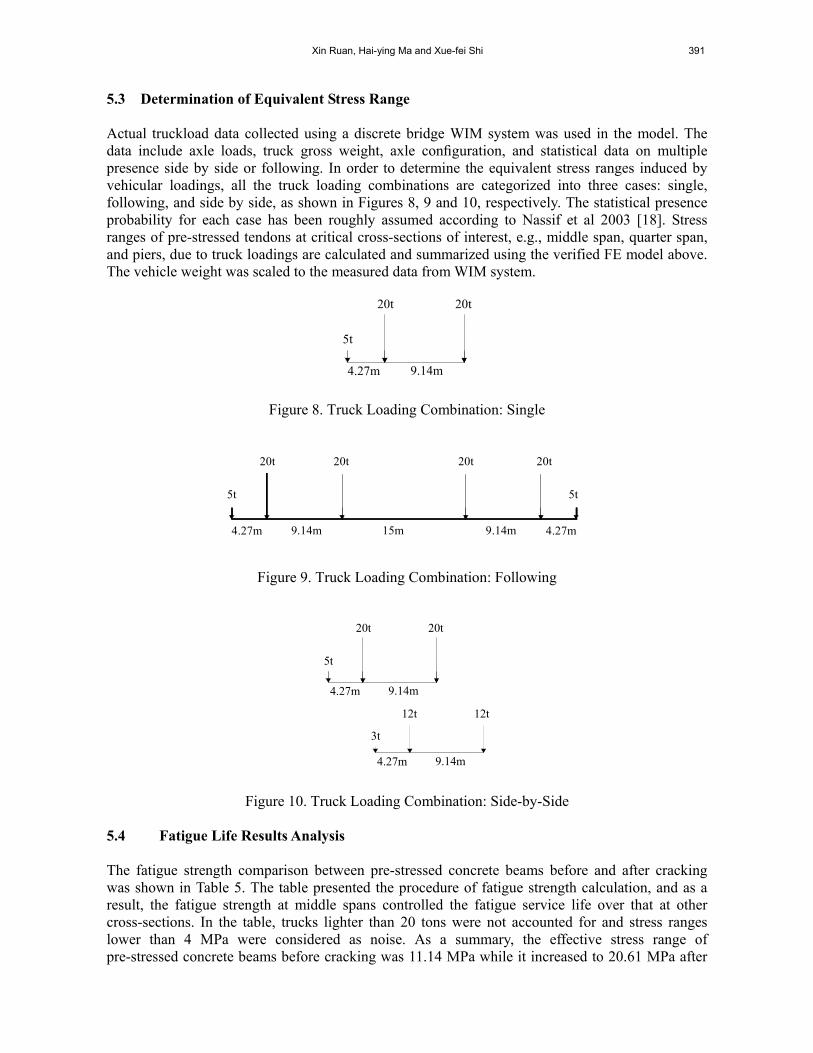
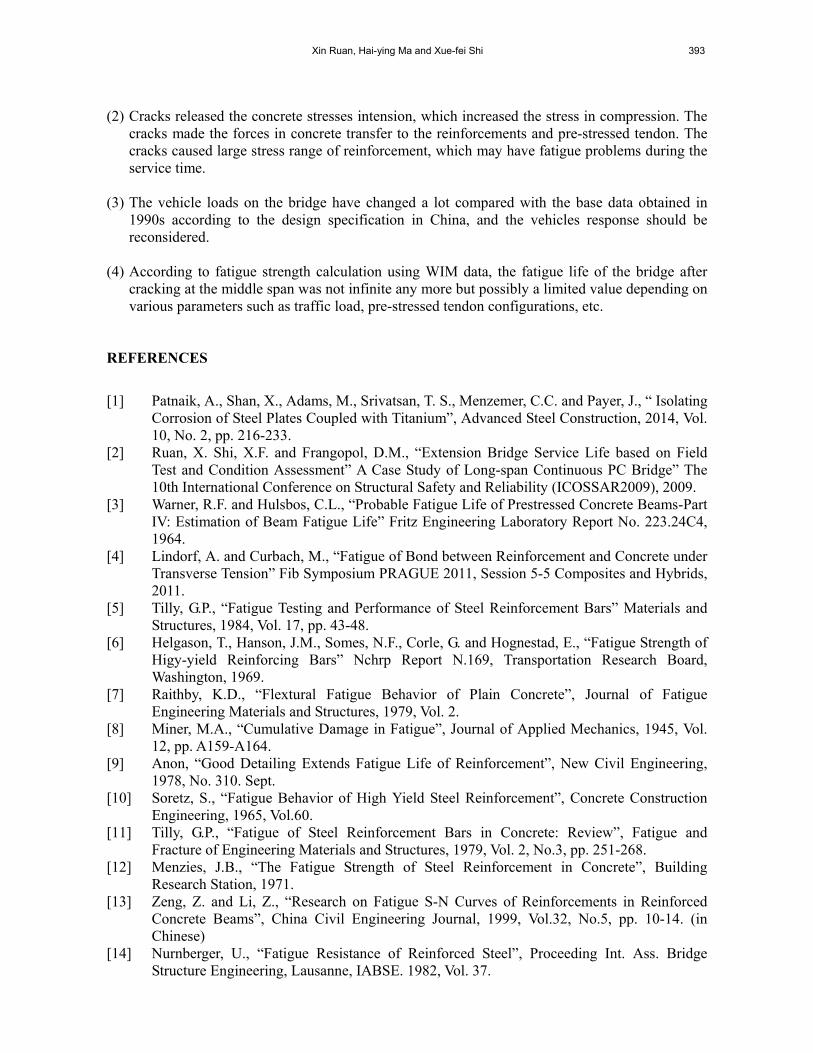
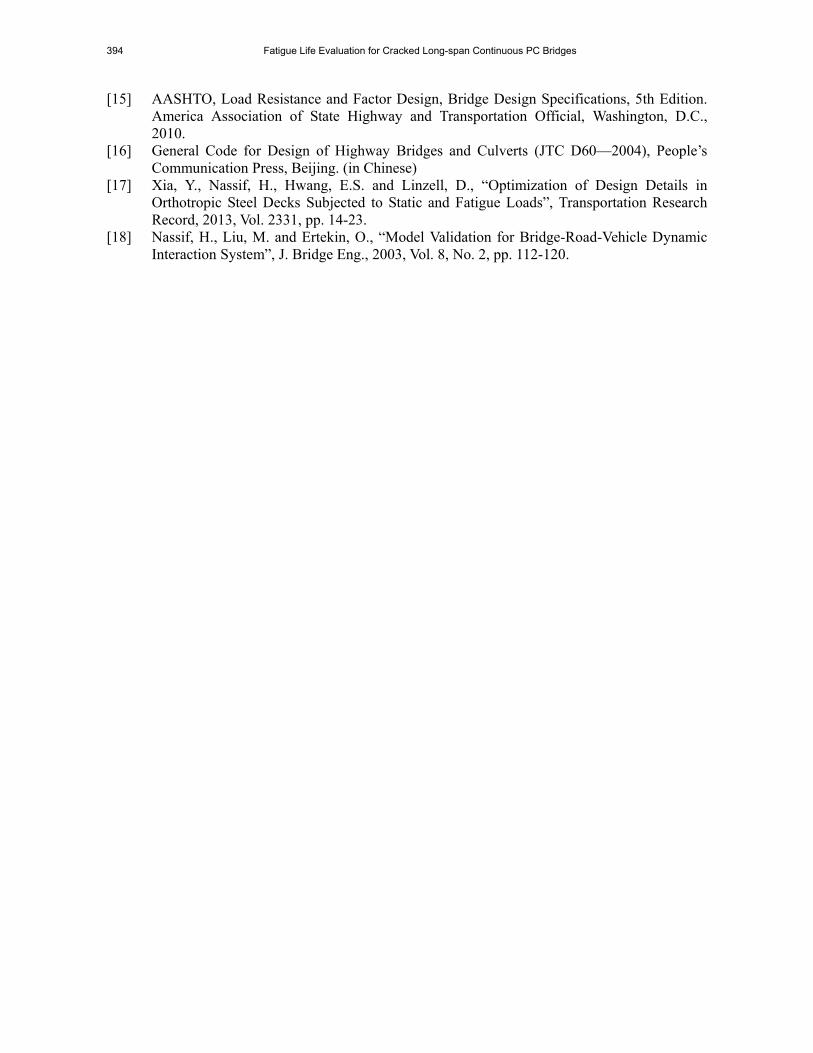
5.3 Determination of Equivalent Stress Range Actual truckload data collected using a discrete bridge WIM system was used in the model. The data include axle loads, truck gross weight, axle configuration, and statistical data on multiple presence side by side or following. In order to determine the equivalent stress ranges induced by vehicular loadings, all the truck loading combinations are categorized into three cases: single, following, and side by side, as shown in Figures 8, 9 and 10, respectively. The statistical presence probability for each case has been roughly assumed according to Nassif et al 2003 [18]. Stress ranges of pre-stressed tendons at critical cross-sections of interest, e.g., middle span, quarter span, and piers, due to truck loadings are calculated and summarized using the verified FE model above. The vehicle weight was scaled to the measured data from WIM system.
5.4 Fatigue Life Results Analysis The fatigue strength comparison between pre-stressed concrete beams before and after cracking was shown in Table 5. The table presented the procedure of fatigue strength calculation, and as a result, the fatigue strength at middle spans controlled the fatigue service life over that at other cross-sections. In the table, trucks lighter than 20 tons were not accounted for and stress ranges lower than 4 MPa were considered as noise. As a summary, the effective stress range of pre-stressed concrete beams before cracking was 11.14 MPa while it increased to 20.61 MPa after
392 Fatigue Life Evaluation for Cracked Long-span Continuous PC Bridges
cracking. Accordingly, the fatigue service life reduced from infinity to 5.82E+07 cycles due to concrete beam cracking. The service year could be calculated based on the annual average daily traffic (AADT) given in Table 5 and with light trucks causing small stress ranges eliminated from the account.
Table 5. Fatigue Strength Calculation using WIM Data
Without Cracks With Cracks
riS Cycles Frequency ( ) 3i riS riS Cycles Frequency ( ) 3
i riS
4 6015 13.06% 8.36 4 811 1.76% 1.13
6 6346 13.78% 29.77 6 1253 2.72% 5.88
8 11488 24.95% 127.73 8 1147 2.49% 12.76
10 8467 18.39% 183.86 10 1518 3.30% 32.98
12 5312 11.53% 199.32 12 1583 3.44% 59.45
14 4002 8.69% 238.48 14 2824 6.14% 168.44
16 1657 3.60% 147.37 16 3712 8.07% 330.44
18 1278 2.78% 161.91 18 4561 9.91% 578.09
20 1118 2.43% 194.17 20 5843 12.70% 1015.88
22 292 0.63% 67.46 22 5103 11.09% 1180.98
24 36 0.08% 10.72 24 4271 9.28% 1283.25
28 28 0.06% 13.23 28 3523 7.66% 1680.59
32 5 0.01% 3.43 32 4076 8.86% 2902.60
34 4 0.01% 3.15 34 2695 5.86% 2302.00
36 1 0.00% 1.25 36 1253 2.72% 1270.75
40 1 0.00% 0.99 40 937 2.04% 1303.19
>40
1 0.00% 0.60 >40
902 1.96% 529.42
Effective Stress Range [ 3 1/3( )i riS ] 11.14MPa
Effective Stress Range [ 3 1/3( )i riS ] 20.61MPa
Fatigue Life in Cycles Infinity Fatigue Life in Cycles 5.71E+07
6. CONCLUSIONS Finite element analysis was performed for a typical long span continuous pre-stressed concrete bridge before and after cracking. A general fatigue life estimation procedure was proposed to simplify the vehicular loading on a bridge and to develop fatigue life analysis using WIM data. The fatigue resistance of the target bridge due to vehicular loads was summarized. The study leads to better understanding and possible design modifications of long span continuous PC bridges. The main conclusions are summarized as follows: (1) The cracks in the bridge increase as the vertical deflection increases, and the cracks may
increase the loss of pre-stress and more deflection.
Xin Ruan, Hai-ying Ma and Xue-fei Shi 393
(2) Cracks released the concrete stresses intension, which increased the stress in compression. The
cracks made the forces in concrete transfer to the reinforcements and pre-stressed tendon. The cracks caused large stress range of reinforcement, which may have fatigue problems during the service time.
(3) The vehicle loads on the bridge have changed a lot compared with the base data obtained in 1990s according to the design specification in China, and the vehicles response should be reconsidered.
(4) According to fatigue strength calculation using WIM data, the fatigue life of the bridge after cracking at the middle span was not infinite any more but possibly a limited value depending on various parameters such as traffic load, pre-stressed tendon configurations, etc.
REFERENCES
[1] Patnaik, A., Shan, X., Adams, M., Srivatsan, T. S., Menzemer, C.C. and Payer, J., “ Isolating Corrosion of Steel Plates Coupled with Titanium”, Advanced Steel Construction, 2014, Vol. 10, No. 2, pp. 216-233.
[2] Ruan, X. Shi, X.F. and Frangopol, D.M., “Extension Bridge Service Life based on Field Test and Condition Assessment” A Case Study of Long-span Continuous PC Bridge” The 10th International Conference on Structural Safety and Reliability (ICOSSAR2009), 2009.
[3] Warner, R.F. and Hulsbos, C.L., “Probable Fatigue Life of Prestressed Concrete Beams-Part IV: Estimation of Beam Fatigue Life” Fritz Engineering Laboratory Report No. 223.24C4, 1964.
[4] Lindorf, A. and Curbach, M., “Fatigue of Bond between Reinforcement and Concrete under Transverse Tension” Fib Symposium PRAGUE 2011, Session 5-5 Composites and Hybrids, 2011.
[5] Tilly, G.P., “Fatigue Testing and Performance of Steel Reinforcement Bars” Materials and Structures, 1984, Vol. 17, pp. 43-48.
[6] Helgason, T., Hanson, J.M., Somes, N.F., Corle, G. and Hognestad, E., “Fatigue Strength of Higy-yield Reinforcing Bars” Nchrp Report N.169, Transportation Research Board, Washington, 1969.
[7] Raithby, K.D., “Flextural Fatigue Behavior of Plain Concrete”, Journal of Fatigue Engineering Materials and Structures, 1979, Vol. 2.
[8] Miner, M.A., “Cumulative Damage in Fatigue”, Journal of Applied Mechanics, 1945, Vol. 12, pp. A159-A164.
[9] Anon, “Good Detailing Extends Fatigue Life of Reinforcement”, New Civil Engineering, 1978, No. 310. Sept.
[10] Soretz, S., “Fatigue Behavior of High Yield Steel Reinforcement”, Concrete Construction Engineering, 1965, Vol.60.
[11] Tilly, G.P., “Fatigue of Steel Reinforcement Bars in Concrete: Review”, Fatigue and Fracture of Engineering Materials and Structures, 1979, Vol. 2, No.3, pp. 251-268.
[12] Menzies, J.B., “The Fatigue Strength of Steel Reinforcement in Concrete”, Building Research Station, 1971.
[13] Zeng, Z. and Li, Z., “Research on Fatigue S-N Curves of Reinforcements in Reinforced Concrete Beams”, China Civil Engineering Journal, 1999, Vol.32, No.5, pp. 10-14. (in Chinese)
[14] Nurnberger, U., “Fatigue Resistance of Reinforced Steel”, Proceeding Int. Ass. Bridge Structure Engineering, Lausanne, IABSE. 1982, Vol. 37.
394 Fatigue Life Evaluation for Cracked Long-span Continuous PC Bridges
[15] AASHTO, Load Resistance and Factor Design, Bridge Design Specifications, 5th Edition. America Association of State Highway and Transportation Official, Washington, D.C., 2010.
[16] General Code for Design of Highway Bridges and Culverts (JTC D60—2004), People’s Communication Press, Beijing. (in Chinese)
[17] Xia, Y., Nassif, H., Hwang, E.S. and Linzell, D., “Optimization of Design Details in Orthotropic Steel Decks Subjected to Static and Fatigue Loads”, Transportation Research Record, 2013, Vol. 2331, pp. 14-23.
[18] Nassif, H., Liu, M. and Ertekin, O., “Model Validation for Bridge-Road-Vehicle Dynamic Interaction System”, J. Bridge Eng., 2003, Vol. 8, No. 2, pp. 112-120.