Fatty Acids Suppress Autophagic Turnover in �-Cells*
Received for publication, March 22, 2011, and in revised form, August 10, 2011 Published, JBC Papers in Press, August 21, 2011, DOI 10.1074/jbc.M111.242412
Guy Las, Sam B. Serada, Jakob D. Wikstrom, Gilad Twig, and Orian S. Shirihai1
From the Department of Medicine, Boston University School of Medicine, Boston, Massachusetts 02118
Recent studies have shown that autophagy is essential forproper �-cell function and survival. However, it is yet unclearunder what pathogenic conditions autophagy is inhibited in�-cells. Here, we report that long term exposure to fatty acidsand glucose block autophagic flux in �-cells, contributing totheir toxic effect. INS1 cells expressing GFP-LC3 (an autopha-gosome marker) were treated with 0.4 mM palmitate, 0.4 mM
oleate, and various concentrations of glucose for 22 h. Kineticsof the effect of fatty acids on autophagy showed a biphasicresponse. During the second phase of autophagy, the size ofautophagosomes and the content of autophagosome substrates(GFP-LC3, p62) and endogenous LC3was increased. During thesame phase, fatty acids suppressed autophagic degradation oflong lived protein in both INS1 cells and islets. In INS1 cells,palmitate induced a 3-fold decrease in the number and the acid-ity of Acidic Vesicular Organelles. This decrease was associatedwith a suppression of hydrolase activity, suppression of endocy-tosis, and suppression of oxidative phosphorylation. The com-bination of fatty acids with glucose synergistically suppressedautophagic turnover, concomitantly suppressing insulin secre-tion. Rapamycin treatment resulted in partial reversal of theinhibition of autophagic flux, the inhibition of insulin secretion,and the increase in cell death. Our results indicate that excessnutrient could impair autophagy in the long term, hence con-tributing to nutrient-induced �-cell dysfunction. This may pro-vide a novel mechanism that connects diet-induced obesity anddiabetes.
Macroautophagy (hereafter named autophagy) is the mainmechanism the cell uses to degrade damaged and redundantorganelles. It involves the formation of a double-membranestructure called the phagophore, which evolves into theautophagosome (AP),2 an organelle that sequesters cytoplas-mic material such as mitochondria, peroxisomes, endoplasmicreticulum, protein aggregates, and lipids. Upon acidification(1), the AP fuses with the lysosome to form the autolysosome,which degrades its content (2).The main approach to study autophagy is by tracking APs
using LC3 (microtubule-associated protein 1 light chain 3), a
cytosolic protein that upon stimulation of autophagy is lipi-dated and recruited to the AP membrane. LC3 remains boundto the AP until released to the cytosol or degraded by lysosomalenzymes (3).Stimulators of autophagy are known to increase the number
of APs. However, the quantification of APs to assess autophagycan be misleading, APs being but one component in the chainconstituting autophagic degradation (3). Thus, for example, inthe case of various neuronal diseases, the increase in the num-ber of APs was originally falsely interpreted as an increase inautophagic turnover, although it is now known to be the resultof a decrease in autophagic turnover downstream to AP forma-tion (4, 5).Type 2 diabetes is a disease in which glucose homeostasis
is impaired due to peripheral insulin resistance accompaniedby a decrease in pancreatic �-cell function and a decrease in�-cell mass. One of the causes for the deterioration of �-cellsduring type 2 diabetes appears to be the toxicity of nutrientoverload on �-cells. High concentrations of free fatty acids(FFAs) (“lipotoxicity”), high concentrations of glucose (“glu-cotoxicity”), and the combination of FFAs and glucose (“glu-colipotoxicity”) impair insulin secretion and induce celldeath by apoptosis (6–8).Autophagy has been shown to be important for �-cell viabil-
ity and function both in the whole animal (9–11) and in INS1cells, a commonly used �-cell secreting line (12, 13). Whetherany of the diabetogenic factors such as nutrition and obesityimpair autophagy is yet unclear. In various animal models(including mice fed high fat diet) (9, 14) and cellular models ofdiabetes (including glucotoxicity and lipotoxicity) (9, 13–16),the number of APs has been reported to increase.Whether thisincrease reflects an increase or a decrease in autophagic turn-over is unresolved. Hints to the effect of FFAs on turnover wereprovided; those, however, are somewhat contradictory. In INS1cells AP formation is found to be increased under long termexposure to FFAs, when autophagosome degradation isblocked (9). In those same cells, short term palmitate exposureincreases protein degradation mediated by autophagy (17). Incontrast to these findings, Masini et al. (18) reported an accu-mulation of overloadedAPs in�-cells frompancreata of humandiabetic cadavers and in dispersed�-cells exposed to FFAs, sug-gesting an impairment of AP maturation.In this study, we use a battery of approaches to study the
effect of nutrient overload on autophagic turnover in �-cells.We show that although in the long term, FFAs can increase theformation of APs, they suppress acidification and autophagicdegradation. Glucose suppresses autophagy as well and cansynergize with FFAs.
* This work was supported by the Evans Center and the Mitochondria-AffinityResearch Collaborative (mtARC) and by National Institutes of Health GrantsR01 HL071629-03 and R01 DK074778 and DK035914 (to O. S. S. and B. C.Corkey).
1 To whom correspondence should be addressed: EBRC 650 Albany St., Rm.804, Boston, MA 02118. Tel.: 617-230-8570; Fax: 617-638-7124;[email protected].
2 The abbreviations used are: AP, autophagosome; FFA, free fatty acid; mTOR,mammalian target of rapamycin; FI, fluorescence intensity; KRB, Krebsringer bicarbonate; AVO, acidic vesicular organelle.
Reagents—The following reagents were used: rapamycin(Sigma), palmitate (Sigma), oleate (Sigma), bafilomycin (LCLaboratories), [14C]phenylalanine (PerkinElmer Life Sciences),and leupeptin (Sigma).Animals and Islet Isolation—Nine- to 10-week-old C57Bl6
male mice were used for islet isolation. They were housed inaccordance with the BostonUniversity Institutional Guidelinesfor Animal Care (IACUC no. 1104) in compliance with UnitedStates Public Health Service Regulation. Animals were fedstandard chow and kept at normal housing conditions (19–22 °C and a 14:10-h light-dark cycle) until death byCO2 asphyx-iation and cervical dislocation.Islets of Langerhans were isolated as described previously
(19). Shortly, the pancreata were inflated with Hanks’ buffercontaining collagenase (Roche Applied Science). After 30 minof digestion at 37 °C, the islets were isolated using Ficollgradient.Cell Culture—INS1 832/13 cells were cultured in RPMI 1640
media supplementedwith 10% FBS, 10mMHEPES buffer, 1mM
pyruvate, 50 �M 2-�-mercaptoethanol, 50 units/ml penicillin,and 50 �g/ml streptomycin.Palmitate and Oleate Complexed to BSA—Palmitate and
oleate were dissolved in DMSO to a final concentration of 0.4 M
and then dissolved at 56 °C in RPMI 1640 media containing 5%fatty acid-free BSA (Calbiochem) to make a 10� stock. Forcontrol, we used RPMI 1640 media containing 5% BSA and 1%DMSO. The day of the experiment, the stocks were added toRPMI 1640 media containing 1% FBS, 50 units/ml penicillin,and 50 �g/ml streptomycin and glucose at either 10 mM or asdesignated concentration.Protein Degradation Assay—The basics of protein degrada-
tion were reported previously (20). Shortly, cells were incu-bated in plain media supplemented with [14C]phenylalanine.After 24 h, the media were switched to media containing 2 mM
nonradioactive phenylalanine for 24 h. The cells were thenincubated in either control media or media containing 0.4 mM
palmitate or 0.4 mM oleate, in the presence or absence of bafi-lomycin.Media samples were collected at different time points,and proteins were precipitated in TCA. At the end of the exper-iment, the cells were lysed using 1% SDS in PBS. Cellular pro-teins were isolated by TCA precipitation. Disintegrations/min(dpm) in the nonprecipitable fraction of the media and in pre-cipitable fraction of the cells were measured with a �-counter.Protein degradation rate was calculated by the ratio of the non-precipitable C14 in the media to the cell precipitable C14divided by time of incubation after chase.Fluorescence-activated Cell Sorting (FACS) Analysis—INS1
cells were infected with lentivirus encoding either for GFP-LC3or DsRed targeted to the mitochondria (12). The cells express-ingGFP-LC3were then sorted according toGFP intensity usingMoFlo Cell Sorter. FACS analyses of the cells after treatmentwas done with �620 FACScan. FACS data analysis was per-formed using FACScalibur (Beckman Coulter). Cell debris wasexcluded by gating on the forward and side scatter plot.Cells were stained with 1 �MAcridine Orange (Sigma) for 15
min and washed twice with PBS. The cells were then
trypsinized, washed twice with PBS by centrifugation, and thensubjected to flow cytometry. Cells incubated for 4 h in KRB orbafilomycin were used as positive and negative controls,respectively.LysoTracker, LysoSensor, MR-Cathepsin L, pHrodo-dextran
Staining, and Immunostaining—Cells were stained with 50 nMLysoTracker red (Molecular Probes) for 30 min, then washedthree times with PBS before being fixed with 4% paraformalde-hyde for 15 min, and washed again three times with PBS andmounted with Mowiol.Cells were stained with 1 �M LysoSensor yellow/blue for 5
min followed by confocal imaging using a 360 nm excitationand collecting images at the yellowwavelength range (510–641nm) and at the range of blue wavelength (404–456 nm). Theratio between yellow and blue was calculated usingmetamorphsoftware. Cells were stainedwith 10�g/mlMagic red cathepsinL (MR-cathepsin L; Immunochemistry Technologies) for 1 h.The cells were then washed three times with RPMI 1640 mediaand observed under a confocal microscope.For p62 immunostaining, the cells were fixed with 4% para-
formaldehyde for 15 min, washed with PBS, permeabilized in0.5% Triton X-100 for 15 min, washed, and then blocked with1% BSA/PBS for 15 min. The fixed cells were incubated withprimary antibody against p62 anti-mouse (Abnova), diluted1:200, washed, incubated with the secondary antibody Alexa660 anti mouse (Invitrogen), diluted 1:500 for 1 h, washed withPBS, and mounted with Mowiol (Calbiochem) mountingmedia. The Images were taken at �63 magnification usingZeiss LSM 510 Meta confocal microscope, and analyzed withMetaMorph software.Western Blot—Samples were prepared as described previ-
ously (21). They were loaded in 12% polyacrylamide gel andtransferred onto a polyvinylidene difluoride membrane using asemidry transfer machine. LC3 (Sigma), �-actin (Sigma), p62(Abnova), GAPDH (Santa Cruz Biotechnology), GFP (Abcam),COX-IV subunit 1 (Invitrogen), and COX-IV subunit 4 (SantaCruz Biotechnology) antibodies were used according to themanufacturer’s instructions.O2 Consumption—Oxygen consumption in INS1 was mea-
sured by an XF24 oxygen consumption assay (Seahorse Biosci-ence, Billerica, MA) as described previously (22).Mitochondrial Membrane Potential—Mitochondrial mem-
brane potential was analyzed as described previously (23).Briefly, INS1 cells were stained with 5 nM tetramethylrhod-amine ethyl ester perchlorate and 100 nM MitoTracker Green(Molecular Probes) for 45min. The cells werewashed and incu-bated with RPMI 1640 media containing tetramethylrhod-amine ethyl ester perchlorate alone and observed under a 710Zeiss confocal microscope.WIPI-1 Measurement—INS1 cells were transfected with
WIPI-1-GFP vector (a generous gift from Dr. Tassula Proikas-Cezanne) usingTransIT-LT1 Reagent (Mirus) according to themanufacturer’s recommendations. After 24 h cells were treatedwith control media or palmitate for 14 h and imaged with con-focal microscope. Cells containing several distinct puncta werecounted.ATPMeasurement—ATPwasmeasured using a biolumines-
cence kit (Roche Applied Science) according to manufacturer’s
Nutrient-induced Inhibition of Autophagy
DECEMBER 9, 2011 • VOLUME 286 • NUMBER 49 JOURNAL OF BIOLOGICAL CHEMISTRY 42535
protocol, after extracting the ATP using boiled deionized wateras described previously (24).Statistics—Unless stated otherwise, error bars indicate
means� S.E., and an unpaired t test was used to validate statis-tical differences.
RESULTS
Palmitate Induces Accumulation of Overloaded Autophago-somes in INS1 Cells—It has previously been shown that type 2diabetes patients accumulate large autophagosomes in theirpancreatic �-cells, suggesting impairment in autophagy (18).We tested whether a similar phenomenon could be reproducedin a cellular model of �-cell lipotoxicity. INS1 cells stablyexpressing GFP-LC3 were exposed for 6 h to either 0.4 mM
palmitate bound to BSA or to amino acid-free medium (KRB)or to control media containing BSA (Fig. 1a). Although bothamino acid starvation and palmitate increased the number ofautophagosomes, under palmitate, autophagosomes werelarger, and GFP fluorescence intensity (FI) was brighter thanunder KRB, suggesting an impairment in AP degradation. Con-
sistently, p62, a protein known to be degraded exclusively byautophagy, was accumulated with palmitate treatment (Fig.1b). Absence of amino acids in the media did not prevent theaccumulation of substrates of autophagosomes in the cell. CellsexpressingGFP-LC3 and treated for 14 hwith palmitate in KRBshowed an increase in p62 (Fig. 1c). Likewise, palmitateincreased unprocessed free GFP (Fig. 1c), as did bafilomycin, ablocker of the lysosomal H� pump (Fig. 1d).Palmitate Increases AP Formation but Autophagy Does Not
Reach Steady State—Previous studies undertaken in hepato-cytes have shown that AP formation is suppressed by FFAs (25).In contrast, in INS1 cells, prolonged exposure to FFAs increaseAP formation (9). To verify the latter, we measured LC3 after14 h of exposure to 0.4mMpalmitate in the presence or absenceof protease inhibitors for the last 2 h. As shown in Fig. 2a, thelipidated formof LC3 (LC3-II)was significantly increased in thepresence of palmitate alone, indicating an increase in the num-ber of APs. Blockage of autophagy by the combination ofammonium chloride and leupeptin increased LC3-II expres-sion. Palmitate further increased LC3-II, indicating that the
FIGURE 1. Palmitate increases the number and size of the APs and the content of AP substrates. INS1 cells were cultured in the presence or absence of 0.4mM palmitate for 14 h. a, representative experiment (n � 6) Western blot analysis of LC3 and images of INS1 cells expressing GFP-LC3 and treated for 14 h withpalmitate or KRB. Two bands were obtained, the cytosolic LC3-I and the autophagosomal LC3-II. Actin was used as a loading control. Below are confocal imagesof INS1 cells expressing GFP-LC3 and treated with control, palmitate, or KRB (starvation) media. b, Western blot analysis and immunostaining of p62 in INS1 cellsincubated in the presence or absence of palmitate in full RPMI 1640 media for 24 h. c and d, Western blot analysis of p62, GFP, LC3 in cells cultured in aminoacid-free medium (KRB) alone or in amino acid-free medium in the presence of 0.4 mM palmitate (c) or in the presence of 200 nM bafilomycin (d) after 14 h ofincubation. GAPDH was used as a loading control. Two bands were obtained with anti-GFP antibody as follows: a heavy one (45 kDa) and a lighter one (27 kDa)corresponding to the chimeric GFP-LC3 and to free GFP, respectively. Free GFP represents partial degradation of GFP-LC3 as indicated by its accumulation uponexposure to bafilomycin.
Nutrient-induced Inhibition of Autophagy
42536 JOURNAL OF BIOLOGICAL CHEMISTRY VOLUME 286 • NUMBER 49 • DECEMBER 9, 2011
accumulation observed in AP number reflects, at least partially,an increase in the rate of AP formation. To further confirmincreasedAP formation, wemeasured the effect of palmitate onaccumulation ofWIPI-1 puncta, a marker of phagophores (Fig.2b) (26, 27). INS1 cells transfected with WIPI1-GFP showed asignificant (61%) increase in WIPI-1 puncta in the presence ofpalmitate as compared with control after 14 h of exposure.Although under control conditions only 26 � 11% of the cellsshowed multiple WIPI-1 puncta, treatment with palmitateincreased this value to 42 � 14% (n � 3, p � 0.05, paired t test).In the presence of high glucose (20mM), palmitate had amildereffect on abundance of WIPI-1 puncta (33 � 9% of the cellshaving multiple WIPI-1 puncta).Unless APs are in steady state (rate of formation � rate of
degradation), an increase in AP formation does not necessarilyreflect an increase in their degradation. To examine whetherunder palmitate autophagosomes reach steady state, we fol-lowed the change in AP number with time. In agreement withprevious publications (13, 17), autophagosomenumber showeda fluctuation with time (Fig. 2c). Both Western blot densito-metry for endogenous LC3-II in noninfected INS1 cells and thenumber of APs in INS1 cells transduced with GFP-LC3 lentivi-rus displayed a biphasic pattern with the first peak emergingafter 8 h of exposure and the second peak emerging after 14 h ofexposure (Fig. 2c). Given that autophagosomes do not reach
steady state, we had to rely on other tools to study autophagicdegradation.FFAs Suppress Autophagic Turnover as Reflected byGFP-LC3
Intensity—Autophagic turnover depends on the fusionbetween the lysosomes and the APs to form the acidic autoly-sosomes. Given that GFP fluorescence decreases within anacidic environment, total GFP FI in cells expressing GFP tar-geted to the APs (GFP-LC3) can be used to estimate the rate offusion between autophagosomes and lysosomes. We employedan approach in which the turnover of GFP-LC3 is measured byflow cytometry (28, 29). In this technique, the total FI of GFP incells expressing GFP-LC3 decreases when autophagic turnoverincreases. Thus, under stimulation of autophagic turnover, theincrease in fusion between APs and lysosomes is expected tolead to a decrease in GFP fluorescence, whereas blockage ofautophagic turnover is expected to lead to an accumulation ofGFP-LC3 in the APs and in the cytosol and thus to an increasein the number of cells with high GFP FI.We compared FI of cells expressing GFP-LC3 under various
conditions known to affect autophagy (Fig. 3a). As shown pre-viously (29), amino acid starvation and treatment with rapamy-cin (an mTOR inhibitor) decreased GFP FI relative to controlcells, indicating an increase in autophagic turnover. Palmitateand oleate, however, significantly increased the average GFP FIby 23� 6 and 39� 9%, respectively (Fig. 3a), as compared with
FIGURE 2. Palmitate increases AP formation without reaching steady state. a, Western blot analysis of LC3. INS1 cells were incubated for 14 h with orwithout 0.4 mM palmitate, in the presence or absence of 20 mM ammonium chloride (NH4Cl) and 100 �M leupeptin (Leu) during the last 3 h of incubation. Belowis the densitometry of LC3-II signal normalized against GAPDH. Note that palmitate increased LC3-II both in the absence and presence of ammonium chlorideand leupeptin. *, p � 0.05 (n � 6); error bars, S.E. b, confocal images of INS1 cells expressing WIPI-GFP and incubated for 14 h in control media (containing 10mM glucose), in media containing 0.4 mM palmitate along with 10 mM glucose or along with 20 mM glucose. c, representative curve (n � 3) of LC3-II proteinlevels over time as determined by densitometry of Western blot analyses. LC3-II signal was normalized against actin. Below is the average AP number per cellover time as determined from confocal images of cells expressing GFP-LC3. Between 40 and 50 cells were analyzed per condition.
Nutrient-induced Inhibition of Autophagy
DECEMBER 9, 2011 • VOLUME 286 • NUMBER 49 JOURNAL OF BIOLOGICAL CHEMISTRY 42537
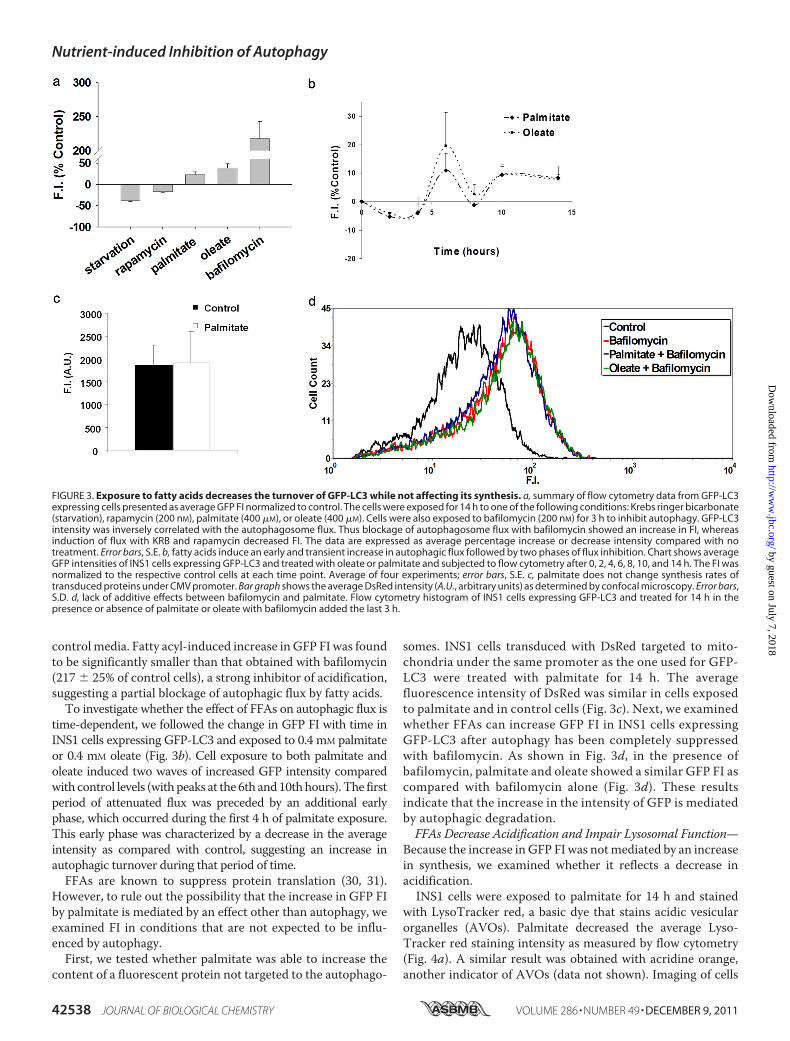
controlmedia. Fatty acyl-induced increase inGFP FI was foundto be significantly smaller than that obtained with bafilomycin(217 � 25% of control cells), a strong inhibitor of acidification,suggesting a partial blockage of autophagic flux by fatty acids.To investigate whether the effect of FFAs on autophagic flux is
time-dependent, we followed the change in GFP FI with time inINS1 cells expressing GFP-LC3 and exposed to 0.4 mM palmitateor 0.4 mM oleate (Fig. 3b). Cell exposure to both palmitate andoleate induced two waves of increased GFP intensity comparedwith control levels (withpeaks at the 6th and10thhours). The firstperiod of attenuated flux was preceded by an additional earlyphase, which occurred during the first 4 h of palmitate exposure.This early phase was characterized by a decrease in the averageintensity as compared with control, suggesting an increase inautophagic turnover during that period of time.FFAs are known to suppress protein translation (30, 31).
However, to rule out the possibility that the increase in GFP FIby palmitate is mediated by an effect other than autophagy, weexamined FI in conditions that are not expected to be influ-enced by autophagy.First, we tested whether palmitate was able to increase the
content of a fluorescent protein not targeted to the autophago-
somes. INS1 cells transduced with DsRed targeted to mito-chondria under the same promoter as the one used for GFP-LC3 were treated with palmitate for 14 h. The averagefluorescence intensity of DsRed was similar in cells exposedto palmitate and in control cells (Fig. 3c). Next, we examinedwhether FFAs can increase GFP FI in INS1 cells expressingGFP-LC3 after autophagy has been completely suppressedwith bafilomycin. As shown in Fig. 3d, in the presence ofbafilomycin, palmitate and oleate showed a similar GFP FI ascompared with bafilomycin alone (Fig. 3d). These resultsindicate that the increase in the intensity of GFP is mediatedby autophagic degradation.FFAs Decrease Acidification and Impair Lysosomal Function—
Because the increase inGFP FI was notmediated by an increasein synthesis, we examined whether it reflects a decrease inacidification.INS1 cells were exposed to palmitate for 14 h and stained
with LysoTracker red, a basic dye that stains acidic vesicularorganelles (AVOs). Palmitate decreased the average Lyso-Tracker red staining intensity as measured by flow cytometry(Fig. 4a). A similar result was obtained with acridine orange,another indicator of AVOs (data not shown). Imaging of cells
FIGURE 3. Exposure to fatty acids decreases the turnover of GFP-LC3 while not affecting its synthesis. a, summary of flow cytometry data from GFP-LC3expressing cells presented as average GFP FI normalized to control. The cells were exposed for 14 h to one of the following conditions: Krebs ringer bicarbonate(starvation), rapamycin (200 nM), palmitate (400 �M), or oleate (400 �M). Cells were also exposed to bafilomycin (200 nM) for 3 h to inhibit autophagy. GFP-LC3intensity was inversely correlated with the autophagosome flux. Thus blockage of autophagosome flux with bafilomycin showed an increase in FI, whereasinduction of flux with KRB and rapamycin decreased FI. The data are expressed as average percentage increase or decrease intensity compared with notreatment. Error bars, S.E. b, fatty acids induce an early and transient increase in autophagic flux followed by two phases of flux inhibition. Chart shows averageGFP intensities of INS1 cells expressing GFP-LC3 and treated with oleate or palmitate and subjected to flow cytometry after 0, 2, 4, 6, 8, 10, and 14 h. The FI wasnormalized to the respective control cells at each time point. Average of four experiments; error bars, S.E. c, palmitate does not change synthesis rates oftransduced proteins under CMV promoter. Bar graph shows the average DsRed intensity (A.U., arbitrary units) as determined by confocal microscopy. Error bars,S.D. d, lack of additive effects between bafilomycin and palmitate. Flow cytometry histogram of INS1 cells expressing GFP-LC3 and treated for 14 h in thepresence or absence of palmitate or oleate with bafilomycin added the last 3 h.
Nutrient-induced Inhibition of Autophagy
42538 JOURNAL OF BIOLOGICAL CHEMISTRY VOLUME 286 • NUMBER 49 • DECEMBER 9, 2011
stained with LysoTracker red, showed a 63% decrease in thenumber of AVOs per cell in the presence of palmitate as com-pared with control (Fig. 4b). Although LysoTracker red andacridine orange are reliable dyes to quantify AVOs, they are notsensitive enough for pHmeasurement. LysoSensor yellow/blueis a pH-sensitive probe that emits predominantly yellow fluo-rescence in acidic organelles, although in less acidic organellesit emits blue fluorescence. Treatment of INS1 cells with palmi-tate significantly decreased the yellow/blue ratio in the AVOsreflecting an increase in pH from 4.6 to 5.1 (Fig. 4c). Interest-ingly, this decrease in acidification was concomitant with a2-fold increase in AVO size (Fig. 4d), further indicating impair-ment in lysosomal function.Acidification of the lysosomes is required for the activity of
lysosomal hydrolases. To test the functional significance ofpalmitate-induced alkalinization of lysosomes, we assessed thefunctionality of the hydrolases. Cells were stained with MR-cathepsin L, a substrate-based assay for the activity of the lyso-somal protease cathepsin L. Although both control and palmi-tate-treated cells showed active cathepsin L, the cells treatedwith palmitate displayed a significantly lower intensity of MR-
cathepsin L. The intensity of MR-cathepsin L was 36% lowerthan for controls indicating impairment in cathepsin L activity(Fig. 4e). Palmitate impaired other lysosomal functions besideautophagy, as shown by pHrodo-dextran staining, a pH-sensi-tive probe that enters the cells via endocytosis. Treatment ofINS1 cells with palmitate induced a robust decrease in theintensity and number of pHrodo puncta as comparedwith con-trol (Fig. 4f).FFAsDecreaseCellularATPLevels andOxygenConsumption
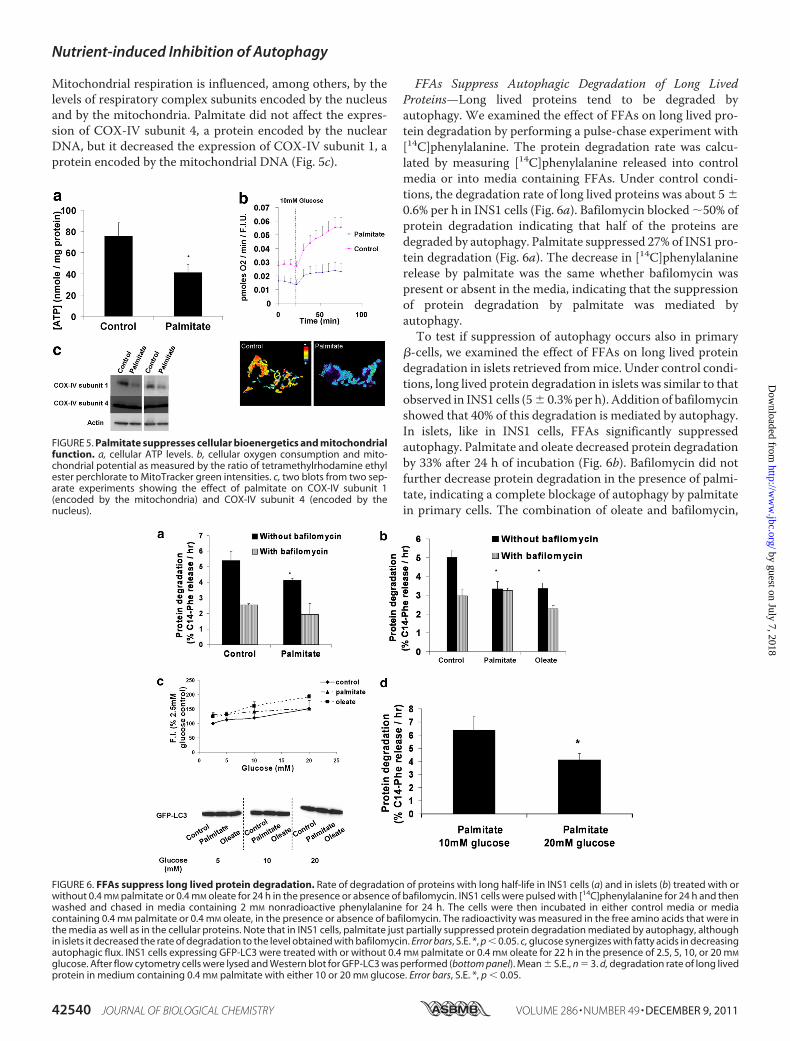
Rate and Impair Mitochondrial Function—Because lysosomalacidification is dependent on ATP hydrolysis by the H� pump,we measured cellular ATP levels (Fig. 5a). Palmitate stronglydecreased cellular ATP contents as compared with control(41 � 7 and 75 � 12 nM/mg protein, respectively). Thisdecrease was associated with a suppression of cellular oxygenconsumption as well as with mitochondrial depolarization.This was also accompanied by fragmentation of mitochondrialnetwork (Fig. 5b) (as previously shown in Refs. 23, 32, 33). Thecombination of depolarization and reduced oxygen consump-tion suggested a respiratory chain defect. To further assess thispossibility, we examined the level respiratory chain proteins.
FIGURE 4. Palmitate decreases lysosomal acidification and cathepsin L activity. INS1 cells were stained with either the probe for acidic vesicular organellesLysoTracker red, or the pH indicator LysoSensor yellow/blue, or the cathepsin L activity indicator magic red after treatment with or without palmitate for 14 h.a, flow cytometry intensity histogram of cells stained with LysoTracker red. b, confocal microscopy analysis of INS1 cells expressing GFP-LC3 (green) and stainedwith LysoTracker red (red). Nuclei were co-stained with Hoechst (purple). Bar, 10 �m. Quantification of the number of AVOs. Error bars, S.D., *, p � 0.05. Note thatLysoTracker red and GFP-LC3 did not co-localize, reflecting the sensitivity of GFP to the acidic pH of the lysosomes and autolysosomes. c, palmitate decreasesAVO acidification. Images show INS1 cells stained with LysoSensor yellow/blue and imaged using two filter ranges, 404 – 456 nm (blue) and 510 – 641 nm(yellow). Subcellular organelles with lower pH are identified as pixels with increased yellow/blue ratio. Error bars, S.E., n � 7. d, average AVO size measured fromLysoSensor images. e, palmitate suppresses cathepsin L activity. Staining for MR-cathepsin L. The graph expresses the average red intensity. Error bars, S.E., n �6, **, p � 0.01. f, pHrodo-dextran fluorescence intensity as a measure for endosome acidity. After 14 h in the presence or absence of palmitate, the cells wereincubated with pHrodo-dextran for 1 h and pHrodo intensity was measured; Error bars, S.E., n � 3, **, p � 0.01.
Nutrient-induced Inhibition of Autophagy
DECEMBER 9, 2011 • VOLUME 286 • NUMBER 49 JOURNAL OF BIOLOGICAL CHEMISTRY 42539
Mitochondrial respiration is influenced, among others, by thelevels of respiratory complex subunits encoded by the nucleusand by the mitochondria. Palmitate did not affect the expres-sion of COX-IV subunit 4, a protein encoded by the nuclearDNA, but it decreased the expression of COX-IV subunit 1, aprotein encoded by the mitochondrial DNA (Fig. 5c).
FFAs Suppress Autophagic Degradation of Long LivedProteins—Long lived proteins tend to be degraded byautophagy. We examined the effect of FFAs on long lived pro-tein degradation by performing a pulse-chase experiment with[14C]phenylalanine. The protein degradation rate was calcu-lated by measuring [14C]phenylalanine released into controlmedia or into media containing FFAs. Under control condi-tions, the degradation rate of long lived proteins was about 5 �0.6% per h in INS1 cells (Fig. 6a). Bafilomycin blocked �50% ofprotein degradation indicating that half of the proteins aredegraded by autophagy. Palmitate suppressed 27% of INS1 pro-tein degradation (Fig. 6a). The decrease in [14C]phenylalaninerelease by palmitate was the same whether bafilomycin waspresent or absent in the media, indicating that the suppressionof protein degradation by palmitate was mediated byautophagy.To test if suppression of autophagy occurs also in primary
�-cells, we examined the effect of FFAs on long lived proteindegradation in islets retrieved frommice. Under control condi-tions, long lived protein degradation in islets was similar to thatobserved in INS1 cells (5� 0.3%per h). Addition of bafilomycinshowed that 40% of this degradation is mediated by autophagy.In islets, like in INS1 cells, FFAs significantly suppressedautophagy. Palmitate and oleate decreased protein degradationby 33% after 24 h of incubation (Fig. 6b). Bafilomycin did notfurther decrease protein degradation in the presence of palmi-tate, indicating a complete blockage of autophagy by palmitatein primary cells. The combination of oleate and bafilomycin,
FIGURE 5. Palmitate suppresses cellular bioenergetics and mitochondrialfunction. a, cellular ATP levels. b, cellular oxygen consumption and mito-chondrial potential as measured by the ratio of tetramethylrhodamine ethylester perchlorate to MitoTracker green intensities. c, two blots from two sep-arate experiments showing the effect of palmitate on COX-IV subunit 1(encoded by the mitochondria) and COX-IV subunit 4 (encoded by thenucleus).
FIGURE 6. FFAs suppress long lived protein degradation. Rate of degradation of proteins with long half-life in INS1 cells (a) and in islets (b) treated with orwithout 0.4 mM palmitate or 0.4 mM oleate for 24 h in the presence or absence of bafilomycin. INS1 cells were pulsed with [14C]phenylalanine for 24 h and thenwashed and chased in media containing 2 mM nonradioactive phenylalanine for 24 h. The cells were then incubated in either control media or mediacontaining 0.4 mM palmitate or 0.4 mM oleate, in the presence or absence of bafilomycin. The radioactivity was measured in the free amino acids that were inthe media as well as in the cellular proteins. Note that in INS1 cells, palmitate just partially suppressed protein degradation mediated by autophagy, althoughin islets it decreased the rate of degradation to the level obtained with bafilomycin. Error bars, S.E. *, p � 0.05. c, glucose synergizes with fatty acids in decreasingautophagic flux. INS1 cells expressing GFP-LC3 were treated with or without 0.4 mM palmitate or 0.4 mM oleate for 22 h in the presence of 2.5, 5, 10, or 20 mM
glucose. After flow cytometry cells were lysed and Western blot for GFP-LC3 was performed (bottom panel). Mean � S.E., n � 3. d, degradation rate of long livedprotein in medium containing 0.4 mM palmitate with either 10 or 20 mM glucose. Error bars, S.E. *, p � 0.05.
Nutrient-induced Inhibition of Autophagy
42540 JOURNAL OF BIOLOGICAL CHEMISTRY VOLUME 286 • NUMBER 49 • DECEMBER 9, 2011
however, showed a synergistic effect on protein degradation.When combined, oleate and bafilomycin led to a strongerdecrease in protein degradation than under oleate or bafilomy-cin alone, suggesting the blockage of additional degradativepathways besides autophagy.Glucose Synergizes with Palmitate or Oleate in the Reduction
of Autophagic Flux—�-Cells are known to be particularly sen-sitive to glucose and to the combination of palmitate and glu-cose, a phenomenon known as glucolipotoxicity, where the twonutrients synergize in the induction of cell death (6). Becauseaccumulation of APs is associated with cell death, we tested ifthis synergy applies to the impairment of autophagic turnover.INS1 cells expressing GFP-LC3 were treated for 22 h with dif-ferent concentrations of glucose (2.5, 5, 10, and 20 mM) in thepresence or absence of palmitate or oleate and then were sub-jected to flow cytometry. As shown in Fig. 6c, glucose aloneincreased the average GFP-LC3 FI in a dose-dependent man-ner. The average GFP intensity under 20 mM glucose was 50%higher than under 2.5 mM glucose. Palmitate and oleate furtherincreased the intensity of GFP, adding to the effect of glucose.The addition of palmitate amplified GFP intensity under allglucose concentrations but 20mM,where the intensitywas sim-ilar to glucose alone. Because palmitate is particularly toxic tothe cells when combined with 20 mM glucose (glucolipotoxic-ity), we assumed that the apparent loss of synergismobserved inGFP-LC3 FI assay could have reflected the inclusion of deadcells in the measurement. We therefore measured long livedprotein degradation (Fig. 6d), which spare the dead cells,thereby avoiding this drawback. Indeed, protein degradationwas strongly decreased in 20 mM glucose with palmitate ascompared with 10 mM glucose with palmitate.
Like palmitate, oleate showed an amplification of GFP signal.The GFP FI was higher (up to 40% above the control at 10 and20 mM glucose) in the presence of oleate at all glucose concen-trations as compared with the concomitant glucose concentra-tion without fatty acids. Neither WIPI puncta (see Fig. 2b) norGFP-LC3 total expression (Fig. 6c) were affected by the addi-tion of glucose, indicating that the increase in GFP-LC3 FI isnot due to its content but possibly to the low acidicenvironment.Rapamycin Reduces the Blockage of Autophagic Turnover
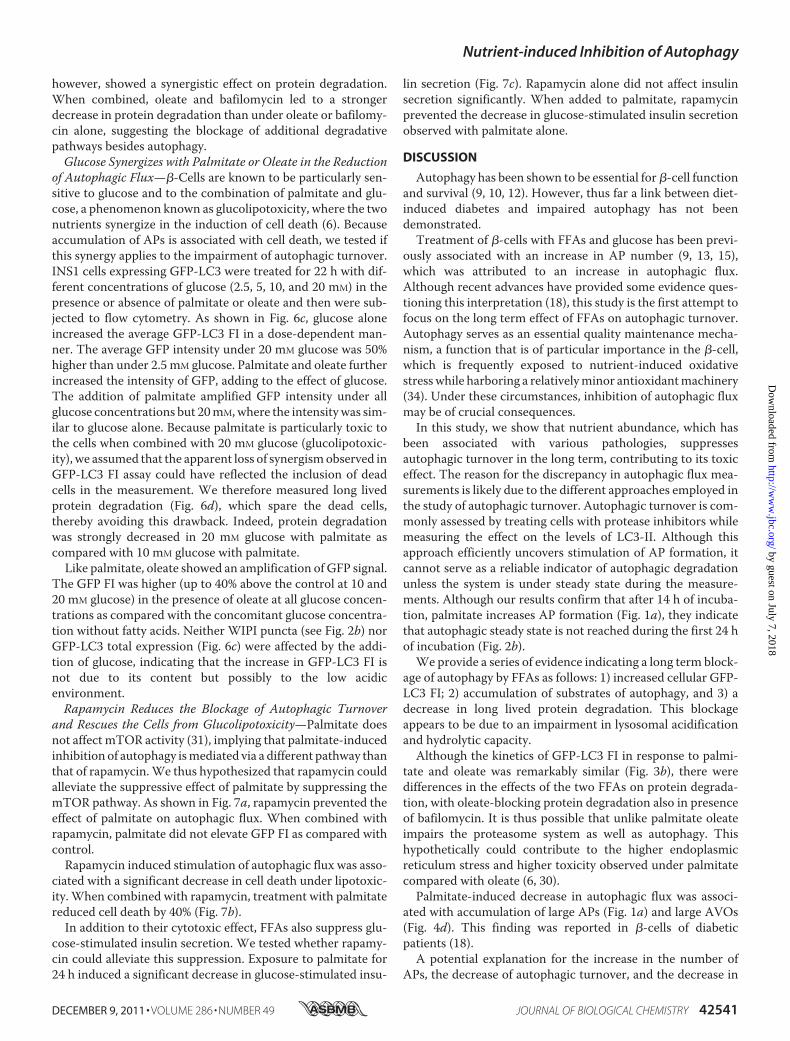
and Rescues the Cells from Glucolipotoxicity—Palmitate doesnot affect mTOR activity (31), implying that palmitate-inducedinhibition of autophagy ismediated via a different pathway thanthat of rapamycin.We thus hypothesized that rapamycin couldalleviate the suppressive effect of palmitate by suppressing themTOR pathway. As shown in Fig. 7a, rapamycin prevented theeffect of palmitate on autophagic flux. When combined withrapamycin, palmitate did not elevate GFP FI as compared withcontrol.Rapamycin induced stimulation of autophagic flux was asso-
ciated with a significant decrease in cell death under lipotoxic-ity.When combined with rapamycin, treatment with palmitatereduced cell death by 40% (Fig. 7b).In addition to their cytotoxic effect, FFAs also suppress glu-
cose-stimulated insulin secretion. We tested whether rapamy-cin could alleviate this suppression. Exposure to palmitate for24 h induced a significant decrease in glucose-stimulated insu-
lin secretion (Fig. 7c). Rapamycin alone did not affect insulinsecretion significantly. When added to palmitate, rapamycinprevented the decrease in glucose-stimulated insulin secretionobserved with palmitate alone.
DISCUSSION
Autophagy has been shown to be essential for�-cell functionand survival (9, 10, 12). However, thus far a link between diet-induced diabetes and impaired autophagy has not beendemonstrated.Treatment of �-cells with FFAs and glucose has been previ-
ously associated with an increase in AP number (9, 13, 15),which was attributed to an increase in autophagic flux.Although recent advances have provided some evidence ques-tioning this interpretation (18), this study is the first attempt tofocus on the long term effect of FFAs on autophagic turnover.Autophagy serves as an essential quality maintenance mecha-nism, a function that is of particular importance in the �-cell,which is frequently exposed to nutrient-induced oxidativestresswhile harboring a relativelyminor antioxidantmachinery(34). Under these circumstances, inhibition of autophagic fluxmay be of crucial consequences.In this study, we show that nutrient abundance, which has
been associated with various pathologies, suppressesautophagic turnover in the long term, contributing to its toxiceffect. The reason for the discrepancy in autophagic flux mea-surements is likely due to the different approaches employed inthe study of autophagic turnover. Autophagic turnover is com-monly assessed by treating cells with protease inhibitors whilemeasuring the effect on the levels of LC3-II. Although thisapproach efficiently uncovers stimulation of AP formation, itcannot serve as a reliable indicator of autophagic degradationunless the system is under steady state during the measure-ments. Although our results confirm that after 14 h of incuba-tion, palmitate increases AP formation (Fig. 1a), they indicatethat autophagic steady state is not reached during the first 24 hof incubation (Fig. 2b).We provide a series of evidence indicating a long term block-
age of autophagy by FFAs as follows: 1) increased cellular GFP-LC3 FI; 2) accumulation of substrates of autophagy, and 3) adecrease in long lived protein degradation. This blockageappears to be due to an impairment in lysosomal acidificationand hydrolytic capacity.Although the kinetics of GFP-LC3 FI in response to palmi-
tate and oleate was remarkably similar (Fig. 3b), there weredifferences in the effects of the two FFAs on protein degrada-tion, with oleate-blocking protein degradation also in presenceof bafilomycin. It is thus possible that unlike palmitate oleateimpairs the proteasome system as well as autophagy. Thishypothetically could contribute to the higher endoplasmicreticulum stress and higher toxicity observed under palmitatecompared with oleate (6, 30).Palmitate-induced decrease in autophagic flux was associ-
ated with accumulation of large APs (Fig. 1a) and large AVOs(Fig. 4d). This finding was reported in �-cells of diabeticpatients (18).A potential explanation for the increase in the number of
APs, the decrease of autophagic turnover, and the decrease in
Nutrient-induced Inhibition of Autophagy
DECEMBER 9, 2011 • VOLUME 286 • NUMBER 49 JOURNAL OF BIOLOGICAL CHEMISTRY 42541
endocytosis is the suppression in lysosomal acidification thatwe observed. Indeed, the staining for acridine orange, Lyso-Tracker red, LysoSensor blue/yellow, and pHrodo-dextran, allpH-sensitive probes, was decreased under palmitate. We havequantified theAVOpHand found it to be increasedwith palmi-tate from 4.6 to 5.1. A pH change within this range was alsorecently reported in cellular models of Alzheimer where itappears to cause accumulation of inactive lysosomes andunfused Aps, which contribute to the pathology (35).Alkalinization of the lysosomes could account for the
decrease in the fusion of the APs with lysosomes, as well as for
the suppression of lysosomal hydrolase activity. Although thecause of the impairment in lysosomal acidification has not beenaddressed directly, a plausible explanation is the observeddecrease in cellular ATP. Indeed H� pump activity is highlysensitive to a decrease in ATP concentrations (36) and so is thecapacity of the lysosomes to fuse with APs (37). Reduction inATP levels may be the result respiratory chain dysfunctionreflected by the suppression of oxygen consumption as well asby mitochondrial depolarization. We have previously reportedthat palmitate induces the arrest of mitochondrial fusion andfragmentation in INS1 cells (23). Others have shown that inhi-
FIGURE 7. Rapamycin prevents the decrease in autophagic flux and protects from lipotoxicity. a, rapamycin partially reverses palmitate-induced inhibi-tion of autophagic flux. Flow cytometry of cellular GFP intensity in INS1-expressing GFP-LC3 normalized to control. Mean � S.E., n � 4. b, rapamycin protectscells from palmitate-induced cell death. Flow cytometry analysis of dead cells with propidium iodide (PI); above are images of the cells taken by a Celigo plateimager. Blue stains for the nuclei with Hoechst, and red represents propidium iodide staining; S.E., n � 6. c, rapamycin protects from suppression of glucose-stimulated insulin secretion. Insulin secretion in response to 2 mM (black columns) and 11 mM glucose (white columns) of cells exposed for 18 h to 0.4 mM
palmitate in the presence or absence of rapamycin. Error bars, S.E. *, p � 0.05; **, p � 0.01.
Nutrient-induced Inhibition of Autophagy
42542 JOURNAL OF BIOLOGICAL CHEMISTRY VOLUME 286 • NUMBER 49 • DECEMBER 9, 2011
bition of mitochondrial fusion leads to a decrease in mitochon-drialDNA levels (38). Furthermore, FFAs have been reported toinduce mitochondrial DNA damage in �-cells (39). Theseabnormalities could account for the observed decrease inmito-chondrion-encoded proteins that we report here, which couldcontribute to reduced oxygen consumption (Fig. 8).Our data suggest that inhibition of autophagic turnover was
accompanied by induction of AP formation. This is evidencedby the increase inWIPI-1 puncta and the increase in LC3 in thepresence of lysosomal blockers, which is supported by previousstudies (9).Although the combination of increased AP formation
along with suppression of autophagic turnover could appearparadoxical, it is plausible that the first is a response to thesecond. Indeed, in a recent study undertaken on melanomacells, it was shown that pharmacological inhibition of thelysosomal proton pump induces the formation of APs as asurvival mechanism to cope with the stress (40). It is alsopossible that the inhibition of the lysosomal function byFFAs suppresses nutrient processing, which in turn couldtrigger AP formation.Interestingly, we found that both palmitate and oleate
decreased GFP intensity during the first 4 h of incubation, sug-gesting an increase in autophagic flux during that stage. Thisresult supports the recent report that in the short term FFAsinduce autophagic protein degradation (17). It is possible thatthis induction is beneficial to the cell for coping with lipotoxic-ity. Further study on this effect is required.The long term effect of palmitate as well as the effect of
oleate on GFP intensity in GFP-LC3-expressing cells wasfound to be synergistic with glucose. Such synergy with glu-cose is also well known with respect to �-cell death (gluco-lipotoxicity) (6). The suppression of autophagic turnover asreflected by GFP-LC3 could be alleviated using rapamycin,an mTOR inhibitor; this was accompanied by a protectionfrom lipotoxicity indicating that mTOR could be a target fortreating palmitate-induced suppression of autophagy. Theimpairment of autophagy by nutrient overload describedhere marks AP maturation as an important impairment con-tributing to compromised cell function and viability. Inhibi-tion of AP maturation may therefore be playing a role in thepathophysiology of diabetes and may serve as a target fortreatment of metabolic diseases.
Acknowledgments—We thank Drs. Barbara Corkey, Jude Deeney,and Andrea Havasi for their helpful advice. We thank Dr. DaniDagan for this helpful comments on the manuscript.
REFERENCES1. Yamamoto, A., Tagawa, Y., Yoshimori, T., Moriyama, Y., Masaki, R., and
Tashiro, Y. (1998) Cell Struct. Funct. 23, 33–422. He, C., and Klionsky, D. J. (2009) Annu. Rev. Genet. 43, 67–933. Klionsky, D. J., Abeliovich, H., Agostinis, P., Agrawal, D. K., Aliev, G.,
Askew, D. S., Baba, M., Baehrecke, E. H., Bahr, B. A., Ballabio, A., Bamber,B. A., Bassham, D. C., Bergamini, E., Bi, X., Biard-Piechaczyk, M., Blum,J. S., Bredesen, D. E., Brodsky, J. L., Brumell, J. H., Brunk, U. T., Bursch,W.,Camougrand, N., Cebollero, E., Cecconi, F., Chen, Y., Chin, L. S., Choi, A.,Chu, C. T., Chung, J., Clarke, P. G., Clark, R. S., Clarke, S. G., Clave, C.,Cleveland, J. L., Codogno, P., Colombo, M. I., Coto-Montes, A., Cregg,J.M., Cuervo, A.M., Debnath, J., Demarchi, F., Dennis, P. B., Dennis, P. A.,Deretic, V., Devenish, R. J., Di Sano, F., Dice, J. F., Difiglia, M., Dinesh-Kumar, S., Distelhorst, C.W., Djavaheri-Mergny,M., Dorsey, F. C., Droge,W., Dron, M., Dunn, W. A., Jr., Duszenko, M., Eissa, N. T., Elazar, Z.,Esclatine, A., Eskelinen, E. L., Fesus, L., Finley, K. D., Fuentes, J. M., Fueyo,J., Fujisaki, K., Galliot, B., Gao, F. B., Gewirtz, D.A., Gibson, S. B., Gohla, A.,Goldberg, A. L., Gonzalez, R., Gonzalez-Estevez, C., Gorski, S., Gottlieb,R. A., Haussinger, D., He, Y.W.,Heidenreich, K., Hill, J. A., Høyer-Hansen,M., Hu, X., Huang,W. P., Iwasaki, A., Jaattela,M., Jackson,W. T., Jiang, X.,Jin, S., Johansen, T., Jung, J. U., Kadowaki,M., Kang, C., Kelekar, A., Kessel,D. H., Kiel, J. A., Kim, H. P., Kimchi, A., Kinsella, T. J., Kiselyov, K., Kita-moto, K., Knecht, E., Komatsu,M., Kominami, E., Kondo, S., Kovacs, A. L.,Kroemer, G., Kuan, C. Y., Kumar, R., Kundu, M., Landry, J., Laporte, M.,Le,W., Lei, H. Y., Lenardo,M. J., Levine, B., Lieberman, A., Lim, K. L., Lin,F. C., Liou, W., Liu, L. F., Lopez-Berestein, G., Lopez-Otín, C., Lu, B.,Macleod, K. F., Malorni, W., Martinet, W., Matsuoka, K., Mautner, J.,Meijer, A. J., Melendez, A., Michels, P., Miotto, G., Mistiaen, W. P., Miz-ushima, N., Mograbi, B., Monastyrska, I., Moore, M. N., Moreira, P. I.,Moriyasu, Y., Motyl, T., Munz, C., Murphy, L. O., Naqvi, N. I., Neufeld,T. P., Nishino, I., Nixon, R. A., Noda, T., Nurnberg, B., Ogawa, M., Olein-ick, N. L., Olsen, L. J., Ozpolat, B., Paglin, S., Palmer, G. E., Papassideri, I.,Parkes, M., Perlmutter, D. H., Perry, G., Piacentini, M., Pinkas-Kramarski,R., Prescott, M., Proikas-Cezanne, T., Raben, N., Rami, A., Reggiori, F.,Rohrer, B., Rubinsztein, D. C., Ryan, K. M., Sadoshima, J., Sakagami, H.,Sakai, Y., Sandri, M., Sasakawa, C., Sass, M., Schneider, C., Seglen, P. O.,Seleverstov, O., Settleman, J., Shacka, J. J., Shapiro, I. M., Sibirny, A., Silva-Zacarin, E. C., Simon, H. U., Simone, C., Simonsen, A., Smith, M. A.,Spanel-Borowski, K., Srinivas, V., Steeves, M., Stenmark, H., Stromhaug,P. E., Subauste, C. S., Sugimoto, S., Sulzer, D., Suzuki, T., Swanson, M. S.,Tabas, I., Takeshita, F., Talbot, N. J., Talloczy, Z., Tanaka, K., Tanaka, K.,Tanida, I., Taylor, G. S., Taylor, J. P., Terman, A., Tettamanti, G., Thomp-son, C. B., Thumm, M., Tolkovsky, A. M., Tooze, S. A., Truant, R., Tu-manovska, L. V., Uchiyama, Y., Ueno, T., Uzcategui, N. L., van der Klei, I.,Vaquero, E. C., Vellai, T., Vogel, M. W., Wang, H. G., Webster, P., Wiley,J. W., Xi, Z., Xiao, G., Yahalom, J., Yang, J. M., Yap, G., Yin, X. M., Yoshi-mori, T., Yu, L., Yue, Z., Yuzaki, M., Zabirnyk, O., Zheng, X., Zhu, X., andDeter, R. L. (2008) Autophagy 4, 151–175
4. Kundu, M., and Thompson, C. B. (2008) Annu. Rev. Pathol. 3, 427–4555. Levine, B., and Kroemer, G. (2008) Cell 132, 27–426. El-Assaad,W., Buteau, J., Peyot,M. L., Nolan, C., Roduit, R., Hardy, S., Joly,
E., Dbaibo, G., Rosenberg, L., and Prentki, M. (2003) Endocrinology 144,4154–4163
7. Zhou, Y. P., and Grill, V. E. (1994) J. Clin. Invest. 93, 870–8768. Poitout, V., and Robertson, R. P. (2008) Endocr. Rev. 29, 351–3669. Ebato, C., Uchida, T., Arakawa, M., Komatsu, M., Ueno, T., Komiya, K.,
Azuma, K., Hirose, T., Tanaka, K., Kominami, E., Kawamori, R., Fujitani,Y., and Watada, H. (2008) Cell Metab. 8, 325–332
10. Jung, H. S., Chung, K. W., Won Kim, J., Kim, J., Komatsu, M., Tanaka, K.,Nguyen, Y. H., Kang, T. M., Yoon, K. H., Kim, J. W., Jeong, Y. T., Han,M. S., Lee, M. K., Kim, K. W., Shin, J., and Lee, M. S. (2008) Cell Metab. 8,318–324
FIGURE 8. Model for the impairment of autophagy by palmitate. By sup-pressing mitochondrial bioenergetics, palmitate impairs cellular ATP levels,thus decreasing the lysosomal H� pump capacity to acidify its lumen, a proc-ess required for hydrolase activity and for the fusion of the AP with thelysosome.
Nutrient-induced Inhibition of Autophagy
DECEMBER 9, 2011 • VOLUME 286 • NUMBER 49 JOURNAL OF BIOLOGICAL CHEMISTRY 42543
11. Wu, J. J., Quijano, C., Chen, E., Liu, H., Cao, L., Fergusson, M. M., Rovira,I. I., Gutkind, S., Daniels, M. P., Komatsu, M., and Finkel, T. (2009) Aging1, 425–437
12. Twig, G., Elorza, A., Molina, A. J., Mohamed, H., Wikstrom, J. D., Walzer,G., Stiles, L., Haigh, S. E., Katz, S., Las, G., Alroy, J.,Wu,M., Py, B. F., Yuan,J., Deeney, J. T., Corkey, B. E., and Shirihai, O. S. (2008) EMBO J. 27,433–446
13. Choi, S. E., Lee, S. M., Lee, Y. J., Li, L. J., Lee, S. J., Lee, J. H., Kim, Y., Jun,H. S., Lee, K. W., and Kang, Y. (2009) Endocrinology 150, 126–134
14. Fujimoto, K., Hanson, P. T., Tran, H., Ford, E. L., Han, Z., Johnson, J. D.,Schmidt, R. E., Green, K. G.,Wice, B.M., and Polonsky, K. S. (2009) J. Biol.Chem. 284, 27664–27673
15. Kaniuk, N. A., Kiraly, M., Bates, H., Vranic, M., Volchuk, A., and Brumell,J. H. (2007) Diabetes 56, 930–939
16. Lupi, R., Dotta, F., Marselli, L., Del Guerra, S., Masini, M., Santangelo, C.,Patane, G., Boggi, U., Piro, S., Anello, M., Bergamini, E., Mosca, F., DiMario, U., Del Prato, S., and Marchetti, P. (2002) Diabetes 51, 1437–1442
17. Komiya, K., Uchida, T., Ueno, T., Koike, M., Abe, H., Hirose, T.,Kawamori, R., Uchiyama, Y., Kominami, E., Fujitani, Y., and Watada, H.(2010) Biochem. Biophys. Res. Commun. 401, 561–567
18. Masini, M., Bugliani, M., Lupi, R., del Guerra, S., Boggi, U., Filipponi, F.,Marselli, L., Masiello, P., and Marchetti, P. (2009) Diabetologia 52,1083–1086
19. Wikstrom, J. D., Katzman, S. M., Mohamed, H., Twig, G., Graf, S. A.,Heart, E., Molina, A. J., Corkey, B. E., de Vargas, L. M., Danial, N. N.,Collins, S., and Shirihai, O. S. (2007) Diabetes 56, 2569–2578
20. Bauvy, C., Meijer, A. J., and Codogno, P. (2009) Methods Enzymol. 452,47–61
21. Kimura, S., Fujita, N., Noda, T., and Yoshimori, T. (2009)Methods Enzy-mol. 452, 1–12
22. Wu, M., Neilson, A., Swift, A. L., Moran, R., Tamagnine, J., Parslow, D.,Armistead, S., Lemire, K., Orrell, J., Teich, J., Chomicz, S., and Ferrick,D. A. (2007) Am. J. Physiol. Cell Physiol. 292, C125–C136
23. Molina, A. J., Wikstrom, J. D., Stiles, L., Las, G., Mohamed, H., Elorza, A.,Walzer, G., Twig, G., Katz, S., Corkey, B. E., and Shirihai, O. S. (2009)
Diabetes 58, 2303–231524. Yang, N. C., Ho, W. M., Chen, Y. H., and Hu, M. L. (2002) Anal. Biochem.
306, 323–32725. Singh, R., Kaushik, S.,Wang, Y., Xiang, Y., Novak, I., Komatsu,M., Tanaka,
K., Cuervo, A. M., and Czaja, M. J. (2009) Nature 458, 1131–113526. Proikas-Cezanne, T., and Pfisterer, S. G. (2009) Methods Enzymol. 452,
247–26027. Proikas-Cezanne, T., Ruckerbauer, S., Stierhof, Y. D., Berg, C., and Nord-
heim, A. (2007) FEBS Lett. 581, 3396–340428. Shvets, E., and Elazar, Z. (2009)Methods Enzymol. 452, 131–14129. Shvets, E., Fass, E., and Elazar, Z. (2008) Autophagy 4, 621–62830. Karaskov, E., Scott, C., Zhang, L., Teodoro, T., Ravazzola, M., and
Volchuk, A. (2006) Endocrinology 147, 3398–340731. Bachar, E., Ariav, Y., Ketzinel-Gilad,M., Cerasi, E., Kaiser, N., and Leibow-
itz, G. (2009) PLoS One 4, e495432. Koshkin, V., Dai, F. F., Robson-Doucette, C. A., Chan, C. B., andWheeler,
M. B. (2008) J. Biol. Chem. 283, 7936–794833. Koshkin, V., Wang, X., Scherer, P. E., Chan, C. B., and Wheeler, M. B.
(2003) J. Biol. Chem. 278, 19709–1971534. Lenzen, S., Drinkgern, J., and Tiedge, M. (1996) Free Radic. Biol. Med. 20,
463–46635. Lee, J. H., Yu, W. H., Kumar, A., Lee, S., Mohan, P. S., Peterhoff, C. M.,
Wolfe, D. M., Martinez-Vicente, M., Massey, A. C., Sovak, G., Uchiyama,Y., Westaway, D., Cuervo, A. M., and Nixon, R. A. (2010) Cell 141,1146–1158
36. Yamashiro, D. J., Fluss, S. R., and Maxfield, F. R. (1983) J. Cell Biol. 97,929–934
37. Koga, H., Kaushik, S., and Cuervo, A. M. (2010) FASEB J. 24, 3052–306538. Chen,H., Vermulst,M.,Wang, Y. E., Chomyn,A., Prolla, T. A.,McCaffery,
J. M., and Chan, D. C. (2010) Cell 141, 280–28939. Grishko, V., Rachek, L., Musiyenko, S., Ledoux, S. P., and Wilson, G. L.
(2005) Free Radic. Biol. Med. 38, 755–76240. Marino, M. L., Fais, S., Djavaheri-Mergny, M., Villa, A., Meschini, S., Lo-
zupone, F., Venturi, G., DellaMina, P., Pattingre, S., Rivoltini, L., Codogno,P., and De Milito, A. (2010) Cell Death Dis. 1, e87
Nutrient-induced Inhibition of Autophagy
42544 JOURNAL OF BIOLOGICAL CHEMISTRY VOLUME 286 • NUMBER 49 • DECEMBER 9, 2011