Fault growth and propagation during incipient continental rifting: Insights from a combined aeromagnetic and Shuttle Radar Topography Mission digital elevation model investigation of the Okavango Rift Zone, northwest Botswana B. D. Kinabo, 1,2 J. P. Hogan, 1 E. A. Atekwana, 3 M. G. Abdelsalam, 1 and M. P. Modisi 4 Received 29 May 2007; revised 20 November 2007; accepted 17 January 2008; published 28 June 2008. [1] Digital Elevation Models (DEM) extracted from the Shuttle Radar Topography Mission (SRTM) data and high-resolution aeromagnetic data are used to characterize the growth and propagation of faults associated with the early stages of continental extension in the Okavango Rift Zone (ORZ), northwest Botswana. Significant differences in the height of fault scarps and the throws across the faults in the basement indicate extended fault histories accompanied by sediment accumulation within the rift graben. Faults in the center of the rift either lack topographic expressions or are interpreted to have become inactive, or have large throws and small scarp heights indicating waning activity. Faults on the outer margins of the rift exhibit either (1) large throws or significant scarp heights and are considered older and active or (2) throws and scarp heights that are in closer agreement and are considered young and active. Fault linkages between major fault systems through a process of ‘‘fault piracy’’ have combined to establish an immature border fault for the ORZ. Thus, in addition to growing in length (by along-axis linkage of segments), the rift is also growing in width (by transferring motion to younger faults along the outer margins while abandoning older faults in the middle). Finally, utilization of preexisting zones of weakness allowed the development of very long faults (>100 km) at a very early stage of continental rifting, explaining the apparent paradox between the fault length versus throw for this young rift. This study clearly demonstrates that the integration of the SRTM DEM and aeromagnetic data provides a 3-D view of the faults and fault systems, providing new insight into fault growth and propagation during the nascent stages of continental rifting. Citation: Kinabo, B. D., J. P. Hogan, E. A. Atekwana, M. G. Abdelsalam, and M. P. Modisi (2008), Fault growth and propagation during incipient continental rifting: Insights from a combined aeromagnetic and Shuttle Radar Topography Mission digital elevation model investigation of the Okavango Rift Zone, northwest Botswana, Tectonics, 27, TC3013, doi:10.1029/ 2007TC002154. 1. Introduction [2] Understanding the factors that control the growth and propagation of normal faults at the earliest stages of continental rifting will lead to a better overall understanding of the processes that control the development of continental rifts, an essential component of the plate tectonics paradigm. This is because the location, orientation, and evolution of normal faults that form during continental rifting exert a strong influence on the development of regional features of the rift including: (1) geomorphology, (2) drainage patterns, (3) basin location, (4) stratigraphy, (5) location of magma- tism, and if the process of continental rifting is successful, (6) the geometry of the passive margin. Additionally, because rift basins and rifted continental margins are considered to be the most prolific areas of hydrocarbon accumulation [Trudgill and Underhill, 2002] this knowl- edge can lead to increased efficiency in petroleum explora- tion and the development of proven reserves. [3] Our understanding of the earliest stages of fault initiation and development and the details of fault linkage and propagation during continental rifting within the cra- tonic lithosphere lags behind our knowledge of many other processes associated with continental rifting for two main reasons. The first is that we can only study the present-day geometry of the faults [Schlische and Anders, 1996]. The second is that investigation of continental rifting has typi- cally focused on a few well documented continental rifts (e.g., the East African Rift System (EARS), Baikal Rift, Rio Grande Rift and North Sea/Viking Graben) where border faults are either fully developed or in an advanced stage of development. Thus, observations critical to constraining processes important to the early stages of fault development during continental rifting are commonly made obscure in these more mature rifts by accumulation of thick sedimentary sequences, volcanic sequences, or by multiple rifting events. [4] Much of our knowledge on incipient continental rifting comes from Mesozoic-Palaeogene hydrocarbon producing TECTONICS, VOL. 27, TC3013, doi:10.1029/2007TC002154, 2008 Click Here for Full Articl e 1 Department of Geological Sciences and Engineering, Missouri University of Science and Technology, Rolla, Missouri, USA. 2 Now at Technical Geophysics Group, Deepwater Gulf of Mexico, Chevron North America Exploration and Production, Houston, Texas, USA. 3 Boone Pickens School of Geology, Oklahoma State University, Stillwater, Oklahoma, USA. 4 Department of Geology, University of Botswana, Gaborone, Botswana. Copyright 2008 by the American Geophysical Union. 0278-7407/08/2007TC002154$12.00 TC3013 1 of 16
Transcript
Fault growth and propagation during incipient continental rifting:
Insights from a combined aeromagnetic and Shuttle Radar
Topography Mission digital elevation model investigation of the
Okavango Rift Zone, northwest Botswana
B. D. Kinabo,1,2 J. P. Hogan,1 E. A. Atekwana,3 M. G. Abdelsalam,1 and M. P. Modisi4
Received 29 May 2007; revised 20 November 2007; accepted 17 January 2008; published 28 June 2008.
[1] Digital Elevation Models (DEM) extracted fromthe Shuttle Radar Topography Mission (SRTM) dataand high-resolution aeromagnetic data are used tocharacterize the growth and propagation of faultsassociated with the early stages of continental extensionin the Okavango Rift Zone (ORZ), northwest Botswana.Significant differences in the height of fault scarps andthe throws across the faults in the basement indicateextended fault histories accompanied by sedimentaccumulation within the rift graben. Faults in thecenter of the rift either lack topographic expressions orare interpreted to have become inactive, or have largethrows and small scarp heights indicating waningactivity. Faults on the outer margins of the rift exhibiteither (1) large throws or significant scarp heights andare considered older and active or (2) throws and scarpheights that are in closer agreement and are consideredyoung and active. Fault linkages between major faultsystems through a process of ‘‘fault piracy’’ havecombined to establish an immature border fault for theORZ. Thus, in addition to growing in length (byalong-axis linkage of segments), the rift is alsogrowing in width (by transferring motion to youngerfaults along the outer margins while abandoning olderfaults in the middle). Finally, utilization of preexistingzones of weakness allowed the development of verylong faults (>100 km) at a very early stage ofcontinental rifting, explaining the apparent paradoxbetween the fault length versus throw for this youngrift. This study clearly demonstrates that theintegration of the SRTM DEM and aeromagneticdata provides a 3-D view of the faults and faultsystems, providing new insight into fault growth andpropagation during the nascent stages of continental
rifting. Citation: Kinabo, B. D., J. P. Hogan, E. A. Atekwana,
M. G. Abdelsalam, and M. P. Modisi (2008), Fault growth and
propagation during incipient continental rifting: Insights from a
combined aeromagnetic and Shuttle Radar Topography Mission
digital elevation model investigation of the Okavango Rift Zone,
[2] Understanding the factors that control the growth andpropagation of normal faults at the earliest stages ofcontinental rifting will lead to a better overall understandingof the processes that control the development of continentalrifts, an essential component of the plate tectonics paradigm.This is because the location, orientation, and evolution ofnormal faults that form during continental rifting exert astrong influence on the development of regional features ofthe rift including: (1) geomorphology, (2) drainage patterns,(3) basin location, (4) stratigraphy, (5) location of magma-tism, and if the process of continental rifting is successful,(6) the geometry of the passive margin. Additionally,because rift basins and rifted continental margins areconsidered to be the most prolific areas of hydrocarbonaccumulation [Trudgill and Underhill, 2002] this knowl-edge can lead to increased efficiency in petroleum explora-tion and the development of proven reserves.[3] Our understanding of the earliest stages of fault
initiation and development and the details of fault linkageand propagation during continental rifting within the cra-tonic lithosphere lags behind our knowledge of many otherprocesses associated with continental rifting for two mainreasons. The first is that we can only study the present-daygeometry of the faults [Schlische and Anders, 1996]. Thesecond is that investigation of continental rifting has typi-cally focused on a few well documented continental rifts(e.g., the East African Rift System (EARS), Baikal Rift, RioGrande Rift and North Sea/Viking Graben) where borderfaults are either fully developed or in an advanced stage ofdevelopment. Thus, observations critical to constrainingprocesses important to the early stages of fault developmentduring continental rifting are commonly made obscure inthese more mature rifts by accumulation of thick sedimentarysequences, volcanic sequences, or by multiple rifting events.[4] Much of our knowledge on incipient continental rifting
comes from Mesozoic-Palaeogene hydrocarbon producing
basins such as North Sea. Information on incipient continen-tal rift zones is limited to a few studies such as those of Fosteret al. [1997], Ebinger et al. [1997],Modisi et al. [2000], andKinabo et al. [2007]. This is partly because there are only afew examples of young continental rifts which are suitable forthe investigation of the process of border fault developmentand evolution. The Okavango Rift Zone (ORZ), in northwestBotswana (Figures 1 and 2) is such a zone of incipientcontinental rifting [Scholz et al., 1976; Modisi et al., 2000].Recent studies suggest that faults associated with this rift arestill in a juvenile stage [Kinabo et al., 2007]. Thus, the ORZcan serve as a modern day analog for the earliest stages ofmore evolved continental rift basins and provides us with aunique opportunity to investigate the earliest developmentalstages of continental rifts.[5] Studies on fault growth and evolution have tradition-
ally relied on field studies such as structural mapping andstratigraphic analysis [e.g., Anders and Schlische, 1994;Cartwright et al., 1995; Dawers and Anders, 1995; Peacockand Sanderson, 1991; Gawthorpe et al., 1997; Jackson etal., 2002], analog models using sand and clay, and numer-ical models to understand formation, early interactions ofsegments, and growth of the faults [Cowie and Scholz,1992; Cowie, 1998a, 1998b; Trudgill and Cartwright,1994; Cartwright et al., 1995; Morley, 1999; Mulugeta
and Woldai, 2001; Moustafa, 2002; Withjack et al., 1995].Scientists have also used an integration of seismic dataanalysis and field work [e.g., Ebinger et al., 1984; Davies etal., 2000; Morley, 2002] or a combination of analog/numerical models with fieldwork for understanding faultgrowth and propagation and their effect on the stratigraphicarchitecture and dispersal patterns [e.g., McClay et al.,2002]. However, in areas where the faults are mostly buriedbeneath large accumulations of sediment, have subduedsurface relief, or where rock outcrops are limited, such asin the case of ORZ [Kinabo et al., 2007; Modisi et al.,2000], it is often difficult to accomplish structural mapping,stratigraphic analysis, and seismic studies through landbased field work. For such areas important structuralinformation regarding rift processes can be gleaned frommagnetic data [Modisi et al., 2000; Grauch, 2001] andDigital Elevation Models (DEM) [Macheyeki et al., 2005;Kervyn et al., 2006]. In this study we couple SRTM DEMdata (which provides information on the surface morphol-ogy of the faults) with high-resolution aeromagnetic data(which provides information about the faults within thebasement) to provide a three dimensional perspective offaults and fault patterns associated with ORZ. We use thisinformation to: (1) examine fault linkage patterns in theORZ, (2) investigate the development of border faults, and(3) demonstrate the utility of coupled SRTM DEM–high-resolution aeromagnetic data to provide important insightsinto the process of fault growth, linkage, propagation, andthe development of border fault systems.
2. Okavango Rift Zone
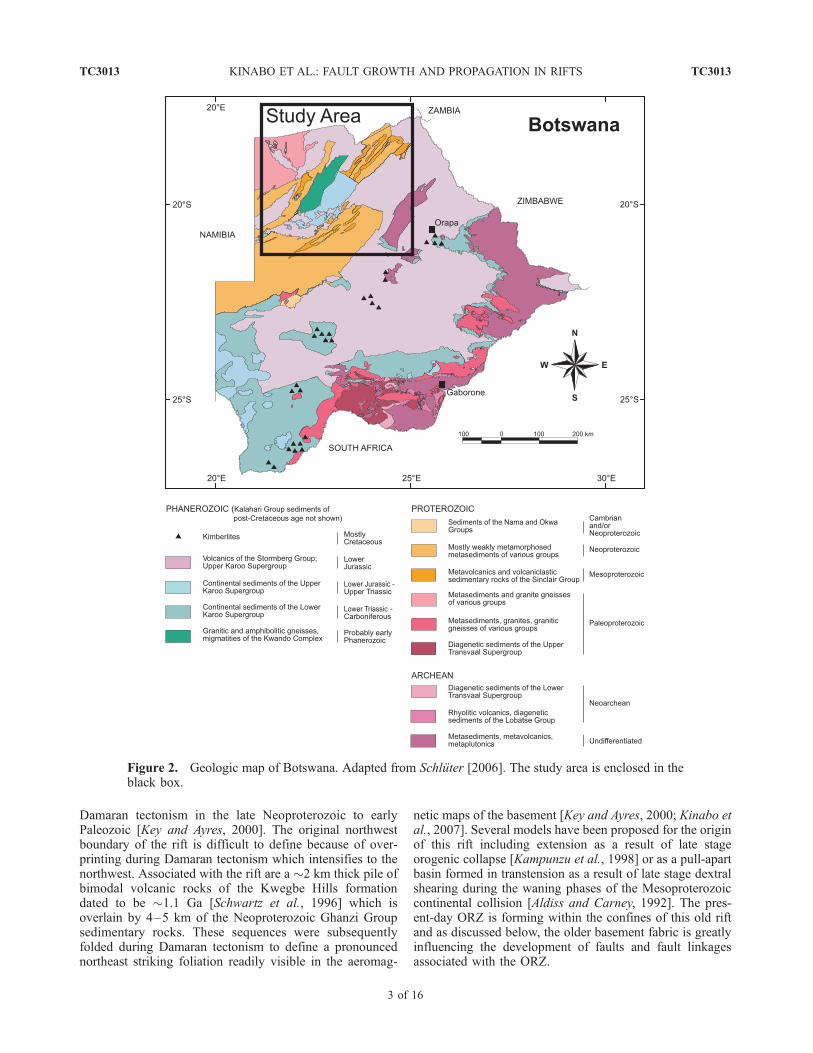
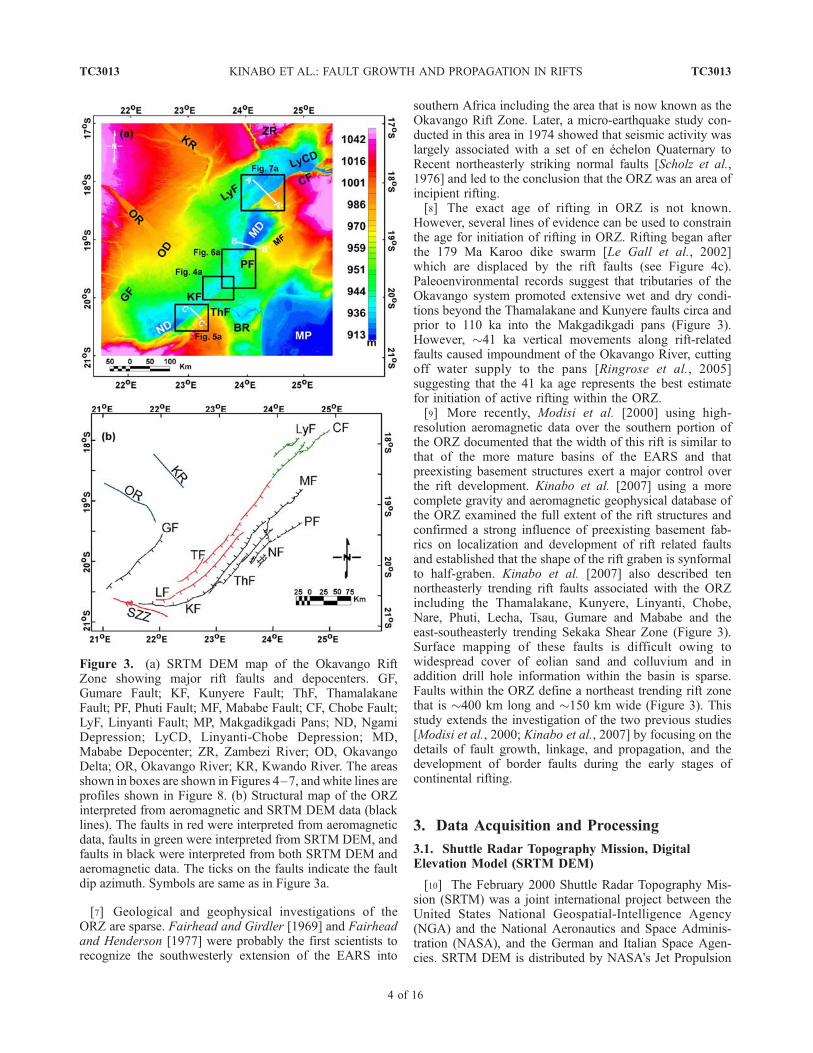
[6] The Okavango basin in NW Botswana is located atthe southern tip of the southwestern branch of the EARS(Figure 1). The rift lies within the Proterozoic Damaranmobile belt which is bounded by the Congo Craton to theNW and the Zimbabwe and Kaapvaal cratons to the south-east. The basement geology (Figure 2) in this area is mostlyburied underneath 200–300 m of the Kalahari sedimentsand very few outcrops are exposed in the northern andsouthern part of the ORZ [Modisi et al., 2000; Kinabo et al.,2007]. Pre-Okavango geologic units include marls, clays,gravels, eolian sands, calcrete, and silcretes which definethe 230-m-thick Cenozoic Kalahari beds. Carboniferous toJurassic Karroo supracrustal sequences include sedimentaryand volcanic rocks (Figure 2). A prominent feature is thewest-northwest-trending 179 Ma Karoo dike swarm. One ofthe most important features present within the basement inthis region are the relicts of the Mesoproterozoic to Neo-proterozoic northeast trending NW Botswana Rift with astrike length of 600 km and a width of 250 km [Key andAyres, 2000; Modie, 2000]. Rifting commenced in theMesoproterozoic but the main phase of rifting occurred inthe Neoproterozoic. The present-day Kalahari Suture Zonedefines the southeastern margin of the rift. This fault zonehas an extended history beginning as a major zone ofMesoproterozoic thrusting that was reactivated as a downto the northwest normal fault during the Neoproterozoic andthen subsequently became the locus of thrusting during the
Figure 1. SRTM DEM map of the East Africa Rift Systemshowing the location of the study area (red rectangle).
TC3013 KINABO ET AL.: FAULT GROWTH AND PROPAGATION IN RIFTS
2 of 16
TC3013
Damaran tectonism in the late Neoproterozoic to earlyPaleozoic [Key and Ayres, 2000]. The original northwestboundary of the rift is difficult to define because of over-printing during Damaran tectonism which intensifies to thenorthwest. Associated with the rift are a �2 km thick pile ofbimodal volcanic rocks of the Kwegbe Hills formationdated to be �1.1 Ga [Schwartz et al., 1996] which isoverlain by 4–5 km of the Neoproterozoic Ghanzi Groupsedimentary rocks. These sequences were subsequentlyfolded during Damaran tectonism to define a pronouncednortheast striking foliation readily visible in the aeromag-
netic maps of the basement [Key and Ayres, 2000; Kinabo etal., 2007]. Several models have been proposed for the originof this rift including extension as a result of late stageorogenic collapse [Kampunzu et al., 1998] or as a pull-apartbasin formed in transtension as a result of late stage dextralshearing during the waning phases of the Mesoproterozoiccontinental collision [Aldiss and Carney, 1992]. The pres-ent-day ORZ is forming within the confines of this old riftand as discussed below, the older basement fabric is greatlyinfluencing the development of faults and fault linkagesassociated with the ORZ.
Figure 2. Geologic map of Botswana. Adapted from Schluter [2006]. The study area is enclosed in theblack box.
TC3013 KINABO ET AL.: FAULT GROWTH AND PROPAGATION IN RIFTS
3 of 16
TC3013
[7] Geological and geophysical investigations of theORZ are sparse. Fairhead and Girdler [1969] and Fairheadand Henderson [1977] were probably the first scientists torecognize the southwesterly extension of the EARS into
southern Africa including the area that is now known as theOkavango Rift Zone. Later, a micro-earthquake study con-ducted in this area in 1974 showed that seismic activity waslargely associated with a set of en echelon Quaternary toRecent northeasterly striking normal faults [Scholz et al.,1976] and led to the conclusion that the ORZ was an area ofincipient rifting.[8] The exact age of rifting in ORZ is not known.
However, several lines of evidence can be used to constrainthe age for initiation of rifting in ORZ. Rifting began afterthe 179 Ma Karoo dike swarm [Le Gall et al., 2002]which are displaced by the rift faults (see Figure 4c).Paleoenvironmental records suggest that tributaries of theOkavango system promoted extensive wet and dry condi-tions beyond the Thamalakane and Kunyere faults circa andprior to 110 ka into the Makgadikgadi pans (Figure 3).However, �41 ka vertical movements along rift-relatedfaults caused impoundment of the Okavango River, cuttingoff water supply to the pans [Ringrose et al., 2005]suggesting that the 41 ka age represents the best estimatefor initiation of active rifting within the ORZ.[9] More recently, Modisi et al. [2000] using high-
resolution aeromagnetic data over the southern portion ofthe ORZ documented that the width of this rift is similar tothat of the more mature basins of the EARS and thatpreexisting basement structures exert a major control overthe rift development. Kinabo et al. [2007] using a morecomplete gravity and aeromagnetic geophysical database ofthe ORZ examined the full extent of the rift structures andconfirmed a strong influence of preexisting basement fab-rics on localization and development of rift related faultsand established that the shape of the rift graben is synformalto half-graben. Kinabo et al. [2007] also described tennortheasterly trending rift faults associated with the ORZincluding the Thamalakane, Kunyere, Linyanti, Chobe,Nare, Phuti, Lecha, Tsau, Gumare and Mababe and theeast-southeasterly trending Sekaka Shear Zone (Figure 3).Surface mapping of these faults is difficult owing towidespread cover of eolian sand and colluvium and inaddition drill hole information within the basin is sparse.Faults within the ORZ define a northeast trending rift zonethat is �400 km long and �150 km wide (Figure 3). Thisstudy extends the investigation of the two previous studies[Modisi et al., 2000; Kinabo et al., 2007] by focusing on thedetails of fault growth, linkage, and propagation, and thedevelopment of border faults during the early stages ofcontinental rifting.
3. Data Acquisition and Processing
3.1. Shuttle Radar Topography Mission, DigitalElevation Model (SRTM DEM)
[10] The February 2000 Shuttle Radar Topography Mis-sion (SRTM) was a joint international project between theUnited States National Geospatial-Intelligence Agency(NGA) and the National Aeronautics and Space Adminis-tration (NASA), and the German and Italian Space Agen-cies. SRTM DEM is distributed by NASA’s Jet Propulsion
Figure 3. (a) SRTM DEM map of the Okavango RiftZone showing major rift faults and depocenters. GF,Gumare Fault; KF, Kunyere Fault; ThF, ThamalakaneFault; PF, Phuti Fault; MF, Mababe Fault; CF, Chobe Fault;LyF, Linyanti Fault; MP, Makgadikgadi Pans; ND, NgamiDepression; LyCD, Linyanti-Chobe Depression; MD,Mababe Depocenter; ZR, Zambezi River; OD, OkavangoDelta; OR, Okavango River; KR, Kwando River. The areasshown in boxes are shown in Figures 4–7, and white lines areprofiles shown in Figure 8. (b) Structural map of the ORZinterpreted from aeromagnetic and SRTM DEM data (blacklines). The faults in red were interpreted from aeromagneticdata, faults in green were interpreted from SRTM DEM, andfaults in black were interpreted from both SRTM DEM andaeromagnetic data. The ticks on the faults indicate the faultdip azimuth. Symbols are same as in Figure 3a.
TC3013 KINABO ET AL.: FAULT GROWTH AND PROPAGATION IN RIFTS
4 of 16
TC3013
Lab (JPL) in 1� � 1� tiles. Two types of SRTM data areavailable: one arc data (SRTM-1, 30 m X-Y resolution); andthree arc data (SRTM-3, 90 m X-Y resolution and ±30 mroot mean square error z accuracy). Only SRTM 3 data areavailable for Africa and, therefore, are used in this study.Data were analyzed using ENVI. Data scenes were com-bined to form a mosaic and registered using image-to-imagetechnique [Chen and Lee, 1992]. Visual interpretations ofSRTM DEM are shown in the form of structural mapsillustrating the strike, dip direction, and spatial distributionof these faults and related structures (Figures 4b, 5b, 6b,and 7b). Topographic profiles were extracted from SRTMDEM data from selected areas to document the morphologyassociated with surface rupture of the rift faults. Threetopographic profiles (Figure 8) were extracted across theselected lineaments to demonstrate a consistent existence offault scarps (the profiles are 4–14 km apart). A movingaverage of 20 data points was applied to filter out above
ground features such as trees and boulders. Throughout ourdiscussion we will use DEM to represent SRTM DEM.
3.2. Aeromagnetic Data
[11] The aeromagnetic data were acquired in 1996 underthe direction of the Geological Survey of Botswana. Theflight elevation was 80 m along north-south lines withspacing of 250 m and tie lines were east-west (spaced1.25 km apart). The international geomagnetic referencefield was removed and data were gridded using a grid cellsize of 62.5 m and the minimum curvature technique[Briggs, 1974; Swain, 1976]. The grid cell size providesan estimate of the resolution of the aeromagnetic data.Minimum curvature gridding is accomplished by fittingthe smoothest possible surface to data values. First andsecond vertical derivative filters were applied to the totalfield magnetic data in order to enhance shallow seatedfeatures of the rift and the basement. Ternary maps were
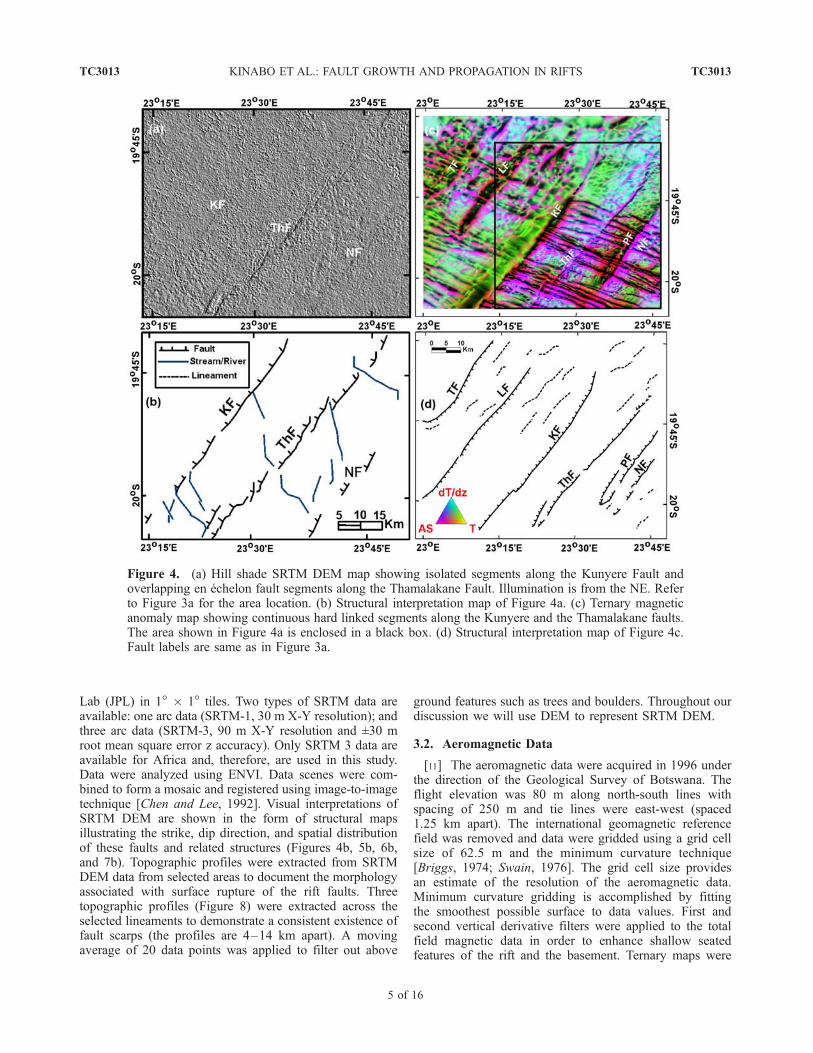
Figure 4. (a) Hill shade SRTM DEM map showing isolated segments along the Kunyere Fault andoverlapping en echelon fault segments along the Thamalakane Fault. Illumination is from the NE. Referto Figure 3a for the area location. (b) Structural interpretation map of Figure 4a. (c) Ternary magneticanomaly map showing continuous hard linked segments along the Kunyere and the Thamalakane faults.The area shown in Figure 4a is enclosed in a black box. (d) Structural interpretation map of Figure 4c.Fault labels are same as in Figure 3a.
TC3013 KINABO ET AL.: FAULT GROWTH AND PROPAGATION IN RIFTS
5 of 16
TC3013
prepared in order to enhance basement structural featuressuch as dikes, faults, fractures, and folds. A ternary diagramis a map made by combining color attributes of threeseparate data sets; in this study optimum enhancement ofbasement structures was obtained by plotting the totalmagnetic field, vertical derivative, and analytical signal datainto one color map (Figures 4c, 5c, 6c, and 7c). The‘‘analytical signal’’ is the square root of the sum of thesquares of the derivatives in three orthogonal directions asshown in the equation below
[12] The analytical signal is useful in locating the sourcesof magnetic bodies. Structural interpretation maps weremade from the ternary maps by tracing lineaments and bydefining boundaries between domains of distinctly differentmagnetic character (Figures 4d, 5d, 6d, and 7d). Depths tothe top of magnetic sources calculated from 3-D Euler
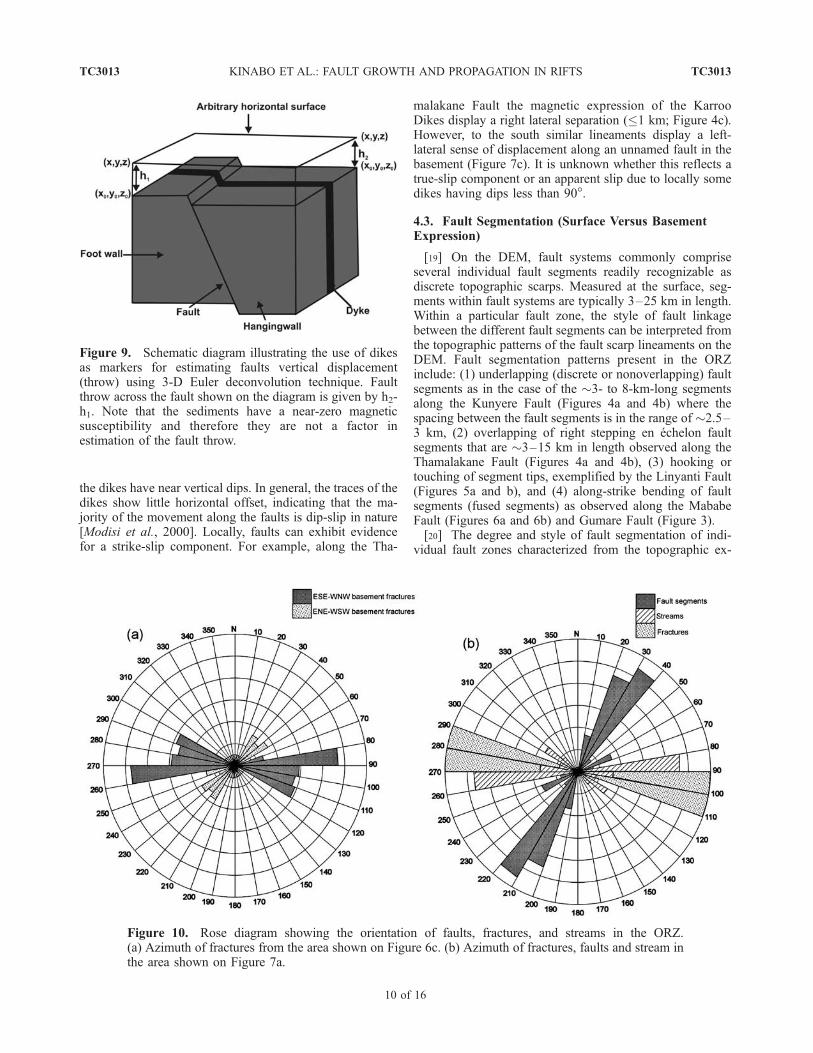
deconvolution presented by Kinabo et al. [2007] were usedto determine the vertical displacements along the faults.Parameters used for the depth estimates included a structuralindex of 1 for dikes, which were used as displacementmarkers because of their pervasiveness in the area and theircrosscutting relationship with the rift faults. We defined anerror limit of 5% for the depth and horizontal positionsthereby limiting solutions. Vertical throws across faultswere estimated by taking the difference in depth betweentwo segments of the dike displaced by faults (Figure 9). Asdocumented by Modisi et al. [2000], Euler solutions depthestimates across the fault zones are consistent with availableborehole data depths within the rift zone.
3.3. Interpretation and Mapping of Lineaments
[13] Surface mapping of faults within the ORZ is difficultowing to widespread surficial cover and weathering of therocks cut by faults. In most of the basin, fault zones areeasily eroded and commonly covered by calcrete. Hence,we relied on the DEM to map faults, using abrupt changesin color or tonal patterns, subtle topographic scarps, linear
Figure 5. (a) SRTM DEM map showing hard linkage along the Linyanti and Chobe faults. Refer toFigure 3a for the area location. (b) Structural interpretation map of Figure 5a. (c) Ternary magneticanomaly map of the same area. Note the folds in the basement as revealed by a ternary map. (d) Structuralinterpretation map of the Figure 5c. Labels are the same as in Figure 3a.
TC3013 KINABO ET AL.: FAULT GROWTH AND PROPAGATION IN RIFTS
6 of 16
TC3013
drainage patterns, and/or isolated exposures of mapped unitsthat are offset vertically. To confirm that the topographicfeatures mapped from the DEM are fault related rather thanfluvial erosional or depositional structures, slope convexityanalysis was performed [e.g., Nash, 1986]. Slope convexityis a measure of gentleness of a slope. In this analysis faultrelated slopes return a value of zero, depositional slopes avalue of +1, and erosional slopes a value of �1. The slopeconvexities of suspected fault scarps were then analyzed byextracting topographic profiles across the suspected faultscarps from the DEM data. In addition, a close spatialcorrespondence between the position of scarps on theDEM and the position of faults in the basement as mappedusing the aeromagnetic anomalies was used to check forconsistency in interpreting topographic scarps as being fault
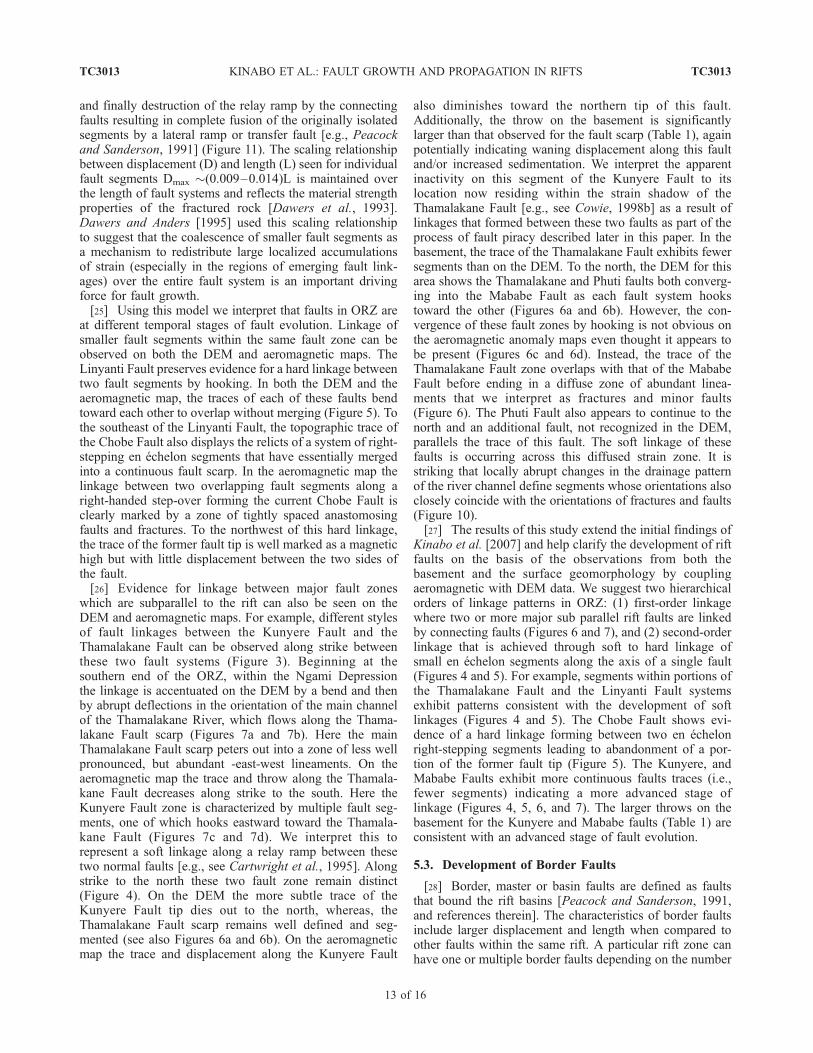
related (e.g., Figures 4 and 5). Other pronounced lineamentson the DEM, presumably corresponding to fractures, dikes,and in other locations stream channels, were noted andmapped. Rose diagrams were constructed using the azimuthof these lineaments to facilitate evaluation of spatial corre-lations and interpretation of these features (Figure 10).[14] Several map enhancements and analytical techniques
as discussed above were applied to the aeromagnetic data tohelp understand fault parameters and their aeromagneticexpressions. In the high-resolution aeromagnetic data, faultswere identified as dominantly linear to slightly curvinglineaments that typically have very pronounced analyticalsignals and by the presence of: (1) abrupt changes in themagnetic character or fabric, (2) linear clusters of Eulersolutions, (3) the magnitude of the vertical derivative,
Figure 6. (a) SRTM DEM image showing linkage of the Thamalakane and Phuti faults to the Mababefault. Refer to Figure 3a for the area location. The black circle encloses A (channel A) and B (channel B)which occupy fractures linking the Thamalakane Fault to the Mababe Fault and the Phuti Fault to theMababe Fault, respectively. (b) Structural interpretation map of Figure 6a. (c) Ternary magnetic anomalymap showing hard linkage along the Mababe Fault. The black box shows the area shown on Figure 6a.(d) Structural interpretation map of Figure 6c. Labels are the same as in Figure 3a.
TC3013 KINABO ET AL.: FAULT GROWTH AND PROPAGATION IN RIFTS
7 of 16
TC3013
(4) magnetic intensity, and/or by (5) truncation of prominentmagnetic anomalies known to be related to the ESE-WNWKarroo dike swarm [Modisi et al., 2000]. The change in themagnetic intensity of the dikes across the linear magneticanomalies indicates a difference in magnetic contrast acrossthe fault. For example, on Figure 4c the ESE-WNW trend-ing linear anomalies (purples) associated with the Karoodikes is clearly visible on the east side (up-thrown block) ofthe Kunyere Fault. However, across the fault, dike anoma-lies are more subtle and of lower intensity (greens andblues) consistent with this being the down-thrown block;that is, the depth to the top of the magnetic source is deeperresulting in the lower amplitude of the magnetic anomalies(see Figure 9). Other pronounced lineaments in the aero-magnetic data set, presumably corresponding to dikes,basement fractures, lithologic layering, and the trace of foldaxes, were noted and mapped. The correspondence ofmapped linear magnetic anomalies to surficial evidence offaulting across the area is the primary evidence that thelinear anomalies represent aeromagnetic expressions of
faults. In map view, these linear anomalies show patternstypical of extensional faulting, such as anastomosing (e.g.,Chobe Fault, Figure 5c) and en echelon segments (e.g.,Linyanti Fault, Figure 5c). Additionally, linear anomaliesassociated with faults have amplitudes on the magnetic mapthat commonly range from 200–600 nT with widths of150–200 m.[15] Rose diagrams were constructed using the azimuth
of these lineaments (Figure 10). The location of suspectedfault boundaries, and other mapped lineaments in theaeromagnetic map were then qualitatively compared withfault scarps and lineaments identified on the DEM toevaluate their degree of spatial correlation.
4. Results
[16] Structural maps constructed from a combined anal-ysis of topographic lineaments as depicted on the DEM dataand magnetic lineaments in the buried basement rocks asdepicted in the aeromagnetic data are shown in Figures 4–7
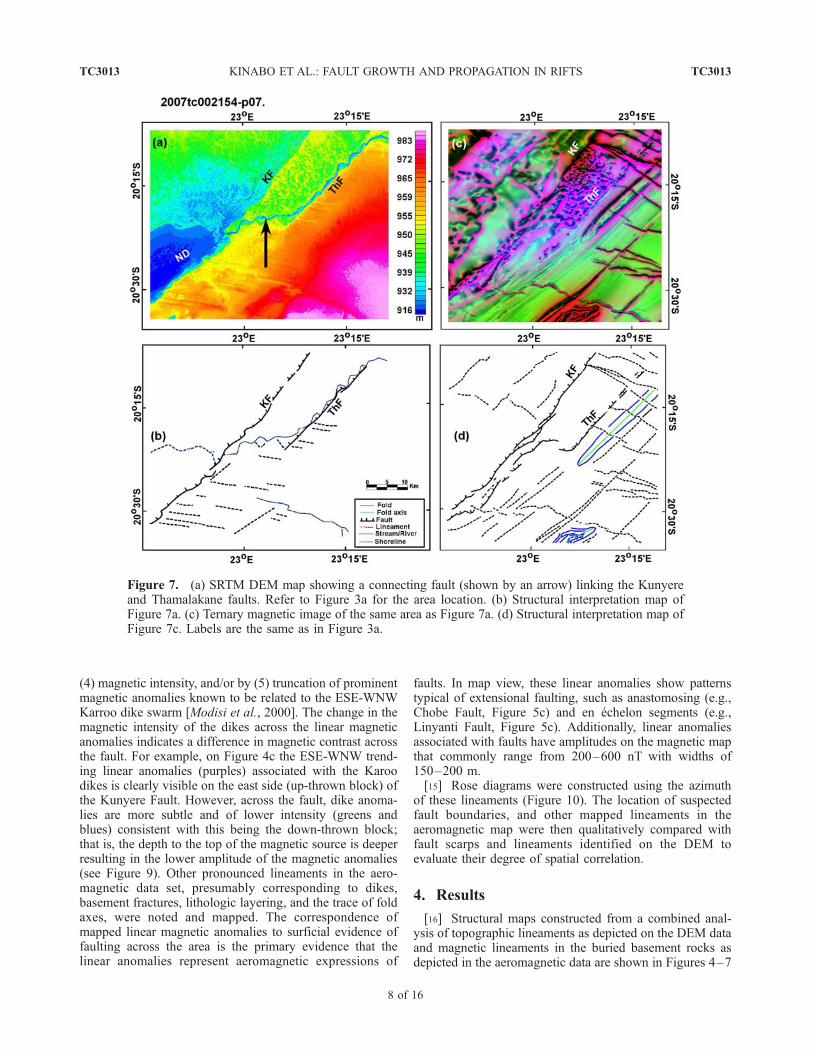
Figure 7. (a) SRTM DEM map showing a connecting fault (shown by an arrow) linking the Kunyereand Thamalakane faults. Refer to Figure 3a for the area location. (b) Structural interpretation map ofFigure 7a. (c) Ternary magnetic image of the same area as Figure 7a. (d) Structural interpretation map ofFigure 7c. Labels are the same as in Figure 3a.
TC3013 KINABO ET AL.: FAULT GROWTH AND PROPAGATION IN RIFTS
8 of 16
TC3013
for selected regions of the ORZ. The ORZ is defined byeleven recognized major fault systems; they are the Chobe,Linyanti, Mababe, Phuti, Nare, Thamalakane, Tsau, Gumare,Lecha, and Kunyere Fault Zones, and the Sekaka ShearZone (Figure 3). The physical characteristics of the faults(e.g., total lengths, throw, scarp height, linkage style) asindependently determined from the DEM and from theaeromagnetic maps are summarized in Table 1. Our obser-vations are as follows.
4.1. Fault Throws Versus Scarp Heights
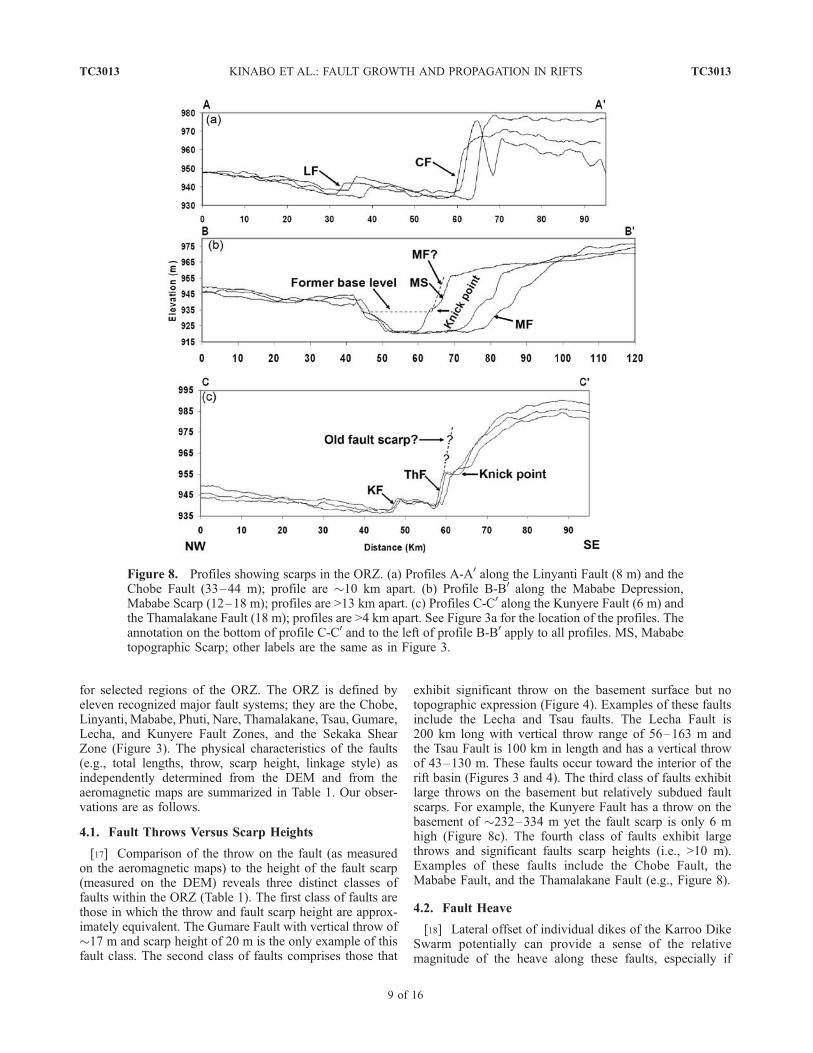
[17] Comparison of the throw on the fault (as measuredon the aeromagnetic maps) to the height of the fault scarp(measured on the DEM) reveals three distinct classes offaults within the ORZ (Table 1). The first class of faults arethose in which the throw and fault scarp height are approx-imately equivalent. The Gumare Fault with vertical throw of�17 m and scarp height of 20 m is the only example of thisfault class. The second class of faults comprises those that
exhibit significant throw on the basement surface but notopographic expression (Figure 4). Examples of these faultsinclude the Lecha and Tsau faults. The Lecha Fault is200 km long with vertical throw range of 56–163 m andthe Tsau Fault is 100 km in length and has a vertical throwof 43–130 m. These faults occur toward the interior of therift basin (Figures 3 and 4). The third class of faults exhibitlarge throws on the basement but relatively subdued faultscarps. For example, the Kunyere Fault has a throw on thebasement of �232–334 m yet the fault scarp is only 6 mhigh (Figure 8c). The fourth class of faults exhibit largethrows and significant faults scarp heights (i.e., >10 m).Examples of these faults include the Chobe Fault, theMababe Fault, and the Thamalakane Fault (e.g., Figure 8).
4.2. Fault Heave
[18] Lateral offset of individual dikes of the Karroo DikeSwarm potentially can provide a sense of the relativemagnitude of the heave along these faults, especially if
Figure 8. Profiles showing scarps in the ORZ. (a) Profiles A-A0 along the Linyanti Fault (8 m) and theChobe Fault (33–44 m); profile are �10 km apart. (b) Profile B-B0 along the Mababe Depression,Mababe Scarp (12–18 m); profiles are >13 km apart. (c) Profiles C-C0 along the Kunyere Fault (6 m) andthe Thamalakane Fault (18 m); profiles are >4 km apart. See Figure 3a for the location of the profiles. Theannotation on the bottom of profile C-C0 and to the left of profile B-B0 apply to all profiles. MS, Mababetopographic Scarp; other labels are the same as in Figure 3.
TC3013 KINABO ET AL.: FAULT GROWTH AND PROPAGATION IN RIFTS
9 of 16
TC3013
the dikes have near vertical dips. In general, the traces of thedikes show little horizontal offset, indicating that the ma-jority of the movement along the faults is dip-slip in nature[Modisi et al., 2000]. Locally, faults can exhibit evidencefor a strike-slip component. For example, along the Tha-
malakane Fault the magnetic expression of the KarrooDikes display a right lateral separation (1 km; Figure 4c).However, to the south similar lineaments display a left-lateral sense of displacement along an unnamed fault in thebasement (Figure 7c). It is unknown whether this reflects atrue-slip component or an apparent slip due to locally somedikes having dips less than 90�.
4.3. Fault Segmentation (Surface Versus BasementExpression)
[19] On the DEM, fault systems commonly compriseseveral individual fault segments readily recognizable asdiscrete topographic scarps. Measured at the surface, seg-ments within fault systems are typically 3–25 km in length.Within a particular fault zone, the style of fault linkagebetween the different fault segments can be interpreted fromthe topographic patterns of the fault scarp lineaments on theDEM. Fault segmentation patterns present in the ORZinclude: (1) underlapping (discrete or nonoverlapping) faultsegments as in the case of the �3- to 8-km-long segmentsalong the Kunyere Fault (Figures 4a and 4b) where thespacing between the fault segments is in the range of �2.5–3 km, (2) overlapping of right stepping en echelon faultsegments that are �3–15 km in length observed along theThamalakane Fault (Figures 4a and 4b), (3) hooking ortouching of segment tips, exemplified by the Linyanti Fault(Figures 5a and b), and (4) along-strike bending of faultsegments (fused segments) as observed along the MababeFault (Figures 6a and 6b) and Gumare Fault (Figure 3).[20] The degree and style of fault segmentation of indi-
vidual fault zones characterized from the topographic ex-
Figure 9. Schematic diagram illustrating the use of dikesas markers for estimating faults vertical displacement(throw) using 3-D Euler deconvolution technique. Faultthrow across the fault shown on the diagram is given by h2-h1. Note that the sediments have a near-zero magneticsusceptibility and therefore they are not a factor inestimation of the fault throw.
Figure 10. Rose diagram showing the orientation of faults, fractures, and streams in the ORZ.(a) Azimuth of fractures from the area shown on Figure 6c. (b) Azimuth of fractures, faults and stream inthe area shown on Figure 7a.
TC3013 KINABO ET AL.: FAULT GROWTH AND PROPAGATION IN RIFTS
10 of 16
TC3013
pression of the fault scarps on the DEM can differ from thatdetermined from the expression of the same fault in thebasement on the aeromagnetic map. For example, theKunyere Fault is composed of four segments that are 3–8 km long on the DEM whereas on the aeromagnetic map itis a continuous fault composed of possibly two segmentsthat are 20 and 50 km in length (Figure 4). The DEMexpression of the Thamalakane Fault (Figures 4a and 4b) ischaracterized by en echelon right stepping segments that are3–15 km long while the aeromagnetic expression of thesame fault is characterized by fewer relatively longer (�20–30 km in length) fault segments (Figures 4c and 4d).
5. Discussion
5.1. Fault Characteristics
[21] All the faults mapped on the aeromagnetic maps,with the exception of the Lecha and Tsau Faults, havetopographic scarps associated with their surface expressions(e.g., Figure 4 and Table 1). The lack of surface expressionfor the Lecha and Tsau basement faults may indicate (1) thatthese are much older faults that for some reason haveremained inactive during the extensional tectonic regimeassociated with the ORZ, (2) these faults are active but lacksufficient energy to rupture the surface (i.e., blind normalfaults), or (3) that these basement faults were active duringthe early stages of ORZ rifting, but have now been con-cealed by rapid sedimentation associated with Okavangoalluvial fan deposits. We suggest the final possibility as themore likely alternative as below we discuss that the rift iswidening and abandoning interior faults as it matures. Formany faults, the scarp heights are significantly smaller thanthe fault throw values calculated from the 3-D Eulerdeconvolution solutions (Table 1). The discrepancy is asmuch as 500 m along the Mababe Fault. We offer thefollowing possible explanation for these differences. Ex-tended fault histories comprises multiple displacementevents coupled with ongoing sedimentation will result indifferences between the throws on the basement and thefault scarp height. In this case, the throw on the basement
records the time integrated displacement over the life of thefault, whereas, the height of the fault scarp will record onlythe more recent movements on the fault. Thus, highersedimentation rates from the Okavango River compared tothe vertical movement along still active faults can lead topartial or complete burial of older fault scarps. Conversely,faults that were once active and have since become dormantor relatively inactive will have fault scarps that are dimin-ished by even moderate to low sedimentation rates. Recentseismic events along several of the major rift faults supportthe higher sedimentation rates scenario [Scholz et al., 1976].[22] Within the ORZ, major fault zones and their seg-
ments have orientations that parallel the structural fabric ofthe basement emphasizing the role of preexisting structureson the development of rift faults [e.g., Ring, 1994]. Thisstrength anisotropy in the basement greatly influenced thelocation and orientation for brittle failure. For example, thelow displacement to length scaling relations observedfor these faults may to a large extent reflect a reduction inthe stress required to produce failure and laterally propagatefaults along these preexisting planes of weakness. Thus wesuggest that in areas of continental rifting where olderbasement structures are oriented favorably to exert a stronginfluence on fault development, normal faults with seem-ingly anomalous strike lengths of 100 km [e.g., see Fosteret al., 1997; Ebinger et al., 1997] may appear early in thedevelopment of the rift. In addition, comparison of the throwon the basement surface with the throw on the topographicfault scarp demonstrates that many of the faults haveextended histories. Most of the faults suggest evidence formultiple episode of faulting with concomitant sedimentationalong the down thrown block and erosion of the faultscarps. The presence of terraces in the Mababe and Tha-malakane fault scarps subdivides the profiles into multipleupper and lower scarps (Figures 8b and 8c). The topographicslope on the scarp above the terrace has been modified byerosion. The topographic slope on the scarp below theterrace does not appear to have been significantly modifiedby erosion (Figure 8c). We interpret the topographic terracesseparating the upper and lower scarps to reflect retreat of the
Table 1. Physical Characteristics of Selected Faults From the Okavango Rift Zonea
aNTE, no topographic scarp; ND, not determined.bEstimated from SRTM DEM.
TC3013 KINABO ET AL.: FAULT GROWTH AND PROPAGATION IN RIFTS
11 of 16
TC3013
fault scarp as a result of erosion during the hiatus betweenepisodes of faulting. This requires the multiple episodes offaulting to have been sufficiently recent and spaced closelyenough that erosion has not removed the topographicevidence of the older displacement. Alternatively, the terra-ces may also reflect changes in local base level (Figure 8b),which is consistent with the presence of well marked formershorelines of Lake Mababe (Figure 3). The extent to whichchanges in local base level is in turn influenced by faultingremains to be constrained. Thus, older faults that haveestablished long fault traces as a result of multiple episodesof faulting and through linking of fault segments mayexhibit topographic scarps with lower than expected reliefas a result of: (1) the height of the topographic fault scarpreflects only the most recent displacement event that rup-tured the surface, (2) since the last displacement, the heightof the fault scarp has been reduced by sedimentation, (3) theheight of the fault scarp has been reduced by erosion, and/or(4) these faults propagate laterally to much greater extentsthan predicted from fault length fault throw scaling relation-ships because of the relative ease by which preexistingweaknesses in the basement terranes fail.
5.2. Fault Growth and Propagation
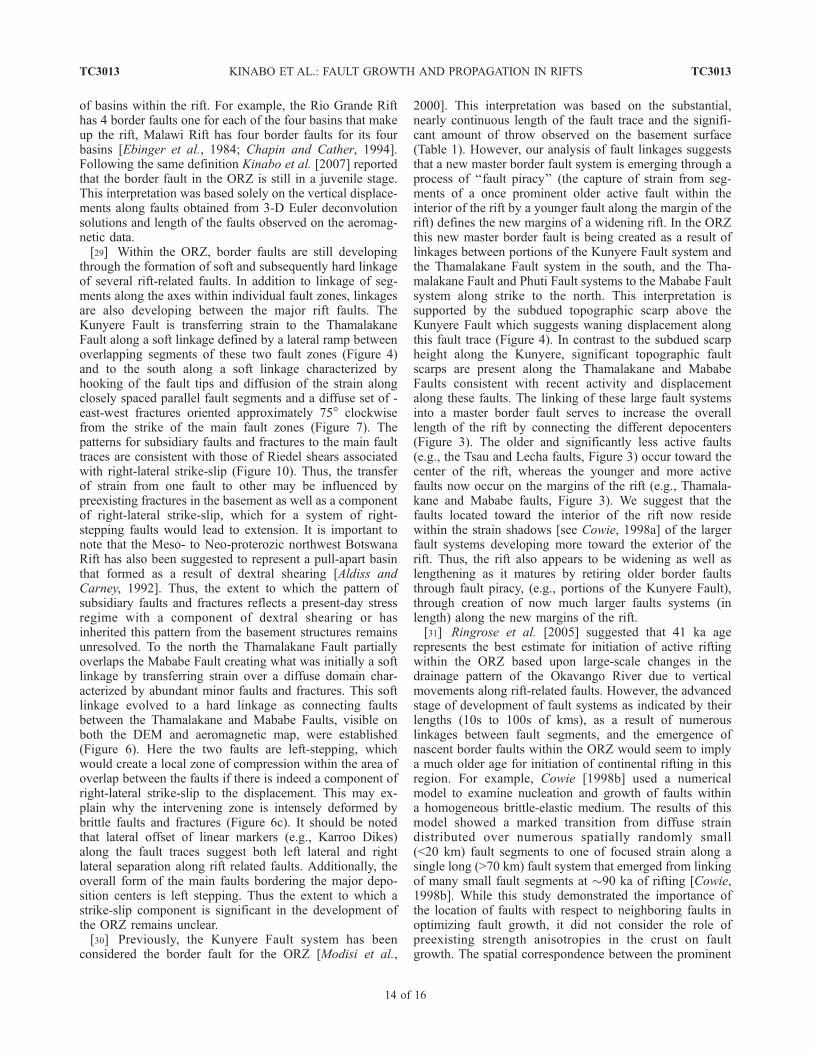
[23] Integrating the results from the two data sets allow usto better evaluate the three dimensional geometry of thefault planes, and therefore the growth of faults through faultlinkages based upon the patterns of fault scarps in the DEMand fault traces in the aeromagnetic maps [e.g., see Walsh etal., 2003]. For example, the traces of the Thamalakane andKunyere faults are segmented on the DEM map but arecontinuous on the aeromagnetic map (Figure 4). The faultsinitiate at depth nucleating on preexisting planar weak-nesses within the basement as long continuous faults. Asthe leading edge of the propagating fault plane approachesthe topographic surface, twists similar to those which formalong the margins of joints, develop and rupture the surface(Figure 11). These twists will appear as en echelon faultsegments on the DEM and could be erroneously interpretedas discrete fault planes related by soft linkage even in thebasement if only the DEM data were available for interpre-tation. Walsh et al. [2003] also present examples wheresegmented faults, when viewed on two dimensional mapscould be considered as separate isolated faults, but in threedimensions can be shown to be related to a single fault thatformed relay zones as the fault propagated upward towardthe free surface (supporting the coherent model of Walsh etal. [2003], where a developing en echelon fault at thesurface is linked at depth to form a single fault).[24] With these cautions in mind, the results of the
combined aeromagnetic and DEM investigations are con-sistent with a model for fault evolution beginning withexploitation of preexisting weakness in the basement byshort discrete fault segments (3–25 km long) which prop-agate and eventually merge to form long continuous faultsegments (�25–325 km long). Current models for faultgrowth and development suggest that faults grow as a resultof formation of first soft linkages then hard linkagesbetween small originally isolated fault segments [Peacockand Sanderson, 1991; Trudgill and Cartwright, 1994;Dawers and Anders, 1995; Cowie, 1998b] (although, seeWalsh et al. [2003] for an alternative model). Within aregional stress field, which fault segments will remain activeand eventually link together to grow and, which willeventually become inactive to a large extent is dependentupon the spatial location of fault segments with respect tothe stress shadows of the neighboring fault segments[Cowie, 1998b]. Faults that are optimally oriented withrespect to their neighbors will be more active and lengthenfaster than faults that are positioned within the stressshadows of other faults. This creates both a positive andnegative feedback between faults leading to the develop-ment of larger fault systems by the linking of the optimallyfavored fault segments at the expense of the other faults(e.g., this scenario is evident between the Kunyere andThamalakane faults, Figure 7 (see discussion below)). Theactive fault segments initially interact through soft linkageswhich are characterized by underlapping segments that withincreased stress continue to propagate and eventually over-lap to form relay ramps. Further increase of stress leads tothe development of hard linkages, which is marked bydevelopment of connecting faults across the relay ramp,
Figure 11. (a) Model showing fault growth and linkage ina progressively increasing stress extensional environment.Modified from Le Calvez and Vendeville [2002]. (b) Enechelon segments at the surface may be twists connected tothe same fault plane at depth as exemplified by portions ofthe Kunyere Fault and Thamalakane Fault in Figure 4.
TC3013 KINABO ET AL.: FAULT GROWTH AND PROPAGATION IN RIFTS
12 of 16
TC3013
and finally destruction of the relay ramp by the connectingfaults resulting in complete fusion of the originally isolatedsegments by a lateral ramp or transfer fault [e.g., Peacockand Sanderson, 1991] (Figure 11). The scaling relationshipbetween displacement (D) and length (L) seen for individualfault segments Dmax �(0.009–0.014)L is maintained overthe length of fault systems and reflects the material strengthproperties of the fractured rock [Dawers et al., 1993].Dawers and Anders [1995] used this scaling relationshipto suggest that the coalescence of smaller fault segments asa mechanism to redistribute large localized accumulationsof strain (especially in the regions of emerging fault link-ages) over the entire fault system is an important drivingforce for fault growth.[25] Using this model we interpret that faults in ORZ are
at different temporal stages of fault evolution. Linkage ofsmaller fault segments within the same fault zone can beobserved on both the DEM and aeromagnetic maps. TheLinyanti Fault preserves evidence for a hard linkage betweentwo fault segments by hooking. In both the DEM and theaeromagnetic map, the traces of each of these faults bendtoward each other to overlap without merging (Figure 5). Tothe southeast of the Linyanti Fault, the topographic trace ofthe Chobe Fault also displays the relicts of a system of right-stepping en echelon segments that have essentially mergedinto a continuous fault scarp. In the aeromagnetic map thelinkage between two overlapping fault segments along aright-handed step-over forming the current Chobe Fault isclearly marked by a zone of tightly spaced anastomosingfaults and fractures. To the northwest of this hard linkage,the trace of the former fault tip is well marked as a magnetichigh but with little displacement between the two sides ofthe fault.[26] Evidence for linkage between major fault zones
which are subparallel to the rift can also be seen on theDEM and aeromagnetic maps. For example, different stylesof fault linkages between the Kunyere Fault and theThamalakane Fault can be observed along strike betweenthese two fault systems (Figure 3). Beginning at thesouthern end of the ORZ, within the Ngami Depressionthe linkage is accentuated on the DEM by a bend and thenby abrupt deflections in the orientation of the main channelof the Thamalakane River, which flows along the Thama-lakane Fault scarp (Figures 7a and 7b). Here the mainThamalakane Fault scarp peters out into a zone of less wellpronounced, but abundant -east-west lineaments. On theaeromagnetic map the trace and throw along the Thamala-kane Fault decreases along strike to the south. Here theKunyere Fault zone is characterized by multiple fault seg-ments, one of which hooks eastward toward the Thamala-kane Fault (Figures 7c and 7d). We interpret this torepresent a soft linkage along a relay ramp between thesetwo normal faults [e.g., see Cartwright et al., 1995]. Alongstrike to the north these two fault zone remain distinct(Figure 4). On the DEM the more subtle trace of theKunyere Fault tip dies out to the north, whereas, theThamalakane Fault scarp remains well defined and seg-mented (see also Figures 6a and 6b). On the aeromagneticmap the trace and displacement along the Kunyere Fault
also diminishes toward the northern tip of this fault.Additionally, the throw on the basement is significantlylarger than that observed for the fault scarp (Table 1), againpotentially indicating waning displacement along this faultand/or increased sedimentation. We interpret the apparentinactivity on this segment of the Kunyere Fault to itslocation now residing within the strain shadow of theThamalakane Fault [e.g., see Cowie, 1998b] as a result oflinkages that formed between these two faults as part of theprocess of fault piracy described later in this paper. In thebasement, the trace of the Thamalakane Fault exhibits fewersegments than on the DEM. To the north, the DEM for thisarea shows the Thamalakane and Phuti faults both converg-ing into the Mababe Fault as each fault system hookstoward the other (Figures 6a and 6b). However, the con-vergence of these fault zones by hooking is not obvious onthe aeromagnetic anomaly maps even thought it appears tobe present (Figures 6c and 6d). Instead, the trace of theThamalakane Fault zone overlaps with that of the MababeFault before ending in a diffuse zone of abundant linea-ments that we interpret as fractures and minor faults(Figure 6). The Phuti Fault also appears to continue to thenorth and an additional fault, not recognized in the DEM,parallels the trace of this fault. The soft linkage of thesefaults is occurring across this diffused strain zone. It isstriking that locally abrupt changes in the drainage patternof the river channel define segments whose orientations alsoclosely coincide with the orientations of fractures and faults(Figure 10).[27] The results of this study extend the initial findings of
Kinabo et al. [2007] and help clarify the development of riftfaults on the basis of the observations from both thebasement and the surface geomorphology by couplingaeromagnetic with DEM data. We suggest two hierarchicalorders of linkage patterns in ORZ: (1) first-order linkagewhere two or more major sub parallel rift faults are linkedby connecting faults (Figures 6 and 7), and (2) second-orderlinkage that is achieved through soft to hard linkage ofsmall en echelon segments along the axis of a single fault(Figures 4 and 5). For example, segments within portions ofthe Thamalakane Fault and the Linyanti Fault systemsexhibit patterns consistent with the development of softlinkages (Figures 4 and 5). The Chobe Fault shows evi-dence of a hard linkage forming between two en echelonright-stepping segments leading to abandonment of a por-tion of the former fault tip (Figure 5). The Kunyere, andMababe Faults exhibit more continuous faults traces (i.e.,fewer segments) indicating a more advanced stage oflinkage (Figures 4, 5, 6, and 7). The larger throws on thebasement for the Kunyere and Mababe faults (Table 1) areconsistent with an advanced stage of fault evolution.
5.3. Development of Border Faults
[28] Border, master or basin faults are defined as faultsthat bound the rift basins [Peacock and Sanderson, 1991,and references therein]. The characteristics of border faultsinclude larger displacement and length when compared toother faults within the same rift. A particular rift zone canhave one or multiple border faults depending on the number
TC3013 KINABO ET AL.: FAULT GROWTH AND PROPAGATION IN RIFTS
13 of 16
TC3013
of basins within the rift. For example, the Rio Grande Rifthas 4 border faults one for each of the four basins that makeup the rift, Malawi Rift has four border faults for its fourbasins [Ebinger et al., 1984; Chapin and Cather, 1994].Following the same definition Kinabo et al. [2007] reportedthat the border fault in the ORZ is still in a juvenile stage.This interpretation was based solely on the vertical displace-ments along faults obtained from 3-D Euler deconvolutionsolutions and length of the faults observed on the aeromag-netic data.[29] Within the ORZ, border faults are still developing
through the formation of soft and subsequently hard linkageof several rift-related faults. In addition to linkage of seg-ments along the axes within individual fault zones, linkagesare also developing between the major rift faults. TheKunyere Fault is transferring strain to the ThamalakaneFault along a soft linkage defined by a lateral ramp betweenoverlapping segments of these two fault zones (Figure 4)and to the south along a soft linkage characterized byhooking of the fault tips and diffusion of the strain alongclosely spaced parallel fault segments and a diffuse set of -east-west fractures oriented approximately 75� clockwisefrom the strike of the main fault zones (Figure 7). Thepatterns for subsidiary faults and fractures to the main faulttraces are consistent with those of Riedel shears associatedwith right-lateral strike-slip (Figure 10). Thus, the transferof strain from one fault to other may be influenced bypreexisting fractures in the basement as well as a componentof right-lateral strike-slip, which for a system of right-stepping faults would lead to extension. It is important tonote that the Meso- to Neo-proterozic northwest BotswanaRift has also been suggested to represent a pull-apart basinthat formed as a result of dextral shearing [Aldiss andCarney, 1992]. Thus, the extent to which the pattern ofsubsidiary faults and fractures reflects a present-day stressregime with a component of dextral shearing or hasinherited this pattern from the basement structures remainsunresolved. To the north the Thamalakane Fault partiallyoverlaps the Mababe Fault creating what was initially a softlinkage by transferring strain over a diffuse domain char-acterized by abundant minor faults and fractures. This softlinkage evolved to a hard linkage as connecting faultsbetween the Thamalakane and Mababe Faults, visible onboth the DEM and aeromagnetic map, were established(Figure 6). Here the two faults are left-stepping, whichwould create a local zone of compression within the area ofoverlap between the faults if there is indeed a component ofright-lateral strike-slip to the displacement. This may ex-plain why the intervening zone is intensely deformed bybrittle faults and fractures (Figure 6c). It should be notedthat lateral offset of linear markers (e.g., Karroo Dikes)along the fault traces suggest both left lateral and rightlateral separation along rift related faults. Additionally, theoverall form of the main faults bordering the major depo-sition centers is left stepping. Thus the extent to which astrike-slip component is significant in the development ofthe ORZ remains unclear.[30] Previously, the Kunyere Fault system has been
considered the border fault for the ORZ [Modisi et al.,
2000]. This interpretation was based on the substantial,nearly continuous length of the fault trace and the signifi-cant amount of throw observed on the basement surface(Table 1). However, our analysis of fault linkages suggeststhat a new master border fault system is emerging through aprocess of ‘‘fault piracy’’ (the capture of strain from seg-ments of a once prominent older active fault within theinterior of the rift by a younger fault along the margin of therift) defines the new margins of a widening rift. In the ORZthis new master border fault is being created as a result oflinkages between portions of the Kunyere Fault system andthe Thamalakane Fault system in the south, and the Tha-malakane Fault and Phuti Fault systems to the Mababe Faultsystem along strike to the north. This interpretation issupported by the subdued topographic scarp above theKunyere Fault which suggests waning displacement alongthis fault trace (Figure 4). In contrast to the subdued scarpheight along the Kunyere, significant topographic faultscarps are present along the Thamalakane and MababeFaults consistent with recent activity and displacementalong these faults. The linking of these large fault systemsinto a master border fault serves to increase the overalllength of the rift by connecting the different depocenters(Figure 3). The older and significantly less active faults(e.g., the Tsau and Lecha faults, Figure 3) occur toward thecenter of the rift, whereas the younger and more activefaults now occur on the margins of the rift (e.g., Thamala-kane and Mababe faults, Figure 3). We suggest that thefaults located toward the interior of the rift now residewithin the strain shadows [see Cowie, 1998a] of the largerfault systems developing more toward the exterior of therift. Thus, the rift also appears to be widening as well aslengthening as it matures by retiring older border faultsthrough fault piracy, (e.g., portions of the Kunyere Fault),through creation of now much larger faults systems (inlength) along the new margins of the rift.[31] Ringrose et al. [2005] suggested that 41 ka age
represents the best estimate for initiation of active riftingwithin the ORZ based upon large-scale changes in thedrainage pattern of the Okavango River due to verticalmovements along rift-related faults. However, the advancedstage of development of fault systems as indicated by theirlengths (10s to 100s of kms), as a result of numerouslinkages between fault segments, and the emergence ofnascent border faults within the ORZ would seem to implya much older age for initiation of continental rifting in thisregion. For example, Cowie [1998b] used a numericalmodel to examine nucleation and growth of faults withina homogeneous brittle-elastic medium. The results of thismodel showed a marked transition from diffuse straindistributed over numerous spatially randomly small(<20 km) fault segments to one of focused strain along asingle long (>70 km) fault system that emerged from linkingof many small fault segments at �90 ka of rifting [Cowie,1998b]. While this study demonstrated the importance ofthe location of faults with respect to neighboring faults inoptimizing fault growth, it did not consider the role ofpreexisting strength anisotropies in the crust on faultgrowth. The spatial correspondence between the prominent
TC3013 KINABO ET AL.: FAULT GROWTH AND PROPAGATION IN RIFTS
14 of 16
TC3013
basement fabric (foliations and fractures) and the orientationof normal faults and linkages suggest that these planarstrength anisotropies were in the optimal orientation withrespect to the regional stress field to be easily reactivated.The lower critical stress required for brittle failure alongthese planes would allow faults to propagate further andwith greater frequency in comparison to intact rock. Thiswould in turn accelerate the process of creating fault link-ages between fault segments to form longer fault systemsand at the same time inhibiting the nucleation and devel-opment of faults that reside with the strain shadows of thelarger faults as described by the model of Cowie [1998b].Thus we suggest the apparent discrepancy in fault lengthsand the young age of the ORZ serves to highlight theimportance of considering the effect of preexisting strengthanisotropies within the crust on fault nucleation, propaga-tion, and growth as well as on the scaling relationshipsbetween Dmax and Length.
5.4. Neotectonics and Fluvial Systems
[32] The main fault zones, the linkages between thesezones, and preexisting basement fabrics appear to be exertinga profound influence on the drainage patterns of the fluvialsystems in the ORZ. Linkages between major fault zones arecommonly areas of intense fracturing that have been influ-enced by the orientation of basement fabrics and areexploited by stream/river erosion. For example, in the souththe Thamalakane River flows along the Thamalakane Faultand exhibits abrupt deflections (rather than smooth mean-ders) in the orientation of its course (as seen on DEM) thatdefine a pattern of right stepping en echelon river channelsegments (Figure 7). South of 20�150S the river flows in analmost east-west direction, cutting through the Kunyere Faultand into Lake Ngami along NE trending right stepping enechelon segments. In the north, the interaction of theThamalakane Fault and the Mababe Fault coincides with aNNE trending stream (channel A; Figures 6a and 6b) whilethe interaction between the Phuti Fault and the Mababe Faultis highlighted by a NNW trending stream channel B(Figures 6a and 6b). Fractures orientation on DEM andaeromagnetic maps display pronounced �ESE-WNW andalso SSW-NNE and SSE-NNW trends coinciding with thetrends of the stream channels (Figures 6, 7, and 10). Simi-larly, a study byWormald et al. [2003] found out that pans arealso aligned 030�–050� and 130�. The pans develop alongthe southern side of the ORZ reflecting the general SE tilt ofthe faults blocks along listric normal faults (Figure 3 and 10).Hence, it appears that faults and fractures are exerting a
profound influence on the location and development of theriver/stream channels and pans highlighting the coupling ofneotectonic and fluvial activities in the ORZ.
6. Conclusions
[33] The integration of high-resolution aeromagnetic datawith DEM data made possible important insights into faultgrowth and propagation associated with the ORZ. Coupledanalysis of SRTM DEM and aeromagnetic data has revealedthat (1) the growth of individual rift faults occurs by alongaxis linkage of small segments; (2) on the basis of therelationship between fault throws and scarp heights, thefaults in the ORZ can be categorized into four groups (groupa) old and active such as the Thamalakane and Mababefaults, (group b) young and active, for example the GumareFault, (group c) faults with no recent activity such as theLecha and Tsau faults, and (group d) faults with waningactivity, for example the Kunyere Fault; (3) young and moreactive rift faults are located on the outer margin of the rift,whereas old and non active faults are in the middlesuggesting that the rift grows both in length (by along axislinkage of segments) and width; (4) a border fault system isdeveloping by linkage of major subparallel rift faults andretirement of portions of other fault segments through faultpiracy. This process results in both lengthening and widen-ing of the rift basin; (5) anisotropies present in the basement(basement fractures, faults, foliations) greatly influenced thedevelopment of faults associated with the formation of theORZ, including fault orientations, linkages between faultsegments, and extending fault lengths. Utilization of thesepreexisting zones of weakness allowed faults that are 3–25 km long to link and grow to form major rift faults �25–325 km long at a very early stage of continental rifting andalso explains the apparent paradox between the faults length(25–325 km) versus throw (17–334 m) for this young rift;and (6) coupling of DEM with aeromagnetic data analysis isa powerful tool for studying rift kinematic processes andcan significantly augment field studies, especially in areaswith limited basement exposures.
[34] Acknowledgments. Partial funding for this project was providedby the National Science Foundation (NSF-OISE-0217831 and NSF-OISE-0644836) and the American Chemical Society, Petroleum Research Fund(ACS PRF 38595-AC8). The Geological Survey of Botswana providedmagnetic data. Dianwei Ren and Marianne Medina assisted with the remotesensing data processing. Damien Delvaux, Hendratta Ali, Caroline Davis,and Moidaki Moikwathai reviewed an earlier version of the manuscript.Reviews comments of Nancy Dawers and an anonymous reviewer criticallyimproved this paper. This paper is Missouri University of Science andTechnology Geology and Geophysics contribution 8.
ReferencesAldiss, D. T., and J. N. Carney (1992), The geology and
regional correlation of the Proterozoic Okwa Inlier,western Botswana, Precambrian Res., 56, 255 –274, doi:10.1016/0301-9268(92)90104-V.
Anders, M. H., and R. W. Schlische (1994), Overlap-ping faults, intrabasin highs and growth of normalfaults, J. Geol., 102, 165–180.
Briggs, I. C. (1974),Machine contouring usingminimumcurvature, Geophysics, 39, 39 – 48, doi:10.1190/1.1440410.
Cartwright, J. A., B. D. Trudgill, and C. S. Mansfield(1995), Fault growth by segment linkage: An ex-planation for scatter in maximum displacement andtrace length data from Canyonlands Graben of SE
Utah, J. Struct. Geol., 17, 1319–1326, doi:10.1016/0191-8141(95)00033-A.
Chapin, C. E., and S. M. Cather (1994), Tectonicsetting of the axial basins of the northern andcentral Rio Grande rift, in Basins of the Rio Grande
Rift: Structure, Stratigraphy, and Tectonic Setting,edited by G. R. Keller and S. M. Cather, Spec. Pap.Geol. Soc. Am., 291, 5 –25.
TC3013 KINABO ET AL.: FAULT GROWTH AND PROPAGATION IN RIFTS
15 of 16
TC3013
Chen, L., and L. Lee (1992), Progressive generation ofcontrol frameworks for image registration, Photo-gramm. Eng. Remote Sens., 58, 1321–1328.
Cowie, P. A. (1998a), Normal fault growth in threedimensions in continental and oceanic crust, Geo-phys. Monogr., 106, 325–345.
Cowie, P. A. (1998b), A healing-reloading feedbackcontrol on the growth rate of seismogenic faults,J. Struct. Geol., 20, 1075 – 1087, doi:10.1016/S0191-8141(98)00034-0.
Cowie, P. A., and C. H. Scholz (1992), Displacement-length scaling relationships for faults: Datasynthesis and discussion, J. Struct. Geol., 14,1149–1156, doi:10.1016/0191-8141(92)90066-6.
Davies, S. J., N. H. Dawers, A. E. McLeod, and J. R.Underhill (2000), The structural and sedimentologi-cal evolution of early synrift succession: TheMiddle Jurassic Tarbert Formation, North Sea,Basin Res., 12, 343 – 365, doi:10.1046/j.1365-2117.2000.00136.x.
Dawers, N. H., and M. H. Anders (1995), Displace-ment-length scaling and fauIt linkage, J. Struct.Geol., 17, 607 – 614, doi:10.1016/0191-8141(94)00091-D.
Dawers, N. H., M. H. Anders, and C. H. Scholz (1993),Growth of normal faults: Displacement-lengthscaling, Geology, 21, 1107 – 1110, doi:10.1130/0091-7613(1993)021<1107:GONFDL>2.3.CO;2.
Ebinger, C. J., M. J. Crow, B. R. Rosendahl, D. A.Livingstone, and J. LeFournier (1984), Structuralevolution of Lake Malawi, Nature, 308, 627–629,doi:10.1038/308627a0.
Ebinger, C., Y. Poudjom Djomani, E. Mbede, A. Foster,and J. B. Dawson (1997), Rifting Archaen litho-sphere: The Eyasi-Natron rifts, East Africa, J. Geol.Soc., 154, 947–960, doi:10.1144/gsjgs.154.6.0947.
Fairhead, J. D., and R. W. Girdler (1969), How far doesthe rift system extend through Africa?, Nature, 221,1018–1020, doi:10.1038/2211018a0.
Fairhead, J. D., and N. B. Henderson (1977), Theseismicity of southern Africa and incipient rifting,Tectonophysics, 41, 19– 26, doi:10.1016/0040-1951(77)90133-0.
Foster, A., C. Ebinger, E. Mbede, and D. Rex (1997),Tectonic development of the northern Tanzaniansector of the East African Rift System, J. Geol.Soc., 154, 689–700, doi:10.1144/gsjgs.154.4.0689.
Gawthorpe, R. L., I. Sharp, J. R. Underhill, and S. Gupta(1997), Linked sequence stratigraphic and structuralevolution of propagating normal faults, Geology, 25,795–798, doi:10.1130/0091-7613(1997)025<0795:LSSASE>2.3.CO;2.
Grauch, V. J. S. (2001), High-resolution aeromagneticdata, a new tool for mapping intrabasinal faults:Example from the Albuquerque basin, NewMexico,Geology, 29, 367 – 370, doi:10.1130/0091-7613(2001)029<0367:HRADAN>2.0.CO;2.
Jackson, C. A., R. B. Gawthorpe, and I. R. Sharp(2002), Growth and linkage of the East Tanka faultzone, Suez Rift: structural style and synrift strati-graphic response, J. Geol. Soc., 159, 175–187.
Kampunzu, A. B., P. Akanyang, R. B. M. Mapeo, B. N.Modie, and M. Wendorff (1998), Geochemistry andtectonic significance of theMesoproterozoicKgwebemetavolcanic rocks in northwest Botswana: Implica-tions for the evolution of theKibaranNamaqua-NatalBelt, Geol. Mag., 135, 669 – 683, doi:10.1017/S001675689800123X.
Kervyn, F., S. Ayub, R. Kajara, E. Kanza, and B. Temu(2006), Evidence of recent faulting in the Rukwarift (West Tanzania) based on radar interferometric
DEM, J. Afr. Earth Sci., 44, 151–169, doi:10.1016/j.jafrearsci.2005.10.008.
Key, R. M., and N. Ayres (2000), The 1998 edition ofthe national geological map of Botswana, J. Afr.Earth Sci., 30, 427–452, doi:10.1016/S0899-5362(00)00030-0.
Kinabo, B. D., E. A. Atekwana, J. P. Hogan, M. P.Modisi, D. D. Wheaton, and A. B. Kampunzu(2007), Early structural evolution of the OkavangoRift Zone, NW Botswana, J. Afr. Earth Sci., 48,125–136, doi:10.1016/j.jafrearsci.2007.02.005.
Le Calvez, J. H., and B. C. Vendeville (2002), Physicalmodeling of normal faults and grabens above relayabove salt, Trans. Gulf Coast Assoc. Geol. Soc., 52,599–606.
Le Gall, B., G. Tshoso, F. Jourdan, G. Feraud,H. Bertrand, J. J. Tiercelin, A. B. Kampunzu,M. P. Modisi, J. Dyment, and M. Maia (2002),40Ar/39 geochronology data from the giant Okavan-go and related mafic dyke swarms, Karoo igneousprovince, northern Botswana, Earth Planet. Sci.
Let t . , 202 , 595 – 606, doi :10.1016/S0012-821X(02)00763-X.
Macheyeki, A. S., D. Delvaux, F. Kervyn, and E. B.Temu, (2005), Morphotectonics of the Kanda FaultSystem in the Ufipa Plateau between Tanganyikaand Rukwa Rift Basins, SW-Tanzania, in ExtendedAbstracts on the International Conference on the
East African Rift System, edited by E. Atekwanaet al., pp. 53–57, Univ. of Dar es Salaam, Mbeya,Tanzania.
McClay, K. R., T. Dooley, P. Whitehouse, and M. Mills(2002), 4-D evolution of rift systems: Insights fromscaled physical models, Am. Assoc. Pet. Geol. Bull.,86(6), 935–959.
Modie, B. N. (2000), Geology and mineralization in theMeso- to Neoproterozoic Ghanzi-Chobe Belt ofnorthwest Botswana, J. Afr. Earth Sci., 30, 467 –474, doi:10.1016/S0899-5362(00)00032-4.
Modisi, M. P., E. A. Atekwana, A. B. Kampunzu, andT. H. Ngwisanyi (2000), Rift kinematics during theincipient stages of continental extension: Evidencefrom the nascent Okavango rift basin, northwestBotswana, Geology, 28, 939 – 942, doi:10.1130/0091-7613(2000)28<939:RKDTIS>2.0.CO;2.
Morley, C. K. (1999), How successful are analoguemodels in addressing the influence of pre-existingfabrics on rift structure?, J. Struct. Geol., 21,1267–1274, doi:10.1016/S0191-8141(99)00075-9.
Morley, C. K. (2002), Evolution of large normal faults:Evidence from seismic reflection data, Am. Assoc.Pet. Geol. Bull., 86(6), 961–978.
Moustafa, A. R. (2002), Controls on the geometry oftransfer zones in Suez rift and northwest Red Sea:Implication for the structural geometry of rift sys-tems, Am. Assoc. Pet. Geol. Bull., 86(6), 979–1002.
Mulugeta, G., and G. Woldai (2001), Modelingheterogeneous stretching during episodic or steadyrifting of the continental lithosphere, Geology, 29,895–898, doi:10.1130/0091-7613(2001)029<0895:MHSDEO>2.0.CO;2.
Nash, D. B. (1986), Morphological dating and model-ing degradation of fault scarps, in Active Tectonics:Impact on Society, pp. 181–194, Natl. AcademyPress, Washington, D. C.
Peacock, D. C. P., and D. J. Sanderson (1991), Displa-cements, segment linkage and relay ramps in faultzones, J. Struct. Geol., 13, 721–733, doi:10.1016/0191-8141(91)90033-F.
Ring, U. (1994), The influence of preexisting structureon the evolution of the Cenozoic Malawi rift (East
Ringrose, S., P. Huntsman-Mapila, A. B. Kampunzu,W. Downey, S. Coetzee, B. Vink, W. Matheson,and C. Vanderpost (2005), Sedimentological andgeochemical evidence for paleo-environmentalchange in the Makgadikgadi subbasin, in relationto the MOZ rift depression, Botswana, Paleogeogr.Palaeoclimatol. Palaeoecol., 217, 265 – 287,doi:10.1016/j.palaeo.2004.11.024.
Schlische, R. W., and M. H. Anders (1996), Strati-graphic effects and tectonic implications of thegrowth of normal faults and extensional basins, inReconstructing the Structural History of Basin and
Range Extension Using Sedimentology and Strati-graphy, edited by K. K. Beratan, Spec. Pap. Geol.Soc. Am., 303, 183–203.
Schluter, T. (2006), Geological Atlas of Africa, With
Notes on Stratigraphy, Tectonics, Economic Geol-ogy, Geohazards, and Geosites of Each Country,272 pp., Springer, New York.
Scholz, C. H., T. A. Koczynski, and D. G. Hutchins(1976), Evidence for incipient rifting in southernAfrica, Geophys. J. R. Astron. Soc., 44, 135–144.
Schwartz, M. O., Y. Y. Kwok, D. W. Davis, andP. Akanyang (1996), Geology, geochronology andregional correlation of the Ghanzi Ridge, Botswana,South Afr. J. Geol., 99, 245–250.
Swain, C. J. (1976), A FOTRAN IV program for inter-polating irregularly spaced data using the differenceequations for minimum curvature, Comput. Geosci.,1, 231 –240, doi:10.1016/0098-3004(76)90071-6.
Trudgill, B. D., and J. A. Cartwright (1994), Relayramp forms and normal fault linkage CanyonlandsNational Park, Utah, Geol. Soc. Am. Bull., 106,1143 – 1157, doi:10.1130/0016-7606(1994)106<1143:RRFANF>2.3.CO;2.
Trudgill, B., and J. R. Underhill (2002), Introduction tothe structure and stratigraphy of rift systems, Am.Assoc. Pet. Geol. Bull., 86(6), 931–933.
Walsh, J. J., W. R. Bailey, C. Childs, A. Nicol, and C. G.Bronson (2003), Formation of segmented normalfaults: A 3-D perspective, J. Struct. Geol., 25,1251 – 1262, doi :10.1016/S0191-8141(02)00161-X.
Withjack, M. O., Q. T. Islam, and P. R. La Pointe(1995), Normal faults and their hanging-wall defor-mation: An experimental study, Am. Assoc. Pet.Geol. Bull., 79(1), 1 –18.
Wormald, R. J., F. D. Eckardt, J. Vearncombe, andS. Vearncombe (2003), Spatial distribution of pansin Botswana: The importance of structural control,S. Afr. J. Geol., 106, 287 – 290, doi:10.2113/106.4.287.
���������M. G. Abdelsalam and J. P. Hogan, Department of
Geological Sciences and Engineering, Missouri Uni-versity of Science and Technology, 129 McNutt Hall,Rolla, MO 65409, USA.
E. A. Atekwana, Oklahoma State University, BoonePickens School of Geology, 105 Noble Research Center,Stillwater, OK 74078, USA. ([email protected])
M. P. Modisi, Department of Geology, University ofBotswana, Private Bag 0022, Gaborone, Botswana.
B. D. Kinabo, Technical Geophysics Group, Deep-water Gulf of Mexico, Chevron North AmericaExploration and Production, 1500 Louisiana St.,Houston, TX 77002, USA.
TC3013 KINABO ET AL.: FAULT GROWTH AND PROPAGATION IN RIFTS