Fault-Tolerant Computing – Fault-Tolerant Computing – It’s Time to Cross the Layer for It’s Time to Cross the Layer for Cost-Effectiveness Cost-Effectiveness Qiang XU Qiang XU CU CU hk hk RE RE liable computing laboratory liable computing laboratory (CURE) (CURE) Department of Computer Science & Department of Computer Science & Engineering Engineering The Chinese University of Hong Kong The Chinese University of Hong Kong
Transcript
Fault-Tolerant Computing – Fault-Tolerant Computing – It’s Time to Cross the Layer for It’s Time to Cross the Layer for
Cost-EffectivenessCost-Effectiveness
Qiang XUQiang XU
CUCUhk hk REREliable computing laboratory (CURE)liable computing laboratory (CURE)Department of Computer Science & EngineeringDepartment of Computer Science & Engineering
The Chinese University of Hong KongThe Chinese University of Hong Kong
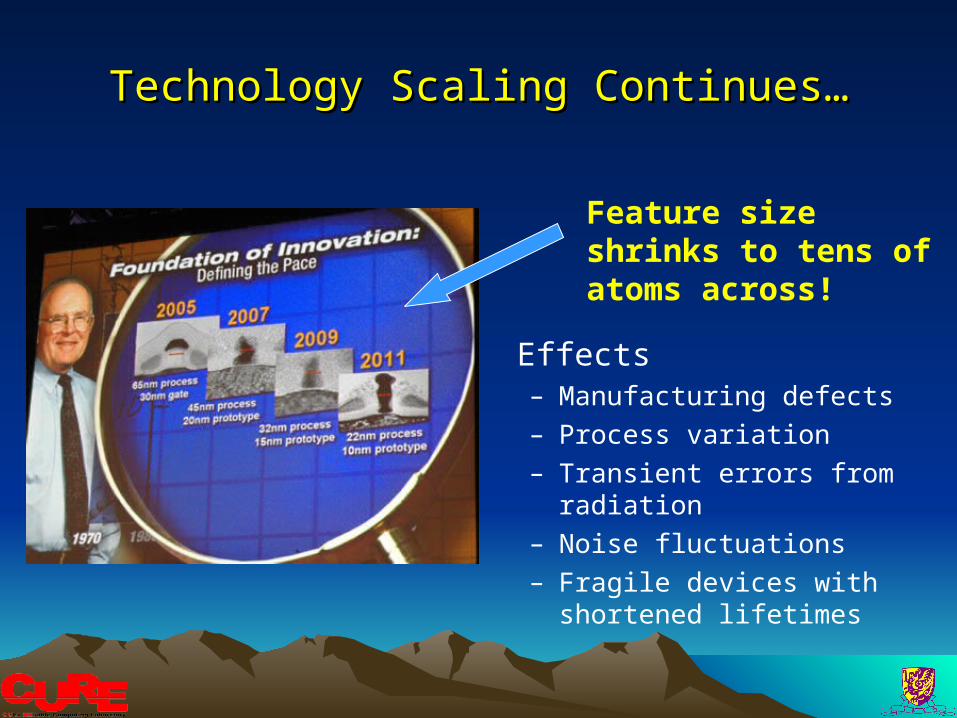
Effects– Manufacturing defects– Process variation– Transient errors from radiation– Noise fluctuations– Fragile devices with shortened
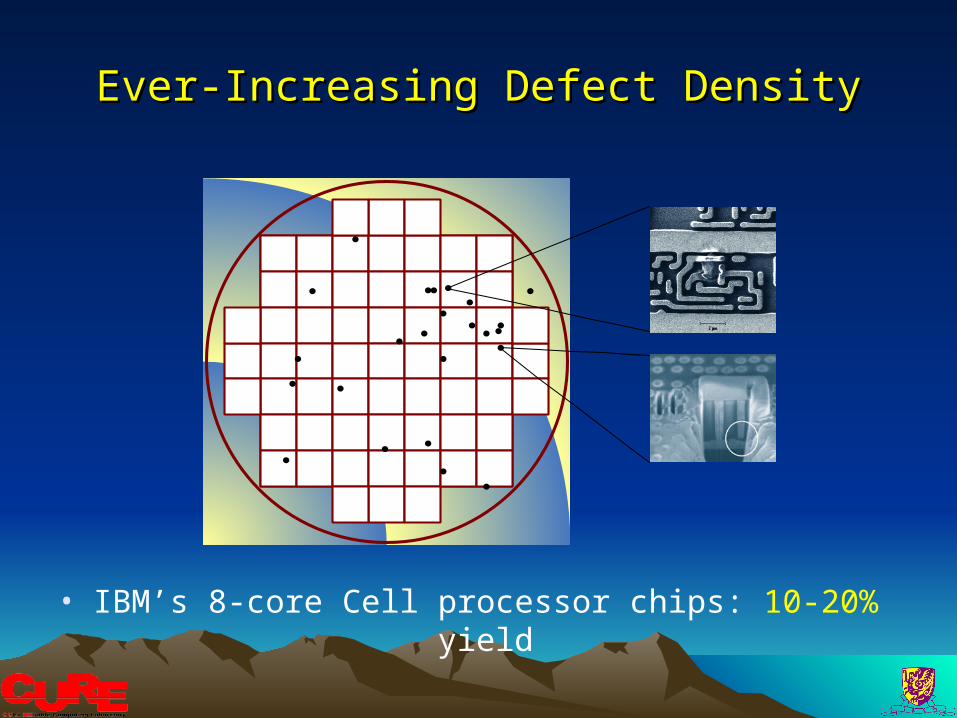
Ever-Increasing Defect DensityEver-Increasing Defect Density
• IBM’s 8-core Cell processor chips: 10-20% yield
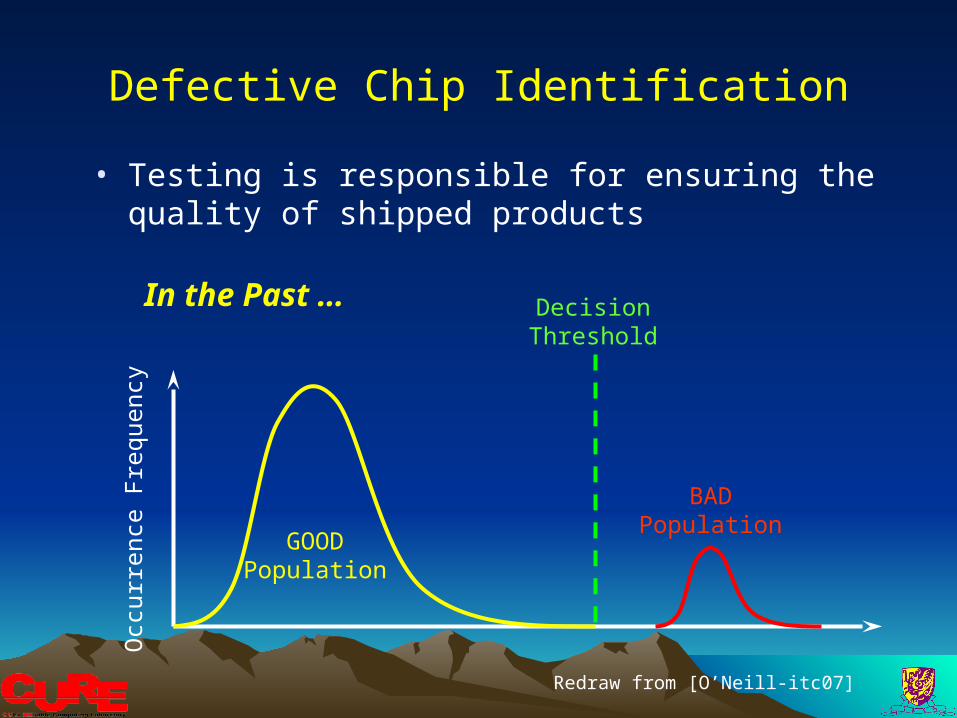
• Testing is responsible for ensuring the quality of shipped products
Defective Chip IdentificationO
ccur
renc
e F
requ
ency
GOODPopulation
BADPopulation
DecisionThreshold
In the Past …
Redraw from [O’Neill-itc07]
Where is the Decision Threshold?Where is the Decision Threshold?O
ccur
renc
e F
requ
ency
GOODPopulation
BADPopulation
Nowadays …
Redraw from [O’Neill-itc07]
DecisionThreshold
TESTESCAPE
FALSEREJECT
Manufacturing Test is NOT Reliable Any More!
Process variation
Func./test mode discrepancy
Current Solution for Yield ImprovementCurrent Solution for Yield Improvement
• Yield-driven redundancy – Cisco’s 192-core Metro network processor contains 4 spares– nVidia’s 128-core GeForce 8800 GPU can be degraded to
96-core version if some cores are faulty
• Simple solution but …• More and more redundant circuitries are
necessary• Require precise offline testing
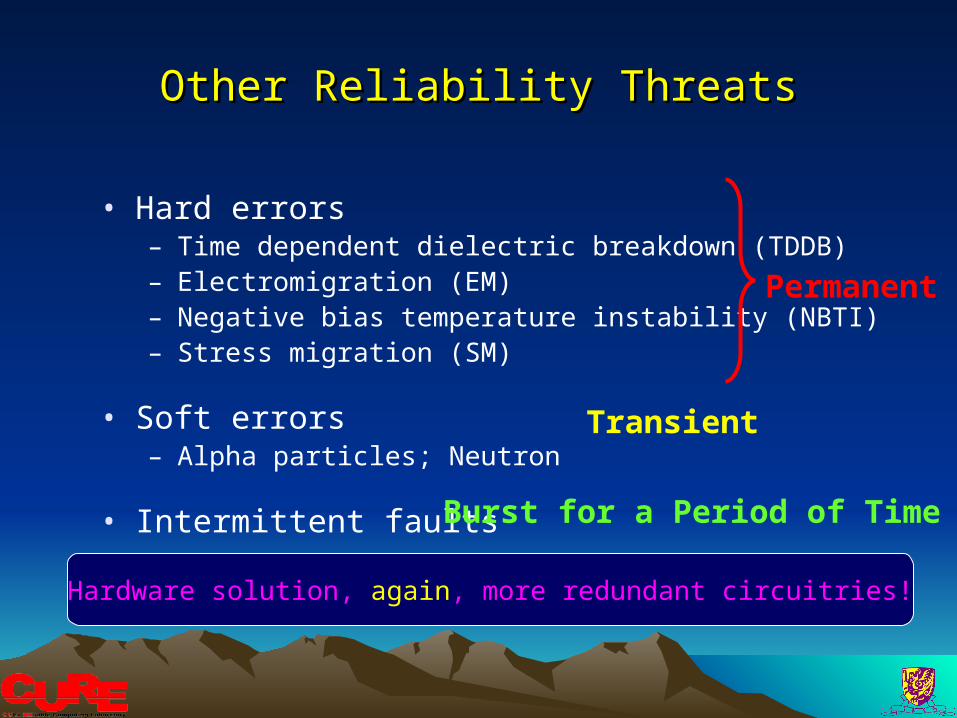
• Hard errors– Time dependent dielectric breakdown (TDDB)– Electromigration (EM)– Negative bias temperature instability (NBTI)– Stress migration (SM)
• Soft errors– Alpha particles; Neutron
• Intermittent faults
Other Reliability ThreatsOther Reliability Threats
Permanent
Transient
Burst for a Period of Time
Hardware solution, again, more redundant circuitries!
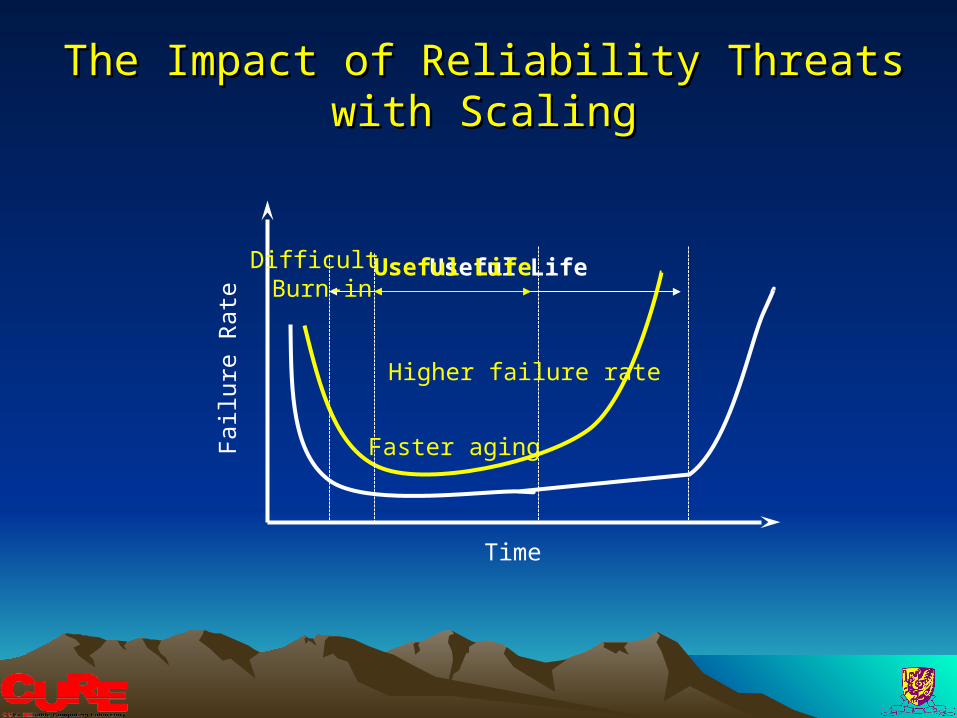
The Impact of Reliability Threats with ScalingThe Impact of Reliability Threats with Scaling
Fai
lure
Rat
e
Time
Useful LifeUseful Life
Faster aging
Difficult Burn-in
Higher failure rate
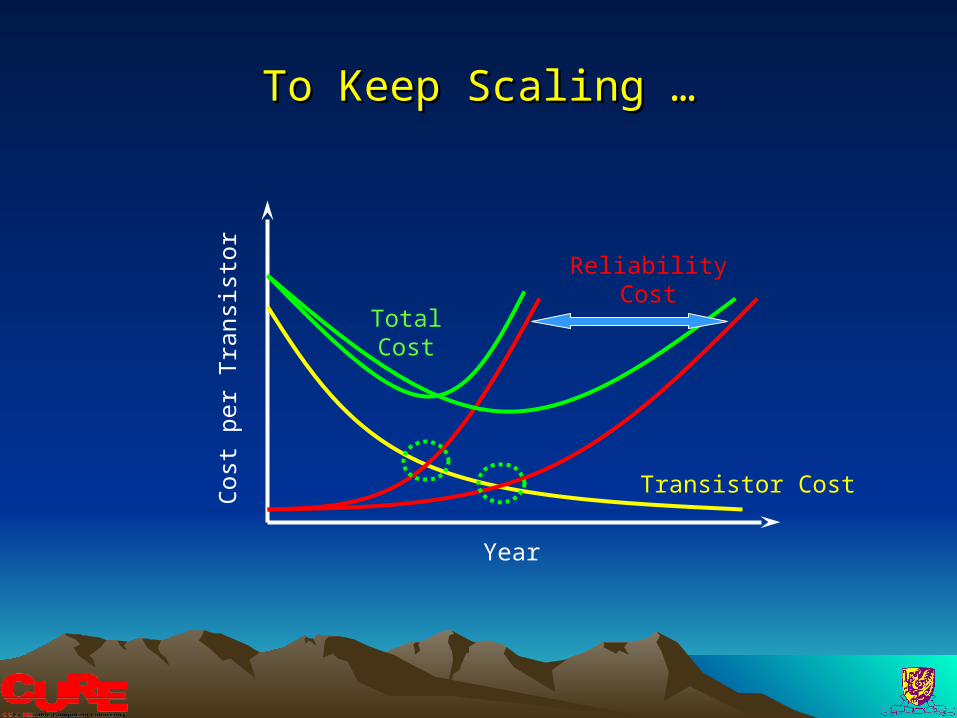
To Keep Scaling …To Keep Scaling …
Cos
t pe
r T
rans
isto
r
Year
Transistor Cost
Reliability Cost
Total Cost
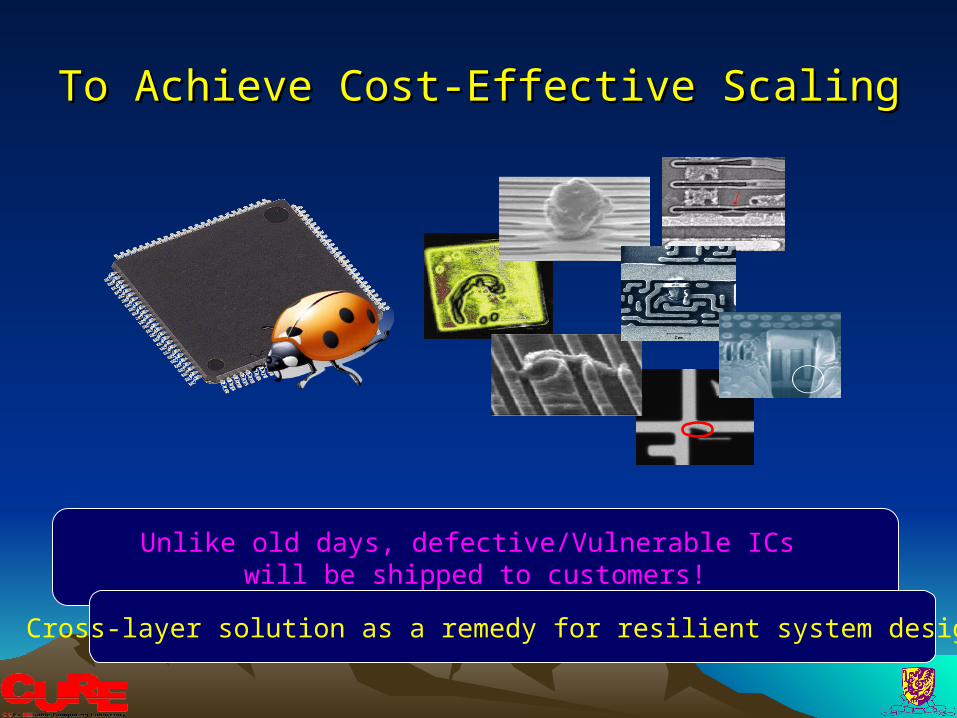
To Achieve Cost-Effective Scaling To Achieve Cost-Effective Scaling
Unlike old days, defective/Vulnerable ICs will be shipped to customers!
Cross-layer solution as a remedy for resilient system design!
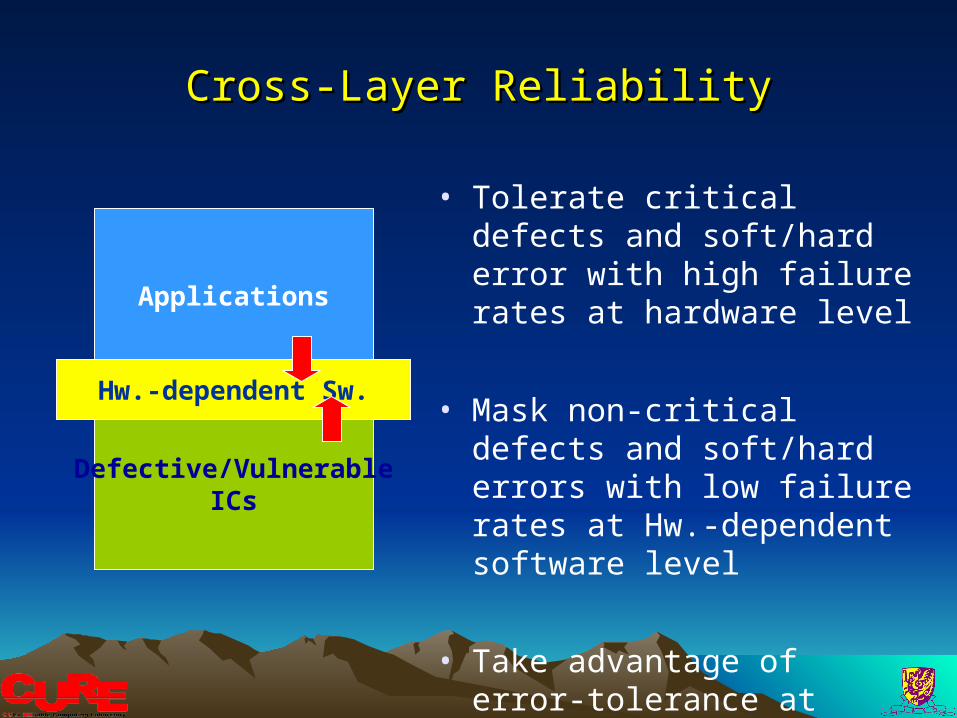
Cross-Layer ReliabilityCross-Layer Reliability
• Tolerate critical defects and soft/hard error with high failure rates at hardware level
• Mask non-critical defects and soft/hard errors with low failure rates at Hw.-dependent software level
• Take advantage of error-tolerance at application level
Applications
Defective/VulnerableICs
Hw.-dependent Sw.
Key Questions in Cross-Layer ReliabilityKey Questions in Cross-Layer Reliability
• @ Circuit-level• Which defects, soft/hard errors are critical enough requiring
hardware redundancy? • Protect at which granularity?• Traditional pass/fail testing methodology no longer stands,
what would be the new metrics for testing?• Ever-increasingly important online test and diagnosis
Differentiate the impact of various reliability threatsand tackle them at different layers!
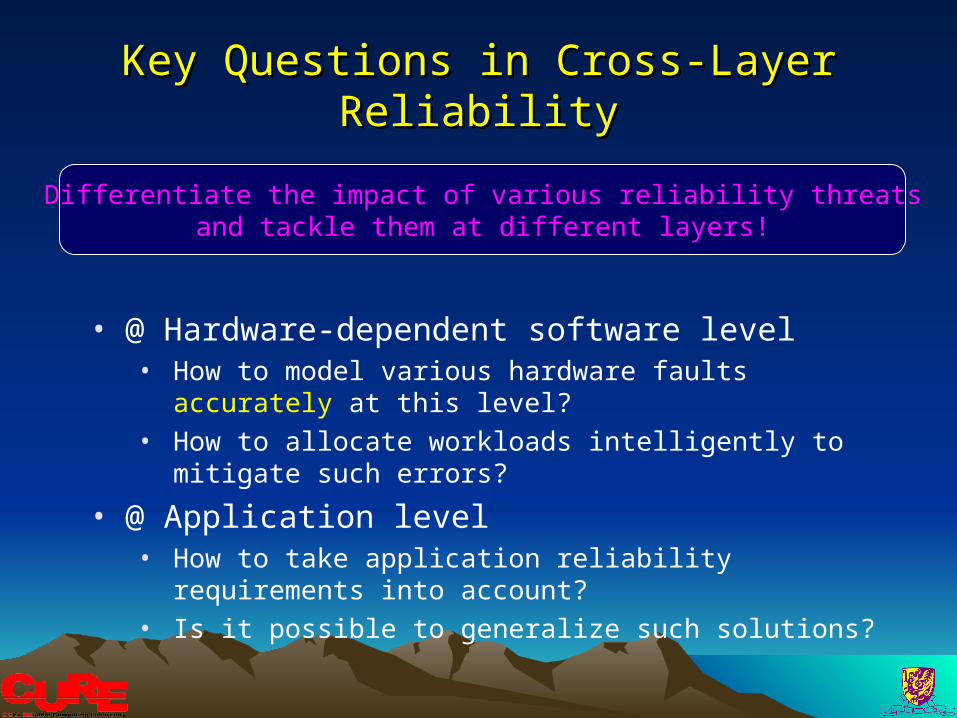
Key Questions in Cross-Layer ReliabilityKey Questions in Cross-Layer Reliability
• @ Hardware-dependent software level• How to model various hardware faults accurately at this
level?• How to allocate workloads intelligently to mitigate such
errors?
• @ Application level• How to take application reliability requirements into
account? • Is it possible to generalize such solutions?
Differentiate the impact of various reliability threatsand tackle them at different layers!
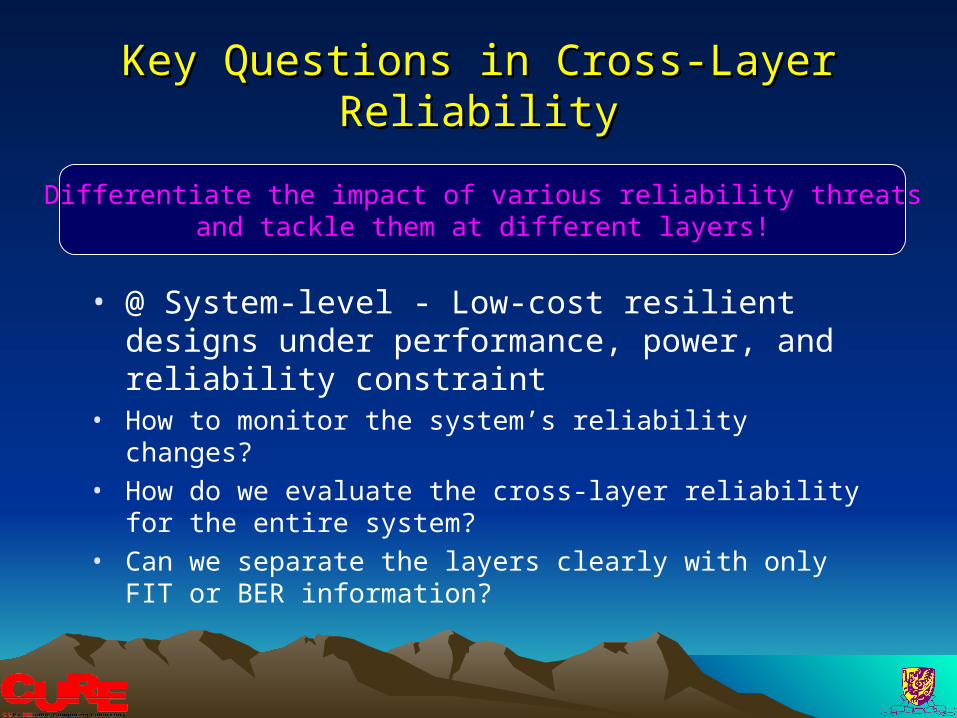
Key Questions in Cross-Layer ReliabilityKey Questions in Cross-Layer Reliability
• @ System-level - Low-cost resilient designs under performance, power, and reliability constraint
• How to monitor the system’s reliability changes?• How do we evaluate the cross-layer reliability for the entire
system?• Can we separate the layers clearly with only FIT or BER
information?
Differentiate the impact of various reliability threatsand tackle them at different layers!
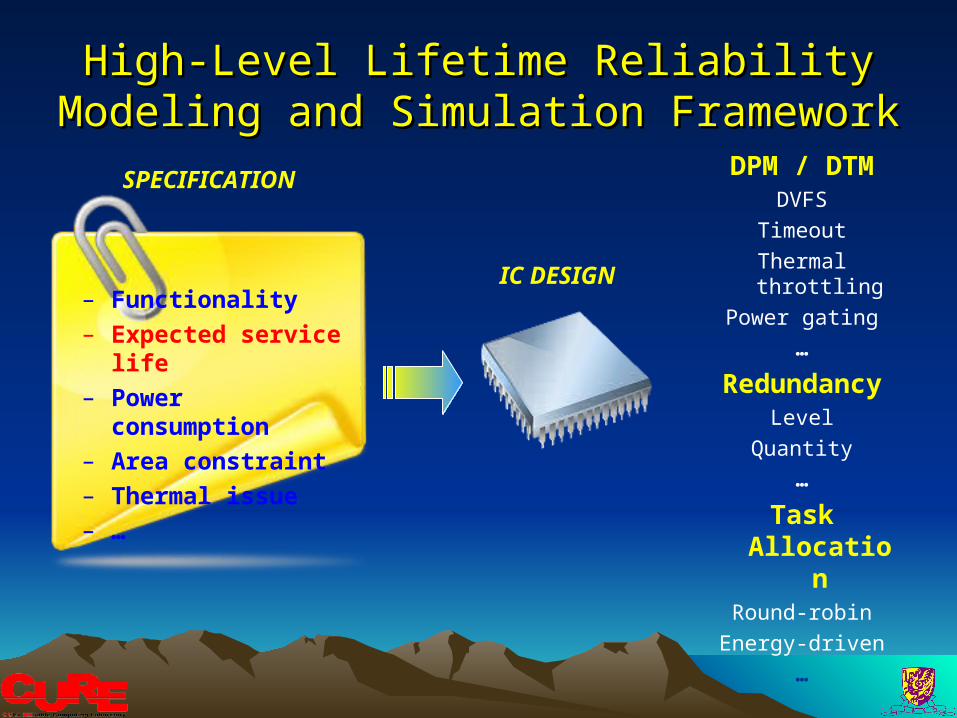
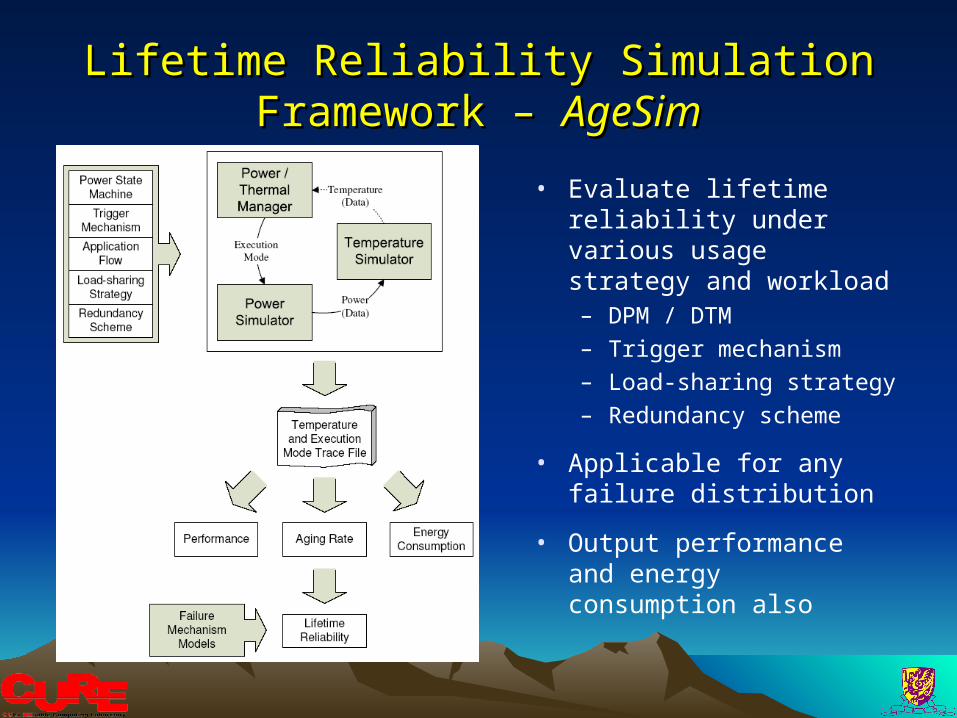
High-Level Lifetime Reliability Modeling and High-Level Lifetime Reliability Modeling and Simulation FrameworkSimulation Framework
– Functionality
– Expected service life
– Power consumption
– Area constraint
– Thermal issue
– …
SPECIFICATION
IC DESIGN
DPM / DTMDVFS
Timeout
Thermal throttling
Power gating
…
RedundancyLevel
Quantity
…
Task AllocationRound-robin
Energy-driven
…
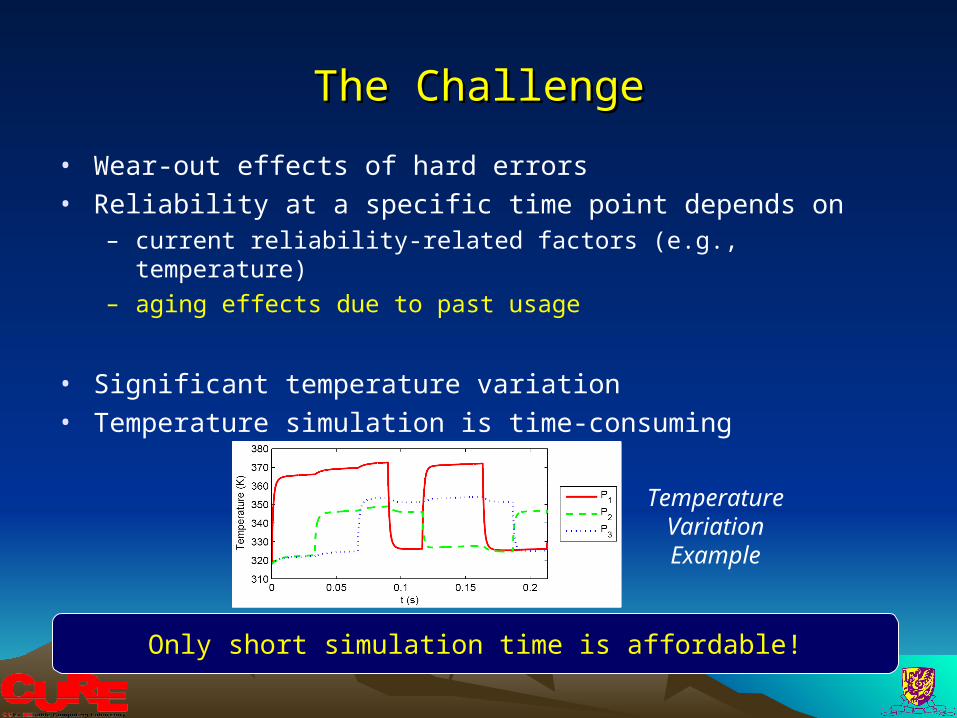
The ChallengeThe Challenge
• Wear-out effects of hard errors• Reliability at a specific time point depends on
– current reliability-related factors (e.g., temperature)
– aging effects due to past usage
• Significant temperature variation• Temperature simulation is time-consuming
TemperatureVariationExample
Only short simulation time is affordable!
The Challenge – Simulation FrameworkThe Challenge – Simulation Framework
• Apparently, it is not possible to trace temperature and aging-related execution parameters in a fine-grained manner throughout the entire lifetime
• What if we conduct coarse-grained tracing and compute lifetime reliability with average operational temperature?– The ignorance of temperature variation results in lack of
accuracy
• How to achieve efficient yet accurate lifetime reliability simulation with limited fine-grained trace information, when failure mechanisms follow arbitrary failure distributions?
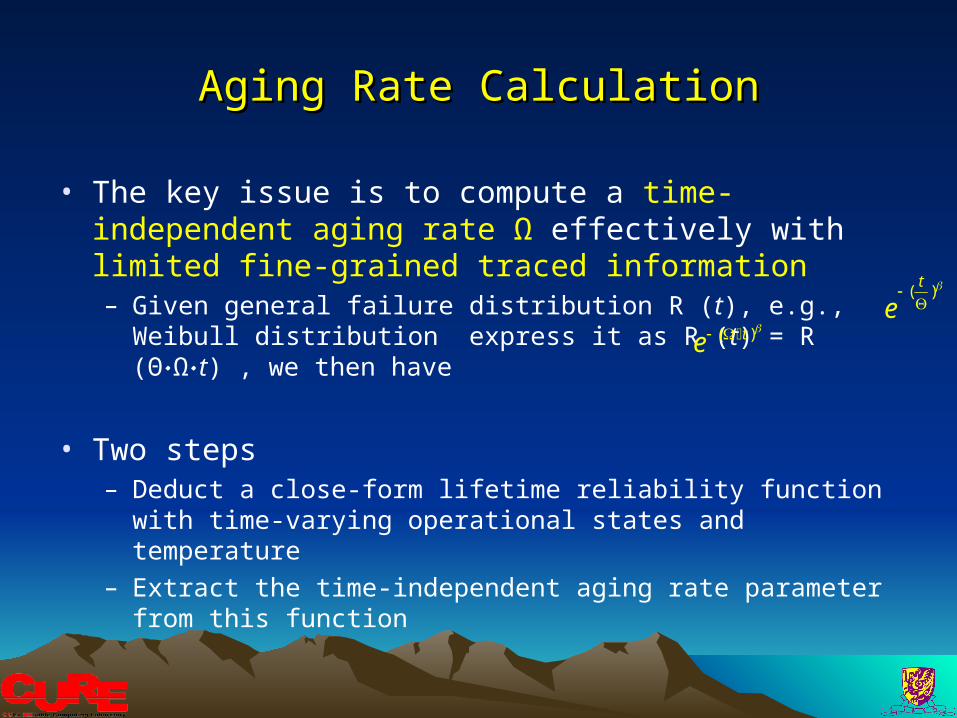
Aging Rate CalculationAging Rate Calculation
• The key issue is to compute a time-independent aging rate Ω effectively with limited fine-grained traced information– Given general failure distribution R (t), e.g., Weibull distribution
express it as R (t) = R (Θ۰Ω۰t) , we then have
• Two steps– Deduct a close-form lifetime reliability function with time-varying
operational states and temperature– Extract the time-independent aging rate parameter from this
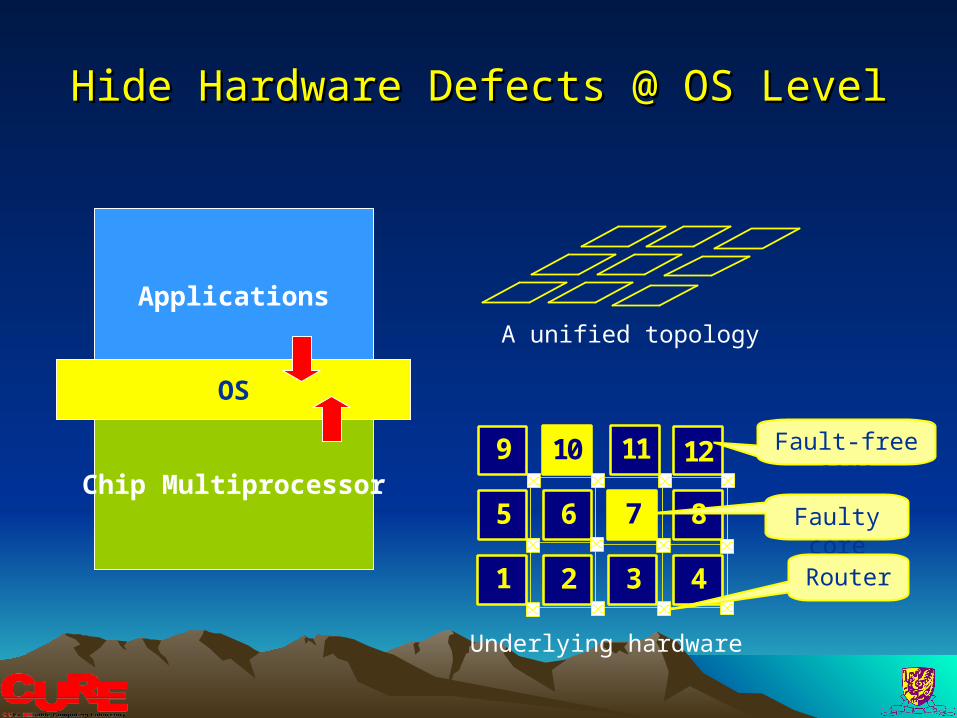
Hide Hardware Defects @ OS LevelHide Hardware Defects @ OS Level
Applications
Chip Multiprocessor
OS
7
1
9
5 6 8
2 3 4
1210 11 Fault-free core
Faulty core
Router
A unified topology
Underlying hardware
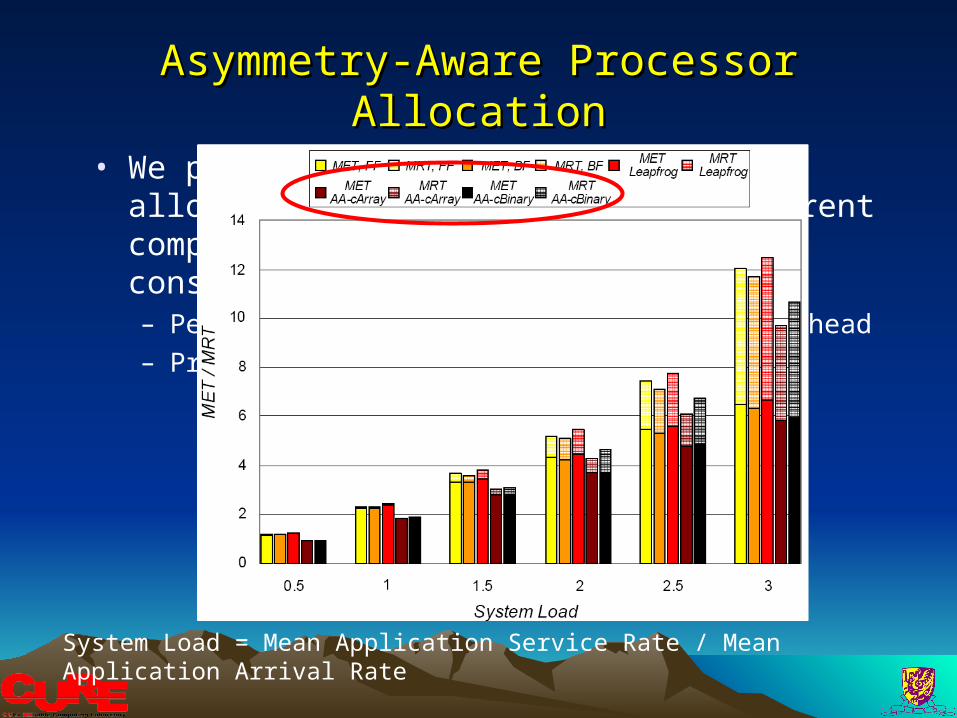
• We propose two contiguous processor allocation methodologies with different computing power representations considering – Performance including communication overhead– Processor allocation time