204
REGISTRATION DOCUMENT 2007

REGISTRATIONDOCUMENT
2007

Design and creation:
BUSINESS REVIEW AND RESULTS OF OPERATIONS
1.1 Business review 6
1.2 Results of operations 12
1.3 Financial structure and debt 14
1.4 Outlook 14
1.5 Risk management 15
RESEARCH & DEVELOPMENT
2.1 Automaker Expectations 21
2.2 Innovation 22
2.3 Product Planning 23
2.4 Engineering Productivity 24
2.5 Premium Attitude 25
HUMAN RESOURCES
3.1 Safety in the workplace 28
3.2 Skills development 32
3.3 Strengthening economic
and social dialogue 36
3.4 Employee incentive plans 38
ENVIRONMENT
4.1 Faurecia’s products
and the environment 51
4.2 Faurecia’s manufacturing sites
and the environment 54
QUALITY
5.1 Breakthrough Quality Plan 60
5.2 Customer Awards 61
5.3 Outlook for 2008 61
CORPORATE GOVERNANCE
6.1 Board of Directors 64
6.2 Executive Committee 68
6.3 Auditing of Accounts 70
6.4 Faurecia and its Shareholders 71
FAURECIA – CONSOLIDATED FINANCIAL STATEMENTS
7.1 Consolidated income statements 77
7.2 Consolidated balance sheets 78
7.3 Consolidated cash fl ow statements 80
7.4 Statement of changes in
consolidated shareholders’ equity 81
7.5 Notes to the consolidated fi nancial
statements 82
7.6 Consolidated companies
as of December 31, 2007 132
7.7 Statutory Auditors’ report on the
consolidated fi nancial statements 136
LEGAL AND FINANCIAL INFORMATION
8.1 Faurecia S.A. 138
8.2 Internal control 162
8.3 Additional information
on Faurecia S.A. 169
COMBINED SHAREHOLDERS’ GENERAL MEETING OF MAY 27, 2008
9.1 Statutory Auditors’ reports 190
9.2 Agenda 192
9.3 Draft resolutions 192
CROSS-REFERENCE TABLE 197
CONTENTS
1
2
3
4
5
6
7
8
9
Key fi gures 2
Board of Directors, Executive Committee
and Auditors 3
Statement by the person responsible
for the registration document 4
The French version of this registration document
(document de référence) was fi led with the Autorité des
marchés fi nanciers (AMF) on April 28, 2008 pursuant to
Article 212-13 of the AMF’s General Regulations.
It may only be used in connection with a fi nancial
transaction if it is accompanied by a memorandum
approved by the AMF.
2007 REGISTRATION DOCUMENT
Technical perfection, automotive passion
2 Faurecia > 2007 Registration document
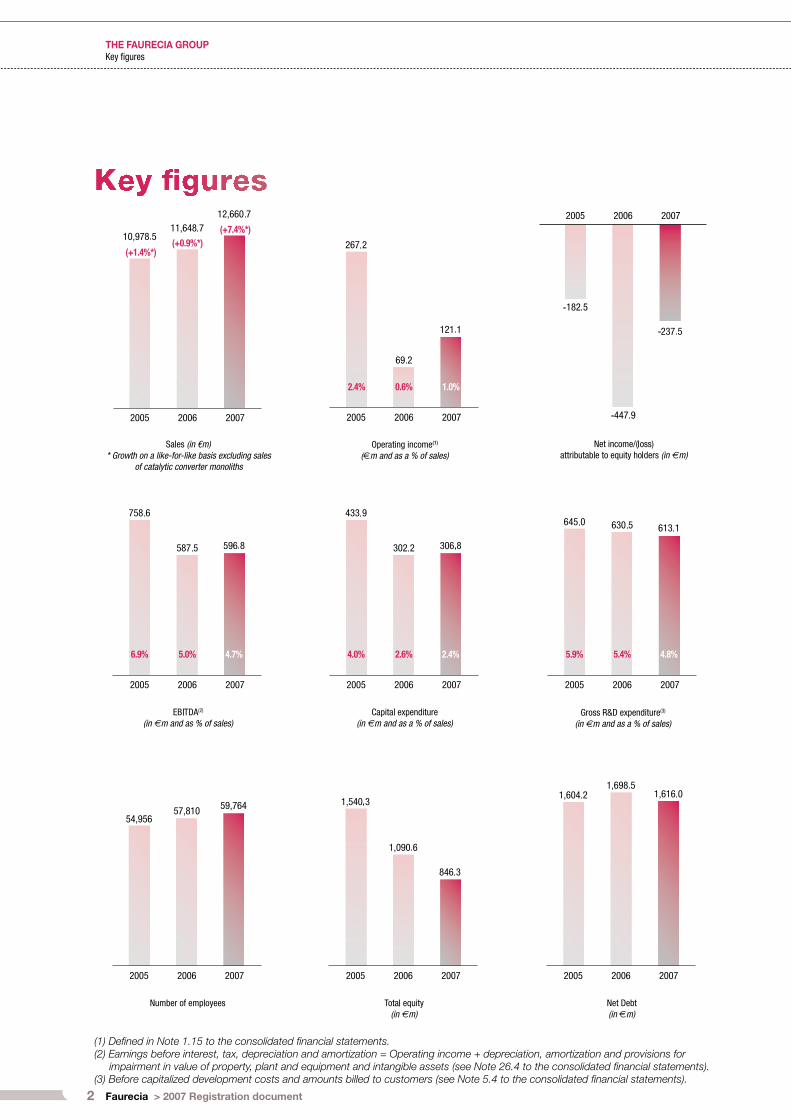
THE FAURECIA GROUP Key fi gures
(1) Defined in Note 1.15 to the consolidated financial statements.(2) Earnings before interest, tax, depreciation and amortization = Operating income + depreciation, amortization and provisions for
impairment in value of property, plant and equipment and intangible assets (see Note 26.4 to the consolidated financial statements).(3) Before capitalized development costs and amounts billed to customers (see Note 5.4 to the consolidated financial statements).
Faurecia > 2007 Registration document 3
THE FAURECIA GROUP Board of Directors, Executive Committee and Auditors
Board of Directors as of April 10, 2008
Yann Delabrière
Chairman and Chief Executive Offi cer
Directors:
Jean-Pierre Clamadieu
Frank Esser
Jean-Louis Gérondeau
Jean-Claude Hanus
Gérard Hauser
Isabel Marey-Semper
Ross Mc Innes
Thierry Peugeot
Robert Peugeot
Christian Streiff
Auditors
Members of the Compagnie
Régionale de Versailles
Ernst & Young Audit
Represented by Laurent Miannay
Tour Ernst & Young
11, allée de l’Arche
92037 Paris La Défense Cedex
France
PricewaterhouseCoopers Audit
Represented by Dominique Ménard
63, rue de Villiers
92220 Neuilly-sur-Seine
France
Executive Committee as of April 10, 2008
Yann Delabrière
Chairman and Chief Executive Offi cer
Arnaud de David-Beauregard
Executive Vice-President, Group Development
Jean-Marc Hannequin
Executive Vice-President, Exhaust Systems Product Group
Frank Imbert
Chief Financial Offi cer
Patrick Koller
Executive Vice-President, Automotive Seating Product Group
Thierry Lemâne
Executive Vice-President, Group Communications
Jacques Le Morvan
Executive Vice-President, Group Purchasing
Jacques Mauge
Executive Vice-President, Group Customer Development
Bruno Montmerle
Executive Vice-President, Group Strategy
Christophe Schmitt
Executive Vice-President, Interior Systems Product Group
Jean-Pierre Sounillac
Executive Vice-President, Group Human Resources
Guy Talbourdet
Executive Vice-President, Modules & Systems Product Group

4 Faurecia > 2007 Registration document
Person responsible for the registration document
Yann DELABRIÈRE
Chairman and Chief Executive Offi cer
I hereby declare that, having taken all reasonable care to ensure
that such is the case, the information contained in the registration
document is, to the best of my knowledge, in accordance with the
facts and contains no omission likely to affect its import.
I further declare that, to the best of my knowledge, (i) the
fi nancial statements have been prepared in accordance with the
applicable accounting standards and give a true and fair view of
the assets and liabilities, fi nancial position and results of Faurecia
and the consolidated companies making up the Group, and (ii)
the management report on page 200 represents a fair view of
the business, results and fi nancial position of Faurecia and the
consolidated companies, as well as a description of the main risks
and uncertainties they face.
I obtained a statement from the Statutory Auditors at the end of
their engagement affi rming that they have read the whole of the
registration document and examined the information about the
fi nancial position and the historical accounts contained therein.
Yann DELABRIÈRE
Nanterre, April 28, 2008
INFORMATION OFFICER
Franck IMBERT
Chief Financial Offi cer
Faurecia
2, rue Hennape
92735 Nanterre Cedex – France
Tel.: +33 (1) 72 36 70 00
Fax: +33 (1) 72 36 70 07
THE FAURECIA GROUP Statement by the person responsible for the registration document

CONTENTS
BUSINESS REVIEW AND RESULTS OF OPERATIONS
1
5Faurecia > 2007 Registration document
1.1 Business review 6
1.1.1 The Faurecia Group 6
1.1.2 Interior Modules 7
1.1.3 Other Modules 10
1.2 Results of operations 12
1.2.1 Operating income 12
1.2.2 Other income statement items 13
1.3 Financial structure and debt 14
1.4 Outlook 14
1.5 Risk management 15
1.5.1 Financial risks 15
1.5.2 Commercial, legal and technical risks 16
In accordance with Article 28 of European Commission Regulation 809/2004, the following information is incorporated by reference in this
registration document:
the consolidated fi nancial statements, the parent company fi nancial statements, the corresponding Statutory Auditors’ reports, the
comments on the consolidated fi nancial statements and signifi cant events of the year by business, set out respectively on pages 24 to 30,
52 to 90, and 95 to 112 of the 2006 registration document fi led with the AMF on April 24, 2007 under no. D-07-037;
the consolidated fi nancial statements, the parent company fi nancial statements, the corresponding Statutory Auditors’ reports, the
comments on the consolidated fi nancial statements and signifi cant events of the year by business, set out respectively on pages 30 to 79,
87 to 103, 80, 104 and 6 to 11 of the 2005 registration document fi led with the AMF on April 24, 2006 under no. D-06-0312.
The sections of the 2006 and 2005 registration documents not included above are either not applicable for investors or are covered by another
section in the registration document.
•
•
6 Faurecia > 2007 Registration document
BUSINESS REVIEW AND RESULTS OF OPERATIONS1 Business review
1.1.1 THE FAURECIA GROUP
The Faurecia Group posted consolidated sales of €12,660.7 million
in 2007, up 8.7%. Excluding catalytic converter monoliths, sales
came to €11,075.3 million, representing 7.4% growth on a like-for-
like basis (at constant exchange rates and based on a constant
Group structure). Currency effects had a negative 1.2% impact and
changes in Group structure had a positive effect of 1.7%. Changes
in Group structure during the year included (i) the integration of the
Front End operations acquired from Cadence Innovation France;
and (ii) the inclusion within the Vehicle Interiors business of the
Romania-based company Euro Plastic Systems (Euro APS), which
supplies the Dacia factory in Pitesti, Romania.
The year 2007 was marked by buoyant growth in Faurecia’s
businesses, with the launch of numerous new programs, continued
geographic diversifi cation and strong growth outside Europe.
Non-European sales accounted for over 24% of the Group total
compared with 20% in 2006.
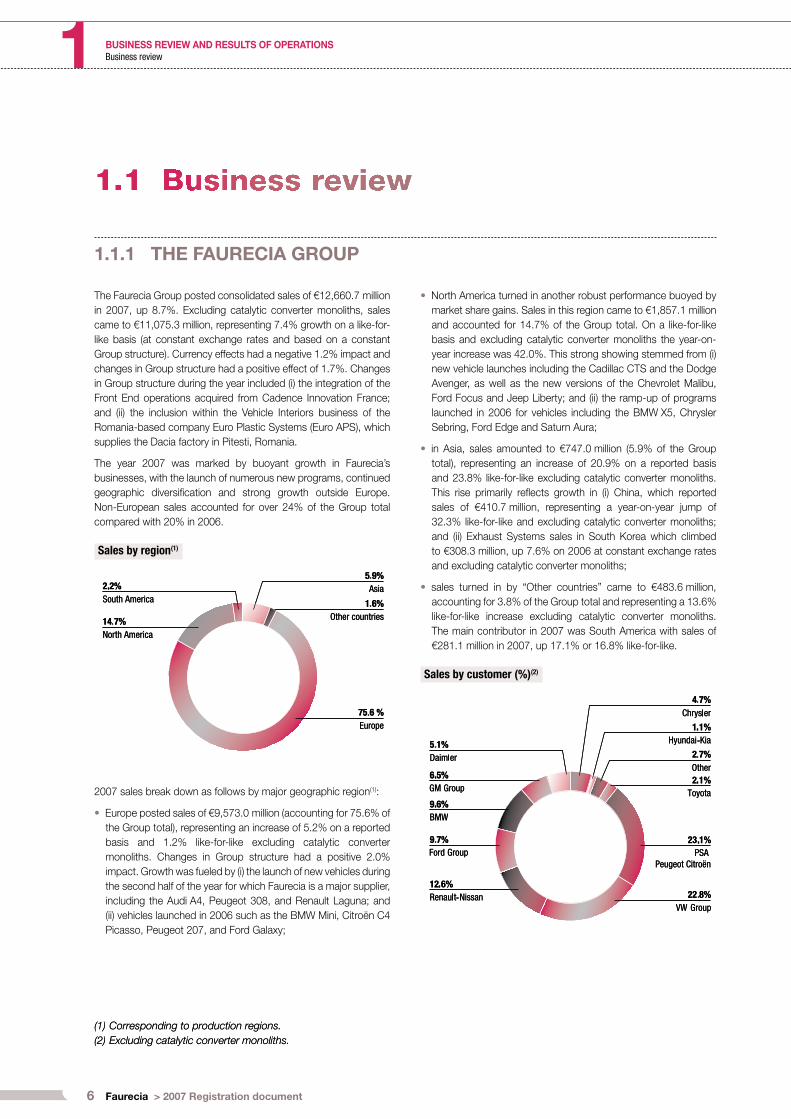
Sales by region(1)
2007 sales break down as follows by major geographic region(1):
Europe posted sales of €9,573.0 million (accounting for 75.6% of
the Group total), representing an increase of 5.2% on a reported
basis and 1.2% like-for-like excluding catalytic converter
monoliths. Changes in Group structure had a positive 2.0%
impact. Growth was fueled by (i) the launch of new vehicles during
the second half of the year for which Faurecia is a major supplier,
including the Audi A4, Peugeot 308, and Renault Laguna; and
(ii) vehicles launched in 2006 such as the BMW Mini, Citroën C4
Picasso, Peugeot 207, and Ford Galaxy;
•
North America turned in another robust performance buoyed by
market share gains. Sales in this region came to €1,857.1 million
and accounted for 14.7% of the Group total. On a like-for-like
basis and excluding catalytic converter monoliths the year-on-
year increase was 42.0%. This strong showing stemmed from (i)
new vehicle launches including the Cadillac CTS and the Dodge
Avenger, as well as the new versions of the Chevrolet Malibu,
Ford Focus and Jeep Liberty; and (ii) the ramp-up of programs
launched in 2006 for vehicles including the BMW X5, Chrysler
Sebring, Ford Edge and Saturn Aura;
in Asia, sales amounted to €747.0 million (5.9% of the Group
total), representing an increase of 20.9% on a reported basis
and 23.8% like-for-like excluding catalytic converter monoliths.
This rise primarily refl ects growth in (i) China, which reported
sales of €410.7 million, representing a year-on-year jump of
32.3% like-for-like and excluding catalytic converter monoliths;
and (ii) Exhaust Systems sales in South Korea which climbed
to €308.3 million, up 7.6% on 2006 at constant exchange rates
and excluding catalytic converter monoliths;
sales turned in by “Other countries” came to €483.6 million,
accounting for 3.8% of the Group total and representing a 13.6%
like-for-like increase excluding catalytic converter monoliths.
The main contributor in 2007 was South America with sales of
€281.1 million in 2007, up 17.1% or 16.8% like-for-like.
Sales by customer (%)(2)
•
•
•
(1) Corresponding to production regions.(1) Corresponding to production regions.
(2) Excluding catalytic converter monoliths.(2) Excluding catalytic converter monoliths.
Faurecia > 2007 Registration document 7
BUSINESS REVIEW AND RESULTS OF OPERATIONS 1Business review
In 2007 the Group continued to diversify its customer portfolio,
which includes all of the world’s major automakers. Business with
PSA Peugeot Citroën c limbed 3.2%, led by sales of the Peugeot 207
and 308 as well as the Citroën C4 Picasso. Sales to Renault-Nissan
swung up by a sharp 8.9% in the second half of the year, thanks to
higher volumes for the Logan and the launch of the Laguna, bringing
the full-year rise to 0.8%. The Group’s sales to BMW surged 56.5%,
powered by the Mini in Europe and the X5 in North America. At the
same time, sales continued to climb steeply with Chrysler (for the
Sebring and Avenger), soaring 162.7%, and remained buoyant with
Hyundai, up 22.3%. Sales to General Motors dipped 1.0% as 2007
was a transitional year before the launch of the new versions of the
Cadillac CTS and Chevrolet Malibu.
1.1.2 INTERIOR MODULES
1.1.2.1 Automotive Seating
Sales Workforce Sites Countries R&D centers
€5.2 billion 29,200 70 17 7
Automotive Seating reported 2007 sales of €5,175.4 million – up
7.5% on 2006, or 8.2% at constant exchange rates – in a year
that saw the successful worldwide launch of twenty-four new
programs.
In Europe, this segment’s sales rose 2.6% (1.9% excluding the
currency impact) to €4,216.9 million. This increase refl ects market
share gains with BMW and Audi a s well as stable volumes for
French automakers following a signifi cant drop in 2006.
Business was brisk in North America, where sales surged 56.1% at
constant exchange rates, spurred by strong volumes with General
Motors, Chrysler and BMW. Growth was also robust in China and
South America, in line with general automotive market trends.
Based on constant exchange rates sales were up 26.4% in Asia
and 15.2% in South America.
In Europe the start-up of volume production of new vehicles,
representing the renewal of 35% of sales, demonstrated the ability
of Faurecia’s Automotive Seating division to manage complex
programs. The Group supplied all of the complete seat units for the
Peugeot 308, Renault Laguna and Audi A4/A5 which occupy major
positions in the European saloon car market. In tandem, thanks to
the success of the new GM Malibu, Cadillac CTS and BMW X5,
Faurecia was able to strengthen its foothold in the US p remium
market, which is growing strongly and is now as highly demanding
as the European and Japanese markets. During the year, Faurecia
managed a total of more than seventy complete seat and seating
structure programs and delivered over one hundred and fi fty million
seating components and sub-assemblies, including mechanisms,
front and rear structures, covers, foam components and headrests,
integrated into over fi ve million complete seat units.
The Group signifi cantly improved its competitive edge in 2007 by
leveraging its manufacturing base of seventy facilities (including
thirty-two just-in-time sites) spanning seventeen countries. European
facilities were streamlined and results picked up considerably in
North America during the fourth quarter of the year. At the same
time, Faurecia invested heavily in components plants located in
countries with low labor costs, such as the foam facility in Jelcz and
the components and metal frame plants in Walbrzych and Grojec in
Poland. A new components plant also came on stream in 2007 in
Pisek in the Czech Republic. The impacts of these investments will
start to feed through as from 2008 – a year that will see the opening
of two new sites in Morocco and Mexico, respectively dedicated to
seating trim covers and metal frames.
The Automotive Seating division also further boosted its creative
capacity in 2007, with four joint-development contracts and
fi fteen major innovation programs. Product development and
innovation in this business is structured around the two key
areas of standardization and premium solutions. With a view to
meeting the high demands of automakers for cost reductions the
division has stepped up its focus on standardizing all concealed
seating components. This standardization now covers metal sub-
assemblies, trim, foam elements, covers and headrests. In addition,
a new generation of metal frames has been approved that meets
higher safety standards while based on a design that is both lighter
weight and geared to a highly standardized production process.
This concentration on standardization will enable the Group to more
effectively control its capital expenditure and maintain quality levels.
Meanwhile, product innovation has been directed towards premium
solutions with the aim of enhancing the comfort and perceived
quality of visible components.
By combining these two development areas of standardization
and premium solutions the Automotive Seating division expects to
achieve profi table growth over the long term.
8 Faurecia > 2007 Registration document
BUSINESS REVIEW AND RESULTS OF OPERATIONS1 Business review
Faurecia’s Automotive Seating business ranked close to the top
of the industry charts for patent applications in 2007, with 34 new
innovations and a total portfolio of 2,388 patents. Numerous
new designs for safety, comfort, quality and reduced energy
consumption were presented to automakers through Tech Days,
special Innovation Days, and specifi c events organized with a view
to acquiring new programs. During the year the Product Group hired
a team of specialists based in Holland (Michigan, USA) to research
breakthrough solutions, notably concerning the use of new materials
in seat frames. Overall, the Automotive Seating Product Group
devoted 5.7% of its sales fi gure to research and development.
The year 2007 was rich in new programs with operating margins in
line with the Faurecia Group’s objectives. For example, the Product
Group won contracts for supplying complete seat units for several
major platforms in the European and North American markets as
well as for a number of new vehicles in China and Brazil. In addition,
having previously been selected by Volkswagen, General Motors,
Chery and Chrysler to supply their new generations of metal lateral
frames, in 2007 Faurecia was once again recognized as a leading
world player in this fi eld when the Group was chosen as the global
supplier-developer for the latest standard metal frames for mid-
range Nissan vehicles.
As a result of all these achievements, Faurecia’s Automotive Seating
Product Group is well poised to keep to its profi table growth path,
and expects to deliver another set of sound results in 2008.
1.1.2.2 Vehicle Interiors
Sales Workforce Sites Countries R&D centers
€3.5 billion 19,900 70 19 6
Vehicle Interiors sales edged up 2.5% to €3,545.8 million in 2007.
Like-for-like the increase was 1.6%. Currency effects had a negative
1.2% impact and changes in Group structure had a positive effect
of 2.1%.
In Europe like-for-like Vehicle Interiors sales contracted 5.3%
whereas North America and Asia reported growth of 45.0% and
30.6% respectively, at constant exchange rates.
COCKPITS, INSTRUMENT PANELS, AND DOOR
MODULES AND PANELS
This Product Group reported a 3.3% year-on-year increase in sales,
or 2.3% like-for-like. European sales retreated 5.4% on a like-for-
like basis but surged 45.0% in North America and 30.6% in Asia.
Overall, 2007 was an eventful year, with the launch of 31 production
programs including nine in the United States.
Business levels were higher with French automakers in 2007,
boosted by the launch of the Renault Laguna and Logan programs
and the Peugeot 308, as well as the ramp-up of the Peugeot 207 and
Citroën C4 Picasso for the PSA Peugeot Citroën Group. Business
remained stable with automakers in other European countries,
however. At the same time, manufacturing reorganization measures
continued to be rolled out in France, Spain and Germany.
North America reported sustained sales growth with all of the
Group’s customers, mainly stemming from higher volumes for the
new BMW X5 and the Chrysler Sebring. The year was also rich in
new vehicle launches, including the Chevrolet Malibu, Cadillac CTS,
Jeep Liberty and Dodge Avenger. Two new just-in-time facilities
were set up in Toledo (Ohio) and Lansing (Michigan) in order to
meet demand resulting from steady rises in volumes for General
Motors and Chrysler.
China posted a 35.8% leap in sales at constant exchange rates,
led by sales of the Audi A6 and start-up of deliveries for the Ford
Galaxy and Mondeo.
Another salient feature of the year for the Product Group was strong
demand from automakers for supplier support in international
development programs, which was notably the case for the Renault
Logan in Romania. In addition, acquisitions carried out during 2007
confi rmed the ongoing expansion of the Group’s business with
General Motors, PSA Peugeot Citroën and Ford.
Against the backdrop of tight market conditions, marked by rising
prices for plastics, which are indexed to the price of oil, Faurecia
was able to retain its number one position both in Europe and
worldwide(*) within the instrument panels and door panels market.
(*) Source: Faurecia.(*) Source: Faurecia.
Faurecia > 2007 Registration document 9
BUSINESS REVIEW AND RESULTS OF OPERATIONS 1Business review
Five new manufacturing facilities opened during the year – of
which four in North America – and three sites were closed in
Western Europe. The Product Group continued to roll out the
Faurecia Excellence System (FES), leading to a major shift in
its manufacturing performance. This system has been lauded
by several of the Group’s customers, including the Ford Motor
Company which presented Faurecia with two World Excellence
Awards for its door modules in 2007 – a gold award for the just-in-
time facility in Cologne (Germany) and a gold award for the Valencia
facility in Spain.
The highlight of the division’s year in terms of innovation was the
presentation of the Group’s “Faurecia Premium Attitude” concept
car at the Los Angeles Auto Show held in mid-November 2007.
Through this full vehicle concept that combines the Group’s six
product lines, Faurecia demonstrated its innovation capabilities that
ally high-end design with manufacturing effi ciency gains achieved
through mass production and standardization. Premium Attitude
is built around two major cutting-edge features which came onto
the market during the year. The fi rst is the RALF concept which
directly integrates an airbag with a fl exible cover into the instrument
panel. The Renault Laguna and Mercedes-Benz S-Class will be
fi tted with these airbags as from early 2008. The second of these
major new launches is the third-generation Highly-Integrated Door
Module (HIM3), which received the Society of Plastics Engineers
Automotive Innovation Award in January and November 2007. This
latest generation of HIM door modules proposes a vanguard use of
plastics with a rail-less window regulator and is already fi tted into
the Dodge Nitro as well as Chrysler’s Jeep Liberty and Cherokee.
ACOUSTIC & SOFT TRIM
This division generated €288.9 million in sales in 2007, on a par
with 2006. Numerous new programs were launched during the
year, including carpeting and acoustic components for the new
Renault Laguna, carpeting, acoustic components and the trunk
compartment for the Nissan Qashqai, as well as parcel shelves for
the new versions of the Ford Mondeo and Toyota Auris.
By setting up a worldwide partnership network the division has
been able to accompany Renault- Nissan in its international vehicle
programs and plans to repeat this process with other automakers.
During the year, its Light Weight Concept acoustic solutions were
further taken up by General Motors and Renault, as well as by a
number of Japanese automakers.
The year 2007 also saw Faurecia’s Acoustic & Soft Trim division
complete the streamlining of its manufacturing operations begun in
2006, by concentrating needle-punched carpet production at the
Mouzon plant in France and grouping its Spanish manufacturing
activities at the Olmedo facility. It also closed its plants at Terrassa
and Fuenlabrada in Spain. The division now has nine manufacturing
sites in Europe that can respond to changes in the output of its major
customers, with a higher proportion of capacity based in Poland
and a focus on low-cost needle-punched carpet production.
Going forward, the division’s market share gains in 2007 will enable
it to boost its sales over the medium term.
Overall, sales posted by the Interior Modules segment came
to €8,721.2 million in 2007, up 5.4% like-for-like, with negative
currency effects of 0.9% exactly offsetting the positive 0.9% of
changes in Group structure.

10 Faurecia > 2007 Registration document
BUSINESS REVIEW AND RESULTS OF OPERATIONS1 Business review
1.1.3 OTHER MODULES
1.1.3.1 Exhaust Systems
Sales (including catalytic converter monoliths) Workforce Sites Countries R&D centers
D&D centers
€3 billion 7,300 35 14 1 6
Strong growth continued in 2007 for Faurecia’s Exhaust Systems
Product Group , with total sales increasing 16.3% to €2,994.4 million
excluding the negative 3.7% currency impact. Without catalytic
converter monoliths the sales fi gure was €1,409.0 million with
growth coming in at 14.0% excluding the negative 3.8% currency
impact. At constant exchange rates and excluding catalytic
converter monoliths, Exhaust Systems sales advanced 14.0%
in Europe, 11.8% in North America and 18.8% in Asia. Sales of
catalytic converter monoliths climbed 18.5% based on constant
exchange rates. Year-on-year comparisons in this Product Group’s
performance are more effective if catalytic converter monoliths
are excluded as their production costs are extremely volatile due
to fl uctuations in the prices of the precious metals they contain.
However, the risk related to these price fl uctuations is borne by the
automakers who have agreed for these metals to be rebilled on a
cost price basis.
The Product Group’s 2007 results show that it has further fi rmed
up its worldwide positioning. Its 24 plants and 11 just-in-time
sites supply components and full exhaust systems to all major
automakers, on four continents. In all, 14 million vehicles were fi tted
with Faurecia’s exhaust system products during the year.
The world exhaust systems market continued to grow in 2007, under
the combined effect of further rises in precious metal prices and the
application of technical solutions to meet the criteria set down by
the Euro 5 standard which will be effective from September 2009.
From that date all new diesel engines sold in Europe will need to be
fi tted with particulate fi lters.
Major launches carried out in 2006 resulted in a signifi cant increase
in market share for Faurecia’s Exhaust Systems Product Group in
2007, particularly in the United States, China and South Korea. The
Product Group kept up its steady pace of launches in 2007.
In Europe, Faurecia supplies the PSA Peugeot Citroën group with full
exhaust systems for the main engine categories of the Peugeot 308
and catalytic converter/particulate fi lter systems for the Citroën C-
Crosser and Peugeot 4007 four-by-fours. It also supplies exhaust
lines for the new Renault Laguna and the full exhaust system for
the Volkswagen Tiguan. Furthermore, in 2007 it won the contract
to supply the exhaust lines for the c ee’d , Kia’s fi rst vehicle to be
produced in Slovakia.
In the United States, Faurecia’s Exhaust Systems Product Group
participated in the launches of the Mercury Sable and Ford’s new
Taurus as well as Chrysler’s Jeep Liberty, delivering full exhaust
systems for each of these models.
In Asia, the Product Group launched numerous welded manifold
solutions, chiefl y for Hyundai, Kia, Ford and Mazda, as well as for
the full exhaust systems for the Citroën C4 in China and catalytic
converters fi tted into the 1.6L and 1.8L engines of the Skoda
Octavia.
Lastly, in the extremely dynamic Mercosur market, Faurecia
participated in the launch of the new Citroën C4 in Argentina and
the Renault Logan/Sandero in Brazil. It also supplies manifolds in
Brazil that are fi tted with integrated catalytic converters for the small
engine categories of the Volkswagen Golf and Fox.
On the manufacturing front, the Product Group pursued its drive
to improve its cost competitiveness by opening a site in Pisek in
the Czech Republic as well as a new just-in-time facility in Zilina
in Slovakia dedicated to delivering the full exhaust system for the
Kia c ee’d. A new site in Silao in Mexico is scheduled to come on
stream in 2008.
A technical center has been set up in Jang An, located fi fty
kilometers south-east of Seoul, which will enable Faurecia to more
effectively partner South Korean automakers in the development of
their exhaust systems.
The year 2007 saw the combination of soaring oil prices and
growing worldwide awareness of the need to reduce carbon dioxide
emissions. These factors have proved that Faurecia was right in
setting itself the objective of partnering the automotive industry in
developing more energy-effi cient vehicles. The solutions proposed
by Faurecia’s Exhaust Systems division include lighter-weight
products, recovering thermal energy from the exhaust system,
and developing exhaust systems that enable optimal use of high-
performing engines. These solutions were taken up by Renault
in 2007, which selected Faurecia to supply a lightweight exhaust
line for the new Laguna, as well as by PSA Peugeot Citroën,
which is using the Product Group’s heat recovery system in the
Citroën C4 Picasso whereby thermal energy is recovered from the
exhaust system to rapidly heat the vehicle interior in cold weather
conditions.
Thanks to its sustained investment in research and development, to
which it devoted 4.5% of its sales fi gure in 2007 (excluding catalytic
converter monoliths), Faurecia’s Exhaust Systems Product Group
maintained its strong positions in new technologies for treating
nitrogen oxides, notably through its SCR (Selective Catalyst
Reduction) and LNT-Lean NOx Trap systems. These technologies
enable diesel and direct fuel injection petrol engines to meet
future European and US emissions standards, while at the same
time consuming less than current engines. The Product Group is
developing solutions to optimize the technical and fi nancial aspects
of regenerating particulate fi lters, designed to enable pollution
to be controlled at a lower cost and with a lower impact on fuel
consumption.
Faurecia > 2007 Registration document 11
BUSINESS REVIEW AND RESULTS OF OPERATIONS 1Business review
Front End sales jumped 31.5% to €945.1 million in 2007, refl ecting
the integration of operations acquired as part of Cadence Innovation
France’s bankruptcy proceedings. Completed in January 2007,
this acquisition has enabled Faurecia to boost its business with
both PSA Peugeot Citroën and Renault. Like-for-like growth was
18.9%, spurred by the start-up of operations in North America and
12.2% higher sales in Europe (excluding the impact of changes in
Group structure). During the year Faurecia consolidated its leading
positions in the Front End market, ranking number one in Europe
and number two worldwide (*).
A number of innovations were introduced in 2007, including a
variant of the mEasy technology incorporated into the front ends
of the Audi A5 and A4. Patented by Faurecia, this technology
provides automakers with a range of solutions to optimize front end
assembly in line with the vehicle’s architectural constraints while
meeting high assembly-quality criteria. In addition, during the year
the division used new development methods for bumpers for the
new Renault Twingo, enabling it to reduce delivery lead-times and
factor in numerous variants.
The Front End division completed the upgrade program for its
bumper system manufacturing business in France in 2007, opening
a new paint booth at its Marles les Mines site which will help to meet
the high performance and cost-competitiveness levels expected by
customers. It also implemented a number of anticipatory measures
to develop solutions that comply with new European environmental
standards, particularly relating to emissions of volatile organic
compounds (VOC). Facilities that have been opened since 2005
have experienced signifi cant growth, notably for the Renault Logan
program. The US front end assembly plant in Sterling Heights,
Michigan – which supplies Chrysler – is now producing at full
capacity.
In 2007, the division exceeded the quality objectives for front end
modules set with its customers. For bumpers systems, quality
performance leveled off in a context of new program launches and
large-scale production transfers carried out with a view to integrating
Cadence Innovation’s operations without adversely affecting the
division’s output. Meanwhile, customers were highly receptive to
the division’s new perceived quality method, which entered its initial
application phase during the year. And lastly, orders won in 2007
will enable the division to continue to capture market share within
the PSA Peugeot Citroën, Renault and BMW groups.
In 2008, Faurecia’s Front End division will focus primarily on the
start-up of new programs and continued rollout of its worldwide
customer service process, both in the manufacturing and research
and development spheres.
Altogether, the Other Modules segment posted sales of
€3,939.5 million, up 16.6%, or 16.9% on a like-for-like basis.
Changes in Group structure had a positive 2.8% impact but this
was more than offset by the 3.1% negative effect of changes in
exchange rates. Excluding catalytic converter monoliths like-for-like
growth came to 15.8%.
(*) Source: Faurecia.(*) Source: Faurecia.
1.1.3.2 Front End
Sales Workforce Sites Countries R&D centers D&D centers
€0.9 billion 2,500 15 6 1 2
12 Faurecia > 2007 Registration document
BUSINESS REVIEW AND RESULTS OF OPERATIONS1 Results of operations
1.2.1 OPERATING INCOME (1)
(1) See defi nition in Note 1-15 to the consolidated fi nancial statements.(1) See defi nition in Note 1-15 to the consolidated fi nancial statements.
Operating income for 2007 amounted to €121.1 million and
represented 1.0% of consolidated sales, up €51.9 million and
0.4 points respectively. At €62.8 million, fi rst-half operating income
was down on the €85.1 million recorded for the same period of
2006. Performance swung up sharply in the second half, however,
and the Group ended the period with operating income of
€58.3 million versus a €15.9 million operating loss in the second
six months of 2006.
The upturn in the second half of 2007 primarily refl ects the following
factors:
in Europe, the impact of productivity gains combined with tighter
control over development expenditure and the initial effects of
prior-period restructuring measures, which together offset the
adverse consequences of sales price pressure and high raw
material costs;
North America’s strong recovery during the year, with this region’s
second-half operating loss totaling €11.7 million compared with
€54.8 million for the equivalent period of 2006. This turnaround
was attributable to considerably higher manufacturing
performance coupled with contained purchasing costs and the
renegotiation of certain customer contracts.
The overall increase in operating income from €69.2 million in 2006
to €121.1 million in 2007 was achieved thanks to the reduction in
North America’s operating loss from €81.8 million to €66.0, as well
as improved performance by European operations.
•
•
Interior Modules turned in a stronger showing in 2007 but still
reported an operating loss of €15.5 million, representing a 0.2%
negative operating margin, compared with an operating loss of
€44.5 million and a 0.5% negative operating margin in 2006. At
€136.6 million, and 3.5% of sales, operating income for the Other
Modules segment was up signifi cantly on the 2006 fi gures of
€113.7 million and 3.4% respectively.
Gross research and development costs decreased 2.8% to
€613.1 million, corresponding to 4.8% of sales, compared with
€630.5 million (5.4% of sales) in 2006. Excluding amounts billable
to customers, R&D costs totaled €268.6 million and represented
2.1% of sales in 2007 versus €305.0 million and 2.6% of sales one
year earlier. These reductions refl ect enhanced use of the Group’s
Program Management System for handling program development
processes.
Selling and administrative expenses totaled €356.3 million and
represented 2.8% of sales, down 0.2 points on the 3.0% recorded
for 2006 (€353.0 million).
EBITDA came to €596.8 million, or 4.7% of sales, versus
€587.5 million (5.0% of sales) in 2006.
Faurecia > 2007 Registration document 13
BUSINESS REVIEW AND RESULTS OF OPERATIONS 1Results of operations
The “Other operating income and expense” item which represented
a net expense of €225.8 million mainly comprised:
an expense of €104.5 million for restructuring measures, down
from €169.2 million in 2006. These measures concerned
1,728 people and correspond to cost-cutting and manufacturing
reorganization plans, primarily in France, Germany and Spain;
€65.1 million in fair value adjustments on certain non-current
assets, as well as €56.1 million in charges to provisions,
representing an aggregate amount of €121.2 million. As
part of the Group’s recovery plan, Faurecia has given priority
focus to turning around signifi cantly loss-making contracts by
implementing large-scale manufacturing recovery programs,
and in certain cases, renegotiating contracts with the customers
concerned. However, despite these measures certain programs
are still potentially loss-making and as a result impairment losses
have been recorded in relation to the corresponding assets
(development costs or property, plant and equipment). Provisions
were also recorded in 2007 for disputes arising during the year.
•
•
Net fi nance costs stood at €101.1 million, or 0.8% of sales, up
from €86.6 million in 2006. This increase stems from the impact
of higher interest rates and a rise in the Group’s average debt over
the year. The average interest rate on the Group’s borrowings rose
from 3.9% to 4.2%. The Group hedges its exposure to changes in
interest rates using caps.
The “Other fi nancial income and expense” item represented a
net expense of €13.8 million and included the €8.7 million impact
of changes in fair value of interest rate instruments, as well as a
€9.4 million expense corresponding to the effect of discounting
pension benefi t obligations (€9.5 million in 2006).
The tax charge for 2007 was €13.6 million, compared with
€35.2 million for the previous year. This decrease includes the
impact of tax savings generated from the formation of a tax group
in Germany.
The Group ended the year with a consolidated net loss of
€230.9 million, or €237.5 million after minority interests of
€6.6 million. The net attributable loss in 2006 came to €447.9 million.
The loss per share was €9.87 in 2007 compared with €18.72 one
year earlier.
1.2.2. OTHER INCOME STATEMENT ITEMS
14 Faurecia > 2007 Registration document
BUSINESS REVIEW AND RESULTS OF OPERATIONS1 Outlook
Cash fl ow from operations totaled €307.6 million (2.4% of sales),
up €52.4 million on the prior-year fi gure of €255.2 million (2.2% of
sales). This increase was primarily fueled by the rise in the Group’s
operating income .
Working capital requirement decreased by €266.6 million, including
a positive €141.0 million impact arising from the Group’s increased
use of without-recourse sales of receivables.
Capital expenditure for the year amounted to €306.8 million, or
2.4% of sales, on a par with the 2006 fi gure of €302.2 million. This
stability refl ects the Group’s highly selective capital expenditure
strategy, which focuses on the least capital intensive solutions.
Capitalized development costs stood at €159.2 million, down from
€208.3 million in 2006.
Cash fl ows excluding the effects of sales of receivables represented
a net cash infl ow in the second half and a net outfl ow of €58.5 million
over the year. Total cash fl ows for the year represented a net infl ow of
€82.5 million, leading to a reduction in net debt to €1,616.0 million
as of December 31, 2007 from €1,698.5 million as of the previous
year-end.
Total equity amounted to €846.3 million as of December 31, 2007,
down from €1,090.6 million one year earlier due to the appropriation
of the 2007 net loss. This led to an increase in the Group’s gearing
ratio from 1.6 to 1.9.
A breakdown of the Group’s debt is provided in Note 26 to the
consolidated fi nancial statements.
Faurecia confi rms its recovery plan for 2008-2010, targeting
operating income of at least 3% of sales.
The plan’s key focal points, whose results will begin to feed through
as from 2008, are as follows:
a further improvement in quality performance;
tighter control over acquisition and development of new
programs;
a substantial reduction in operating costs;
•
•
•
a recovery in operating income in North America; and
enhanced production innovation capability at constant R&D
costs.
The automotive market environment is expected to be diffi cult in
2008, with fl at sales in Europe and lower volumes in North America.
Despite this unfavorable context, Faurecia is aiming to substantially
improve again its operating income and reduce its debt thanks to
the implementation of its recovery plan.
•
•
Faurecia > 2007 Registration document 15
BUSINESS REVIEW AND RESULTS OF OPERATIONS 1Risk management
1.5.1 FINANCIAL RISKS
Faurecia is essentially exposed to fi nancial risks relating to
fl uctuations in interest rates and the ensuing impact on fi nancial
expense.
1.5.1.1 Interest- and exchange-rate risks
Before taking into account the impact of interest-rate hedges,
85.7% of the Group’s long-term debt was at variable rates as of
December 31, 2007, compared with 86.4% as of end-2006. The
main component of the Group’s fi xed-rate debt is the €300 million
bond issue carried out in October 2005.
Group policy is to systematically hedge the interest rate risk on its
debt. Consequently, in view of the Group’s derivatives portfolio as
of December 31, 2007, a rise in the average level of short-term
interest rates would not signifi cantly impact interest expense. It
would, however, impact consolidated net fi nancial expense, due
to changes in the fair value of derivatives set up to hedge future
interest payable in 2008, 2009 and 2010.
Based on the Group’s interest-rate instruments in place as of
December 31, 2007, a 50bp increase in interest rates (similar to
the increase in 2007) would have an €18 million positive pre-tax
impact on income. Conversely, as the Group’s derivatives primarily
correspond to options, the negative pre-tax impact on income of
a 50bp or more decrease in interest rates would be limited to the
change in the present value of those derivatives as of December 31,
2007, representing €21.8 million.
Interest rates are managed centrally at Group level. Caps, swaps
and other options in euros and US dollars were used for this
purpose in 2007. In addition, fl oors were purchased in order to
benefi t from any lowering of medium-term interest rates on fi xed
rate debt. This policy has enabled the Group to hedge the majority
of its interest rate risk relating to interest payable in 2008 and 2009
and signifi cantly boost its interest cover ratio for 2010.
Faurecia is also exposed to risks arising from fl uctuations in the
exchange rates of certain currencies, particularly due to the location
of some of its production sites as well as the fact that certain
subsidiaries purchase raw materials and other supplies or sell their
products in a currency other than their reporting currency.
The Group Finance department manages these currency risks on
a centralized basis.
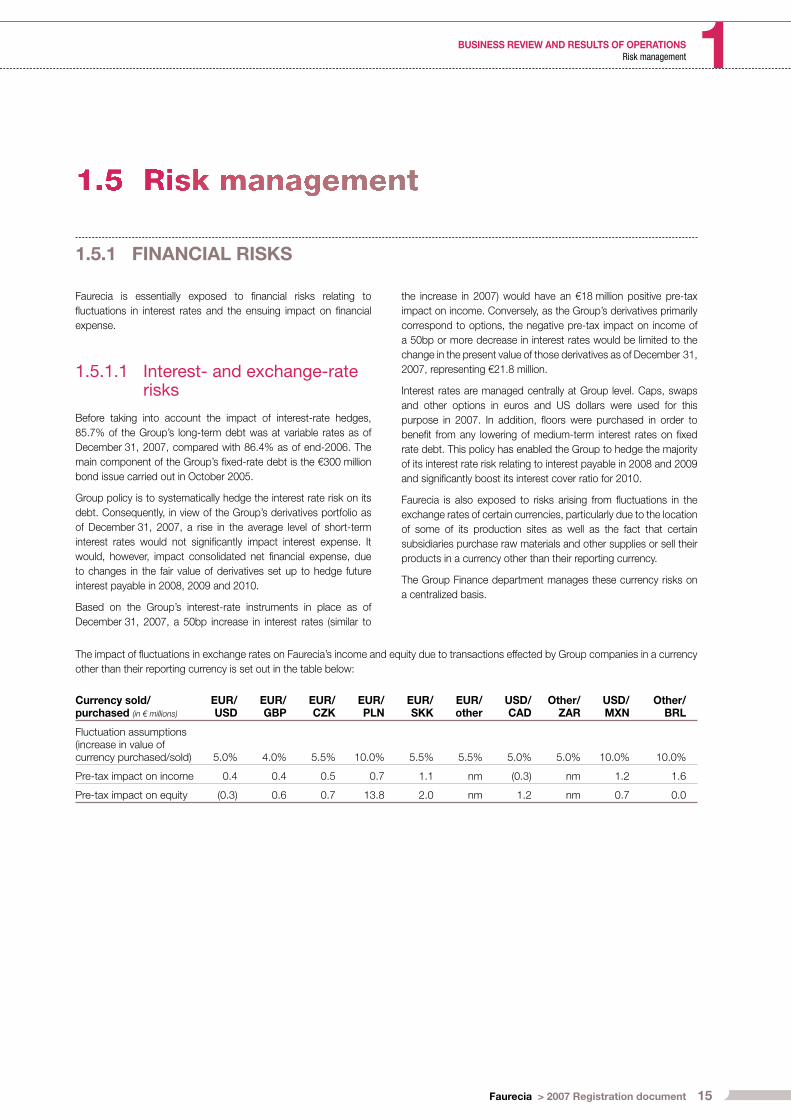
The impact of fl uctuations in exchange rates on Faurecia’s income and equity due to transactions effected by Group companies in a currency
other than their reporting currency is set out in the table below:
Currency sold/purchased (in € millions)
EUR/USD
EUR/GBP
EUR/CZK
EUR/PLN
EUR/SKK
EUR/other
USD/CAD
Other/ZAR
USD/MXN
Other/BRL
Fluctuation assumptions (increase in value of currency purchased/sold) 5.0% 4.0% 5.5% 10.0% 5.5% 5.5% 5.0% 5.0% 10.0% 10.0%
Pre-tax impact on income 0.4 0.4 0.5 0.7 1.1 nm (0.3) nm 1.2 1.6
Pre-tax impact on equity (0.3) 0.6 0.7 13.8 2.0 nm 1.2 nm 0.7 0.0

16 Faurecia > 2007 Registration document
BUSINESS REVIEW AND RESULTS OF OPERATIONS1 Risk management
These impacts refl ect (i) the effect on income of changes in
exchange rates used for the year-end valuation of assets and
liabilities denominated in a foreign currency, net of the impact of
the change in fair value of existing hedging instruments; and (ii) the
effect on equity of changes in the fair value of hedges of forecast
transactions (cash fl ow hedges).
The Group hedges these risks using futures, options, and loans in
foreign currencies, applying strict internal control guidelines under
the supervision of senior management. In addition, subsidiaries
outside the euro zone have been granted inter-company loans
in their functional currencies, representing €415.4 million as of
December 31, 2007. As these loans are refi nanced in euros, the
related exchange-rate risk is hedged through swaps. Details of net
balance sheet positions and currency hedges are provided in Note
30-1 to the consolidated fi nancial statements.
1.5.1.2 Liquidity risks
For its fi nancing, Faurecia has access to a medium-term syndicated
line of credit of up to €1.6 billion which can be drawn down for
renewable periods of one to six months. This line of credit was
set up in 2004 and will expire in November 2009. In addition, in
October 2005 Faurecia issued €300 million worth of bonds,
maturing in October 2010. This bond issue enabled the Group to
diversify its sources of fi nancing.
The syndicated line of credit is used to guarantee liquidity for
Faurecia’s commercial paper program, which is capped at
€850 million. As of December 31, 2007, Faurecia had issued
commercial paper representing a total amount of €503.7 million
with maturities ranging from one month to one year.
The bond indenture and contract relating to the syndicated line of credit contains covenants based on consolidated fi nancial ratios. These
ratios are disclosed each half-year. Their value as of December 31, 2007 is presented in the table below:
Type of ratioContractual ceiling/fl oor Value as of
Dec. 31, 2007 Dec. 31, 2006 Dec. 31, 2005
ratio amount ratio ratio
Adjusted net debt(*)/EBITDA(**) 3.50 ceiling 2.77 1,653.4/596.8 2.97 2.19
EBITDA(**)/net interest 4.50 fl oor 5.90 596.8/101.1 6.78 11.58
(*) Adjusted net debt = consolidated net debt + adjustments for certain commitments given, based on definitions provided in the credit agreement (e.g. mortgages or collateralized liabilities).
(**) Earnings before interest, tax, depreciation and amortization = Operating income + depreciation, amortization and provisions for impairment in value of property, plant and equipment and intangible assets.
Failure to comply with the above-mentioned ceilings/fl oors at a
given reference date would entitle the lenders or bondholders to
demand the repayment of the borrowings concerned in advance
of term. Each lender participating in the syndicated line of credit
may individually demand the early repayment of its share of any
drawdowns and terminate its participation in the contract, which
would remain in force for the other lenders. Concerning the bond
issue, bondholders are entitled to redemption at par of all or some
of their bonds plus the accrued interest outstanding at the date on
which the application for early redemption is made.
1.5.1.3 Commodity risks
The Group manages its exposure to commodity risk by constantly
negotiating with customers and tightly managing inventories. It also
negotiates fi xed-term contracts with suppliers wherever possible
(on an annual basis for steel, and with quarterly index clauses for
plastics). Faurecia does not use derivatives to hedge its purchases
of raw materials and energy.
1.5.2 COMMERCIAL, LEGAL AND TECHNICAL RISKS
As a manufacturer and assembler of parts and components for the
automotive industry, Faurecia is exposed to the risk of technical or
commercial disputes. As part of its ongoing drive to ever-enhance
the supply-chain, just-in-time delivery, and supplier relations, it
limits its inventories of raw materials and fi nished and semi-fi nished
products.
Faurecia > 2007 Registration document 17
BUSINESS REVIEW AND RESULTS OF OPERATIONS 1Risk management
Volume risk is analyzed twice a year with each customer, during
which issues relating to price renegotiations and the amount
of research and development are addressed. The fi nancing of
research and development is variable. It may be paid upfront or as
the parts are delivered, with no guarantee from the customer that
it will pay for the full amount of expenditure incurred. The relevant
contracts sometimes contain clauses concerning the renegotiation
of research and development fi nancing.
Lastly, the Group has not identifi ed any risk of technological
dependence in relation to its products, modules and systems. This
refl ects Faurecia’s proactive strategy – implemented at its 28 R&D
centers – to create its own designs and control the patents that are
essential for its operations.
1.5.2.1 Claims and litigation
To the best of the Company’s knowledge, in the past twelve months
there were no governmental, legal or arbitration proceedings
(including any such proceedings which are pending or threatened
of which it is aware) that may have, or have had in the recent
past, signifi cant effects on the Group and its fi nancial position or
profi tability, apart from those described in this registration document
(see Note 24 to the consolidated fi nancial statements), and which
were covered by adequate provisions based on known factors and
information available at the balance sheet date.
1.5.2.2 Industrial risk management
As it does not have any captive insurance entities, Faurecia’s
system for safeguarding its assets is based on the implementation
and ongoing adaptation of its risk prevention policy as well as its
strategy of transferring high-level risks to the insurance market.
INDUSTRIAL RISK PREVENTION
Faurecia’s industrial risk prevention policy is part of the Group’s
Health, Safety and Environment strategy. The aim is to reduce
accidents caused by fi re and encourage Group sites to achieve
excellence in fi re safety by obtaining the HPR (Highly Protected Risk)
label from Faurecia’s insurer. Since 2005, the insurance premiums
for sites that have been HPR certifi ed have been reduced by 20%.
The HPR policy is based on the following priorities:
regular safety audits, carried out every two years on average
by the Group’s fi re insurer. The most recent audit program was
carried out in 2007. Approximately half of the Group’s sites are
classifi ed as HPR or pre-HPR. Four new sites – Hénin Beaumont
in the Vehicle Interiors Product Group and Leipzig, Walbrzych
and Neuenstadt in the Automotive Seating Product Group –
received HPR certifi cation in 2007. Substantially all of the sites
audited in 2007 received confi rmation of their HPR status, or
•
saw an increase in their certifi cation grade. A program of around
113 audits is scheduled for 2008. In total, 95% of Faurecia’s sites
(plants and technical centers) have been regularly audited since
the Group’s launch of its HPR strategy. The audit process for
the Group’s Chinese sites began in 2005 and will continue into
2008;
incorporating fi re safety factors into the early stages of any
plant design or major refurbishing of existing sites, through fi re
partitioning and ensuring that adequate fi re safety equipment is
available;
experience feedback: incidents are systematically analyzed and
the fi ndings circulated throughout the HSE network;
an Intranet-based fi re safety management system developed by
Faurecia, through which the HPR policy is relayed to the entire
Group. This system provides online information including audit
fi ndings, technical specifi cations, feedback and best practices.
A major fi re took place in 2007 at the Mlada Boleslav Interior Systems
facility in the Czech Republic. However, the site’s production
equipment was not affected and the plant started up operations
again immediately. A procedure for verifying the maintenance and
inspection of sprinklers has been set up for all of the Group’s plants
and will be extended in conjunction with its insurer.
FIRE, PROPERTY DAMAGE , AND BUSINESS
INTERRUPTION INSURANCE
On January 1, 2008 Faurecia renewed its fi re, property damage
and business interruption insurance policy for two and a half years
with a leading insurer based on the same rates as for the previous
policy.
The coverage for buildings and equipment is based on replacement
value. Coverage is organized around a “Master” policy, which
includes direct coverage for the “freedom of services area”, with
local policies for subsidiaries in countries located outside this area.
Special coverage has been set up in certain countries for specifi c
risks.
LIABILITY INSURANCE
Faurecia also renewed its liability coverage on January 1, 2008
based on the same rates as for 2007.
The Group’s liability insurance breaks down as follows:
operational liability;
product liability;
liability for environmental damage.
Liability insurance takes the form of a “Master” policy combined
with local policies taken out in countries where Faurecia has
subsidiaries.
•
•
•
•
•
•
18 Faurecia > 2007 Registration document
BUSINESS REVIEW AND RESULTS OF OPERATIONS1

Faurecia > 2007 Registration document
CONTENTS
19Faurecia > 2007 Registration document
2RESEARCH & DEVELOPMENT
2.1 Automaker Expectations 21
2.2 Innovation 22
2.3 Product Planning 23
2.4 Engineering Productivity 24
2.5 Premium Attitude 25

20 Faurecia > 2007 Registration document
RESEARCH & DEVELOPMENT2
R&D is a key strategic issue for Faurecia. It covers innovation,
development of generic products, and engineering, on a total of
340 programs. And it represents a major commitment on resources:
€613.1 million gross expenditure in 2007, plus management of
tooling costs and plant investment. In all, 3,500 engineers and
technicians at 28 Faurecia R&D centers worldwide control a gross
budget of around €1 billion.
As automakers’ expectations intensifi ed in 2007, R&D becomes a
major arena for competition among equipment vendors.
To meet the challenge Faurecia stepped up its engineering
capabilities, very successfully so judging by enthusiastic response
to its Premium Attitude concept.

21Faurecia > 2007 Registration document
RESEARCH & DEVELOPMENT 2Automaker Expectations
Fierce competition between automakers shows through clearly in
their product offerings:
intensifi ed vehicle releases schedule , with some makers’ product
line-ups expanding by up to 50%;
shorter development leadtimes, for rapid renewal of product
ranges;
growing need to release vehicles with distinctive advantages
appreciated by the end consumers ;
tighter constraints on safety, with makers increasingly eager to
anticipate on forthcoming regulations;
longer warranty coverage and extreme consumer attention to
perceived quality, both on initial contact with the vehicle and from
a longer-term viewpoint, for reasons of resale value;
stronger emphasis, in 2007, on environment-related issues (fuel
consumption, pollutant emissions, ecological footprint over
vehicle time ) in automaker priorities and consumer purchase
criteria.
•
•
•
•
•
•
These factors combine to toughen demands on equipment supplier
performance under very tight economic conditions. Automakers
are demanding these results, which entail increased workload,
within constant overall development outlays. And they also expect
to continue the trend toward spreading program fi nance over the
program cycle , thus requiring equipment suppliers to bear a higher
proportion of program risks.
Faurecia nevertheless regards these trends as holding opportunity
for developing value on its markets and strengthening long-term
competitive standing. Few of its rivals can meet these intensifying
demands, and among the major market players Faurecia fi elds front-
line technology. To meet emerging challenges under tightly imposed
leadtime and cost conditions, Faurecia set up or stepped up a
series of measures on innovation, product planning and engineering
productivity in 2007. And it unveiled the Premium Attitude concept
car as a working showcase to illustrate its innovative capabilities
and stimulate advanced dialogue with customers.
22 Faurecia > 2007 Registration document
RESEARCH & DEVELOPMENT2 Innovation
Faurecia stands at the crossroads of two major automotive industry
trends:
creation of end-customer value for vehicle differentiation;
improvements in environmental performance.
Faurecia’s increasing investment in innovation takes these two
focuses in each of its product lines; here’s a few examples:
automotive seating:
product solutions for the growing premium segment, with
seats for BMW Mini Clubman in 2007,
improved static and dynamic comfort with the “grand comfort”
project for a seat with multidirectional adjustments developed
jointly with an automaker,
standardization of seat structures and components, such as
mechanisms,
lightweight design;
vehicle interiors:
enhanced perceived quality, illustrated by the new Renault
Laguna, winner of the International Design Festival “best
interior” award,
function integration, with the new-generation door module;
exhaust systems:
compliance with new standards such as Euro V and Euro VI,
improved engine performance, with growth in welded manifolds
(for better high-temperature performance) and exhaust heat
insulation systems,
weight and size reductions, to free up more interior space;
front-end units:
full-function module integration, a high-growth market,
enhanced perceived quality, and integration of functions such
as parking sensors;
acoustic solutions:
improved acoustic performance, without weight and package
penalties, through developments of multilayer materials,
substantial use of recycled materials, with development of
Sommold.
•
•
•
−
−
−
−
•
−
−
•
−
−
−
•
−
−
•
−
−
The boost in innovation would not have been possible without the
improved effi ciency in the innovation process, achieved through
four measures:
reorganization, involving development of poles of product/
process competency , accurate identifi cation of key skills needed
for future development, and close analysis of needs. A major
additional contribution comes from the new Westworks think
tank in the USA, dedicated to innovation and creative design in
all vehicle interior systems;
systematic launch of co-development projects with main
customers, stimulating forward-looking technical dialogue on
concepts and architecture ;
introduction of Quality Basics in Innovation program, which
ensures that industrial and technical risks are identifi ed and
controlled, without imposing excessive constraints on creativity ;
tighter selection of innovation projects, to concentrate resources
on priority challenges addressing identifi ed commercial targets.
Faurecia has a portfolio of 196 innovation projects, broken down
by product line (seats, structures & mechanisms, dashboards,
etc.) and by innovation focus, addressing market expectations
such as perceived quality, driving experience , safety, environment
and standardization. Project progress is managed from initial idea
through to product/process validation, applying a structured process
with decision milestones. The risks inherent to any innovation-driven
endeavor are lifted as development proceeds, on in-house pilot
applications or on upstream co-development programs run with
automaker s. Only validated projects can be offered for application
on customer programs.
R&D-specifi c expenditure can be fi nanced either cash or through
piece price amortization , or through a combination of both
arrangements.
The Faurecia innovation policy yielded a total of 243 patents in 2007,
putting Faurecia among the most inventive companies in its sector.
•
•
•
•
23Faurecia > 2007 Registration document
RESEARCH & DEVELOPMENT 2Product Planning
Faurecia undertook an in-depth review of its product plan in 2007,
in response to customer demand under constraints specifi c to
Faurecia. Four main focuses were taken:
full integration of product and process teams, for parallel
development of products and the manufacturing processes for
making them;
design of component platforms for splitting development costs
across several models in the vehicle range of one or more
customers. These platforms, in each of Faurecia’s business lines,
are mostly tailor-made, and require in-depth analysis of what
can be standardized and what must remain specifi c, to leave the
automaker suffi cient design freedom for product differentiation.
Standardization scope includes seat and dashboard structures,
door and front-end modules, and exhaust lines;
early allowance for constraints on perceived quality, as it is
extremely costly to correct errors once designs and processes
have been set. Faurecia’s industrial design teams step in at
project inception, to diagnose risks and put forward solutions
as early as possible in the development chain. Perceived quality
concerns the whole vehicle interior, including seats, and the
vehicle exterior, especially for front-end modules and bumpers
fi t and fi nish;
•
•
•
defi nition of priority solutions on environment matters: weight,
emission control, recyclable materials. Lightweight vehicle design
has become a major challenge for automakers, and Faurecia
modules can together account for around 16% of the total
vehicle weight. In each of its business lines Faurecia develops
products with weight reductions of 25% to 30%, making a very
signifi cant contribution to automakers’ initiatives on lightweight
vehicle design. On emission control, Faurecia’s exhaust system
teams work with automakers across the whole spectrum of
advanced technological solutions (improved combustion, gas
recycling, etc.). Programs on replacing resins by natural fi bers (in
cellulose and other materials) are already yielding economically
and qualitatively competitive alternatives to plastics in a number
of applications. Faurecia largely outpaces its main rivals as
regards upline integration capabilities in this fi eld. In parallel,
teams across all Faurecia businesses are working on recyclability
of materials, taking up “zero waste” (in vehicle soundproofi ng,
for example) as the ultimate objective.
•
24 Faurecia > 2007 Registration document
RESEARCH & DEVELOPMENT2 Engineering Productivity
Because R&D goals must be met under tight economic constraints,
Faurecia put together a four-year action plan on engineering
productivity in 2007, specifying a steady shift in geographical
siting for its development centers, and constant improvement in
development processes. R&D centers in India and China, where
Faurecia plans to locate over 25% of its total development
capacities by 2010, are growing in response to two needs: local
development of products for local automobile manufacture; and
cost optimization across an increasing proportion of the value
chain in product development for European and North American
markets.
The shift in geographical siting for engineering functions continued
in 2007, consistent with the optimum location principles
determined by Faurecia teams: geographical proximity to customer
sites for effi cient program take-up and interfacing; centralization
and specialization for research and innovation centers; siting in
moderate-cost countries for prototyping, simulation and validation
work. The fast-growing Pune development center in India employs
a workforce of around 200 to provide an increasingly wide range
of services across the whole of the Faurecia group. Then in China,
Faurecia developed a metal structure platform for the global
low-cost vehicle segment, at greatly reduced cost within a very
short timeframe. This unit is already in production with a Chinese
automaker.
Faurecia sees R&D as a powerful competitive lever for strategic
development. Though challenging demands from automaker
customers impose a very fast rate of change, they also hold
substantial opportunity for differentiation and long-term
improvements in economic performance.

25Faurecia > 2007 Registration document
RESEARCH & DEVELOPMENT 2Premium Attitude
Faurecia’s Premium Attitude concept car was developed to
showcase product innovation addressing the fast-growing
premium market. Premium Attitude has met with a very enthusiastic
reception from the automotive industry, the press, and the general
public, at international motor shows. Once the preserve of a handful
of upmarket automakers, premium products are spilling over into
neighboring vehicle segments, and customers are being courted
by all manufacturers.
Premium Attitude demonstrates Faurecia’s capacity for expertise,
forward planning and innovation on the automotive market in general
and the premium market in particular. And it also prompts dialogue
very early on in the program take-up process with customers’
design, vehicle package and product planning teams, stimulating
joint ideas on future co-developments.
All Faurecia’s design and engineering teams, in all business lines,
contributed to Premium Attitude. And many of the innovations
showcased on Premium Attitude are being developed under
product -line innovation plans.
Premium Attitude is based on a 1972 Tatra 603/2, an iconic model
in motoring history, yet perfectly neutral today since the brand no
longer exists. It illustrates Faurecia’s proactive stance on facilitating
innovation through direct dialogue with automakers. The interior
space is consistent with today’s norms, enabling Faurecia to do
full justice to the vehicle interior, of key differentiations on today’s
increasingly fragmented auto market.
Those i nnovations demonstrate the future organic growth of
Faurecia. Faurecia’s capacity to offer its customers well-designed,
innovative products is crucial to its sustainable profi tability.
Major focuses for innovation on the Premium Attitude concept car
are:
intelligent design and ease of use:
self-supporting dashboard,
stowage drawer in trunk/rear module,
asymmetrical driver’s seat, with integrated console and multi-
control module;
•
−
−
−
“Magic” experience:
adaptable front seats,
“Magic” rear armrest,
“Relax” function on rear seat,
adjustable door armrest with action linked to seat
adjustments,
“Magic wave” dashboard for different screen modes;
obsessive attention to detail:
“Jewel box” glove compartment,
large inserts in real wood (seats, doors, etc.),
innovative air vents,
ambiance lighting.
Faurecia as T ier one supplier is a solution provider and developes
new architectures (like the self-supporting dashboard) that give
greater freedom to automaker designers and stimulate innovation-
oriented dialogue with customer advanced teams.
The Premium Attitude concept car appeared at the Los Angeles
Auto Show in November 2007 before making its European de but
in Berlin, capital of Europe’s foremost premium automobile market.
It has been presented to Ford, General Motors, Chrysler, Toyota,
Nissan, Hyundai-Kia, PSA Peugeot Citroën, Renault, Mercedes
Benz, BMW, Saab, Audi, Seat, Honda, Tata and Volvo. Feedback
from automakers is extremely positive, and this new form of
dialogue has already spawned several co-development projects
targeting forthcoming vehicle programs.
•
−
−
−
−
−
•
−
−
−
−

26 Faurecia > 2007 Registration document
RESEARCH & DEVELOPMENT2

CONTENTS
HUMAN RESOURCES
3
27Faurecia > 2007 Registration document
3.1 Safety in the workplace 28
3.1.1 Workplace safety indicators 28
3.1.2 Health and safety training 30
3.1.3 Health and Safety certifi cation 30
3.1.4 Ergonomics and working conditions 31
3.2 Skills development 32
3.2.1 Employee empowerment 32
3.2.2 Developing manager and professional potential 33
3.2.3 Faurecia University 34
3.2.4 Talent sourcing 35
3.3 Strengthening economic and social dialogue 36
3.3.1 A slowdown in the relocation of manufacturing facilities and employees 36
3.3.2 In-depth discussions with employee representatives 36
3.3.3 A larger and stronger european works council 36
3.3.4 Code of ethics 37
3.3.5 Compensation and benefi ts 37
3.4 Employee incentive plans 38
3.4.1 Voluntary gain-sharing plan (“Intéressement”) 38
3.4.2 Mandatory profi t-sharing plan (“Participation”) 38
3.4.3 Group employee savings plan 38
3.4.4 Stock options 39
3.4.5 Other corporate data 40
28 Faurecia > 2007 Registration document
HUMAN RESOURCES3 Safety in the workplace
The Group’s HSE policy is clearly outlined in two documents that
defi ne Faurecia’s core principles: the Mission Statement and the
Code of Ethics. These principles provide the basis for HSE policies
at all Faurecia sites worldwide.
Faurecia’s policy in terms of health and safety and working
conditions hinges on two main objectives: ensuring the protection
of employee’s health and improving the safety of employees in the
workplace.
Safety in the workplace is one of the building blocks of the Group’s
search for excellence embodied in the Faurecia Excellence System
(FES). It is an absolute requirement for the respect of employees,
which every facility must satisfy.
To achieve the goal of reducing the rate of work-related injuries with
lost time within the Group to three per million working hours by the
end of 2008, Faurecia continued to strengthen its commitment to
safety and better working conditions throughout the year.
3.1.1 WORKPLACE SAFETY INDICATORS
The results of initiatives in this area are measured by analyzing
changes in the frequency rate of work-related injuries.
In order to guarantee the same level of workplace safety for all
employees, temporary workers are included in indicator calculations
in the same manner as permanent staff.
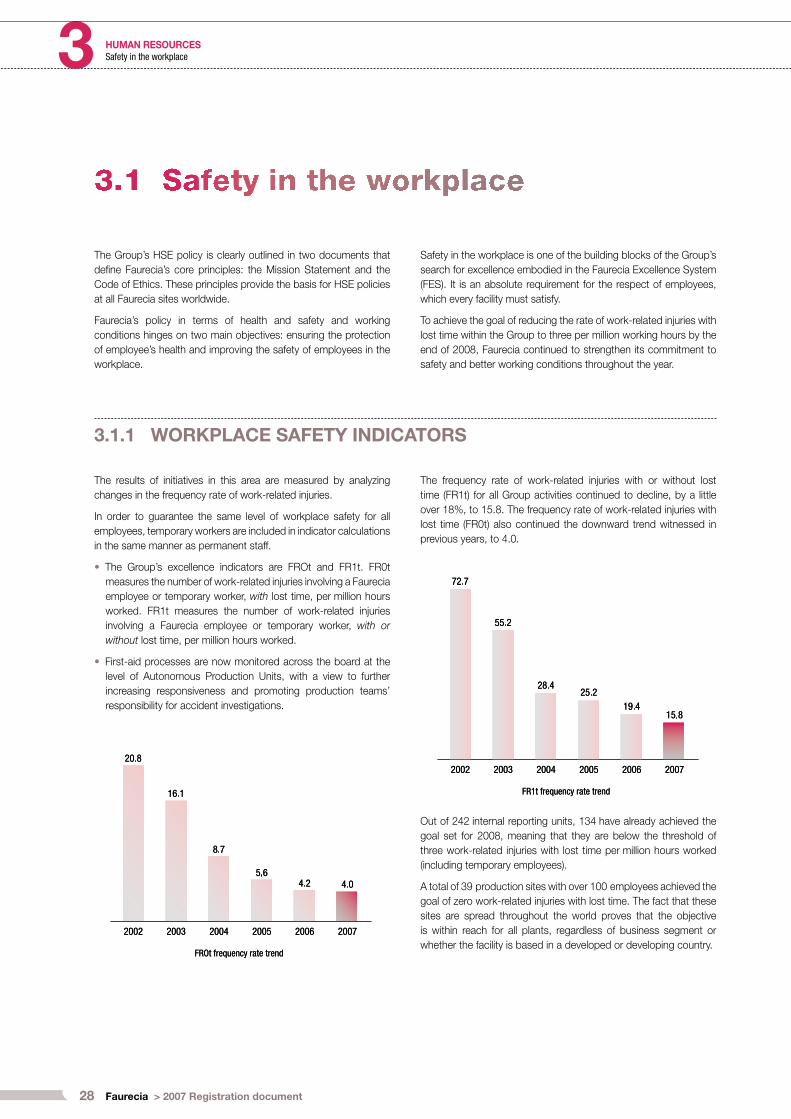
The Group’s excellence indicators are FROt and FR1t. FR0t
measures the number of work-related injuries involving a Faurecia
employee or temporary worker, with lost time, per million hours
worked. FR1t measures the number of work-related injuries
involving a Faurecia employee or temporary worker, with or
without lost time, per million hours worked.
First-aid processes are now monitored across the board at the
level of Autonomous Production Units, with a view to further
increasing responsiveness and promoting production teams’
responsibility for accident investigations .
•
•
The frequency rate of work-related injuries with or without lost
time (FR1t) for all Group activities continued to decline, by a little
over 18%, to 15.8. The frequency rate of work-related injuries with
lost time (FR0t) also continued the downward trend witnessed in
previous years, to 4.0.
Out of 242 internal reporting units, 134 have already achieved the
goal set for 2008, meaning that they are below the threshold of
three work-related injuries with lost time per million hours worked
(including temporary employees).
A total of 39 production sites with over 100 employees achieved the
goal of zero work-related injuries with lost time. The fact that these
sites are spread throughout the world proves that the objective
is within reach for all plants, regardless of business segment or
whether the facility is based in a developed or developing country.

29Faurecia > 2007 Registration document
HUMAN RESOURCES 3Safety in the workplace
Site Business Country Number of employees
Grojec Frames & Mechanisms Poland 1,632
Stadthagen Frames & Mechanisms Germany 1,588
Puebla Vehicle Interiors Mexico 895
Talmaciu Automotive Seating Romania 758
Vigo Automotive Seating Spain 552
Ben Arous Automotive Seating Tunisia 539
Walbrzych Frames & Mechanisms Poland 520
Puebla cut & sew Vehicle Interiors Mexico 509
Pisek Vehicle Interiors Czech Republic 470
Pisek Frames & Mechanisms Czech Republic 386
Troy West Exhaust Systems USA 366
Port Elizabeth Vehicle Interiors South Africa 366
Wörth Vehicle Interiors Germany 357
Orhangazi Vehicle Interiors Turkey 320
Pamplona Automotive Seating Spain 298
Fradley Vehicle Interiors United Kingdom 295
Peine Vehicle Interiors Germany 286
Fountain Inn Automotive Seating USA 274
Changchun Vehicle Interiors China 265
Lieu-St-Amand Automotive Seating France 256
Troy East Exhaust Systems USA 256
Burlada Exhaust Systems Spain 236
Chongqing Vehicle Interiors China 220
Granger Exhaust Systems USA 208
Changchun Exhaust Systems China 205
Madrid Frames & Mechanisms Spain 205
Sao Paulo Vehicle Interiors Brazil 201
Riverside (MO) Automotive Seating USA 199
Walton Automotive Seating USA 195
Changchun Frames & Mechanisms China 188
Vigo Vehicle Interiors Spain 184
Shanghai Frames & Mechanisms China 169
Böblingen Vehicle Interiors Germany 155
Neuenstadt Automotive Seating Germany 135
Sittard Automotive Seating France 126
Walbrzych Automotive Seating Poland 123
Bains s/Oust Modules & Systems France 121
Quatro Barras Covers Automotive Seating Brazil 110
Palmela Modules & Systems Portugal 108
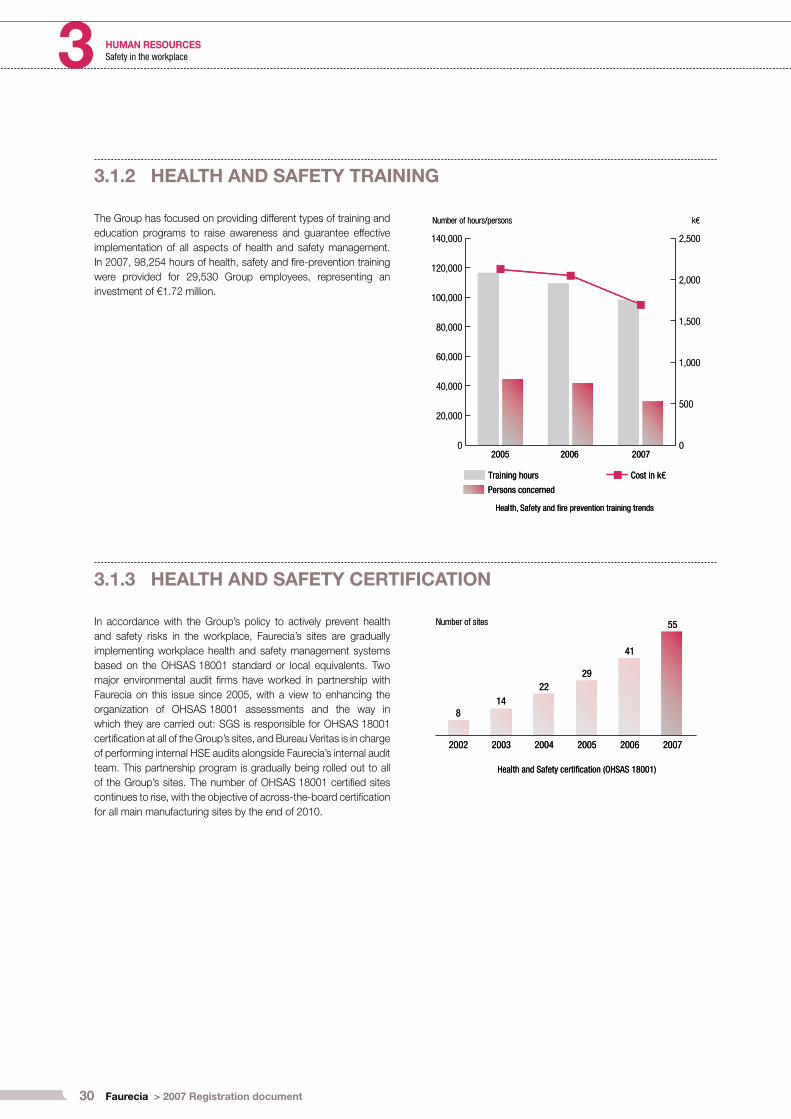
30 Faurecia > 2007 Registration document
HUMAN RESOURCES3 Safety in the workplace
3.1.3 HEALTH AND SAFETY CERTIFICATION
In accordance with the Group’s policy to actively prevent health
and safety risks in the workplace, Faurecia’s sites are gradually
implementing workplace health and safety management systems
based on the OHSAS 18001 standard or local equivalents. Two
major environmental audit fi rms have worked in partnership with
Faurecia on this issue since 2005, with a view to enhancing the
organization of OHSAS 18001 assessments and the way in
which they are carried out: SGS is responsible for OHSAS 18001
certifi cation at all of the Group’s sites, and Bureau Veritas is in charge
of performing internal HSE audits alongside Faurecia’s internal audit
team. This partnership program is gradually being rolled out to all
of the Group’s sites. The number of OHSAS 18001 certifi ed sites
continues to rise, with the objective of across-the-board certifi cation
for all main manufacturing sites by the end of 2010.
3.1.2 HEALTH AND SAFETY TRAINING
The Group has focused on providing different types of training and
education programs to raise awareness and guarantee effective
implementation of all aspects of health and safety management.
In 2007, 98,254 hours of health, safety and fi re-prevention training
were provided for 29,530 Group employees, representing an
investment of €1.72 million.
0
20,000
40,000
60,000
80,000
100,000
120,000
140,000
0
500
1,000
1,500
2,000
2,500
0
20,000
40,000
60,000
80,000
100,000
120,000
140,000
0
500
1,000
1,500
2,000
2,500
31Faurecia > 2007 Registration document
HUMAN RESOURCES 3Safety in the workplace
3.1.4 ERGONOMICS AND WORKING CONDITIONS
In 2007, 198 cases of occupational illness were reported throughout
the Group, most involving musculoskeletal disorder . To help combat
this problem, Faurecia has taken steps over the past few years to
take more effective account of the strains caused by workstations
and to offset them to the greatest degree possible. The industrial
sites declared total payments of €35.3 million to public or private
insurance providers in 2007 in respect of employee healthcare.
An ergonomic review of 91 sites was carried out within the
Automotive Seating business in 2007, using the AGREPT method
(french acronym for Analysis of Risky Gestu res and their Effects on
Hardness at Work ). This review is also due to be carried out in the
Front End division of the Modules & Systems business.
As a result of these analyses, solutions were implemented at
manufacturing workstations.
The analyses are also used to prepare a list of recommendations
that are systematically taken into account during the design
of products and manufacturing tools. An increasing number
of recommendations from professional ergonomists and HSE
coordinators are being factored into the “Program Management
System” (PMS).
An “Ergonomics” memorandum is now available to all Group process
engineers and managers in charge of effi ciency in manufacturing
systems, to provide additional information on analyzing workloads
and how to take into consideration the ergonomic constraints
of workstations. This memorandum is aimed at providing basic
training in this area for people such as members of health and
safety committees, who are involved in organizing work schedules
or designing workstations.

32 Faurecia > 2007 Registration document
HUMAN RESOURCES3 Skills development
Refl ecting the Group’s strategy of providing excellent customer
service, human resource management is a considerable
competitive advantage for Faurecia and one of the keys to its
success. The Group’s strategy in this area is based on two pillars:
employee empowerment and developing the potential of engineers
and managers.
3.2.1 EMPLOYEE EMPOWERMENT
Employee empowerment is the cornerstone of the Faurecia
Excellence System (FES). It is a key factor in boosting industrial
performance. Employee empowerment is a strategic driver for
the Human Resources department, with the objective being the
implementation of Autonomous Production Groups (GAP), which
perform their activities in accordance with standards in force and
actively contribute to improving the performance of their particular
entity.
The progress made in 2007 is the result of priorities set in the
following fi ve areas:
3.2.1.1 Implementing “HOP”
”Human organization of production” (HOP) is central to employee
empowerment. Putting HOP into practice means organizing
the manufacturing sites into four hierarchical levels with smaller
autonomous production groups (GAP) led by GAP leaders. First-
level training is provided by team supervisors. The teams are limited
in size so that the supervisors can provide genuine guidance and
help staff meet performance objectives.
3.2.1.2 Ensuring team stability
Production team stability is vital to a site’s performance, especially
during the launch phase. Factors such as recruitment quality,
training and detailed instructions to employees before they join
the production line are known to have a major impact on team
stability.
3.2.1.3 Making training plans more suitable
This approach has been rolled out to site management teams
group-wide, the goal being to ensure that training actions are
consistent with site priorities. Particular importance is given to
identifying training needs and systematically reviewing progress
and the achievement of objectives.
The deployment of this approach in the second half of 2007
confi rmed that the operational managers pay considerable
attention to training their teams, insofar as the teams have a role to
play in achieving operational objectives.
3.2.1.4 Stepping up use of the Supervisor’s dashboard
Given the progress made in HOP implementation, it has become
even more important to ensure the systematic rollout of the
production site’s objectives to each GAP. For supervisors, these
objectives are set out in a dashboard, by which they can follow
a series of performance indicators in order to check if the results
obtained are in line with expectations and, if necessary, to
pinpoint corrective action requiring management intervention.
The implementation of the supervisor’s dashboard at sites such
as Boblingen in Germany has led to an improvement in operating
results thanks to the individual progress made by supervisors,
GAP leaders and their teams.
3.2.1.5 Involving operator employees in the ongoing improvement drive
Employees at all Group entities are encouraged to put forward
their ideas for improvement, which can then be put into practice
in their particular area. In 2007, the number of ideas per employee
per year increased by 60% to 5.6, and 75% of ideas proposed
were actually put into practice (40% more than in 2006). This
indicator is crucial in enabling us to measure our teams’ autonomy.
The considerable advances made in 2007 show that employee
empowerment is continuing to grow, with the Group reaping the
rewards in terms of manufacturing improvements.
33Faurecia > 2007 Registration document
HUMAN RESOURCES 3Skills development
In order to succeed both now and in the future, Faurecia needs
the best teams of managers and experts, driven by the pursuit of
excellent customer service. Consequently, the Group is committed
to continually building the skills and motivation of its teams and
identifying future needs.
3.2.2.1 Changing in line with Group developments
Faurecia is keenly aware of the importance of constantly adapting
resources in line both with changes in customer requirements and
developments in the Group’s organization. With this in mind, the
Group is continuing to expand its network of career management
specialists for managers and technical experts.
3.2.2.2 Tailoring resources to changing needs
The trend registered in 2005 held fi rm in 2006 and 2007. Out of at
total of 9,908 managers and professionals employed by the Group,
almost 38% work outside Western Europe. 56% of new managers
and professionals were hired in the Group’s growth regions of
North America, Central Europe, Asia and South America.
Over 66% of vacancies in Western Europe were fi lled internally.
Inter-segment mobility represented 12% of the 2,103 mobility
programs carried out. Some 80% of program manager vacancies
and 79% of plant manager positions were fi lled internally. In 2007,
the Group’s “talent pool” initiative started to bear fruit, with 80%
of senior management vacancies fi lled internally. At the same
time, 56% of junior management positions were taken up by
internal candidates and we maintained our policy of hiring young
graduates.
A total of 39 contracts were signed under the VIE international
voluntary internship system and almost 60% of VIE interns were
recruited at the end of their placement.
We also extended our targeted graduate recruitment scheme to
Germany, Poland and the United States. During the second half of
the year, 33% of our graduate hires came from selected universities
and colleges, compared with 30% in the fi rst six months.
3.2.2.3 Personalized and pro-active career management
Faurecia encourages its managers and professionals to deepen
their skills in their core discipline in order to hone their expertise
and enhance the value of their experience. This holds particularly
true in the support functions and in Research and Development.
The possibility of moving into a different domain subsequently allows
managers and professionals to learn new technical expertise and
acquire managerial skills. Over 540 managers and professionals
worldwide moved into a new technical area in 2007, accounting
for almost a quarter of the Group’s employee mobility fi gure.
The Group considers internal promotion a priority and has set
very high standards with a stated objective of promoting the next
generation of top managers and experts from within. In line with
this, our promotion rate remained at 10% in 2007.
Opportunities for personal development are available to everybody
within the Group, based on demonstrated individual performance
and potential. Particular focus is placed on managing internal staff
career moves to ensure that employees hold suitable positions in
both the short- and medium-term. Almost half of the employees
identifi ed as ready to change posts were effectively given new
positions in 2007.
Faurecia considers its experts and managers to be of vital
importance and strives to ensure that both categories receive
equal recognition and are offered the same opportunities. 2007
marked the third consecutive year of our process of identifying and
rewarding the expertise of our employees, as a result of which we
appointed 36 new specialists during the year. We also appointed
new senior experts, demonstrating our ability to strengthen the
business-specifi c skills required for each product line. By the end
of 2007, Faurecia counted a total of 196 experts within its ranks.
All of Faurecia’s managers play a key role in the development of the
Group’s teams. The Human Resources department is responsible
for coordinating the overall career management process. Over
1,900 managers and professionals met individually with their career
manager during the year, and several communication initiatives
were introduced by the career managers in this regard.
3.2.2.4 Building for the future today
At the 2007 staffi ng review, 5% of the Group’s top 900 managers
and professionals were identifi ed as high-potential employees. The
collective nature of the review process, from the shop fl oor right
up to General Management, ensures the consistency of the whole
procedure.
By consolidating performance and potential assessments, the
Group can defi ne succession plans for its management teams at
each level of the organization. In 2007, we were able to identify
83% of the successors for our management employees (up from
76% in 2006) with 43% available within a one-year timeframe.
3.2.2 DEVELOPING MANAGER AND PROFESSIONAL POTENTIAL
34 Faurecia > 2007 Registration document
HUMAN RESOURCES3 Skills development
3.2.3 FAURECIA UNIVERSITY
3.2.3.1 Training programs serving Group needs
In 2007, the Group continued to focus on skills development
for employees through the Faurecia University. The number of
programs on offer once again increased, to 18, with even more
employees now able to take advantage of the courses on offer.
With the addition of Sales Fundamentals and Supervisor/UAP
Manager courses, the University organized a total of 150 sessions
in 11 countries, with some 2,741 employees from 22 countries
taking part.
The Faurecia University continued with the dedicated training
sessions of the last fi ve years, aimed at helping internally-promoted
mangers get to grips with their new role. Plant managers and
program managers hold key positions and are therefore especially
implicated by these sessions. Training for future Group leaders
remained a priority in 2007, and rollout of the Global Leadership
Programs was stepped up a notch. Following a successful pilot
session in April, the Global Leadership II program is now in full
swing. This program focuses on business management and is
being carried out in conjunction with the renowned IESE business
school in Barcelona.
In addition to existing programs for the Sales and Human
Resources departments, 2007 saw the introduction of the
new Sales Fundamentals course, which teaches the industry’s
basic methodologies, main procedures and objectives. Some
63 employees took part in one of four sessions organized over
the year.
The launch of a special program for Supervisors and UAP
Managers illustrated the extent of the University’s reach. This
ambitious 11-day program was set up simultaneously in China,
the Czech Republic, Slovakia, France and Germany. This was the
fi rst Faurecia University program to be run in various languages
worldwide, by a network of external trainers in the countries
concerned. Impeccable coordination was required for the program
to succeed, and each external trainer had to undergo a detailed
and precise training and qualifi cation process. The program will
be extended to Portugal, Brazil, Poland, the US and Canada in
2008.
In close cooperation with the Group’s industrial networks, the
University continued its work to structure and expand its industrial
training offering. It is concentrating on providing internal trainers
at the sites, within the context of training programs and working
groups focused on the Group’s tools and methodology. Employees
worldwide are continually schooled in the Faurecia Excellence
System (FES), through the FES school, signifi cantly enhancing
operational performance.
A SPECIFIC PROCESS FOR ANTICIPATING
FUTURE NEEDS
In 2007, the Group’s medium-term plan included an analysis of the
impact on human resources of changes in our operations.
This analysis was carried out for fi ve functions – production,
program, sales, R&D, and methods – in the six countries undergoing
the most rapid changes, namely France, Germany, Poland, the
Czech Republic, the United States and China.
This approach enables us to better leverage the individual skills and
experience acquired by our employees within the Group and, in
parallel, to effectively measure and forecast our requirements.
Faurecia is now in a better position to predict major changes in its
principal activities and to plan accordingly.
These changes include the ongoing development of industrial sites
in China, the US and, to an even greater extent, Mexico, as well
as operations in progress in new territories such as Russia, Iran
and India. The need for a worldwide R&D network is becoming
increasingly tangible, especially in the Mercosur, Asia, Eastern
Europe and North America regions. Expertise and production
methods also need to be consolidated in each product group.
Given the extremely vibrant nature of our business and the signifi cant
human resources challenges we face, our medium-term Business
Plan has become an important means for the Human Resources
department and General Management to plan and anticipate future
needs.
35Faurecia > 2007 Registration document
HUMAN RESOURCES 3Skills development
3.2.4 TALENT SOURCING
3.2.4.1 Attracting and retaining the necessary resources and skills
In 2007, the Group recruited a total of 1,617 managers and
professionals on permanent contracts worldwide. As projected,
the breakdown of new hires refl ects the Group’s sustained growth
in Eastern Europe, Asia and the United States, which represented
11%, 16% and 24% respectively of management and executive
recruits. The Talent Sourcing teams are focused primarily on China,
France, Germany, Poland, Slovakia, the Czech Republic and the
USA. Their goal is to signifi cantly increase the quantity and quality
of new hires through a range of measures such as developing
partnerships with target universities and business schools, creating
a panel of recruitment agencies, and encouraging employees to
put forward potential candidates from their own personal networks.
These initiatives should also help the Talent Sourcing department
to rein in recruitment expenditure.
Through all these measures, the Talent Sourcing team – in
conjunction with the Management Development network – plays
a key role in building up the Group’s talent pool and facilitates
internal mobility. The Group’s priority in this area is to attract,
promote and retain the best talent, through initiatives such as
recruiting graduates (42.5% of external recruitments in France)
from selected institutions (28% of graduate recruits in France), as
well as keeping down the number of external hires and providing
career opportunities to existing employees (60% of the internal
mobility fi gure in 2007).

36 Faurecia > 2007 Registration document
HUMAN RESOURCES3 Strengthening economic and social dialogue
3.3.1 A SLOWDOWN IN THE RELOCATION OF MANUFACTURING
FACILITIES AND EMPLOYEES
In 2007, the Group continued with the relocation measures needed
to maintain its competitive edge. These measures were more
targeted, however, and care was taken to ensure that all sites
continued to carry out enough business as to remain fi nancially
viable.
Relocation measures affected sixteen sites and approximately
1,800 jobs in 2007, primarily in Western Europe (33% in Spain,
25% in France and 14% in Germany).
Providing employee assistance and holding discussions with
employee representatives remained priorities for the Group:
anticipating change through employment and skills forecasting
and planning agreements;
•
restricting the number of redundancies by fi nding other positions
within the Group; and
reducing the impact of the redundancies that were necessary
by providing employees with outplacement assistance and
encouraging voluntary departures for employees who had found
alternative solutions.
In France in 2007, 32% of employees affected by job cuts found
another position within the Group and almost 60% found an
outplacement or alternative solution, either within the Group or
elsewhere, even before being notifi ed of their redundancy.
•
•
3.3.2 IN-DEPTH DISCUSSIONS WITH EMPLOYEE REPRESENTATIVES
The policy of consulting and negotiating with employee
representatives once again produced results in 2007, with
some 185 agreements signed in 18 countries (compared with
184 agreements in 2006 and 130 in 2005).
54% of these new agreements concerned salaries and benefi ts,
compared with 30% in 2006;
20% related to work organization (30% in 2006);
•
•
11% dealt with the employee-related aspects of restructuring
measures (13% in 2006); and
15% involved other issues (27% in 2005).
France accounted for 102 of these agreements, and Germany
for 38.
•
•
3.3.3 A LARGER AND STRONGER EUROPEAN WORKS COUNCIL
With the four-year founding agreement signed in 2003 about to
expire, the European Works Council reviewed its modus operandi
in 2007. Against a backdrop of consultation with offi cers of the
Works Council and the union expert, and in keeping with the
founding agreement, a new agreement was approved by the
European Works Council and signed on April 24, 2007. The
Council’s new 25-seat composition refl ects Romania’s accession
to the European Union.

37Faurecia > 2007 Registration document
HUMAN RESOURCES 3Strengthening economic and social dialogue
This new agreement grants additional resources to the employee
representatives of the FEW (Faurecia European Works Council).
These resources mainly concern the council bureau, tasked with
ensuring ongoing exchange and dialogue between management
and employees and with keeping all parties informed of events.
Under this agreement, the bureau will meet three times a year, and
meetings with General Management will be held on a quarterly
basis.
The Council now has increased responsibilities, and its new
composition has meant new members, with the Group’s six main
countries (France, Germany, Spain, Portugal, Poland and the
Czech Republic) now represented, instead of only four previously.
Additional translators and interpreters are provided as required,
such as during the Council’s preparatory meetings.
The role of the Council’s economic and union experts is subject
to stricter controls, and specifi c resources are granted. A specifi c
budget is allocated for training members of the Works Council.
Terms and conditions for renewing this new four-year agreement
have been set out.
3.3.4 CODE OF ETHICS
In 2004, Faurecia signed the United Nations Global Compact. By
so doing, it undertook to comply with and promote, in its corporate
practice, a set of values and principles based on international
texts and conventions on human rights, labor standards and the
environment.
Changes within the group, new requirements from our clients,
and new trends as regards corporate social responsibility and
sustainable development, have led the Group to draft a new
version of its Code of Ethics.
This Code defi nes the main rules of behavior that Faurecia
employees are expected to apply on a daily basis in their relations
with colleagues and clients alike. It is also used as a guide to make
employees more aware of their responsibilities and encourage
their empowerment. It includes a more stringent whistle-blowing
procedure enabling employees to report any violation of ethics
regulations. Employees can also report their suspicions through the
traditional internal channels. After consultation with the employee
representatives in the various countries, the Code of Ethics was
sent individually to each employee.
3.3.5 COMPENSATION AND BENEFITS
Total payroll costs for the Group, including social security charges,
remained stable at €2,103.6 million in 2007, compared with
€2,104.3 million in 2006, while headcount rose 3.4%.
The Group complies with minimum wage legislation in force in
each country. In most countries, salary increases and changes in
other components of compensation or benefi ts are determined on
the basis of negotiations. Such negotiations led to the signature of
more than 73 agreements within the Group in 2007.
The variable compensation system for personnel in key positions
applies in an identical manner to all eligible employees and is
common to all countries in which the Group has operations. It
is based chiefl y on reference to collective targets. At end-2007,
approximately 2,300 senior executives (out of a total of 10,200)
qualifi ed for this system.
In 2007, Faurecia drew up national policies concerning company
cars for the Czech Republic, Romania, Brazil and China, in
accordance with the corporate company car policy and in line with
practices in each market. These policies comply with the laws in
force in the countries in question. They also apply to all the Group’s
businesses in each country.
Employees’ social security benefi ts were enhanced in Brazil
and Slovakia. Work is ongoing in the USA and France on the
harmonization of healthcare and retirement policies, and a similar
project got off the ground in China.
A new approach to compensation was fl eshed out in 2007, with a
view to defi ning a total remuneration policy in line with the Group’s
objectives and forecast expansion in each of the countries in which
it has operations. This approach also takes account of the human
resources policies and practices applied by our competitors on
local markets. In 2007, policies were fi nalized in Slovakia and got
underway in China and Poland.
38 Faurecia > 2007 Registration document
HUMAN RESOURCES3 Employee incentive plans
3.4.1 VOLUNTARY GAIN-SHARING PLAN
(“ INTÉRESSEMENT”)
In 2007, four agreements were signed for a period of three
years. These follow on from agreements that expired. Numerous
supplemental agreements were signed in order to set half-yearly
performance indicators. All Faurecia’s French companies except
one are now covered by gain-sharing plans .
In accordance with the Group’s strategy, most of these agreements
contain the following provisions:
gain-sharing pay out on fulfi llment of objectives is capped at
6% of payroll, though in exceptional cases, if objectives are
exceeded, it may be raised to 8%;
gain-sharing pay out is calculated on the basis of two sets of
indicators:
business indicators at the level of the Company and its various
sites.
•
•
−
This represents approximately 40% of the global intéressement
and is calculated and paid every year,
progress indicators calculated at site level and selected from
among the Faurecia Excellence System (FES) indicators.
This represents approximately 60% of the global intéressement
and is calculated and paid every six months;
half of the gain-sharing allocation is proportional to salary and
half is applied uniformly across the board (depending on the
hours worked).
The agreements signed at the just-in-time (JIT) sites generally
accord greater signifi cance to progress indicators. For these sites,
intéressement is spread evenly across the board.
The Group paid out over €9 million in gain-sharing in respect
of 2007.
−
•
3.4.2 MANDATORY PROFIT-SHARING PLAN
(“ PARTICIPATION”)
The mandatory profi t-sharing agreements of the various Group
companies stipulate that employee profi t sharing calculated in
accordance with the legal formula is allocated among employees
pro rata to their compensation for the year in question, subject to
compliance with regulatory limits.
The amounts of profi t-sharing reserve may be invested either into
an escrow account or in the corporate mutual funds set up in
connection with the Group Employee Savings Plan (PEG).
The Group profi t-sharing for 2007, paid in 2008, is close to
€3 million.
3.4.3 GROUP EMPLOYEE SAVINGS PLAN
The Faurecia Group employee savings plan set up in 2004 offers
employees the chance to invest in a savings plan by purchasing
units in a corporate mutual fund. The Group savings plan may be
funded by securities.
Since 2006, it may also be funded by real property, increasing the
number of investment options available to employees to fourteen.
The Group savings plan may be funded by the payment of the
amounts allocated in respect of gain sharing in profi t sharing plans ,
as well as voluntary contributions made by employees.
Since 2004, voluntary contributions to the “Faurecia Actionnariat”
corporate mutual fund, comprised only of Faurecia shares, have
been entitled to a Company match.
The total amount invested in the corporate mutual funds remained
stable, at €30 million. Over the last two years, however, the total
amount of gain-sharing invested in the employee savings plan
has increased, and voluntary savings and company match have
decreased.
Some €4.5 million has been invested in the savings plan since it
was set up in 2004.
39Faurecia > 2007 Registration document
HUMAN RESOURCES 3Employee incentive plans
3.4.4 STOCK OPTIONS
Faurecia has put in place stock option schemes with a view to
motivating and retaining its senior executives. These schemes are
governed by a strict allocation procedure, set out at the Board of
Directors meeting of February 6, 2003.
The Board of Directors decides upon the principle of granting
stock subscription or purchase options once a year, during the
Board Meeting held in February. The list of benefi ciaries, the
number of options granted to each benefi ciary and the price of
the options – which is based on the average of the opening prices
quoted for the Company’s shares over the twenty trading days
preceding the effective date of grant – are determined in April, at
the Board Meeting which issues the notice of the Annual General
Meeting.
A total of 1,258,303 stock subscription options were outstanding
at December 31, 2007.
The Ordinary and Extraordinary Shareholders’ Meeting of
May 29, 2007 gave the Board of Directors a 38-month authorization
to grant, on one or several occasions, a maximum of 600,000 stock
subscription options to the management and employees of
Group companies and of subsidiaries of which Faurecia holds
more than 50%.
Each option is exercisable for one common share under the terms
and conditions set out below. No other securities exist giving direct
or indirect access to the Company’s capital.
Between 1999 and 2001, the Group granted stock purchase
options to the management of Group companies and of subsidiaries
of which it held more than 50%, allowing them to purchase existing
Faurecia shares. At December 31, 2007, a total of 260,980 stock
purchase options were outstanding.
Details of the stock option plans can be found on page 182 of this
registration document.
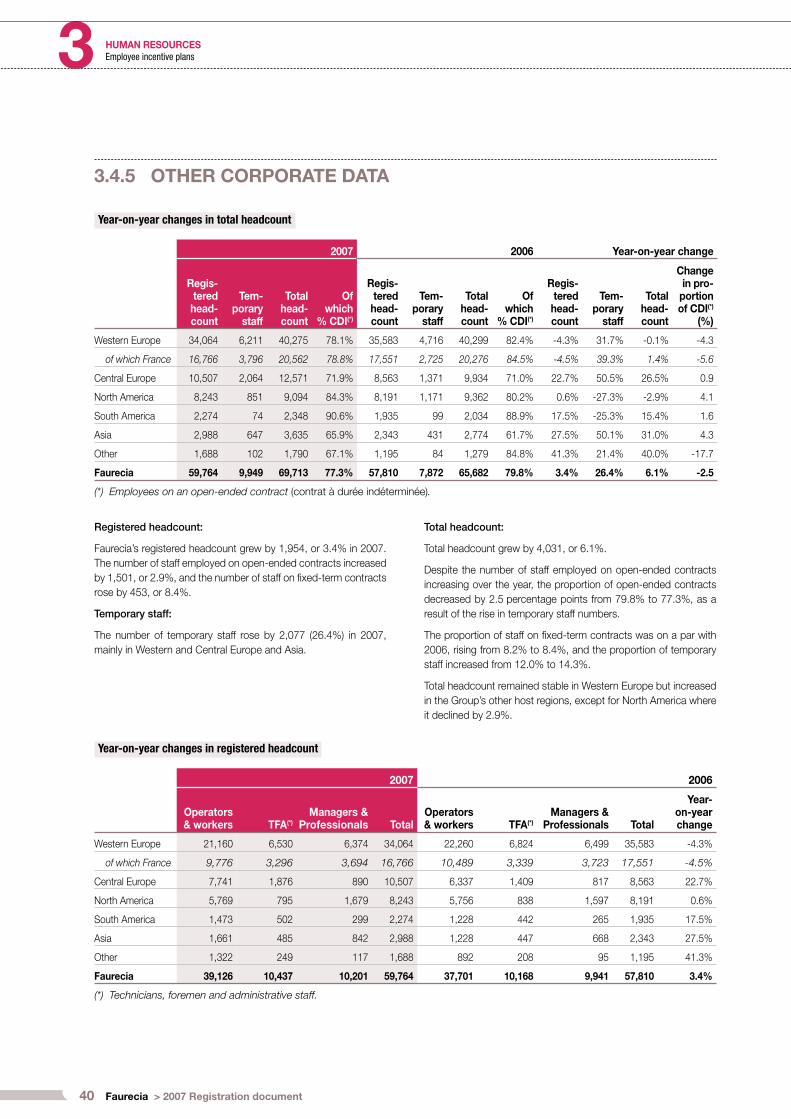
40 Faurecia > 2007 Registration document
HUMAN RESOURCES3 Employee incentive plans
3.4.5 OTHER CORPORATE DATA
Year-on-year changes in total headcount
2007 2006 Year-on-year change
Regis-tered head-count
Tem-porary
staff
Total head-count
Of which
% CDI(*)
Regis-tered head-count
Tem-porary
staff
Total head-count
Of which
% CDI(*)
Regis-tered head-count
Tem-porary
staff
Total head-count
Change in pro-
portion of CDI(*)
(%)
Western Europe 34,064 6,211 40,275 78.1% 35,583 4,716 40,299 82.4% -4.3% 31.7% -0.1% -4.3
of which France 16,766 3,796 20,562 78.8% 17,551 2,725 20,276 84.5% -4.5% 39.3% 1.4% -5.6
Central Europe 10,507 2,064 12,571 71.9% 8,563 1,371 9,934 71.0% 22.7% 50.5% 26.5% 0.9
North America 8,243 851 9,094 84.3% 8,191 1,171 9,362 80.2% 0.6% -27.3% -2.9% 4.1
South America 2,274 74 2,348 90.6% 1,935 99 2,034 88.9% 17.5% -25.3% 15.4% 1.6
Asia 2,988 647 3,635 65.9% 2,343 431 2,774 61.7% 27.5% 50.1% 31.0% 4.3
Other 1,688 102 1,790 67.1% 1,195 84 1,279 84.8% 41.3% 21.4% 40.0% -17.7
Faurecia 59,764 9,949 69,713 77.3% 57,810 7,872 65,682 79.8% 3.4% 26.4% 6.1% -2.5
(*) Employees on an open-ended contract (contrat à durée indéterminée).
Registered headcount:
Faurecia’s registered headcount grew by 1,954, or 3.4% in 2007.
The number of staff employed on open-ended contracts increased
by 1,501, or 2.9%, and the number of staff on fi xed-term contracts
rose by 453, or 8.4%.
Temporary staff:
The number of temporary staff rose by 2,077 (26.4%) in 2007,
mainly in Western and Central Europe and Asia.
Total headcount:
Total headcount grew by 4,031, or 6.1%.
Despite the number of staff employed on open-ended contracts
increasing over the year, the proportion of open-ended contracts
decreased by 2.5 percentage points from 79.8% to 77.3%, as a
result of the rise in temporary staff numbers.
The proportion of staff on fi xed-term contracts was on a par with
2006, rising from 8.2% to 8.4%, and the proportion of temporary
staff increased from 12.0% to 14.3%.
Total headcount remained stable in Western Europe but increased
in the Group’s other host regions, except for North America where
it declined by 2.9%.
Year-on-year changes in registered headcount
2007 2006
Operators & workers TFA(*)
Managers & Professionals Total
Operators & workers TFA(*)
Managers & Professionals Total
Year-on-year change
Western Europe 21,160 6,530 6,374 34,064 22,260 6,824 6,499 35,583 -4.3%
of which France 9,776 3,296 3,694 16,766 10,489 3,339 3,723 17,551 -4.5%
Central Europe 7,741 1,876 890 10,507 6,337 1,409 817 8,563 22.7%
North America 5,769 795 1,679 8,243 5,756 838 1,597 8,191 0.6%
South America 1,473 502 299 2,274 1,228 442 265 1,935 17.5%
Asia 1,661 485 842 2,988 1,228 447 668 2,343 27.5%
Other 1,322 249 117 1,688 892 208 95 1,195 41.3%
Faurecia 39,126 10,437 10,201 59,764 37,701 10,168 9,941 57,810 3.4%
(*) Technicians, foremen and administrative staff.
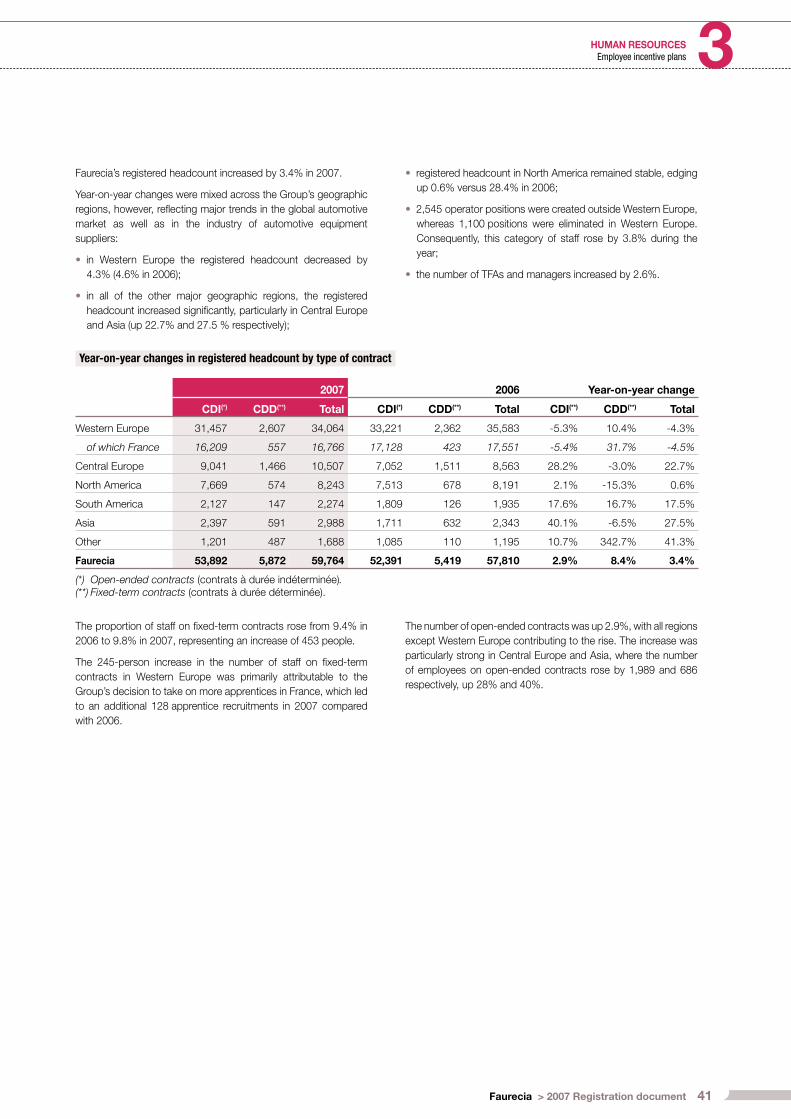
41Faurecia > 2007 Registration document
HUMAN RESOURCES 3Employee incentive plans
Faurecia’s registered headcount increased by 3.4% in 2007.
Year-on-year changes were mixed across the Group’s geographic
regions, however, refl ecting major trends in the global automotive
market as well as in the industry of automotive equipment
suppliers:
in Western Europe the registered headcount decreased by
4.3% (4.6% in 2006);
in all of the other major geographic regions, the registered
headcount increased signifi cantly, particularly in Central Europe
and Asia (up 22.7% and 27.5 % respectively);
•
•
registered headcount in North America remained stable, edging
up 0.6% versus 28.4% in 2006;
2,545 operator positions were created outside Western Europe,
whereas 1,100 positions were eliminated in Western Europe.
Consequently, this category of staff rose by 3.8% during the
year;
the number of TFAs and managers increased by 2.6%.
•
•
•
Year-on-year changes in registered headcount by type of contract
2007 2006 Year-on-year change
CDI(*) CDD(**) Total CDI(*) CDD(**) Total CDI(**) CDD(**) Total
Western Europe 31,457 2,607 34,064 33,221 2,362 35,583 -5.3% 10.4% -4.3%
of which France 16,209 557 16,766 17,128 423 17,551 -5.4% 31.7% -4.5%
Central Europe 9,041 1,466 10,507 7,052 1,511 8,563 28.2% -3.0% 22.7%
North America 7,669 574 8,243 7,513 678 8,191 2.1% -15.3% 0.6%
South America 2,127 147 2,274 1,809 126 1,935 17.6% 16.7% 17.5%
Asia 2,397 591 2,988 1,711 632 2,343 40.1% -6.5% 27.5%
Other 1,201 487 1,688 1,085 110 1,195 10.7% 342.7% 41.3%
Faurecia 53,892 5,872 59,764 52,391 5,419 57,810 2.9% 8.4% 3.4%
(*) Open-ended contracts (contrats à durée indéterminée).(**) Fixed-term contracts (contrats à durée déterminée).
The proportion of staff on fi xed-term contracts rose from 9.4% in
2006 to 9.8% in 2007, representing an increase of 453 people.
The 245-person increase in the number of staff on fi xed-term
contracts in Western Europe was primarily attributable to the
Group’s decision to take on more apprentices in France, which led
to an additional 128 apprentice recruitments in 2007 compared
with 2006.
The number of open-ended contracts was up 2.9%, with all regions
except Western Europe contributing to the rise. The increase was
particularly strong in Central Europe and Asia, where the number
of employees on open-ended contracts rose by 1,989 and 686
respectively, up 28% and 40%.
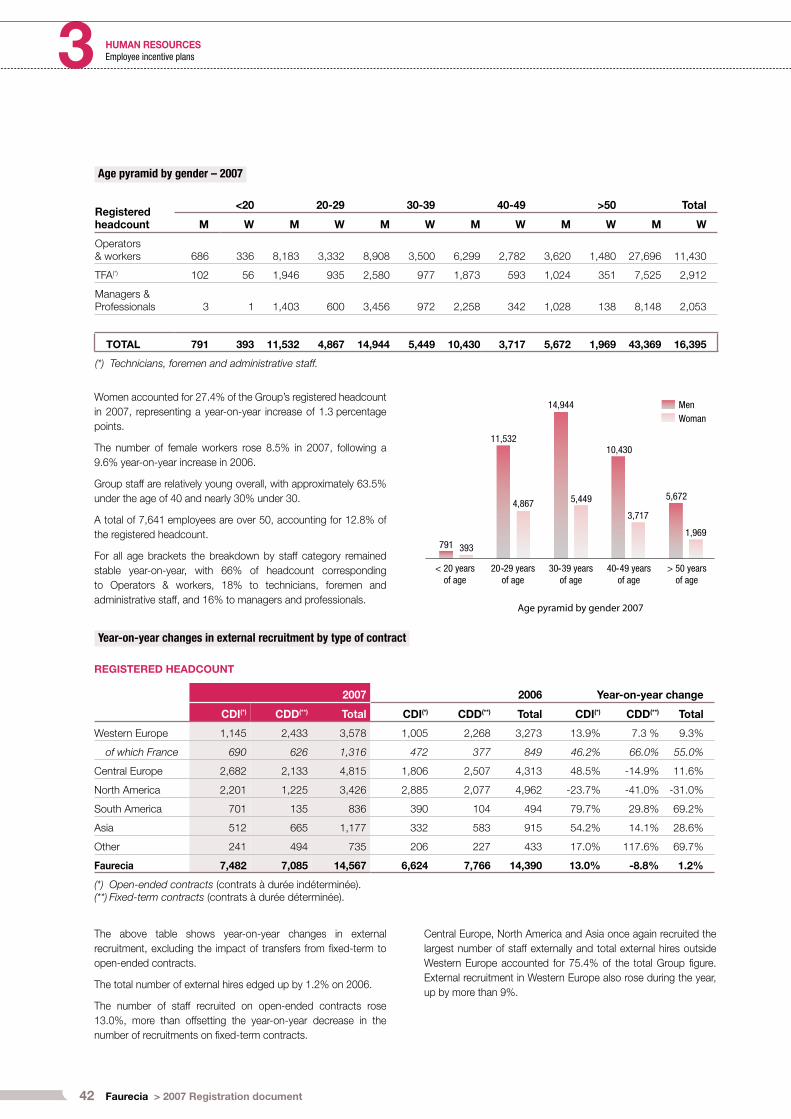
42 Faurecia > 2007 Registration document
HUMAN RESOURCES3 Employee incentive plans
Age pyramid by gender – 2007
Registered headcount
<20 20-29 30-39 40-49 >50 Total
M W M W M W M W M W M W
Operators & workers 686 336 8,183 3,332 8,908 3,500 6,299 2,782 3,620 1,480 27,696 11,430
TFA(*) 102 56 1,946 935 2,580 977 1,873 593 1,024 351 7,525 2,912
Managers & Professionals 3 1 1,403 600 3,456 972 2,258 342 1,028 138 8,148 2,053
TOTAL 791 393 11,532 4,867 14,944 5,449 10,430 3,717 5,672 1,969 43,369 16,395
(*) Technicians, foremen and administrative staff.
Women accounted for 27.4% of the Group’s registered headcount
in 2007, representing a year-on-year increase of 1.3 percentage
points.
The number of female workers rose 8.5% in 2007, following a
9.6% year-on-year increase in 2006.
Group staff are relatively young overall, with approximately 63.5%
under the age of 40 and nearly 30% under 30.
A total of 7,641 employees are over 50, accounting for 12.8% of
the registered headcount.
For all age brackets the breakdown by staff category remained
stable year-on-year, with 66% of headcount corresponding
to Operators & workers, 18% to technicians, foremen and
administrative staff, and 16% to managers and professionals.
Year-on-year changes in external recruitment by type of contract
REGISTERED HEADCOUNT
2007 2006 Year-on-year change
CDI(*) CDD(**) Total CDI(*) CDD(**) Total CDI(*) CDD(**) Total
Western Europe 1,145 2,433 3,578 1,005 2,268 3,273 13.9% 7.3 % 9.3%
of which France 690 626 1,316 472 377 849 46.2% 66.0% 55.0%
Central Europe 2,682 2,133 4,815 1,806 2,507 4,313 48.5% -14.9% 11.6%
North America 2,201 1,225 3,426 2,885 2,077 4,962 -23.7% -41.0% -31.0%
South America 701 135 836 390 104 494 79.7% 29.8% 69.2%
Asia 512 665 1,177 332 583 915 54.2% 14.1% 28.6%
Other 241 494 735 206 227 433 17.0% 117.6% 69.7%
Faurecia 7,482 7,085 14,567 6,624 7,766 14,390 13.0% -8.8% 1.2%
(*) Open-ended contracts (contrats à durée indéterminée).(**) Fixed-term contracts (contrats à durée déterminée).
The above table shows year-on-year changes in external
recruitment, excluding the impact of transfers from fi xed-term to
open-ended contracts.
The total number of external hires edged up by 1.2% on 2006.
The number of staff recruited on open-ended contracts rose
13.0%, more than offsetting the year-on-year decrease in the
number of recruitments on fi xed-term contracts.
Central Europe, North America and Asia once again recruited the
largest number of staff externally and total external hires outside
Western Europe accounted for 75.4% of the total Group fi gure.
External recruitment in Western Europe also rose during the year,
up by more than 9%.

43Faurecia > 2007 Registration document
HUMAN RESOURCES 3Employee incentive plans
Year-on-year changes in external recruitment by staff category
REGISTERED HEADCOUNT
2007 2006
Operators & workers TFA(*)
Managers & Professionals Total
Operators & workers TFA(*)
Managers & Professionals Total
Western Europe 2,041 771 766 3,578 2,127 541 605 3,273
of which France 408 409 499 1 316 202 219 428 849
Central Europe 3,959 701 155 4,815 3,516 540 257 4,313
North America 2,810 230 386 3,426 4,097 362 503 4,962
South America 537 222 77 836 249 184 61 494
Asia 736 175 266 1,177 528 183 204 915
Other 665 47 23 735 374 39 20 433
Faurecia 10,748 2,146 1,673 14,567 10,981 1,849 1,650 14,390
(*) Technicians, foremen and administrative staff.
During the year, o perators & workers accounted for 74% of
external hires, TFAs for 15% and managers & professionals for
11%, compared with 76%, 13% and 11% respectively in 2006.
Hires of technicians and foremen rose 16%, while external
recruitment of managers edged up 1.4% and hires of o perators &
workers retreated 1.3%.
External hires by socio-economic category vary depending on
the geographic region concerned as different areas have different
recruitment profi les.
Transfers from fi xed-term to open-ended contracts – year-on-year comparison
REGISTERED HEADCOUNT
2007 2006
Operators & workers TFA(*)
Managers & Professionals Total
Operators & workers TFA(*)
Managers & Professionals Total
Western Europe 343 73 70 486 692 96 68 856
of which France 16 8 28 52 15 10 30 55
Central Europe 1,056 200 64 1,320 1,952 339 74 2,365
North America 414 36 7 457 711 55 24 790
South America 0 31 0 31 0 16 0 16
Asia 380 52 9 441 513 222 325 1,060
Other 37 4 0 41 145 8 1 154
Faurecia 2,230 396 150 2,776 4,013 736 492 5,241
(*) Technicians, foremen and administrative staff.
The number of transfers from fi xed-term to open-ended contracts
decreased 57% year-on-year. However, the fi gure for 2006 was
particularly high as it included the impact of Faurecia’s decision to
record all fi xed-term contracts of over two years as open-ended
contracts within the Group.
Compared with 2005, when total transfers came to 1,882, the
number of fi xed-term contracts switched to open-ended contracts
increased by 48% across the Group in 2007.

44 Faurecia > 2007 Registration document
HUMAN RESOURCES3 Employee incentive plans
Departures (broken down by reason) – year-on-year comparison
REGISTERED HEADCOUNT
2007 2006
Resi-gnations
(open-ended
contracts)
Individual redun-
dancies
Collective redun-
dancies Other Total
Resi-gnations
(open-ended
contracts)
Individual redun-
dancies
Collective redun-
dancies Other Total
Western Europe 1,238 905 1,052 1,737 4,932 1,077 1,118 945 1,689 4,829
of which France 521 433 496 495 1,945 420 485 465 551 1,921
Central Europe 1,250 914 102 596 2,862 960 460 1 801 2,222
North America 1,009 1,587 33 736 3,365 928 1,267 30 946 3,171
South America 137 280 4 79 500 69 321 0 64 454
Asia 220 98 5 222 545 148 80 69 235 532
Other 80 79 0 253 412 113 40 0 207 360
Faurecia 3,934 3,863 1,196 3,623(*) 12,616 3,295 3,286 1,045 3,942 11,568
(*) Of which 3,229 on expiry of fixed-term contracts.
The number of employees who left the Group in 2007 totaled
12,616 against 11,568 the previous year, representing an increase
of 9%.
Of these departures, 26% corresponded to the expiry of fi xed-term
contracts while resignations and individual redundancies each
represented almost 31%.
The number of collective redundancies once again refl ected the
Group’s restructuring operations in both Western and Central
Europe.
Training hours – year-on-year comparison
2007 2006
Total training hours
Training hours per employee
Total training hours
Training hours per employee
Western Europe 725,308 23 695,767 21
of which France 349,081 23 292,227 18
Central Europe 341,399 38 392,359 54
North America 160,837 21 197,429 28
South America 55,411 30 56,136 33
Asia 109,801 42 85,904 42
Other 42,214 32 37,155 32
Faurecia 1,434,970 26 1,464,750 28
The average number of training hours per employee came to 26 in
2007 compared with 28 the previous year. This decrease refl ects
a slowdown in training programs in North America and Central
Europe following the signifi cant amounts invested in these regions
in 2006. Conversely, there was a major focus on training in Western
Europe during the period, particularly in France, in order to raise
the overall number of hours from the 2006 level. Consequently, the
average number of training hours for Western European employees
increased from 21 to 23, with the fi gure for France up almost 28%
from 18 to 23.
Group policy is to signifi cantly increase the training available for all
staff categories, especially for site operators.

45Faurecia > 2007 Registration document
HUMAN RESOURCES 3Employee incentive plans
Expatriates by destination – year-on-year comparison
2007 2006
Western Europe 75 81
of which France 29 34
Central Europe 53 57
North America 45 60
South America 7 4
Asia 61 52
Other 12 12
Faurecia 253 266
The steady high levels of expatriate numbers and their widely diverse nationalities refl ect the Group’s international expansion policy. During
2007 there was a 17% increase in expatriates to Asia.
Disabled employees – year-on-year comparison
2007 2006
Western Europe 999 1,048
of which France 671 712
Central Europe 19 13
North America 8 9
South America 14 12
Asia 18 0
Other 12 12
Faurecia 1,070 1,094
Faurecia employs some 1,000 disabled people in Western
Europe.
The criteria used to defi ne disabled employees are those set down
in the legislation of each country. In Western Europe – particularly
France – such legislation tends to favor a more proactive approach
than in other countries.
The decrease in the number of disabled employees in Western
Europe in 2007 refl ects the overall reduction in staff numbers in
that region.
The proportion of disabled employees in France was more or less
unchanged from 2006, representing 4.0 % of the country’s total
headcount.
Work schedules in 2007
REGISTERED HEADCOUNT
Two 8-hr shifts Three 8-hr shifts Weekend(1) Other Total
Western Europe 11,179 7,705 199 14,981 34,064
of which France 6,504 2,247 159 7,856 16,766
Central Europe 1,527 6,619 156 2,205 10,507
North America 1,678 2,726 95 3,744 8,243
South America 213 1,338 0 723 2,274
Asia 993 400 46 1,549 2,988
Other 867 459 0 362 1,688
Faurecia 16,457 19,247 496 23,564 59,764
(1) Reduced weekend hours.
Staff work schedules within the Group are aimed at meeting customer needs, based on production capacity at our sites. Shift work and
weekend work mainly concern the production sites and together account for 60.6% of the Group’s registered headcount.

46 Faurecia > 2007 Registration document
HUMAN RESOURCES3 Employee incentive plans
Part-time staff – year-on-year comparison
Part-time staff – 2007
Part-time staff – 2006
Western Europe 611 624
of which France 373 395
Central Europe 13 2
North America 0 0
South America 0 0
Asia 0 0
Other 0 0
Faurecia 624 626
Substantially all of the Group’s part-time employment contracts are in Western Europe, particularly France.
Part-time staff accounted for 3.7% of the Group’s total registered headcount in France in 2007, versus 2.2% in 2006.
Overtime – year-on-year comparison
2007 2006
Overtime(in hours) % hours worked
Overtime(in hours) % hours worked
Western Europe 1,133,869 1.9% 1,041,643 1.7%
of which France 314,314 1.1% 288,237 1.0%
Central Europe 1,345,215 7.4% 1,011,732 7.0%
North America 1,698,270 10.1% 1,672,647 11.1%
South America 283,418 8.5% 206,096 6.6%
Asia 847,156 15.0% 655,973 14.6%
Other 264,081 8.5% 239,708 9.1%
Faurecia 5,572,008 5.3% 4,827,798 4.7%
Overtime hours are set in accordance with the legislation of each country.
The 0.6 point rise in overtime as a proportion of total hours worked mainly stemmed from increases in Central Europe (0.4 point) and Asia
(0.4 point).
Absenteeism – year-on-year comparison
Absenteeism rate – 2007
Absenteeism rate – 2006
Western Europe 3.6% 3.4%
of which France 3.4% 3.3%
Central Europe 3.9% 3.2%
North America 1.9% 1.8%
South America 2.2% 2.4%
Asia 0.5% 0.7%
Other 3.0% 3.4%
Faurecia 3.2% 3.0%
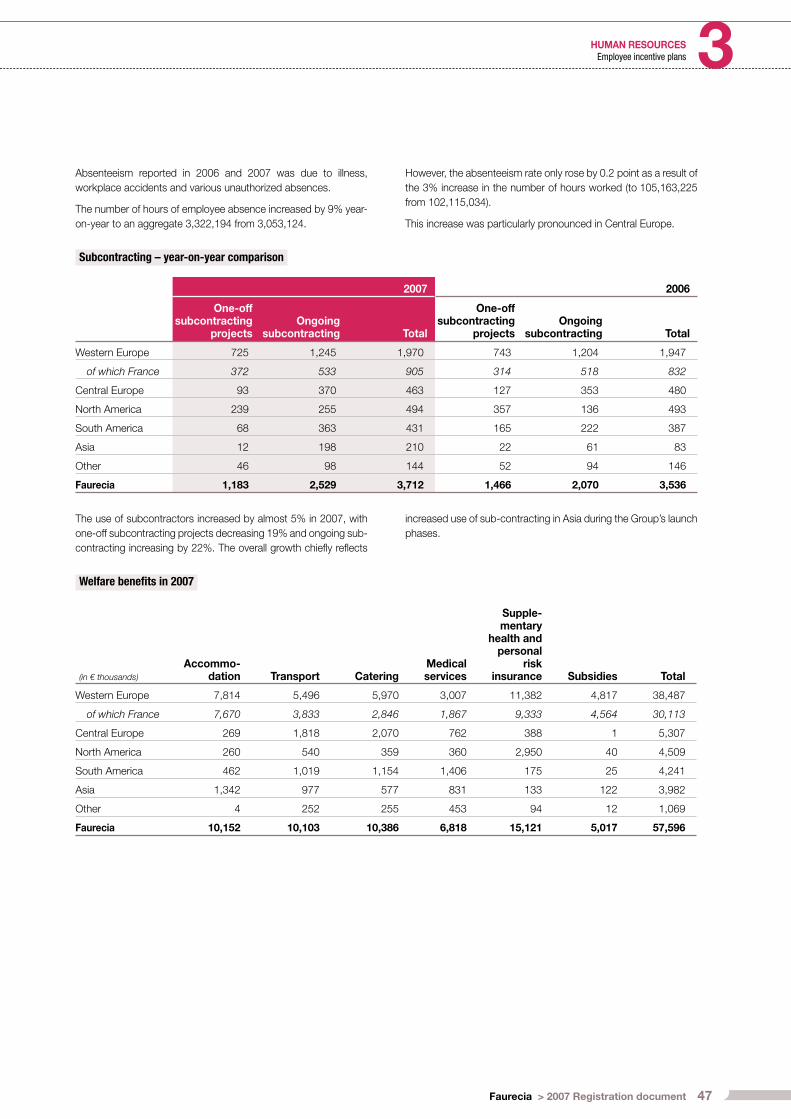
47Faurecia > 2007 Registration document
HUMAN RESOURCES 3Employee incentive plans
Absenteeism reported in 2006 and 2007 was due to illness,
workplace accidents and various unauthorized absences.
The number of hours of employee absence increased by 9% year-
on-year to an aggregate 3,322,194 from 3,053,124.
However, the absenteeism rate only rose by 0.2 point as a result of
the 3% increase in the number of hours worked (to 105,163,225
from 102,115,034).
This increase was particularly pronounced in Central Europe.
Subcontracting – year-on-year comparison
2007 2006
One-off subcontracting
projectsOngoing
subcontracting Total
One-off subcontracting
projectsOngoing
subcontracting Total
Western Europe 725 1,245 1,970 743 1,204 1,947
of which France 372 533 905 314 518 832
Central Europe 93 370 463 127 353 480
North America 239 255 494 357 136 493
South America 68 363 431 165 222 387
Asia 12 198 210 22 61 83
Other 46 98 144 52 94 146
Faurecia 1,183 2,529 3,712 1,466 2,070 3,536
The use of subcontractors increased by almost 5% in 2007, with
one-off subcontracting projects decreasing 19% and ongoing sub-
contracting increasing by 22%. The overall growth chiefl y refl ects
increased use of sub-contracting in Asia during the Group’s launch
phases.
Welfare benefi ts in 2007
(in € thousands)
Accommo-dation Transport Catering
Medical services
Supple-mentary
health and personal
risk insurance Subsidies Total
Western Europe 7,814 5,496 5,970 3,007 11,382 4,817 38,487
of which France 7,670 3,833 2,846 1,867 9,333 4,564 30,113
Central Europe 269 1,818 2,070 762 388 1 5,307
North America 260 540 359 360 2,950 40 4,509
South America 462 1,019 1,154 1,406 175 25 4,241
Asia 1,342 977 577 831 133 122 3,982
Other 4 252 255 453 94 12 1,069
Faurecia 10,152 10,103 10,386 6,818 15,121 5,017 57,596
48 Faurecia > 2007 Registration document
HUMAN RESOURCES3

4ENVIRONMENT
Faurecia > 2007 Registration document 49
CONTENTS
4.1 Faurecia’s products and the environment 51
4.1.1 Product design 51
4.1.2 Decreasing the weight of products 51
4.1.3 Recycling initiatives 52
4.1.4 Use of natural materials 53
4.1.5 Supplier management 53
4.2 Faurecia’s manufacturing sites and the environment 54
4.2.1 Environmental protection improvement initiatives 54
4.2.2 Certifi cation and training 54
4.2.3 Environmental indicators 55
Water consumption and wastewater discharges 55
Energy consumption and atmospheric emissions 56
Use of ground surfaces (watertight surfaces and total surfaces) 56
Waste generation 57
Other environmental indicators 57
50 Faurecia > 2007 Registration document
ENVIRONMENT4
Against a background of well-established regulations, Faurecia
now boasts health, safety, environment, eco-design and regulatory
monitoring teams which, at Group, business, or site level are
tasked with identifying environmental and regulatory risks. These
teams analyze the impact of the various regulations and suggest
ways of ensuring that products are compliant. Close collaboration
with suppliers and strict controls as regards components delivered
and purchasing procedures also enable the Group to ensure the
compliance of parts received.
Faurecia is therefore compliant with current regulations on the
elimination of heavy metals and is now concentrating on the
elimination of lead from self-lubricating rings.
Material and substance reporting is ongoing, with a view to
ensuring constructor compliance with the future recycling section
of the approval phase, due to take effect on December 1, 2008 for
new vehicles.

51Faurecia > 2007 Registration document
ENVIRONMENT 4Faurecia products and the environment
From the product design phase, and in the technical expertise it
provides to automakers, Faurecia’s environment and sustainable
development policy covers three main issues:
decreasing the weight of components;•
developing recycling initiatives, such as anticipating the end-of-
life phase and optimizing waste and recycled plastic reuse;
stepping up the use of natural materials.
•
•
4.1.2 DECREASING THE WEIGHT OF PRODUCTS
Vehicle weight has become one of the automotive industry’s primary
concerns. CO2 emissions regulations are becoming increasingly
rigorous, and various tax incentives and sanctions are starting to
kick in. In such a climate, weight reduction is seen as a signifi cant
way for a company to stand out from its competitors.
Such developments are of particular importance for Faurecia for
several reasons:
Faurecia products account for a very signifi cant proportion of a
vehicle’s overall weight (15% to 20% for all Faurecia modules
together);
extensive vertical integration allows Faurecia the scope to work
on materials, components and product assembly.
Developments have been structured around various complementary
approaches:
continuous improvement (“Kaizen”) of existing components,
representing weight reductions of 5% to 10%, applies to most
of our products. Designing components in accordance with lean
production principles is of particular importance here;
•
•
•
new materials such as high-elastic-limit steel give weight savings
of around 10% on seat structures, cockpit crossmembers, or
multilayered compounds for improved soundproofi ng;
new product architectures with higher integration rates bring door
module weights down by 3 kg to 4 kg per vehicle. The Inpamo
system combines structure and instrument panel to achieve a
12% weight saving;
standard profi les and new assembly methods, such as a laser
welding technique for assembling metal parts without adding
extra material, bring weight reductions of 10%;
new technologies such as the Fiber Molding Process (FMP)
have resulted in a 30% weight saving in the manufacture of felt
acoustic components.
•
•
•
•
Faurecia takes environmental issues into account at every stage
in the product life cycle, from design to end-of-life. Dealings with
suppliers and the impact of production sites on the ecosystem are
also of concern to the Group.
4.1.1 PRODUCT DESIGN
52 Faurecia > 2007 Registration document
ENVIRONMENT4 Faurecia products and the environment
4.1.3 RECYCLING INITIATIVES
4.1.3.1 Optimizing use of production waste
In the interests of limiting the environmental impact of its
manufacturing activities, Faurecia has set itself ambitious objectives
on the reuse of production waste and scrap. The Group is particularly
anxious to avoid landfi ll disposal.
Total production waste recycled in 2007 by the Acoustics Division
increased by 16%, reaching an overall recovery rate of 43% by
weight. These efforts are set to continue, with a target of 70%
by 2009.
4.1.3.2 Preparing for end-of-life phase
Under increasingly strict regulations, automakers are making ever
more stringent demands on their equipment suppliers in terms
of recycling end-of-life products. All of Faurecia’s businesses
are concerned by these obligations and, depending on the
characteristics of the component in question, have implemented
plans or solutions to ensure that end-of-life products will be
processed as effi ciently as possible in the future.
For Renault, Faurecia’s Automotive Seating division applied eco-
design rules to the seat padding used in the recent Laguna III. The
padding was developed by examining the removal of foams, the
separation of materials and the chemical compatibility of the various
plastic components. This has enabled Faurecia to anticipate end-
of-life phases such as dismantling and crushing, contributing to the
new Laguna’s compliance with European regulations.
In 2007, the Instrument Panels business launched a study to
assess each of the processing stages involved in a vehicle’s
end-of-life phase. This study was carried out in conjunction with
other industry players and recycling companies. Until now, these
components were crushed at the same time as the vehicle’s frame,
and the plastics could not be recycled. The objective, therefore, is
to determine the feasibility of current processes.
The same type of approach has been adopted for bumpers. This will
be a priority area for Faurecia as it does not have a unit dedicated to
recycling bumpers. The aim of the process is to extend the use of
the materials concerned for as long as possible, to the point where
bumper materials can be recycled from one generation of vehicles
to another without any loss in product functionality. The outcome
of the Group’s research should enable its teams to draw up an
economic and technical model that is most suited to Faurecia for
recycling end-of-life bumpers.
4.1.3.3 Use of recycled plastic
Rarely used in vehicle interiors until now, recycled materials are
increasingly present in new car models. Faurecia is contributing to
these changes, in particular within the Vehicle Interior business, by
offering a growing number of parts made from recycled plastic –
mainly polypropylene (talc-charged or not), or recycled polyolefi n
grades. In the long-term, the tests and validations resulting from
this research should enable the Group to incorporate these
materials into the design of several non-visible instrument panel
components.
Depending on the type and category of the vehicle, various
automotive seating components are now made of recycled
polypropylene. Recycled plastics add up to around three kilograms
across Faurecia Automotive seating components alone. Tests are
in progress to develop new applications, particularly for vehicle
interior parts that are not highly visible. And Faurecia is maximizing
the incorporation of recycled natural fi bers (cotton, in the main) in its
vehicle soundproofi ng systems.
53Faurecia > 2007 Registration document
ENVIRONMENT 4Faurecia products and the environment
4.1.4 USE OF NATURAL MATERIALS
New car models are also using more and more natural materials
and fi bers. In anticipation of the trend, Faurecia invested in this
area and can offer its customers a range of solutions made from
recycled materials.
4.1.4.1 Natural fi bers and composites
Faurecia designs and manufactures door panels using composite
materials that combine wood fi bers with polyolefi n or polyester.
These materials contain 63% to 73% of natural fi bers. Instrument
panels are also produced combining linen fi bers and a polypropylene
matrix. These use 40% to 60% natural fi bers, depending on the
mechanical properties required. The use of natural fi bers as
reinforcement in plastic parts brings weight savings of between
25% and 30%. The use of these materials makes the Group less
dependent on oil, the price of which is currently spiraling, and allows
it to reduce its overall environmental footprint. Wood and linen are
entirely renewable and locally available, and require much less start-
up energy than alternative solutions, such as glass fi bers. Faurecia
is one of the few automotive equipment suppliers in the world to
have developed such materials, which are used in both premium
vehicles and volume-production models such as the Citroën C4,
Toyota Corolla and Avensis, Audi A4, Ford C-Max and Volvo C70
Coupé (wood fi bers), and the Opel Astra and SmartForTwo (linen).
4.1.4.2 Biomat
In 2007, Faurecia started research into the replacement of materials
derived from fossil resources with materials derived from fully
renewable resources. Although some solutions do already exist,
none have been able to meet the automotive market’s requirements
in terms of economic positioning or technical feasibility.
Faurecia’s aim is to develop a biopolymer for specifi c vehicle interior
applications, such as inserts, air ducts and trims. These are technical
materials, which meet signifi cant technical requirements in terms
of safety, regulations, thermal resistance, dynamic fatigue, odors,
VOC, etc. They are transformed using traditional, low-investment
processes, and the price per kilogram remains competitive
compared to more conventional materials. This research should
eventually result in an industrial application with high volumes of
materials derived from renewable resources, such as linen, hemp,
cereal, beet and corn.
This project has been earmarked by the Pôle de Compétitivité
Industrie Agro-Ressources, an agro-industry regional business
cluster whose objectives include whole-plant utilization, and, more
generally, sustainable development and respect for the environment.
The production of these materials is forecast for 2010.
4.1.5 SUPPLIER MANAGEMENT
Faurecia’s components purchasing policy continued to evolve
in order to factor in environmental protection at every step in the
product supply chain. Since July 1, 2007, the Group has been
requesting its main suppliers to comply with Faurecia’s corporate
social responsibility and environmental requirements. These
requirements mainly concern compliance with various regulations,
including those on health and safety in the workplace, certifi cation
of the environmental management system (e.g., ISO 14001), the
development of eco-friendly products and a ban on prohibited
products and substances. By the end of 2007, over 180 suppliers
had signed up to these requirements. This request follows on from
the initiative started in 2006, concerning ISO 14001 certifi cation for
the Group’s 400 largest outside suppliers in terms of revenues. By
end-2007, over 60% of suppliers had obtained this certifi cation.
In October 2007, specifi c action was taken with respect to the
implementation of the REACh directive, aimed at all suppliers
providing Faurecia with chemical products or articles containing
chemical substances intended to be released. In accordance with
the recommendations of various automotive industry committees
and working groups, of which it is a member, Faurecia ensures
that suppliers are aware of the directive’s requirements in terms of
registration, evaluation and authorization, and, where applicable,
makes allowance for the withdrawal of some of these substances
from the market.

54 Faurecia > 2007 Registration document
ENVIRONMENT4 Faurecia’s manufacturing sites and the environment
4.2.1 ENVIRONMENTAL PROTECTION IMPROVEMENT INITIATIVES
To limit the impact of its industrial activities on the natural
environment surrounding its sites, in particular in terms of the
emission of hazardous substances into the air and water and the
generation of greenhouse gas emissions, Faurecia has continued to
introduce pollution abatement equipment for use at the end of the
manufacturing process in order to reduce the quantity and harmful
effects of emissions. For example, the Etupes site has changed
the cooling process for its injection presses, which has helped
to reduce energy consumption. The Audincourt site changed the
primer applied to bumpers for a water-soluble product. Other
sites have swapped traditional adhesives for aqueous adhesives,
helping to reduce VOC emissions. Finally, optimizing logistics fl ows
and curtailing the time slots for heavy goods deliveries has allowed
the Group to limit noise pollution around certain sites. The Group’s
sites invested a total of €4.6 million in environmental protection
measures in 2007. This included bringing existing installations into
compliance with regulations.
4.2.2 CERTIFICATION AND TRAINING
In line with the Group’s environmental policy, Faurecia’s sites are
gradually implementing environmental management systems
based on the ISO 14001 standard within the overall framework of
the Faurecia Excellence System (FES).
External certifi cation and surveillance audits are carried out by
SGS with a view to validating this implementation. The number of
ISO 14001-certifi ed sites continues to rise (99 sites in 2007), with
certifi cation of all production sites with more than 50 employees
targeted for the end of 2009. New or recently consolidated sites are
obliged to obtain this certifi cation within three years.
As well as implementing ISO 14001 management systems, in
2007 Faurecia organized environmental training and awareness-
raising sessions targeted at all employees. In 2007, 11,633 hours
of environmental training were provided to 12,779 employees,
representing an investment of €124 thousand.
ISO 14001 environmental certifi cation
0
5,000
10,000
15,000
20,000
0
50
100
150
200
250
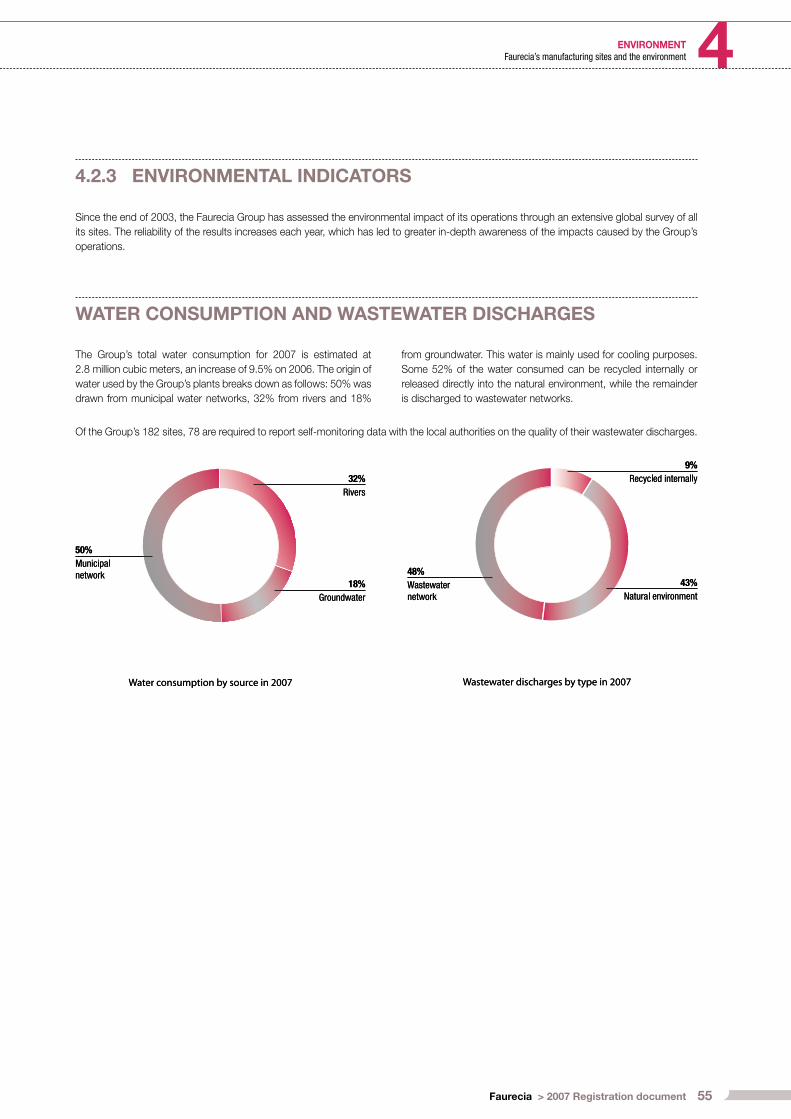
55Faurecia > 2007 Registration document
ENVIRONMENT 4Faurecia’s manufacturing sites and the environment
4.2.3 ENVIRONMENTAL INDICATORS
Since the end of 2003, the Faurecia Group has assessed the environmental impact of its operations through an extensive global survey of all
its sites. The reliability of the results increases each year, which has led to greater in-depth awareness of the impacts caused by the Group’s
operations.
WATER CONSUMPTION AND WASTEWATER DISCHARGES
The Group’s total water consumption for 2007 is estimated at
2.8 million cubic meters, an increase of 9.5% on 2006. The origin of
water used by the Group’s plants breaks down as follows: 50% was
drawn from municipal water networks, 32% from rivers and 18%
from groundwater. This water is mainly used for cooling purposes.
Some 52% of the water consumed can be recycled internally or
released directly into the natural environment, while the remainder
is discharged to wastewater networks.
Of the Group’s 182 sites, 78 are required to report self-monitoring data with the local authorities on the quality of their wastewater discharge s.

56 Faurecia > 2007 Registration document
ENVIRONMENT4 Faurecia’s manufacturing sites and the environment
ENERGY CONSUMPTION AND ATMOSPHERIC EMISSIONS
The Group’s total energy consumption for 2007 is estimated at
1.8 million MWh, broken down as follows:
33% natural gas, 62% electricity, 3% liquefi ed petroleum gas
(LPG), and just over 1% fuel oil and 1% steam. During the year, 86
sites reported that they had put in place plans to manage energy
consumption at local level.
Atmospheric emissions from energy consumption result mainly from
natural gas, liquefi ed petroleum gas and fuel oils. Of the Group’s
182 sites, 86 are required to report self-monitoring data with the
local authorities on the quality of their atmospheric emissions.
The Group’s greenhouse gas emissions, CO2 emissions in
particular (137,000 metric tons of CO2 in 2007), fell considerably
compared with 2005 (171,000 metric tons of CO2), while energy
consumption has remained stable. This is due to more widespread
use of electric energy and lower consumption of certain fuels.
The breakdown of atmospheric emissions is provided on
page 57.
62%
Electricity
3%
Steam
1%
LPG
1%
Fuel oil33%
Natural gas
Direct energy consumption by source in 2007
62%
Electricity
3%
Steam
1%
LPG
1%
Fuel oil33%
Natural gas
Direct energy consumption by source in 2007
USE OF GROUND SURFACES (WATERTIGHT SURFACES
AND TOTAL SURFACES)
Faurecia sites occupy a total surface area of 668 hectares
worldwide, 67% of which is sealed against rainwater.

57Faurecia > 2007 Registration document
ENVIRONMENT 4Faurecia’s manufacturing sites and the environment
WASTE GENERATION
The Group generated 201,000 metric tons of waste in 2007, down
13% on 2006. The majority of this waste consisted of metals (42%),
which are released into the metals recycling circuit. As regards
other waste, 17% was recovered externally, for heat or as raw
material, and 5% was eliminated in otherways (incineration without
energy recovery or physico-chemical or biological treatment), 32%
was landfi lled, and 4% was recycled internally.
OTHER ENVIRONMENTAL INDICATORS
List of sites for which a legal ruling is pending on environmental compliance
Site Cause
Fountain Inn Failure to monitor atmospheric emissions in 2005
Granger M onitoring groundwater pollution
Hordain Failure to update an operations permit
Kosice Failure to m onitor atmospheric emissions
San Joao de Madera Compliance with local regulations and monitoring atmospheric emissions
Trabitz Monitoring historical groundwater pollution
Valencia Failure to monitor VOC emissions
Sources of atmospheric emissions in 2007
CO2
N2 O CH
4SO
2NO
2
Natural gas 119,180 1 8 1 126
Liquifi ed petroleum gas 14,011 0 1 0 13
Heavy fuel oil (4% sulfur rate ) 3 0 0 0 0
Low-sulfur industrial fuel oil (2% sulfur rate ) 24 0 0 0 0
Very low sulfur industrial fuel oil (1% sulfur rate ) 274 0 0 2 1
Light fuel oil (0.3% sulfur rate ) 2,510 0 0 5 3
Total in metric tons 136,002 6 9 8 144
ENVIRONMENTAL PENALTIES AND DISPUTES
In 2007, 22 of Faurecia’s sites received a total of 30 notices of
violation or other notices for failure to comply with regulations
concerning the environment, working conditions and health and
safety. These notices were served in relation to updating permits
or other authorizations for operations, failure to respect thresholds
defi ned in the relevant authorizations, noise and odor pollution,
and other issues. Eight of the sites concerned were ordered to pay
€56,000 in penalties. Twelve disputed cases are still in progress
against Faurecia worldwide for issues relating to the environment,
working conditions and health and safety.

58 Faurecia > 2007 Registration document
ENVIRONMENT4
CONTENTS
QUALITY
5
59Faurecia > 2007 Registration document
5.1 Breakthrough Quality Plan 60
5.2 Customer Awards 61
5.3 Outlook for 2008 61

60 Faurecia > 2007 Registration document
QUALITY5 Breakthrough Quality Plan
Faurecia management has set quality as number-one priority for
the Group.
In October 2006, Faurecia launched the Breakthrough Quality
Plan, a top-down initiative designed to nurture new mindsets on
quality across all Faurecia sites. Specifi c targets set for 2008 are
a customer rejects of 15 ppm and zero signifi cant alerts on safety
and regulatory issues.
The plan is rooted in seven simple, practical rules on problem-
solving at development and production stages. Rather than
introducing new tools, it involves rigorous, disciplined application of
quality basics (such as QRQC, “quick response on quality control”)
by each employee. Management runs daily shopfl oor reviews,
and Quality Department audits are carried out for critical sites and
projects.
QRQC is a management approach whereby all defects must be
met by corrective action immediately, or within 24 hours at the
latest, working from an in-depth analysis to pinpoint the root
causes of the problems and determine appropriate technical
solutions for cross-functional implementation. It applies at all levels
in the company organization, from production-line operators up to
workshop supervisors and site management. It extends to project
development teams and development centers as well as production
facilities. And it is also used to tackle problems in logistics, supplier
relations and HSE (health-safety-environment).
Through personal involvement from all employees at all levels, a
structured management ramp-up process, and full management
support, the plan produced an immediate improvement in
production quality results:
six-fold reduction of costly quality “walls” in one year;
three-fold reduction in customer refusals, from 103 to 33 ppm
(average for second half of 2007);
2008 target of 15 ppm already reached at over 100 sites out
of 187.
For production quality basics to be effective, development quality
basics must be applied with rigor and discipline by program
teams. With this in mind a wide-reaching training program for
all development personnel was begun in 2007. So far, 70% of
Faurecia’s 3,100 engineers, including innovation teams, have taken
courses.
Under its Breakthrough Quality P lan, Faurecia has also developed
a concrete quality validation review system for critical program
phases.
All programs are monitored over the fi rst six months of volume
production, to the criteria of customer satisfaction, ppm, compliance
with delivery schedules, personnel safety, warranty claims and
safety problems (with zero tolerance). Immediate action is taken on
any problems arising.
In 2007, Faurecia fi nalized rollout of its Faurecia Core Procedures
(FCP), for standardizing quality system architectures and simplifying
preparation for site certifi cation audits.
•
•
•

61Faurecia > 2007 Registration document
QUALITY 5Outlook for 2008
Faurecia’s Vehicle Interior Systems Product Group won Ford’s
Gold Excellence Award for its Cologne site in Germany, and the
Silver Excellence Award for its Valencia site in Spain. These are the
highest distinctions awarded by Ford worldwide, in recognition of
excellence in quality, cost and leadtime performance.
Faurecia’s Exhaust Systems product group won the quality trophy
awarded by PSA to its four best suppliers. This distinction rewards
Faurecia’s excellent quality results in volume-production deliveries
(25 ppm on average in 2007, 50% better than in 2006) and its
committed involvement in PSA’s supplier aftersales response
system.
Faurecia is on track to reach its quality targets for 2008, namely
a 15 ppm customer rejects and zero regulatory/safety alerts with
customer impact.
Because customer satisfaction is the ultimate goal of any quality
endeavor, special efforts are made to ensure that all Faurecia
sites understand and meet all their customers’ expectations and
indicators.
Program control remains a major challenge for Faurecia, and a
program excellence plan, along similar lines to the quality plan, is
being fi nalized for rollout in 2008.

62 Faurecia > 2007 Registration document
QUALITY5

6CORPORATE
GOVERNANCE
63Faurecia > 2007 Registration document
CONTENTS
6.1 Board of Directors 64
6.1.1 Membership of the Board of Directors 64
6.1.2 Activities of the Board of Directors and its specialized committees 65
6.1.3 Compensation received by the Chairman and Chief Executive Offi cer 66
6.1.4 Directors’ compensation 67
6.2 Executive Committee 68
6.2.1 Executive committee compensation 69
6.3 Auditing of Accounts 70
6.4 Faurecia and its Shareholders 71
6.4.1 Information policy 71
6.4.2 Faurecia’s capital 72
6.4.3 Changes in Faurecia’s share price 72
64 Faurecia > 2007 Registration document
CORPORATE GOVERNANCE6 Board of Directors
6.1.1 MEMBERSHIP OF THE BOARD OF DIRECTORS
The Board of Directors consists of eleven members, fi ve of whom
are considered to be independent (compared with four in 2006),
based on the defi nition in the report published by the AFEP-MEDEF
working group aimed at improving corporate governance in French
listed companies. Five Directors directly represent the interests of
the majority shareholder. Since February 16, 2007, Yann Delabrière
has been Faurecia’s Chairman and Chief Executive Offi cer. The
Board considers that its membership adequately refl ects the
weight in Faurecia’s ownership structure of Peugeot SA, its key
shareholder.
Members of the Board of Directors are chosen on account of their
skills in Faurecia’s main areas of business, their autonomy and their
determination to consider the interests of all shareholders. The global
and international experience of independent Directors in industry
enhances the decisions and work of the Board. The following
changes occurred on the Board in 2007. On February 2, 2007, the
Board of Directors appointed Christian Streiff to replace Jean-Martin
Folz and this decision was ratifi ed by the Shareholders’ Meeting of
May 29, 2007. Grégoire Olivier resigned from his duties as Director
on February 16, 2007. Following this decision, Yann Delabrière was
elected as Chairman of the Board of Directors and Chief Executive
Offi cer of Faurecia. At the Shareholders’ Meeting of May 29, 2007
Jean-Pierre Clamadieu and Robert Peugeot were appointed to
replace Daniel Dewavrin and Louis Defl ine, respectively, whose
directorships expired. The Board also appointed Sylvie Rucar to
replace Grégoire Olivier and Ross Mc Innes to replace Patrick
Duverger who resigned. Lastly, on October 8, 2007, the Board
appointed Isabel Marey-Semper to replace Sylvie Rucar who
resigned.
As a result of these changes, the Board now has the following
members.
Yann DELABRIÈRE Chairman and Chief Executive Offi cer
Jean-Pierre CLAMADIEU Director
Frank ESSER Director
Jean-Louis GÉRONDEAU Director
Jean-Claude HANUS Director
Gérard HAUSER Director
Ross Mc INNES Director
Isabel MAREY-SEMPER Director
Thierry PEUGEOT Director
Robert PEUGEOT Director
Christian STREIFF Director
In 2007, the Board of Directors reaffi rmed its commitment to
ensuring that Directors are independent by appointing one additional
independent Director as compared to last year. Any Director who
“does not have any relationship with the Company, the Group or the
Group’s management that may impair his/her judgment” is deemed
independent.
As of April 10, 2008, Faurecia’s fi ve independent Directors are
Frank Esser, Ross Mc Innes, Jean-Pierre Clamadieu, Jean-Luc
Gérondeau, and Gérard Hauser.
65Faurecia > 2007 Registration document
CORPORATE GOVERNANCE 6Board of Directors
6.1.2 ACTIVITIES OF THE BOARD OF DIRECTORS
AND ITS SPECIALIZED COMMITTEES
6.1.2.1 Board of Directors
ROLE OF THE BOARD OF DIRECTORS
The Board of Directors determines overall business, fi nancial and
economic strategies for the Company and the Group and oversees
their implementation. Subject to the powers expressly granted
to Shareholders’ Meetings and within the limit of the Company’s
purpose, at the Chairman’s initiative the Board deals with all matters
concerning the Company’s affairs and decides on matters involving
the Company, notably in relation to all strategic decisions for the
Company and the Group.
ORGANIZATION OF THE BOARD OF DIRECTORS
The internal rules of the Board of Directors, which may be consulted
by shareholders at the Company’s headquarters, are aimed
at organizing the work of the Board and ensuring that Directors
receive all requisite information. They describe the Board’s modus
operandi and its role in the management of the Company and the
Group as carried out in accordance with the law and the Company’s
bylaws. They also specify the rights and responsibilities of Board
members, particularly regarding the prevention of confl icts of
interest, the holding of multiple directorships and the need for strict
confi dentiality as well as diligence in taking part in the Board’s work.
In addition they set out rules governing transactions involving the
Company’s shares, as recommended by the Autorité des marchés
fi nanciers.
The Board of Directors is free to decide how the general
management of the Company is carried out. These duties may
either be performed by the Chairman of the Board or by another
person appointed by the Board of Directors who holds the position
of Chief Executive Offi cer. Since the Board meeting of September 8,
2006, the position of Chief Executive Offi cer has been held by the
Chairman of the Board. The Board of Directors confi rmed this
management method at its meeting of February 16, 2007 when
Yann Delabrière was appointed Chairman and Chief Executive
Offi cer to replace Grégoire Olivier.
The Board of Directors determines the Company’s main economic
and fi nancial strategies in accordance with the law and the
Company’s bylaws.
6.1.2.2 Operation of the Board of Directors
The Board met seven times during 2007, principally to review
the Group’s budget, business activities and results, as well as its
fi nancing and major business strategies. During these meetings
the Board reviewed information prepared by the Audit Committee
and the Appointments and Compensation Committee, including
the interim and annual fi nancial statements, sales and earnings
forecasts, the appointment of a new Chairman and Chief Executive
Offi cer and his powers and compensation, the restructuring of
the Board of Directors, Audit Committee and Appointments and
Compensation Committee, and a stock option plan for directors
and senior managers of the Group. One meeting was devoted to
the Group’s medium-term outlook and strategic direction.
The attendance rate of Directors at Board Meetings in 2007 was
91%. All members of the Board Committees attended every
Committee meeting.
Following a review by the Appointments and Compensation
Committee several years ago, the Board implemented a procedure
for the evaluation of its work, using a survey to obtain feedback
from each Director on the methods of functioning of the Board and
on whether the Directors were given access to all the information
needed to perform their duties and that they were given the
opportunity to formulate any signifi cant observations. Directors’
responses to the survey and suggestions are then analyzed by the
Chairman of the Appointments and Compensation Committee, who
reports to the Board on his fi ndings and the results of his work.
6.1.2.3 Specialized Committees
In 2003, the Board of Directors also set up an Audit Committee and
an Appointments and Compensation Committee.
APPOINTMENTS AND COMPENSATION
COMMITTEE
This Committee is responsible for preparing the Board of Directors’
decisions concerning:
the appointment of future Directors; the Committee must
therefore determine the criteria for selecting Directors, prepare
the selection process and make proposals with regard to the
appointment or reappointment of Directors;
compensation received by corporate offi cers, including the
Chairman;
the granting of stock options.
The Committee met fi ve times in 2007. At its meeting of February 2,
2007, the Board of Directors appointed Christian Streiff as member
of the Appointments and Compensation Committee and Jean
Claude Hanus as Committee Chairman. At its meeting of May 29,
2007, the Board of Directors appointed Jean-Pierre Clamadieu
•
•
•
66 Faurecia > 2007 Registration document
CORPORATE GOVERNANCE6 Board of Directors
as member of the Appointments and Compensation Committee
and confi rmed the appointments of Christian Streiff, Jean-Claude
Hanus and Gérard Hauser.
AUDIT COMMITTEE
This Committee’s role is to conduct an in-depth review of the interim
and annual fi nancial statements, the Group’s most signifi cant
fi nancial transactions and its reporting package. It monitors off-
balance sheet commitments and information used to assess the
risks incurred by the Group. It is thus responsible for preparing
the Board meetings held to review the interim and annual fi nancial
statements and for informing the other Board members on these
subjects.
For that purpose, it reviews the fi nancial statements before their
submission to the Board and issues an opinion on:
the application and relevance of the accounting principles and
methods used and reviews material risks;
the appointment, fees and audit program of the Statutory
Auditors and issues relating to their independence.
•
•
The Audit Committee also ensures that the accounting principles
that have a material impact on the presentation of the Company’s
fi nancial statements are formally approved by Management and
the Statutory Auditors, that they are brought to the attention of the
Board of Directors, that the principal accounting procedures and
decisions made are explained and justifi ed by Management to the
Board and reviewed by the Statutory Auditors, that the Statutory
Auditors are given all the information they require to perform their
duties and that they are given the opportunity to formulate any
signifi cant observations they may have.
The Committee met four times in 2007. At its meeting of May 29,
2007, the Board of Directors appointed Christian Streiff as member
and Chairman of the Audit Committee and Ross Mc Innes as
member of the Committee, and confi rmed the appointment of
Jean-Luc Gérondeau. At its meeting of October 8, 2007, the
Board appointed Isabel Marey-Semper as member of the Audit
Committee.
6.1.3 COMPENSATION RECEIVED BY THE CHAIRMAN
AND CHIEF EXECUTIVE OFFICER
Grégoire Olivier stepped down from his position as Chairman
and Chief Executive Offi cer of Faurecia at the Board of Directors
meeting of February 16, 2007. In 2007 he received €87,300 in
fi xed compensation, calculated on a pro rata basis to the time
he worked for the Company during the year, as well as variable
compensation of €190,000 for 2006. His fi xed compensation in
2006 was €217,715 and he received €250,000 that year in the
form of an exceptional bonus. Grégoire Olivier was not granted any
special benefi ts payable in the future.
At its February 16, 2007 meeting the Board of Directors appointed
Yann Delabrière to replace Grégoire Olivier as Chairman and Chief
Executive Offi cer and during the year Yann Delabrière received
€487,828 in fi xed compensation for that position. This amount was
set by the Board prior to Yann Delabrière’s appointment based on
a recommendation made by the Appointments and Compensation
Committee. The Board also decided that Yann Delabrière should
receive variable compensation, representing up to 100% of his
fi xed salary and determined based on (i) operating results; (ii) the
debt-to-EBITDA ratio; (iii) the level of orders for which the operating
margin is at least equal to 3%; and (iv) the quality of his managerial
skills and business approach. Acting on the recommendation of the
Appointments and Compensation Committee, at its February 8,
2008 meeting the Board of Directors set Yann Delabrière’s variable
compensation at €520,000 for 2007.
In addition, Grégoire Olivier and Yann Delabrière respectively
received €3,714 and €17,000 in Directors’ fees in 2007.
The benefi ts in kind granted to Grégoire Olivier and Yann Delabrière
are the same as those granted to Faurecia’s senior executives.
They include a company car and, for the Chairman, the services
of a chauffeur.
The Chairman and Chief Executive Offi cer is not entitled to any
deferred compensation in the event that his term of offi ce is
terminated.
Grégoire Olivier did not receive or exercise any stock options
during 2007.
Yann Delabrière received 40,000 stock options, as decided by the
Board at its meeting on April 16, 2007. The Board also decided
that if Yann Delabrière exercises any of these options before the
end of his term of offi ce he must keep in registered form a number
of shares corresponding to a value representing 20% of the gross
gain on the exercised options.

67Faurecia > 2007 Registration document
CORPORATE GOVERNANCE 6Board of Directors
(Gross amounts in €) 2007 2006
Compensation paid to Grégoire Olivier
Total compensation 281,014 476,430
of which variable portion for 2006 190,000 -
of which benefi ts in kind 1,015 1,015
of which exceptional bonus - 250,000
of which Directors’ fees 3,714 8,715
Compensation paid to Yann Delabrière
Total compensation 504,828 20,143
of which variable portion for 2006 - -
of which benefi ts in kind 5,287 -
of which exceptional bonus - -
of which Directors’ fees 17,000 20,143
6.1.4 DIRECTORS’ COMPENSATION
Directors’ compensation is paid in the form of attendance fees,
which are designed to take into account the Board members’
effective attendance at meetings and their attendance at Committee
meetings. Directors therefore receive a fi xed portion in recognition of
their function and a variable portion based on the number of Board
meetings attended. They also receive additional compensation if
they are a member of one of the Board’s Committees.
The Directors in offi ce on December 31, 2007 received the following attendance fees:
DirectorsAttendance fees
paid in 2007Attendance fees
paid in 2006
Jean-Pierre CLAMADIEU €11,429 -
Yann DELABRIÈRE €17,000 €20,143
Frank ESSER €11,857 €10,429
Jean-Louis GÉRONDEAU €21,000 €18,429
Jean-Claude HANUS €21,000 €21,000
Gérard HAUSER €20,143 €21,000
Isabel MAREY-SEMPER €5,857 -
Ross Mc INNES €11,429 -
Grégoire OLIVIER €3,714 €8,715
Thierry PEUGEOT €13,000 €13,000
Robert PEUGEOT €7,429 -
Christian STREIFF €21,000 -
Fixed and variable compensation, as well as all benefi ts granted
by Peugeot SA, the controlling company, to its corporate offi cers
who also hold a corporate offi ce in Faurecia were the following.
The compensation awarded to Christian Streiff in his capacity as
Chairman of the Managing Board of Peugeot SA for 2007 was
€1,906,681 million. The compensation paid to Thierry Peugeot in
his capacity as Chairman of the Supervisory Board of Peugeot SA
amounted to €457,000 in 2007. The compensation paid to Robert
Peugeot in his capacity as member of the Supervisory Board
of Peugeot SA amounted to €22,000 in 2007. Faurecia does
not have any information on its own corporate offi cers who are
not also offi cers of the controlling company. Faurecia specifi es
that no compensation other than the Directors’ attendance fees
mentioned above was paid in 2007 to any of its corporate offi cers
by the Company or its subsidiaries.
68 Faurecia > 2007 Registration document
CORPORATE GOVERNANCE6 Executive Committee
Faurecia’s executive management is performed under the responsibility of the Chairman and Chief Executive Offi cer by the Group Executive
Committee that meets every month to review the Group’s results and consider general matters concerning the Group.
Its membership was as follows as of April 10, 2008:
Name Position
Yann DELABRIÈRE Chairman of the Board of Directors and Chief Executive Offi cer
Arnaud de DAVID-BEAUREGARD Executive Vice-President, Group Development
Jean-Marc HANNEQUIN Executive Vice-President, Exhaust Systems Product Group
Frank IMBERT Chief Financial Offi cer
Patrick KOLLER Executive Vice-President, Automotive Seating Product Group
Thierry LEMANE Executive Vice-President, Group Communications
Jacques LE MORVAN Executive Vice-President, Group Purchasing
Jacques MAUGE Executive Vice-President, Group Customer Development
Bruno MONTMERLE Executive Vice-President, Group Strategy
Christophe SCHMITT Executive Vice-President, Interior Systems Product Group
Jean-Pierre SOUNILLAC Executive Vice-President, Group Human Resources
Guy TALBOURDET Executive Vice-President, Modules & Systems Product Group
The Faurecia Group is organized into Product Groups which are
responsible for product management and development activities
worldwide.
The Product Groups are responsible for the operating results of
their activities, as well as investments and the management of
operating cash fl ow.
Faurecia comprises four Product Groups:
the Seating Product Group is responsible for the management
and development of the complete seat unit and all aspects
of the design and production of seats such as metal frames,
mechanisms, comfort and security sub-modules, foams and
covers;
the Interior System Product Group is responsible for the
management and development of the main parts which make up
the vehicles’ interior such as instrument panels, cockpits, center
consoles, door panels and door modules;
the Exhaust System Product Group is responsible for the
management and development of complete exhaust systems
and exhaust components covering both the hot and cold ends
of the exhaust system such as particulate and exhaust fume
treatments (hot end) and acoustic solutions (cold end);
•
•
•
the Modules and Systems Product Group comprises the acoustic
package, vehicle exterior and front-end modules divisions.
The functional departments include:
the Finance and Human Resources Departments responsible for
the management of their respective areas of expertise. They are
structured around country-based divisions and shared service
centers in charge of providing fi nancial management services
(cash fl ow, accounting) and human resources management
services to the Faurecia Group as a whole;
the Strategy Department drives the Group’s strategic direction
and medium-term planning, and coordinates the Product Groups
innovation and R&D activities as well as Faurecia’s growth in
emerging markets;
the Customer Development Department coordinates the Group’s
sales policy and the Purchasing Department supervises the
Group’s relations with its suppliers. The Development Department
is in charge of the Group’s external growth operations and
fi nancial and legal management of the relations with its partners
in joint ventures. The Communications Department ensures the
application of the group’s internal and external communications
policies.
•
•
•
•

69Faurecia > 2007 Registration document
CORPORATE GOVERNANCE 6Executive Committee
6.2.1 EXECUTIVE COMMITTEE COMPENSATION
The total compensation paid or allocated to Directors and offi cers
of the Company and Group in respect of 2007 amounted to
€7,201,661, including a total of €197,428 in attendance fees.
The fees paid to Executive Committee members include a
variable performance bonus. This is equal to 0%-40% of the basic
compensation of most members, but may reach up to 60%. Each
bonus depends not only on the level of individual performance, but
also on collective performance indicators, such as quality, operating
margin and debt.
If the employment contract of an Executive Committee member
is terminated by Faurecia, that member may receive contractual
severance pay of up to 12 months’ compensation, depending on
his/her position. Such severance pay is not payable in the event of
gross or serious misconduct.
70 Faurecia > 2007 Registration document
CORPORATE GOVERNANCE6 Auditing of Accounts
In accordance with French law on commercial companies,
Faurecia’s Statutory Auditors certify the Company and Group
fi nancial statements and review the situation of its fully consolidated
subsidiaries.
The Statutory Auditors are appointed by the Shareholders’ Meeting.
The Shareholders’ Meeting of May 29, 2007 renewed the term of
offi ce of PricewaterhouseCoopers and Ernst & Young for a term
of six years. The engagement of PricewaterhouseCoopers, which
was fi rst appointed at the Shareholders’ Meeting of May 27, 2003,
and the engagement of Ernst & Young, which was fi rst appointed
at the Shareholders’ Meeting of June 17, 1983, will expire at the
Shareholders’ Ordinary Meeting to be held in 2013.
In 2007, PricewaterhouseCoopers received €1.9 million in respect
of their audit assignments and €0.04 million in respect of their other
duties. Ernst & Young received €2.8 million in respect of its audit
assignments.
A table giving details of the total fees booked in 2007 by Faurecia
and its fully consolidated subsidiaries for the work entrusted to the
Statutory Auditors appears on page 187.

71Faurecia > 2007 Registration document
CORPORATE GOVERNANCE 6Faurecia and its Shareholders
6.4.1 INFORMATION POLICY
Faurecia informs the fi nancial markets of all the appropriate
information to objectively assess its growth strategy and results.
This fi nancial communication policy aims to provide all private and
corporate shareholders with specifi c and accurate information in
accordance with stock market practice.
Its policy is based, fi rst, on the periodic circulation of compulsory
information (periodic publications in the French Bulletin of
Compulsory Legal Announcements, or BALO). This information is
then supplemented by the press releases intended for the fi nancial
community and, more generally, the public, regarding non-
recurring matters that are of major importance in understanding
the Company’s strategy. Lastly, periodic meetings are held on an
interactive basis for fi nancial analysts and economic journalists
with a view to giving details of the challenges facing the Group, its
sales and income.
Faurecia’s website (www.faurecia.fr) provides shareholders with
all information on the Group. Furthermore, an e-mail address
([email protected]) and a free subscription system allow
shareholders to receive the documents of their choice directly
(annual report, Company brochure, press releases, etc.).
In 2007, Faurecia facilitated access to regulated information on
its website. Such information can now be found under “Faurecia/
Shareholder information/AMF regulated information.”
Employee shareholders also have access to a dedicated web
space on Faurecia’s Intranet site that provides information on the
Group employee savings plan.
The annual report presented and fi led as a registration document
with the Autorité des marchés fi nanciers (AMF) and the report on
the interim fi nancial statements are circulated on a wide scale
within the fi nancial community.
2008 Timetable
February 11 7:30 a.m. Publication of results – H2 2007 and FY 2007
April 17 7:30 a.m. Publication of sales – Q1 2008
May 27 10:00 a.m. Shareholders’ Meeting
July 22 7:30 a.m. Publication of results – H1 2008
October 20 7:30 a.m. Publication of sales – Q3 2008
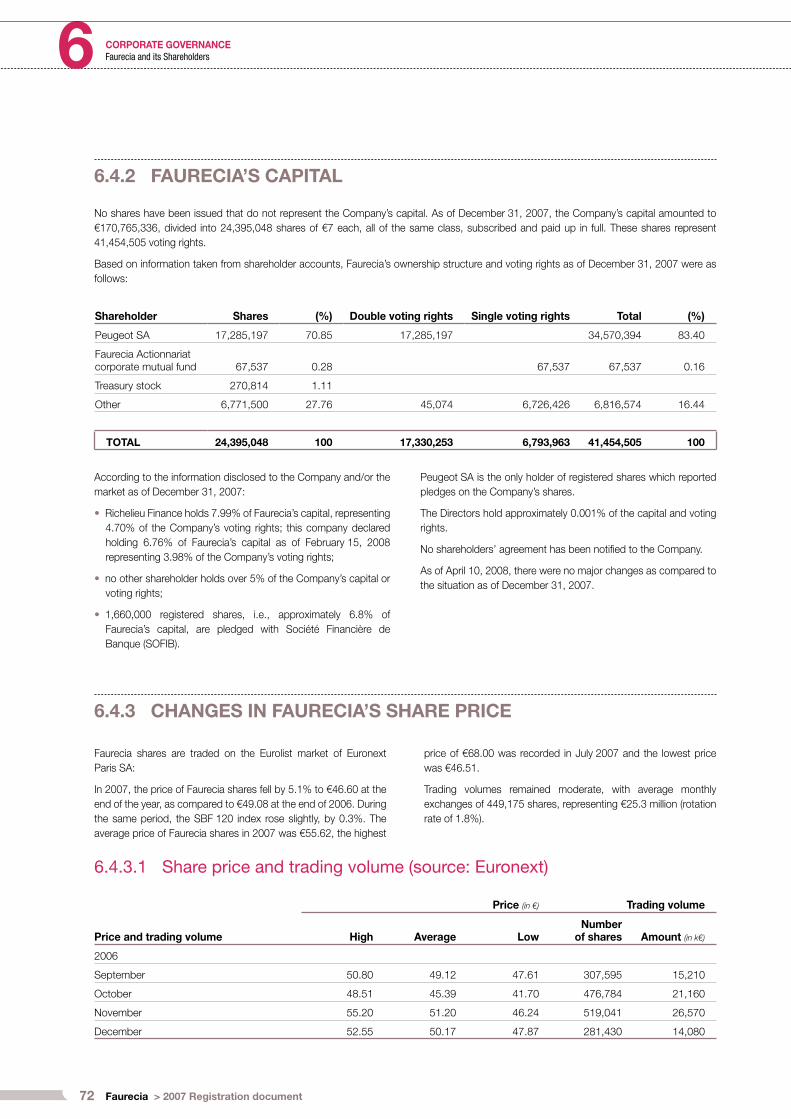
72 Faurecia > 2007 Registration document
CORPORATE GOVERNANCE6 Faurecia and its Shareholders
6.4.2 FAURECIA’S CAPITAL
No shares have been issued that do not represent the Company’s capital. As of December 31, 2007, the Company’s capital amounted to
€170,765,336, divided into 24,395,048 shares of €7 each, all of the same class, subscribed and paid up in full. These shares represent
41,454,505 voting rights.
Based on information taken from shareholder accounts, Faurecia’s ownership structure and voting rights as of December 31, 2007 were as
follows:
Shareholder Shares (%) Double voting rights Single voting rights Total (%)
Peugeot SA 17,285,197 70.85 17,285,197 34,570,394 83.40
Faurecia Actionnariat corporate mutual fund 67,537 0.28 67,537 67,537 0.16
Treasury stock 270,814 1.11
Other 6,771,500 27.76 45,074 6,726,426 6,816,574 16.44
TOTAL 24,395,048 100 17,330,253 6,793,963 41,454,505 100
According to the information disclosed to the Company and/or the
market as of December 31, 2007:
Richelieu Finance holds 7.99% of Faurecia’s capital, representing
4.70% of the Company’s voting rights; this company declared
holding 6.76% of Faurecia’s capital as of February 15, 2008
representing 3.98% of the Company’s voting rights;
no other shareholder holds over 5% of the Company’s capital or
voting rights;
1,660,000 registered shares, i.e., approximately 6.8% of
Faurecia’s capital, are pledged with Société Financière de
Banque (SOFIB).
•
•
•
Peugeot SA is the only holder of registered shares which reported
pledges on the Company’s shares.
The Directors hold approximately 0.001% of the capital and voting
rights.
No shareholders’ agreement has been notifi ed to the Company.
As of April 10, 2008, there were no major changes as compared to
the situation as of December 31, 2007.
6.4.3 CHANGES IN FAURECIA’S SHARE PRICE
Faurecia shares are traded on the Eurolist market of Euronext
Paris SA:
In 2007, the price of Faurecia shares fell by 5.1% to €46.60 at the
end of the year, as compared to €49.08 at the end of 2006. During
the same period, the SBF 120 index rose slightly, by 0.3%. The
average price of Faurecia shares in 2007 was €55.62, the highest
price of €68.00 was recorded in July 2007 and the lowest price
was €46.51.
Trading volumes remained moderate, with average monthly
exchanges of 449,175 shares, representing €25.3 million (rotation
rate of 1.8%).
6.4.3.1 Share price and trading volume (source: Euronext)
Price and trading volume
Price (in €) Trading volume
High Average LowNumber
of shares Amount (in k€)
2006
September 50.80 49.12 47.61 307,595 15,210
October 48.51 45.39 41.70 476,784 21,160
November 55.20 51.20 46.24 519,041 26,570
December 52.55 50.17 47.87 281,430 14,080
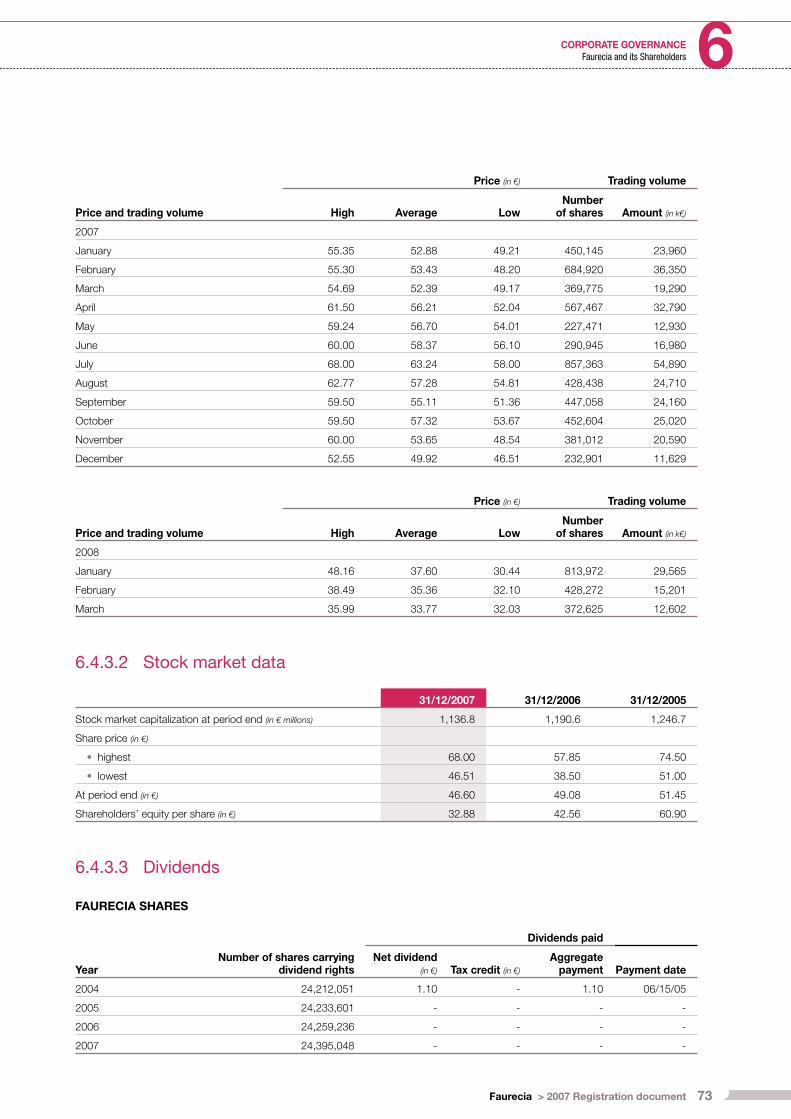
73Faurecia > 2007 Registration document
CORPORATE GOVERNANCE 6Faurecia and its Shareholders
Price and trading volume
Price (in €) Trading volume
High Average LowNumber
of shares Amount (in k€)
2007
January 55.35 52.88 49.21 450,145 23,960
February 55.30 53.43 48.20 684,920 36,350
March 54.69 52.39 49.17 369,775 19,290
April 61.50 56.21 52.04 567,467 32,790
May 59.24 56.70 54.01 227,471 12,930
June 60.00 58.37 56.10 290,945 16,980
July 68.00 63.24 58.00 857,363 54,890
August 62.77 57.28 54.81 428,438 24,710
September 59.50 55.11 51.36 447,058 24,160
October 59.50 57.32 53.67 452,604 25,020
November 60.00 53.65 48.54 381,012 20,590
December 52.55 49.92 46.51 232,901 11,629
Price and trading volume
Price (in €) Trading volume
High Average LowNumber
of shares Amount (in k€)
2008
January 48.16 37.60 30.44 813,972 29,565
February 38.49 35.36 32.10 428,272 15,201
March 35.99 33.77 32.03 372,625 12,602
6.4.3.2 Stock market data
31/12/2007 31/12/2006 31/12/2005
Stock market capitalization at period end (in € millions) 1,136.8 1,190.6 1,246.7
Share price (in €)
highest• 68.00 57.85 74.50
lowest• 46.51 38.50 51.00
At period end (in €) 46.60 49.08 51.45
Shareholders’ equity per share (in €) 32.88 42.56 60.90
6.4.3.3 Dividends
FAURECIA SHARES
YearNumber of shares carrying
dividend rights
Dividends paid
Net dividend (in €) Tax credit (in €)
Aggregate payment Payment date
2004 24,212,051 1.10 - 1.10 06/15/05
2005 24,233,601 - - - -
2006 24,259,236 - - - -
2007 24,395,048 - - - -

74 Faurecia > 2007 Registration document
CORPORATE GOVERNANCE6 Faurecia and its Shareholders
6.4.3.4 Dividend Distribution Policy
The Company distributes dividends in line with the practices of other similar companies, based on the Group’s results for the year.
6.4.3.5 Figures Per Share
31/12/2007 31/12/2006 31/12/2005
Basic earnings (loss) per share (in €) (9.87) (18.72) (7.64)
Cash fl ow per share (in €) 13.65 10.14 20.73
The method used to calculate the weighted average number of shares after dilution to determine fi gures per share is explained in Note 9 of
the annex to Faurecia’s consolidated fi nancial statements (page 98).
CONTENTS
FAURECIA – CONSOLIDATED FINANCIAL STATEMENTS
7
75Faurecia > 2007 Registration document
7.1 Consolidated income statements 77
7.2 Consolidated balance sheets 78
7.3 Consolidated cash fl ow statements 80
7.4 Statement of changes in consolidated shareholders’ equity 81
7.5 Notes to the consolidated fi nancial statements 82
7.6 Consolidated companies as of December 31, 2007 132
7.7 Statutory Auditors’ reporton the consolidated fi nancial statements 136
76 Faurecia > 2007 Registration document
FAURECIA – CONSOLIDATED FINANCIAL STATEMENTS7

77Faurecia > 2007 Registration document
FAURECIA – CONSOLIDATED FINANCIAL STATEMENTS 7Consolidated income statements
(in € millions) Notes 2007 2006 2005
SALES 4 12,660.7 11,648.7 10,978.5
Cost of sales 5 (11,914.7) (10,921.5) (10,118.1)
Research and development costs 5 (268.6) (305.0) (276.4)
Selling and administrative expenses 5 (356.3) (353.0) (316.8)
OPERATING INCOME 121.1 69.2 267.2
Other operating income and expense 6 (225.8) (386.0) (315.0)
Income from loans, cash investments and marketable securities 15.9 10.9 9.1
Finance costs (117.0) (97.5) (74.6)
Other fi nancial income and expense 7 (13.8) (3.4) (12.6)
INCOME (LOSS) BEFORE TAX OF FULLY CONSOLIDATED COMPANIES (219.6) (406.8) (125.9)
Current taxes 8 (8.8) (48.1) (32.1)
Deferred taxes 8 (4.8) 12.9 (20.7)
NET INCOME (LOSS) OF FULLY CONSOLIDATED COMPANIES (233.2) (442.0) (178.7)
Equity in net income of companies accounted for by the equity method 13 2.3 4.4 5.9
CONSOLIDATED NET INCOME (LOSS) (230.9) (437.6) (172.8)
Net income attributableto equity holder of the parent (237.5) (447.9) (182.5)
Net income attributable to minority interests 6.6 10.3 9.7
Basic earnings (loss) per share (in €) 9 (9.87) (18.72) (7.64)
Diluted earnings (loss) per share (in €) 9 (9.87) (18.72) (7.64)
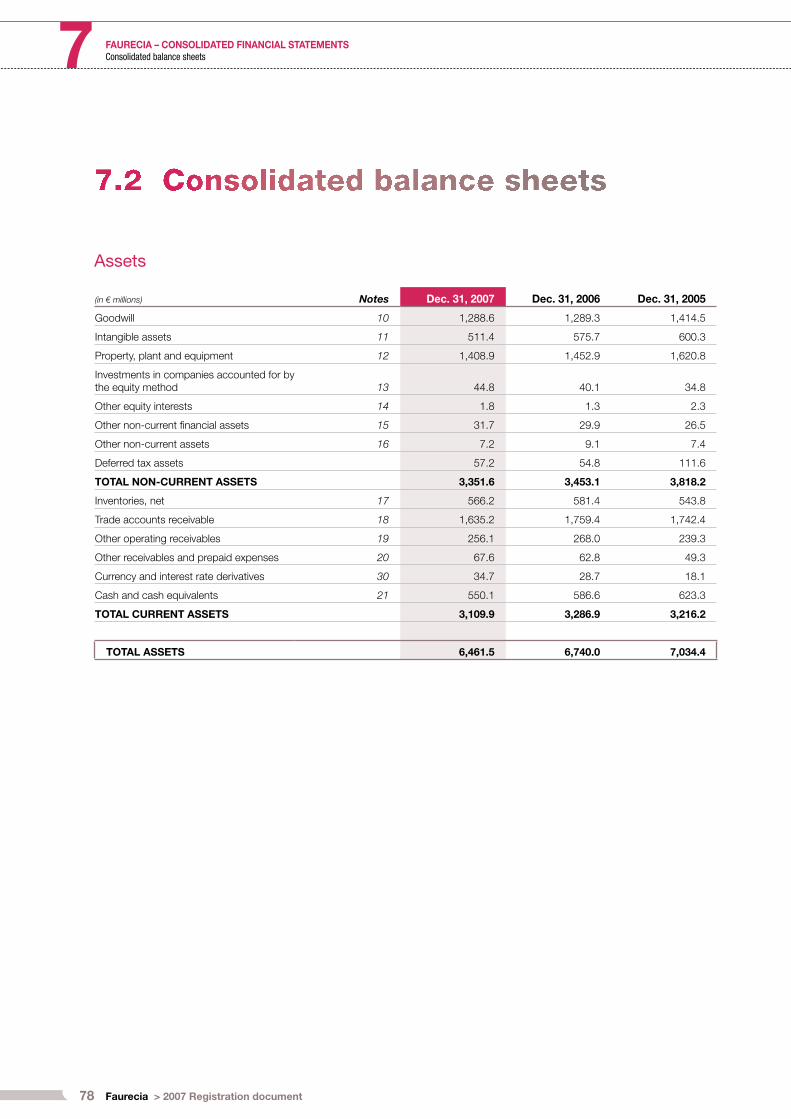
78 Faurecia > 2007 Registration document
FAURECIA – CONSOLIDATED FINANCIAL STATEMENTS7 Consolidated balance sheets
Assets
(in € millions) Notes Dec. 31, 2007 Dec. 31, 2006 Dec. 31, 2005
Goodwill 10 1,288.6 1,289.3 1,414.5
Intangible assets 11 511.4 575.7 600.3
Property, plant and equipment 12 1,408.9 1,452.9 1,620.8
Investments in companies accounted for by the equity method 13 44.8 40.1 34.8
Other equity interests 14 1.8 1.3 2.3
Other non-current fi nancial assets 15 31.7 29.9 26.5
Other non-current assets 16 7.2 9.1 7.4
Deferred tax assets 57.2 54.8 111.6
TOTAL NON-CURRENT ASSETS 3,351.6 3,453.1 3,818.2
Inventories, net 17 566.2 581.4 543.8
Trade accounts receivable 18 1,635.2 1,759.4 1,742.4
Other operating receivables 19 256.1 268.0 239.3
Other receivables and prepaid expenses 20 67.6 62.8 49.3
Currency and interest rate derivatives 30 34.7 28.7 18.1
Cash and cash equivalents 21 550.1 586.6 623.3
TOTAL CURRENT ASSETS 3,109.9 3,286.9 3,216.2
TOTAL ASSETS 6,461.5 6,740.0 7,034.4
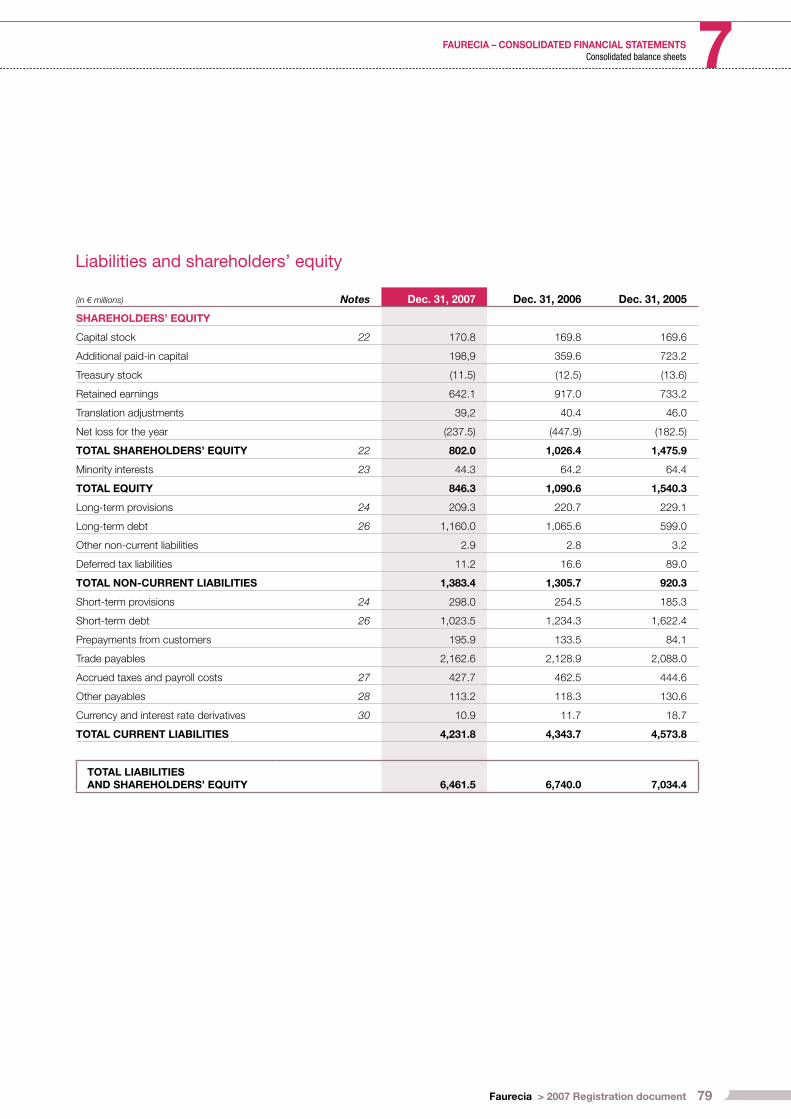
79Faurecia > 2007 Registration document
FAURECIA – CONSOLIDATED FINANCIAL STATEMENTS 7Consolidated balance sheets
Liabilities and shareholders’ equity
(in € millions) Notes Dec. 31, 2007 Dec. 31, 2006 Dec. 31, 2005
SHAREHOLDERS’ EQUITY
Capital stock 22 170.8 169.8 169.6
Additional paid-in capital 198,9 359.6 723.2
Treasury stock (11.5) (12.5) (13.6)
Retained earnings 642.1 917.0 733.2
Translation adjustments 39,2 40.4 46.0
Net loss for the year (237.5) (447.9) (182.5)
TOTAL SHAREHOLDERS’ EQUITY 22 802.0 1,026.4 1,475.9
Minority interests 23 44.3 64.2 64.4
TOTAL EQUITY 846.3 1,090.6 1,540.3
Long-term provisions 24 209.3 220.7 229.1
Long-term debt 26 1,160.0 1,065.6 599.0
Other non-current liabilities 2.9 2.8 3.2
Deferred tax liabilities 11.2 16.6 89.0
TOTAL NON-CURRENT LIABILITIES 1,383.4 1,305.7 920.3
Short-term provisions 24 298.0 254.5 185.3
Short-term debt 26 1,023.5 1,234.3 1,622.4
Prepayments from customers 195.9 133.5 84.1
Trade payables 2,162.6 2,128.9 2,088.0
Accrued taxes and payroll costs 27 427.7 462.5 444.6
Other payables 28 113.2 118.3 130.6
Currency and interest rate derivatives 30 10.9 11.7 18.7
TOTAL CURRENT LIABILITIES 4,231.8 4,343.7 4,573.8
TOTAL LIABILITIES AND SHAREHOLDERS’ EQUITY 6,461.5 6,740.0 7,034.4

80 Faurecia > 2007 Registration document
FAURECIA – CONSOLIDATED FINANCIAL STATEMENTS7 Consolidated cash fl ow statements
(in € millions) Notes 2007 2006 2005
I- OPERATING ACTIVITIES
Consolidated net income (loss) (230.9) (437.6) (172.8)
Depreciation and amortization 538.6 754.9 682.6
Deferred tax (benefi ts) charges 4.8 (12.9) 21.2
Increase (decrease) in long-term provisions (10.0) (8.3) (43.9)
Equity in net income of companies accounted for by the equity method, net of dividends received (0.8) (1.6) (1.8)
Capital (gains) losses on disposals of non-current assets 3.1 (20.9) (0.3)
Other 2.8 (18.4) 7.7
CASH FLOW FROM OPERATIONS 307.6 255.2 492.7
Increase (decrease) in short-term provisions 51.4 75.4 28.4
Change in inventories 28.2 (31.5) 3.1
Change in trade account receivables 105.0 (24.8) 63.5
Change in trade payables 45.9 42.0 18.7
Change in other operating receivables and payables 43.9 38.3 28.8
Change in other receivables and payables (7.8) 40.6 29.6
(Increase) decrease in working capital requirement 266.6 140.0 172.1
NET CASH PROVIDED BY OPERATING ACTIVITIES 574.2 395.2 664.8
II- INVESTING ACTIVITIES
Additions to property, plant and equipment 12 (306.8) (302.2) (433.9)
Capitalized development costs (159.2) (208.3) (215.8)
Acquisitions of investments (25.2) (1.6) (9.2)
Proceeds from disposals of property, plant and equipment 9.8 52.3 9.2
Proceeds from disposals of fi nancial assets
Change in investment-related receivables and payables (4.7) (42.4) 37.9
Other movements 4.4 (15.6) (19.9)
NET CASH USED BY INVESTING ACTIVITIES (481.7) (517.8) (631.7)
NET CASH PROVIDED (USED) BY OPERATING AND INVESTING ACTIVITIES (I)+(II) 92.5 (122.6) 33.1
III- FINANCING ACTIVITIES
Issuance of shares by Faurecia and fully-consolidated companies 5.5 1.1 1.5
Dividends paid by the parent company (26.3)
Dividends paid to minority interests in consolidated subsidiaries (11.2) (6.2) (11.6)
Issuance of debt securities and increase in other fi nancial liabilities 129.9 552.0 316.1
Repayments of debt and other fi nancial liabilities (193.0) (476.1) (492.3)
NET CASH (USED) PROVIDED BY FINANCING ACTIVITIES (68.8) 70.8 (212.6)
IV- OTHER CHANGES IN CASH AND CASH EQUIVALENTS
Impact of exchange rate changes on cash and cash equivalents (3.8) (8.0) 16.3
NET INCREASE (DECREASE) IN CASH AND CASH EQUIVALENTS 19.9 (59.8) (163.2)
CASH AND CASH EQUIVALENTS AT BEGINNING OF YEAR 523.6 583.4 746.6
CASH AND CASH EQUIVALENTS AT END OF YEAR 26 543.5 523.6 583.4

81Faurecia > 2007 Registration document
FAURECIA – CONSOLIDATED FINANCIAL STATEMENTS 7Statement of changes in consolidated shareholders’ equity
(in € millions)
Number of shares(2)
Capital stock
Additional paid-in capital
Treasury stock
Retained earnings
and net income
(loss) for the year
Translation adjustments
Total shareholders’
equityMinority interests Total
Balance as of Jan. 1, 2005 before appropriation of net income (loss) 24,212,051 169.5 722.5 (14.1) 756.5 5.6 1,640.0 60.9 1,700.9
Net loss for the year (182.5) (182.5) 9.7 (172.8)
Translation adjustments 40.4 40.4 5.7 46.1
Changes in fair value of currency hedging instruments (0.6) (0.6) (0.6)
Total income and expense recognized directly in equity (183.1) 40.4 (142.7) 15.4 (127.3)
Issue of share capital(1) 21,550 0.1 0.7 0.8 0.7 1.5
2004 dividend (26.3) (26.3) (11.6) (37.9)
Measurement of stock options 2.4 2.4 2.4
Sales of treasury stock 0.5 1.2 1.7 1.7
Changes in scope of consolidation 0.0 (1.0) (1.0)
Balance as of Dec. 31, 2005 before appropriation of net income (loss) 24,233,601 169.6 723.2 (13.6) 550.7 46.0 1,475.9 64.4 1,540.3
Net loss for the year (447.9) (447.9) 10.3 (437.6)
Translation adjustments (5.6) (5.6) (4.3) (9.9)
Changes in fair value of currency hedging instruments (0.8) (0.8) (0.8)
Total income and expense recognized directly in equity (448.7) (5.6) (454.3) 6.0 (448.3)
Issue of share capital(1) 25,635 0.2 0.9 1.1 1.1
2005 dividend 0.0 (6.2) (6.2)
Measurement of stock options 2.3 2.3 2.3
Sales of treasury stock 1.1 0.3 1.4 1.4
Changes in scope of consolidation 0.0 0.0
Recognition of 2005 losses of the parent company (364.5) 364.5 0.0 0.0
Balance as of Dec. 31, 2006 before appropriation of net income (loss) 24,259,236 169.8 359.6 (12.5) 469.1 40.4 1,026.4 64.2 1,090.6
Net loss for the year (237.5) (237.5) 6.6 (230.9)
Translation adjustments (1.2) (1.2) (2.1) (3.3)
Changes in fair value of currency hedging instruments 5.4 5.4 5.4
Total income and expense recognized directly in equity (232.1) (1.2) (233.3) 4.5 (228.8)
Issue of share capital(1) 135,812 1.0 4.5 5.5 5.5
2006 dividend 0.0 (11.2) (11.2)
Measurement of stock options 1.9 1.9 1.9
Sales of treasury stock 1.0 0.5 1.5 1.5
Changes in scope of consolidation 0.0 (13.2) (13.2)
Recognition of 2006 losses of the parent company (165.2) 165.2 0.0 0.0
Balance as of Dec. 31, 2007 before appropriation of net income (loss) 24,395,048 170.8 198.9 (11.5) 404.6 39.2 802.0 44.3 846.3
(1) Shares issued on exercise of stock options.(2) Including 270,814 treasury shares as of December 31, 2007, compared with 302,154 as of December 31, 2006 and 335,804 as of
December 31, 2005 (see Note 22-3).
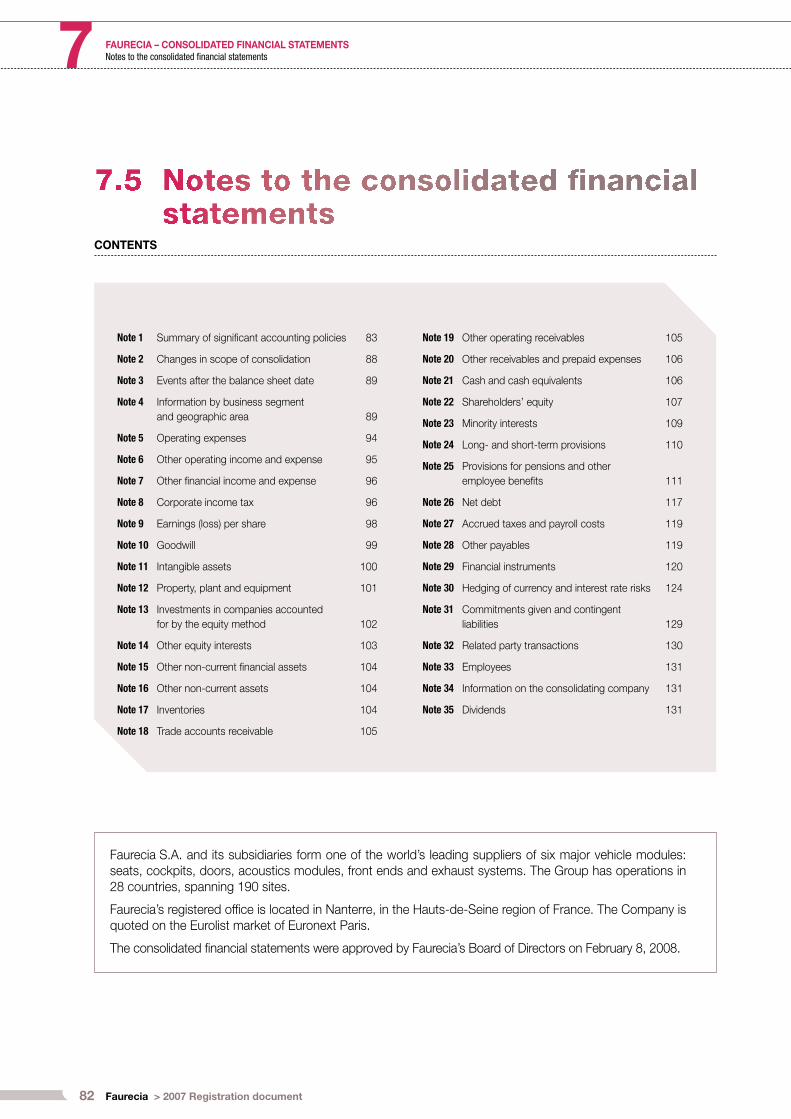
82 Faurecia > 2007 Registration document
FAURECIA – CONSOLIDATED FINANCIAL STATEMENTS7
CONTENTS
Notes to the consolidated fi nancial statements
Faurecia S.A. and its subsidiaries form one of the world’s leading suppliers of six major vehicle modules:
seats, cockpits, doors, acoustics modules, front ends and exhaust systems. The Group has operations in
28 countries, spanning 190 sites.
Faurecia’s registered offi ce is located in Nanterre, in the Hauts-de-Seine region of France. The Company is
quoted on the Eurolist market of Euronext Paris.
The consolidated fi nancial statements were approved by Faurecia’s Board of Directors on February 8, 2008.
Note 1 Summary of signifi cant accounting policies 83
Note 2 Changes in scope of consolidation 88
Note 3 Events after the balance sheet date 89
Note 4 Information by business segment
and geographic area 89
Note 5 Operating expenses 94
Note 6 Other operating income and expense 95
Note 7 Other fi nancial income and expense 96
Note 8 Corporate income tax 96
Note 9 Earnings (loss) per share 98
Note 10 Goodwill 99
Note 11 Intangible assets 100
Note 12 Property, plant and equipment 101
Note 13 Investments in companies accounted
for by the equity method 102
Note 14 Other equity interests 103
Note 15 Other non-current fi nancial assets 104
Note 16 Other non-current assets 104
Note 17 Inventories 104
Note 18 Trade accounts receivable 105
Note 19 Other operating receivables 105
Note 20 Other receivables and prepaid expenses 106
Note 21 Cash and cash equivalents 106
Note 22 Shareholders’ equity 107
Note 23 Minority interests 109
Note 24 Long- and short-term provisions 110
Note 25 Provisions for pensions and other
employee benefi ts 111
Note 26 Net debt 117
Note 27 Accrued taxes and payroll costs 119
Note 28 Other payables 119
Note 29 Financial instruments 120
Note 30 Hedging of currency and interest rate risks 124
Note 31 Commitments given and contingent
liabilities 129
Note 32 Related party transactions 130
Note 33 Employees 131
Note 34 Information on the consolidating company 131
Note 35 Dividends 131

83Faurecia > 2007 Registration document
FAURECIA – CONSOLIDATED FINANCIAL STATEMENTS 7Notes to the consolidated fi nancial statements
NOTE 1 SUMMARY OF SIGNIFICANT ACCOUNTING POLICIES
The consolidated fi nancial statements of the Faurecia Group
have been prepared in accordance with International Financial
Reporting Standards (IFRSs) as adopted by the European Union,
including International Accounting Standards (IASs) and related
interpretations issued by the International Financial Reporting
Interpretations Committee (IFRIC).
The standards used to prepare the 2007 fi nancial statements and
comparative data for 2006 and 2005 are those published in the Offi cial
Journal of the European Union (OJEU) as of December 31, 2007,
and whose application was mandatory at that date.
In accordance with IFRS 1, First-time adoption of International
Financial Reporting Standards, Faurecia elected to apply the
following exemptions at the IFRS transition date:
translation adjustments arising on consolidation were taken to
consolidated retained earnings at January 1, 2004;
unrecognized actuarial gains and losses on employee benefi t
obligations as of January 1, 2004 were recorded under
consolidated retained earnings.
The Group also used the possibility offered by IFRS 1 permitting
companies to restate business combinations that occurred prior to
January 1, 2004.
The Group has not elected to apply the option available under
IAS 19 permitting actuarial gains and losses on pension benefi t
obligations to be recorded directly in equity. Consequently, such
gains and losses are still recognized according to the corridor
method over the expected average remaining working lives of the
employees participating in the plans concerned.
The principal accounting policies applied in the preparation of the
consolidated fi nancial statements are set out below. These policies
have been consistently applied to all the years presented.
The new standards, interpretations and amendments issued by the
IASB whose application was mandatory as of January 1, 2007 have
been applied where appropriate and are listed below. However, as
they did not have a material impact on the fi nancial statements,
comparative prior-year data were not restated.
IFRS 7, “Financial instruments: Disclosures”, which introduces
new disclosure requirements about a company’s exposure to
risks arising from fi nancial instruments and how those risks are
managed (see Note 29).
The amendment to IAS 1 concerning capital disclosures that
enable users of fi nancial statements to evaluate the company’s
objectives, policies and processes for managing capital.
IFRIC 7, “Applying the restatement approach under IAS 29,
Financial reporting in hyperinfl ationary economies”, which is not
currently relevant to the Group’s operations.
IFRIC 10, “Interim fi nancial reporting and impairment”, which
states that companies must not reverse any impairment losses
recognized in a previous interim period in respect of goodwill or
an investment in either an equity instrument or a fi nancial asset
carried at cost.
•
•
•
•
•
•
The Group has not elected to early adopt any standards that have
been published in the Offi cial Journal of the European Union but
which were not effective as of December 31, 2007.
1-1 Consolidation principles
Companies which are at least 20%-owned are consolidated when
one or more of the following criteria are met: annual sales of over
€20 million, total assets of over €20 million, and/or debt of over
€5 million.
Non-consolidated companies are not material, either individually or
in the aggregate.
Subsidiaries controlled by the Group are fully consolidated.
Control is presumed to exist where the Group holds over 50%
of a company’s voting rights, and may also arise as a result of
shareholders’ agreements.
Subsidiaries are fully consolidated from the date on which control
is transferred to the Group and are deconsolidated from the date
that control ceases.
Companies over which the Group exercises signifi cant infl uence but
not control – generally through a shareholding of between 20% and
50% of the voting rights – are accounted for by the equity method.
The Faurecia Group’s consolidated fi nancial statements are
presented in euros.
The functional currency of foreign subsidiaries is generally their
local currency. The assets and liabilities of these companies are
translated into euros at the year-end exchange rate and income
statement items are translated at the average exchange rate for the
year. The resulting translation adjustments are recorded in equity.
Certain companies located outside the euro zone which carry out
the majority of their transactions in euros may, however, use euros
as their functional currency.
For companies located in high-infl ation countries, non-monetary
assets and liabilities and the corresponding income statement items
are translated at historical exchange rates, after adjust ment for the
effects of hyperinfl ation. Translation gains and losses on other items
are recognized in the income statement.
All material intercompany transactions are eliminated in
consolidation, including intercompany gains.
Prior to consolidation, the fi nancial statements of subsidiaries and
associates are restated to comply with Group accounting policies.

84 Faurecia > 2007 Registration document
FAURECIA – CONSOLIDATED FINANCIAL STATEMENTS7 Notes to the consolidated fi nancial statements
1-2 Goodwill
Goodwill represents the excess of the cost of an acquisition over
the fair value of the Group’s share of the net identifi able assets of
the acquired entity at the date of acquisition.
In accordance with IAS 36, goodwill is not amortized but is tested
for impairment at least once a year and more often if there is an
indication that it may be impaired. For the purpose of impairment
testing, goodwill is allocated to cash-generating units (CGUs). A
CGU is defi ned as the smallest identifi able group of assets that
generates cash infl ows that are largely independent of the cash
infl ows from other assets or groups of assets.
The CGU to which goodwill is allocated represents the lowest
level within the business segment at which goodwill is monitored
for internal management purposes. The Group has identifi ed the
following CGUs:
Automotive Seating;
Vehicle Interiors;
Exhaust Systems;
Front End.
The carrying amount of these assets is then compared with the
higher of their value in use and their market value.
1-3 Intangible assets
A - RESEARCH AND DEVELOPMENT
EXPENDITURE
The Faurecia Group incurs certain development costs in connection
with producing and delivering modules for specifi c customer
orders which are either a) not sold to the customer, or b) paid for
by the customer on delivery of each part, without the customer
guaranteeing full fi nancing of the costs incurred. In accordance
with IAS 38, these development costs are recorded as an intangible
asset where the company concerned can demonstrate:
its intention to complete the project as well as the availability of
adequate technical, fi nancial and other resources to complete
the development;
how the customer contract will generate probable future
economic benefi ts and the company’s ability to measure these
reliably;
its ability to measure reliably the expenditure attributable to the
contracts concerned (costs to completion).
These capitalized costs are amortized to match the quantities of
parts delivered to the customer, over a period not to exceed fi ve
years except under exceptional circumstances.
Research costs, and development costs that do not meet the
above criteria, are expensed as incurred.
•
•
•
•
•
•
•
B - OTHER INTANGIBLE ASSETS
Other intangible assets include development and purchase costs
relating to software used within the Group – which are amortized
on a straight-line basis over a period of between one and three
years – as well as patents and licenses.
1-4 Property, plant and equipment
Property, plant and equipment are stated at acquisition cost, or
production cost in the case of assets produced by the Group for
its own use, less accumulated depreciation.
Maintenance and repair costs are expensed as incurred, except
where they serve to increase productivity or to prolong the useful
life of an asset, in which case they are capitalized.
Borrowing costs are not included in the cost of assets.
Property, plant and equipment are depreciated by the straight-line
method over the estimated useful lives of the assets, as follows:
buildings 20 to 30 years
leasehold improvements, fi xtures and fi ttings 10 to 20 years
machinery, tooling and furniture 3 to 10 years
Certain tooling is produced or purchased for the purpose of
manufacturing parts or modules for customer orders, which are
either a) not sold to the customer, or b) paid for by the customer
on delivery of each part, without the customer guaranteeing full
fi nancing of the costs incurred. In accordance with IAS 16, this
tooling is recognized as property, plant and equipment.
It is depreciated to match the quantities of parts delivered to the
customer over a maximum of three years, in line with the rate at
which models are replaced.
Investment grants are recorded as a deduction from the assets
that they were used to fi nance.
Property, plant and equipment acquired under fi nance leases
which transfer substantially all the risks and rewards incidental to
ownership of the asset to the lessee are recorded under assets
at the fair value of the leased asset or, if lower, the present value
of the minimum lease payments. The assets recognized are
subsequently depreciated as described above. An obligation of
the same amount is recorded as a liability.
85Faurecia > 2007 Registration document
FAURECIA – CONSOLIDATED FINANCIAL STATEMENTS 7Notes to the consolidated fi nancial statements
1-5 Cash generating units and impairment tests
Impairment tests are carried out where there is an indication that
the asset may be impaired. Goodwill is tested for impairment at
least once a year. Impairment testing consists of comparing the
carrying amount of an asset, or group of assets, with the higher of
its market value and value in use.
Value in use is defi ned as the present value of the net future cash
fl ows expected to be derived from an asset or group of assets.
The assets are grouped at the lowest levels for which there are
separately identifi able cash fl ows (cash-generating units, or
CGUs). In line with this principle, tests are performed on each
group of intangible assets (development costs) and property, plant
and equipment attributable to a customer contract to compare
the aggregate carrying amount of the assets with the present
value of the expected net future cash fl ows to be derived from
the contract.
An impairment loss is recorded when the assets’ carrying amount
is lower than the present value of the expected net future cash
fl ows. A provision is also recorded for losses to completion on
loss-making contracts.
1-6 Financial assets and liabilities (excluding derivatives)
A - DEFINITIONS
In accordance with IAS 39, the Group classifi es its fi nancial assets
in the following categories: loans and receivables, available-for-
sale, and at fair value through profi t or loss. They are recorded
under the following balance sheet items: “Other equity interests”
(Note 14), “Other non-current fi nancial assets” (Note 15), “Trade
account receivables” (Note 18), “Other operating receivables”
(Note 19), “Other receivables and prepaid expenses” (Note 20)
and “Cash and cash equivalents” (Note 21).
The Group does not use the IAS 39 categories of “Held-to-maturity
investments” or “Financial assets held for trading”.
The Group’s fi nancial liabilities fall within the IAS 39 categories of (i)
at fair value through profi t or loss, and (ii) measured at amortized
cost.
They are recorded under the following balance sheet items: “Short-
term debt” and “Long-term debt” (Note 26), “Accrued taxes and
payroll costs” (Note 27) and “Other payables” (Note 28).
Financial assets and liabilities are broken down into current and
non-current components for maturities of less than and more than
one year, respectively, at the balance sheet date.
B - RECOGNITION AND MEASUREMENT
OF FINANCIAL ASSETS
(a) Other equity interests
Other equity interests correspond to the Group’s interests in the
capital of non-consolidated companies. They are carried in the
balance sheet at cost, which the Group considers as representing
their fair value due to the absence of an active market. An
impairment loss is recognized where there is a prolonged decline in
the value in use of these assets. Value in use is determined based
on the most appropriate fi nancial criteria, generally corresponding
to the Group’s equity in the underlying net assets and the earnings
outlook of the company concerned.
(b) Loans and other fi nancial assets
Loans and other fi nancial assets are stated at nominal value which
corresponds to amortized cost, calculated using the effective
interest method.
Provisions are booked on a case-by-case basis where there is a
risk of non-recovery.
(c) Cash and cash equivalents
Cash and cash equivalents are measured at fair value. They include
current account balances and units in money market funds which
can be sold at short notice and which do not carry a signifi cant risk
of impairment in the event of changes in interest rates.
C - RECOGNITION AND MEASUREMENT
OF FINANCIAL LIABILITIES
(a) Financial liabilities measured at amortized cost
The Group’s fi nancial liabilities are generally measured at amortized
cost using the effective interest method.
1-7 Inventories and work-in-progress
Inventories of raw materials and supplies are stated at cost,
determined by the FIFO method (First-In, First-Out).
Finished and semi- fi nished products, as well as work-in-progress,
are stated at production cost, determined by the FIFO method.
Production cost includes the cost of raw materials and supplies as
well as direct and indirect production costs, excluding overheads
not linked to production and borrowing costs.
Work-in-progress includes the costs of internally-manufactured
specifi c tooling or development work which is sold to customers,
i.e. where the related risks and rewards are transferred. These
costs are recognized in the income statement over the period in
86 Faurecia > 2007 Registration document
FAURECIA – CONSOLIDATED FINANCIAL STATEMENTS7 Notes to the consolidated fi nancial statements
which the corresponding sales are made, as each technical stage
is validated by the customer, or when the tooling is delivered if the
contract does not provide for specifi c technical stages.
Provisions are booked for inventories for which the probable
realizable value is lower than cost.
1-8 Foreign currency transactions
Transactions in foreign currency are converted at the exchange
rate prevailing on the transaction date. Receivables and payables
are converted at the year-end exchange rate and the resulting gain
or loss is recorded in the income statement as operating income
or expenses for operating receivables and payables, and under
“Other fi nancial income and expense” for other receivables and
payables.
1-9 Derivatives
Faurecia uses derivative instruments traded on organized markets
or purchased over-the-counter from fi rst-rate counterparties to
hedge currency and interest rate risks. They are recorded at fair
value in the balance sheet.
Currency hedges:
The effective portion of changes in the fair value of instruments
used to hedge future revenues is recorded in equity and taken to
operating income when the hedged revenues are received.
Changes in the fair value of instruments used to hedge trade
receivables and payables are recorded as operating income or
expenses.
The portion of the change in fair value of these hedges that is
ineffective (time value of the hedges) is recorded under “Other
fi nancial income and expense” together with changes in the
fair value of instruments used to hedge other receivables and
payables.
Interest rate hedges:
Changes in the fair value of interest rate hedges are recorded
directly in “Other fi nancial income and expense” when a hedging
relationship cannot be demonstrated under IAS 39, or where the
Group has elected not to apply hedge accounting principles.
1-10 Minority interests
This item corresponds to minority shareholders’ interests in the
net assets of consolidated subsidiaries. In the case of subsidiaries
with a negative net worth, minority interests are deducted from
consolidated shareholders’ equity except where an agreement
has been signed requiring minority shareholders to contribute to
fi nancing the Company pro rata to their stake in the capital.
1-11 Provisions for pensions and other employee benefi ts
The Group’s liability for pensions and other employee benefi ts
is determined on an actuarial basis using the projected unit
credit method. The valuation takes into account the probability
of employees staying with the Group up to retirement age and
expected future salary levels. Benefi t obligations are partially
funded by contributions to external funds.
In cases where the funds are permanently allocated to the benefi t
plan concerned, their value is deducted from the related liability.
Actuarial gains and losses are recognized according to the corridor
method over the expected average remaining working lives of the
employees participating in the plans. Periodic pension and other
employee benefi t costs are recognized as operating expenses
over the benefi t vesting period, except for the interest cost,
which is recorded under “Other fi nancial income and expense” in
accordance with the alternative method under IAS 19. The impact
of changes in the present value of external funds is also recorded
under this item.
1-12 Stock option plans
Stock options are granted to the management executives of Group
companies and their over 50%-owned subsidiaries, allowing them
to subscribe to new Faurecia shares or to purchase existing shares.
Options granted after November 7, 2002 that had not vested as
of January 1, 2005 are measured at fair value as of the grant date
using the Black & Scholes option pricing model.
The fair value of stock options is recognized in payroll costs on a
straight-line basis over the vesting period (the period between the
grant date and the vesting date), with a corresponding adjustment
to equity.
1-13 Restructuring and reorganization provisions
A provision is booked when Group General Management has
decided to rationalize the organization structure and announced
the program to the employees concerned or their representatives.

87Faurecia > 2007 Registration document
FAURECIA – CONSOLIDATED FINANCIAL STATEMENTS 7Notes to the consolidated fi nancial statements
1-14 Revenue recognition
Sales are recognized when the risks and rewards incidental to
ownership of the modules or parts produced are transferred. This
generally corresponds to when the goods are shipped, or – in the
case of development contracts or the sale of tooling – when the
technical stages are validated by the customer.
If no such technical stages are provided for in the contract, sales
are recognized when the related development work is completed
or the tooling is delivered.
1-15 Operating income
Operating income is the Faurecia Group’s principal performance
indicator.
It corresponds to net income of fully consolidated companies
before:
other operating income and expense, corresponding to material
unusual and non-recurring items including rationalization and
early retirement costs, the impact of exceptional events such
as the discontinuation of a business, the closure or sale of an
industrial site, disposals of non-operating buildings, impairment
losses recorded for property, plant and equipment or intangible
assets, as well as other material and unusual losses;
income from loans, cash investments and marketable
securities;
fi nance costs;
other fi nancial income and expense, which includes the impact
of discounting the pension benefi t obligation and the return
on related plan assets, the ineffective portion of interest rate
and currency hedges, changes in value of interest rate and
currency instruments for which a hedging relationship cannot
be demonstrated under IAS 39, and gains and losses on sales
of shares in subsidiaries;
corporate income tax.
•
•
•
•
•
1-16 Deferred taxes
Deferred taxes are recognized using the liability method for
temporary differences arising between the tax bases of assets
and liabilities and their carrying amounts in the consolidated
fi nancial statements. Temporary differences mainly arise from tax
loss carryforwards and consolidation adjustments to subsidiaries’
accounts.
Deferred taxes are determined using tax rates (and laws) that have
been enacted or substantially enacted by the balance sheet date
and are expected to apply when the related deferred tax asset is
realized or the deferred tax liability is settled.
Deferred income tax assets are recognized only to the extent that it
is probable that future taxable profi t will be available against which
the temporary differences can be utilized.
Where appropriate, an accrual is booked to cover taxes payable on
the distribution of retained earnings of subsidiaries and associates
which are not considered as having been permanently reinvested.
1-17 Use of estimates
The preparation of fi nancial statements in accordance with IFRS
requires the use of estimates and assumptions when measuring
certain assets, liabilities, income, expenses and obligations . These
estimates and assumptions are primarily used when calculating
the impairment of property, plant and equipment, intangible assets,
goodwill and deferred tax assets, as well as for measuring pension
and other post-employment benefi t obligations and provisions for
restructuring and losses on loss-making contracts. They are based
on historical experience and other factors that are believed to be
reasonable under the circumstances. Actual results may differ from
these estimates and assumptions.
88 Faurecia > 2007 Registration document
FAURECIA – CONSOLIDATED FINANCIAL STATEMENTS7 Notes to the consolidated fi nancial statements
NOTE 2 CHANGES IN SCOPE OF CONSOLIDATION
2-1 2007
During the year Faurecia acquired a 50% interest in Romania-based
Euro Auto-Plastic Systems srl in the Vehicle Interiors business for
€9.4 million.
In addition, Faurecia set up three new companies in China in 2007
– Faurecia (Shanghai) Automotive Systems Co Ltd., Faurecia
Wuhan Automotive Seating Co Ltd. and Faurecia Qingdao Exhaust
Systems Co Ltd – as well as one new company in South Korea,
Faurecia Trim Korea Ltd.
Faurecia also acquired a 50% interest held by the Duroplast Group
in Faurecia Duroplast Mexico for €18.3 million, raising its stake in
the company to 100%.
In early 2007, Faurecia purchased certain assets of Cadence
Innovation in France for €0.4 million.
2-2 2006
In fi rst-half 2006, Faurecia purchased the US assets held by
the Copo Iberica group which is 50%-owned by Faurecia and
accounted for by the equity method. In addition, Kwang Jin Faurecia
was accounted for by the equity method for the fi rst time in 2006.
Formed in 2005, this South Korea-based company is 50%-owned
by Faurecia.
2-3 Impact on consolidated data of changes in scope of consolidation
Changes in scope of consolidation did not have a material impact
on the Group’s consolidated fi nancial statements.
1-18 Earnings per share
Basic earnings per share are calculated by dividing net income
attributable to equity holders of the parent company by the
weighted average number of shares outstanding during the year,
excluding treasury stock.
Diluted earnings per share are calculated by the treasury stock
method which consists of multiplying the number of outstanding
stock options by the ratio between the average exercise price of
outstanding stock options and the average share price for the
year. For the purpose of calculating diluted earnings per share,
the Group adjusts net income attributable to equity holders of
the parent company and the weighted average number of shares
outstanding for the effects of all dilutive potential ordinary shares
(such as stock options).
89Faurecia > 2007 Registration document
FAURECIA – CONSOLIDATED FINANCIAL STATEMENTS 7Notes to the consolidated fi nancial statements
NOTE 3 EVENTS AFTER THE BALANCE SHEET DATE
No signifi cant post-balance sheet events have occurred.
NOTE 4 INFORMATION BY BUSINESS SEGMENT AND GEOGRAPHIC AREA
IAS 14 defi nes a business segment as a distinguishable component
of an entity that is engaged in providing an individual product or
service or a group of related products or services and that is subject
to risks and returns that are different from those of other business
segments.
Faurecia has distinguished two separate business segments:
Interior modules and Other modules, which present different risk
profi les.
The segments defi ned refl ect Faurecia’s organization and internal
reporting structure.

90 Faurecia > 2007 Registration document
FAURECIA – CONSOLIDATED FINANCIAL STATEMENTS7 Notes to the consolidated fi nancial statements
4-1 Key fi gures by business segment
2007
(in € millions) Interior modules Other modulesHolding
companies Total
Net sales 8,758.7 3,958.6 189.3 12,906.7
Inter-segment eliminations (37.5) (19.1) (189.3) (245.9)
Consolidated sales 8,721.2 3,939.5 0.0 12,660.7
Operating margin (15.5) 136.6 0.0 121.1
Segment income (loss) (235.5) 128.4 (11.4) (118.5)
Net fi nancial expense (101.1)
Corporate income tax (13.6)
Equity in net income of companies accounted for by the equity method 2.3
Net loss for the year (230.9)
Segment assets
Property, plant and equipment, net 1,096.8 295.0 17.1 1,408.9
Other 3,234.7 1,043.2 18.8 4,296.7
Total segment assets 4,331.5 1,338.2 35.9 5,705.6
Investments in companies accounted for by the equity method 44.8 0.0 0.0 44.8
Other equity interests 1.8
Short and long-term fi nancial assets 624.1
Tax assets (current and deferred) 85.6
Total assets 6,461.9
Segment liabilities 2,573.4 817.0 3.1 3,393.5
Borrowings 2,197.7
Tax liabilities (current and deferred) 24.4
Shareholders’ equity and minority interests 846.3
Total liabilities 6,461.9
Capital expenditure 249.6 45.5 11.7 306.8
Depreciation of property, plant and equipment (263.4) (47.1) (3.2) (313.7)
Impairment in value of property, plant and equipment (23.7) (23.7)
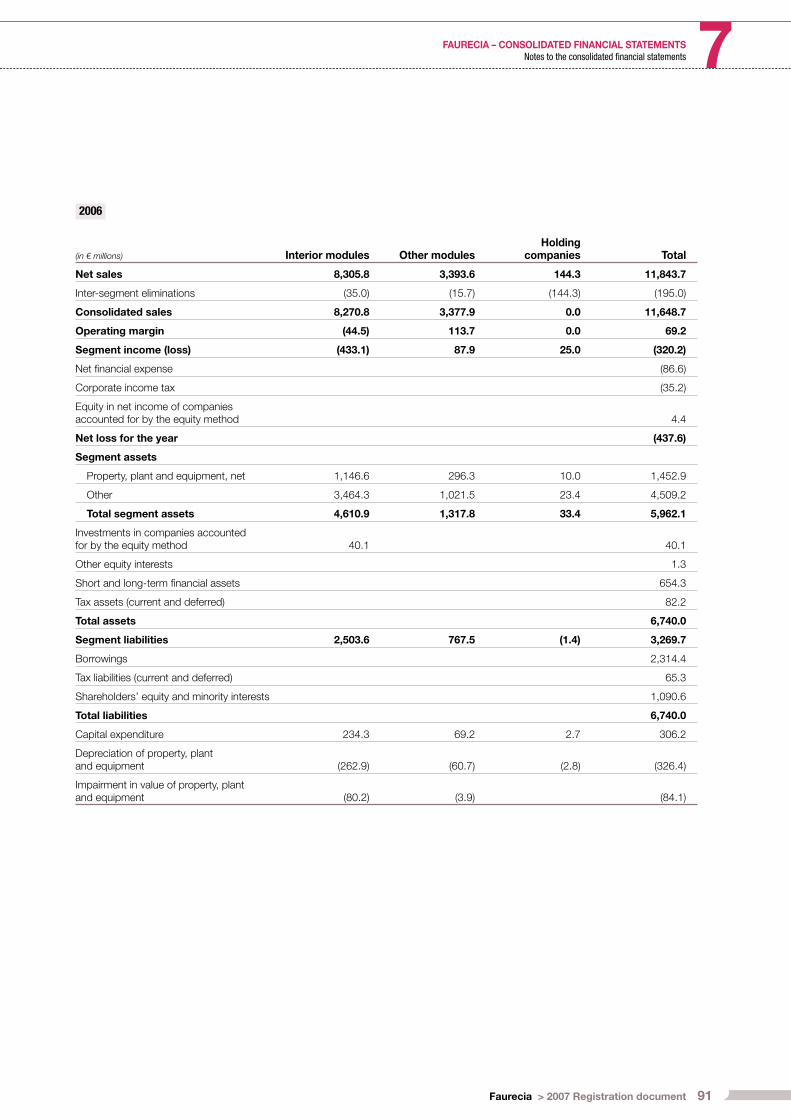
91Faurecia > 2007 Registration document
FAURECIA – CONSOLIDATED FINANCIAL STATEMENTS 7Notes to the consolidated fi nancial statements
2006
(in € millions) Interior modules Other modulesHolding
companies Total
Net sales 8,305.8 3,393.6 144.3 11,843.7
Inter-segment eliminations (35.0) (15.7) (144.3) (195.0)
Consolidated sales 8,270.8 3,377.9 0.0 11,648.7
Operating margin (44.5) 113.7 0.0 69.2
Segment income (loss) (433.1) 87.9 25.0 (320.2)
Net fi nancial expense (86.6)
Corporate income tax (35.2)
Equity in net income of companies accounted for by the equity method 4.4
Net loss for the year (437.6)
Segment assets
Property, plant and equipment, net 1,146.6 296.3 10.0 1,452.9
Other 3,464.3 1,021.5 23.4 4,509.2
Total segment assets 4,610.9 1,317.8 33.4 5,962.1
Investments in companies accounted for by the equity method 40.1 40.1
Other equity interests 1.3
Short and long-term fi nancial assets 654.3
Tax assets (current and deferred) 82.2
Total assets 6,740.0
Segment liabilities 2,503.6 767.5 (1.4) 3,269.7
Borrowings 2,314.4
Tax liabilities (current and deferred) 65.3
Shareholders’ equity and minority interests 1,090.6
Total liabilities 6,740.0
Capital expenditure 234.3 69.2 2.7 306.2
Depreciation of property, plant and equipment (262.9) (60.7) (2.8) (326.4)
Impairment in value of property, plant and equipment (80.2) (3.9) (84.1)
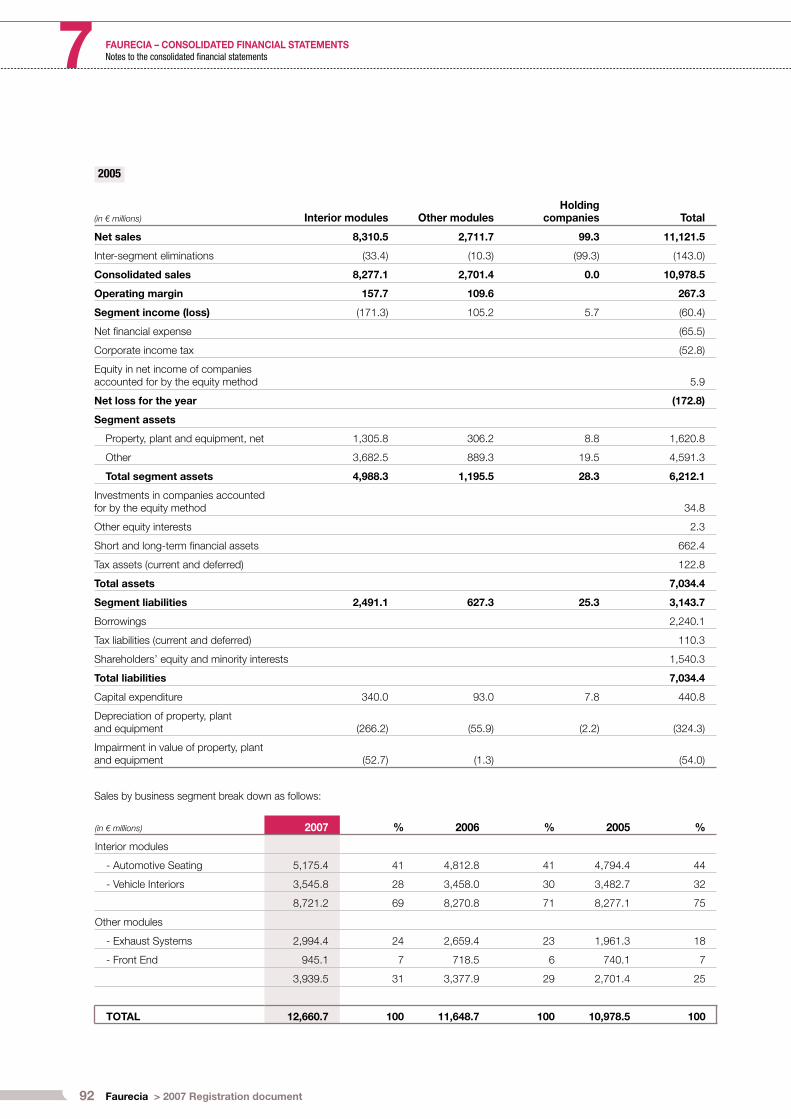
92 Faurecia > 2007 Registration document
FAURECIA – CONSOLIDATED FINANCIAL STATEMENTS7 Notes to the consolidated fi nancial statements
2005
(in € millions) Interior modules Other modulesHolding
companies Total
Net sales 8,310.5 2,711.7 99.3 11,121.5
Inter-segment eliminations (33.4) (10.3) (99.3) (143.0)
Consolidated sales 8,277.1 2,701.4 0.0 10,978.5
Operating margin 157.7 109.6 267.3
Segment income (loss) (171.3) 105.2 5.7 (60.4)
Net fi nancial expense (65.5)
Corporate income tax (52.8)
Equity in net income of companies accounted for by the equity method 5.9
Net loss for the year (172.8)
Segment assets
Property, plant and equipment, net 1,305.8 306.2 8.8 1,620.8
Other 3,682.5 889.3 19.5 4,591.3
Total segment assets 4,988.3 1,195.5 28.3 6,212.1
Investments in companies accounted for by the equity method 34.8
Other equity interests 2.3
Short and long-term fi nancial assets 662.4
Tax assets (current and deferred) 122.8
Total assets 7,034.4
Segment liabilities 2,491.1 627.3 25.3 3,143.7
Borrowings 2,240.1
Tax liabilities (current and deferred) 110.3
Shareholders’ equity and minority interests 1,540.3
Total liabilities 7,034.4
Capital expenditure 340.0 93.0 7.8 440.8
Depreciation of property, plant and equipment (266.2) (55.9) (2.2) (324.3)
Impairment in value of property, plant and equipment (52.7) (1.3) (54.0)
Sales by business segment break down as follows:
(in € millions) 2007 % 2006 % 2005 %
Interior modules
- Automotive Seating 5,175.4 41 4,812.8 41 4,794.4 44
- Vehicle Interiors 3,545.8 28 3,458.0 30 3,482.7 32
8,721.2 69 8,270.8 71 8,277.1 75
Other modules
- Exhaust Systems 2,994.4 24 2,659.4 23 1,961.3 18
- Front End 945.1 7 718.5 6 740.1 7
3,939.5 31 3,377.9 29 2,701.4 25
TOTAL 12,660.7 100 11,648.7 100 10,978.5 100

93Faurecia > 2007 Registration document
FAURECIA – CONSOLIDATED FINANCIAL STATEMENTS 7Notes to the consolidated fi nancial statements
4-2 Key fi gures by geographic area
Sales are analyzed by the country of sale; the other items are presented by location of the companies concerned.
2007
(in € millions) France Germany
Other European countries
North America
South America Asia
Other countries Total
Sales 3,059.8 3,022.1 3,388.9 1,853.6 292.6 752.0 291.7 12,660.7
Property, plant and equipment, net 442.9 143.9 510.6 148.3 82.9 63.0 17.3 1,408.9
Capital expenditure 113.8 15.3 96.8 26.4 29.1 19.4 6.0 306.8
Number of employees as of December 31 20,562 8,724 23,560 6,622 4,820 3,826 1,599 69,713
2006
(in € millions) France Germany
Other European countries
North America
South America Asia
Other countries Total
Sales 3,066.5 2,977.8 2,913.2 1,485.9 246.7 634.4 324.1 11,648.6
Property, plant and equipment, net 449.6 189.6 492.7 172.1 71.4 61.9 15.7 1,452.9
Capital expenditure 87.9 13.2 113.6 61.9 11.2 16.1 2.2 306.1
Number of employees as of December 31 20,276 9,364 20,593 6,867 4,529 2,774 1,279 65,682
2005
(in € millions) France Germany
Other European countries
North America
South America Asia
Other countries Total
Sales 3,382.6 2,892.0 2,583.1 1,234.7 221.6 404.2 260.2 10,978.4
Property, plant and equipment, net 508.8 241.8 521.4 185.1 80.3 62.5 20.8 1,620.7
Capital expenditure 139.2 68.6 125.9 51.2 19.6 31.8 4.5 440.8
Number of employees as of December 31 22,148 10,050 17,299 5,072 3,810 2,067 1,275 61,721
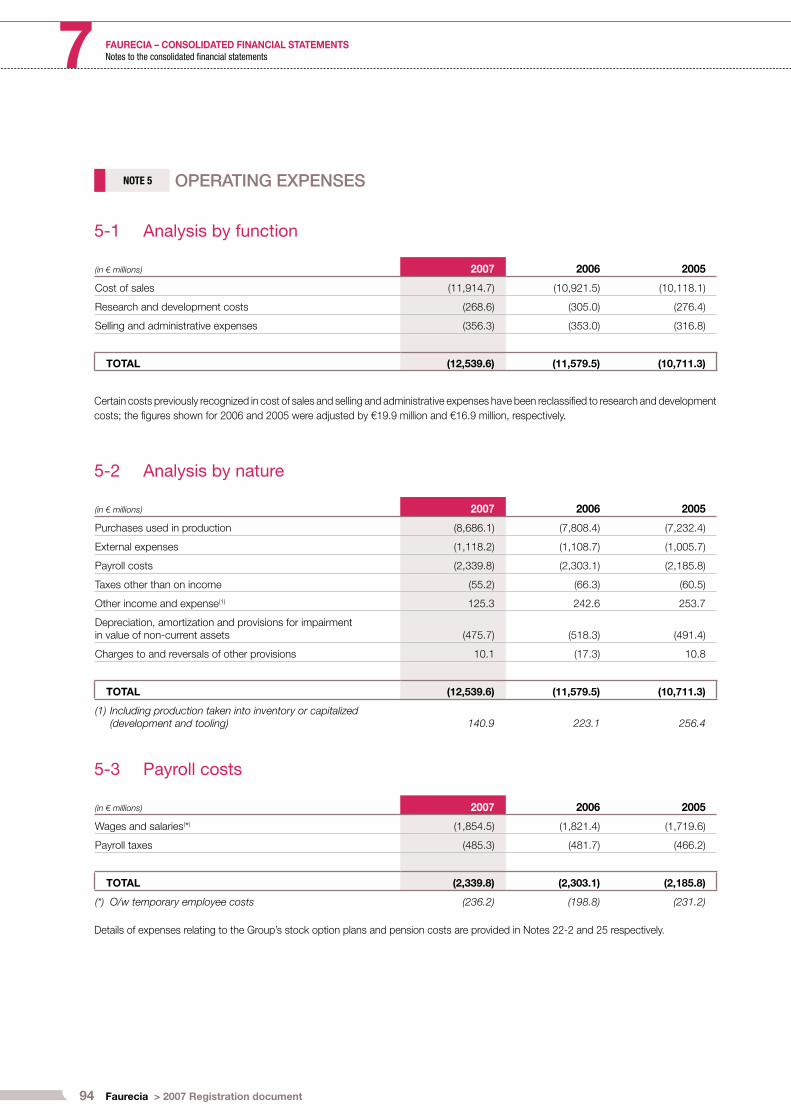
94 Faurecia > 2007 Registration document
FAURECIA – CONSOLIDATED FINANCIAL STATEMENTS7 Notes to the consolidated fi nancial statements
NOTE 5 OPERATING EXPENSES
5-1 Analysis by function
(in € millions) 2007 2006 2005
Cost of sales (11,914.7) (10,921.5) (10,118.1)
Research and development costs (268.6) (305.0) (276.4)
Selling and administrative expenses (356.3) (353.0) (316.8)
TOTAL (12,539.6) (11,579.5) (10,711.3)
5-2 Analysis by nature
(in € millions) 2007 2006 2005
Purchases used in production (8,686.1) (7,808.4) (7,232.4)
External expenses (1,118.2) (1,108.7) (1,005.7)
Payroll costs (2,339.8) (2,303.1) (2,185.8)
Taxes other than on income (55.2) (66.3) (60.5)
Other income and expense(1) 125.3 242.6 253.7
Depreciation, amortization and provisions for impairment in value of non-current assets (475.7) (518.3) (491.4)
Charges to and reversals of other provisions 10.1 (17.3) 10.8
TOTAL (12,539.6) (11,579.5) (10,711.3)
(1) Including production taken into inventory or capitalized (development and tooling) 140.9 223.1 256.4
Certain costs previously recognized in cost of sales and selling and administrative expenses have been reclassifi ed to research and development
costs; the fi gures shown for 2006 and 2005 were adjusted by €19.9 million and €16.9 million, respectively.
5-3 Payroll costs
(in € millions) 2007 2006 2005
Wages and salaries(*) (1,854.5) (1,821.4) (1,719.6)
Payroll taxes (485.3) (481.7) (466.2)
TOTAL (2,339.8) (2,303.1) (2,185.8)
(*) O/w temporary employee costs (236.2) (198.8) (231.2)
Details of expenses relating to the Group’s stock option plans and pension costs are provided in Notes 22-2 and 25 respectively.
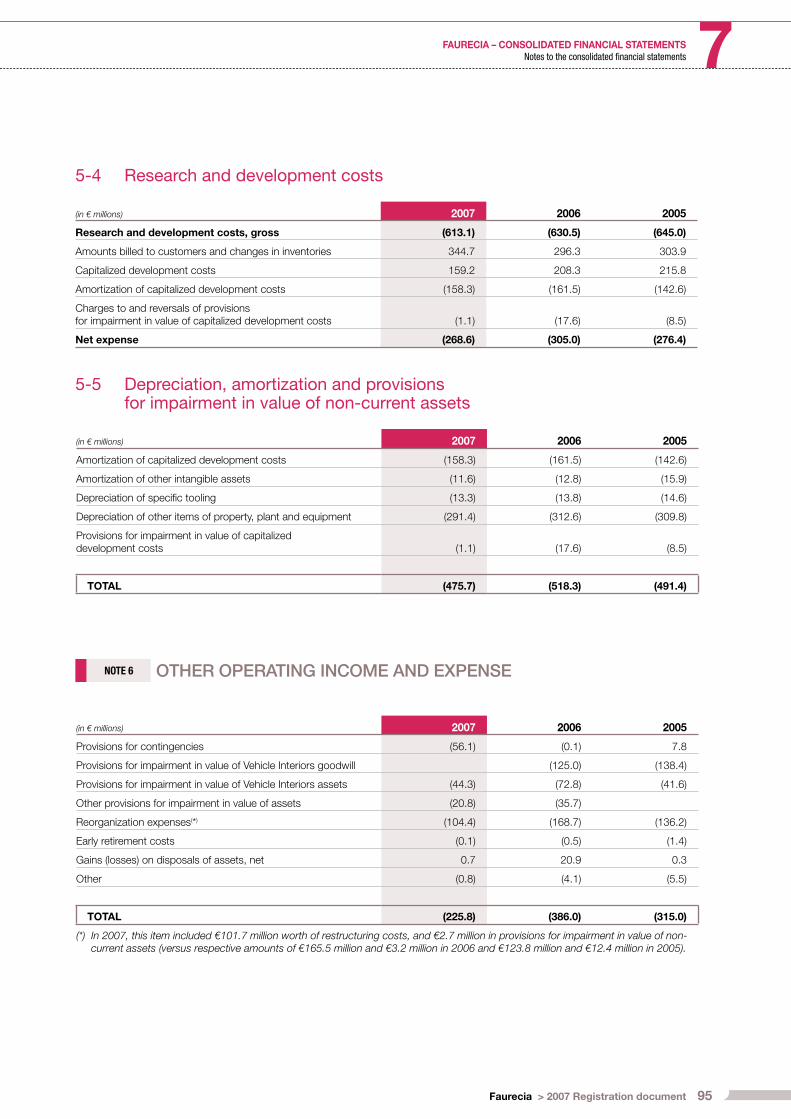
95Faurecia > 2007 Registration document
FAURECIA – CONSOLIDATED FINANCIAL STATEMENTS 7Notes to the consolidated fi nancial statements
5-4 Research and development costs
(in € millions) 2007 2006 2005
Research and development costs, gross (613.1) (630.5) (645.0)
A mounts billed to customers and changes in inventories 344.7 296.3 303.9
C apitalized development costs 159.2 208.3 215.8
A mortization of capitalized development costs (158.3) (161.5) (142.6)
C harges to and reversals of provisions for impairment in value of capitalized development costs (1.1) (17.6) (8.5)
Net expense (268.6) (305.0) (276.4)
5-5 Depreciation, amortization and provisions for impairment in value of non-current assets
(in € millions) 2007 2006 2005
Amortization of capitalized development costs (158.3) (161.5) (142.6)
Amortization of other intangible assets (11.6) (12.8) (15.9)
Depreciation of specifi c tooling (13.3) (13.8) (14.6)
Depreciation of other items of property, plant and equipment (291.4) (312.6) (309.8)
Provisions for impairment in value of capitalized development costs (1.1) (17.6) (8.5)
TOTAL (475.7) (518.3) (491.4)
NOTE 6 OTHER OPERATING INCOME AND EXPENSE
(in € millions) 2007 2006 2005
Provisions for contingencies (56.1) (0.1) 7.8
Provisions for impairment in value of Vehicle Interiors goodwill (125.0) (138.4)
Provisions for impairment in value of Vehicle Interiors assets (44.3) (72.8) (41.6)
Other provisions for impairment in value of assets (20.8) (35.7)
Reorganization expenses(*) (104.4) (168.7) (136.2)
Early retirement costs (0.1) (0.5) (1.4)
Gains (losses) on disposals of assets, net 0.7 20.9 0.3
Other (0.8) (4.1) (5.5)
TOTAL (225.8) (386.0) (315.0)
(*) In 2007, this item included €101.7 million worth of restructuring costs, and €2.7 million in provisions for impairment in value of non-current assets (versus respective amounts of €165.5 million and €3.2 million in 2006 and €123.8 million and €12.4 million in 2005).

96 Faurecia > 2007 Registration document
FAURECIA – CONSOLIDATED FINANCIAL STATEMENTS7 Notes to the consolidated fi nancial statements
Restructuring operations
Total reorganization expenses came to €104.4 million in 2007 and early retirement costs totaled €0.1 million. These amounts concerned
1,728 employees and break down as follows by country:
In € millionsNumber
of employees
France 26.9 412
Germany 12.5 283
Spain 41.1 665
Other 24.0 368
TOTAL 104.5 1,728
NOTE 7 OTHER FINANCIAL INCOME AND EXPENSE
(in € millions) 2007 2006 2005
Impact of discounting pension benefi t obligations (9.4) (9.5) (10.0)
Changes in the ineffective portion of gains and losses on currency hedges (1.9) (0.5) (0.9)
Changes in fair value of currency hedges relating to debt 0.8 0.1 (3.9)
Changes in fair value of interest rate instruments (8.7) 7.9 (1.1)
Gains on sales of securities 1.7
Other 3.7 (1.4) 3.3
TOTAL (13.8) (3.4) (12.6)
NOTE 8 CORPORATE INCOME TAX
Corporate income tax can be analyzed as follows:
(in € millions) 2007 2006 2005
Current taxes
- C orporate income tax currently payable (8.8) (37.0) (27.3)
- T ax on intercompany dividends, tax reassessments (11.1) (4.8)
(8.8) (48.1) (32.1)
Deferred taxes
- D eferred taxes for the year (3.7) 44.1 4.3
- I mpairment of deferred tax assets recognized in prior periods (1.1) (31.2) (25.0)
Deferred taxes (4.8) 12.9 (20.7)
TOTAL (13.6) (35.2) (52.8)
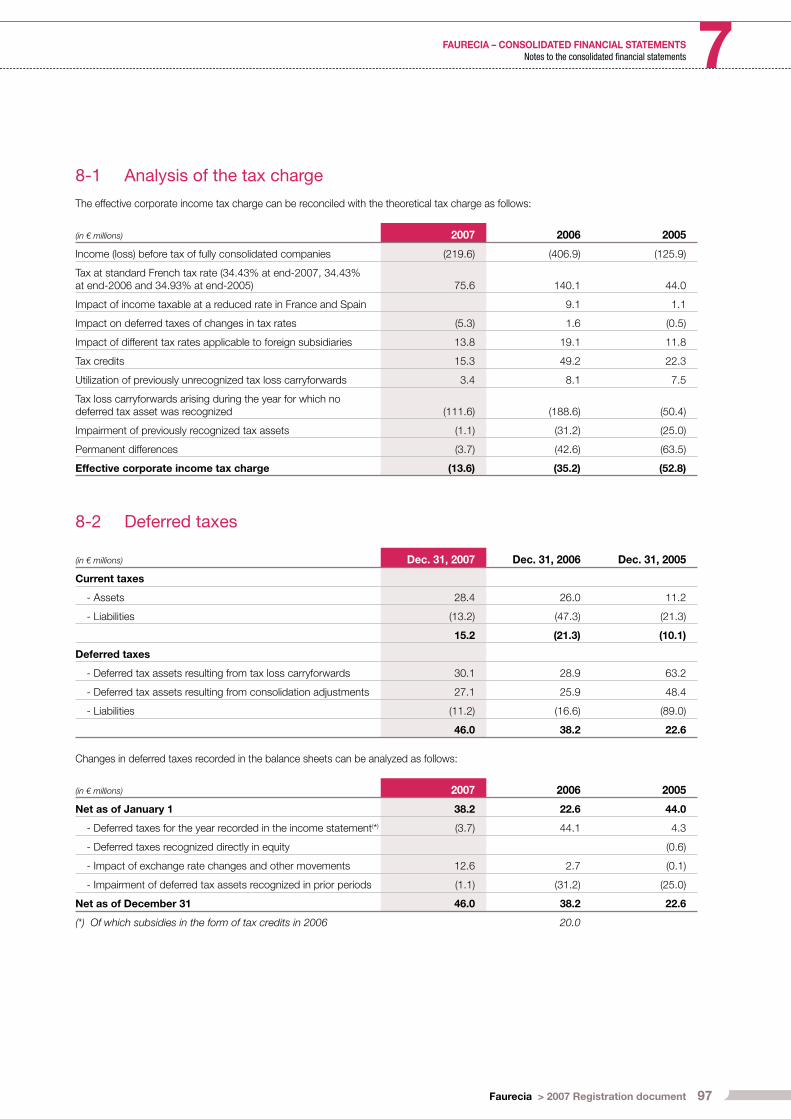
97Faurecia > 2007 Registration document
FAURECIA – CONSOLIDATED FINANCIAL STATEMENTS 7Notes to the consolidated fi nancial statements
8-1 Analysis of the tax charge
The effective corporate income tax charge can be reconciled with the theoretical tax charge as follows:
(in € millions) 2007 2006 2005
Income (loss) before tax of fully consolidated companies (219.6) (406.9) (125.9)
Tax at standard French tax rate (34.43% at end-2007, 34.43% at end-2006 and 34.93% at end-2005) 75.6 140.1 44.0
Impact of income taxable at a reduced rate in France and Spain 9.1 1.1
Impact on deferred taxes of changes in tax rates (5.3) 1.6 (0.5)
Impact of different tax rates applicable to foreign subsidiaries 13.8 19.1 11.8
Tax credits 15.3 49.2 22.3
Utilization of previously unrecognized tax loss carryforwards 3.4 8.1 7.5
Tax loss carryforwards arising during the year for which no deferred tax asset was recognized (111.6) (188.6) (50.4)
Impairment of previously recognized tax assets (1.1) (31.2) (25.0)
Permanent differences (3.7) (42.6) (63.5)
Effective corporate income tax charge (13.6) (35.2) (52.8)
8-2 Deferred taxes
(in € millions) Dec. 31, 2007 Dec. 31, 2006 Dec. 31, 2005
Current taxes
- Assets 28.4 26.0 11.2
- Liabilities (13.2) (47.3) (21.3)
15.2 (21.3) (10.1)
Deferred taxes
- Deferred tax assets resulting from tax loss carryforwards 30.1 28.9 63.2
- Deferred tax assets resulting from consolidation adjustments 27.1 25.9 48.4
- Liabilities (11.2) (16.6) (89.0)
46.0 38.2 22.6
Changes in deferred taxes recorded in the balance sheets can be analyzed as follows:
(in € millions) 2007 2006 2005
Net as of January 1 38.2 22.6 44.0
- Deferred taxes for the year recorded in the income statement(*) (3.7) 44.1 4.3
- Deferred taxes recognized directly in equity (0.6)
- Impact of exchange rate changes and other movements 12.6 2.7 (0.1)
- Impairment of deferred tax assets recognized in prior periods (1.1) (31.2) (25.0)
Net as of December 31 46.0 38.2 22.6
(*) Of which subsidies in the form of tax credits in 2006 20.0
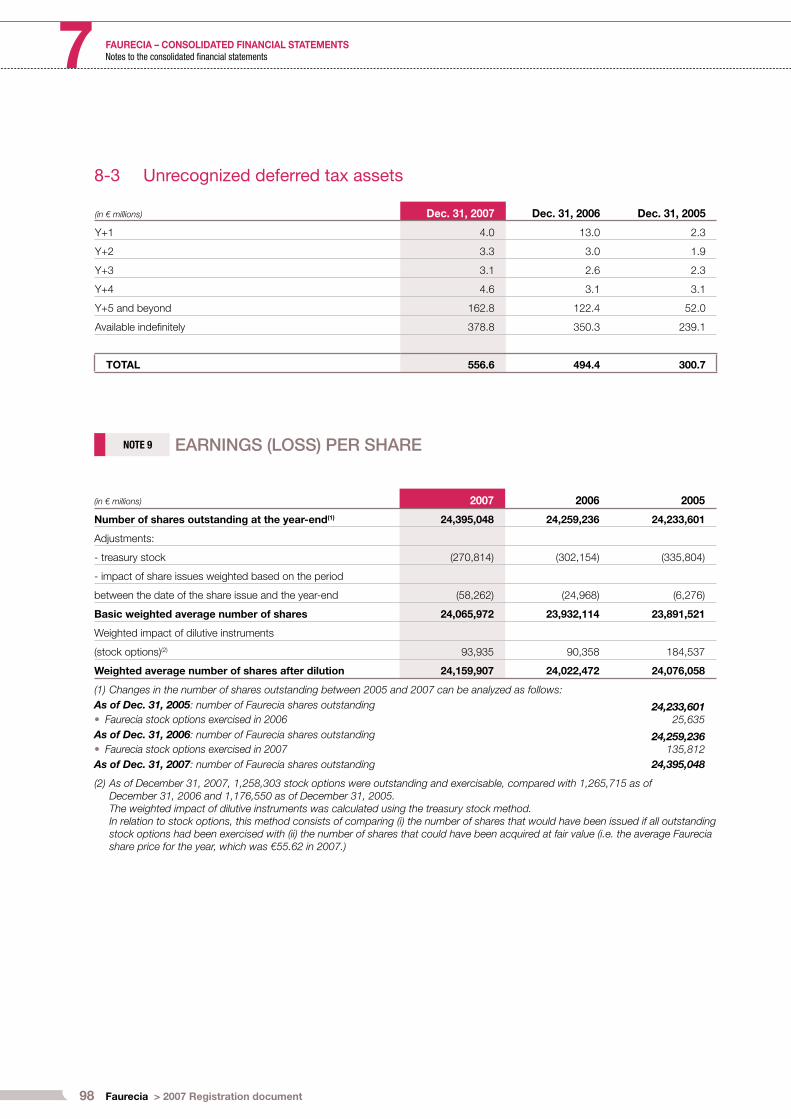
98 Faurecia > 2007 Registration document
FAURECIA – CONSOLIDATED FINANCIAL STATEMENTS7 Notes to the consolidated fi nancial statements
8-3 Unrecognized deferred tax assets
(in € millions) Dec. 31, 2007 Dec. 31, 2006 Dec. 31, 2005
Y+1 4.0 13.0 2.3
Y+2 3.3 3.0 1.9
Y+3 3.1 2.6 2.3
Y+4 4.6 3.1 3.1
Y+5 and beyond 162.8 122.4 52.0
Available indefi nitely 378.8 350.3 239.1
TOTAL 556.6 494.4 300.7
NOTE 9 EARNINGS (LOSS) PER SHARE
(in € millions) 2007 2006 2005
Number of shares outstanding at the year-end(1) 24,395,048 24,259,236 24,233,601
Adjustments:
- treasury stock (270,814) (302,154) (335,804)
- impact of share issues weighted based on the period
between the date of the share issue and the year-end (58,262) (24,968) (6,276)
Basic weighted average number of shares 24,065,972 23,932,114 23,891,521
Weighted impact of dilutive instruments
(stock options)(2) 93,935 90,358 184,537
Weighted average number of shares after dilution 24,159,907 24,022,472 24,076,058
(1) Changes in the number of shares outstanding between 2005 and 2007 can be analyzed as follows:
As of Dec. 31, 2005: number of Faurecia shares outstanding
Faurecia stock options exercised in 2006•24,233,601
25,635
As of Dec. 31, 2006: number of Faurecia shares outstanding
Faurecia stock options exercised in 2007•24,259,236
135,812
As of Dec. 31, 2007: number of Faurecia shares outstanding 24,395,048
(2) As of December 31, 2007, 1,258,303 stock options were outstanding and exercisable, compared with 1,265,715 as of December 31, 2006 and 1,176,550 as of December 31, 2005.The weighted impact of dilutive instruments was calculated using the treasury stock method.In relation to stock options, this method consists of comparing (i) the number of shares that would have been issued if all outstanding stock options had been exercised with (ii) the number of shares that could have been acquired at fair value (i.e. the average Faurecia share price for the year, which was €55.62 in 2007.)

99Faurecia > 2007 Registration document
FAURECIA – CONSOLIDATED FINANCIAL STATEMENTS 7Notes to the consolidated fi nancial statements
Basic and diluted earnings (loss) per share
Basic and diluted loss per share breakdown as follows:
2007 2006 2005
Net loss (in € millions) (237.5) (447.9) (182.5)
Per share data (in euros)
- basic earnings (loss) per share (9.87) (18.72) (7.64)
- diluted earnings (loss) per share (9.87) (18.72) (7.64)
NOTE 10 GOODWILL
(in € millions) Gross Impairment Net
Net goodwill as of January 1, 2005 1,546.0 0.0 1,546.0
Acquisitions and minority interest buyouts 6.8 6.8
Translation adjustments and other movements 0.1 0.1
Impairment of goodwill (Vehicle Interiors) (138.4) (138.4)
Net goodwill as of December 31, 2005 1,552.9 (138.4) 1,414.5
Translation adjustments and other movements (0.2) (0.2)
Impairment of goodwill (Vehicle Interiors) (125.0) (125.0)
Net goodwill as of December 31, 2006 1,552.7 (263.4) 1,289.3
Acquisitions and minority interest buyouts 10.3 10.3
Translation adjustments and other movements (11.0) (11.0)
Net goodwill as of December 31, 2007 1,552.0 (263.4) 1,288.6
Net goodwill breaks down as follows by business:
(in € millions) Dec. 31, 2007 Dec. 31, 2006 Dec. 31, 2005
Automotive Seating 792.5 792.5 792.7
Vehicle Interiors 247.0 239.3 364.3
Front End 96.1 96.1 96.1
Exhaust Systems 153.0 161.4 161.4
TOTAL 1,288.6 1,289.3 1,414.5
In accordance with the accounting policies described in Notes 1-2
and 1-5, the carrying amount of each CGU to which goodwill
has been allocated has been compared with the higher of the
CGU’s value in use and market value. Value in use corresponds
to the present value of net future cash fl ows based on the most
recent forecasts drawn up by Group Management for each cash-
generating unit concerned. The most recent forecasts used were
based on the Group’s 2008-2011 medium-term business plan.
The calculation is performed by projecting to perpetuity projected
cash fl ows for the last year of the business plan (i.e. 2011), applying
a growth rate determined based on analysts’ forecast trends for
the automotive market.
The growth rate applied in 2007, 2006 and 2005 was 1.5%.
Faurecia called on an independent expert to calculate the weighted
average cost of capital used to discount future cash fl ows. The
market parameters used in the expert’s calculation were based on
a sample of 11 companies operating in the automotive supplier
sector (six in Europe and fi ve in the US). On the basis of these
parameters and a market risk premium of 4.7%, the weighted
average cost of capital used to discount future cash fl ows was set
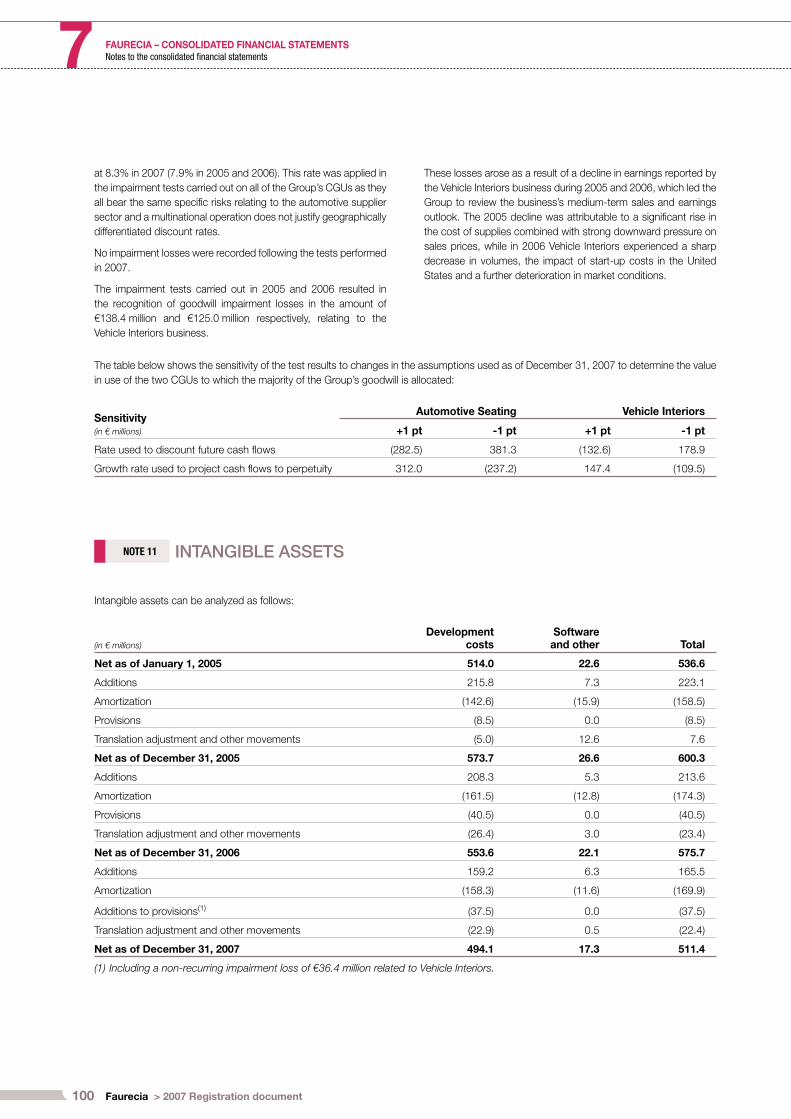
100 Faurecia > 2007 Registration document
FAURECIA – CONSOLIDATED FINANCIAL STATEMENTS7 Notes to the consolidated fi nancial statements
at 8.3% in 2007 (7.9% in 2005 and 2006). This rate was applied in
the impairment tests carried out on all of the Group’s CGUs as they
all bear the same specifi c risks relating to the automotive supplier
sector and a multinational operation does not justify geographically
differentiated discount rates.
No impairment losses were recorded following the tests performed
in 2007.
The impairment tests carried out in 2005 and 2006 resulted in
the recognition of goodwill impairment losses in the amount of
€138.4 million and €125.0 million respectively, relating to the
Vehicle Interiors business.
These losses arose as a result of a decline in earnings reported by
the Vehicle Interiors business during 2005 and 2006, which led the
Group to review the business’s medium-term sales and earnings
outlook. The 2005 decline was attributable to a signifi cant rise in
the cost of supplies combined with strong downward pressure on
sales prices, while in 2006 Vehicle Interiors experienced a sharp
decrease in volumes, the impact of start-up costs in the United
States and a further deterioration in market conditions.
The table below shows the sensitivity of the test results to changes in the assumptions used as of December 31, 2007 to determine the value
in use of the two CGUs to which the majority of the Group’s goodwill is allocated:
Sensitivity(in € millions)
Automotive Seating Vehicle Interiors
+1 pt -1 pt +1 pt -1 pt
Rate used to discount future cash fl ows (282.5) 381.3 (132.6) 178.9
Growth rate used to project cash fl ows to perpetuity 312.0 (237.2) 147.4 (109.5)
NOTE 11 INTANGIBLE ASSETS
Intangible assets can be analyzed as follows:
(in € millions)
Development costs
Software and other Total
Net as of January 1, 2005 514.0 22.6 536.6
Additions 215.8 7.3 223.1
Amortization (142.6) (15.9) (158.5)
Provisions (8.5) 0.0 (8.5)
Translation adjustment and other movements (5.0) 12.6 7.6
Net as of December 31, 2005 573.7 26.6 600.3
Additions 208.3 5.3 213.6
Amortization (161.5) (12.8) (174.3)
Provisions (40.5) 0.0 (40.5)
Translation adjustment and other movements (26.4) 3.0 (23.4)
Net as of December 31, 2006 553.6 22.1 575.7
Additions 159.2 6.3 165.5
Amortization (158.3) (11.6) (169.9)
Additions to provisions(1) (37.5) 0.0 (37.5)
Translation adjustment and other movements (22.9) 0.5 (22.4)
Net as of December 31, 2007 494.1 17.3 511.4
(1) Including a non-recurring impairment loss of €36.4 million related to Vehicle Interiors.

101Faurecia > 2007 Registration document
FAURECIA – CONSOLIDATED FINANCIAL STATEMENTS 7Notes to the consolidated fi nancial statements
NOTE 12 PROPERTY, PLANT AND EQUIPMENT
(in € millions) Land BuildingsPlant and
equipmentSpecifi c
tooling
Other and assets under construction Total
Net as of January 1, 2005 70.5 361.0 818.3 30.2 254.4 1,534.4
Additions (including own work capitalized)(1) 2.6 31.2 148.3 31.9 226.8 440.8
Disposals (0.1) (21.4) (98.3) 0.0 (17.5) (137.3)
Depreciation and provisions for impairment in value (0.3) (39.7) (235.1) (14.8) (45.4) (335.3)
Non-recurring impairment losses(2) 0.0 0.0 (41.5) 0.0 0.0 (41.5)
Depreciation written off on disposals 0.0 20.3 91.4 0.0 16.4 128.1
Translation adjustment 1.7 14.4 34.3 0.3 8.2 58.9
Other movements 0.5 24.0 133.8 (17.2) (168.4) (27.3)
Net as of December 31, 2005 74.9 389.8 851.2 30.4 274.5 1,620.8
Additions (including own work capitalized)(1) 0.7 19.2 94.0 19.2 173.1 306.2
Disposals (13.2) (9.3) (137.9) 0.0 (14.7) (175.1)
Depreciation and provisions for impairment in value (0.3) (43.9) (225.4) (13.8) (47.6) (331.0)
Non-recurring impairment losses(2) (2.5) (24.5) (45.7) (7.8) (3.5) (84.0)
Depreciation written off on disposals 0.0 7.0 126.3 0.0 11.9 145.2
Translation adjustment (0.5) (3.9) (17.5) (0.2) (1.0) (23.1)
Other movements (0.2) 12.9 117.3 0.0 (136.1) (6.1)
Net as of December 31, 2006 58.9 347.3 762.3 27.8 256.6 1,452.9
Additions (including own work capitalized)(1) 1.6 28.0 96.1 13.8 169.2 308.7
Disposals (2.3) (31.4) (170.0) (11.9) (29.5) (245.1)
Depreciation and provisions for impairment in value (0.3) (38.2) (213.8) (13.5) (41.4) (307.2)
Non-recurring impairment losses(2) (0.5) (5.8) (13.6) (1.3) (2.5) (23.7)
Depreciation written off on disposals 1.5 30.1 152.0 11.9 27.4 222.9
Translation adjustment (0.8) (0.6) (9.2) (0.1) 0.2 (10.5)
Other movements (0.5) 19.3 114.2 0.5 (122.6) 10.9
Net as of December 31, 2007 57.6 348.7 718.0 27.2 257.4 1,408.9
(1) Including assets held under finance leases in 2005: 6.9 in 2006: 4.0 in 2007: 1.9
(2) Of which: Vehicle Interiors Automotive Seating Front end modules
in 2005in 2006in 2007
(41.5)(65.0)(2.9)
(15.1)(21.9)
(3.9)
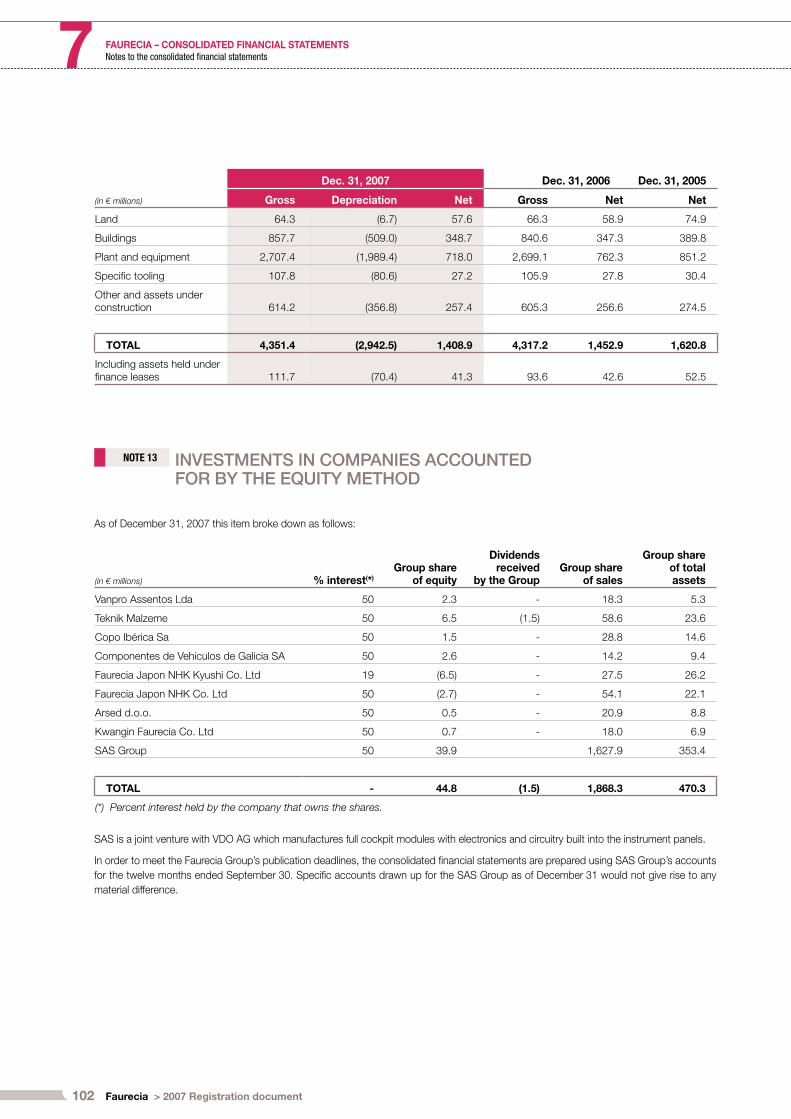
102 Faurecia > 2007 Registration document
FAURECIA – CONSOLIDATED FINANCIAL STATEMENTS7 Notes to the consolidated fi nancial statements
(in € millions)
Dec. 31, 2007 Dec. 31, 2006 Dec. 31, 2005
Gross Depreciation Net Gross Net Net
Land 64.3 (6.7) 57.6 66.3 58.9 74.9
Buildings 857.7 (509.0) 348.7 840.6 347.3 389.8
Plant and equipment 2,707.4 (1,989.4) 718.0 2,699.1 762.3 851.2
Specifi c tooling 107.8 (80.6) 27.2 105.9 27.8 30.4
Other and assets under construction 614.2 (356.8) 257.4 605.3 256.6 274.5
TOTAL 4,351.4 (2,942.5) 1,408.9 4,317.2 1,452.9 1,620.8
Including assets held under fi nance leases 111.7 (70.4) 41.3 93.6 42.6 52.5
NOTE 13 INVESTMENTS IN COMPANIES ACCOUNTED FOR BY THE EQUITY METHOD
As of December 31, 2007 this item broke down as follows:
(in € millions) % interest(*)
Group share of equity
Dividends received
by the GroupGroup share
of sales
Group share of total assets
Vanpro Assentos Lda 50 2.3 - 18.3 5.3
Teknik Malzeme 50 6.5 (1.5) 58.6 23.6
Copo Ibérica Sa 50 1.5 - 28.8 14.6
Componentes de Vehiculos de Galicia SA 50 2.6 - 14.2 9.4
Faurecia Japon NHK Kyushi Co. Ltd 19 (6.5) - 27.5 26.2
Faurecia Japon NHK Co. Ltd 50 (2.7) - 54.1 22.1
Arsed d.o.o. 50 0.5 - 20.9 8.8
Kwangin Faurecia Co. Ltd 50 0.7 - 18.0 6.9
SAS Group 50 39.9 1,627.9 353.4
TOTAL - 44.8 (1.5) 1,868.3 470.3
(*) Percent interest held by the company that owns the shares.
SAS is a joint venture with VDO AG which manufactures full cockpit modules with electronics and circuitry built into the instrument panels.
In order to meet the Faurecia Group’s publication deadlines, the consolidated fi nancial statements are prepared using SAS Group’s accounts
for the twelve months ended September 30. Specifi c accounts drawn up for the SAS Group as of December 31 would not give rise to any
material difference.

103Faurecia > 2007 Registration document
FAURECIA – CONSOLIDATED FINANCIAL STATEMENTS 7Notes to the consolidated fi nancial statements
13-2 Group equity in the net assets of companies accounted for by the equity method
(in € millions) Dec. 31, 2007 Dec. 31, 2006 Dec. 31, 2005
Non-current assets 35.0 42.0 34.6
Current assets 400.7 400.6 380.0
Cash and cash equivalents 34.6 21.3 32.2
TOTAL ASSETS 470.3 463.9 446.8
Shareholders’ equity 44.8 40.1 34.8
Borrowings 28.1 33.2 25.5
Other non-current liabilities 21.7 14.9 48.5
Non-fi nancial current liabilities 375.7 375.7 338.0
TOTAL LIABILITIES AND SHAREHOLDERS’ EQUITY 470.3 463.9 446.8
13-1 Change in investments in companies accounted for by the equity method
(in € millions) 2007 2006 2005
Group equity in underlying net assets at beginning of year 40.1 34.8 33.1
Dividends (1.5) (2.8) (4.0)
Group equity in net income 2.3 4.4 5.9
Changes in scope of consolidation - 1.0
Capital increase 3.3 1.5
Translation adjustment 0.6 1.2 (0.2)
Group equity in underlying net assets at end of year 44.8 40.1 34.8
NOTE 14 OTHER EQUITY INTERESTS
(in € millions) % interest
Dec. 31, 2007 Dec. 31, 2006 Dec. 31, 2005
Gross Net Net Net
SCI Messei 100 0.4 0.1 0.1 0.1
Kwang Jin Faurecia Co. Ltd(*) 50 1.0
Taco-Faurecia 50 0.4 0.4 0.4 0.4
Faurecia Shin Sung(**) 60 0.6 0.6
Other - 1.3 0.7 0.8 0.8
TOTAL 2.7 1.8 1.3 2.3
(*) A South-Korean company accounted for by the equity method for the first time in 2006.(**) A South-Korean company which will be accounted for by the equity method for the first time in 2008.
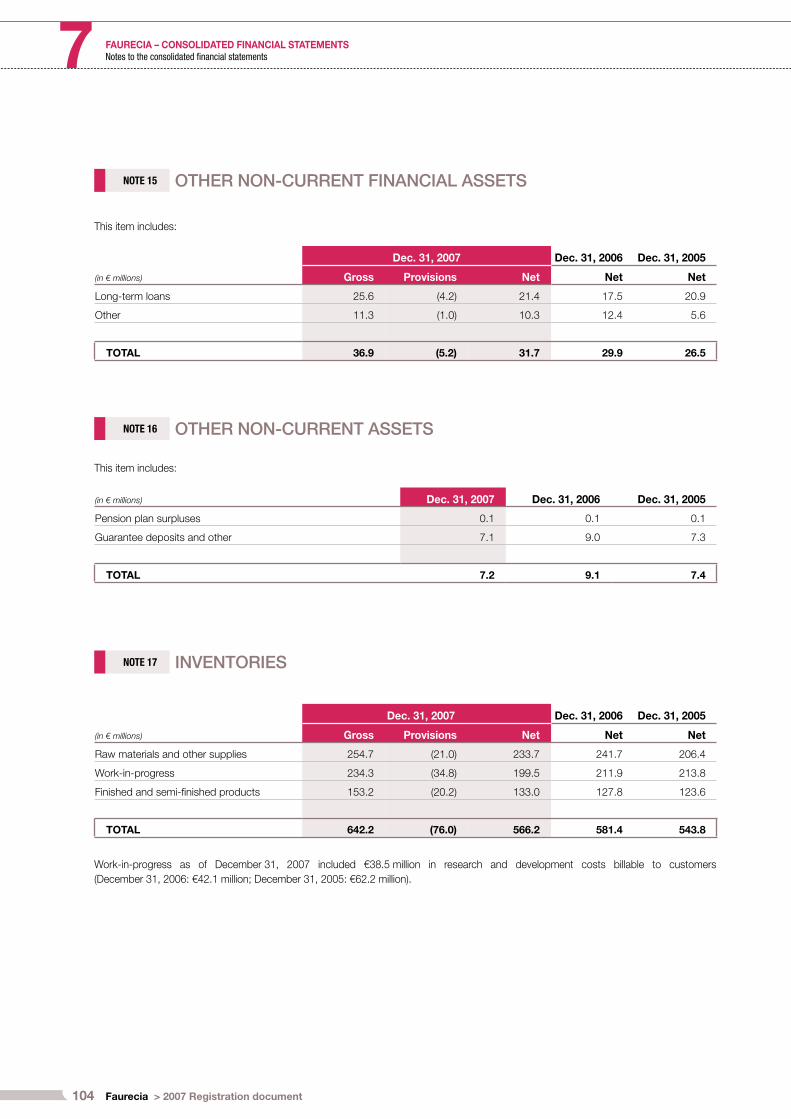
104 Faurecia > 2007 Registration document
FAURECIA – CONSOLIDATED FINANCIAL STATEMENTS7 Notes to the consolidated fi nancial statements
NOTE 15 OTHER NON-CURRENT FINANCIAL ASSETS
This item includes:
(in € millions)
Dec. 31, 2007 Dec. 31, 2006 Dec. 31, 2005
Gross Provisions Net Net Net
Long-term loans 25.6 (4.2) 21.4 17.5 20.9
Other 11.3 (1.0) 10.3 12.4 5.6
TOTAL 36.9 (5.2) 31.7 29.9 26.5
NOTE 16 OTHER NON-CURRENT ASSETS
This item includes:
(in € millions) Dec. 31, 2007 Dec. 31, 2006 Dec. 31, 2005
Pension plan surpluses 0.1 0.1 0.1
Guarantee deposits and other 7.1 9.0 7.3
TOTAL 7.2 9.1 7.4
NOTE 17 INVENTORIES
(in € millions)
Dec. 31, 2007 Dec. 31, 2006 Dec. 31, 2005
Gross Provisions Net Net Net
Raw materials and other supplies 254.7 (21.0) 233.7 241.7 206.4
Work-in-progress 234.3 (34.8) 199.5 211.9 213.8
Finished and semi-fi nished products 153.2 (20.2) 133.0 127.8 123.6
TOTAL 642.2 (76.0) 566.2 581.4 543.8
Work-in-progress as of December 31, 2007 included €38.5 million in r esearch and d evelopment costs billable to customers
(December 31, 2006: €42.1 million; December 31, 2005: €62.2 million).

105Faurecia > 2007 Registration document
FAURECIA – CONSOLIDATED FINANCIAL STATEMENTS 7Notes to the consolidated fi nancial statements
NOTE 18 TRADE ACCOUNTS RECEIVABLE
In 2000, Faurecia and certain of its French subsidiaries entered
into a one-year agreement with a Group bank providing for the
sale of receivables. Under this agreement, which was renewable
through November 2005, the bank’s right of recourse was limited
to the amount of the related subordinated deposit. The agreement
was renegotiated in 2004 for a one-year period, renewable through
December 2007, in order to provide for the transfer of substantially
all of the risks and rewards relating to the sold receivables. It was
subsequently renewed on November 30, 2007 for a further fi ve
years until end-November 2012.
In order to further diversify its fi nancial resources, in December 2002
Faurecia entered into a second one-year renewable agreement
with another Group bank, extending the receivables sale program
to other French and non-French subsidiaries in Europe. This
program remained in force until May 2007, when it was replaced
by renewable open-ended agreements that provide for the transfer
of substantially all of the risks and rewards of a portion of the sold
receivables.
In addition, in 2004, 2006 and 2007 other receivables sale
agreements were entered into between certain of the Group’s
European subsidiaries and a number of their banks, providing for
the transfer of substantially all of the risks and rewards of the sold
receivables.
The following table shows the amount of sold receivables with
maturities beyond December 31, 2007, 2006 and 2005 for which
substantially all the risks and rewards have been transferred, and
which have therefore been derecognized:
(in € millions) Dec. 31, 2007 Dec. 31, 2006 Dec. 31, 2005
Receivables sold and derecognized 387.5 246.5 212.5Individually impaired receivables do not represent a material
amount in relation to total trade accounts receivable.
Given the high quality of Group counterparties, late payments do not represent a material risk and general arise from administrative issues.
NOTE 19 OTHER OPERATING RECEIVABLES
(in € millions) Dec. 31, 2007 Dec. 31, 2006 Dec. 31, 2005
Prepayments to suppliers 68.5 61.4 66.3
Other receivables(1) 187.6 206.6 173.0

106 Faurecia > 2007 Registration document
FAURECIA – CONSOLIDATED FINANCIAL STATEMENTS7 Notes to the consolidated fi nancial statements
TOTAL 256.1 268.0 239.3
(1) Including recoverable VAT and other taxes. 182.7 195.9 165.5
NOTE 20 OTHER RECEIVABLES AND PREPAID EXPENSES
(in € millions) Dec. 31, 2007 Dec. 31, 2006 Dec. 31, 2005
Current maturities of long-term loans 0.1 0.1 0.1
Prepaid expenses 19.1 18.1 16.3
Current taxes 28.4 26.0 11.2
Other receivables 20.0 18.6 21.7
TOTAL 67.6 62.8 49.3
NOTE 21 CASH AND CASH EQUIVALENTS
As of December 31, 2006, cash and cash equivalents included
current account balances in debit of €401.5 million (December 31,
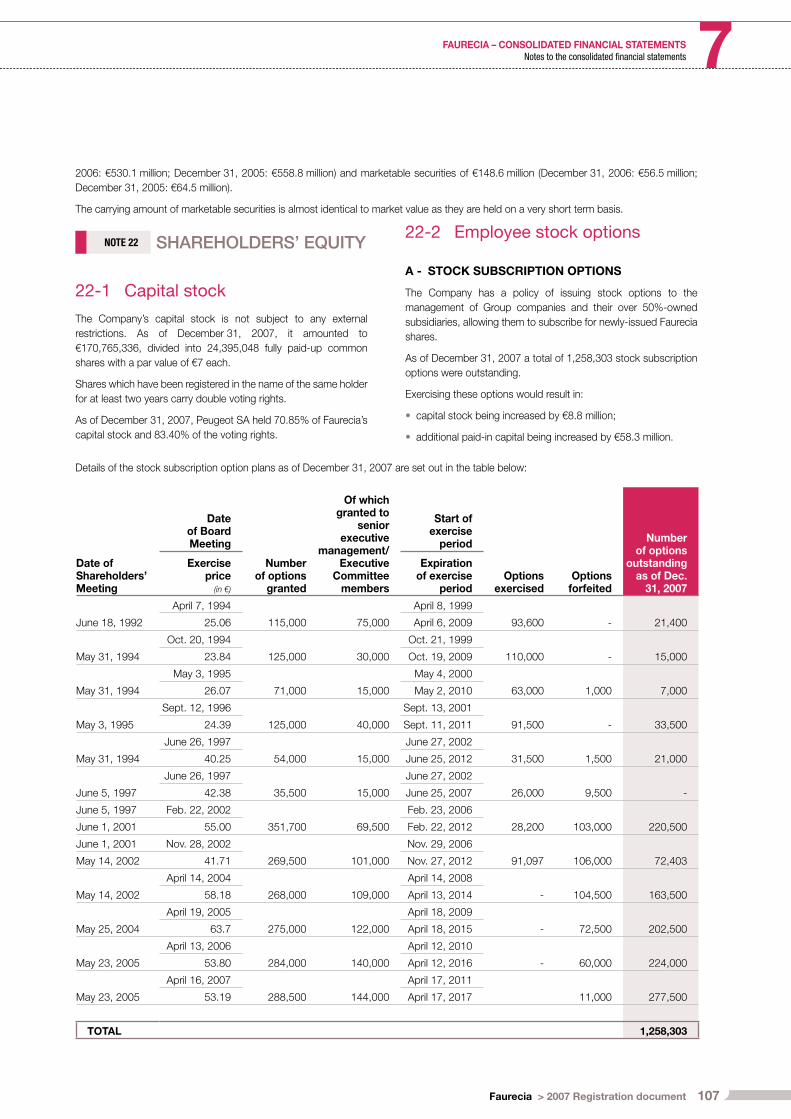
107Faurecia > 2007 Registration document
FAURECIA – CONSOLIDATED FINANCIAL STATEMENTS 7Notes to the consolidated fi nancial statements
2006: €530.1 million; December 31, 2005: €558.8 million) and marketable securities of €148.6 million (December 31, 2006: €56.5 million;
December 31, 2005: €64.5 million).
The carrying amount of marketable securities is almost identical to market value as they are held on a very short term basis.
NOTE 22 SHAREHOLDERS’ EQUITY
22-1 Capital stock
The Company’s capital stock is not subject to any external
restrictions. As of December 31, 2007, it amounted to
€170,765,336, divided into 24,395,048 fully paid-up common
shares with a par value of €7 each.
Shares which have been registered in the name of the same holder
for at least two years carry double voting rights.
As of December 31, 2007, Peugeot SA held 70.85% of Faurecia’s
capital stock and 83.40% of the voting rights.
22-2 Employee stock options
A - STOCK SUBSCRIPTION OPTIONS
The Company has a policy of issuing stock options to the
management of Group companies and their over 50%-owned
subsidiaries, allowing them to subscribe for newly-issued Faurecia
shares.
As of December 31, 2007 a total of 1,258,303 stock subscription
options were outstanding.
Exercising these options would result in:
capital stock being increased by €8.8 million;
additional paid-in capital being increased by €58.3 million.
•
•
Details of the stock subscription option plans as of December 31, 2007 are set out in the table below:
Date of Shareholders’ Meeting
Date of Board Meeting
Number of options
granted
Of which granted to
senior executive
management/Executive
Committee members
Start of exercise
period
Options exercised
Options forfeited
Number of options
outstanding as of Dec.
31, 2007
Exercise price
(in €)
Expiration of exercise
period
June 18, 1992
April 7, 1994
115,000 75,000
April 8, 1999
93,600 - 21,40025.06 April 6, 2009
May 31, 1994
Oct. 20, 1994
125,000 30,000
Oct. 21, 1999
110,000 - 15,00023.84 Oct. 19, 2009
May 31, 1994
May 3, 1995
71,000 15,000
May 4, 2000
63,000 1,000 7,00026.07 May 2, 2010
May 3, 1995
Sept. 12, 1996
125,000 40,000
Sept. 13, 2001
91,500 - 33,50024.39 Sept. 11, 2011
May 31, 1994
June 26, 1997
54,000 15,000
June 27, 2002
31,500 1,500 21,00040.25 June 25, 2012
June 5, 1997
June 26, 1997
35,500 15,000
June 27, 2002
26,000 9,500 -42.38 June 25, 2007
June 5, 1997 Feb. 22, 2002
351,700 69,500
Feb. 23, 2006
28,200 103,000 220,500June 1, 2001 55.00 Feb. 22, 2012
June 1, 2001 Nov. 28, 2002
269,500 101,000
Nov. 29, 2006
91,097 106,000 72,403May 14, 2002 41.71 Nov. 27, 2012
May 14, 2002
April 14, 2004
268,000 109,000
April 14, 2008
- 104,500 163,50058.18 April 13, 2014
May 25, 2004
April 19, 2005
275,000 122,000
April 18, 2009
- 72,500 202,50063.7 April 18, 2015
May 23, 2005
April 13, 2006
284,000 140,000
April 12, 2010
- 60,000 224,00053.80 April 12, 2016
May 23, 2005
April 16, 2007
288,500 144,000
April 17, 2011
11,000 277,50053.19 April 17, 2017
TOTAL 1,258,303

108 Faurecia > 2007 Registration document
FAURECIA – CONSOLIDATED FINANCIAL STATEMENTS7 Notes to the consolidated fi nancial statements
In accordance with IFRS 2, the fi ve plans issued since November 7, 2002 have been measured at fair value as of the grant date. The
measurement was performed using the Black & Scholes option pricing model, based on the following assumptions:
Plan of Nov. 28, 2002
Plan of April 14, 2004
Plan of April 19, 2005
Plan of April 13, 2006
Plan of April 16, 2007
Option exercise price (as of grant date) €41.71 €58.18 €63.70 €53.80 €53.19
Share price as of grant date €41.82 €58.45 €62.05 €53.15 €56.15
Vesting period 4 years 4 years 4 years 4 years 4 years
Expected share dividend 2% 2% 2 % 1.5% 0.0%
Zero coupon rate 3.57% 3.33% 2.93% 3.50% 4.41%
Expected share price volatility 40% 40% 40% 30% 30%
Changes in fair value are recorded under payroll costs over the vesting period, with a corresponding adjustment to equity. The related expense
in 2007 totaled €1.9 million, compared with €2.3 million in 2006.
B - STOCK PURCHASE OPTIONS
Between 1999 and 2001, the Company granted stock options to the management of Group companies and their over 50%-owned subsidiaries,
allowing them to purchase existing Faurecia shares.
As of December 31, 2007 a total of 260,980 stock purchase options were outstanding.
Details of the stock purchase option plans as of December 31, 2007 are set out in the table below:
Date of Shareholders’ Meeting
Date of Board
Meeting
Number of options
granted
Of which granted
to senior executive
managemen/Executive
Committee members
Start of exercise
period
Options exercised
Options forfeited
Number of options
outstanding as of Dec.
31, 2007
Exercise price
(in €)
Expiration of exercise
period
June 1, 1999
Sept. 6, 1999
200,000 53,100
Sept. 6, 2004
46,600 17,250 136,15052.0 Sept. 5, 2009
June 1, 1999 Sept. 4, 2000
254,000 54,900
Sept. 4, 2005
108,920 42,250 102,830May 22, 2000 40.0 Sept. 3, 2010
May 22, 2000
April 26, 2001
43,500 40,000
April 26, 2005
16,500 5,000 22,00054.5 April 25, 2011
TOTAL 260,980

109Faurecia > 2007 Registration document
FAURECIA – CONSOLIDATED FINANCIAL STATEMENTS 7Notes to the consolidated fi nancial statements
22-3 Treasury stock
As of December 31, 2007, Faurecia held 270,814 shares in treasury
stock, refl ecting the following transactions:
200,000 shares contributed by ECTRA in 1999;
19,613 shares purchased in 2000 for €0.8 million;
96,361 shares purchased in 2001 for €4.2 million;
96,860 shares purchased in 2002 for €3.8 million;
32,745 shares sold in 2004 for €1 million;
74,285 shares sold in 2005 for €2.3 million;
30,000 shares purchased in 2005 for €1.8 million;
33,650 shares sold in 2006 for €1.3 million;
•
•
•
•
•
•
•
•
31,340 shares sold in 2007 for €1.0 million.
The cost of the shares held in treasury stock as of December 31,
2007 totaled €11.5 million, representing an average cost of €42.48
per share.
At the year-end, Faurecia’s share price was €46.60. A 10% fall in
the share price would represent a decrease of €4.66 per share,
corresponding to a share price of €41.94 which would give rise to a
€0.1 million impairment loss.
These shares are being held for allocation on the exercise of stock
options granted to directors and managers of the Group further
to decisions of the Board of Directors on September 6, 1999,
September 4, 2000 and April 26, 2001. The options outstanding
as of December 31, 2007 are exercisable for 260,980 shares (see
Note 22.2 b).
•
NOTE 23 MINORITY INTERESTS
Changes in minority interests were as follows:
(in € millions) 2007 2006 2005
Balance as of January 1 64.2 64.4 60.9
Minority interests in share issues by subsidiaries 0.7
Other changes in scope of consolidation(*) (13.2) (1.0)
Minority interests in net income for the year 6.6 10.3 9.7
Dividends paid to minority shareholders (11.2) (6.2) (11.6)
Translation adjustments (2.1) (4.3) 5.7
Balance as of December 31 44.3 64.2 64.4
(*) Including Faurecia Duroplast Mexico (17.3)
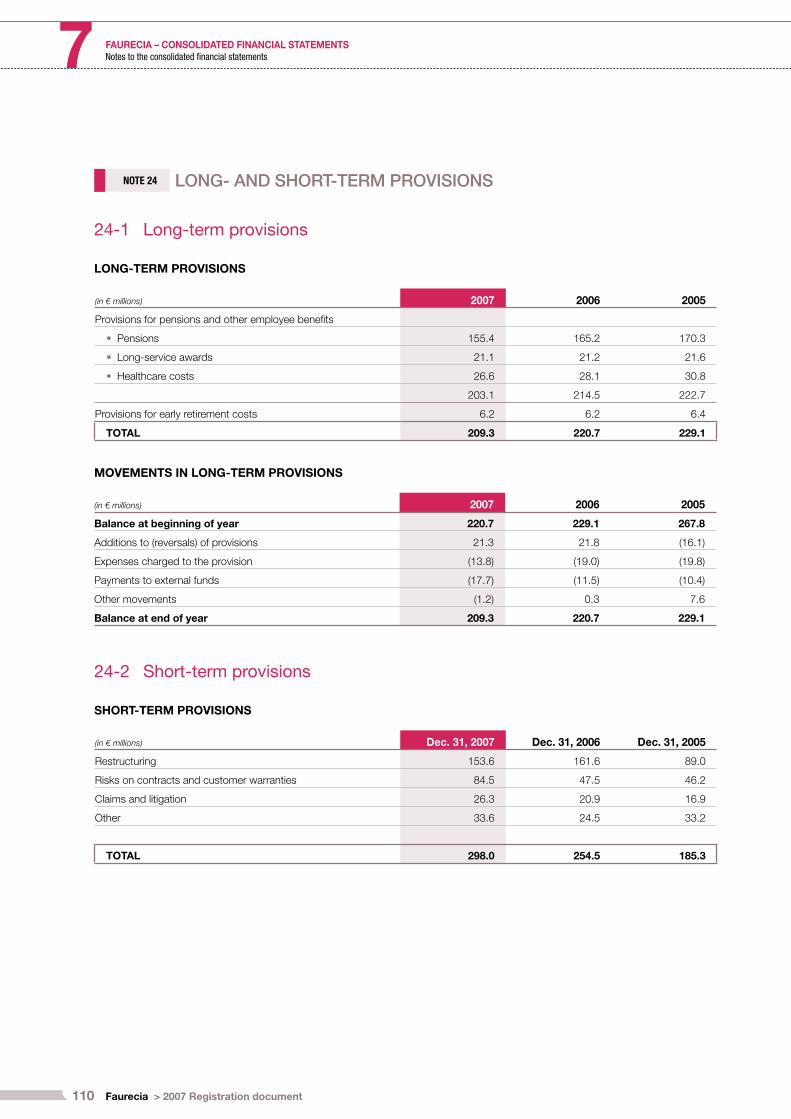
110 Faurecia > 2007 Registration document
FAURECIA – CONSOLIDATED FINANCIAL STATEMENTS7 Notes to the consolidated fi nancial statements
NOTE 24 LONG- AND SHORT-TERM PROVISIONS
24-1 Long-term provisions
LONG-TERM PROVISIONS
(in € millions) 2007 2006 2005
Provisions for pensions and other employee benefi ts
Pensions• 155.4 165.2 170.3
Long-service awards• 21.1 21.2 21.6
Healthcare costs• 26.6 28.1 30.8
203.1 214.5 222.7
Provisions for early retirement costs 6.2 6.2 6.4
TOTAL 209.3 220.7 229.1
MOVEMENTS IN LONG-TERM PROVISIONS
(in € millions) 2007 2006 2005
Balance at beginning of year 220.7 229.1 267.8
Additions to (reversals) of provisions 21.3 21.8 (16.1)
Expenses charged to the provision (13.8) (19.0) (19.8)
Payments to external funds (17.7) (11.5) (10.4)
Other movements (1.2) 0.3 7.6
Balance at end of year 209.3 220.7 229.1
24-2 Short-term provisions
SHORT-TERM PROVISIONS
(in € millions) Dec. 31, 2007 Dec. 31, 2006 Dec. 31, 2005
Restructuring 153.6 161.6 89.0
Risks on contracts and customer warranties 84.5 47.5 46.2
Claims and litigation 26.3 20.9 16.9
Other 33.6 24.5 33.2
TOTAL 298.0 254.5 185.3
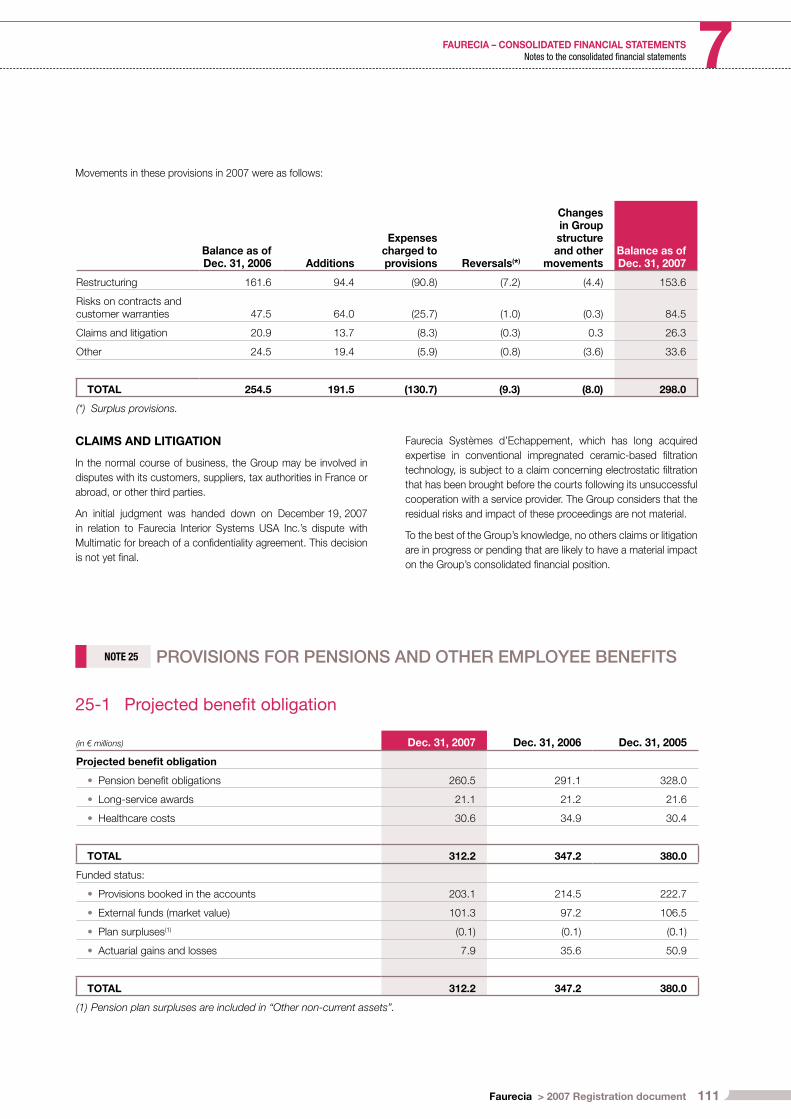
111Faurecia > 2007 Registration document
FAURECIA – CONSOLIDATED FINANCIAL STATEMENTS 7Notes to the consolidated fi nancial statements
Movements in these provisions in 2007 were as follows:
Balance as of Dec. 31, 2006 Additions
Expenses charged to provisions Reversals(*)
Changes in Group structure and other
movementsBalance as of Dec. 31, 2007
Restructuring 161.6 94.4 (90.8) (7.2) (4.4) 153.6
Risks on contracts and customer warranties 47.5 64.0 (25.7) (1.0) (0.3) 84.5
Claims and litigation 20.9 13.7 (8.3) (0.3) 0.3 26.3
Other 24.5 19.4 (5.9) (0.8) (3.6) 33.6
TOTAL 254.5 191.5 (130.7) (9.3) (8.0) 298.0
(*) Surplus provisions.
CLAIMS AND LITIGATION
In the normal course of business, the Group may be involved in
disputes with its customers, suppliers, tax authorities in France or
abroad, or other third parties.
An initial judgment was handed down on December 19, 2007
in relation to Faurecia Interior Systems USA Inc.’s dispute with
Multimatic for breach of a confi dentiality agreement. This decision
is not yet fi nal.
Faurecia Systèmes d’Echappement, which has long acquired
expertise in conventional impregnated ceramic-based fi ltration
technology, is subject to a claim concerning electrostatic fi ltration
that has been brought before the courts following its unsuccessful
cooperation with a service provider. The Group considers that the
residual risks and impact of these proceedings are not material.
To the best of the Group’s knowledge, no others claims or litigation
are in progress or pending that are likely to have a material impact
on the Group’s consolidated fi nancial position.
NOTE 25 PROVISIONS FOR PENSIONS AND OTHER EMPLOYEE BENEFITS
25-1 Projected benefi t obligation
(in € millions) Dec. 31, 2007 Dec. 31, 2006 Dec. 31, 2005
Projected benefi t obligation
Pension benefi t obligations• 260.5 291.1 328.0
Long-service awards• 21.1 21.2 21.6
Healthcare costs• 30.6 34.9 30.4
TOTAL 312.2 347.2 380.0
Funded status:
Provisions booked in the accounts• 203.1 214.5 222.7
External funds (market value)• 101.3 97.2 106.5
Plan surpluses(1)• (0.1) (0.1) (0.1)
Actuarial gains and losses• 7.9 35.6 50.9
TOTAL 312.2 347.2 380.0
(1) Pension plan surpluses are included in “Other non-current assets”.
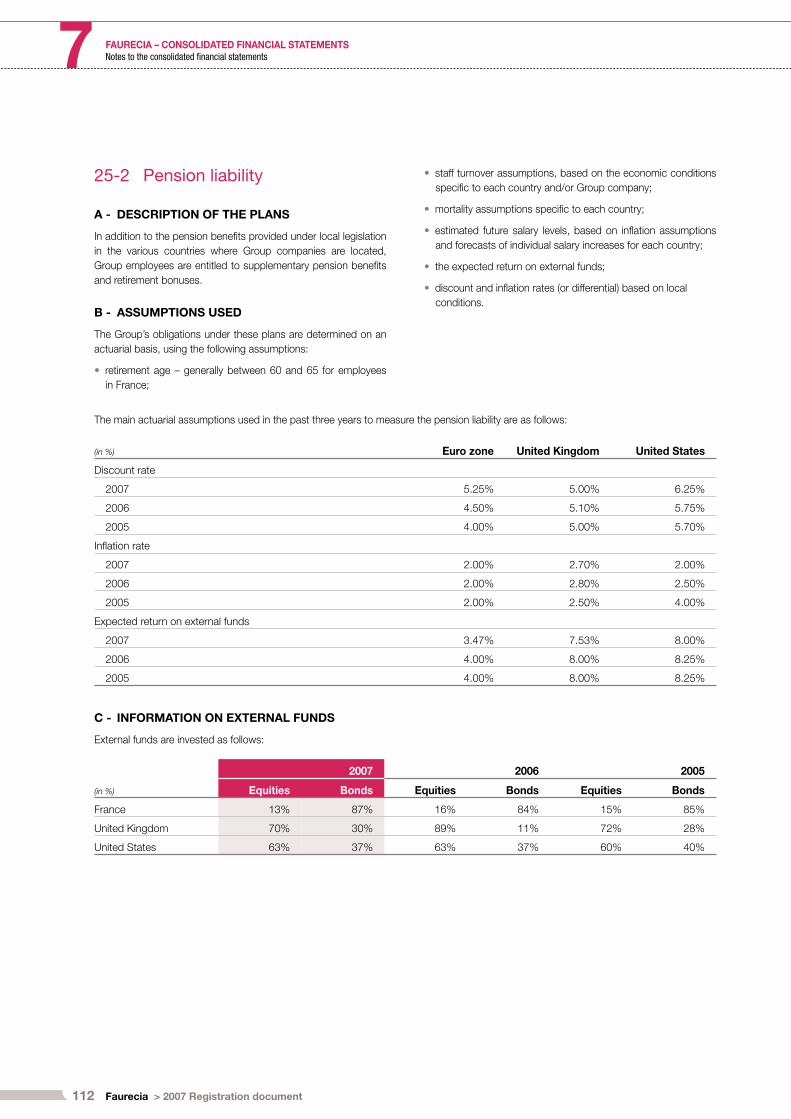
112 Faurecia > 2007 Registration document
FAURECIA – CONSOLIDATED FINANCIAL STATEMENTS7 Notes to the consolidated fi nancial statements
25-2 Pension liability
A - DESCRIPTION OF THE PLANS
In addition to the pension benefi ts provided under local legislation
in the various countries where Group companies are located,
Group employees are entitled to supplementary pension benefi ts
and retirement bonuses.
B - ASSUMPTIONS USED
The Group’s obligations under these plans are determined on an
actuarial basis, using the following assumptions:
retirement age – generally between 60 and 65 for employees
in France;
•
staff turnover assumptions, based on the economic conditions
specifi c to each country and/or Group company;
mortality assumptions specifi c to each country;
estimated future salary levels, based on infl ation assumptions
and forecasts of individual salary increases for each country;
the expected return on external funds;
discount and infl ation rates (or differential) based on local
conditions.
•
•
•
•
•
The main actuarial assumptions used in the past three years to measure the pension liability are as follows:
(in %) Euro zone United Kingdom United States
Discount rate
2007 5.25% 5.00% 6.25%
2006 4.50% 5.10% 5.75%
2005 4.00% 5.00% 5.70%
Infl ation rate
2007 2.00% 2.70% 2.00%
2006 2.00% 2.80% 2.50%
2005 2.00% 2.50% 4.00%
Expected return on external funds
2007 3.47% 7.53% 8.00%
2006 4.00% 8.00% 8.25%
2005 4.00% 8.00% 8.25%
C - INFORMATION ON EXTERNAL FUNDS
External funds are invested as follows:
(in %)
2007 2006 2005
Equities Bonds Equities Bonds Equities Bonds
France 13% 87% 16% 84% 15% 85%
United Kingdom 70% 30% 89% 11% 72% 28%
United States 63% 37% 63% 37% 60% 40%
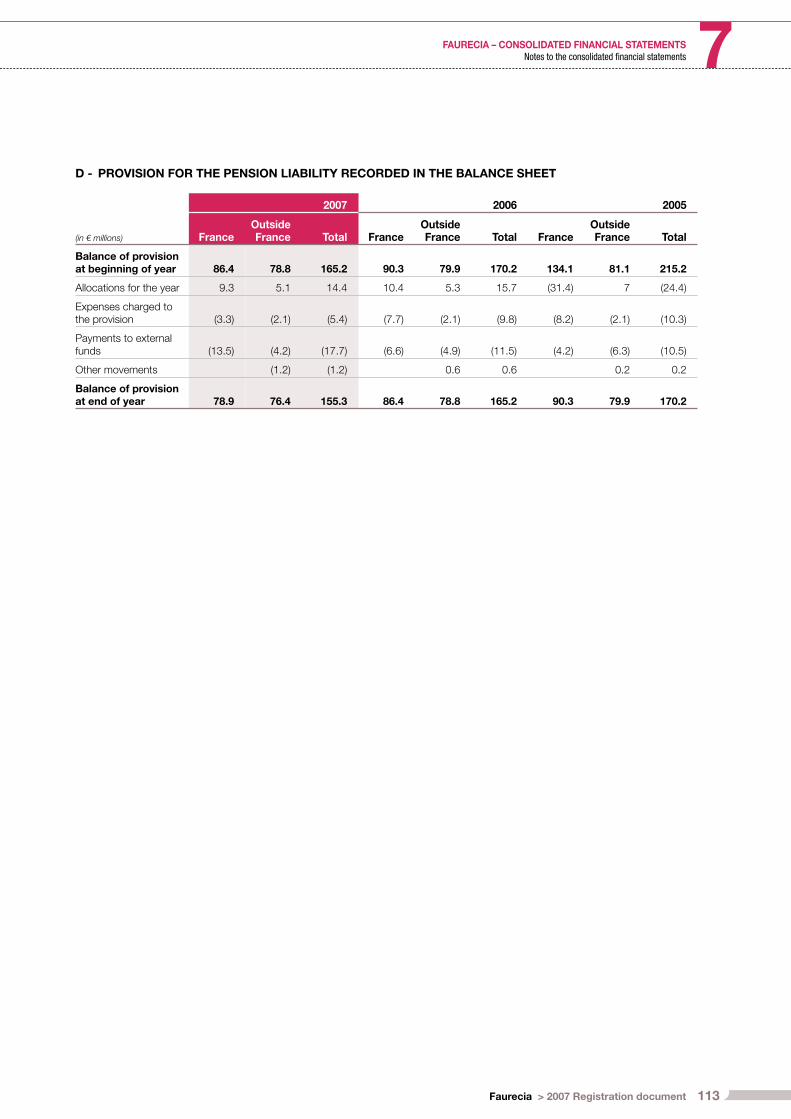
113Faurecia > 2007 Registration document
FAURECIA – CONSOLIDATED FINANCIAL STATEMENTS 7Notes to the consolidated fi nancial statements
D - PROVISION FOR THE PENSION LIABILITY RECORDED IN THE BALANCE SHEET
(in € millions)
2007 2006 2005
FranceOutside France Total France
Outside France Total France
Outside France Total
Balance of provision at beginning of year 86.4 78.8 165.2 90.3 79.9 170.2 134.1 81.1 215.2
Allocations for the year 9.3 5.1 14.4 10.4 5.3 15.7 (31.4) 7 (24.4)
Expenses charged to the provision (3.3) (2.1) (5.4) (7.7) (2.1) (9.8) (8.2) (2.1) (10.3)
Payments to external funds (13.5) (4.2) (17.7) (6.6) (4.9) (11.5) (4.2) (6.3) (10.5)
Other movements (1.2) (1.2) 0.6 0.6 0.2 0.2
Balance of provision at end of year 78.9 76.4 155.3 86.4 78.8 165.2 90.3 79.9 170.2
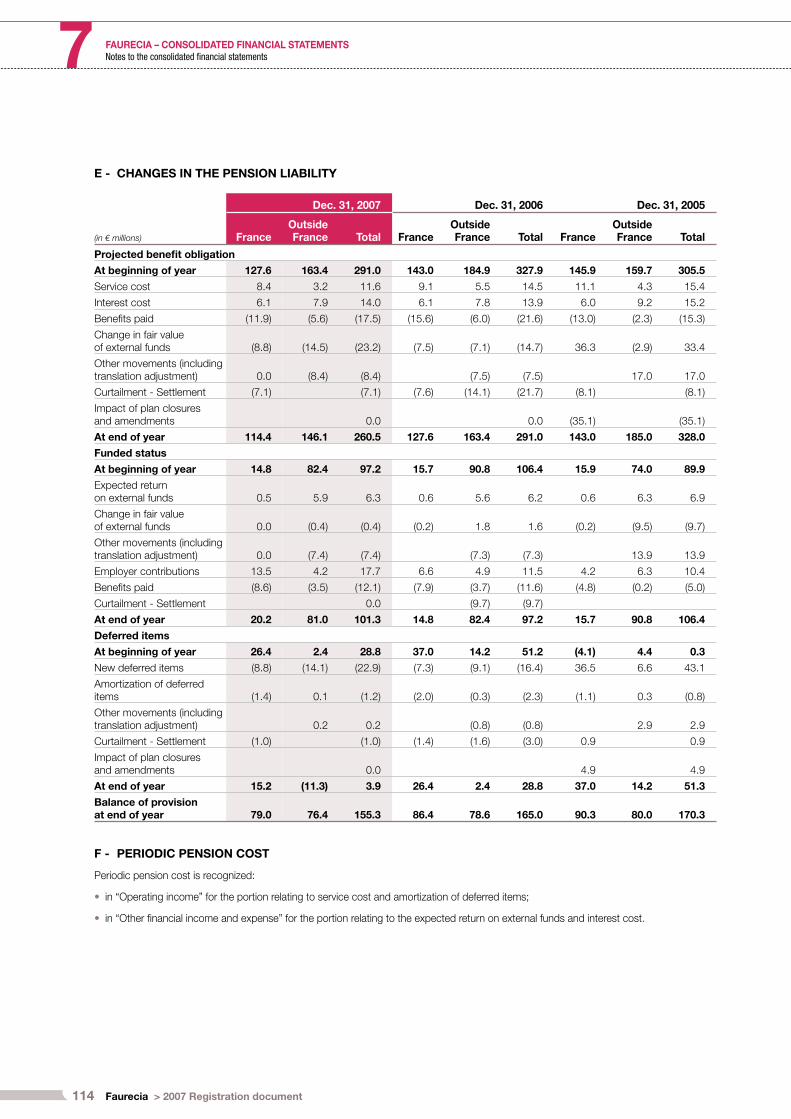
114 Faurecia > 2007 Registration document
FAURECIA – CONSOLIDATED FINANCIAL STATEMENTS7 Notes to the consolidated fi nancial statements
E - CHANGES IN THE PENSION LIABILITY
Dec. 31, 2007 Dec. 31, 2006 Dec. 31, 2005
(in € millions) FranceOutside France Total France
Outside France Total France
Outside France Total
Projected benefi t obligation
At beginning of year 127.6 163.4 291.0 143.0 184.9 327.9 145.9 159.7 305.5
Service cost 8.4 3.2 11.6 9.1 5.5 14.5 11.1 4.3 15.4
Interest cost 6.1 7.9 14.0 6.1 7.8 13.9 6.0 9.2 15.2
Benefi ts paid (11.9) (5.6) (17.5) (15.6) (6.0) (21.6) (13.0) (2.3) (15.3)
Change in fair value of external funds (8.8) (14.5) (23.2) (7.5) (7.1) (14.7) 36.3 (2.9) 33.4
Other movements (including translation adjustment) 0.0 (8.4) (8.4) (7.5) (7.5) 17.0 17.0
Curtailment - Settlement (7.1) (7.1) (7.6) (14.1) (21.7) (8.1) (8.1)
Impact of plan closures and amendments 0.0 0.0 (35.1) (35.1)
At end of year 114.4 146.1 260.5 127.6 163.4 291.0 143.0 185.0 328.0
Funded status
At beginning of year 14.8 82.4 97.2 15.7 90.8 106.4 15.9 74.0 89.9
Expected return on external funds 0.5 5.9 6.3 0.6 5.6 6.2 0.6 6.3 6.9
Change in fair value of external funds 0.0 (0.4) (0.4) (0.2) 1.8 1.6 (0.2) (9.5) (9.7)
Other movements (including translation adjustment) 0.0 (7.4) (7.4) (7.3) (7.3) 13.9 13.9
Employer contributions 13.5 4.2 17.7 6.6 4.9 11.5 4.2 6.3 10.4
Benefi ts paid (8.6) (3.5) (12.1) (7.9) (3.7) (11.6) (4.8) (0.2) (5.0)
Curtailment - Settlement 0.0 (9.7) (9.7)
At end of year 20.2 81.0 101.3 14.8 82.4 97.2 15.7 90.8 106.4
Deferred items
At beginning of year 26.4 2.4 28.8 37.0 14.2 51.2 (4.1) 4.4 0.3
New deferred items (8.8) (14.1) (22.9) (7.3) (9.1) (16.4) 36.5 6.6 43.1
Amortization of deferred items (1.4) 0.1 (1.2) (2.0) (0.3) (2.3) (1.1) 0.3 (0.8)
Other movements (including translation adjustment) 0.2 0.2 (0.8) (0.8) 2.9 2.9
Curtailment - Settlement (1.0) (1.0) (1.4) (1.6) (3.0) 0.9 0.9
Impact of plan closures and amendments 0.0 4.9 4.9
At end of year 15.2 (11.3) 3.9 26.4 2.4 28.8 37.0 14.2 51.3
Balance of provision at end of year 79.0 76.4 155.3 86.4 78.6 165.0 90.3 80.0 170.3
F - PERIODIC PENSION COST
Periodic pension cost is recognized:
in “Operating income” for the portion relating to service cost and amortization of deferred items;
in “Other fi nancial income and expense” for the portion relating to the expected return on external funds and interest cost.
•
•
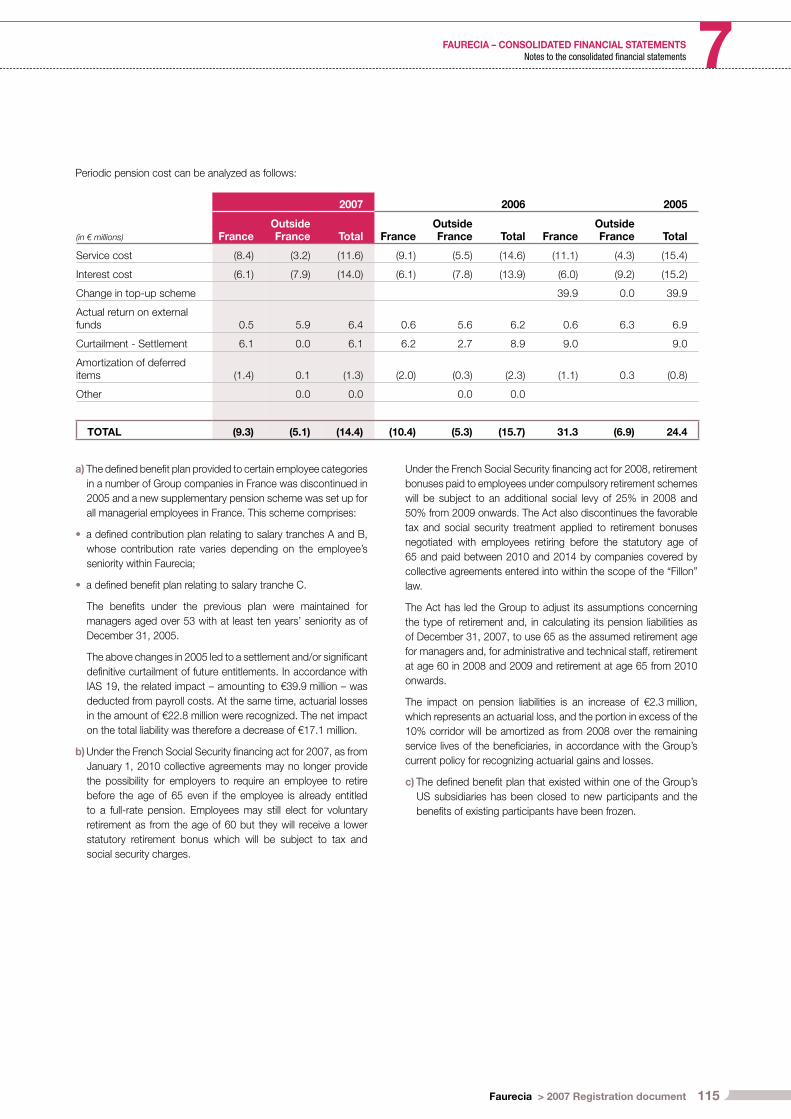
115Faurecia > 2007 Registration document
FAURECIA – CONSOLIDATED FINANCIAL STATEMENTS 7Notes to the consolidated fi nancial statements
Periodic pension cost can be analyzed as follows:
2007 2006 2005
(in € millions) FranceOutside France Total France
Outside France Total France
Outside France Total
Service cost (8.4) (3.2) (11.6) (9.1) (5.5) (14.6) (11.1) (4.3) (15.4)
Interest cost (6.1) (7.9) (14.0) (6.1) (7.8) (13.9) (6.0) (9.2) (15.2)
Change in top-up scheme 39.9 0.0 39.9
Actual return on external funds 0.5 5.9 6.4 0.6 5.6 6.2 0.6 6.3 6.9
Curtailment - Settlement 6.1 0.0 6.1 6.2 2.7 8.9 9.0 9.0
Amortization of deferred items (1.4) 0.1 (1.3) (2.0) (0.3) (2.3) (1.1) 0.3 (0.8)
Other 0.0 0.0 0.0 0.0
TOTAL (9.3) (5.1) (14.4) (10.4) (5.3) (15.7) 31.3 (6.9) 24.4
a) The defi ned benefi t plan provided to certain employee categories
in a number of Group companies in France was discontinued in
2005 and a new supplementary pension scheme was set up for
all managerial employees in France. This scheme comprises:
a defi ned contribution plan relating to salary tranches A and B,
whose contribution rate varies depending on the employee’s
seniority within Faurecia;
a defi ned benefi t plan relating to salary tranche C.
The benefi ts under the previous plan were maintained for
managers aged over 53 with at least ten years’ seniority as of
December 31, 2005.
The above changes in 2005 led to a settlement and/or signifi cant
defi nitive curtailment of future entitlements. In accordance with
IAS 19, the related impact – amounting to €39.9 million – was
deducted from payroll costs. At the same time, actuarial losses
in the amount of €22.8 million were recognized. The net impact
on the total liability was therefore a decrease of €17.1 million.
b) Under the French Social Security fi nancing act for 2007, as from
January 1, 2010 collective agreements may no longer provide
the possibility for employers to require an employee to retire
before the age of 65 even if the employee is already entitled
to a full-rate pension. Employees may still elect for voluntary
retirement as from the age of 60 but they will receive a lower
statutory retirement bonus which will be subject to tax and
social security charges.
•
•
Under the French Social Security fi nancing act for 2008, retirement
bonuses paid to employees under compulsory retirement schemes
will be subject to an additional social levy of 25% in 2008 and
50% from 2009 onwards. The Act also discontinues the favorable
tax and social security treatment applied to retirement bonuses
negotiated with employees retiring before the statutory age of
65 and paid between 2010 and 2014 by companies covered by
collective agreements entered into within the scope of the “Fillon”
law.
The Act has led the Group to adjust its assumptions concerning
the type of retirement and, in calculating its pension liabilities as
of December 31, 2007, to use 65 as the assumed retirement age
for managers and, for administrative and technical staff, retirement
at age 60 in 2008 and 2009 and retirement at age 65 from 2010
onwards.
The impact on pension liabilities is an increase of €2.3 million,
which represents an actuarial loss, and the portion in excess of the
10% corridor will be amortized as from 2008 over the remaining
service lives of the benefi ciaries, in accordance with the Group’s
current policy for recognizing actuarial gains and losses.
c) The defi ned benefi t plan that existed within one of the Group’s
US subsidiaries has been closed to new participants and the
benefi ts of existing participants have been frozen.

116 Faurecia > 2007 Registration document
FAURECIA – CONSOLIDATED FINANCIAL STATEMENTS7 Notes to the consolidated fi nancial statements
25-3 Long-service awards
The Group calculates its liability for the payment of long-service awards using the same method and assumptions as for its pension liability. A
provision has been set aside for long-service awards, as follows:
(in € millions) Dec. 31, 2007 Dec. 31, 2006 Dec. 31, 2005
French companies 10.4 10.7 11.2
Foreign companies 10.7 10.5 10.4
TOTAL 21.1 21.2 21.6
25-4 Healthcare costs
In addition to pension plans, some Group companies – mainly in the United States – cover the healthcare costs of their employees.
The related liability can be analyzed as follows:
(in € millions) Dec. 31, 2007 Dec. 31, 2006 Dec. 31, 2005
Foreign companies 26.6 28.1 30.8
TOTAL 26.6 28.1 30.8
Expenses recognized in connection with this liability break down as follows:
PERIODIC HEALTHCARE COSTS
(in € millions) 2007 2006 2005
Service cost (3.0) (2.3) (1.3)
Interest cost(*) (1.7) (1.8) (1.7)
Amortization of deferred items (0.4) (0.1) (0.1)
TOTAL (5.1) (4.2) (3.1)
(*) Interest cost is recorded under “Other financial income and expense”.
The impact of a one percentage point increase in medical cost
trend rates would be 9% rises in service cost, fi nancial expenses
and the projected benefi t obligation.
The impact of a one percentage point decrease in medical cost
trend rates would be 8% reductions in service cost, fi nancial
expenses and the projected benefi t obligation.
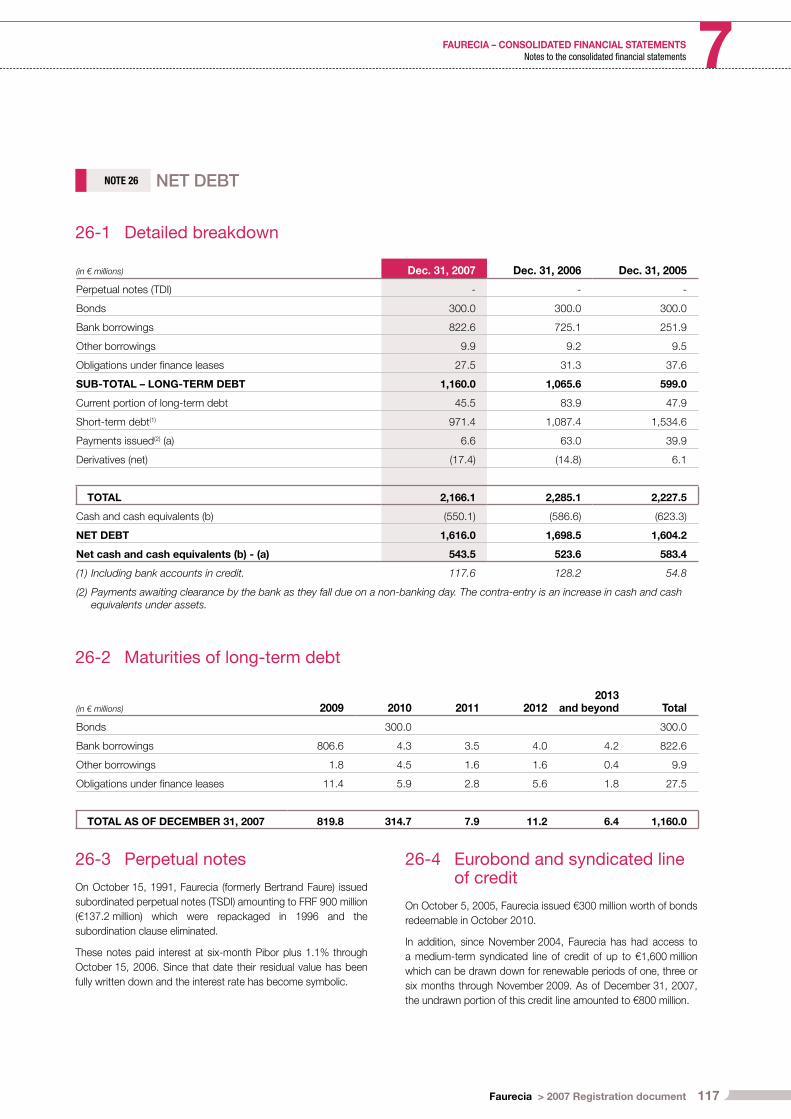
117Faurecia > 2007 Registration document
FAURECIA – CONSOLIDATED FINANCIAL STATEMENTS 7Notes to the consolidated fi nancial statements
NOTE 26 NET DEBT
26-1 Detailed breakdown
(in € millions) Dec. 31, 2007 Dec. 31, 2006 Dec. 31, 2005
Perpetual notes (TDI) - - -
Bonds 300.0 300.0 300.0
Bank borrowings 822.6 725.1 251.9
Other borrowings 9.9 9.2 9.5
Obligations under fi nance leases 27.5 31.3 37.6
SUB-TOTAL – LONG-TERM DEBT 1,160.0 1,065.6 599.0
Current portion of long-term debt 45.5 83.9 47.9
Short-term debt(1) 971.4 1,087.4 1,534.6
Payments issued(2) (a) 6.6 63.0 39.9
Derivatives (net) (17.4) (14.8) 6.1
TOTAL 2,166.1 2,285.1 2,227.5
Cash and cash equivalents (b) (550.1) (586.6) (623.3)
NET DEBT 1,616.0 1,698.5 1,604.2
Net cash and cash equivalents (b) - (a) 543.5 523.6 583.4
(1) Including bank accounts in credit. 117.6 128.2 54.8
(2) Payments awaiting clearance by the bank as they fall due on a non-banking day. The contra-entry is an increase in cash and cash equivalents under assets.
26-2 Maturities of long-term debt
(in € millions) 2009 2010 2011 20122013
and beyond Total
Bonds 300.0 300.0
Bank borrowings 806.6 4.3 3.5 4.0 4.2 822.6
Other borrowings 1.8 4.5 1.6 1.6 0.4 9.9
Obligations under fi nance leases 11.4 5.9 2.8 5.6 1.8 27.5
TOTAL AS OF DECEMBER 31, 2007 819.8 314.7 7.9 11.2 6.4 1,160.0
26-3 Perpetual notes
On October 15, 1991, Faurecia (formerly Bertrand Faure) issued
subordinated perpetual notes (TSDI) amounting to FRF 900 million
(€137.2 million) which were repackaged in 1996 and the
subordination clause eliminated.
These notes paid interest at six-month Pibor plus 1.1% through
October 15, 2006. Since that date their residual value has been
fully written down and the interest rate has become symbolic.
26-4 Eurobond and syndicated line of credit
On October 5, 2005, Faurecia issued €300 million worth of bonds
redeemable in October 2010.
In addition, since November 2004, Faurecia has had access to
a medium-term syndicated line of credit of up to €1,600 million
which can be drawn down for renewable periods of one, three or
six months through November 2009. As of December 31, 2007,
the undrawn portion of this credit line amounted to €800 million.
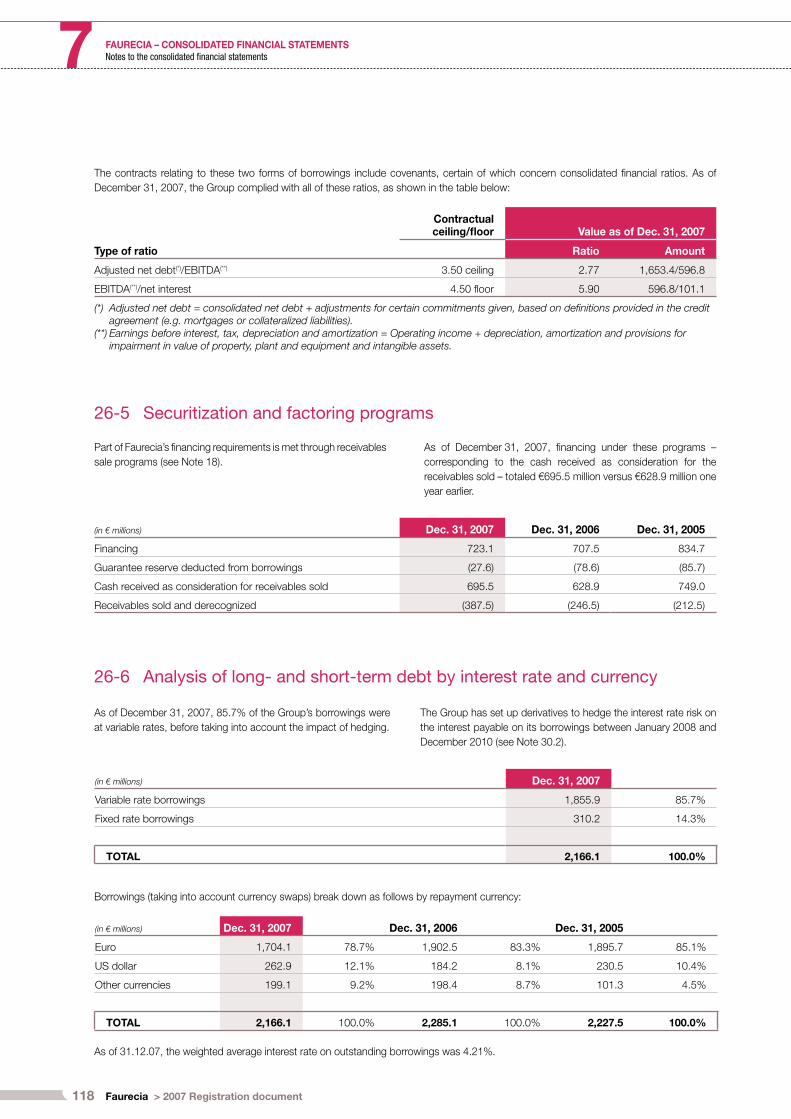
118 Faurecia > 2007 Registration document
FAURECIA – CONSOLIDATED FINANCIAL STATEMENTS7 Notes to the consolidated fi nancial statements
The contracts relating to these two forms of borrowings include covenants, certain of which concern consolidated fi nancial ratios. As of
December 31, 2007, the Group complied with all of these ratios, as shown in the table below:
Contractual ceiling/fl oor Value as of Dec. 31, 2007
Type of ratio Ratio Amount
Adjusted net debt(*)/EBITDA(**) 3.50 ceiling 2.77 1,653.4/596.8
EBITDA(**)/net interest 4.50 fl oor 5.90 596.8/101.1
(*) Adjusted net debt = consolidated net debt + adjustments for certain commitments given, based on definitions provided in the credit agreement (e.g. mortgages or collateralized liabilities).
(**) Earnings before interest, tax, depreciation and amortization = Operating income + depreciation, amortization and provisions for impairment in value of property, plant and equipment and intangible assets.
26-5 Securitization and factoring programs
(in € millions) Dec. 31, 2007 Dec. 31, 2006 Dec. 31, 2005
Financing 723.1 707.5 834.7
Guarantee reserve deducted from borrowings (27.6) (78.6) (85.7)
Cash received as consideration for receivables sold 695.5 628.9 749.0
Receivables sold and derecognized (387.5) (246.5) (212.5)
26-6 Analysis of long- and short-term debt by interest rate and currency
(in € millions) Dec. 31, 2007
Variable rate borrowings 1,855.9 85.7%
Fixed rate borrowings 310.2 14.3%
TOTAL 2,166.1 100.0%
Borrowings (taking into account currency swaps) break down as follows by repayment currency:
(in € millions) Dec. 31, 2007 Dec. 31, 2006 Dec. 31, 2005
Euro 1,704.1 78.7% 1,902.5 83.3% 1,895.7 85.1%
US dollar 262.9 12.1% 184.2 8.1% 230.5 10.4%
Other currencies 199.1 9.2% 198.4 8.7% 101.3 4.5%
TOTAL 2,166.1 100.0% 2,285.1 100.0% 2,227.5 100.0%
As of 31.12.07, the weighted average interest rate on outstanding borrowings was 4.21%.
Part of Faurecia’s fi nancing requirements is met through receivables
sale programs (see Note 18).
As of December 31, 2007, fi nancing under these programs –
corresponding to the cash received as consideration for the
receivables sold – totaled €695.5 million versus €628.9 million one
year earlier.
As of December 31, 2007, 85.7% of the Group’s borrowings were
at variable rates, before taking into account the impact of hedging.
The Group has set up derivatives to hedge the interest rate risk on
the interest payable on its borrowings between January 2008 and
December 2010 (see Note 30.2).
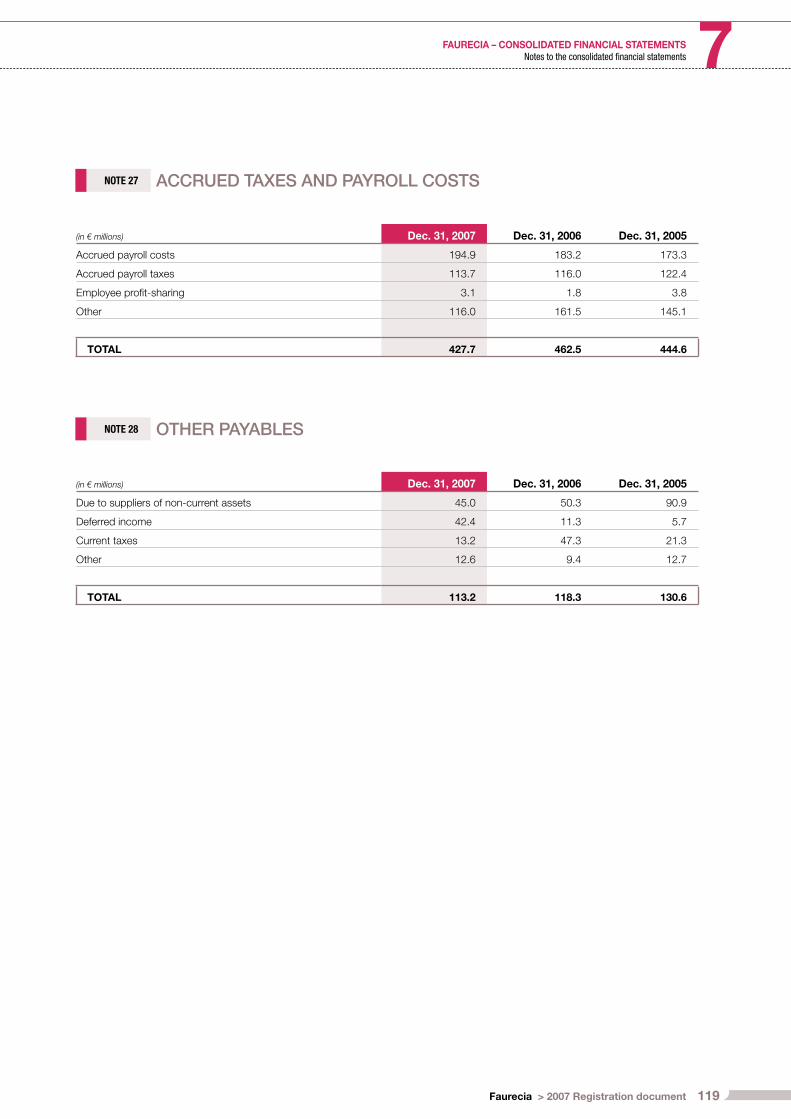
119Faurecia > 2007 Registration document
FAURECIA – CONSOLIDATED FINANCIAL STATEMENTS 7Notes to the consolidated fi nancial statements
NOTE 27 ACCRUED TAXES AND PAYROLL COSTS
(in € millions) Dec. 31, 2007 Dec. 31, 2006 Dec. 31, 2005
Accrued payroll costs 194.9 183.2 173.3
Accrued payroll taxes 113.7 116.0 122.4
Employee profi t-sharing 3.1 1.8 3.8
Other 116.0 161.5 145.1
TOTAL 427.7 462.5 444.6
NOTE 28 OTHER PAYABLES
(in € millions) Dec. 31, 2007 Dec. 31, 2006 Dec. 31, 2005
Due to suppliers of non-current assets 45.0 50.3 90.9
Deferred income 42.4 11.3 5.7
Current taxes 13.2 47.3 21.3
Other 12.6 9.4 12.7
TOTAL 113.2 118.3 130.6
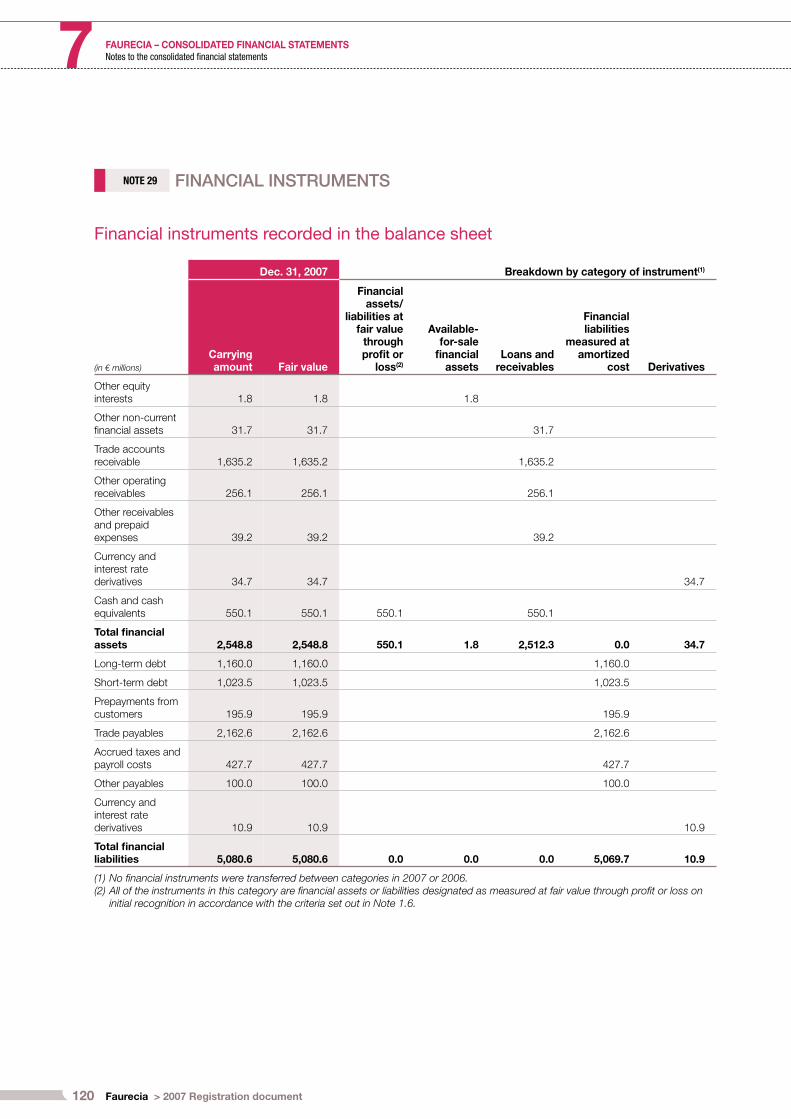
120 Faurecia > 2007 Registration document
FAURECIA – CONSOLIDATED FINANCIAL STATEMENTS7 Notes to the consolidated fi nancial statements
NOTE 29 FINANCIAL INSTRUMENTS
Financial instruments recorded in the balance sheet
(in € millions)
Dec. 31, 2007 Breakdown by category of instrument(1)
Carrying amount Fair value
Financial assets/
liabilities at fair value
through profi t or
loss(2)
Available-for-sale
fi nancial assets
Loans and receivables
Financial liabilities
measured at amortized
cost Derivatives
Other equity interests 1.8 1.8 1.8
Other non-current fi nancial assets 31.7 31.7 31.7
Trade accounts receivable 1,635.2 1,635.2 1,635.2
Other operating receivables 256.1 256.1 256.1
Other receivables and prepaid expenses 39.2 39.2 39.2
Currency and interest rate derivatives 34.7 34.7 34.7
Cash and cash equivalents 550.1 550.1 550.1 550.1
Total fi nancial assets 2,548.8 2,548.8 550.1 1.8 2,512.3 0.0 34.7
Long-term debt 1,160.0 1,160.0 1,160.0
Short-term debt 1,023.5 1,023.5 1,023.5
Prepayments from customers 195.9 195.9 195.9
Trade payables 2,162.6 2,162.6 2,162.6
Accrued taxes and payroll costs 427.7 427.7 427.7
Other payables 100.0 100.0 100.0
Currency and interest rate derivatives 10.9 10.9 10.9
Total fi nancial liabilities 5,080.6 5,080.6 0.0 0.0 0.0 5,069.7 10.9
(1) No financial instruments were transferred between categories in 2007 or 2006.(2) All of the instruments in this category are financial assets or liabilities designated as measured at fair value through profit or loss on
initial recognition in accordance with the criteria set out in Note 1.6.
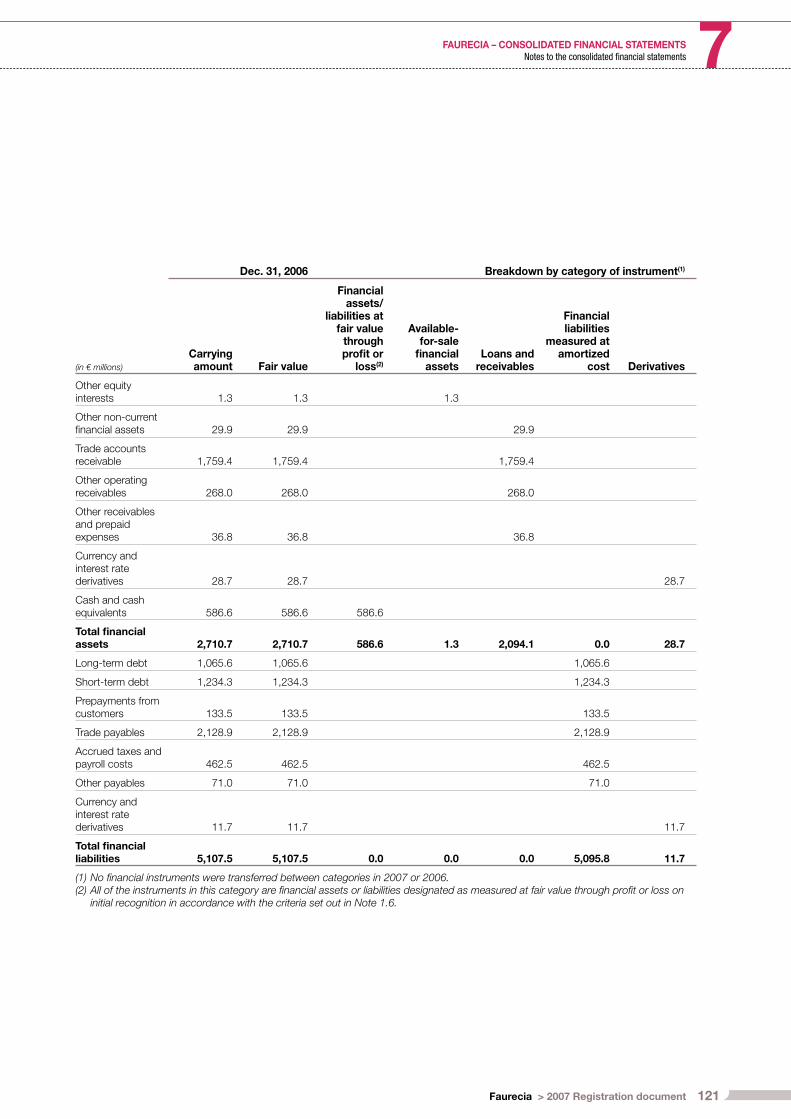
121Faurecia > 2007 Registration document
FAURECIA – CONSOLIDATED FINANCIAL STATEMENTS 7Notes to the consolidated fi nancial statements
(in € millions)
Dec. 31, 2006 Breakdown by category of instrument(1)
Carrying amount Fair value
Financial assets/
liabilities at fair value
through profi t or
loss(2)
Available-for-sale
fi nancial assets
Loans and receivables
Financial liabilities
measured at amortized
cost Derivatives
Other equity interests 1.3 1.3 1.3
Other non-current fi nancial assets 29.9 29.9 29.9
Trade accounts receivable 1,759.4 1,759.4 1,759.4
Other operating receivables 268.0 268.0 268.0
Other receivables and prepaid expenses 36.8 36.8 36.8
Currency and interest rate derivatives 28.7 28.7 28.7
Cash and cash equivalents 586.6 586.6 586.6
Total fi nancial assets 2,710.7 2,710.7 586.6 1.3 2,094.1 0.0 28.7
Long-term debt 1,065.6 1,065.6 1,065.6
Short-term debt 1,234.3 1,234.3 1,234.3
Prepayments from customers 133.5 133.5 133.5
Trade payables 2,128.9 2,128.9 2,128.9
Accrued taxes and payroll costs 462.5 462.5 462.5
Other payables 71.0 71.0 71.0
Currency and interest rate derivatives 11.7 11.7 11.7
Total fi nancial liabilities 5,107.5 5,107.5 0.0 0.0 0.0 5,095.8 11.7
(1) No financial instruments were transferred between categories in 2007 or 2006.(2) All of the instruments in this category are financial assets or liabilities designated as measured at fair value through profit or loss on
initial recognition in accordance with the criteria set out in Note 1.6.
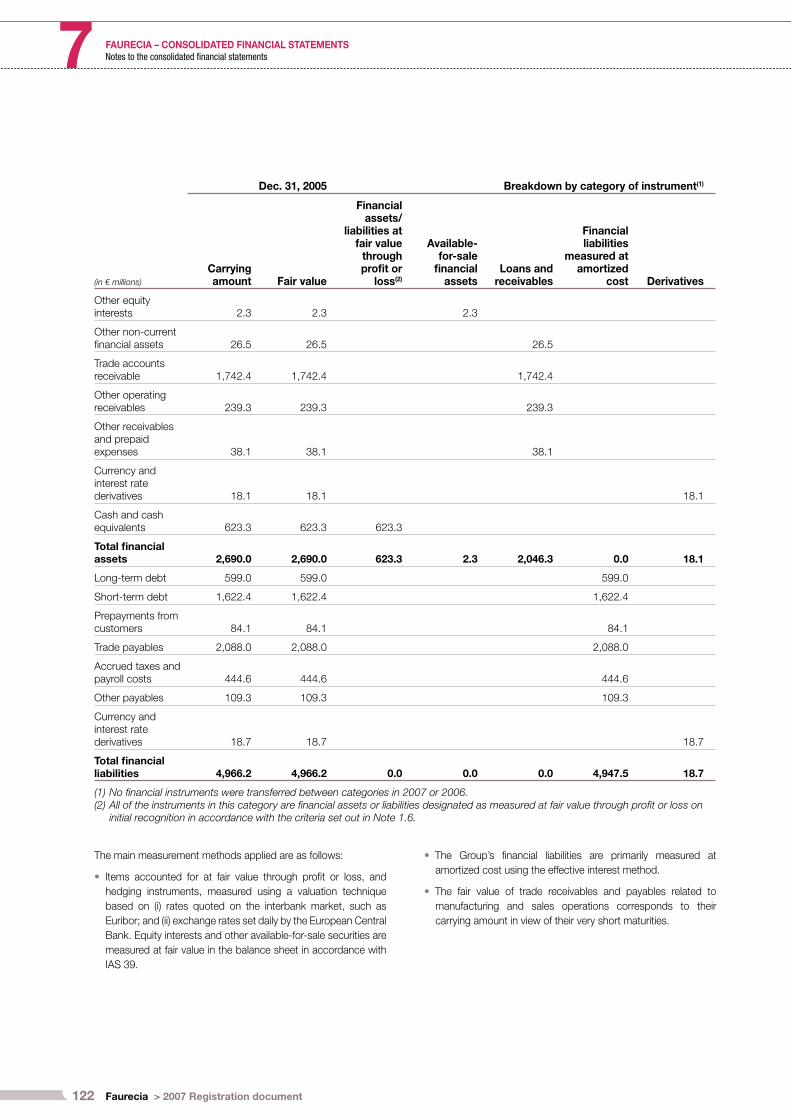
122 Faurecia > 2007 Registration document
FAURECIA – CONSOLIDATED FINANCIAL STATEMENTS7 Notes to the consolidated fi nancial statements
(in € millions)
Dec. 31, 2005 Breakdown by category of instrument(1)
Carrying amount Fair value
Financial assets/
liabilities at fair value
through profi t or
loss(2)
Available-for-sale
fi nancial assets
Loans and receivables
Financial liabilities
measured at amortized
cost Derivatives
Other equity interests 2.3 2.3 2.3
Other non-current fi nancial assets 26.5 26.5 26.5
Trade accounts receivable 1,742.4 1,742.4 1,742.4
Other operating receivables 239.3 239.3 239.3
Other receivables and prepaid expenses 38.1 38.1 38.1
Currency and interest rate derivatives 18.1 18.1 18.1
Cash and cash equivalents 623.3 623.3 623.3
Total fi nancial assets 2,690.0 2,690.0 623.3 2.3 2,046.3 0.0 18.1
Long-term debt 599.0 599.0 599.0
Short-term debt 1,622.4 1,622.4 1,622.4
Prepayments from customers 84.1 84.1 84.1
Trade payables 2,088.0 2,088.0 2,088.0
Accrued taxes and payroll costs 444.6 444.6 444.6
Other payables 109.3 109.3 109.3
Currency and interest rate derivatives 18.7 18.7 18.7
Total fi nancial liabilities 4,966.2 4,966.2 0.0 0.0 0.0 4,947.5 18.7
(1) No financial instruments were transferred between categories in 2007 or 2006.(2) All of the instruments in this category are financial assets or liabilities designated as measured at fair value through profit or loss on
initial recognition in accordance with the criteria set out in Note 1.6.
The main measurement methods applied are as follows:
Items accounted for at fair value through profi t or loss, and
hedging instruments, measured using a valuation technique
based on (i) rates quoted on the interbank market, such as
Euribor; and (ii) exchange rates set daily by the European Central
Bank. Equity interests and other available-for-sale securities are
measured at fair value in the balance sheet in accordance with
IAS 39.
•
The Group’s fi nancial liabilities are primarily measured at
amortized cost using the effective interest method.
The fair value of trade receivables and payables related to
manufacturing and sales operations corresponds to their
carrying amount in view of their very short maturities.
•
•

123Faurecia > 2007 Registration document
FAURECIA – CONSOLIDATED FINANCIAL STATEMENTS 7Notes to the consolidated fi nancial statements
The impact of fi nancial instruments on income can be analyzed as follows:
2007 Breakdown by category of instrument
Income statement
impact
Financial assets/
liabilities at fair value
through profi t or
loss
Available-for-sale
fi nancial assets
Loans and receivables
Financial liabilities
measured at amortized
cost Derivatives
Translation differences on commercial transactions 8.9 8.5 0.4
Income from loans, cash investments and marketable securities 15.9 15.9
Finance costs (117.0) (117.0)
Other fi nancial income and expense (6.7) 3.1 (9.8)
Net income/(expense) (98.9) 15.9 0.0 11.6 (117.0) (9.4)
2006 Breakdown by category of instrument
Income statement
impact
Financial assets/
liabilities at fair value
through profi t or
loss
Available-for-sale
fi nancial assets
Loans and receivables
Financial liabilities
measured at amortized
cost Derivatives
Translation differences on commercial transactions (0.9) 0.4 (1.3)
Income from loans, cash investments and marketable securities 10.9 10.9
Finance costs (97.5) (97.5)
Other fi nancial income and expense 7.4 0 0 (0.1) 0 7.5
Net income/(expense) (80.1) 10.9 0.0 0.3 (97.5) 6.2
2005 Breakdown by category of instrument
Income statement
impact
Financial assets/
liabilities at fair value
through profi t or
loss
Available-for-sale
fi nancial assets
Loans and receivables
Financial liabilities
measured at amortized
cost Derivatives
Translation differences on commercial transactions 8.1 6.8 1.5
Income from loans, cash investments and marketable securities 9.1 9.1
Finance costs (74.6) (74.6)
Other fi nancial income and expense (2.6) 3.3 (5.9)
Net income/(expense) (60.0) 9.1 0.0 10.1 (74.6) (4.4)
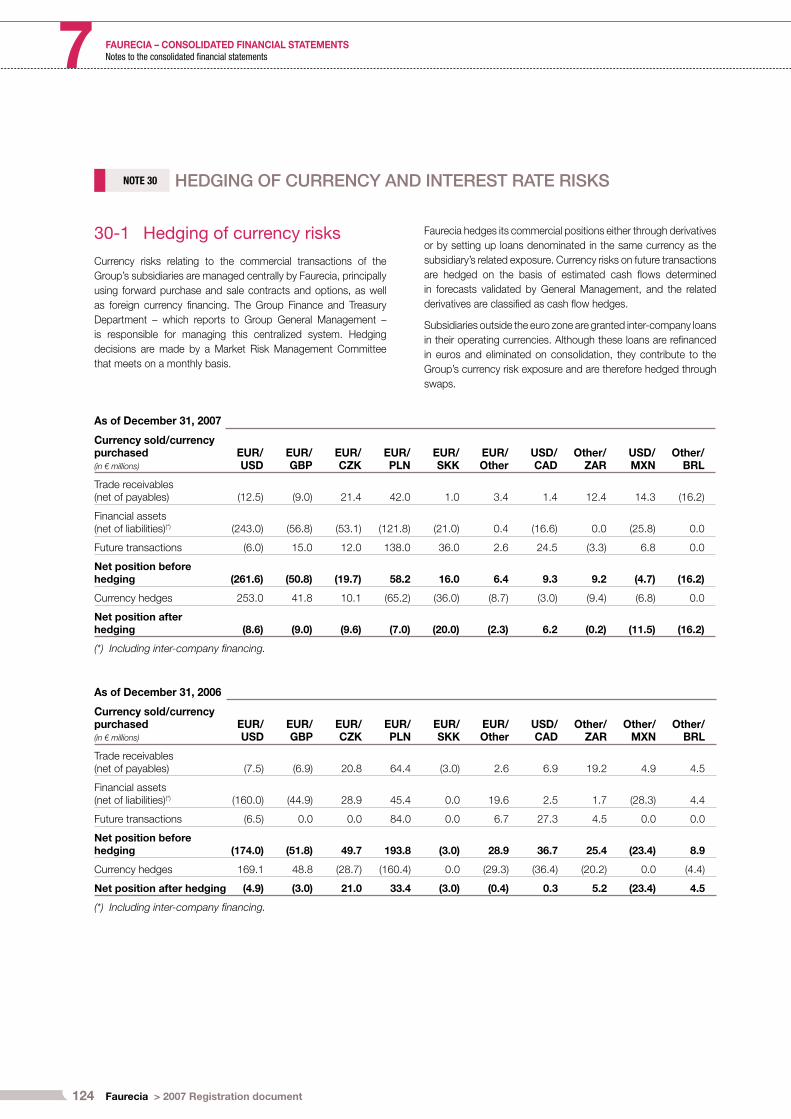
124 Faurecia > 2007 Registration document
FAURECIA – CONSOLIDATED FINANCIAL STATEMENTS7 Notes to the consolidated fi nancial statements
NOTE 30 HEDGING OF CURRENCY AND INTEREST RATE RISKS
30-1 Hedging of currency risks
Currency risks relating to the commercial transactions of the
Group’s subsidiaries are managed centrally by Faurecia, principally
using forward purchase and sale contracts and options, as well
as foreign currency fi nancing. The Group Finance and Treasury
Department – which reports to Group General Management –
is responsible for managing this centralized system. Hedging
decisions are made by a Market Risk Management Committee
that meets on a monthly basis.
Faurecia hedges its commercial positions either through derivatives
or by setting up loans denominated in the same currency as the
subsidiary’s related exposure. Currency risks on future transactions
are hedged on the basis of estimated cash fl ows determined
in forecasts validated by General Management, and the related
derivatives are classifi ed as cash fl ow hedges.
Subsidiaries outside the euro zone are granted inter-company loans
in their operating currencies. Although these loans are refi nanced
in euros and eliminated on consolidation, they contribute to the
Group’s currency risk exposure and are therefore hedged through
swaps.
As of December 31, 2007
Currency sold/currency purchased (in € millions)
EUR/USD
EUR/GBP
EUR/CZK
EUR/PLN
EUR/SKK
EUR/Other
USD/CAD
Other/ZAR
USD/MXN
Other/BRL
Trade receivables (net of payables) (12.5) (9.0) 21.4 42.0 1.0 3.4 1.4 12.4 14.3 (16.2)
Financial assets (net of liabilities)(*) (243.0) (56.8) (53.1) (121.8) (21.0) 0.4 (16.6) 0.0 (25.8) 0.0
Future transactions (6.0) 15.0 12.0 138.0 36.0 2.6 24.5 (3.3) 6.8 0.0
Net position before hedging (261.6) (50.8) (19.7) 58.2 16.0 6.4 9.3 9.2 (4.7) (16.2)
Currency hedges 253.0 41.8 10.1 (65.2) (36.0) (8.7) (3.0) (9.4) (6.8) 0.0
Net position after hedging (8.6) (9.0) (9.6) (7.0) (20.0) (2.3) 6.2 (0.2) (11.5) (16.2)
(*) Including inter-company financing.
As of December 31, 2006
Currency sold/currency purchased (in € millions)
EUR/USD
EUR/GBP
EUR/CZK
EUR/PLN
EUR/SKK
EUR/Other
USD/CAD
Other/ZAR
Other/MXN
Other/BRL
Trade receivables (net of payables) (7.5) (6.9) 20.8 64.4 (3.0) 2.6 6.9 19.2 4.9 4.5
Financial assets(net of liabilities)(*) (160.0) (44.9) 28.9 45.4 0.0 19.6 2.5 1.7 (28.3) 4.4
Future transactions (6.5) 0.0 0.0 84.0 0.0 6.7 27.3 4.5 0.0 0.0
Net position before hedging (174.0) (51.8) 49.7 193.8 (3.0) 28.9 36.7 25.4 (23.4) 8.9
Currency hedges 169.1 48.8 (28.7) (160.4) 0.0 (29.3) (36.4) (20.2) 0.0 (4.4)
Net position after hedging (4.9) (3.0) 21.0 33.4 (3.0) (0.4) 0.3 5.2 (23.4) 4.5
(*) Including inter-company financing.

125Faurecia > 2007 Registration document
FAURECIA – CONSOLIDATED FINANCIAL STATEMENTS 7Notes to the consolidated fi nancial statements
As of December 31, 2005
Currency sold/currency purchased (in € millions)
EUR/USD
EUR/GBP
EUR/CZK
EUR/PLN
EUR/SKK
EUR/Divers
USD/CAD
divers/ZAR
divers/MXN
divers/BRL
Trade receivables (net of payables) (10.1) (19.6) 2.0 51.3 3.1 1.5 11.5 12.7
Financial assets (net of liabilities)(*) (229.4) (35.6) 16.4 (44.3) (5.2) 17.1 4.8 25.3 0.0 0.0
Future transactions (7.1) (0.8) 0.0 150.0 0.0 3.5 2.4 0.3 0.0 0.0
Net position before hedging (246.6) (56.0) 18.3 157.1 (2.1) 22.1 18.7 38.3 0.0 0.0
Currency hedges 241.5 43.8 (17.4) (160.4) 5.2 (21.2) (17.0) (29.5) 0.0 0.0
Net position after hedging (5.0) (12.1) 0.9 (3.3) 3.1 0.9 1.8 8.8 0.0 0.0
(*) Including inter-company financing.
Currency hedges are recognized in the balance sheet at fair value, determined based on measurements confi rmed by banking counterparties .
Information on hedged notional amounts can be analyzed as follows:
As of Dec. 31, 2007 Carrying amount Maturities
Assets LiabilitiesNotional amount
Within 1 year
1 to 5 years
Beyond 5 years
Fair value hedges
Forward currency contracts• (0.1) (14.0) (14.0)
Currency options•
Inter-company loans in foreign currencies swapped for euros
•3.6 415.4 415.4
Cash fl ow hedges
Forward currency contracts• 0.1
Currency options• 7.9 (225.7) (225.7)
Overhedging and t rading (1.5)
10.0 175.7 175.7
Of which currency hedges for operations 6.4
Of which hedges of receivables and borrowings 3.6
As of Dec. 31, 2006 Carrying amount Maturities
Assets LiabilitiesNotional amount
Within 1 year
1 to 5 years
Beyond 5 years
Fair value hedges
Forward currency contracts• (0.7) 28.7 28.7
Options de change• 2.3 2.3
Inter-company loans in foreign currencies swapped for euros
•0.6 337.4 337.4
Cash fl ow hedges
Forward currency contracts•
Currency options• 1.2 129.0 129.0
Overhedging and t rading 1.6
2.7 0.0 497.4 497.4
Of which currency hedges for operations 2.1
Of which hedges of receivables and borrowings 0.6

126 Faurecia > 2007 Registration document
FAURECIA – CONSOLIDATED FINANCIAL STATEMENTS7 Notes to the consolidated fi nancial statements
As of Dec. 31, 2005 Carrying amount Maturities
Assets LiabilitiesNotional amount
Within 1 year
1 to 5 years
Beyond 5 years
Fair value hedges
Forward currency contracts• 2.3 13.6 13.6
Currency options• 0.4 12.2 12.2
Inter-company loans in foreign currencies swapped for euros
•331.8 331.8
Cash fl ow hedges
Forward currency contracts•
Currency options• 2.4 164.1 164.1
Overhedging and t rading 2.7 3.9 3.9
5.5 2.3 525.6 525.6
Of which currency hedges for operations 5.5
Of which hedges of receivables and borrowings 2.3
The impact of currency hedges on income and equity can be analyzed as follows:
Impact of cash fl ow hedges(in € millions) Dec. 31, 2007 Dec. 31, 2006
Fair value at beginning of year 1.2 2.4
Changes in effective portion of gains and losses recorded in equity
Changes in ineffective portion of gains and losses recorded in income 0.8 (0.4)
Purchases of options 9.2 3.3
Derecognition on exercise or disposal of instruments (3.3) (4.1)
Fair value at end of year 7.9 1.2
Ineffective portion of hedges recorded in the income statement 0.8 (0.4)
Intrinsic values recycled to the income statement where hedge accounting no longer applied
Pre-tax impact 0.8 (0.4)
Net impact on equity 5.4 (0.8)
The sensitivity of Group net income and equity as of December 31, 2007 to a fl uctuation in transaction currencies other than the functional
currency of each of the Group’s subsidiaries, with all other variables remaining constant, is as follows:
Currency sold/currency purchased (in € millions)
EUR/USD
EUR/GBP
EUR/CZK
EUR/PLN
EUR/SKK
EUR/Other
USD/CAD
Other/ZAR
USD/MXN
Other/BRL
Hypothetical changes (appreciation of currency purchased/currency sold) 5.0% 4.0% 5.5% 10.0% 5.5% 5.5% 5.0% 5.0% 10.0% 10.0%
Pre-tax impact 0.4 0.4 0.5 0.7 1.1 nm (0.3) nm 1.2 1.6
Impact on equity (0.3) 0.6 0.7 13.8 2.0 nm 1.2 nm 0.7 0.0
These impacts refl ect (i) the impact on net income of currency
fl uctuation on the year-end valuation of assets and liabilities
recorded on the balance sheet, net of the impact of the change
in fair (intrinsic) value of existing hedging instruments; and (ii) the
impact on equity of the change in the intrinsic value of hedges of
forecast transactions.
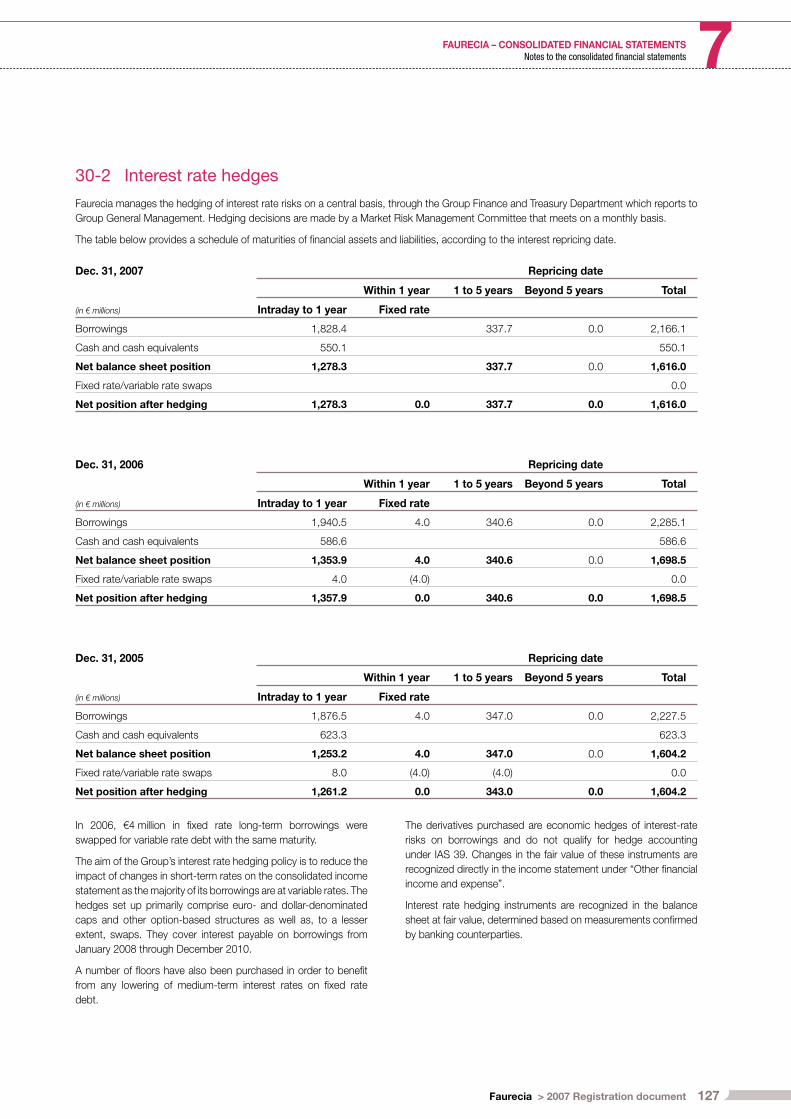
127Faurecia > 2007 Registration document
FAURECIA – CONSOLIDATED FINANCIAL STATEMENTS 7Notes to the consolidated fi nancial statements
30-2 Interest rate hedges
Faurecia manages the hedging of interest rate risks on a central basis, through the Group Finance and Treasury Department which reports to
Group General Management. Hedging decisions are made by a Market Risk Management Committee that meets on a monthly basis.
The table below provides a schedule of maturities of fi nancial assets and liabilities, according to the interest repricing date.
Dec. 31, 2007 Repricing date
Within 1 year 1 to 5 years Beyond 5 years Total
(in € millions) Intraday to 1 year Fixed rate
Borrowings 1,828.4 337.7 0.0 2,166.1
Cash and cash equivalents 550.1 550.1
Net balance sheet position 1,278.3 337.7 0.0 1,616.0
Fixed rate/variable rate swaps 0.0
Net position after hedging 1,278.3 0.0 337.7 0.0 1,616.0
Dec. 31, 2006 Repricing date
Within 1 year 1 to 5 years Beyond 5 years Total
(in € millions) Intraday to 1 year Fixed rate
Borrowings 1,940.5 4.0 340.6 0.0 2,285.1
Cash and cash equivalents 586.6 586.6
Net balance sheet position 1,353.9 4.0 340.6 0.0 1,698.5
Fixed rate/variable rate swaps 4.0 (4.0) 0.0
Net position after hedging 1,357.9 0.0 340.6 0.0 1,698.5
Dec. 31, 2005 Repricing date
Within 1 year 1 to 5 years Beyond 5 years Total
(in € millions) Intraday to 1 year Fixed rate
Borrowings 1,876.5 4.0 347.0 0.0 2,227.5
Cash and cash equivalents 623.3 623.3
Net balance sheet position 1,253.2 4.0 347.0 0.0 1,604.2
Fixed rate/variable rate swaps 8.0 (4.0) (4.0) 0.0
Net position after hedging 1,261.2 0.0 343.0 0.0 1,604.2
In 2006, €4 million in fi xed rate long-term borrowings were
swapped for variable rate debt with the same maturity.
The aim of the Group’s interest rate hedging policy is to reduce the
impact of changes in short-term rates on the consolidated income
statement as the majority of its borrowings are at variable rates. The
hedges set up primarily comprise euro- and dollar-denominated
caps and other option-based structures as well as, to a lesser
extent, swaps. They cover interest payable on borrowings from
January 2008 through December 2010.
A number of fl oors have also been purchased in order to benefi t
from any lowering of medium-term interest rates on fi xed rate
debt.
The derivatives purchased are economic hedges of interest-rate
risks on borrowings and do not qualify for hedge accounting
under IAS 39. Changes in the fair value of these instruments are
recognized directly in the income statement under “Other fi nancial
income and expense”.
Interest rate hedging instruments are recognized in the balance
sheet at fair value, determined based on measurements confi rmed
by banking counterparties .
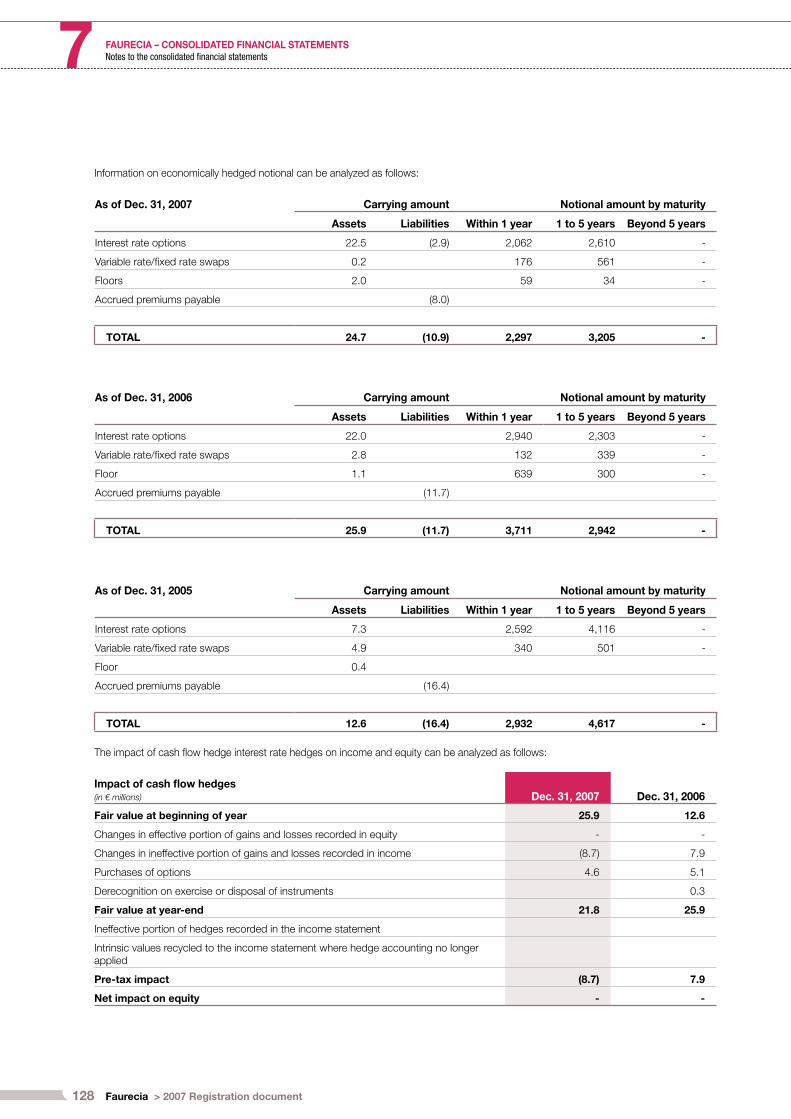
128 Faurecia > 2007 Registration document
FAURECIA – CONSOLIDATED FINANCIAL STATEMENTS7 Notes to the consolidated fi nancial statements
Information on economically hedged notional can be analyzed as follows :
As of Dec. 31, 2007 Carrying amount Notional amount by maturity
Assets Liabilities Within 1 year 1 to 5 years Beyond 5 years
Interest rate options 22.5 (2.9) 2,062 2,610 -
Variable rate/fi xed rate swaps 0.2 176 561 -
Floors 2.0 59 34 -
Accrued premiums payable (8.0)
TOTAL 24.7 (10.9) 2,297 3,205 -
As of Dec. 31, 2006 Carrying amount Notional amount by maturity
Assets Liabilities Within 1 year 1 to 5 years Beyond 5 years
Interest rate options 22.0 2,940 2,303 -
Variable rate/fi xed rate swaps 2.8 132 339 -
Floor 1.1 639 300 -
Accrued premiums payable (11.7)
TOTAL 25.9 (11.7) 3,711 2,942 -
As of Dec. 31, 2005 Carrying amount Notional amount by maturity
Assets Liabilities Within 1 year 1 to 5 years Beyond 5 years
Interest rate options 7.3 2,592 4,116 -
Variable rate/fi xed rate swaps 4.9 340 501 -
Floor 0.4
Accrued premiums payable (16.4)
TOTAL 12.6 (16.4) 2,932 4,617 -
The impact of cash fl ow hedge interest rate hedges on income and equity can be analyzed as follows:
Impact of cash fl ow hedges (in € millions) Dec. 31, 2007 Dec. 31, 2006
Fair value at beginning of year 25.9 12.6
Changes in effective portion of gains and losses recorded in equity - -
Changes in ineffective portion of gains and losses recorded in income (8.7) 7.9
Purchases of options 4.6 5.1
Derecognition on exercise or disposal of instruments 0.3
Fair value at year-end 21.8 25.9
Ineffective portion of hedges recorded in the income statement
Intrinsic values recycled to the income statement where hedge accounting no longer applied
Pre-tax impact (8.7) 7.9
Net impact on equity - -
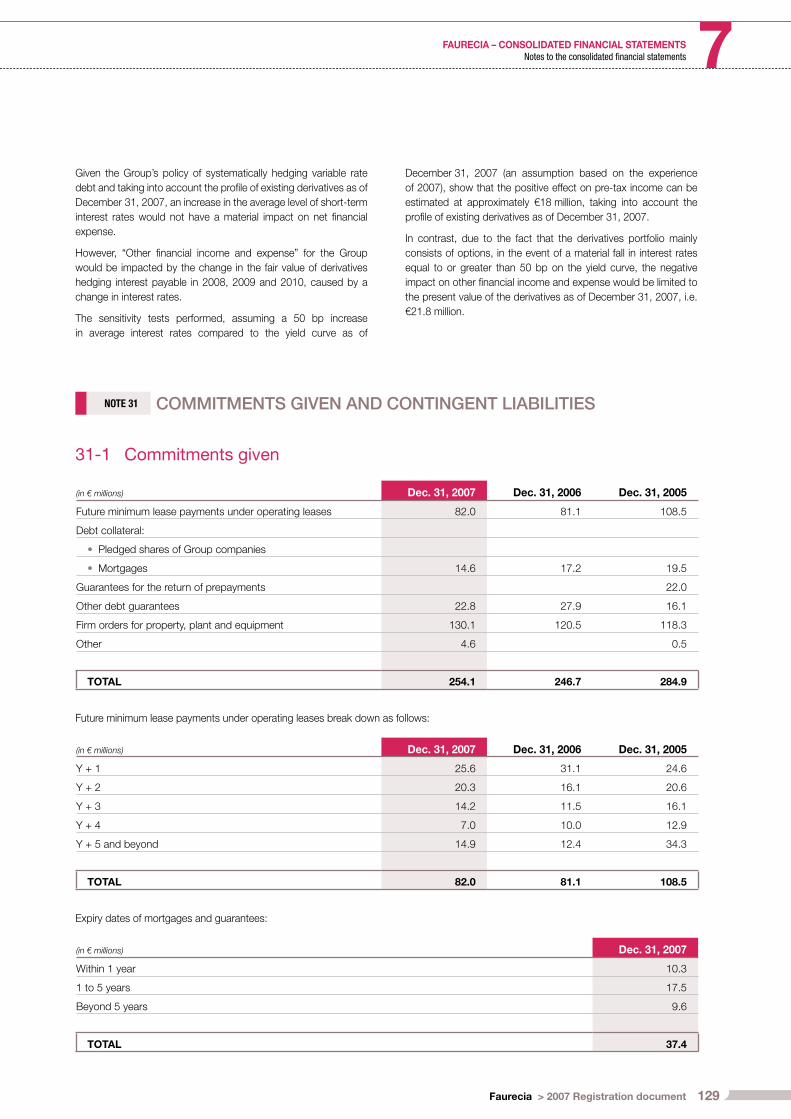
129Faurecia > 2007 Registration document
FAURECIA – CONSOLIDATED FINANCIAL STATEMENTS 7Notes to the consolidated fi nancial statements
Given the Group’s policy of systematically hedging variable rate
debt and taking into account the profi le of existing derivatives as of
December 31, 2007, an increase in the average level of short-term
interest rates would not have a material impact on net fi nancial
expense.
However, “Other fi nancial income and expense” for the Group
would be impacted by the change in the fair value of derivatives
hedging interest payable in 2008, 2009 and 2010, caused by a
change in interest rates.
The sensitivity tests performed, assuming a 50 bp increase
in average interest rates compared to the yield curve as of
December 31, 2007 (an assumption based on the experience
of 2007), show that the positive effect on pre-tax income can be
estimated at approximately €18 million, taking into account the
profi le of existing derivatives as of December 31, 2007.
In contrast, due to the fact that the derivatives portfolio mainly
consists of options, in the event of a material fall in interest rates
equal to or greater than 50 bp on the yield curve, the negative
impact on other fi nancial income and expense would be limited to
the present value of the derivatives as of December 31, 2007, i.e.
€21.8 million.
NOTE 31 COMMITMENTS GIVEN AND CONTINGENT LIABILITIES
31-1 Commitments given
(in € millions) Dec. 31, 2007 Dec. 31, 2006 Dec. 31, 2005
Future minimum lease payments under operating leases 82.0 81.1 108.5
Debt collateral:
Pledged shares of Group companies•
Mortgages• 14.6 17.2 19.5
Guarantees for the return of prepayments 22.0
Other debt guarantees 22.8 27.9 16.1
Firm orders for property, plant and equipment 130.1 120.5 118.3
Other 4.6 0.5
TOTAL 254.1 246.7 284.9
Future minimum lease payments under operating leases break down as follows:
(in € millions) Dec. 31, 2007 Dec. 31, 2006 Dec. 31, 2005
Y + 1 25.6 31.1 24.6
Y + 2 20.3 16.1 20.6
Y + 3 14.2 11.5 16.1
Y + 4 7.0 10.0 12.9
Y + 5 and beyond 14.9 12.4 34.3
TOTAL 82.0 81.1 108.5
Expiry dates of mortgages and guarantees:
(in € millions) Dec. 31, 2007
Within 1 year 10.3
1 to 5 years 17.5
Beyond 5 years 9.6
TOTAL 37.4

130 Faurecia > 2007 Registration document
FAURECIA – CONSOLIDATED FINANCIAL STATEMENTS7 Notes to the consolidated fi nancial statements
31-2 Contingent liabilities
INDIVIDUAL TRAINING ENTITLEMENT
In accordance with the provisions of French Act no. 2004-391
dated May 4, 2004 relating to professional training, employees of
the Group’s French companies are entitled to at least twenty hours
of training per calendar year, which may be carried forward for up
to six years. If all or part of the entitlement is not used within six
years, it is capped at 120 hours.
In 2007, the average utilization rate of this entitlement was 2.7%.
The number of unused accumulated training hours at the year-
end totaled 1,098,182. No provision was recorded in the fi nancial
statements for these individual training entitlements as the Group
does not have suffi ciently reliable historical data to accurately
estimate the related contingent liability. The potential impact is not,
however, considered material.
NOTE 32 RELATED PARTY TRANSACTIONS
32-1 Transactions with PSA Peugeot Citroën
The Faurecia Group is managed independently and transactions with the PSA Peugeot Citroën Group are conducted on arm’s length terms.
Related party transactions with the PSA Peugeot Citroën Group were as follows in 2007, 2006 and 2005:
(in € millions) Dec. 31, 2007 Dec. 31, 2006 Dec. 31, 2005
Sales 2,918.6 2,701.2 2,721.9
Purchases of products, services and materials 28.2 31.8 32.0
Receivables(*) 705.0 776.1 735.7
Payables 59.3 55.4 21.2
(*) After no-recourse sale of receivables of: 259.3 197.0 159.8
32-2 Management compensation
Total compensation for 2007 awarded to the members of the Board
of Directors and the Group Executive Committee amounted to
€7,201,661, including directors’ fees of €197,428 compared with
the year-earlier fi gures of €7,088,269 and €188,574 respectively.
In addition to this compensation, 144,000 Faurecia stock
subscription options were awarded to management during the year,
and the amount recognized with respect to share-based payments
to management was €401,730.
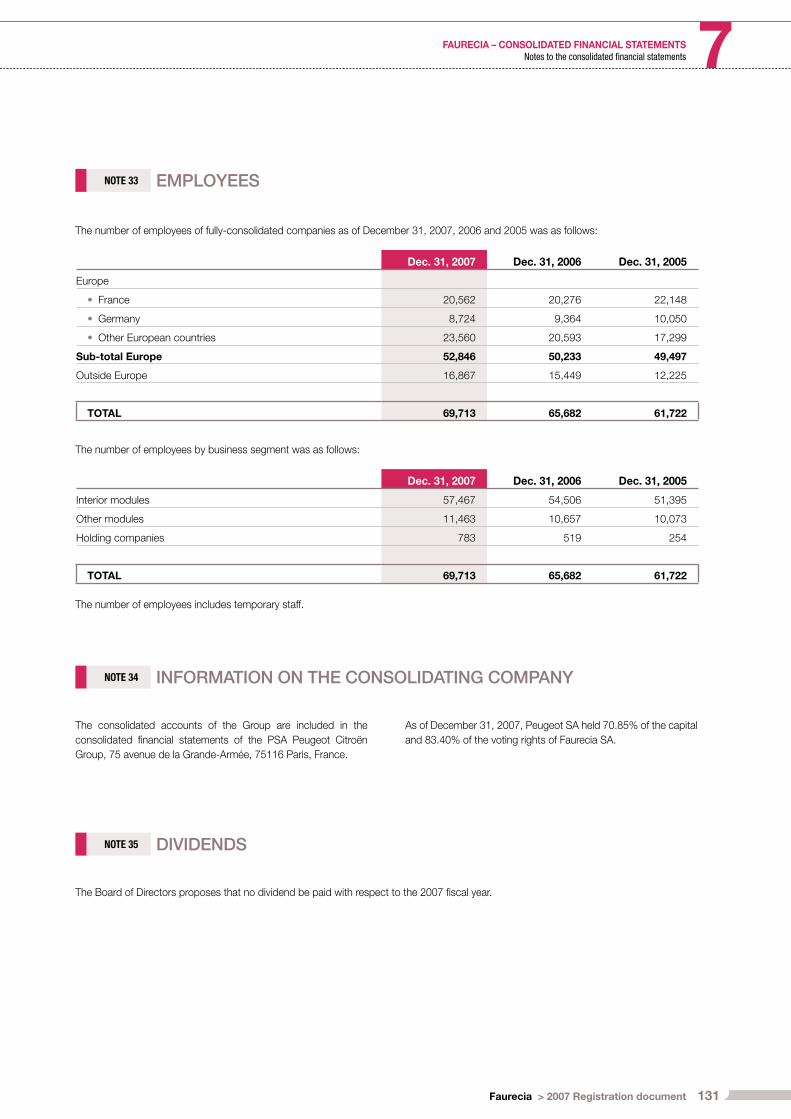
131Faurecia > 2007 Registration document
FAURECIA – CONSOLIDATED FINANCIAL STATEMENTS 7Notes to the consolidated fi nancial statements
NOTE 33 EMPLOYEES
The number of employees of fully-consolidated companies as of December 31, 2007, 2006 and 2005 was as follows:
Dec. 31, 2007 Dec. 31, 2006 Dec. 31, 2005
Europe
France• 20,562 20,276 22,148
Germany• 8,724 9,364 10,050
Other European countries• 23,560 20,593 17,299
Sub-total Europe 52,846 50,233 49,497
Outside Europe 16,867 15,449 12,225
TOTAL 69,713 65,682 61,722
The number of employees by business segment was as follows:
Dec. 31, 2007 Dec. 31, 2006 Dec. 31, 2005
Interior modules 57,467 54,506 51,395
Other modules 11,463 10,657 10,073
Holding companies 783 519 254
TOTAL 69,713 65,682 61,722
The number of employees includes temporary staff.
NOTE 34 INFORMATION ON THE CONSOLIDATING COMPANY
The consolidated accounts of the Group are included in the
consolidated fi nancial statements of the PSA Peugeot Citroën
Group, 75 avenue de la Grande-Armée, 75116 Paris, France.
As of December 31, 20 07, Peugeot SA held 70.85% of the capital
and 83.40% of the voting rights of Faurecia SA.
NOTE 35 DIVIDENDS
The Board of Directors proposes that no dividend be paid with respect to the 2007 fi scal year.

132 Faurecia > 2007 Registration document
FAURECIA – CONSOLIDATED FINANCIAL STATEMENTS7 Consolidated companies as of December 31, 2007
Country% interest of the parent company % control(1)
I - FULLY CONSOLIDATED COMPANIES
Faurecia France Parent company
Financière Faurecia « 100.00 100.00
SFEA - Société Foncière pour l’Equipement Automobile « 100.00 100.00
Faurecia Investments « 100.00 100.00
Faurecia Automotive Holdings « 100.00 100.00
Blériot Investissements « 100.00 100.00
Faurecia Services Groupe « 100.00 100.00
Faurecia Global Purchasing “ 100.00 100.00
Faurecia Exhaust International “ 100.00 100.00
Faurecia Verwaltungs GmbH Germany 100.00 100.00
Société Internationale de Participations (S.I.P) Belgium 100.00 100.00
Faurecia Netherlands Holding BV Netherlands 100.00 100.00
United Parts Exhaust Systems AB Sweden 100.00 100.00
Faurecia USA Holdings, Inc. United States 100.00 100.00
AUTOMOTIVE SEATING AND VEHICLE INTERIORS
Faurecia Sièges d’Automobile France 100.00 100.00
Faurecia Industries « 100.00 100.00
EAK Composants pour l’Automobile SAS « 51.00 51.00
EAK Composants pour l’Automobile SNC « 51.00 51.00
Trecia « 100.00 100.00
Siebret « 100.00 100.00
Siemar « 100.00 100.00
Sienor « 100.00 100.00
Sieto « 100.00 100.00
Sieval « 100.00 100.00
Sotexo « 100.00 100.00
Siedoubs « 100.00 100.00
Sielest « 100.00 100.00
ECSA-Etudes et Construction de Sièges pour l’Automobile « 100.00 100.00
Faurecia Interieur Industrie SNC « 100.00 100.00
Faurecia Automotive Industrie SNC « 100.00 100.00
Automotive Sandouville « 100.00 100.00
Société Automobile du Cuir de Vesoul « 100.00 100.00
Faurecia Autositze GmbH Germany 100.00 100.00
Faurecia Automotive GmbH (merged with Faurecia Deutschland Holding GmbH & Co KG) « 100.00 100.00
(1) Total interest of fully-consolidated companies.

133Faurecia > 2007 Registration document
FAURECIA – CONSOLIDATED FINANCIAL STATEMENTS 7Consolidated companies as of December 31, 2007
Country% interest of the parent company % control(1)
Faurecia Innenraum Systeme GmbH « 100.00 100.00
Industriepark Sassenburg GmbH « 100.00 100.00
Faurecia Industrie NV Belgium 100.00 100.00
Faurecia Asientos Para Automovil Espana SA Spain 100.00 100.00
Asientos de Castilla Leon SA « 100.00 100.00
Asientos del Norte SA « 100.00 100.00
Industrias Cousin Frères SL « 50.01 50.01
Tecnoconfort « 50.00 50.00
Faurecia Automotive Espana SL « 100.00 100.00
Faurecia Interior Systems Espana SA « 100.00 100.00
Faurecia Interior Systems SALC Espana SL « 100.00 100.00
Cartera e inversiones Enrich SA « 100.00 100.00
Asientos de Galicia SL « 100.00 100.00
Valencia Modulos de Puerta SL « 100.00 100.00
Faurecia AST Luxembourg SA Luxembourg 100.00 100.00
Faurecia Automotive seating BV Netherlands 100.00 100.00
Faurecia Assentos de Automovel, Limitada Portugal 100.00 100.00
Sasal « 100.00 100.00
Faurecia Sistemas de Interior de Portugal. Componentes para Automovel SA « 100.00 100.00
EDA - Estofagem de Assentos Lda « 100.00 100.00
Faurecia Automotive Seating UK Ltd United Kingdom 100.00 100.00
Faurecia Midlands Ltd « 100.00 100.00
SAI Automotive Telford Ltd « 100.00 100.00
SAI Automotive Fradley Ltd « 100.00 100.00
SAI Automotive Washington Ltd « 100.00 100.00
Faurecia Interior Systems Sweden AB Sweden 100.00 100.00
Faurecia Fotele Samochodowe Sp.Zo.o Poland 100.00 100.00
Faurecia Walbrzych Sp Zo.o « 100.00 100.00
Faurecia Legnica Sp Zo.o (formerly SAI Automotive Polska Sp Zo.o) « 100.00 100.00
Faurecia Systemy Kierownicze Sp Zo.o « 100.00 100.00
Faurecia Gorzow Sp Zo.o “ 100.00 100.00
Faurecia Lecotex a.s. Czech Republic 100.00 100.00
Faurecia Interior Systems Bohemia (formerly SAI Automotive Bohemia Sro) « 100.00 100.00
Faurecia Components Pisek S r o « 100.00 100.00
Faurecia Seating Talmaciu Sro Romania 100.00 100.00
Euro Auto Plastic Systems S.R.L. « 50.00 50.00
Faurecia Leather Kosice Sro Slovakia 100.00 100.00
Faurecia Slovakia Sro « 100.00 100.00
Faurecia Interior Systems Bratislava Sro « 100.00 100.00
Faurecia Polifl eks Otomotiv Sanayi Ve Ticaret Anonim Sirketi Turkey 100.00 100.00
Faurecia Interior Systems South Africa (Proprietary) Ltd South Africa 100.00 100.00
Société Tunisienne d’Equipements Automobiles Tunisia 100.00 100.00
(1) Total interest of fully-consolidated companies.
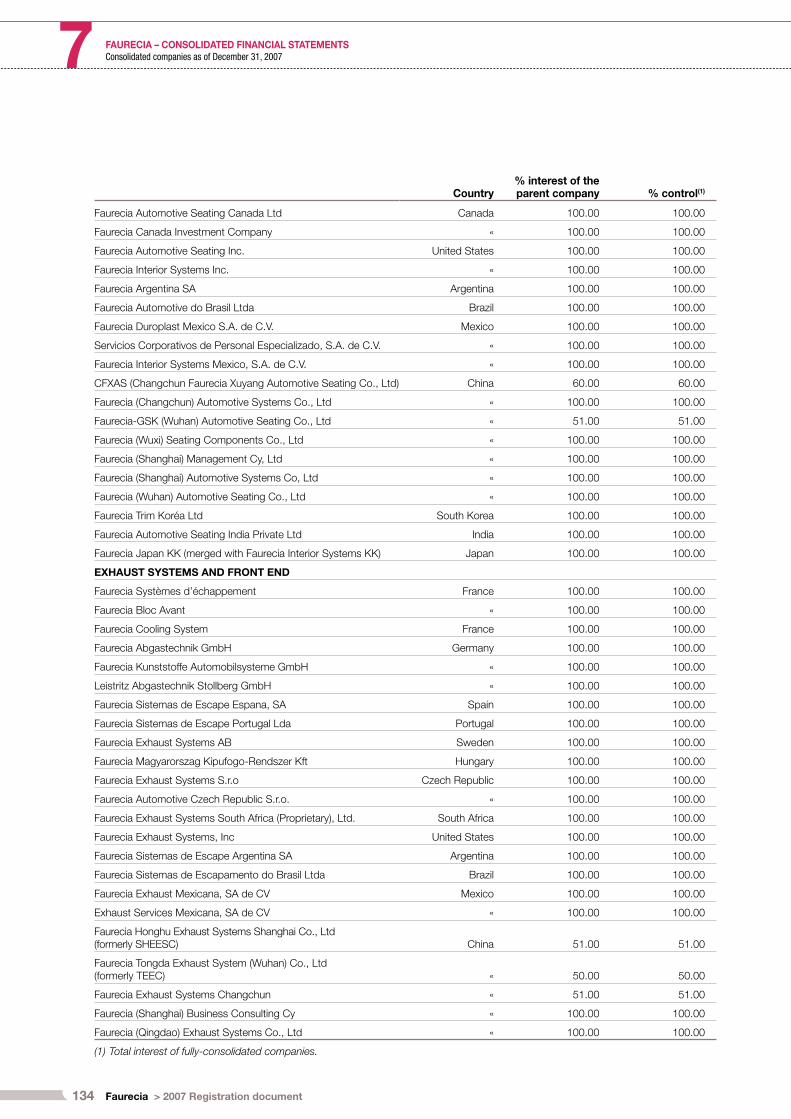
134 Faurecia > 2007 Registration document
FAURECIA – CONSOLIDATED FINANCIAL STATEMENTS7 Consolidated companies as of December 31, 2007
Country% interest of the parent company % control(1)
Faurecia Automotive Seating Canada Ltd Canada 100.00 100.00
Faurecia Canada Investment Company « 100.00 100.00
Faurecia Automotive Seating Inc. United States 100.00 100.00
Faurecia Interior Systems Inc. « 100.00 100.00
Faurecia Argentina SA Argentina 100.00 100.00
Faurecia Automotive do Brasil Ltda Brazil 100.00 100.00
Faurecia Duroplast Mexico S.A. de C.V. Mexico 100.00 100.00
Servicios Corporativos de Personal Especializado, S.A. de C.V. « 100.00 100.00
Faurecia Interior Systems Mexico, S.A. de C.V. « 100.00 100.00
CFXAS (Changchun Faurecia Xuyang Automotive Seating Co., Ltd) China 60.00 60.00
Faurecia (Changchun) Automotive Systems Co., Ltd « 100.00 100.00
Faurecia-GSK (Wuhan) Automotive Seating Co., Ltd « 51.00 51.00
Faurecia (Wuxi) Seating Components Co., Ltd « 100.00 100.00
Faurecia (Shanghai) Management Cy, Ltd « 100.00 100.00
Faurecia (Shanghai) Automotive Systems Co, Ltd « 100.00 100.00
Faurecia (Wuhan) Automotive Seating Co., Ltd « 100.00 100.00
Faurecia Trim Koréa Ltd South Korea 100.00 100.00
Faurecia Automotive Seating India Private Ltd India 100.00 100.00
Faurecia Japan KK (merged with Faurecia Interior Systems KK) Japan 100.00 100.00
EXHAUST SYSTEMS AND FRONT END
Faurecia Systèmes d’é chappement France 100.00 100.00
Faurecia Bloc Avant « 100.00 100.00
Faurecia Cooling System France 100.00 100.00
Faurecia Abgastechnik GmbH Germany 100.00 100.00
Faurecia Kunststoffe Automobilsysteme GmbH « 100.00 100.00
Leistritz Abgastechnik Stollberg GmbH « 100.00 100.00
Faurecia Sistemas de Escape Espana, SA Spain 100.00 100.00
Faurecia Sistemas de Escape Portugal Lda Portugal 100.00 100.00
Faurecia Exhaust Systems AB Sweden 100.00 100.00
Faurecia Magyarorszag Kipufogo-Rendszer Kft Hungary 100.00 100.00
Faurecia Exhaust Systems S.r.o Czech Republic 100.00 100.00
Faurecia Automotive Czech Republic S.r.o. « 100.00 100.00
Faurecia Exhaust Systems South Africa (Proprietary), Ltd. South Africa 100.00 100.00
Faurecia Exhaust Systems, Inc United States 100.00 100.00
Faurecia Sistemas de Escape Argentina SA Argentina 100.00 100.00
Faurecia Sistemas de Escapamento do Brasil Ltda Brazil 100.00 100.00
Faurecia Exhaust Mexicana, SA de CV Mexico 100.00 100.00
Exhaust Services Mexicana, SA de CV « 100.00 100.00
Faurecia Honghu Exhaust Systems Shanghai Co., Ltd (formerly SHEESC) China 51.00 51.00
Faurecia Tongda Exhaust System (Wuhan) Co., Ltd (formerly TEEC) « 50.00 50.00
Faurecia Exhaust Systems Changchun « 51.00 51.00
Faurecia (Shanghai) Business Consulting Cy « 100.00 100.00
Faurecia (Qingdao) Exhaust Systems Co., Ltd « 100.00 100.00
(1) Total interest of fully-consolidated companies.
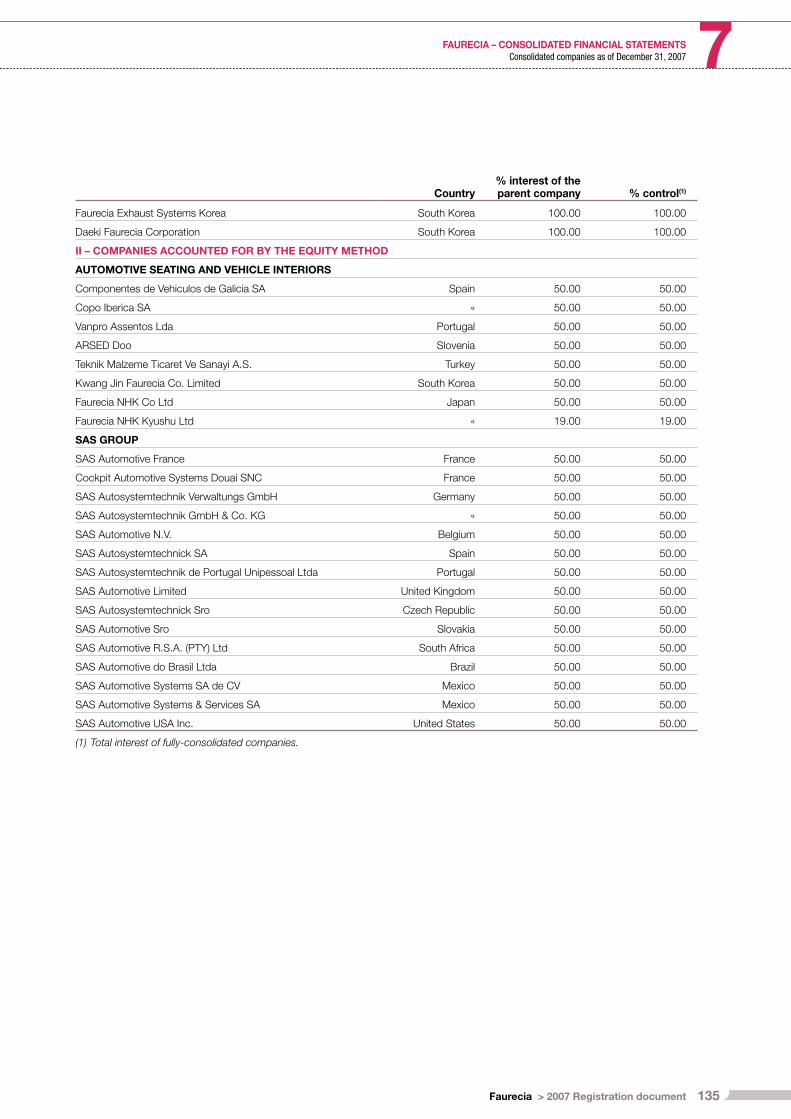
135Faurecia > 2007 Registration document
FAURECIA – CONSOLIDATED FINANCIAL STATEMENTS 7Consolidated companies as of December 31, 2007
Country% interest of the parent company % control(1)
Faurecia Exhaust Systems Korea South Korea 100.00 100.00
Daeki Faurecia Corporation South Korea 100.00 100.00
II – COMPANIES ACCOUNTED FOR BY THE EQUITY METHOD
AUTOMOTIVE SEATING AND VEHICLE INTERIORS
Componentes de Vehiculos de Galicia SA Spain 50.00 50.00
Copo Iberica SA « 50.00 50.00
Vanpro Assentos Lda Portugal 50.00 50.00
ARSED Doo Slovenia 50.00 50.00
Teknik Malzeme Ticaret Ve Sanayi A.S. Turkey 50.00 50.00
Kwang Jin Faurecia Co. Limited South Korea 50.00 50.00
Faurecia NHK Co Ltd Japan 50.00 50.00
Faurecia NHK Kyushu Ltd « 19.00 19.00
SAS GROUP
SAS Automotive France France 50.00 50.00
Cockpit Automotive Systems Douai SNC France 50.00 50.00
SAS Autosystemtechnik Verwaltungs GmbH Germany 50.00 50.00
SAS Autosystemtechnik GmbH & Co. KG « 50.00 50.00
SAS Automotive N.V. Belgium 50.00 50.00
SAS Autosystemtechnick SA Spain 50.00 50.00
SAS Autosystemtechnik de Portugal Unipessoal Ltda Portugal 50.00 50.00
SAS Automotive Limited United Kingdom 50.00 50.00
SAS Autosystemtechnick Sro Czech Republic 50.00 50.00
SAS Automotive Sro Slovakia 50.00 50.00
SAS Automotive R.S.A. (PTY) Ltd South Africa 50.00 50.00
SAS Automotive do Brasil Ltda Brazil 50.00 50.00
SAS Automotive Systems SA de CV Mexico 50.00 50.00
SAS Automotive Systems & Services SA Mexico 50.00 50.00
SAS Automotive USA Inc. United States 50.00 50.00
(1) Total interest of fully-consolidated companies.

136 Faurecia > 2007 Registration document
FAURECIA – CONSOLIDATED FINANCIAL STATEMENTS7 Statutory Auditors’ report on the consolidated fi nancial statements
This is a free translation into English of the Statutory Auditors’ report issued in the French language and is provided solely for the convenience of English
speaking readers. The Statutory Auditors’ report includes information specifi cally required by French law in all audit reports, whether qualifi ed or not. This
information is presented below the opinion on the consolidated fi nancial statements and includes an explanatory paragraph discussing the auditors’
assessments of certain signifi cant accounting and auditing matters. These assessments were considered for the purpose of issuing an audit opinion on the
consolidated fi nancial statements taken as a whole and not to provide separate assurance on individual account captions or on information taken outside
of the consolidated fi nancial statements.
This report should be read in conjunction with, and construed in accordance with, French law and professional auditing standards applicable in France
To the Shareholders,
In compliance with the assignment entrusted to us by the Annual Shareholders’ Meeting, we have audited the accompanying consolidated
fi nancial statements of Faurecia SA and its subsidiaries for the year ended December 31, 2007.
These consolidated fi nancial statements have been approved by the Board of Directors. Our role is to express an opinion on these consolidated
fi nancial statements based on our audit.
I. Opinion on the consolidated fi nancial statements
We conducted our audit in accordance with professional standards applicable in France. Those standards require that we plan and perform
the audit to obtain reasonable assurance about whether the consolidated fi nancial statements are free of material misstatement. An audit
includes examining, on a test basis, evidence supporting the amounts and disclosures in the consolidated fi nancial statements. An audit
also includes assessing the accounting principles used and signifi cant estimates made by management, as well as evaluating the overall
presentation of the consolidated fi nancial statements. We believe that our audit provides a reasonable basis for our opinion.
In our opinion, the consolidated fi nancial statements give a true and fair view of the assets and liabilities and of the fi nancial position of the
Group as at December 31, 2007 and the results of its operations for the year then ended in accordance with IFRS as adopted by the European
Union.
II. Justifi cation of our assessments
In accordance with the requirements of article L.823-9 of the French Commercial Code (Code de commerce) relating to the justifi cation of our
assessments, we bring to your attention the following matters:
• The Company performs impairment tests on goodwill at each balance sheet date, and also assesses whether fi xed assets show any
indication of impairment, based on the methods described in notes 1-2, 1-5 and 10 to the consolidated fi nancial statements. We reviewed the
methods applied to carry out these impairment tests, as well as the cash fl ow projections and assumptions used. We also verifi ed that note
10 discloses appropriate disclosures in this regard.
• Note 1-16 to the consolidated fi nancial statements, concerning corporate income taxes, specifi es that deferred tax assets are not recognized
in the accounts when it is deemed uncertain that they will be recovered in the future. Our work consisted in verifying that this method had
been correctly applied and assessing whether the forecast data and assumptions supporting the probability of recovery for these deferred
tax assets were reasonable.
• As part of our assessment of the accounting rules and principles applied by your Company, we reviewed the criteria used for capitalizing and
amortizing development expense and measuring the recoverable amount. We also ensured that Note 1-3 discloses appropriate information.
These assessments were made in the context of our audit of the consolidated fi nancial statements, taken as a whole, and therefore contributed
to the opinion we formed which is expressed in the fi rst part of this report.
III. Specifi c verifi cation
In accordance with professional standards applicable in France, we have also verifi ed the information given in the Group Director’s r eport. We
have no matters to report regarding its fair presentation and conformity with the consolidated fi nancial statements.
Neuilly-sur-Seine and Paris-La Défense, February 18, 2008
The Statutory Auditors
PricewaterhouseCoopers Audit Ernst & Young Audit
Dominique Ménard Laurent Miannay

8LEGAL AND FINANCIAL
INFORMATION
CONTENTS
137Faurecia > 2007 Registration document
8.1 Faurecia S.A. 138
8.1.1 Management reportof the parent company 138
8.1.2 Income statements 140
8.1.3 Balance sheets 141
8.1.4 Cash fl ow statements 142
8.1.5 Notes to the 2007 parent company fi nancial statements 143
8.1.6 Appropriation of 2007 net income 155
8.1.7 Subsidiaries and associatesas of December 31, 2007 156
8.1.8 Five-year fi nancial summary 158
8.1.9 Securities portfolioas of December 31, 2007 159
8.1.10 Statutory Auditors’ reports 160
8.2 Internal control 162
8.2.1 Report by the Chairmanof the Board of Directorson internal control drawn upin accordance with Article L. 225-37 of the French Commercial Code 162
8.2.2 Statutory Auditors’ reporton the Chairman’s reporton internal control 168
8.3 Additional informationon Faurecia S.A. 169
8.3.1 History 169
8.3.2 Legal information about the Company 171
8.3.3 Information published aboutthe Company 187
138 Faurecia > 2007 Registration document
LEGAL AND FINANCIAL INFORMATION8 Faurecia S.A.
8.1.1 MANAGEMENT REPORT OF THE PARENT COMPANY
The parent company, Faurecia S.A., is a holding company which
directly and indirectly provides fi nancial, accounting, general
management and administrative services to companies in the
Group.
Sales for 2007 amounted to €73.1 million versus €87.1 million in
2006, refl ecting a decrease in amounts rebilled to subsidiaries for
services rendered due to Group-level cost reduction measures.
In addition to providing services to Group subsidiaries, since
2006 Faurecia has invoiced trademark royalties to certain
French subsidiaries. These royalties totaled €18.1 million in 2007
(€16.6 million in 2006).
Results
The Company ended 2007 with an operating loss of €2.2 million
versus operating income of €1.7 million in 2006. The majority of
operating expenses are rebilled to the Group’s subsidiaries.
Net fi nancial income came in at €53.2 million compared with net
fi nancial expense of €205.3 million in 2006, due to a sharp decrease
in charges to provisions for impairment of investments. The 2007
fi gure includes the following:
a €22.2 million charge to provisions for impairment of investments,
corresponding to fair value remeasurements of certain shares.
This amount was down signifi cantly on 2006 and 2005, when
charges were recorded for the impact of decreases in valuations
of the Vehicle Interiors business recorded in the consolidated
fi nancial statements;
€128.2 million in dividends received from subsidiaries – including
€100.9 million from Faurecia Investments – compared with
€153.6 million in 2006;
net borrowing costs of €40.9 million (€40.6 million in 2006). In
2007 these costs were contained by the interest rate caps set
up by the Group which limited the impact of rises in interest rates
on the Company’s net debt, which is primarily at fl oating rates
(81.2% as of end-2007).
Net non-recurring income for the year amounted to €2.0 million
and mainly comprised provision reversals. In 2006 this item totaled
€27.8 million and included the impact of two reclassifi cations of
investments within the Group.
•
•
•
The corporate income tax benefi t arising from the results of the
French subsidiaries in the tax group rose €13.7 million from
€10.5 million in 2006 to €24.2 million in 2007.
Faurecia S.A. recorded net income of €77.2 million in 2007 following
two years of net losses.
Financial structure and debt
Net cash provided by operating and investing activities in 2007 came
to €173.5 million. Cash fl ow from operations totaled €105.8 million
and working capital requirement decreased by €65.3 million, mainly
due to repayment to Faurecia of the deposit relating to a European
receivables sale program which terminated in May 2007.
No acquisitions of investments in subsidiaries and associates
were recorded in the 2007 cash fl ow statement. Similarly, capital
increases carried out by Faurecia’s direct subsidiaries had no effect
on the cash fl ow statement in 2007, as the €187.7 million share
issue by the North American subsidiary Faurecia USA Holding
decided as of end-2006 and completed in early 2007 was paid up
by capitalizing receivables and had no impact on the Company’s
fi nancing needs for the year.
The carrying amount of investments in subsidiaries and associates
recognized in the balance sheet as of December 31, 2007 came to
€1,612.4 million, compared with €1,451.2 million one year earlier.
As of December 31, 2007 net debt, corresponding to borrowings
net of cash and cash equivalents, marketable securities and net
inter-company cash advances, amounted to €1,341.1 million,
versus €1,468.1 million as of end-2006.
The Company’s sources of fi nancing comprise the following:
a €300 million bond issue carried out in October 2005 and which
matures in October 2010;
a €1.6 billion syndicated line of credit which can be drawn
down for renewable periods of one to six months, expiring in
November 2009, of which €800 million had been used as of
December 31, 2007;
a commercial paper program issued on the French domestic
market for a total amount of €850 million of which €503.7 million
had been used as of December 31, 2007. The liquidity of this
program is guaranteed by the syndicated line of credit.
The contracts relating to the Company’s bonds and syndicated
line of credit contain covenants, particularly relating to certain
•
•
•

139Faurecia > 2007 Registration document
LEGAL AND FINANCIAL INFORMATION 8Faurecia S.A.
consolidated fi nancial ratios. All of these covenants were complied
with as of December 31, 2007.
Total shareholders’ equity amounted to €472.7 million as of
December 31, 2007, versus €390.0 million as of December 31, 2006.
Business review relating to the Company’s subsidiaries
Operations and results of the Company’s subsidiaries are analyzed
in detail when the consolidated fi nancial statements are prepared.
The year 2007 marked the fi rst stages of a turnaround for the
Faurecia Group with an increase in operating income, a decrease in
the consolidated net loss, and tightly controlled borrowings.
At the same time, the Group pursued the restructuring measures
begun several years ago. Faurecia Deutschland Holding and its
mainly German subsidiaries specializing in the Automotive Seating,
Exhaust Systems and Front End businesses were merged into
Faurecia Automotive GmbH with a view to combining all of the
Group’s German subsidiaries in one entity and set up a single tax
group. In parallel, as part of the Group’s international expansion
strategy new subsidiaries were formed in 2007 – notably in Central
Europe and Asia.
The only changes to the Company’s capital stock in the year related
to the issuance of shares on the exercise of stock options by the
Company’s senior managers. The Board of Directors did not use the
authorization given by the Shareholders’ Meeting of May 22, 2006
to increase the capital stock by a maximum amount of €61 million.
The risks to which the Company is exposed are described in the
Management report of the Board of Directors on the consolidated
fi nancial statements.
The draft resolutions presented below are an integral part of this
document and supplement the information provided to shareholders.
In the ordinary resolutions, the Company’s shareholders are asked
to approve the fi nancial statements of the Company and the Group,
as well as to appropriate net income for the year. Shareholders are
also requested to ratify the Board’s October 8, 2007 appointment of
Isabel Marey-Semper as a director. A full list of the other directorships
and positions held by Isabel Marey-Semper is provided in section
8.3.2.2 (page 177) of this registration document.
In the extraordinary resolutions, the Company’s shareholders are
invited to authorize the Board of Directors to issue Faurecia shares
and/or securities carrying rights to shares as described below:
in the sixth and seventh resolutions the Board of Directors
is asking shareholders to renew the authorizations previously
given in order to enable it to rapidly carry out capital increases
whenever required;
the purpose of the sixth resolution, drawn up in accordance
with Articles L. 225-119 et seq. of the French Commercial Code,
is to authorize the Board to issue shares and/or securities
carrying immediate or deferred rights to shares in the Company,
with pre-emptive subscription rights for existing shareholders.
The maximum amount by which the Company’s capital may be
increased under this authorization is €61 million. The maximum
nominal amount of debt securities carrying rights to the
Company’s shares would be capped at €1 billion;
the purpose of the seventh resolution, also drawn up in
accordance with Articles L. 225-119 et seq. of the French
Commercial Code, is to authorize the Board to issue shares
and/or securities carrying immediate or deferred rights to
shares in the Company, subject to the same conditions as in
the sixth resolution but without pre-emptive subscription rights
for existing shareholders. However, the Board may offer existing
shareholders a priority right to subscribe for any issues carried
out under this authorization. The price of the shares to be issued
on the purchase, conversion, exchange or exercise of warrants
would equal at least the average weighted price of the Faurecia
share on the Paris stock exchange over the three trading days
preceding the pricing date, less a maximum discount of 5%;
the Board of Directors is obliged to table an eighth resolution
concerning employee rights issues pursuant to the requirements
of the French Act of February 9, 2001 on employee stock
ownership and the Social Modernization Act of January 2002.
Under this authorization the Board of Directors would be entitled
to issue shares to employees in accordance with Article L. 443-5
of the French Labor Code and subject to an aggregate maximum
ceiling of €5,120,000. The Board of Directors would determine
the issue price for the new shares in accordance with the
provisions of said Article and would set the conditions for paying
up the shares, as well as the terms, conditions and timing of
employee subscriptions.
The Board of Directors does not recommend that shareholders
adopt this resolution in view of the other procedures in place
enabling employees to take up the Company’s shares under
favorable conditions.
•
•
•
•

140 Faurecia > 2007 Registration document
LEGAL AND FINANCIAL INFORMATION8 Faurecia S.A.
8.1.2 INCOME STATEMENTS
(in € thousands) Notes 2007 2006 2005
Services sold 73,124 87,108 82,779
Sales 73,124 87,108 82,779
Capitalized production 566 155 185
External services (66,214) (78,498) (63,742)
Taxes other than on income (1,461) (2,172) (1,123)
Wages and salaries (13,553) (9,785) (9,307)
Payroll taxes (7,357) (3,841) (3,373)
Depreciation, amortization and provisions (less reversals) (5,224) (7,669) (8,469)
Other income and expenses, net 17,959 16,418 (164)
Total operating expenses (75,284) (85,392) (85,993)
OPERATING INCOME (LOSS) (2,160) 1,716 (3,214)
Financial income 3 204,042 305,536 100,338
Interest and other fi nancial expenses 3 (150,876) (510,798) (522,413)
NET FINANCIAL INCOME (EXPENSE) 3 53,166 (205,262) (422,075)
OPERATING INCOME (LOSS) AFTER NET FINANCIAL INCOME (EXPENSE) 51,006 (203,546) (425,289)
Non-recurring income 4 6,776 86,537 157,435
Non-recurring expense 4 (4,825) (58,738) (164,822)
NET NON-RECURRING INCOME (EXPENSE) 4 1,951 27,799 (7,387)
Employee profi t-sharing
Corporate income tax 5 24,197 10,522 16,918
NET INCOME (LOSS) 77,154 (165,225) (415,758)

141Faurecia > 2007 Registration document
LEGAL AND FINANCIAL INFORMATION 8Faurecia S.A.
8.1.3 BALANCE SHEETS
ASSETS(in € thousands)
Dec. 31, 2007 Dec. 31, 2006 Dec. 31, 2005
Notes Cost
Depreciation, amortization and
provisions Net Net Net
Intangible assets 6 16,224 14,140 2,084 2,807 5,935
Property, plant and equipment 7 11,023 7,097 3,926 5,469 5,909
Investments 8 2,700,750 930,226 1,770,524 1,741,966 1,944,722
Total fi xed assets 2,727,997 951,463 1,776,534 1,750,242 1,956,566
Trade receivables 47,135 47,135 56,163 27,210
Other receivables 9 824,410 2,898 821,512 783,765 811,112
Cash and cash equivalents 10 18,205 18,205 16,942 16,296
Total current assets 889,750 2,898 886,852 856,870 854,618
Prepaid expenses 11 12,893 12,893 16,176 18,156
Conversion losses 4 4 0 0
Deferred charges 1,259 1,259 2,206 3,175
TOTAL ASSETS 3,631,903 954,361 2,677,542 2,625,494 2,832,515
LIABILITIES AND SHAREHOLDERS’ EQUITY(in € thousands) Notes Dec. 31, 2007 Dec. 31, 2006 Dec. 31, 2005
Capital stock 170,765 169,815 169,635
Additional paid-in capital 198,846 359,566 723,184
Legal reserve 16,948 16,948 16,948
Untaxed reserves 8,939 8,939 8,939
Other reserves 3,020
Retained earnings 48,232
Net income (loss) for the year 77,154 (165,225) (415,758)
Untaxed provisions
Total shareholders’ equity 12 472,652 390,043 554,200
Provisions for contingencies and charges 13 4,607 6,140 4,730
Perpetual notes 14 65,734
Other debt 15 1,611,457 1,532,612 1,364,385
Total debt 1,611,457 1,532,612 1,430,119
Operating payables 16 27,659 33,749 25,650
Other payables 16 558,659 661,830 815,889
Total payables 586,318 695,579 841,539
Deferred income 17 2,506 745 1,927
Conversion gains 2 375
TOTAL LIABILITIES AND SHAREHOLDERS’ EQUITY 2,677,542 2,625,494 2,832,515
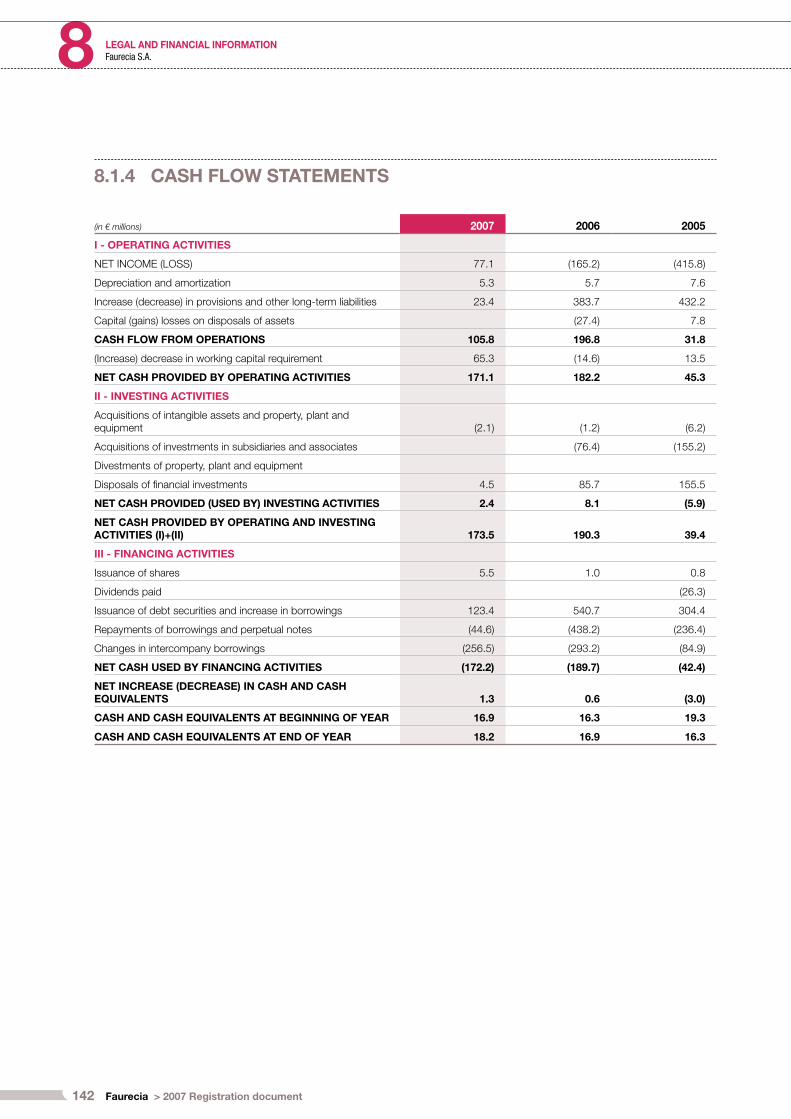
142 Faurecia > 2007 Registration document
LEGAL AND FINANCIAL INFORMATION8 Faurecia S.A.
8.1.4 CASH FLOW STATEMENTS
(in € millions) 2007 2006 2005
I - OPERATING ACTIVITIES
NET INCOME (LOSS) 77.1 (165.2) (415.8)
Depreciation and amortization 5.3 5.7 7.6
Increase (decrease) in provisions and other long-term liabilities 23.4 383.7 432.2
Capital (gains) losses on disposals of assets (27.4) 7.8
CASH FLOW FROM OPERATIONS 105.8 196.8 31.8
(Increase) decrease in working capital requirement 65.3 (14.6) 13.5
NET CASH PROVIDED BY OPERATING ACTIVITIES 171.1 182.2 45.3
II - INVESTING ACTIVITIES
Acquisitions of intangible assets and property, plant and equipment (2.1) (1.2) (6.2)
Acquisitions of investments in subsidiaries and associates (76.4) (155.2)
Divestments of property, plant and equipment
Disposals of fi nancial investments 4.5 85.7 155.5
NET CASH PROVIDED (USED BY) INVESTING ACTIVITIES 2.4 8.1 (5.9)
NET CASH PROVIDED BY OPERATING AND INVESTING ACTIVITIES (I)+(II) 173.5 190.3 39.4
III - FINANCING ACTIVITIES
Issuance of shares 5.5 1.0 0.8
Dividends paid (26.3)
Issuance of debt securities and increase in borrowings 123.4 540.7 304.4
Repayments of borrowings and perpetual notes (44.6) (438.2) (236.4)
Changes in intercompany borrowings (256.5) (293.2) (84.9)
NET CASH USED BY FINANCING ACTIVITIES (172.2) (189.7) (42.4)
NET INCREASE (DECREASE) IN CASH AND CASH EQUIVALENTS 1.3 0.6 (3.0)
CASH AND CASH EQUIVALENTS AT BEGINNING OF YEAR 16.9 16.3 19.3
CASH AND CASH EQUIVALENTS AT END OF YEAR 18.2 16.9 16.3
143Faurecia > 2007 Registration document
LEGAL AND FINANCIAL INFORMATION 8Faurecia S.A.
8.1.5 NOTES TO THE 2007 PARENT COMPANY FINANCIAL
STATEMENTS
NOTE 1 SUMMARY OF SIGNIFICANT ACCOUNTING POLICIES
The parent company fi nancial statements have been prepared in
accordance with French generally accepted accounting principles
(PCG 99-03 as amended by the regulations of the Comité de
Réglementation Comptable (Accounting Regulation Committee).
The main policies applied are as follows:
A - PROPERTY, PLANT AND EQUIPMENT
Property, plant and equipment are stated at acquisition or production
cost. Depreciation is calculated by the straight-line method over the
estimated useful life of the assets, as follows:
buildings: 25 to 30 years;
leasehold improvements, fi xtures and fi ttings: 7 to 10 years;
other fi xtures and fi ttings: 10 years;
offi ce equipment and computers: 3 to 5 years;
software: 1 to 3 years;
furniture: 10 years.
B - INVESTMENTS
Investments are stated at the lower of cost and value in use. Value
in use is based on the subsidiary’s revalued net assets, profi tability
and future prospects.
For investments intended to be sold, value-in-use estimates also
take into account prices at which prior transactions were carried
out, if any.
C - MARKETABLE SECURITIES
Marketable securities are stated at the lower of cost and market
value.
•
•
•
•
•
•
D - FOREIGN CURRENCY TRANSACTIONS
Unhedged payables and receivables in foreign currency are
translated at the exchange rate prevailing on the transaction date.
At the year-end, they are translated at the year-end exchange rate
and the resulting gain or loss is recorded in the balance sheet under
“Conversion losses” or “Conversion gains”.
Hedged payables and receivables are translated at the hedging
rate.
E - PROVISION FOR PENSION AND RETIREMENT
BENEFITS
The vested rights of employees under supplementary pension and
retirement bonus plans are determined on an actuarial basis using
the projected benefi t obligation method. The valuation takes into
account the probability of employees staying with the Company
up to retirement age and expected future salary levels. Benefi t
obligations are partially funded by contributions to external funds.
In cases where the funds are permanently allocated to the benefi t
plan concerned, their value is deducted from the related liability.
F - NON-RECURRING ITEMS
Unusual or non-recurring items are included under “Non-recurring
income” and “Non-recurring expense”.
G - FINANCIAL INSTRUMENTS
Interest rate risks are hedged, where appropriate, using fi nancial
instruments traded on organized or over-the-counter markets.
Hedging gains and losses are recognized on a symmetrical basis
with the loss or gain on the hedged item.
NOTE 2 SUBSEQUENT EVENTS
No signifi cant events have occurred since the balance sheet date.
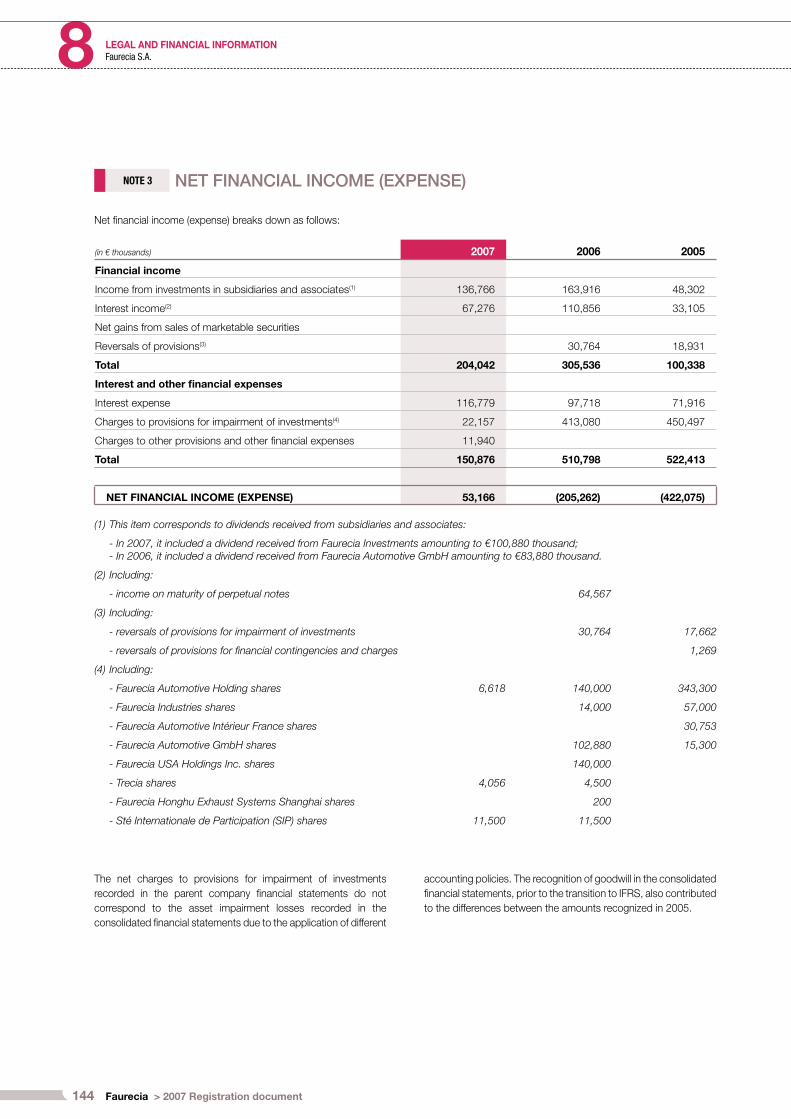
144 Faurecia > 2007 Registration document
LEGAL AND FINANCIAL INFORMATION8 Faurecia S.A.
NOTE 3 NET FINANCIAL INCOME (EXPENSE)
(1) This item corresponds to dividends received from subsidiaries and associates:
- In 2007, it included a dividend received from Faurecia Investments amounting to €100,880 thousand; - In 2006, it included a dividend received from Faurecia Automotive GmbH amounting to €83,880 thousand.
(2) Including:
- income on maturity of perpetual notes 64,567
(3) Including:
- reversals of provisions for impairment of investments 30,764 17,662
- reversals of provisions for financial contingencies and charges 1,269
(4) Including:
- Faurecia Automotive Holding shares 6,618 140,000 343,300
- Faurecia Industries shares 14,000 57,000
- Faurecia Automotive Intérieur France shares 30,753
- Faurecia Automotive GmbH shares 102,880 15,300
- Faurecia USA Holdings Inc. shares 140,000
- Trecia shares 4,056 4,500
- Faurecia Honghu Exhaust Systems Shanghai shares 200
- Sté Internationale de Participation (SIP) shares 11,500 11,500
Net fi nancial income (expense) breaks down as follows:
(in € thousands) 2007 2006 2005
Financial income
Income from investments in subsidiaries and associates(1) 136,766 163,916 48,302
Interest income(2) 67,276 110,856 33,105
Net gains from sales of marketable securities
Reversals of provisions(3) 30,764 18,931
Total 204,042 305,536 100,338
Interest and other fi nancial expenses
Interest expense 116,779 97,718 71,916
Charges to provisions for impairment of investments(4) 22,157 413,080 450,497
Charges to other provisions and other fi nancial expenses 11,940
Total 150,876 510,798 522,413
NET FINANCIAL INCOME (EXPENSE) 53,166 (205,262) (422,075)
The net charges to provisions for impairment of investments
recorded in the parent company fi nancial statements do not
correspond to the asset impairment losses recorded in the
consolidated fi nancial statements due to the application of different
accounting policies. The recognition of goodwill in the consolidated
fi nancial statements, prior to the transition to IFRS, also contributed
to the differences between the amounts recognized in 2005.
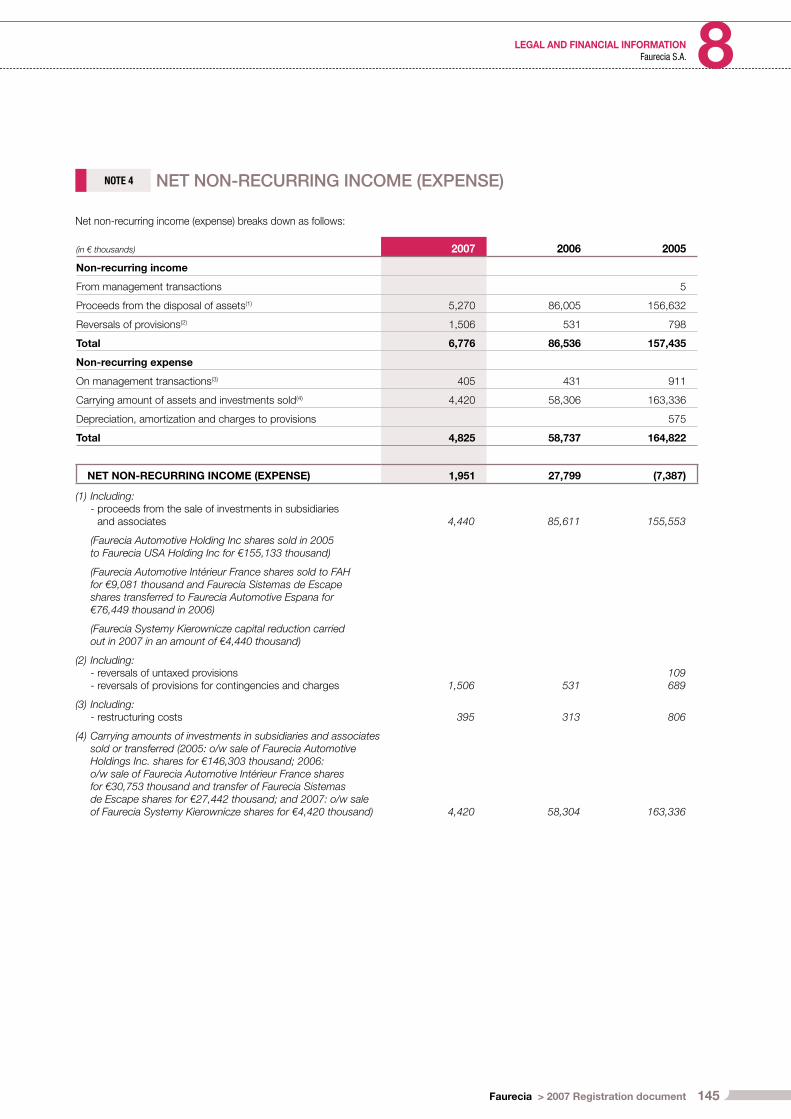
145Faurecia > 2007 Registration document
LEGAL AND FINANCIAL INFORMATION 8Faurecia S.A.
NOTE 4 NET NON-RECURRING INCOME (EXPENSE)
Net non-recurring income (expense) breaks down as follows:
(in € thousands) 2007 2006 2005
Non-recurring income
From management transactions 5
Proceeds from the disposal of assets(1) 5,270 86,005 156,632
Reversals of provisions(2) 1,506 531 798
Total 6,776 86,536 157,435
Non-recurring expense
On management transactions(3) 405 431 911
Carrying amount of assets and investments sold(4) 4,420 58,306 163,336
Depreciation, amortization and charges to provisions 575
Total 4,825 58,737 164,822
NET NON-RECURRING INCOME (EXPENSE) 1,951 27,799 (7,387)
(1) Including:- proceeds from the sale of investments in subsidiaries
and associates 4,440 85,611 155,553
(Faurecia Automotive Holding Inc shares sold in 2005 to Faurecia USA Holding Inc for €155,133 thousand)
(Faurecia Automotive Intérieur France shares sold to FAH for €9,081 thousand and Faurecia Sistemas de Escape shares transferred to Faurecia Automotive Espana for €76,449 thousand in 2006)
(Faurecia Systemy Kierownicze capital reduction carried out in 2007 in an amount of €4,440 thousand)
(2) Including:- reversals of untaxed provisions- reversals of provisions for contingencies and charges 1,506 531
109689
(3) Including:- restructuring costs 395 313 806
(4) Carrying amounts of investments in subsidiaries and associates sold or transferred (2005: o/w sale of Faurecia Automotive Holdings Inc. shares for €146,303 thousand; 2006: o/w sale of Faurecia Automotive Intérieur France shares for €30,753 thousand and transfer of Faurecia Sistemas de Escape shares for €27,442 thousand; and 2007: o/w sale of Faurecia Systemy Kierownicze shares for €4,420 thousand) 4,420 58,304 163,336

146 Faurecia > 2007 Registration document
LEGAL AND FINANCIAL INFORMATION8 Faurecia S.A.
NOTE 5 CORPORATE INCOME TAX
Faurecia has elected to fi le consolidated tax returns. The tax group includes the parent company and its main French subsidiaries. This
election allows Faurecia to obtain a tax benefi t by offsetting any tax losses recorded by the Company and certain of its subsidiaries against
the taxable income of other subsidiaries in the tax group:
(in € thousands) 2007 2006 2005
Tax income from subsidiaries in the tax group 24,524 10,419 17,500
Tax benefi t (expense) – tax audit (327) 103 (582)
TOTAL 24,197 10,522 16,918
NOTE 6 INTANGIBLE ASSETS
Intangible assets can be analyzed as follows:
(in € thousands)
Patents and licenses
Other intangible assets
Intangible assets in progress Total
Net as of January 1, 2005 3,373 3,373
Additions (including own work capitalized) 6,293 6,293
Amortization and provisions for impairment in value (3,731) (3,731)
Net as of December 31, 2005 5,935 0 0 5,935
Additions (including own work capitalized) 365 365
Amortization and provisions for impairment in value (3,493) (3,493)
Net as of December 31, 2006 2,807 0 0 2,807
Additions (including own work capitalized) 1,171 1,347 2,518
Amortization and provisions for impairment in value (2,463) (778) (3,241)
Net as of December 31, 2007 344 393 1,347 2,084

147Faurecia > 2007 Registration document
LEGAL AND FINANCIAL INFORMATION 8Faurecia S.A.
NOTE 7 PROPERTY, PLANT AND EQUIPMENT
Property, plant and equipment can be analyzed as follows:
(in € thousands)
Dec. 31, 2007 Dec. 31, 2006 Dec. 31, 2005
Cost Net Net Net
Land 54 54 55 56
Buildings 285 0 1
Other property, plant and equipment in progress 10,684 3,872 5,414 5,852
TOTAL 11,023 3,926 5,469 5,909
(in € thousands) Land Buildings
Other property, plant and
equipment
Property, plant and equipment
in progress Total
Net as of January 1, 2005 56 7 7,000 304 7,367
Additions (including own work capitalized) 144 144
Disposals 0
Depreciation and provisions for impairment in value (6) (1,338) (1,344)
Depreciation written off on disposals 0
Other movements (258) (258)
Net as of December 31, 2005 56 1 5,806 46 5,909
Additions (including own work capitalized) 227 600 827
Disposals (1) (14) (15)
Depreciation and provisions for impairment in value (1,265) (1,265)
Depreciation written off on disposals 13 13
Other movements 0
Net as of December 31, 2006 55 0 4,768 646 5,469
Additions (including own work capitalized) 177 177
Disposals (1) (3) (4)
Depreciation and provisions for impairment in value 3 (1,073) (1,070)
Depreciation written off on disposals 0
Other movements (646) (646)
Net as of December 31, 2007 54 0 3,872 0 3,926

148 Faurecia > 2007 Registration document
LEGAL AND FINANCIAL INFORMATION8 Faurecia S.A.
NOTE 8 INVESTMENTS
(in € thousands)
Dec. 31, 2007 Dec. 31, 2006 Dec. 31, 2005
Cost Provisions Net Net Net
Investments in subsidiaries and associates 2,542,603 930,226 1,612,377 1,451,183 1,815,302
Loans to subsidiaries and associates 158,147 158,147 290,783 129,367
Other 0 0 53
TOTAL 2,700,750 930,226 1,770,524 1,741,966 1,944,722
Loans to subsidiaries and associates are due in more than one year.
NOTE 9 RECEIVABLES
NOTE 10 CASH AND CASH EQUIVALENTS
As of December 31, 2007, cash and cash equivalents
corresponded mainly to 270,814 Faurecia shares with a carrying
amount of €11.5 million compared with 302,154 Faurecia shares
with a carrying amount of €12.5 million as of December 31, 2006,
refl ecting the following transactions:
200,000 shares contributed by Ectra in 1999;
19,613 shares purchased in 2000;
96,361 shares purchased in 2001;
96,860 shares purchased in 2002;
32,745 shares sold in 2004;
74,285 shares sold in 2005;
•
•
•
•
•
•
30,000 shares purchased in 2005;
33,650 shares sold in 2006;
31,340 shares sold in 2007.
The shares are being held for allocation on exercise of stock options
granted to directors and managers of the Group.
At its meetings held on September 6, 1999, September 4, 2000
and April 26, 2001, the Board of Directors decided to grant,
respectively, 200,000 stock options with an exercise price of €52
each, 254,000 stock options with an exercise price of €40 each
and 43,500 stock options with an exercise price of €54.5 each.
•
•
•
Receivables mainly comprise:
cash advances to various Group companies totaling €800.6 million
as of December 31, 2007 (December 31, 2006: €694.8 million;
December 31, 2005: €712.2 million);
taxes due by subsidiaries in the tax group, in an amount of
€10.9 million (December 31, 2006: €2.1 million; December 31,
2005: €4.1 million);
corporate income tax receivables in an amount of €6.8 million
as of December 31, 2007 (December 31, 2006: €3.9 million;
December 31, 2005: €2.9 million);
•
•
•
a securitization deposit which amounted to €78.6 million as of
December 31, 2006 and €85.7 million as of December 31, 2005
but was reduced to zero as of December 31, 2007;
recoverable VAT of €1 million compared with €1.1 million in
2006.
Receivables due within one year amounted to €816.5 million as of
December 31, 2007 and those due in more than one year totaled
€5 million.
•
•
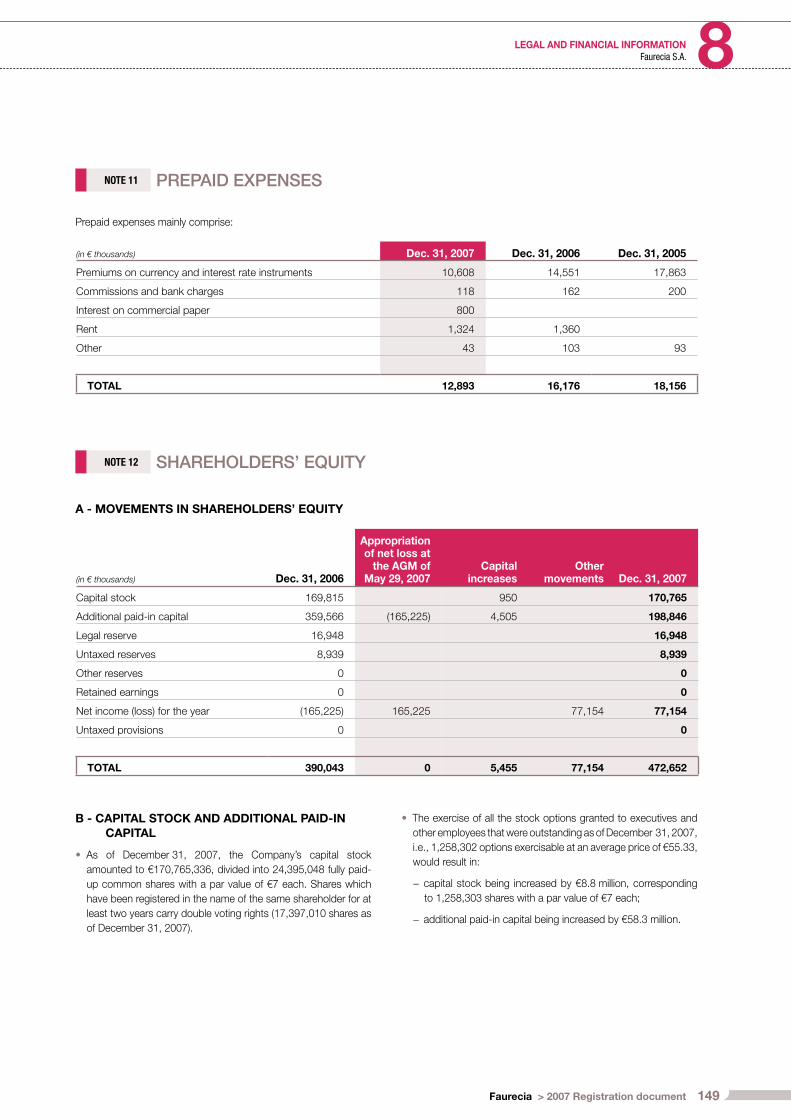
149Faurecia > 2007 Registration document
LEGAL AND FINANCIAL INFORMATION 8Faurecia S.A.
NOTE 11 PREPAID EXPENSES
Prepaid expenses mainly comprise:
(in € thousands) Dec. 31, 2007 Dec. 31, 2006 Dec. 31, 2005
Premiums on currency and interest rate instruments 10,608 14,551 17,863
Commissions and bank charges 118 162 200
Interest on commercial paper 800
Rent 1,324 1,360
Other 43 103 93
TOTAL 12,893 16,176 18,156
NOTE 12 SHAREHOLDERS’ EQUITY
A - MOVEMENTS IN SHAREHOLDERS’ EQUITY
(in € thousands) Dec. 31, 2006
Appropriation of net loss at
the AGM of May 29, 2007
Capital increases
Other movements Dec. 31, 2007
Capital stock 169,815 950 170,765
Additional paid-in capital 359,566 (165,225) 4,505 198,846
Legal reserve 16,948 16,948
Untaxed reserves 8,939 8,939
Other reserves 0 0
Retained earnings 0 0
Net income (loss) for the year (165,225) 165,225 77,154 77,154
Untaxed provisions 0 0
TOTAL 390,043 0 5,455 77,154 472,652
B - CAPITAL STOCK AND ADDITIONAL PAID-IN
CAPITAL
As of December 31, 2007, the Company’s capital stock
amounted to €170,765,336, divided into 24,395,048 fully paid-
up common shares with a par value of €7 each. Shares which
have been registered in the name of the same shareholder for at
least two years carry double voting rights (17,397,010 shares as
of December 31, 2007).
•
The exercise of all the stock options granted to executives and
other employees that were outstanding as of December 31, 2007,
i.e., 1,258,302 options exercisable at an average price of €55.33,
would result in:
capital stock being increased by €8.8 million, corresponding
to 1,258,303 shares with a par value of €7 each;
additional paid-in capital being increased by €58.3 million.
•
−
−
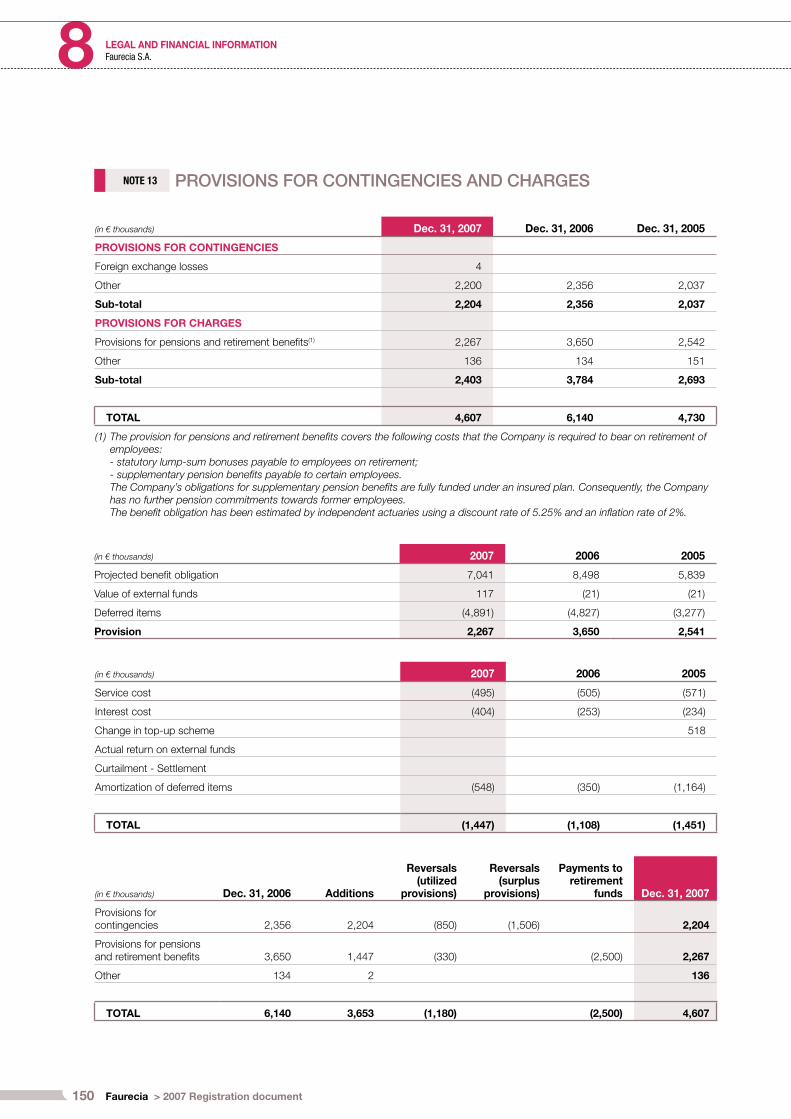
150 Faurecia > 2007 Registration document
LEGAL AND FINANCIAL INFORMATION8 Faurecia S.A.
(in € thousands) Dec. 31, 2007 Dec. 31, 2006 Dec. 31, 2005
PROVISIONS FOR CONTINGENCIES
Foreign exchange losses 4
Other 2,200 2,356 2,037
Sub-total 2,204 2,356 2,037
PROVISIONS FOR CHARGES
Provisions for pensions and retirement benefi ts(1) 2,267 3,650 2,542
Other 136 134 151
Sub-total 2,403 3,784 2,693
TOTAL 4,607 6,140 4,730
(1) The provision for pensions and retirement benefits covers the following costs that the Company is required to bear on retirement of employees:- statutory lump-sum bonuses payable to employees on retirement;- supplementary pension benefi ts payable to certain employees. The Company’s obligations for supplementary pension benefits are fully funded under an insured plan. Consequently, the Company has no further pension commitments towards former employees.The benefi t obligation has been estimated by independent actuaries using a discount rate of 5.25% and an infl ation rate of 2%.
(in € thousands) 2007 2006 2005
Projected benefi t obligation 7,041 8,498 5,839
Value of external funds 117 (21) (21)
Deferred items (4,891) (4,827) (3,277)
Provision 2,267 3,650 2,541
(in € thousands) 2007 2006 2005
Service cost (495) (505) (571)
Interest cost (404) (253) (234)
Change in top-up scheme 518
Actual return on external funds
Curtailment - Settlement
Amortization of deferred items (548) (350) (1,164)
TOTAL (1,447) (1,108) (1,451)
NOTE 13 PROVISIONS FOR CONTINGENCIES AND CHARGES
(in € thousands) Dec. 31, 2006 Additions
Reversals (utilized
provisions)
Reversals (surplus
provisions)
Payments to retirement
funds Dec. 31, 2007
Provisions for contingencies 2,356 2,204 (850) (1,506) 2,204
Provisions for pensions and retirement benefi ts 3,650 1,447 (330) (2,500) 2,267
Other 134 2 136
TOTAL 6,140 3,653 (1,180) (2,500) 4,607

151Faurecia > 2007 Registration document
LEGAL AND FINANCIAL INFORMATION 8Faurecia S.A.
NOTE 14 PERPETUAL NOTES
On October 15, 1991, Faurecia (formerly Bertrand Faure) issued
subordinated perpetual notes amounting to FRF 900 million
(€137.2 million).
The subordination clause relating to these notes was removed as
part of a restructuring that took place in 1996. The €8.6 million
gain that arose on the restructuring was recognized on a straight-
line basis over the period between July 30, 1996 and October 15,
2006.
The entire operation was approved by the French tax authorities
(Service de la Législation Fiscale) which decided that the tax regime
originally applicable to the notes in 1991 could still apply, i.e. interest
paid was deductible based on the amount effectively received,
corresponding to €98.5 million. However, Article 238 bis-01 of the
French General Tax Code provides that the interest capitalized over
the preceding three years relating to the portion of funds transferred
outside France must be included in taxable income.
As the perpetual notes matured in October 2006, their net amount
(€64.6 million) was taken to the 2006 income statement.
NOTE 15 OTHER DEBT
(in € thousands) Dec. 31, 2007 Dec. 31, 2006 Dec. 31, 2005
Bonds 300,000 300,000 299,919
Bank borrowings 1,308,119 1,228,907 1,060,359
Other 3,338 3,705 4,107
TOTAL 1,611,457 1,532,612 1,364,385
On October 5, 2005, Faurecia issued €300 million worth of bonds
redeemable in October 2010.
In addition, Faurecia has access to a medium-term syndicated
line of credit of up to €1,600 million which can be drawn down
for renewable periods of one, three or six months through
November 2009. As of December 31, 2007, the undrawn portion
of this credit line amounted to €800 million.
The contracts relating to the Company’s bonds and syndicated
line of credit contain covenants, particularly relating to certain
consolidated fi nancial ratios, which were all complied with as of
December 31, 2007.
As of year-end 2007, 81.2% of the Company’s debt was at fl oating
rates. This debt is hedged through interest rate options as described
in Note 20-A.
Maturities of other debt are as follows:
(in € thousands) Dec. 31, 2007
Maturing in 2007
Maturing in 2008 511,124
Maturing in 2009 800,027
Maturing in 2010 300,147
Maturing in 2011 86
Maturing in 2012 and beyond 73
TOTAL 1,611,457
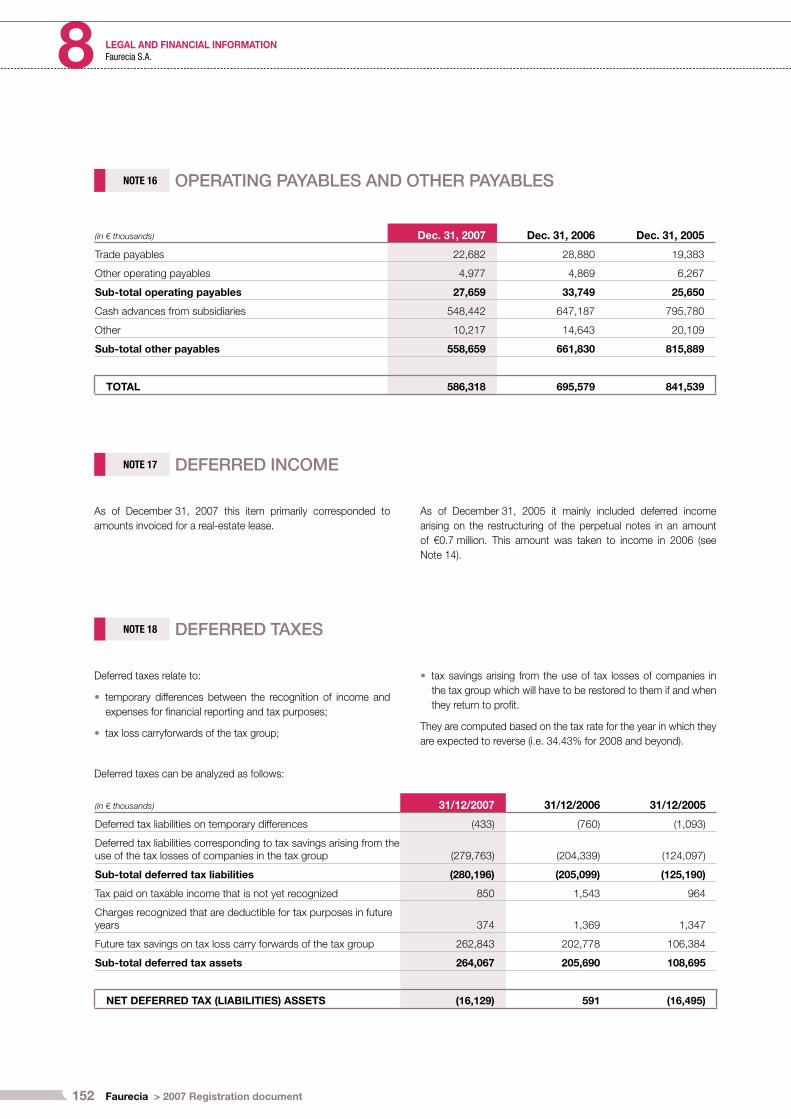
152 Faurecia > 2007 Registration document
LEGAL AND FINANCIAL INFORMATION8 Faurecia S.A.
NOTE 16 OPERATING PAYABLES AND OTHER PAYABLES
NOTE 17 DEFERRED INCOME
NOTE 18 DEFERRED TAXES
Deferred taxes relate to:
temporary differences between the recognition of income and
expenses for fi nancial reporting and tax purposes;
tax loss carryforwards of the tax group;
•
•
tax savings arising from the use of tax losses of companies in
the tax group which will have to be restored to them if and when
they return to profi t.
They are computed based on the tax rate for the year in which they
are expected to reverse (i.e. 34.43% for 2008 and beyond).
•
Deferred taxes can be analyzed as follows:
(in € thousands) 31/12/2007 31/12/2006 31/12/2005
Deferred tax liabilities on temporary differences (433) (760) (1,093)
Deferred tax liabilities corresponding to tax savings arising from the use of the tax losses of companies in the tax group (279,763) (204,339) (124,097)
Sub-total deferred tax liabilities (280,196) (205,099) (125,190)
Tax paid on taxable income that is not yet recognized 850 1,543 964
Charges recognized that are deductible for tax purposes in future years 374 1,369 1,347
Future tax savings on tax loss carry forwards of the tax group 262,843 202,778 106,384
Sub-total deferred tax assets 264,067 205,690 108,695
NET DEFERRED TAX (LIABILITIES) ASSETS (16,129) 591 (16,495)
(in € thousands) Dec. 31, 2007 Dec. 31, 2006 Dec. 31, 2005
Trade payables 22,682 28,880 19,383
Other operating payables 4,977 4,869 6,267
Sub-total operating payables 27,659 33,749 25,650
Cash advances from subsidiaries 548,442 647,187 795,780
Other 10,217 14,643 20,109
Sub-total other payables 558,659 661,830 815,889
TOTAL 586,318 695,579 841,539
As of December 31, 2007 this item primarily corresponded to
amounts invoiced for a real-estate lease.
As of December 31, 2005 it mainly included deferred income
arising on the restructuring of the perpetual notes in an amount
of €0.7 million. This amount was taken to income in 2006 (see
Note 14).
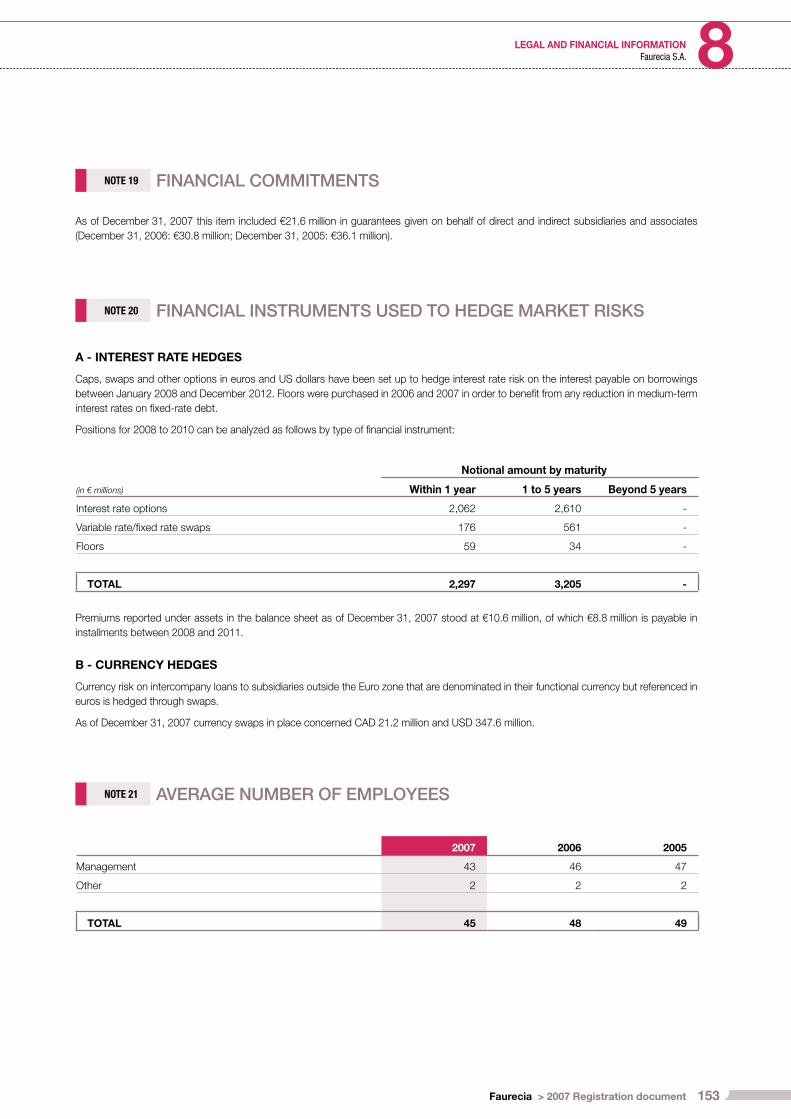
153Faurecia > 2007 Registration document
LEGAL AND FINANCIAL INFORMATION 8Faurecia S.A.
NOTE 19 FINANCIAL COMMITMENTS
As of December 31, 2007 this item included €21.6 million in guarantees given on behalf of direct and indirect subsidiaries and associates
(December 31, 2006: €30.8 million; December 31, 2005: €36.1 million).
NOTE 20 FINANCIAL INSTRUMENTS USED TO HEDGE MARKET RISKS
A - INTEREST RATE HEDGES
Caps, swaps and other options in euros and US dollars have been set up to hedge interest rate risk on the interest payable on borrowings
between January 2008 and December 2012. Floors were purchased in 2006 and 2007 in order to benefi t from any reduction in medium-term
interest rates on fi xed-rate debt.
Positions for 2008 to 2010 can be analyzed as follows by type of fi nancial instrument:
(in € millions)
Notional amount by maturity
Within 1 year 1 to 5 years Beyond 5 years
Interest rate options 2,062 2,610 -
Variable rate/fi xed rate swaps 176 561 -
Floors 59 34 -
TOTAL 2,297 3,205 -
Premiums reported under assets in the balance sheet as of December 31, 2007 stood at €10.6 million, of which €8.8 million is payable in
installments between 2008 and 2011.
B - CURRENCY HEDGES
Currency risk on intercompany loans to subsidiaries outside the Euro zone that are denominated in their functional currency but referenced in
euros is hedged through swaps.
As of December 31, 2007 currency swaps in place concerned CAD 21.2 million and USD 347.6 million.
NOTE 21 AVERAGE NUMBER OF EMPLOYEES
2007 2006 2005
Management 43 46 47
Other 2 2 2
TOTAL 45 48 49
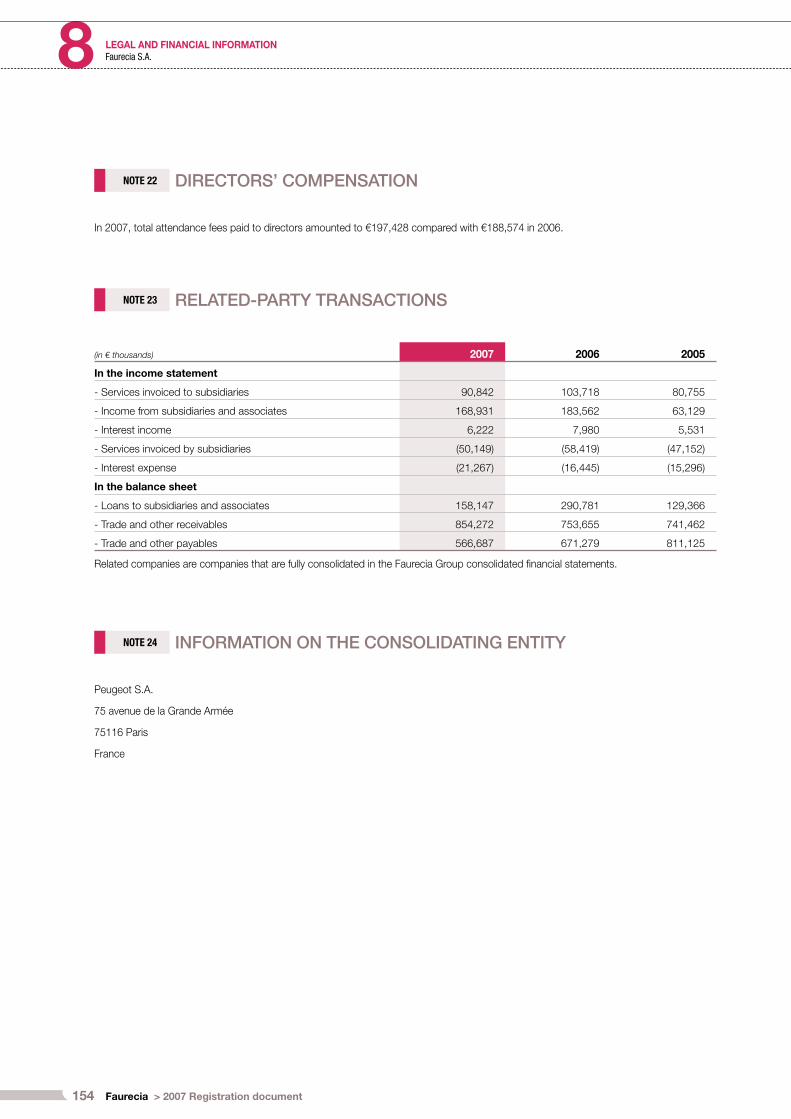
154 Faurecia > 2007 Registration document
LEGAL AND FINANCIAL INFORMATION8 Faurecia S.A.
NOTE 22 DIRECTORS’ COMPENSATION
In 2007, total attendance fees paid to directors amounted to €197,428 compared with €188,574 in 2006.
NOTE 23 RELATED-PARTY TRANSACTIONS
(in € thousands) 2007 2006 2005
In the income statement
- Services invoiced to subsidiaries 90,842 103,718 80,755
- Income from subsidiaries and associates 168,931 183,562 63,129
- Interest income 6,222 7,980 5,531
- Services invoiced by subsidiaries (50,149) (58,419) (47,152)
- Interest expense (21,267) (16,445) (15,296)
In the balance sheet
- Loans to subsidiaries and associates 158,147 290,781 129,366
- Trade and other receivables 854,272 753,655 741,462
- Trade and other payables 566,687 671,279 811,125
Related companies are companies that are fully consolidated in the Faurecia Group consolidated fi nancial statements.
NOTE 24 INFORMATION ON THE CONSOLIDATING ENTITY
Peugeot S.A.
75 avenue de la Grande Armée
75116 Paris
France
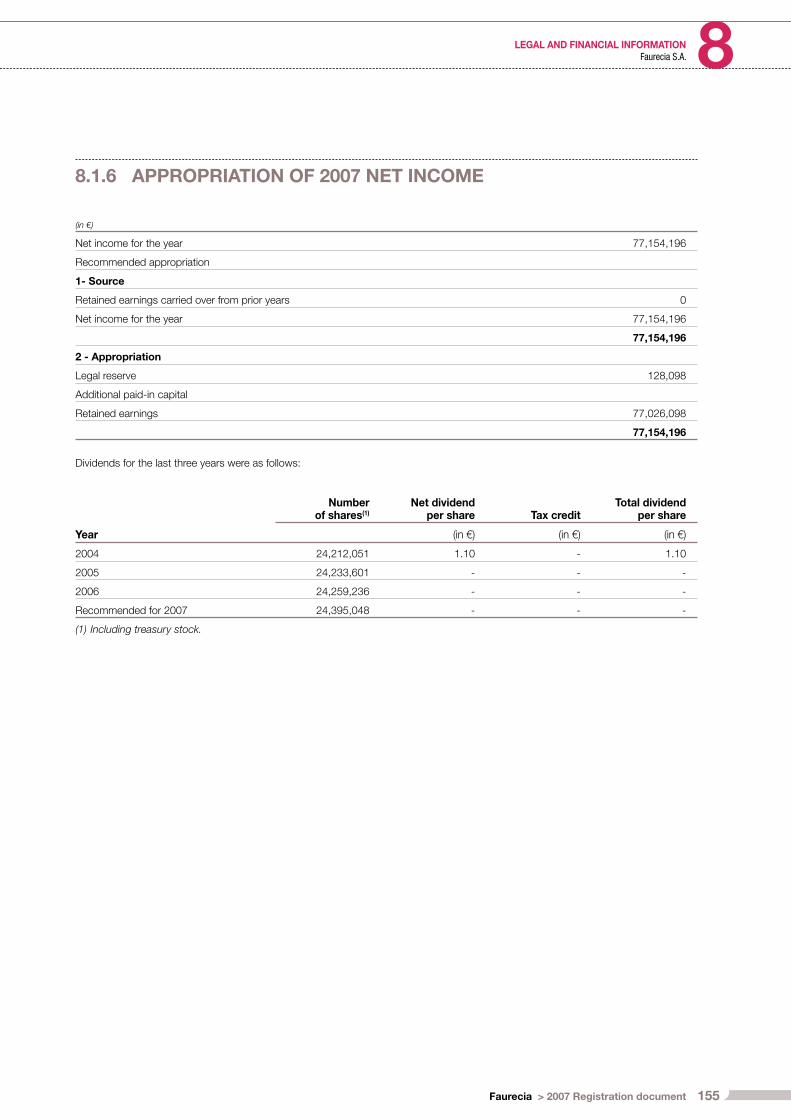
155Faurecia > 2007 Registration document
LEGAL AND FINANCIAL INFORMATION 8Faurecia S.A.
8.1.6 APPROPRIATION OF 2007 NET INCOME
(in €)
Net income for the year 77,154,196
Recommended appropriation
1- Source
Retained earnings carried over from prior years 0
Net income for the year 77,154,196
77,154,196
2 - Appropriation
Legal reserve 128,098
Additional paid-in capital
Retained earnings 77,026,098
77,154,196
Dividends for the last three years were as follows:
Number of shares(1)
Net dividend per share Tax credit
Total dividend per share
Year (in €) (in €) (in €)
2004 24,212,051 1.10 - 1.10
2005 24,233,601 - - -
2006 24,259,236 - - -
Recommended for 2007 24,395,048 - - -
(1) Including treasury stock.
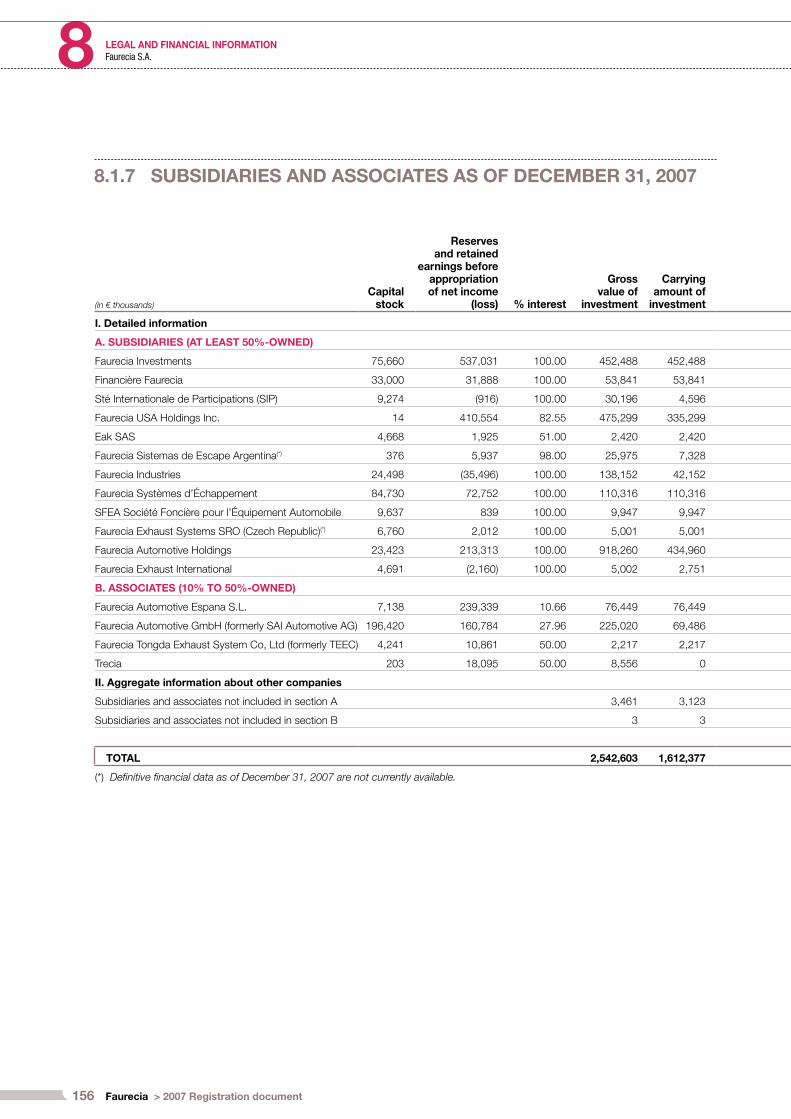
156 Faurecia > 2007 Registration document
LEGAL AND FINANCIAL INFORMATION8 Faurecia S.A.
(in € thousands)
Capital stock
Reserves and retained
earnings before appropriation of net income
(loss) % interest
Gross value of
investment
Carrying amount of
investment
I. Detailed information
A. SUBSIDIARIES (AT LEAST 50%-OWNED)
Faurecia Investments 75,660 537,031 100.00 452,488 452,488
Financière Faurecia 33,000 31,888 100.00 53,841 53,841
Sté Internationale de Participations (SIP) 9,274 (916) 100.00 30,196 4,596
Faurecia USA Holdings Inc. 14 410,554 82.55 475,299 335,299
Eak SAS 4,668 1,925 51.00 2,420 2,420
Faurecia Sistemas de Escape Argentina(*) 376 5,937 98.00 25,975 7,328
Faurecia Industries 24,498 (35,496) 100.00 138,152 42,152
Faurecia Systèmes d’Échappement 84,730 72,752 100.00 110,316 110,316
SFEA Société Foncière pour l’Équipement Automobile 9,637 839 100.00 9,947 9,947
Faurecia Exhaust Systems SRO (Czech Republic)(*) 6,760 2,012 100.00 5,001 5,001
Faurecia Automotive Holdings 23,423 213,313 100.00 918,260 434,960
Faurecia Exhaust International 4,691 (2,160) 100.00 5,002 2,751
B. ASSOCIATES (10% TO 50%-OWNED)
Faurecia Automotive Espana S.L. 7,138 239,339 10.66 76,449 76,449
Faurecia Automotive GmbH (formerly SAI Automotive AG) 196,420 160,784 27.96 225,020 69,486
Faurecia Tongda Exhaust System Co, Ltd (formerly TEEC) 4,241 10,861 50.00 2,217 2,217
Trecia 203 18,095 50.00 8,556 0
II. Aggregate information about other companies
Subsidiaries and associates not included in section A 3,461 3,123
Subsidiaries and associates not included in section B 3 3
TOTAL 2,542,603 1,612,377
(*) Definitive financial data as of December 31, 2007 are not currently available.
8.1.7 SUBSIDIARIES AND ASSOCIATES AS OF DECEMBER 31, 2007
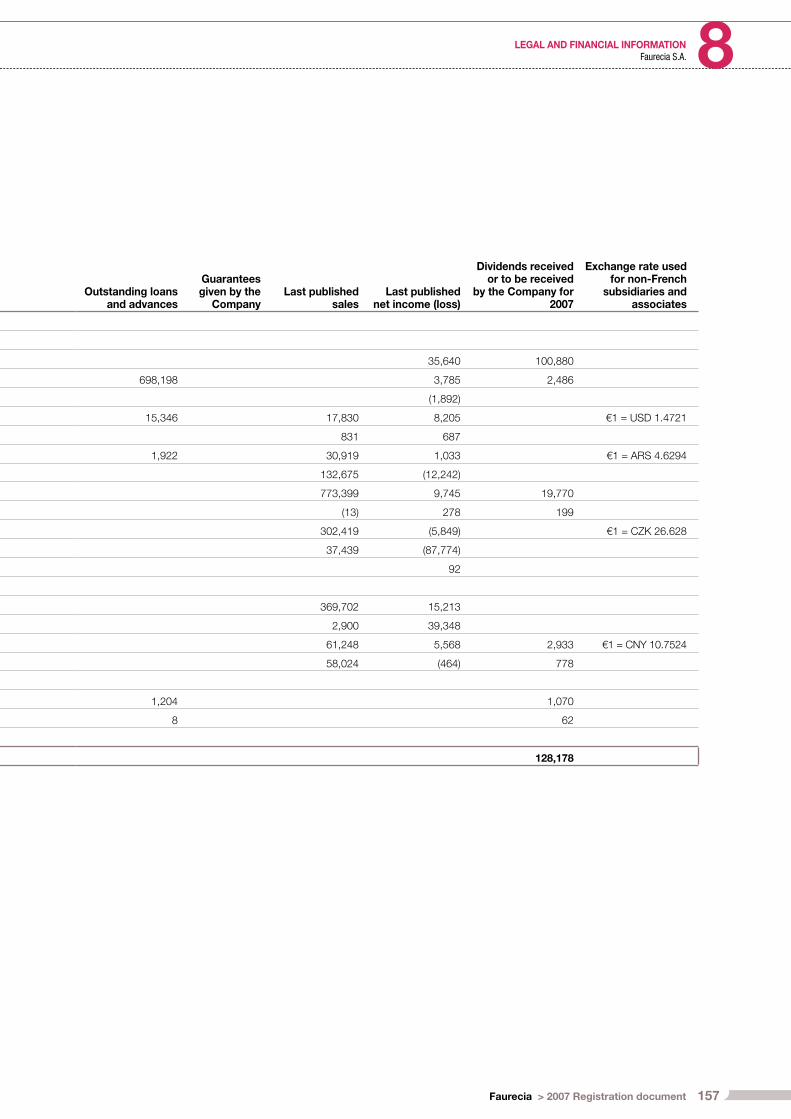
157Faurecia > 2007 Registration document
LEGAL AND FINANCIAL INFORMATION 8Faurecia S.A.
Outstanding loans and advances
Guarantees given by the
CompanyLast published
salesLast published
net income (loss)
Dividends received or to be received
by the Company for 2007
Exchange rate used for non-French
subsidiaries and associates
35,640 100,880
698,198 3,785 2,486
(1,892)
15,346 17,830 8,205 €1 = USD 1.4721
831 687
1,922 30,919 1,033 €1 = ARS 4.6294
132,675 (12,242)
773,399 9,745 19,770
(13) 278 199
302,419 (5,849) €1 = CZK 26.628
37,439 (87,774)
92
369,702 15,213
2,900 39,348
61,248 5,568 2,933 €1 = CNY 10.7524
58,024 (464) 778
1,204 1,070
8 62
128,178
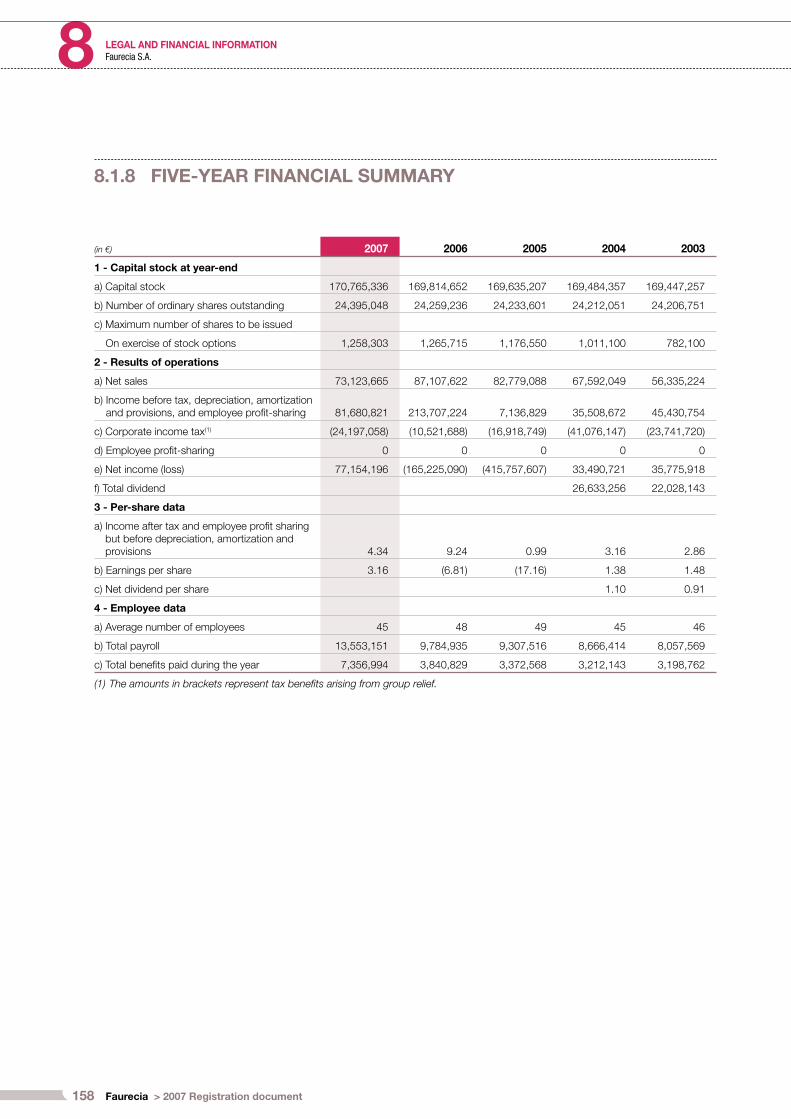
158 Faurecia > 2007 Registration document
LEGAL AND FINANCIAL INFORMATION8 Faurecia S.A.
8.1.8 FIVE-YEAR FINANCIAL SUMMARY
(in €) 2007 2006 2005 2004 2003
1 - Capital stock at year-end
a) Capital stock 170,765,336 169,814,652 169,635,207 169,484,357 169,447,257
b) Number of ordinary shares outstanding 24,395,048 24,259,236 24,233,601 24,212,051 24,206,751
c) Maximum number of shares to be issued
On exercise of stock options 1,258,303 1,265,715 1,176,550 1,011,100 782,100
2 - Results of operations
a) Net sales 73,123,665 87,107,622 82,779,088 67,592,049 56,335,224
b) Income before tax, depreciation, amortization and provisions, and employee profi t-sharing 81,680,821 213,707,224 7,136,829 35,508,672 45,430,754
c) Corporate income tax(1) (24,197,058) (10,521,688) (16,918,749) (41,076,147) (23,741,720)
d) Employee profi t-sharing 0 0 0 0 0
e) Net income (loss) 77,154,196 (165,225,090) (415,757,607) 33,490,721 35,775,918
f) Total dividend 26,633,256 22,028,143
3 - Per-share data
a) Income after tax and employee profi t sharing but before depreciation, amortization and provisions 4.34 9.24 0.99 3.16 2.86
b) Earnings per share 3.16 (6.81) (17.16) 1.38 1.48
c) Net dividend per share 1.10 0.91
4 - Employee data
a) Average number of employees 45 48 49 45 46
b) Total payroll 13,553,151 9,784,935 9,307,516 8,666,414 8,057,569
c) Total benefi ts paid during the year 7,356,994 3,840,829 3,372,568 3,212,143 3,198,762
(1) The amounts in brackets represent tax benefits arising from group relief.

159Faurecia > 2007 Registration document
LEGAL AND FINANCIAL INFORMATION 8Faurecia S.A.
8.1.9 SECURITIES PORTFOLIO AS OF DECEMBER 31, 2007
(in € thousands) Number Type and par valueCarrying amount
1. Main securities
a) Investments in subsidiaries and associates
Faurecia Systèmes d’Echappement 5,648,700 Shares – €15 110,316
Faurecia Investments 5,043,997 Shares – €15 452,488
Faurecia Industries 2,899,200 Shares – €8.45 42,152
Faurecia USA Holdings Inc. 3,600 Shares – USD 0.001 335,299
Sté Internationale de Participations (SIP) 1,168,999 Shares 4,596
Faurecia Automotive Espana S.L. 126,859 Shares – €6 76,449
SFEA Société Foncière pour l’Équipement Automobile 642,499 Shares – €15 9,947
Financière Faurecia 2,200,000 Shares – €15 53,841
Trécia 6,762 Shares – €15 0
Faurecia Exhaust Systems sro. 1 Shares 5,002
Faurecia Magyarorszag Kipufogo-Rendszer Kft 24,900,000 Shares – HUF 1 0
Faurecia Systemy Kierownicze SpZoo 100 Shares – PLN 500 13
Faurecia Sistemas de Escape Argentina SA 1,802,379 Shares – Peso 1 7,328
EAK - Composants pour l’Industrie Automobile SAS 158,722 Shares – €15 2,420
Faurecia Tongda Exhaust System (Wuhan) Co Ltd 1 Shares 2,217
Faurecia Exhaust Systems South Africa Ltd 100 Shares – Rand 1 1,073
Ecia South Africa Ltd 10 Shares – Rand 1 0
EAK - Composants pour l’Industrie Automobile SNC 51,510 Shares – €15 785
Faurecia Honghu Exhaust Systems Shanghai Co Ltd 1 Shares 1,012
Faurecia Automotive Holdings 23,422,554 Shares – €1 434,960
Faurecia Automotive GmbH (formerly SAI Automotive AG) 1 Shares 69,486
Faurecia Services Groupe 2,500 Shares – €16 1
Faurecia Exhaust International 312,750 Shares – €15 2,751
Faurecia Global Purchasing 1 1 share of €1,000 1
Faurecia Sistemas de Escape Portugal Lda 1 Shares 1
Flamant jaune 2,500 Shares – €16 40
Flamant bleu 2,500 Shares – €16 40
Toucan participations SA 2,494 Shares – €16 40
Toucan investissements SA 2,494 Shares – €16 40
Blériot Investissements 2,500 Shares – €16 40
Faurecia Slovakia Sro 1 Shares 1
Faurecia Leather Kosice Sro 1 Shares 1
Goeland Vert SAS 2,315 Shares – €16 37
Sub-total 1,612,377
2. Marketable securities
Faurecia 270,814 Shares – €7 11,504
TOTAL 1,623,881

160 Faurecia > 2007 Registration document
LEGAL AND FINANCIAL INFORMATION8 Faurecia S.A.
8.1.10 STATUTORY AUDITORS’ REPORTS
Statutory Auditors’ report on the annual fi nancial statements for the year ended December 31, 2007
This is a free translation into English of the statutory Auditors’ report issued in the French language and is provided solely for the convenience
of English speaking readers. The Statutory Auditors’ report includes information specifi cally required by French law in all audit reports, whether
qualifi ed or not, and this is presented below the opinion on the annual fi nancial statement. This information includes an explanatory paragraph
discussing the Auditors’ assessments of certain signifi cant accounting and auditing matters. These assessments were considered for the
purpose of issuing an audit opinion on the annual fi nancial statements taken as a whole and not to provide separate assurance on individual
account captions or on information taken outside of the annual fi nancial statements.
This report should be read in conjunction with, and construed in accordance with, French law and professional auditing standards applicable
in France.
To the Shareholders,
In compliance with the assignment entrusted to us by the Annual Shareholders’ Meeting, we hereby report to you, for the year ended
December 31, 2007 on:
the audit of the accompanying annual fi nancial statements of Faurecia S.A.;
the justifi cation of our assessments;
the specifi c verifi cations and information required by law.
These annual fi nancial statements have been approved by the Board of Directors. Our role is to express an opinion on these annual fi nancial
statements based on our audit.
I - Opinion on the annual fi nancial statements
We conducted our audit in accordance with professional standards applicable in France. Those standards require that we plan and perform
the audit to obtain reasonable assurance about whether the annual fi nancial statements are free of material misstatement. An audit includes
examining, on a test basis, evidence supporting the amounts and disclosures in the annual fi nancial statements. An audit also includes
assessing the accounting principles used and signifi cant estimates made by management, as well as evaluating the overall presentation of the
annual fi nancial statements. We believe that our audit provides a reasonable basis for our opinion.
In our opinion, the annual fi nancial statements give a true and fair view of the Company’s fi nancial position and its assets and liabilities as
of December 31, 2007, and of the results of its operations for the year then ended, in accordance with the accounting rules and principles
applicable in France.
II - Justifi cation of our assessments
In accordance with the requirements of article 823-9 of the French Commercial Code (Code de commerce) relating to the justifi cation of our
assessments, we bring to your attention the following matter:
Note 1.2 to the annual fi nancial statements presents the rules and methods applied to investments. A provision for impairment is set aside
if the fair value of an investment falls below its gross value, corresponding to its value on initial recognition. Fair value is based on the
subsidiary’s revalued net assets, profi tability and future outlook. As part of our assessment of the accounting principles and methods, we
verifi ed the appropriateness of the above-mentioned accounting methods, ensured that they were correctly applied and that reasonable
estimates were used.
These assessments were made in the context of our audit of the annual fi nancial statements, taken as a whole, and therefore contributed to
the formation of the opinion expressed in the fi rst part of this report.
III - Specifi c verifi cations and information
We have also performed the specifi c verifi cations required by law, in accordance with professional standards applicable in France.
We have no matters to report as to:
the fair presentation and the conformity with the annual fi nancial statements of the information given in the Director’s report of the Board of
Directors and in the documents addressed to the shareholders with respect to the fi nancial position and the annual fi nancial statements;
the fair presentation of the information given in the Director’s report regarding the remuneration and benefi ts granted to corporate offi cers
and any other commitments made in their favor in connection with, or subsequent to, their appointment, termination or change in function.
We draw your attention to the reasons presented in the Director’s report explaining that your company does not provide any information
relating to remuneration and benefi ts granted by the controlling entity to corporate offi cers of your company who are not also corporate
offi cers of the controlling entity.
As required by law, we have also verifi ed that names of the principal shareholders and holders of voting rights are disclosed in the
Director’s r eport.
Neuilly-sur-Seine and Paris-La Défense, April 9, 2008
The Statutory Auditors
PricewaterhouseCoopers Audit Ernst & Young Audit
Dominique Ménard Laurent Miannay
•
•
•
•
•
•
161Faurecia > 2007 Registration document
LEGAL AND FINANCIAL INFORMATION 8Faurecia S.A.
Statutory Auditors’ special report on regulated agreements and commitments with third parties
This is a free translation into English of the Statutory Auditors’ special report on regulated agreements and commitments issued in the French language and is provided solely for the convenience of English speaking readers. This report should be read in conjunction with, and construed in accordance with, French law and professional auditing standards applicable in France.
To the shareholders,
In our capacity as Statutory Auditors of Faurecia S.A., we hereby present our report on regulated agreements and commitments with third parties.
Agreements and commitments authorized in 2007
In accordance with Article L. 225-40 of the French Commercial Code (Code de Commerce), we have been advised of the following agreements and commitments which were authorized in advance by the Board of Directors.
Our responsibility does not include identifying any undisclosed agreements or commitments. We are required to report to shareholders, based on the information provided, on the main terms and conditions of the agreements and commitments that have been disclosed to us, without commenting on their relevance or substance. Under the provisions of Article R. 225-31 of the French Commercial Code, it is the responsibility of shareholders to determine whether the agreements or commitments are appropriate and should be approved.
We carried out our work in accordance with the professional standards applicable in France. Those standards require that we perform procedures to verify that the information given to us agrees with the underlying documents.
With Faurecia Automotive Industrie, Faurecia Industries, Faurecia Intérieur Industrie, Faurecia Sièges d’Automobile, Faurecia Sytèmes d’Echappement, Sielest, Siemar and Sotexo
In accordance with the authorization granted by the Board of Directors on July 17, 2007, on November 30, 2007 Faurecia and the above-mentioned subsidiaries (hereinafter referred to as the “Transferors”) renewed the securitization agreement signed on November 8, 2002 with Société Générale.
The main clauses of the agreement are identical to those in the original agreement, notably concerning the €300 million cap on the amount of receivables that may be sold.
Under this agreement, Faurecia: acts as the Transferors’ representative;receives payments from Société Générale for the sold receivables, and subsequently forwards these payments to the Transferors;pays fees to Société Générale on behalf of all the Transferors which it subsequently passes on to the Transferors under the cash pooling agreement signed between Faurecia and the subsidiaries concerned.
Agreements and commitments entered into in prior years which remained in force during the year
In accordance with the French Commercial Code we were informed of the following commitments and agreements entered into in prior years, which remained in force during the year.
1. With Faurecia USA Holdings Inc. and its subsidiaries
Faurecia USA Holdings Inc. benefi ted from a credit line of USD 491 million at December 31, 2006. At its meeting of December 21, 2006 the Board of Directors authorized the inclusion of a portion of this credit line in the capital of Faurecia USA Holdings Inc. based on the company’s interest, i.e. USD 247.6 million for a capital increase of USD 300 million.
The USD 300 million capital increase took place on January 31, 2007.
2. With Faurecia Autositze, Faurecia Abgastechnik, Faurecia Innenraum Systems GmbH, Asientos de Castilla Leon, Asientos del Norte, Faurecia Sistemas de Escape España, Faurecia Automotive España and Faurecia Interior Systems España
In accordance with the loan agreement entered into with the above-mentioned companies on December 10, 2002, said companies provided Faurecia S.A. with a credit line totaling a maximum amount of €315 million.
This agreement expired on May 14, 2007.
3. With Faurecia Automotive Industrie, Faurecia Industries, Faurecia Intérieur Industrie, Faurecia Sièges d’Automobile, Faurecia Sytèmes d’Echappement, Sielest, Siemar and Sotexo
In accordance with the loan agreement entered into with the above-mentioned companies on November 8, 2000, said companies provided Faurecia S.A. with a credit line totaling a maximum amount of €300 million.
As of December 31, 2007 the amount outstanding under this agreement totaled €282 million.
4. With Faurecia Sièges d’Automobile
The Company has given a guarantee to Agence de l’Eau Loire-Bretagne covering a loan for an initial amount of €237,820 made to Faurecia Sièges d’Automobile.
As of December 31, 2007, the outstanding balance due from Faurecia Sièges d’Automobile was €14,363.
Neuilly-sur-Seine and Paris-La Défense, April 9, 2008
The Statutory Auditors
PricewaterhouseCoopers Audit Ernst & Young Audit
Dominique Ménard Laurent Miannay
•••

162 Faurecia > 2007 Registration document
LEGAL AND FINANCIAL INFORMATION8 Internal control
8.2.1 REPORT BY THE CHAIRMAN OF THE BOARD OF DIRECTORS
ON INTERNAL CONTROL DRAWN UP IN ACCORDANCE WITH
ARTICLE L. 225-37 OF THE FRENCH COMMERCIAL CODE
To the shareholders
Pursuant to Article L. 225-37 (6) and (7) of the French Commercial
Code, the Chairman of the Board of Directors is required to present
an additional report, appended to the management report, to
describe the way in which the work of the Board is prepared and
organized, as well as the internal control procedures implemented
within the Company. This report must also indicate any restrictions
imposed by the Board of Directors on the powers of the Chief
Executive Offi cer and set out the principles and rules adopted by
the Board of Directors to determine the compensation and any and
all benefi ts granted to corporate offi cers.
This report was drawn up based on the work carried out within
the Group under the supervision of a Steering Committee set up
in October 2007 whose members comprise the Head of Audit, the
Head of Group Accounting, and the Head of Legal Affairs. It was
prepared under the responsibility of the Chairman of the Board
of Directors in accordance with Article L. 225-37 of the French
Commercial Code, based on information provided by senior
management. The Chairman of the Board is responsible for internal
control systems and procedures put in place in the Company,
and for all the disclosures required by law in the report on internal
control.
A presentation of the report was provided to the Board of Directors
at its meeting of February 8, 2008.
This report is partially based on the recommendations of the French
securities regulator (Autorité des Marchés Financiers) concerning
internal control systems set out in its Reference Framework
document issued on January 22, 2007 and includes a number
of summarized responses to the questionnaire on accounting
and fi nancial internal control systems attached to the Reference
Framework.
1. Preparing and organizing the work of the Board of Directors
A - MEMBERSHIP AND ROLE OF THE BOARD OF
DIRECTORS
a. Membership of the Board of Directors
The Board of Directors consists of eleven members, fi ve of whom
are considered to be independent (compared with four in 2006),
based on the defi nition in the report published by the AFEP-MEDEF
working group aimed at improving corporate governance in French
listed companies. These independent Directors are Jean-Pierre
Clamadieu, Frank Esser, Jean-Louis Gérondeau, Gérard Hauser
and Ross Mc Innes. Five Directors directly represent the interests
of the majority shareholder. Yann Delabrière has been Faurecia’s
Chairman and Chief Executive Offi cer since February 16, 2007. The
Board considers that its membership structure adequately refl ects
the interest in the Company held by Peugeot SA, its majority
shareholder.
Members of the Board of Directors are chosen on account of their
expertise in the Company’s key business areas, as well as for
their autonomy and determination to consider the interests of all
shareholders. The independent Directors enrich Board discussions
and work thanks to their diverse experience, from an international,
industrial and managerial perspective.
Apart from the Chairman and Chief Executive Offi cer, no member of
the Board of Directors holds an executive management or salaried
position within a Group company.
Details of the directorships and other positions held by all of
Faurecia’s Directors are in this registration document.
b. Role of the Board of Directors
The Board of Directors determines overall business, fi nancial and
economic strategies for the Company and the Group and oversees
their implementation. Subject to the powers expressly granted
to Shareholders’ Meetings and within the limit of the Company’s
purpose, at the Chairman’s initiative the Board deals with all matters
concerning the Company’s affairs and decides on matters involving
the Company, notably in relation to all strategic decisions for the
Company and the Group.
B - ORGANIZATION OF THE BOARD
OF DIRECTORS
The internal rules of the Board of Directors, which may be consulted
by shareholders at the Company’s headquarters, are aimed
at organizing the work of the Board and ensuring that Directors
receive all requisite information. They describe the Board’s modus
operandi and its role in the management of the Company and the
Group as carried out in accordance with the law and the Company’s
bylaws. They also specify the rights and responsibilities of Board
members, particularly regarding the prevention of confl icts of
interest, the holding of multiple directorships and the need for strict

163Faurecia > 2007 Registration document
LEGAL AND FINANCIAL INFORMATION 8Internal control
confi dentiality as well as diligence in taking part in the Board’s work.
In addition they set out rules governing transactions involving the
Company’s shares, as recommended by the Autorité des Marchés
Financiers.
The Board of Directors is free to decide how the general
management of the Company is carried out. These duties may
either be performed by the Chairman of the Board or by another
person appointed by the Board of Directors who holds the position
of Chief Executive Offi cer. Since the Board meeting of September 8,
2006, the position of Chief Executive Offi cer has been held by the
Chairman of the Board. The Board of Directors confi rmed this
management method at its meeting of February 16, 2007 when
Yann Delabrière was appointed Chairman and Chief Executive
Offi cer to replace Grégoire Olivier.
In 2003, the Board of Directors set up an Audit Committee and an
Appointments and Compensation Committee.
Appointments and Compensation Committee
The main role of this Committee is to provide the Board of Directors
with preparatory information for their decisions on:
the appointment of future Directors, notably determining the
criteria for selecting candidates, preparing the selection process
and recommending elections or re-elections of Directors;
compensation payable to corporate offi cers, including particularly
the Chairman; and
stock option grants.
The Committee met fi ve times in 2007. At its meeting of February 2,
2007, the Board of Directors appointed Christian Streiff as a
member of the Appointments and Compensation Committee and
named Jean-Claude Hanus as Committee Chairman. At its meeting
of May 29, 2007, the Board of Directors appointed Jean-Pierre
Clamadieu as a member of the Appointments and Compensation
Committee and confi rmed the appointments of Christian Streiff,
Jean-Claude Hanus and Gérard Hauser.
Audit Committee
The role of this Committee is to perform a detailed review of the
drafting of the interim and annual fi nancial statements, as well as
of the Group’s major fi nancial transactions. It also examines the
Group’s fi nancial reporting schedules and monitors off-balance
sheet commitments and factors that enable the Group’s risks to be
assessed. It is responsible for preparing the Board Meetings held to
review the interim and annual fi nancial statements and for providing
information to the other Board members on these subjects. For
that purpose, it examines the fi nancial statements before they are
submitted to the Board and issues an opinion on:
the application and relevance of the accounting principles and
methods used (as well as reviewing material risks);
the appointment, fees and audit program of the Statutory
Auditors and issues relating to their independence.
•
•
•
•
•
In addition, the Committee ensures (i) that senior management and
the Statutory Auditors formally approve accounting policies with a
signifi cant impact on the presentation of the fi nancial statements;
(ii) that these accounting policies are presented to the Board of
Directors; (iii) that senior management explains and substantiates
to the Board the main accounting options that are selected; (iv)
that the Statutory Auditors review these options; and (v) that the
Statutory Auditors have access to all the information they require
for performing their duties and are given the means to relay any
signifi cant observations.
The Committee met four times in 2007. On May 29, 2007 the
Board of Directors appointed Christian Streiff as Chairman of the
Audit Committee. It also appointed Ross Mc Innes as a Committee
member and confi rmed the appointment of Jean-Louis Gérondeau.
On October 8, 2007 the Board of Directors appointed Isabel Marey-
Semper as a member of the Audit Committee.
C - OPERATION OF THE BOARD OF DIRECTORS
The Board met seven times during 2007, principally to review
the Group’s budget, business activities and results, as well as its
fi nancing and major business strategies. During these meetings
the Board reviewed information prepared by the Audit Committee
and the Appointments and Compensation Committee, including
the interim and annual fi nancial statements, sales and earnings
forecasts, the appointment of a new Chairman and Chief Executive
Offi cer and his powers and compensation, the restructuring of
the Board of Directors, Audit Committee and Appointments and
Compensation Committee, and a stock option plan for directors
and senior managers of the Group. One meeting was devoted to
the Group’s medium-term outlook and strategic direction.
The attendance rate of Directors at Board Meetings in 2007 was
91%. All members of the Board Committees attended every
Committee meeting.
D - EVALUATION OF THE BOARD OF DIRECTORS
Several years ago, following a review by the Appointments and
Compensation Committee, the Board implemented a procedure
for the evaluation of its work, using a detailed questionnaire to
obtain feedback from each Director on how the Board operates
and on whether (i) they have access to all the information required
for performing their duties, and (ii) they felt that they were able
to relay any signifi cant observations. Directors’ responses to the
questionnaire and their related suggestions are analyzed by the
Chairman of the Appointments and Compensation Committee,
who reports to the Board on his fi ndings.
164 Faurecia > 2007 Registration document
LEGAL AND FINANCIAL INFORMATION8 Internal control
E - PROCEDURE FOR COMPENSATING
CORPORATE OFFICERS
Details relating to compensation and benefi ts paid to corporate
offi cers as well as the methods used to determine these amounts
are provided in the management report.
2. Internal control procedures
A - INTERNAL CONTROL: DEFINITION AND AIMS
Internal control is defi ned within the Faurecia Group as a
process designed to provide reasonable assurance regarding
the identifi cation, control and prevention of risks regarding the
achievement of the following aims:
the application of instructions and guidelines set by senior
management;
the effective implementation and optimization of operations;
availability, reliability and integrity of the accounting system and
fi nancial and operations-related information;
legal and regulatory compliance;
balancing risks with objectives and expected benefi ts;
protecting the Group’s property and safeguarding its assets;
adapting the organization to changes in standards, particularly
environmental standards;
controlling the risks that the Group may generate for its staff,
customers, suppliers, shareholders and all of its business and
community partners.
Internal control helps Faurecia to attain its strategic objectives, by
protecting it as far as possible against the risks and contingencies
related to its business.
However, like any other control system, it cannot provide an
absolute guarantee that all risks have been eliminated.
B - GENERAL ORGANIZATION AND
DESCRIPTION OF INTERNAL CONTROL
PROCEDURES
Participants and the organization of internal control
procedures
Internal control is more than just a set of standards and procedures.
It is designed to involve everyone throughout the entire Faurecia
Group and therefore includes fully-consolidated subsidiaries. It is
applied not only by the Group’s Executive and Supervisory bodies
(including the Audit Committee, Risk Committee and Internal Audit
department), but also by each and every Group employee in his or
her daily work.
•
•
•
•
•
•
•
•
The main participants in the internal control system:
the Board of Directors, which is responsible for determining
the major strategies for the Group’s business activities and
overseeing their implementation;
the Audit Committee, described earlier in this report, whose
responsibilities are set by the Board of Directors and which
plays a vital role in the performance of internal control and the
monitoring of existing procedures;
the Group Executive Committee, which orchestrates the Group’s
business strategy, allocates the resources required to implement
this strategy, sets the objectives for all Group entities and verifi es
that these objectives are met;
the Risk Committee, created in 2004, which meets twice a year
before the accounts closing date. Meetings are attended by the
Group Chairman, the Chief Financial Offi cer and the Head of
the Internal Audit department. The Committee may request the
assistance of any internal experts who have specialist knowledge
of the matters examined by the Committee. The Risk Committee
evaluates specifi c program-related risks;
the Financing and Treasury department, the Financial Control
department, the Quality Assurance department, the Legal Affairs
department and the Country Financial departments, which play
a specifi c role in the internal control process on account of their
cross-functional skills;
the Internal Audit department – described in more detail
below – which (i) reviews the internal control system and any
changes to the related processes; (ii) ensures that the Group’s
procedures comply with the applicable legislation and market
recommendations; (iii) verifi es that the system as a whole is
complete, consistent and relevant; (iv) sets up and monitors
tests and checks; (v) ensures that the action plans are properly
implemented; and (vi) reports on the system’s effectiveness.
The work of these internal departments is rounded out by the
actions of external parties, including:
the Group’s Statutory Auditors, who perform an audit of the Group
every year within the scope of their statutory audit engagement
on the Group’s consolidated fi nancial statements and other audit
engagements regarding the fi nancial statements of Group entities.
In accordance with French company law, the fi nancial statements
of the Company and the Group are certifi ed by two audit fi rms
which undertake a joint review of the full accounts and the
procedures used for preparing them and also examine selected
Group internal control processes concerning the preparation of
accounting and fi nancial information. Backed by members of
their network in each of the Group’s host countries, these two
audit fi rms perform statutory or contractual audit engagements
for all of the Group’s fully consolidated companies;
third-party organizations which carry out the following certifi cation
processes for the whole Group over a three-year cycle:
environment (ISO 14001),
health and safety (OHSAS 18001),
quality (ISO/TS);
•
•
•
•
•
•
•
•
−
−
−
165Faurecia > 2007 Registration document
LEGAL AND FINANCIAL INFORMATION 8Internal control
engineers from fi re and property & damage insurance companies
which conduct a two-yearly audit at each of Faurecia’s sites with
the aim of:
assessing fi re risks and any potential impact on production
and customers;
assessing whether the prevention and protection measures in
place are adequate;
issuing recommendations on reducing risks.
Description of internal control procedures
The Group’s internal control system is underpinned by a set of
procedures that can be accessed by all employees via the Intranet.
These procedures form part of the Faurecia Excellence System
(FES) which defi nes the way in which the Group’s employees work
across the globe and structures the Group’s identity
The related FES Core Procedures (FCP) are organized around the
following six Group processes:
leadership, which sets a common framework for all Group entities
in relation to issues such as fi nancial control, setting objectives,
drawing up strategic plans, quality policies, communication and
health and safety;
development, which includes the applicable procedures for
defi ning the Group’s product offering, innovation strategy and
program control measures;
production, corresponding to the various production process
stages within the Group’s plants: preparing for the start-up of
new programs or units; planning and controlling the production
process; and managing fl ows;
customer communications, which details the process for building
up customer relations and ensuring customer satisfaction through
competitively priced high-quality products and services;
partnerships with suppliers, covering processes set up with the
Group’s suppliers with a view to building a sustainable relationship
based on excellence;
staff involvement, encompassing human resource policies.
These procedures are developed by each Group function while
respecting a common general framework, and apply to all Faurecia
entities throughout the world. They are regularly updated and
enhanced.
Program control measures are subject to specifi c procedures in
light of the Group’s core business of designing and manufacturing
parts, sub-assemblies and modules for the automotive industry.
Each contract signed with a customer represents a Program and
corresponds to a project which:
responds to a specifi c request from an automaker (“Request
for Quotation” or RFQ) for the supply of complex automotive
equipment;
•
−
−
−
•
•
•
•
•
•
−
meets set objectives concerning quality, cost and lead times;
meets the Group’s profi tability criteria.
The life of a Program can stretch to ten years, from the beginning
of the development phase (including the acquisition phase and
industrial production) to the end of series life (production).
Various control tools and procedures are used throughout the
life of a Program which is precisely structured into successive
stages through the Group’s Program Management System
(PMS). Each Program involves various milestones from the bid
processing stage to the end of product life. As part of this control
system, Program reviews are carried out once a month by the
Product Group concerned. Formal reports of these reviews are
required and a certain number of documents must be submitted,
including the Business Plan (see below). This process is designed
to identify Program risks on an ongoing basis, in order to draw up
and implement the necessary action plans.
Right from its inception – i.e. during the fi ling of the bid – each
Program is subject to a forward-looking fi nancial analysis in the
form of a Business Plan (BP). BPs are prepared in accordance
with a standard method developed and monitored by Group
Management. The BP is regularly updated as assumptions
change, and it contains all the information required to assess
a Program at every stage, right from preparing the quotation,
through contract negotiations and the development phase.
The Code of Ethics – introduced in 2004 and strengthened in 2007
– also forms an integral part of the FCPs. It defi nes the general
rules on ethical behavior applicable on a day-to-day basis to all of
Faurecia’s employees in their relations both inside and outside the
Group, as well as to the Group’s partners. The updated version
of the Code was presented to the European Works Council in
April 2007 and was subsequently discussed with employee
representatives within the Group’s various companies and host
countries. In addition to strengthening the measures already in
place, this Code introduces a whistle-blowing procedure enabling
employees to notify Faurecia, in confi dence, of any breaches of
the law or Group procedures. A reinforced warning procedure has
been set up relating to incidents involving serious risks for Faurecia
in the areas of accounting, fi nancial audit and anti-corruption
measures. An external organization is responsible for handling the
initial process triggered by the warning procedure and will alert
the Group Chairman and CEO if it deems it necessary, who can
then request the Group’s Internal Audit department to perform
the requisite investigations. The Code of Ethics has been widely
relayed throughout the Group – notably via Intranet – so that all
employees can access it and comply with it at all times and in all
circumstances. At the same time, it is aimed at developing a sense
of accountability and involvement among the Group’s staff.
−
−
166 Faurecia > 2007 Registration document
LEGAL AND FINANCIAL INFORMATION8 Internal control
C - INTERNAL CONTROL PROCEDURES
RELATING TO THE PREPARATION AND
PROCESSING OF ACCOUNTING AND
FINANCIAL INFORMATION
Principles applied to the preparation of fi nancial
statements
The Group’s Accounting and Tax Management department
prepares monthly consolidated fi nancial statements and, more
specifi cally, interim and annual fi nancial information that is issued
publicly. It ensures that local fi nancial managers prepare the
fi nancial statements of subsidiaries in accordance with applicable
regulations, defi nes the Group’s accounting policies under IFRS, and
verifi es that these policies are applied correctly by all subsidiaries. It
also prepares the fi nancial statements of Faurecia S.A.
The following principles are implemented across the Group
regarding the preparation of fi nancial statements:
ensuring that information on transactions is complete;
ensuring that transactions comply with the accounting principles
applicable to the Group;
periodically reviewing the value of assets.
The key to preparing fi nancial and accounting information is to
ensure consistency between fi nancial reporting tools and the
Group’s operating systems. The volume of information involved,
the quality and integrity required to process the information and
ever-tighter fi nancial reporting deadlines – enabling management
to respond quickly and to effi ciently control operations – require the
use of effective information systems. In 2007 the Group launched a
major systems upgrade program and in 2008 the upgraded system
will be test run at several pilot sites before gradually being rolled out
Group-wide.
The Group’s fi nancial statements are prepared using information
provided by each subsidiary and integrated into the Magnitude
reporting and consolidation system. The accounting data
submitted by each subsidiary are prepared in accordance with the
Group’s accounting policies, which since 2004 comply with IFRS
as adopted by the European Union. An IFRS accounting manual
is included in the Faurecia Core Procedures system, which can be
accessed via the Intranet.
Each subsidiary’s accounting information comprises income
statements prepared by nature and by function, as well as a
breakdown by business segment, an analysis of current and
deferred taxes, a balance sheet, cash fl ow statement, and statement
of commitments and contingent liabilities.
Intercompany accounts are reconciled using the ICS software.
The Financial and Accounting department also uses (i) short- and
medium-term forecasts to verify the value of cash-generating
units; (ii) actuarial reports to assess retirement and other employee
benefi t obligations; and (iii) fair-value measurements of derivatives
confi rmed by the Group’s banking counterparties.
In each subsidiary, the head of accounting and the fi nancial
controller have access to all the information they require in order
•
•
•
to draw up accurate fi nancial statements in compliance with local
GAAP for the statutory accounts and with the Group’s accounting
policies for reporting purposes.
At every interim and annual close the heads of all subsidiaries are
required to prepare an IFRS/local GAAP reconciliation for equity
and income and expenses.
Every month instructions are sent to the accountants and fi nancial
controllers specifying the closing procedures to be followed, such
as for estimating accrued expenses, and informing them of the
applicable deadlines. In addition, Magnitude training sessions are
regularly provided to newly recruited accounting and fi nancial staff.
The preparation of monthly reporting packages requires each
entity to ensure it has the appropriate resources to draw up quality
information.
Off-balance sheet commitments
Off-balance sheet commitments are handled in accordance with a
specifi c identifi cation and valuation process.
Each commitment is tracked by nature. Currency and interest-rate
risks, as well as inter-company fi nancing in foreign currencies, are
managed at Group level under the supervision of the Group Finance
department. Foreign currency hedges are set up where required.
Any sureties or guarantees granted by Faurecia are issued and
monitored at Group level.
Identifi cation and analysis of risks impacting
accounting and fi nancial information
The preparation of full monthly fi nancial statements greatly reduces
risks at interim and annual closes, particularly regarding meeting
fi nancial reporting deadlines. Any problems are anticipated,
intercompany accounts are reconciled every month, specifi c
transactions are accounted for without waiting for the yearly close,
and substantiating tax calculations is a regular exercise.
By preparing and reviewing monthly fi nancial statements and
reconciling them with the budget each entity can detect any
anomalies in the accounts, such as in relation to inventories or
cash fl ows. Implemented in tandem with specifi c procedures, this
process is intended to reduce the risk of errors and fraud.
Hard close procedure
A hard close is carried out at October 31 each year aimed at
anticipating, evaluating and validating the main accounting options
for the yearly close.
Accounting and fi nancial control tools
The Group has drawn up procedures for preparing and processing
fi nancial and accounting information. These procedures comply
with applicable accounting principles and standards and, like all the
other internal control procedures, are available on the Company’s
Intranet. The following fi gure among the most important Group
procedures:
a capital expenditure authorization procedure, aimed at
determining capital spending criteria and designating authorized
•
•
167Faurecia > 2007 Registration document
LEGAL AND FINANCIAL INFORMATION 8Internal control
signatories who can commit the Company for amounts up to
pre-defi ned thresholds;
an authorization procedure for capital increases, capital
injections, acquisitions of shareholdings and intercompany
loans;
a procedure for drafting Program Business Plans;
a procedure relating to the acquisition of new programs;
a procedure for consolidating the fi nancial statements.
Financial reporting processes
The Group’s fi nancial reporting processes are aimed at providing
systems for informing and steering the Group’s people and
ensuring maximum responsiveness to any risks that may arise. A
“reporting glossary” describes the content of all reporting data and
procedures explain how reporting should be carried out.
Since 2004 , the Group has used the Magnitude consolidation
system for its monthly reporting process. This tool provides for
the reporting of both fi nancial information (income statement
and balance sheet data) and non-fi nancial information (such as
indicators relating to quality, production, purchasing, safety and
human resources).
The level of control over the process for consolidating results at
Group level has been reinforced by applying blocking controls
upstream in reporting schedules and intermediate controls for the
reporting system.
Monthly reporting data include estimated sales and operating
profi t to be provided by each business unit within three days of
the month-end, and defi nitive data fi ve days after the month-end
prepared in accordance with the Group’s accounting policies.
Every month, an Operations Committee reviews the performance
and action plans of each Group business.
Medium-term plan and the budget
Faurecia’s budget is drawn up on an annual basis and updated
half-yearly.
Group management provides the economic and fi nancial
assumptions to be used in the budget, and sets specifi c objectives
for each operating unit. The budget is then tailored to each plant,
research and development center and administrative center. Finally,
it is converted to monthly periods using standard schedules, and
then consolidated.
In order to more effectively anticipate short-term changes and
improve responsiveness, the monthly reporting package includes
a rolling three-month forecast for the income statement and cash
fl ow statement.
As Faurecia’s contracts span several years, the Group needs a
medium-term overview of its fi nancial position in order to effectively
manage risks. To this end, the Group draws up a fi ve-year plan
known as the medium-term plan each year, in which the Program-
related dimension plays an essential part. This plan makes
it possible to clarify the Group’s outlook in terms of profi tability
and required resources. It is consolidated on the same basis as
the monthly reporting process, by applying the same stringent
procedures, and is used to defi ne the targets set in the budget.
•
•
•
•
The Internal Audit department
At the beginning of 2003, the Group created an Internal Audit
department which reports directly to the Group’s Finance
department. In addition, its work is approved and supervised by
the Chairman of the Board and the Audit Committee. The role
of the Internal Audit department is to ensure an optimum level of
effi ciency in all systems of internal fi nancial control, by applying a
systematic and methodical approach. It is authorized to intervene
where required in relation to any Group process throughout the
world. This department conducts its assignments in a wholly
objective manner and systematically supports its fi ndings with
precise facts and fi gures that have been duly verifi ed. All of the
Internal Audit department’s work is made available to Group Senior
Management, to which it reports regularly on the progress of its
assignments and the meeting of its objectives. It presents its audit
plan, as well as the reports it has drawn up and details of whether
it has met its objectives to the Group Executive Committee twice
a year and to the Audit Committee once a year. In addition, it
provides other Company governance bodies with clarifi cations of
its audit fi ndings, when so requested.
In 2004, the department drew up an Internal Audit Code of
Conduct which defi nes the department’s roles and remit, as well
as the purpose and methods of its assignments. Its resources are
currently being increased so that it can systematically cover all of
the Group’s entities based on a pre-defi ned schedule.
Main developments
During the year the Group continued to develop its risk assessment
policy and enhance its internal control procedures:
it pursued its rollout of the standards and procedures applicable
under the Faurecia Excellence System, notably by introducing
self-assessment questionnaires enabling each site to appraise
whether it complies with these standards;
it strengthened its Code of Ethics, particularly by setting up the
above-described warning procedure;
it launched a risk mapping process, in order to more effectively
identify and manage risks. The aim is to assess risks in each
area and monitor any changes, ensure that appropriate action
plans are put in place by the risk prevention functions and,
where necessary, supplement existing control procedures and
systems. The Group’s main risk factors are explained in the
management report;
it strengthened its Internal Audit function by increasing the
department’s headcount;
in addition, by upgrading its information systems based on SAP
architecture the Group has created standardized, reliable and
up-to-the-minute tools that correspond to Faurecia’s standards
and procedures and which will be gradually rolled out across
the Group.
•
•
•
•
•

168 Faurecia > 2007 Registration document
LEGAL AND FINANCIAL INFORMATION8 Internal control
3. Limitations placed by the Board of Directors on the powers of the Chairman and Chief Executive Offi cer
The Board of Directors has entrusted its Chairman with
responsibility for the Company’s general management. The internal
rules of operation of the Board specify the terms and conditions
of performance of the Board’s own role as well as the duties of
the Chairman. These rules also state that the Board should be
consulted on all Company and Group strategic decisions at the
Chairman’s initiative. At its meeting of February 16, 2007, the
Board of Directors authorized the Chairman and Chief Executive
Offi cer to give endorsements or guarantees subject to an overall
ceiling of €50 million, with a limit of €10 million per transaction. If
the Group is required to provide advance repayment guarantees
or performance bonds for contracts with successive performance
commitments, the Chief Executive Offi cer is authorized to provide
guarantees representing a maximum of €5 million per transaction,
subject to the same overall ceiling. Through its internal rules of
operation and within the scope of the applicable laws governing
its business activities, the Board has the powers to deal with all
matters required for the smooth running of the Company.
The Chairman of the Board of Directors
8.2.2 STATUTORY AUDITORS’ REPORT ON THE CHAIRMAN’S
REPORT ON INTERNAL CONTROL
This is a free translation into English of the Statutory Auditors’ report issued in the French language and is provided solely for the convenience
of English speaking readers. This report should be read in conjunction with, and construed in accordance with, French law and professional
auditing standards applicable in France.
To the shareholders,
In our capacity as Statutory Auditors of Faurecia S.A., and in accordance with Article L. 225-235 of the French Commercial Code (Code de
commerce), we report to you on the report prepared by Faurecia’s Chairman in accordance with Article L. 225-37 of said Code for the year
ended 31 December 2007.
It is for the Chairman to give an account, in his report, notably of the conditions in which the work of the Board of Directors is prepared and
organized and of the internal control procedures in place within the Company.
It is our responsibility to report to you our observations on the information contained in the Chairman’s report concerning the internal control
procedures relating to the preparation and processing of fi nancial and accounting information.
We performed our procedures in accordance with professional standard applicable in France. This standard requires us to perform procedures
to assess the fairness of the information set out in the Chairman’s report concerning the internal control procedures relating to the preparation
and processing of fi nancial and accounting information. These procedures notably consisted of:
obtaining an understanding of the internal control procedures relating to the preparation and processing of fi nancial and accounting
information on which the information presented in the Chairman’s report, and existing documentation is based;
obtaining an understanding of the work performed in order to prepare this information and existing documentation;
determining whether any major internal control weaknesses concerning the preparation and processing of accounting and fi nancial
information that we may have identifi ed as part of our audit are appropriately disclosed in the Chairman’s report.
On the basis of these procedures, we have no matters to report in connection with the information given on the Company’s internal control
procedures relating to the preparation and processing of fi nancial and accounting information, contained in the Chairman of the Board’s report
prepared in accordance with Article L. 225-37 of the French Commercial Code.
Neuilly-sur-Seine and Paris-La Défense, April 9, 2008
The Statutory Auditors
PricewaterhouseCoopers Audit Ernst & Young Audit
Dominique Ménard Laurent Miannay
•
•
•

169Faurecia > 2007 Registration document
LEGAL AND FINANCIAL INFORMATION 8Additional information on Faurecia S.A.
An industrial history spanning two centuries
Faurecia’s present-day expertise refl ects a long heritage, stretching
back to the beginning of French industrialization. Although
Faurecia’s founding company Ecia (Équipements et Composants
pour l’Industrie Automobile) was formed in 1987 from the merger
of Cycles Peugeot and Aciers & Outillages Peugeot, its industrial
tradition dates back to 1810.
In its current confi guration, Faurecia was formed from the three
French companies Ecia, Bertrand Faure and Sommer Allibert. The
fi rst two merged in 1998, and the third joined the Group in 2001.
With sales of €12.7 billion and a workforce of 60,000 in 28 countries,
Faurecia ranks as the number two automotive equipment supplier
in Europe and number eight worldwide (1).
ROOTS
1810. Jacques Maillard-Salins and the Peugeot brothers Jean-
Pierre and Frédéric set up a steel foundry to make saw blades at
Hérimoncourt, a village in eastern France, a few kilometers from the
Swiss border.
1891. The fi rst automobiles, in the modern sense, are made,
powered by petrol engines. The fi rst steel tubes follow, patented
by Peugeot and made at sites including Audincourt, in the Doubs
region of eastern France.
1914. At Levallois-Perret to the west of Paris, Bertrand Faure opens
his fi rst workshop, making seats for Paris trams and underground
trains.
1929. Bertrand Faure acquires the Epéda process enabling the
company to fi ne-tune its seats for the automotive industry and
develop a new product – the spring mattress. Both businesses take
off signifi cantly after the Second World War. Bertrand Faure clients
include Renault, Peugeot, Citroën, Talbot, Panhard-Levassor,
Berliet and Simca.
1950. Bernard Deconinck, son-in-law of hay merchant Joseph
Allibert, who had founded the Allibert company in Isère (eastern
France) in 1910, decides to invest in a huge injection press, imported
from the USA, to mould large plastic parts in a single piece. He
turns from refrigerator manufacturers to the automotive industry.
1955. The Frères Peugeot company, one of whose subsidiaries
is Peugeot et Cie, starts production of automotive equipment,
diversifying over time to make products such as seats, exhaust
systems and steering columns. Operations extend outside France
and some products are dropped to concentrate on new production
lines.
1972. François Sommer, grandson of Alfred Sommer, merges
his automotive fl oor coverings company with that of Bernard
Deconinck’s company, Allibert, to found the Sommer Allibert Group,
combining know-how in textiles and plastics.
In the early 1980s, Sommer Allibert invests heavily to meet the
needs of the automotive industry and becomes a leading specialist
in interior vehicle fi ttings for all major automakers. International
expansion follows, with the acquisition of Spain-based Lignotock,
and an extended presence in Germany from 1993.
1987. Ecia (Équipements et Composants pour l’Industrie
Automobile) is formed from the merger of Cycles Peugeot with
Aciers & Outillages Peugeot and undergoes ten years of intense
industrial and geographical development. At the same time Bertrand
Faure steps up its international development with the purchase
of the Rentrop Group in Germany, rounding out the acquisitions
made in 1977 in Spain and Portugal. This makes Bertrand Faure
the European number one in automotive seating techniques and
components. From the beginning of the 1990s until 1998, Bertrand
Faure concentrates on its automotive equipment business, selling
off its other businesses in bedding (Epéda and Mérinos), aeronautics
(Ratier-Figeac) and luggage (Delsey).
1992. Ecia sells its bicycles business, followed by its tooling
business in 1993, and makes signifi cant acquisitions of exhaust
systems specialists – including Tubauto and Eli Échappement in
France, Leistritz Abgastechnik in Germany and Silenciadores PCG
in Spain – to become European number one for this module. Its
Seating division joins forces with the Spanish automotive equipment
supplier Irausa to form the company’s fi rst non-French subsidiary,
Ardasa. Clients for exhaust systems, seats, interior fi ttings and front
ends include Volkswagen, Renault, Daimler-Chrysler, Opel, Honda
and Mitsubishi.
(1) Source: Faurecia.(1) Source: Faurecia.
8.3.1 HISTORY
170 Faurecia > 2007 Registration document
LEGAL AND FINANCIAL INFORMATION8 Additional information on Faurecia S.A.
FORMATION
December 11, 1997. Ecia launches a friendly bid for Bertrand
Faure, bringing its direct and indirect stake in this group to 99%.
The acquisition leads to the formation of the Faurecia Group in 1998
with the underlying aim of focusing on the automotive equipment
business. At the same time as Bertrand Faure sells its luggage
business (Delsey) and aeronautics business (Ratier Figeac), Ecia
sells its motorcycles business (Peugeot Motocycles) to the PSA
Peugeot Citroën Group in 1998.
June 1999. Ecia and Bertrand Faure merge, resulting in the PSA
Peugeot Citroën Group holding a 52.6% stake in Faurecia by
the end of 1999. Faurecia reports sales of over €4 billion, with a
workforce of 32,000. As well as boosting its size and helping it gain
a worldwide position in automotive seating, Bertrand Faure gives
Ecia a broader geographical and commercial reach, especially in
Germany, where the company has strong links with manufacturers
such as Volkswagen and BMW.
Late 1999. The Faurecia Group extends its exhaust systems
coverage in North America with the acquisition of the US company
AP Automotive Systems.
October 2000. Faurecia purchases Sommer Allibert. By fi nancing
this transaction, PSA Peugeot Citroën raises its stake in the
Faurecia Group to 71.5%. With good coverage of Germany and
Spain, the Group commands high market share for vehicle interior
fi ttings in Europe, especially for door panels, instrument panels and
acoustic modules.
2001. The Sommer Allibert acquisition is fi nalized through a buyback
bid addressing Sommer Allibert minority shareholders. The resulting
G roup posts sales of €9.6 billion. Faurecia then buys the remaining
minority shares held by external shareholders in Sommer Allibert’s
German subsidiary SAI Automotive AG.
INTERNATIONAL EXPANSION AND PRODUCTION
SYSTEM DEVELOPMENT
2002. The Faurecia Group acquires a 49% stake in the South
Korean catalytic converter maker Daeki Industrial, number two on
its market. The same year, Faurecia forms a joint venture with the
Taiwanese automotive equipment company GSK, with a view to
making seats at Wuhan, in China.
2003. Faurecia follows up these acquisitions by buying the South
Korean exhaust systems company Chang Heung Precision, which
holds market share of over 20%. This gives Faurecia’s Exhaust
Systems a manufacturing presence in all continents. In Europe, the
Group fi nalizes an agreement with Siemens-VDO on strengthening
and extending their joint venture (SAS) that assembles cockpits for
BMW, DaimlerChrysler, the Ford group, Renault-Nissan and the
Volkswagen Group.
To step up Korean operations, Faurecia raises its stake in Daeki
(specializing in exhaust systems for Hyundai) to 100%, and sets
up a joint venture with the South Korean company Kwang Jin
Sang Gong, to produce door modules for Hyundai Motor and Kia
Motors.
171Faurecia > 2007 Registration document
LEGAL AND FINANCIAL INFORMATION 8Additional information on Faurecia S.A.
8.3.2 LEGAL INFORMATION ABOUT THE COMPANY
8.3.2.1 General information about the Company
COMPANY NAME AND HEADQUARTERS
Company name: Faurecia
Headquarters: 2, rue Hennape - 92000 Nanterre - France
Tel.: +33 (0) 1 72 36 70 00
Fax: +33 (0) 1 72 36 70 07
www.faurecia.com
LEGAL FORM
Faurecia is a listed société anonyme (joint-stock corporation)
governed by the French Commercial Code and the related
implementing regulations. It complies with generally accepted
corporate governance principles for listed companies in France,
including those described in the AFEP/MEDEF report on corporate
governance, and reports on its application of these principles in its
registration document.
Faurecia abides by the legal and regulatory provisions that apply
to the governing bodies of listed companies and reports in this
registration document on the application of the recommendations
made in relation to said document
AUDITORS
The Company’s accounts are audited by two Statutory Auditors,
appointed in accordance with Article L. 225-228 of the French
Commercial Code.
DATE OF INCORPORATION AND TERM
Incorporated on July 1, 1929.
Term expires on: December 31, 2027.
INCORPORATION DETAILS
The Company is registered with the Nanterre Trade and Companies
Registry under number 542 005 376.
APE (business identifi er) code: 7010Z (company administration).
CONSULTATION OF CORPORATE DOCUMENTS
During the period of validity of this registration document, the
following documents (or copies thereof) can be consulted at the
Company’s headquarters:
a. The Company’s bylaws;
b. Financial information on Faurecia S.A. and its subsidiaries for
each of the two fi scal years prior to publication of the registration
document.
•
•
•
•
•
Contact:
FAURECIA
Dominique Laulan
General Counsel
2, rue Hennape - 92000 Nanterre - France
CORPORATE PURPOSE
The Company’s purpose, as set out in Article 3 of the bylaws, is
summarized below:
to establish, acquire, operate directly or indirectly or invest in
any and all industrial, trading or service companies in France
or abroad;
to provide administrative, fi nancial and technical assistance to
subsidiaries and affi liates;
to manufacture and sell any and all products, accessories or
equipment for the automotive and other industries, and generally
to conduct any and all related commercial, industrial, real-estate
and other transactions.
THE COMPANY’S ROLE IN RELATION TO ITS
SUBSIDIARIES
Faurecia is a holding company, whose assets are primarily made
up of investments in subsidiaries and associates. The Group’s
industrial assets are held by the operating subsidiaries.
Faurecia provides direct and indirect fi nancial, accounting,
management, administrative and other services to Group
companies.
Group subsidiaries are fi nanced on a centralized basis, primarily
through Faurecia and Financière Faurecia – which performs a cash
pooling role – in order to enable the subsidiaries to benefi t from the
favorable market conditions obtained from lenders by Faurecia.
As of December 31, 2007, the Company’s net debt, corresponding
to borrowings less cash and cash equivalents and net inter-
company cash advances, amounted to €1,341.1 million, compared
with €1,616.0 million in consolidated net debt for the Group as a
whole.
FISCAL YEAR
The Company’s fi scal year covers the twelve-month period from
January 1 to December 31.
INCOME APPROPRIATION
Income available for distribution corresponds to net income for
the year, less any losses carried forward from prior years and any
amounts appropriated to reserves in compliance with the law or
the bylaws, plus any retained earnings. Out of this income, the
Shareholders’ Meeting determines the fraction attributed to
shareholders in the form of dividends and deducts the amounts it
considers appropriate to allocate to any reserve funds or to carry
forward.
•
•
•

172 Faurecia > 2007 Registration document
LEGAL AND FINANCIAL INFORMATION8 Additional information on Faurecia S.A.
However, except in the case of a capital reduction, no distributions
may be made to shareholders if the Company’s shareholders’
equity represents – or would represent after the planned distribution
– less than its capital stock plus any reserves which, according to
the law or the bylaws, are not available for distribution.
The Shareholders’ Meeting may also decide to distribute amounts
deducted from optional reserves in order to pay an ordinary
dividend or increase the dividend or pay an exceptional dividend.
The Company’s bylaws provide that the Ordinary Shareholders’
Meeting approving the fi nancial statements for the year may also
decide to offer each shareholder the option between the payment
of the dividend or the interim dividend in cash or in shares.
DIVIDENDS – STATUTE OF LIMITATIONS
Dividends not collected within fi ve years of the payment date will
be time-barred and paid over to the French Treasury.
REGISTRAR AND PAYING AGENT
The registrar and paying agent for Faurecia shares is Crédit Agricole
– Caisse d’Epargne Investor Services (CACEIS). 14, rue Rouget-
de-Lisle, 92862 Issy-les-Moulineaux Cedex 9 France.
STOCK MARKET DATA
Faurecia shares are traded on the Eurolist market of Euronext
Paris SA under ISIN Code FR 0000121147. They are included in
the SBF 250, MID & SMALL 190 and NEXT 150 indexes and are
eligible for inclusion in personal equity plans (PEA) and the deferred
settlement service (SRD).
GENERAL SHAREHOLDERS’ MEETINGS
Shareholders’ Meetings are held at the Company’s headquarters
or at any other venue specifi ed in the notice of Meeting.
Holders of registered shares are notifi ed by mail; the other
shareholders are notifi ed via the relevant banks and brokers through
the fi nancial notices provided for by the applicable regulations.
A continually updated schedule of all of the Group’s fi nancial events,
including the date of the Shareholders’ Meeting, is available on
Faurecia’s website at www.faurecia.com.
To be entitled to attend Shareholders’ Meetings in person or to
be represented by proxy, holders of registered shares must have
their shares recorded in the registered share account kept by the
Company and holders of bearer shares must have their shares
recorded in a share account kept by their bank or broker at least
three (3) days prior to the date of the Meeting. The person who
issues the notice of Meeting may, however, reduce this period if
he or she sees fi t.
The rights of shareholders, which may only be amended in
accordance with the conditions laid down by French law, are not
affected by any other provision of the bylaws.
VOTING RIGHTS
The Company’s bylaws do not provide for any restrictions on
voting rights. Voting rights at Ordinary, Extraordinary and Special
Shareholders’ Meetings are exercisable by the benefi cial owner of
the shares.
DOUBLE VOTING RIGHTS
All fully paid-up shares that have been registered in the name of the
same holder for at least two (2) years carry double voting rights.
In the case of a bonus share issue paid up by capitalizing retained
earnings, income or additional paid-in capital, the bonus shares
allotted in respect of registered shares carrying double voting
rights will also carry double voting rights as from the date of issue.
This double voting right may be cancelled following a decision of
the Extraordinary Shareholders’ Meeting and after having informed
a Special Meeting of the benefi ciary shareholders.
Shares that are transferred or converted to bearer form are stripped
of double voting rights. However, double voting rights are not lost
and the above-mentioned two-year period continues to run when
shares are transferred following the liquidation of a marital estate,
or by way of an inheritance or in the form of an inter vivos gift to a
spouse or a relative in the direct line of succession.
DISCLOSURE THRESHOLDS
(ARTICLE 24 OF THE BYLAWS)
When an individual or corporate shareholder, acting alone or in
concert within the meaning of Article L. 233-10 of the French
Commercial Code, raises their interest to above 2% of the
Company’s voting rights, said shareholder must inform the
Company of the total number of shares and voting rights held by
the shareholder, within fi ve trading days of the threshold being
crossed, by registered letter with return receipt requested. This 2%
applies in addition to the 5% disclosure threshold provided for in
Article L. 233-7 of the French Commercial Code. The shareholder
must also inform the Autorité des Marchés Financiers within the
same timeframe, so that the latter can disclose this information to
the public, in accordance with its general regulations.
In the case of failure to comply with these disclosure rules, at the
request of one or several shareholders present or represented at
the Meeting with combined holdings representing at least 2% of
the capital or voting rights, the undisclosed shares will be stripped
of voting rights. Said request must be recorded in the minutes of
the Shareholders’ Meeting. This procedure is in addition to the
legal requirements concerning disclosure thresholds set out in
Article L. 233-7 of the French Commercial Code.
173Faurecia > 2007 Registration document
LEGAL AND FINANCIAL INFORMATION 8Additional information on Faurecia S.A.
The rights of shareholders, which may only be amended in
accordance with the conditions laid down by French law, are not
affected by any other provision of the bylaws.
ARRANGEMENTS WHOSE OPERATION COULD
RESULT IN A CHANGE IN CONTROL OF THE
COMPANY OR WHICH COULD POSTPONE OR
PREVENT A CHANGE IN CONTROL
To the best of the Company’s knowledge there are no arrangements
in place whose operation could result in a change in control of the
Company at a future date.
There are currently no deeds, bylaws, charters, regulations or
contractual provisions in place that could postpone or prevent a
change in control of the Company.
In the automotive industry sector in which Faurecia operates sub-
contractors do not generally defi ne the technical specifi cations
for subcontracted parts. When on rare occasions subcontractors
are in a position to do this, the Group’s policy is to contractually
arrange for the subcontractor concerned to transfer the relevant
design work in order for it to be used in conjunction with other
services.
MATERIAL CONTRACTS
To date, Faurecia has not entered into any material contracts that
would entail a signifi cant obligation or commitment for the Group,
other than those that fall within the ordinary course of business.
DEPENDENCE
Faurecia is not currently dependent on any patents or
manufacturing processes owned by third parties or on any specifi c
supply contracts to conduct its business.
MATERIAL PROPERTY, PLANT AND EQUIPMENT
The Group’s 190 manufacturing sites and 28 research and
development centers spanning 28 countries enable it to maximize
its local presence and implement its just-in-time delivery strategy.
None of its manufacturing equipment taken on an individual basis
represents a material value in relation to the property, plant and
equipment of the Group as a whole.
8.3.2.2 Additional information on the members of the Board of Directors
GENERAL INFORMATION
The Company has no employee-elected or non-voting Directors.
Each Director must hold at least 20 Faurecia shares throughout his
or her term of offi ce.
Apart from the Chairman and Chief Executive Offi cer, no member
of the Board of Directors holds an executive management or
salaried position within a Group company.
As of April 10, 2008, the only Directors with a family connection
were Thierry Peugeot and Robert Peugeot.
In the past fi ve years no Director has (i) received a conviction in
relation to fraudulent offi ces; (ii) managed a company that has
fi led for bankruptcy or gone into receivership or liquidation; (iii)
received an offi cial public incrimination or sanction by statutory or
regulatory authorities; (iv) been disqualifi ed by a court from acting
as a member of the administrative, management or supervisory
bodies of an issuer, or from acting in the management or conduct
of the affairs of an issuer.
CONFLICTS OF INTEREST
As provided for in the Board of Directors’ internal rules, all Directors
must inform the Board of any actual or potential confl icts of interest
and refrain from voting during the corresponding deliberations. No
such situations arose in 2007.
Aside from regulated agreements (which are the subject of a report
to the Shareholders’ Meeting) no service agreement has been
entered into between a member of the Board of Directors and
Faurecia or any one of its subsidiaries.
Transactions that may be entered into with a shareholder owning
more than 5% of the Company’s capital correspond to day-to-day
routine operations.
At its meeting of December 16, 2005, the Board strengthened
its rules relating to confl icts of interest by adopting a procedure
regarding the communication of insider information. This procedure
– which applies notably to Directors – provides that no transactions
may be carried out involving the Company’s shares until the
related information has been made public. Directors and certain
categories of staff, who are all included in a regularly updated list,
must disclose any trades they carry out in Faurecia’s shares to the
Company which then informs the markets.
174 Faurecia > 2007 Registration document
LEGAL AND FINANCIAL INFORMATION8 Additional information on Faurecia S.A.
DIRECTORSHIPS AND OTHER POSITIONS HELD BY MEMBERS OF THE BOARD OF DIRECTORS
Director Directorship/Position
Yann DELABRIERE
Yann Delabrière, 57, has been Chairman and Chief Executive Offi cer of Faurecia since February 16, 2007. His term of offi ce will expire at the Shareholders’ Meeting to be held in 2013.
Yann Delabrière has been a Director of Faurecia since November 18, 1996. He occupied various positions within the fi nance departments of major manufacturing groups before joining the PSA Peugeot Citroën Group in 1990 where he held the position of Chief Financial Offi cer.
As of December 31, 2007, Yann Delabrière held 1, 100 Faurecia shares.
Business address: FAURECIA - 2, rue Hennape 92735 Nanterre Cedex - France
In addition to his duties as a Director of Faurecia, Yann Delabrière
held the following positions and directorships in 2007:
IN FRANCE (OUTSIDE THE GROUP)
Director of Capgemini
During the last fi ve years, Yann Delabrière has also held the following
positions, which he no longer holds:
IN FRANCE (WITHIN THE GROUP)
Chief Financial Offi cer of the PSA Peugeot Citroën Group
Chairman and Chief Executive Offi cer of Banque PSA Finance
Chairman and Chief Executive Offi cer of Compagnie Générale
de Crédit aux Particuliers – Credipar
Director of Peugeot Citroën Automobiles SA
Director of Automobiles Citroën
Director of Gefco
Chairman of Egery
Chairman of Pergolese Investissements
Chief Executive Offi cer of Grande Armée Participations
Legal Manager of PSA Citroën Finance
Chairman of the Supervisory Board of SIT
Permanent representative of Automobiles Peugeot
on the Board of Directors of Peugeot SA
IN FRANCE (OUTSIDE THE GROUP)
Member of the Supervisory Board of Sommer Allibert
OUTSIDE FRANCE (WITHIN THE GROUP)
Legal Manager of PSA Services SrL (Italy)
Chairman of the Board of Directors of Peugeot Citroën Argentina SA
(Argentina)
Chairman of the Supervisory Board of Peugeot Finance International
(Netherlands)
Vice-Chairman and Director of PSA International SA (Switzerland)
Jean-Pierre CLAMADIEU
Jean-Pierre Clamadieu, 49, has been a Director
of Faurecia since May 29, 2007. His term of offi ce will
expire at the Shareholders’ Meeting to be held in 2013.
Jean-Pierre Clamadieu has been Chief Executive Offi cer
of Rhodia since October 2003 and Chairman since
March 2008, having previously held various divisional
executive positions. He is also a Director of Rhodia.
As of December 31, 2007 Jean-Pierre Clamadieu held
100 Faurecia shares.
Business address: RHODIA - Immeuble C œur D éfense
tour A, 110 Esplanade Charles de Gaulle -
La Défense 4 - 92931 La Défense Cedex - France
In addition to his duties as a Director of Faurecia, Jean-Pierre Clamadieu
held the following positions and directorships in 2007:
IN FRANCE (OUTSIDE THE GROUP)
Chief Executive Offi cer and a Director of the Rhodia G roup
During the last fi ve years, Jean-Pierre Clamadieu has also held the following
positions, which he no longer holds:
IN FRANCE (OUTSIDE THE GROUP)
President of the Pharmacy and Agrochemicals Division, Rhodia
President of the Fine Organics Division, Rhodia
Director of various Rhodia Group subsidiaries

175Faurecia > 2007 Registration document
LEGAL AND FINANCIAL INFORMATION 8Additional information on Faurecia S.A.
Director Directorship/Position
Frank ESSER
Frank Esser, 49, has been a Director of Faurecia
since May 23, 2005. His term of offi ce will expire
at the Shareholders’ Meeting to be held in 2011.
Frank Esser joined SFR as Chief Executive Offi cer
in September 2000 and was appointed Chairman
and Chief Executive Offi cer in 2002.
As of December 31, 2007 Frank Esser held 20 Faurecia
shares.
Business address: SFR - Tour Séquoia - 1, place
Carpeaux - 92915 Paris La Défense - France
In addition to his duties as a Director of Faurecia, Frank Esser
held the following positions and directorships in 2007:
IN FRANCE (OUTSIDE THE GROUP)
Chairman of the Board of Directors of Vizzavi France
Chairman of the Fédération Française des Télécoms et des communications
électroniques
Director of Neuf Cegetel
Director of Jet Multimedia
Permanent representative of SFR on the Board of Directors of Ltb-R
Member of the Management Board of Vivendi
Director of Vivendi Telecom International
OUTSIDE FRANCE (OUTSIDE THE GROUP)
Member of the Supervisory Board of Maroc Telecom
Director of Vodafone D2 GmbH (Germany)
Director of GSM Association (UK)
During the last fi ve years, Frank Esser has also held the following positions,
which he no longer holds:
IN FRANCE (OUTSIDE THE GROUP)
Chairman of the Supervisory Board of Cegetel
Chief Executive Offi cer of SFR Cegetel
Jean-Louis GERONDEAU
Jean-Louis Gérondeau, 64, has been a Director
of Faurecia since May 27, 2003. His term of offi ce will
expire at the Shareholders’ Meeting to be held in 2009.
Jean-Louis Gérondeau is Chairman of the Management
Board of the Zodiac group and has long-standing
experience in managing international groups specialized
in the aeronautical industry.
As of December 31, 2007 Jean-Louis Gérondeau
held 100 Faurecia shares.
Business address: ZODIAC - 2, rue Maurice-Mallet -
92130 Issy-les-Moulineaux - France
In addition to his duties as a Director of Faurecia, Jean-Louis Gérondeau
held the following positions and directorships in 2007:
IN FRANCE (OUTSIDE THE GROUP)
Chairman and Vice-Chairman of the Supervisory Board
of Institut de Développement Industriel
Chairman of Aerazur
Chairman of Intertechnique
Chairman of Aerazur Newco
Chairman of Zodiac Marine Holding
Director of SICMA Aero Seat
Director of Nexans
Permanent representative of Zodiac SA Parachutes de France
OUTSIDE FRANCE (OUTSIDE THE GROUP)
Chairman of Zodiac Airline Equipment LLC (USA)
Director of Avox-Eros Services Inc (USA)
Director of Avox Systems Inc. (USA)
Director of Evac International Oy (Finland)
Director of Evac Oy (Finland)
Director of Marine Holding Corp (USA)
Director of Zodiac Espagnola (Spain)
Director of Mag Aerospace Industries Inc (USA)
Director of C&D Zodiac (USA)
Director of C&D Aerospace Canada
Director of Zodiac Automotive UK
Director of Zodiac Automotive US
Director of Zodiac US Corporation
Director of Air Cruisers (USA)
Director of Zodiac Group of Australia
Director of SICMA Aero Seat Services (USA)
During the last fi ve years, Jean-Louis Gérondeau has also held the following
positions, which he no longer holds:
IN FRANCE (OUTSIDE THE GROUP)
Director of Ferma
Director of Optim Actif
176 Faurecia > 2007 Registration document
LEGAL AND FINANCIAL INFORMATION8 Additional information on Faurecia S.A.
Director Directorship/Position
Jean-Claude HANUS
Jean-Claude Hanus, 61, has been a Director of Faurecia
since February 21, 2000. His term of offi ce was renewed
at the May 23, 2005 Shareholders’ Meeting and will expire
at the Shareholders’ Meeting to be held in 2011.
Jean-Claude Hanus has spent his entire career
with the PSA Peugeot Citroën Group and is currently
Director of Legal Affairs, Institutional Relations
and Internal Audit of Peugeot SA.
As of December 31, 2007 Jean-Claude Hanus
held 100 Faurecia shares.
Business address: PEUGEOT SA,
75, avenue de la Grande-Armée - 75116 Paris - France.
In addition to his duties as Director of Faurecia, Jean-Claude Hanus
held the following positions and directorships in 2007:
IN FRANCE (WITHIN THE GROUP)
Chairman of DJ6
Chairman of Grande Armée Participations
Director of Automobiles Peugeot
Director of Compagnie générale de Crédit aux Particuliers – Credipar
Permanent representative of Peugeot SA on the Board of Directors
of Banque PSA Finance
Permanent representative of Peugeot SA on the Board of Directors
of Gefco SA
IN FRANCE (OUTSIDE THE GROUP)
Director of Association Auxiliaire de l’Automobile
Director of Comité des Constructeurs Français Automobiles
OUTSIDE FRANCE (WITHIN THE GROUP)
Director of Peugeot Citroën Automobiles España SA
During the last fi ve years, Jean-Claude Hanus has also held the following
positions, which he no longer holds:
IN FRANCE
Director of Pergolèse Investissement
Director of Financière Pergolèse
Permanent representative of Peugeot SA on the Board of Directors
of Automobiles Citroën
Chairman of the Board of Directors of Beaujon Immobilier
Chief Executive Offi cer of Beaujon Immobilier
Gérard HAUSER
Gérard Hauser, 66, has been a Director of Faurecia
since July 22, 2003. His term of offi ce will expire
at the Shareholders’ Meeting to be held in 2009.
Gérard Hauser is Chairman and Chief Executive Offi cer
of Nexans and has held executive positions in various
international industrial groups.
As of December 31, 2007 Gérard Hauser held 50 Faurecia
shares.
Business address: NEXANS - 16, rue de Monceau -
75008 Paris - France
In addition to his duties as a Director of Faurecia, Gérard Hauser
held the following positions and directorships in 2007:
IN FRANCE (OUTSIDE THE GROUP)
Chairman of the Board of Directors of Nexans
Director of Aplix
Director of Alstom
Director of Ipsen
During the last fi ve years, Gérard Hauser has also held the following
positions which he no longer holds:
IN FRANCE (OUTSIDE THE GROUP)
Director of Electro Banque
177Faurecia > 2007 Registration document
LEGAL AND FINANCIAL INFORMATION 8Additional information on Faurecia S.A.
Director Directorship/Position
Ross MC INNES
Ross Mc Innes, 54, has been a Director of Faurecia
since May 29, 2007. His term of offi ce will expire at the
Shareholders’ Meeting to be held in 2013.
Ross Mc Innes is Vice-Chairman of Macquarie Capital
Europe Ltd and has long-standing executive experience in
major industrial groups.
As of December 31, 2007 Ross Mc Innes held 100
Faurecia shares.
Business address: MACQUARIE EUROPE
41 Avenue George V, 75008 Paris - France
In addition to his duties as a Director of Faurecia, Ross Mc Innes held the
following positions and directorships in 2007:
IN FRANCE (OUTSIDE THE GROUP)
Member of the Supervisory Board of Générale de Santé SA
Member of the Audit Committee and Nominations and Compensation
Committee of Générale de Santé SA
Representative of the Chairman of Santé Développement Europe
Director of Macquarie Autoroutes de France, Eiffarie, APRR and AREA.
Director of SNEF and Financière du Planier
Director of Bienfaisance Holding
OUTSIDE FRANCE (OUTSIDE THE GROUP)
Vice-Chairman of Macquarie Europe Ltd
During the last fi ve years, Ross Mc Innes has also held the following
positions, which he no longer holds:
IN FRANCE (OUTSIDE THE GROUP)
Chairman of the Management Board of Générale de Santé SA
Permanent representative of Santé Sa rl on the Supervisory Board of
Générale de Santé SA
Chief Financial Offi cer of P.P.R.
Non-voting Director of P.P.R.
Director of CFAO
Director of Rexel
Chief Operating Offi cer of Thales
Director of Thales Air Defence SA, Thales Systèmes Aéroportés SA, and
Thales International.
Director of Electro Banque
OUTSIDE FRANCE (OUTSIDE THE GROUP)
Member of the Supervisory Board of Gucci Group NV
Director of Adi Group Holding Pty Limited, Adi Group Pty Limited, Adi
Munitions Pty Limited, and Australian Defence Industries.
Director of Camelot Plc.
Isabel MAREY-SEMPER
Isabel Marey-Semper, 40, has been a Director of Faurecia
since May 29, 2007. Her term of offi ce will expire at the
Shareholders’ Meeting to be held in 2013.
Isabel Marey-Semper has held various executive positions
in major international groups and has been Chief Financial
Offi cer of Peugeot SA since September 1, 2007.
As of January 21, 2008 Isabel Marey-Semper held 200
Faurecia shares.
Business address: PEUGEOT SA - 75, avenue de la
Grande-Armée - 75116 Paris - France.
In addition to her duties as a Director of Faurecia, Isabel Marey-Semper held
the following positions and directorships in 2007:
IN FRANCE (WITHIN THE GROUP)
Chairman and Chief Executive Offi cer of Banque PSA Finance
Director of Compagnie générale de Crédit aux particuliers – Credipar
Director of Gefco SA
Director of Peugeot Citroën Automobiles SA
IN FRANCE (OUTSIDE THE GROUP)
Director of Association Auxiliaire de l’Automobile
Director of Comité des Constructeurs Français Automobiles
OUTSIDE FRANCE (WITHIN THE GROUP)
Director of Dongfeng Peugeot Citroën Automobiles Company Ltd
Chairman of the Supervisory Board of Peugeot Finance International NV
Vice-Chairman of PSA International
Director of PSA International
178 Faurecia > 2007 Registration document
LEGAL AND FINANCIAL INFORMATION8 Additional information on Faurecia S.A.
Director Directorship/Position
Robert PEUGEOT
Robert Peugeot, 57, has been a Director of Faurecia
since May 29, 2007. His term of offi ce will expire
at the Shareholders’ Meeting to be held in 2013.
Robert Peugeot is a member of the Supervisory Board of
Peugeot SA. He has held a number of executive positions,
primarily in the PSA Peugeot Citroën Group, and has
extensive knowledge of the automotive sector.
He was previously a member of the Executive Committee
of the PSA Peugeot Citroën Group and held the position
of Vice-President, Innovation and Quality between
1998 and 2007. He has also been Chairman and Chief
Executive Offi cer of Société Foncière, Financière
et de Participations (FFP) since 2002.
As of December 31, 2007 Robert Peugeot
held 100 Faurecia shares.
Business address: PEUGEOT SA
75, avenue de la Grande-Armée - 75116 Paris - France.
In addition to his duties as a Director of Faurecia, Robert Peugeot
held the following positions and directorships in 2007:
IN FRANCE (WITHIN THE GROUP)
Member of the Supervisory Board of Peugeot SA
IN FRANCE (OUTSIDE THE GROUP)
Director of Holding Reignier SA
Director of WRG-Waste Recycling Group Ltd
Director of Alpine Holding
Director of Etablissements Peugeot Frères
Director of Imerys
Director of Immeubles et Particpation de l’Est
Director of Sanef
Chairman of the Board of Directors of Simante S.L.
Member of the Supervisory Board of Hermès International
Chairman and Chief Executive Offi cer of Société Foncière, Financière
et de Participations (FFP)
Director of LFPF (La Française de Participations Financières)
Permanent representative of FPP on the Supervisory Board of Zodiac
Statutory representative of FPP as Chairman of Financière Guiraud (SAS)
OUTSIDE FRANCE (OUTSIDE THE GROUP)
Director of B-1998, SL
Director of FCC Construcción, SA
During the last fi ve years, Robert Peugeot has also held the following
positions, which he no longer holds:
IN FRANCE (OUTSIDE THE GROUP)
Member of the Supervisory Board of the Taittinger G roup
Director of Aviva France
Director of Aviva Participations
Director of Fomentos de Construcciones y Contratas, SA (FCC)
Director of Institut Français du Pétrole (IFP)
Director of Société du Louvre
OUTSIDE FRANCE (WITHIN THE GROUP)
Director of Citroën Danmark A/S
Director of Citroën Deutschland Akitiengesellschaft
Director of Citroën UK Limited
Director of Peugeot Automobiles United Kingdom Ltd
Thierry PEUGEOT
Thierry Peugeot, 50, has been a Director of Faurecia
since April 17, 2003. His term of offi ce was renewed
at the May 23, 2005 Shareholders’ Meeting and will expire
at the Shareholders’ Meeting to be held in 2011.
Thierry Peugeot is Chairman of the Supervisory Board
of Peugeot SA He has held various executive positions
in the automotive sector and has a broad international
experience. He is also Chairman of the Supervisory
Board of Peugeot SA and Peugeot SA’s Chairman
of the Compensation and Appointments Committee
and is a member of the Strategy Committee.
As of December 31, 2007 Thierry Peugeot held 20
Faurecia shares.
Business address: PEUGEOT SA - 75, avenue de la
Grande-Armée - 75116 Paris - France.
In addition to his duties as a Director of Faurecia, Thierry Peugeot
held the following positions and directorships in 2007:
IN FRANCE (WITHIN THE GROUP)
Chairman of the Supervisory Board of Peugeot SA
Vice-Chairman and a Director of Établissements Peugeot Frères
Director of Foncière, Financière et de Participation
Director of La Française de Participations Financières
Director of Société Anonyme de Participations
IN FRANCE (OUTSIDE THE GROUP)
Director of Compagnie Industrielle de Delle
Permanent representative on the Board of Directors of ANSA
Permanent representative of CID on the Board of Directors of LISI
Member of the Supervisory Board of Air Liquide
Director of Immeubles et Participations de l’Est
During the last fi ve years, Thierry Peugeot has also held the following
positions, which he no longer holds:
IN FRANCE (OUTSIDE THE GROUP)
Director of AMC Promotion
Director of SIA Mulhouse
Chairman and a Director of Immeubles et Participations de l’Est
179Faurecia > 2007 Registration document
LEGAL AND FINANCIAL INFORMATION 8Additional information on Faurecia S.A.
Director Directorship/Position
Christian STREIFF
Christian Streiff, 53, has been a Director of Faurecia
since February 2, 2007.
His term of offi ce will expire at the Shareholders’ Meeting
to be held in 2011.
Christian Streiff is Chairman of the Managing Board
of PSA Peugeot Citroën. He has spent the majority
of his career with the Saint-Gobain G roup where he built
up in-depth international and industrial experience
in a range of different sectors in Europe, the United States,
Brazil and China.
As of December 31, 2007 Christian Streiff
held 100 Faurecia shares.
Business address: PEUGEOT SA
75, avenue de la Grande-Armée - 75116 Paris - France.
In addition to his duties as a Director of Faurecia, Christian Streiff
held the following positions and directorships in 2007:
IN FRANCE (WITHIN THE GROUP)
Chairman of Automobiles Peugeot
Chairman of Automobiles Citroën
Director of Banque PSA Finance
Director of Peugeot Citroën Automobiles
In addition Christian Streiff held the following positions and directorships in
2006:
IN FRANCE (OUTSIDE THE GROUP)
Chairman and Chief Executive Offi cer of Airbus Holding
Legal Manager of Argos Conseil
Chairman of the Board of Directors of Société Européenne des Produits
Réfractaires (SEPR)
During the last fi ve years, Christian Streiff has also held the following
positions, which he no longer holds:
IN FRANCE (OUTSIDE THE GROUP)
Chief Operating Offi cer of Compagnie de Saint-Gobain
Chairman and Chief Executive Offi cer of Airbus Holding
OUTSIDE FRANCE (OUTSIDE THE GROUP)
Chairman and Chief Executive Offi cer of Saint-Gobain Advanced Ceramics C orp.
Chairman and Chief Executive Offi cer of Carborundum Ventures Inc.
Chairman of the Board of Directors of Saint-Gobain Ceramics & Plastics Inc
Chairman of the Board of Directors of Saint-Gobain Performance
Plastics Corp.
Chairman of the Board of Directors of Saint-Gobain Abrasivos SA
Director of Thyssen-Krupp
Director of Continental AG
Director of PAM Colombia SA
Director of Grindwell Norton Ltd
Director of Kure-Norton Ltd
Director of Saint-Gobain Corporation
Director of Saint-Gobain Pipe Systems Plc.
Chief Executive Offi cer of Saint-Gobain KK
.

180 Faurecia > 2007 Registration document
LEGAL AND FINANCIAL INFORMATION8 Additional information on Faurecia S.A.
8.3.2.3 Additional information on the Company’s capital
As of December 31, 2007 the Company’s capital amounted to
€170,765,336, divided into 24,395,048 fully paid-up shares of €7
each, all of the same class. These shares represent 41,454,505
voting rights. No shares have been issued that do not represent
the Company’s capital.
AUTHORIZED, UNISSUED CAPITAL
At the May 22, 2006 Ordinary and Extraordinary Shareholders’
Meeting, the Board of Directors was given a twenty-six month
authorization to issue shares and/or securities carrying rights to
shares, with or without pre-emptive subscription rights for existing
shareholders. The maximum amount of any capital increases
carried out under this authorization was set at €61,000,000 and
the nominal amount of debt securities issued may not exceed
€1,000,000,000 or the foreign currency equivalent.
The Company did not use this authorization in 2007.
Authorization to increase capital stock:
Date of Shareholders’ Meeting TermAuthorized
amount Amount used(*)
Date of Board Meeting
May 22, 2006 26 months €61,000,000 0 N/A
(*) As of April 10, 2008.
DEBT INSTRUMENTS
At the May 27, 2003 Shareholders’ Meeting, the Board of Directors
was given a fi ve-year authorization to issue bonds with a maximum
nominal value of €1,000,000,000.
Since the French governmental order 2004-604 was issued on
June 24, 2004, the Board of Directors has the exclusive power to
decide on or authorize the issue of bonds, unless the Shareholders’
Meeting decides to exercise this power (Article L. 228-40 al.1 of
the French Commercial Code).
POTENTIAL SHARES
As of December 31, 2007, a total of 1,258,303 employee stock
options were outstanding.
Details of the stock option plans approved as at December 31,
2007 can be found on page 182.
SHARES HELD BY THE COMPANY
As of December 31, 2007, the Company held 270,814 of its own
shares(*), , following the sale of 31,340 shares during the year.
These shares were sold at a price of €40 each to benefi ciaries of
stock options exercisable for existing shares granted under the
September 4, 2000 plan.
(*) See Note 10 to the parent company fi nancial statements.(*) See Note 10 to the parent company fi nancial statements.
CHANGES IN FAURECIA’S CAPITAL OVER THE LAST FIVE YEARS
Amount of capital increase/reduction (in €)
New capital stock
New additional
paid-in capitalNew number
of shares
Year and type of transaction Par value Premium (in €) (in €)
February 2002Increase in capital following the exercise of stock options leading to the issue of 7,950 shares with a par value of €7 (including 5,950 shares with a cum-dividend date of January 1, 2001) 55,650 140,314.50 169,163,757 734,912,289.07 24,166,251
July 2002Increase in capital following the exercise of stock options leading to the issue of 700 shares with a par value of €7 4,900 12,173 169,168,657 734,924,462.07 24,166,951
November 2002Increase in capital following the exercise of stock options leading to the issue of 7,300 shares with a par value of €7 51,100 150,737 169,219,757 735,075,199.07 24,174,251
181Faurecia > 2007 Registration document
LEGAL AND FINANCIAL INFORMATION 8Additional information on Faurecia S.A.
Amount of capital increase/reduction (in €)
New capital stock
New additional
paid-in capitalNew number
of shares
Year and type of transaction Par value Premium (in €) (in €)
March 2003Increase in capital following the exercise of stock options leading to the issue of 29,150 shares with a par value of €7 204,050 708,714.50 169,423,807 735,783,913.57 24,203,401
December 2003Increase in capital following the exercise of stock options leading to the issue of 3,350 shares with a par value of €7 23,450 73,994 169,447,257 735,857,907.57 24,206,751
July 2004Increase in capital following the exercise of stock options leading to the issue of 2,800 shares with a par value of €7 19,600 48,692 169,466,857 735,906,599.57 24,209,551
October 2004Increase in capital following the exercise of stock options leading to the issue of 1,000 shares with a par value of €7 7,000 35,380 169,473,857 735,941,979.57 24,210,551
February 2005Increase in capital following the exercise of stock options leading to the issue of 6,500 shares with a par value of €7 45,500 187,600 169,519,357 736,129,579.57 24,217,051
April 2005Increase in capital following the exercise of stock options leading to the issue of 5,950 shares with a par value of €7 41,650 151,144 169,561,007 736,280,723.57 24,233,001
July 2005Increase in capital following the exercise of stock options leading to the issue of 7,600 shares with a par value of €7 53,200 328,210 169,614,207 736,608,933.57 24,230,601
October 2005Increase in capital following the exercise of stock options leading to the issue of 3,000 shares with a par value of €7 21,000 51,620 169,635,207 736,660,553.57 24,233,601
January 2006Increase in capital following the exercise of stock options leading to the issue of 1,000 shares with a par value of €7 7,000 35,380 169,642,207 736,712,173.57 24,234,601
December 2006Increase in capital following the exercise of stock options leading to the issue of 24,635 shares with a par value of €7 172,445 852,981.30 169,814,652 737,565,154.87 24,259,236
April 2007Increase in capital following the exercise of stock options leading to the issue of 1,000 shares with a par value of €7 240,800 1,191,084.50 170,055,452 738,756,239.37 24,293,636
October 2007Increase in capital following the exercise of stock options leading to the issue of 24,635 shares with a par value of €7 693,224 3,231,303.27 170,748,676 741,987,542.64 24,392,668
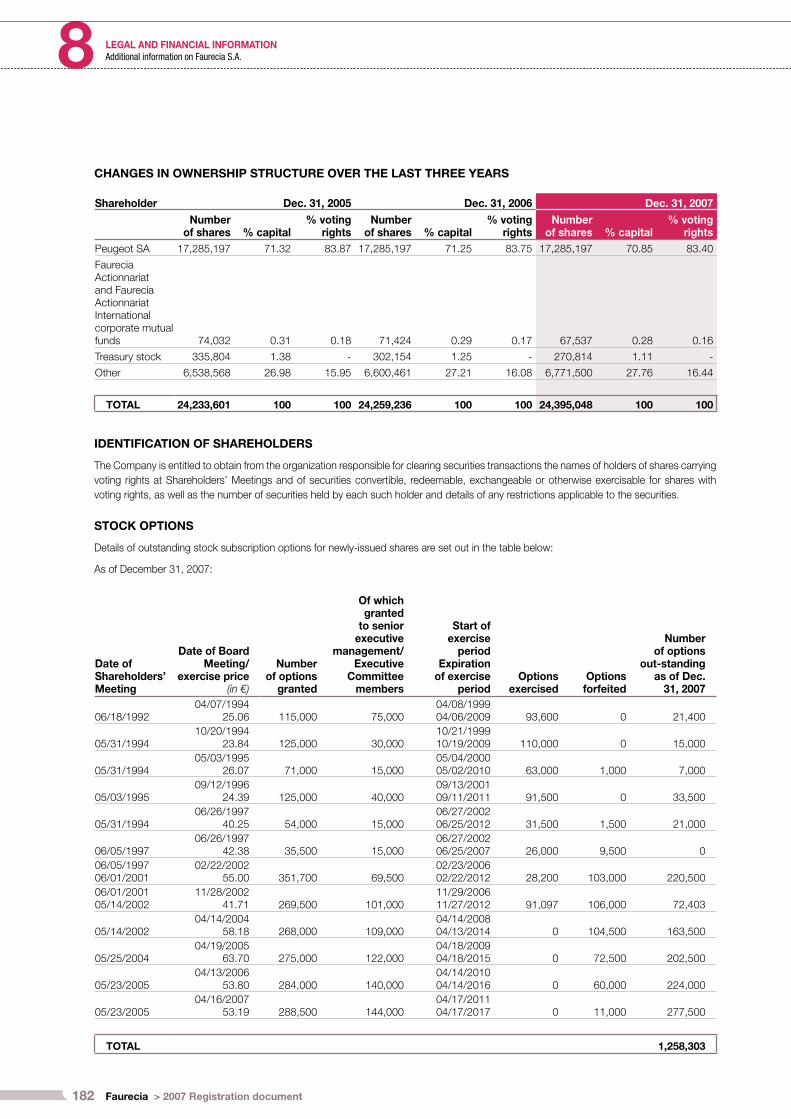
182 Faurecia > 2007 Registration document
LEGAL AND FINANCIAL INFORMATION8 Additional information on Faurecia S.A.
CHANGES IN OWNERSHIP STRUCTURE OVER THE LAST THREE YEARS
Shareholder Dec. 31, 2005 Dec. 31, 2006 Dec. 31, 2007
Number of shares % capital
% voting rights
Number of shares % capital
% voting rights
Number of shares % capital
% voting rights
Peugeot SA 17,285,197 71.32 83.87 17,285,197 71.25 83.75 17,285,197 70.85 83.40
Faurecia Actionnariat and Faurecia Actionnariat International corporate mutual funds 74,032 0.31 0.18 71,424 0.29 0.17 67,537 0.28 0.16
Treasury stock 335,804 1.38 - 302,154 1.25 - 270,814 1.11 -
Other 6,538,568 26.98 15.95 6,600,461 27.21 16.08 6,771,500 27.76 16.44
TOTAL 24,233,601 100 100 24,259,236 100 100 24,395,048 100 100
IDENTIFICATION OF SHAREHOLDERS
The Company is entitled to obtain from the organization responsible for clearing securities transactions the names of holders of shares carrying
voting rights at Shareholders’ Meetings and of securities convertible, redeemable, exchangeable or otherwise exercisable for shares with
voting rights, as well as the number of securities held by each such holder and details of any restrictions applicable to the securities.
STOCK OPTIONS
Details of outstanding stock subscription options for newly-issued shares are set out in the table below:
As of December 31, 2007:
Date of Shareholders’ Meeting
Date of Board Meeting/
exercise price (in €)
Number of options
granted
Of which granted
to senior executive
management/Executive
Committee members
Start of exercise
periodExpiration
of exercise period
Options exercised
Options forfeited
Number of options
out-standing as of Dec.
31, 2007
06/18/199204/07/1994
25.06 115,000 75,00004/08/199904/06/2009 93,600 0 21,400
05/31/199410/20/1994
23.84 125,000 30,00010/21/199910/19/2009 110,000 0 15,000
05/31/199405/03/1995
26.07 71,000 15,00005/04/200005/02/2010 63,000 1,000 7,000
05/03/199509/12/1996
24.39 125,000 40,00009/13/200109/11/2011 91,500 0 33,500
05/31/199406/26/1997
40.25 54,000 15,00006/27/200206/25/2012 31,500 1,500 21,000
06/05/199706/26/1997
42.38 35,500 15,00006/27/200206/25/2007 26,000 9,500 0
06/05/199706/01/2001
02/22/200255.00 351,700 69,500
02/23/200602/22/2012 28,200 103,000 220,500
06/01/200105/14/2002
11/28/200241.71 269,500 101,000
11/29/200611/27/2012 91,097 106,000 72,403
05/14/200204/14/2004
58.18 268,000 109,00004/14/200804/13/2014 0 104,500 163,500
05/25/200404/19/2005
63.70 275,000 122,00004/18/200904/18/2015 0 72,500 202,500
05/23/200504/13/2006
53.80 284,000 140,00004/14/201004/14/2016 0 60,000 224,000
05/23/200504/16/2007
53.19 288,500 144,00004/17/201104/17/2017 0 11,000 277,500
TOTAL 1,258,303
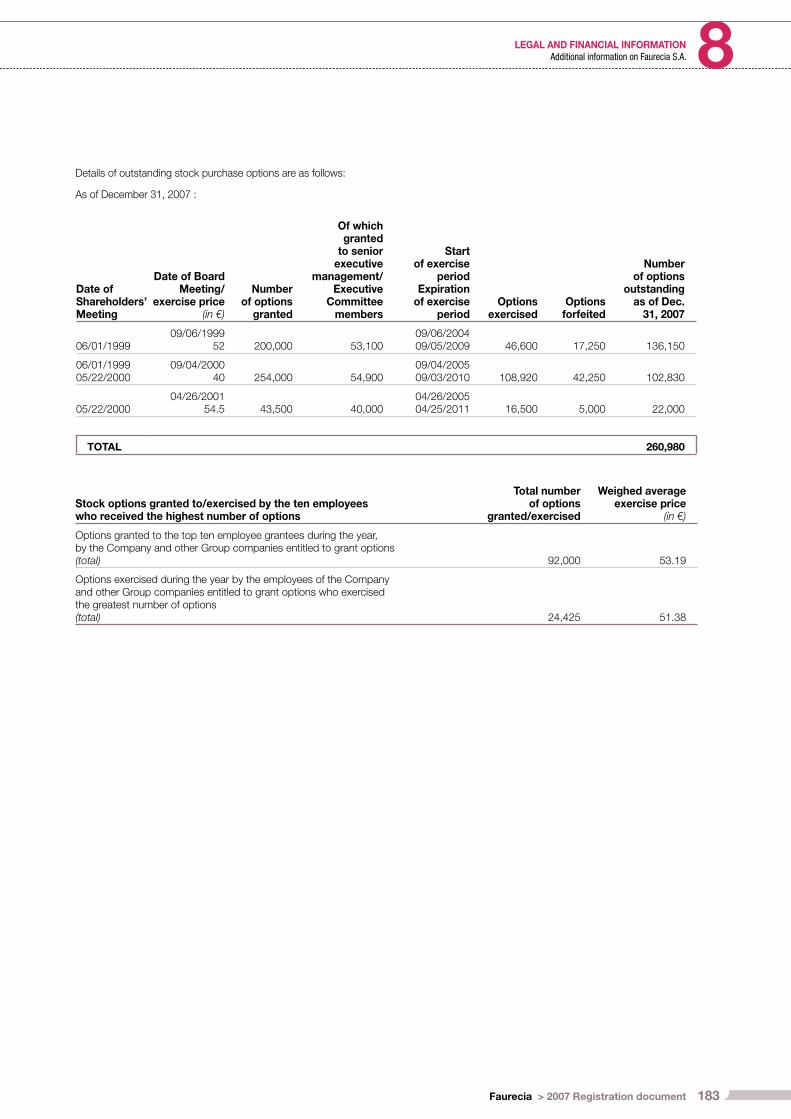
183Faurecia > 2007 Registration document
LEGAL AND FINANCIAL INFORMATION 8Additional information on Faurecia S.A.
Details of outstanding stock purchase options are as follows:
As of De cember 31, 2007 :
Date of Shareholders’ Meeting
Date of Board Meeting/
exercise price (in €)
Number of options
granted
Of which granted
to senior executive
management/Executive
Committee members
Start of exercise
periodExpiration
of exercise period
Options exercised
Options forfeited
Number of options
outstanding as of Dec.
31, 2007
06/01/199909/06/1999
52 200,000 53,10009/06/200409/05/2009 46,600 17,250 136,150
06/01/199905/22/2000
09/04/200040 254,000 54,900
09/04/200509/03/2010 108,920 42,250 102,830
05/22/200004/26/2001
54.5 43,500 40,00004/26/200504/25/2011 16,500 5,000 22,000
TOTAL 260,980
Stock options granted to/exercised by the ten employees who received the highest number of options
Total number of options
granted/exercised
Weighed average exercise price
(in €)
Options granted to the top ten employee grantees during the year, by the Company and other Group companies entitled to grant options(total) 92,000 53.19
Options exercised during the year by the employees of the Company and other Group companies entitled to grant options who exercised the greatest number of options(total) 24,425 51.38

184 Faurecia > 2007 Registration document
LEGAL AND FINANCIAL INFORMATION8 Additional information on Faurecia S.A.
8.3.2.4 Organization chart of Faurecia Group companies
82,55%
Faurecia ExhaustSystems, Inc.
(USA)
100%
Faurecia ExhaustSystems, LLC
(USA)
100%
Faurecia NetherlandsHolding B.V.
(Netherlands)
100%
Faurecia AutomotiveSeating B.V.
(Netherlands)
100%
United PartsExhaust Systems AB
(Sweden)
100%
Faurecia ExhaustSystems AB(Sweden)
100%
19,17%
Sienor(France)
100%
Siemar(France)
100%
Sielest(France)
100%
Siedoubs(France)
100%
Siebret(France)
100%
Ecsa(France)
100%
Faurecia Siègesd'Automobile
(France)
100%
IndustriasCousin Frères, S.L.
(Spain)
50,01%
Sotexo(France)
100%
Société Automobiledu Cuir de Vesoul
(France)
100%
Sieval(France)
100%
Sieto(France)
100%
VanproAssentos Lda.
(Portugal)
50%
Faurecia Sistemas de Interior de Portugal. Componentes Para Automovel S.A.
(Portugal)
100%
Faurecia - Sistemas de Escape Portugal,
Lda (Portugal)
100%
SASAL(Portugal)
100%
EDA - Estofagem de Assentos, Lda
(Portugal)
100%
Faurecia - Assentos de Automovel,
Limitada (Portugal)
100%
BFTC(Turkey)
100%
Teknik Malzeme(Turkey)
50%
Arsed d.o.o.(Slovenia)
50%
Faurecia Walbrzych Sp.Zo.o
(Poland)
100%
Faurecia Fotele Samochodowe Sp.Zo.o (Poland)
100%
Faurecia Components Pisek s.r.o.
(Czech Republic)
100%
Somil S.A.(Uruguay)
50%
Bertrand FaureArgentina S.A.
(Argentina)
50%
PAB S.A.(Argentina)
50%
Faurecia Azin Pars
(Iran)
51%
Faurecia AutomotiveSeatIng Canada Ltd
(Canada)
100%
Faurecia CanadaInvestment Company
(Canada)
100%
Société Tunisienned'Équipements
d'Automobile (Tunisia)
100%
Faurecia-NHKKyushu Co., Ltd(FNQ) (Japan)
19%
Faurecia-NHKCo., Ltd
(FNK) (Japan)
50%
Faurecia - GSK (Wuhan)Automotive Seating
Co Ltd (China)
51%
CFXAS(China)
60%
FaureciaJapan KK(Japan)
100%
FaureciaMidlands Ltd
(UK)
100%
Faurecia AutomotiveSeating UK Ltd
(UK)
100%
Exhaust ServicesMexicana,
S.A. de C.V. (Mexico)
100%
FaureciaExhaust International
(France)
100%
Faurecia Systèmesd'Echappement
(France)
100%
Faurecia Sistemasde Escape Argentina
SA (Argentina)
100%
Faurecia ExhaustSystems s.r.o.
(Czech Republic)
100%
EciaSouth Africa
(South Africa)
100%
Faurecia ExhaustSystems South Africa
(South Africa)
100%
Faurecia TongdaExhaust System
(Wuhan) Co., Ltd (China)
50%
Faurecia HonghuExhaust Systems
Shanghaï Co. Ltd (China)
51%
Tecnoconfort(Spain)
50%
FaureciaLecotex a.s.
(Czech Republic)
100%
Faurecia AutomotiveSeating India
Private Ltd (India)
100%
Société Internationalede Participations (SIP)
(Belgium)
100%
Faurecia SystemyKierownicze Sp.Zo.o
(Poland)
100%
50%
TRECIA(France)
100%
Faurecia Industries,Inc.
(USA)
FaureciaCooling Systems
(France)
FaureciaIndustries(France)
FaureciaBloc Avant(France)
100%
FaureciaServices Groupe
(France)
100%
FinancièreFaurecia(France)
100% 50%
100% 100%
FaureciaUsa Holdings, Inc.
(USA)
17,45%
Faurecia AutomotiveSeating, Inc.
(USA)
100%
Faurecia Interior Systems, Inc.
(USA)
100%
Faurecia Interior Systems Mexico
S.A. de C.V. (Mexico)
100%
FaureciaDuroplast Mexico,
S.A. de CV (Mexico)
100%
Servicios Corporativos dePersonal Especiali-zado,
S.A. de CV (Mexico)
100%
Faurecia AutomotiveGmbH
(Germany)
25,81% 55,02%
FaureciaInvestments
(France)
100%
FAURECIA Simplified organization chart of operating companies
EAK Snc(France)
51%
EAK SAS(France)
51%
Europe North AmericaSouth America, AfricaAsia
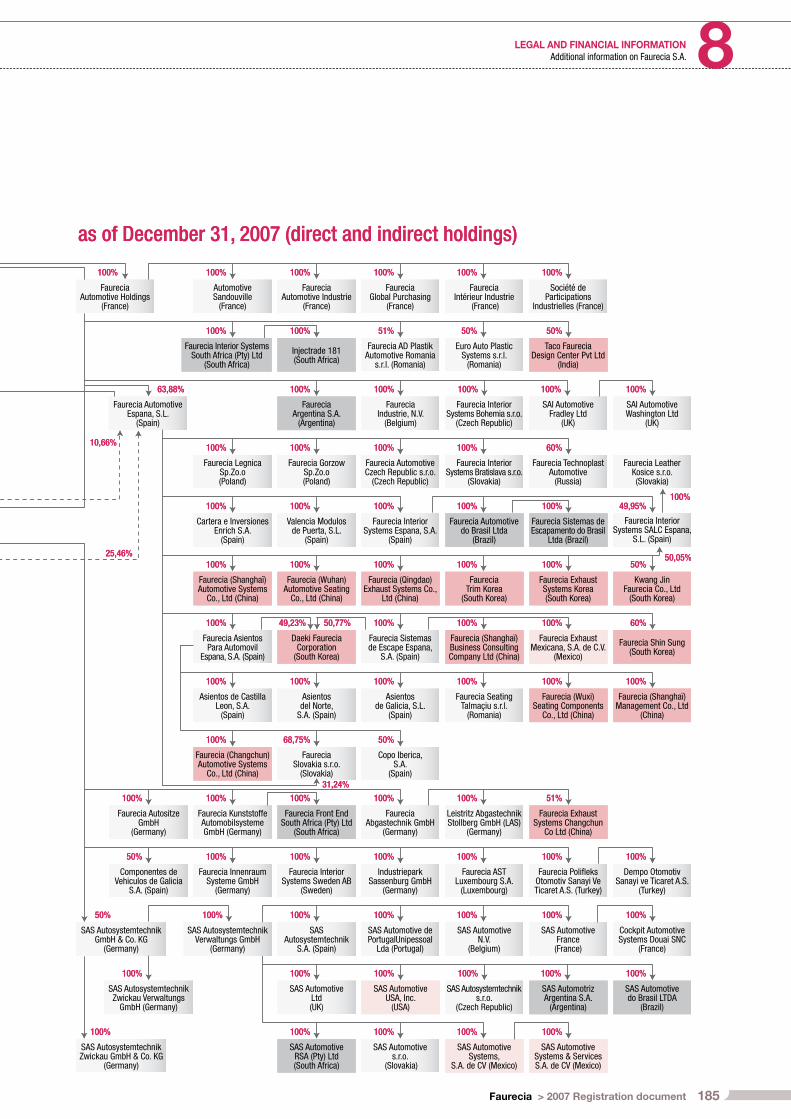
185Faurecia > 2007 Registration document
LEGAL AND FINANCIAL INFORMATION 8Additional information on Faurecia S.A.
100%
Société deParticipations
Industrielles (France)
FaureciaIntérieur Industrie
(France)
FaureciaAutomotive Industrie
(France)
FaureciaGlobal Purchasing
(France)
100% 100% 100%
AutomotiveSandouville
(France)
100%
FaureciaAutomotive Holdings
(France)
100%
50%
Taco FaureciaDesign Center Pvt Ltd
(India)
Euro Auto PlasticSystems s.r.l.
(Romania)
Injectrade 181(South Africa)
Faurecia AD PlastikAutomotive Romania
s.r.l. (Romania)
100% 51% 50%
Faurecia Interior SystemsSouth Africa (Pty) Ltd
(South Africa)
100%
100%
SAI AutomotiveWashington Ltd
(UK)
SAI AutomotiveFradley Ltd
(UK)
FaureciaIndustrie, N.V.
(Belgium)
Faurecia InteriorSystems Bohemia s.r.o.
(Czech Republic)
100% 100% 100%
FaureciaArgentina S.A.
(Argentina)
100%
Faurecia AutomotiveEspana, S.L.
(Spain)
63,88%
10,66%
25,46%
Faurecia LeatherKosice s.r.o.(Slovakia)
60%
Faurecia TechnoplastAutomotive
(Russia)
Faurecia InteriorSystems Bratislava s.r.o.
(Slovakia)
Faurecia GorzowSp.Zo.o(Poland)
Faurecia AutomotiveCzech Republic s.r.o.
(Czech Republic)
100% 100% 100%
Faurecia LegnicaSp.Zo.o(Poland)
100%
49,95%100%
Faurecia InteriorSystems SALC Espana,
S.L. (Spain)
100%
Faurecia Sistemas deEscapamento do Brasil
Ltda (Brazil)
Faurecia Automotivedo Brasil Ltda
(Brazil)
Valencia Modulosde Puerta, S.L.
(Spain)
Faurecia InteriorSystems Espana, S.A.
(Spain)
100% 100% 100%
Cartera e InversionesEnrich S.A.
(Spain)
100%
50%50,05%
Kwang JinFaurecia Co., Ltd
(South Korea)
100%
Faurecia ExhaustSystems Korea(South Korea)
FaureciaTrim Korea
(South Korea)
Faurecia (Wuhan)Automotive Seating
Co., Ltd (China)
Faurecia (Qingdao)Exhaust Systems Co.,
Ltd (China)
100% 100% 100%
Faurecia (Shanghaï)Automotive Systems
Co., Ltd (China)
100%
60%
Faurecia Shin Sung(South Korea)
100%
Faurecia ExhaustMexicana, S.A. de C.V.
(Mexico)
Faurecia (Shanghaï)Business ConsultingCompany Ltd (China)
Daeki FaureciaCorporation
(South Korea)
Faurecia Sistemasde Escape Espana,
S.A. (Spain)
49,23% 100% 100%
Faurecia AsientosPara Automovil
Espana, S.A. (Spain)
100%
100%
Faurecia (Shanghaï)Management Co., Ltd
(China)
100%
Faurecia (Wuxi)Seating Components
Co., Ltd (China)
Faurecia SeatingTalmaçiu s.r.l.
(Romania)
Asientosdel Norte,
S.A. (Spain)
Asientosde Galicia, S.L.
(Spain)
100% 100% 100%
Asientos de CastillaLeon, S.A.
(Spain)
100%
FaureciaSlovakia s.r.o.
(Slovakia)
Copo Iberica,S.A.
(Spain)
68,75% 50%
Faurecia (Changchun)Automotive Systems
Co., Ltd (China)
100%
51%
Faurecia ExhaustSystems Changchun
Co Ltd (China)
Leistritz AbgastechnikStollberg GmbH (LAS)
(Germany)
Faurecia Front EndSouth Africa (Pty) Ltd
(South Africa)
FaureciaAbgastechnik GmbH
(Germany)
100%
31,24%
100% 100%
Faurecia KunststoffeAutomobilsystemeGmbH (Germany)
100%
Faurecia AutositzeGmbH
(Germany)
100%
100%
Dempo OtomotivSanayi ve Ticaret A.S.
(Turkey)
100%
Faurecia PolifleksOtomotiv Sanayi VeTicaret A.S. (Turkey)
Faurecia ASTLuxembourg S.A.
(Luxembourg)
Faurecia InteriorSystems Sweden AB
(Sweden)
IndustrieparkSassenburg GmbH
(Germany)
100% 100% 100%
Faurecia InnenraumSysteme GmbH
(Germany)
100%
Componentes deVehiculos de Galicia
S.A. (Spain)
50%
100%
Cockpit AutomotiveSystems Douai SNC
(France)
100%
SAS AutomotiveFrance
(France)
SAS AutomotiveN.V.
(Belgium)
SASAutosystemtechnik
S.A. (Spain)
SAS Automotive dePortugalUnipessoal
Lda (Portugal)
100% 100% 100%
SAS AutosystemtechnikVerwaltungs GmbH
(Germany)
100%
SAS AutosystemtechnikGmbH & Co. KG
(Germany)
50%
SAS AutosystemtechnikZwickau Verwaltungs
GmbH (Germany)
100%
100%
SAS AutomotiveSystems & ServicesS.A. de CV (Mexico)
SAS AutomotiveSystems,
S.A. de CV (Mexico)
SAS AutomotiveRSA (Pty) Ltd(South Africa)
SAS Automotives.r.o.
(Slovakia)
100% 100% 100%
SAS AutosystemtechnikZwickau GmbH & Co. KG
(Germany)
100%
50,77%
100%
SAS Automotivedo Brasil LTDA
(Brazil)
SAS AutomotrizArgentina S.A.
(Argentina)
SAS AutomotiveUSA, Inc.
(USA)
SAS Autosystemtechniks.r.o.
(Czech Republic)
100% 100% 100%
SAS AutomotiveLtd(UK)
100%
as of December 31, 2007 (direct and indirect holdings)
100%
Société deParticipations
Industrielles (France)
FaureciaIntérieur Industrie
(France)
FaureciaAutomotive Industrie
(France)
FaureciaGlobal Purchasing
(France)
100% 100% 100%
AutomotiveSandouville
(France)
100%
FaureciaAutomotive Holdings
(France)
100%
50%
Taco FaureciaDesign Center Pvt Ltd
(India)
Euro Auto PlasticSystems s.r.l.
(Romania)
Injectrade 181(South Africa)
Faurecia AD PlastikAutomotive Romania
s.r.l. (Romania)
100% 51% 50%
Faurecia Interior SystemsSouth Africa (Pty) Ltd
(South Africa)
100%
100%
SAI AutomotiveWashington Ltd
(UK)
SAI AutomotiveFradley Ltd
(UK)
FaureciaIndustrie, N.V.
(Belgium)
Faurecia InteriorSystems Bohemia s.r.o.
(Czech Republic)
100% 100% 100%
FaureciaArgentina S.A.
(Argentina)
100%
Faurecia AutomotiveEspana, S.L.
(Spain)
63,88%
10,66%
25,46%
Faurecia LeatherKosice s.r.o.(Slovakia)
60%
Faurecia TechnoplastAutomotive
(Russia)
Faurecia InteriorSystems Bratislava s.r.o.
(Slovakia)
Faurecia GorzowSp.Zo.o(Poland)
Faurecia AutomotiveCzech Republic s.r.o.
(Czech Republic)
100% 100% 100%
Faurecia LegnicaSp.Zo.o(Poland)
100%
49,95%100%
Faurecia InteriorSystems SALC Espana,
S.L. (Spain)
100%
Faurecia Sistemas deEscapamento do Brasil
Ltda (Brazil)
Faurecia Automotivedo Brasil Ltda
(Brazil)
Valencia Modulosde Puerta, S.L.
(Spain)
Faurecia InteriorSystems Espana, S.A.
(Spain)
100% 100% 100%
Cartera e InversionesEnrich S.A.
(Spain)
100%
50%50,05%
Kwang JinFaurecia Co., Ltd
(South Korea)
100%
Faurecia ExhaustSystems Korea(South Korea)
FaureciaTrim Korea
(South Korea)
Faurecia (Wuhan)Automotive Seating
Co., Ltd (China)
Faurecia (Qingdao)Exhaust Systems Co.,
Ltd (China)
100% 100% 100%
Faurecia (Shanghaï)Automotive Systems
Co., Ltd (China)
100%
60%
Faurecia Shin Sung(South Korea)
100%
Faurecia ExhaustMexicana, S.A. de C.V.
(Mexico)
Faurecia (Shanghaï)Business ConsultingCompany Ltd (China)
Daeki FaureciaCorporation
(South Korea)
Faurecia Sistemasde Escape Espana,
S.A. (Spain)
49,23% 100% 100%
Faurecia AsientosPara Automovil
Espana, S.A. (Spain)
100%
100%
Faurecia (Shanghaï)Management Co., Ltd
(China)
100%
Faurecia (Wuxi)Seating Components
Co., Ltd (China)
Faurecia SeatingTalmaçiu s.r.l.
(Romania)
Asientosdel Norte,
S.A. (Spain)
Asientosde Galicia, S.L.
(Spain)
100% 100% 100%
Asientos de CastillaLeon, S.A.
(Spain)
100%
FaureciaSlovakia s.r.o.
(Slovakia)
Copo Iberica,S.A.
(Spain)
68,75% 50%
Faurecia (Changchun)Automotive Systems
Co., Ltd (China)
100%
51%
Faurecia ExhaustSystems Changchun
Co Ltd (China)
Leistritz AbgastechnikStollberg GmbH (LAS)
(Germany)
Faurecia Front EndSouth Africa (Pty) Ltd
(South Africa)
FaureciaAbgastechnik GmbH
(Germany)
100%
31,24%
100% 100%
Faurecia KunststoffeAutomobilsystemeGmbH (Germany)
100%
Faurecia AutositzeGmbH
(Germany)
100%
100%
Dempo OtomotivSanayi ve Ticaret A.S.
(Turkey)
100%
Faurecia PolifleksOtomotiv Sanayi VeTicaret A.S. (Turkey)
Faurecia ASTLuxembourg S.A.
(Luxembourg)
Faurecia InteriorSystems Sweden AB
(Sweden)
IndustrieparkSassenburg GmbH
(Germany)
100% 100% 100%
Faurecia InnenraumSysteme GmbH
(Germany)
100%
Componentes deVehiculos de Galicia
S.A. (Spain)
50%
100%
Cockpit AutomotiveSystems Douai SNC
(France)
100%
SAS AutomotiveFrance
(France)
SAS AutomotiveN.V.
(Belgium)
SASAutosystemtechnik
S.A. (Spain)
SAS Automotive dePortugalUnipessoal
Lda (Portugal)
100% 100% 100%
SAS AutosystemtechnikVerwaltungs GmbH
(Germany)
100%
SAS AutosystemtechnikGmbH & Co. KG
(Germany)
50%
SAS AutosystemtechnikZwickau Verwaltungs
GmbH (Germany)
100%
100%
SAS AutomotiveSystems & ServicesS.A. de CV (Mexico)
SAS AutomotiveSystems,
S.A. de CV (Mexico)
SAS AutomotiveRSA (Pty) Ltd(South Africa)
SAS Automotives.r.o.
(Slovakia)
100% 100% 100%
SAS AutosystemtechnikZwickau GmbH & Co. KG
(Germany)
100%
50,77%
100%
SAS Automotivedo Brasil LTDA
(Brazil)
SAS AutomotrizArgentina S.A.
(Argentina)
SAS AutomotiveUSA, Inc.
(USA)
SAS Autosystemtechniks.r.o.
(Czech Republic)
100% 100% 100%
SAS AutomotiveLtd(UK)
100%
as of December 31, 2007 (direct and indirect holdings)

186 Faurecia > 2007 Registration document
LEGAL AND FINANCIAL INFORMATION8 Additional information on Faurecia S.A.
8.3.2.5 Additional information on the audit of the fi nancial statements
A - AUDITORS
Date of fi rst
appointment
Expiration of term
of offi ce
Statutory Auditors
ERNST & YOUNG
represented by Laurent Miannay
member of the Compagnie Régionale de Versailles
11 allée de l’Arche - 92037 Paris La Défense Cedex - France June 17, 1983 2013 AGM
PRICEWATERHOUSECOOPERS AUDIT
represented by Dominique Ménard
member of the Compagnie Régionale de Versailles
63, rue de Villiers - 92208 Neuilly-Sur-Seine - France May 27, 2003 2013 AGM
Alternate Auditors
Auditex May 27, 2003 2013 AGM
Étienne Boris May 23, 2005 2013 AGM
The terms of offi ce of the Statutory and Alternate Auditors were renewed for a period of six years at the Shareholders’ Meeting of May 29,
2007.

187Faurecia > 2007 Registration document
LEGAL AND FINANCIAL INFORMATION 8Additional information on Faurecia S.A.
B - FEES PAID TO THE AUDITORS
Fees paid by Faurecia and its fully consolidated subsidiaries for engagements performed by the Auditors break down as follows:
(in € thousands)
PricewaterhouseCoopers Audit Ernst & Young
Amount (excl. VAT) % %
Amount (excl. VAT) % %
2007 2006 2007 2006 2007 2006 2007 2006
Audit services
Statutory and contractual audits, certifi cation, review of company and consolidated fi nancial statements 1,905 3,099 96.4% 100.0% 2,834 1,906 99.9% 100.0%
Issuing company 349 380 17.7% 12.3% 273 118 9.6% 6.2%
Fully consolidated subsidiaries 1,556 2,719 78.7% 87.7% 2,561 1,788 90.3% 93.8%
Other services relating directly to the statutory audit engagement 33 1.7% 2 0.1%
Issuing company 11 0.6% 2 0.1%
Fully consolidated subsidiaries 22 1.1%
Sub-total 1,938 3,099 98.0% 100.0% 2,836 1,906 100.0% 100.0%
Other services rendered by networks to fully consolidated subsidiaries
Tax, legal and other services (specifi ed if worth > 10% of audit fees) 39 2.0%
Sub-total 39 2.0%
TOTAL 1,977 3,099 100% 100% 2,836 1,906 100% 100%
8.3.3 INFORMATION PUBLISHED ABOUT THE COMPANY
List of information concerning Faurecia and its stock published in 2007 and fi rst-quarter 2008
Date Type of information Publication
February 14, 2007 Fourth-quarter 2006 sales Bulletin des annonces légales obligatoires (BALO no. 20)
April 16, 2007 2006 sales Bulletin des annonces légales obligatoires (BALO no. 46)
April 23, 2007 Notice of 2007 Annual Shareholders’ Meeting Bulletin des annonces légales obligatoires (BALO no. 49)
May 11, 2007 First-quarter 2007 sales Bulletin des annonces légales obligatoires (BALO no. 57)
June 11, 2007 Voting rights Les affi ches parisiennes
August 10, 2007 Second-quarter 2007 sales Bulletin des annonces légales obligatoires (BALO no. 96)
August 10, 2007 Financial statements for fi rst-half 2007 Bulletin des annonces légales obligatoires (BALO no. 96)
September 3, 2007Approval of 2006 fi nancial statements at the 2007
Annual Shareholders’ Meeting Bulletin des annonces légales obligatoires (BALO no. 106)
September 7, 2007 First-half 2007 fi nancial report Bulletin des annonces légales obligatoires (BALO no. 108)
November 12, 2007 Third-quarter 2007 sales Bulletin des annonces légales obligatoires (BALO no. 136)
November 6, 2007Appointment of Isabel Marey-Semper as a Director to replace Sylvie Rucar Petites affi ches
November 6, 2007Increase in the Company’s capital from
€170,055,452 to €170,748,676 Petites affi ches
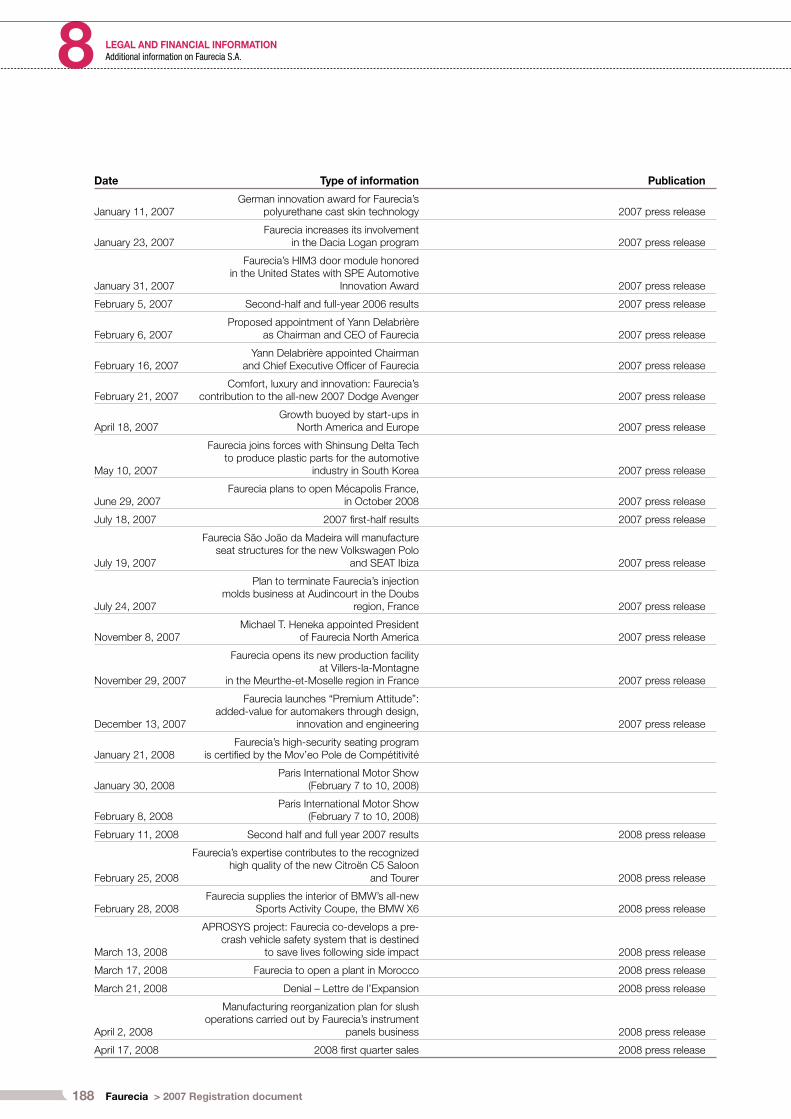
188 Faurecia > 2007 Registration document
LEGAL AND FINANCIAL INFORMATION8 Additional information on Faurecia S.A.
Date Type of information Publication
January 11, 2007German innovation award for Faurecia’s
poly urethane cast skin technology 2007 press release
January 23, 2007Faurecia increases its involvement
in the Dacia Logan program 2007 press release
January 31, 2007
Faurecia’s HIM3 door module honored in the United States with SPE Automotive
Innovation Award 2007 press release
February 5, 2007 Second-half and full-year 2006 results 2007 press release
February 6, 2007Proposed appointment of Yann Delabrière
as Chairman and CEO of Faurecia 2007 press release
February 16, 2007Yann Delabrière appointed Chairman
and Chief Executive Offi cer of Faurecia 2007 press release
February 21, 2007Comfort, luxury and innovation: Faurecia’s
contribution to the all-new 2007 Dodge Avenger 2007 press release
April 18, 2007Growth buoyed by start-ups in
North America and Europe 2007 press release
May 10, 2007
Faurecia joins forces with Shinsung Delta Tech to produce plastic parts for the automotive
industry in South Korea 2007 press release
June 29, 2007Faurecia plans to open Mécapolis France,
in October 2008 2007 press release
July 18, 2007 2007 fi rst-half results 2007 press release
July 19, 2007
Faurecia São João da Madeira will manufacture seat structures for the new Volkswagen Polo
and SEAT Ibiza 2007 press release
July 24, 2007
Plan to terminate Faurecia’s injection molds business at Audincourt in the Doubs
region, France 2007 press release
November 8, 2007Michael T. Heneka appointed President
of Faurecia North America 2007 press release
November 29, 2007
Faurecia opens its new production facility at Villers-la-Montagne
in the Meurthe-et-Moselle region in France 2007 press release
December 13, 2007
Faurecia launches “Premium Attitude”: added-value for automakers through design,
innovation and engineering 2007 press release
January 21, 2008Faurecia’s high-security seating program
is certifi ed by the Mov’eo Pole de Compétitivité
January 30, 2008Paris International Motor Show
(February 7 to 10, 2008)
February 8, 2008Paris International Motor Show
(February 7 to 10, 2008)
February 11, 2008 Second half and full year 2007 results 2008 press release
February 25, 2008
Faurecia’s expertise contributes to the recognized high quality of the new Citroën C5 Saloon
and Tourer 2008 press release
February 28, 2008Faurecia supplies the interior of BMW’s all-new
Sports Activity Coupe, the BMW X6 2008 press release
March 13, 2008
APROSYS project: Faurecia co-develops a pre-crash vehicle safety system that is destined
to save lives following side impact 2008 press release
March 17, 2008 Faurecia to open a plant in Morocco 2008 press release
March 21, 2008 Denial – Lettre de l’Expansion 2008 press release
April 2, 2008
Manufacturing reorganization plan for slush operations carried out by Faurecia’s instrument
panels business 2008 press release
April 17, 2008 2008 fi rst quarter sales 2008 press release

CONTENTS
COMBINED SHAREHOLDERS’ GENERAL MEETING
OF MAY 27, 2008
9
189Faurecia > 2007 Registration document
9.1 Statutory Auditors’ reports 190
9.2 Agenda 192
9.3 Draft resolutions 192
190 Faurecia > 2007 Registration document
COMBINED SHAREHOLDERS’ GENERAL MEETING OF MAY 27, 20089 Statutory Auditors’ reports
STATUTORY AUDITORS’ REPORT ON THE ISSUE OF SHARES AND
OTHER SECURITIES WITH/WITHOUT PRE-EMPTIVE SUBSCRIPTION
RIGHTS FOR EXISTING SHAREHOLDERS
This is a free translation into English of the Statutory Auditors’ special report on the issue of shares and other securities with/without pre-
emptive subscription rights for existing shareholders issued in the French language and is provided solely for the convenience of English
speaking readers. This report should be read in conjunction with, and construed in accordance with, French law and professional auditing
standards applicable in France.
(sixth and seventh resolutions of the Ordinary and Extraordinary Shareholders’ Meeting of May 27, 2008)
To the shareholders,
In our capacity as Statutory Auditors of Faurecia S.A., and in accordance with Articles L. 225-135 and L. 228-92 of the French Commercial
Code (Code de commerce), we present below our report on the authorizations sought by the Board of Directors to issue shares and/or
securities carrying rights to shares.
Based on its report, the Board of Directors is inviting shareholders to grant it a twenty-six month authorization to increase the Company’s
capital and set the related terms and conditions. Said capital increases would be carried out as follows:
by issuing ordinary shares and/or securities carrying rights to shares in the Company and/or equity warrants exercisable for the Company’s
shares, with pre-emptive subscription rights for existing shareholders (sixth resolution);
by issuing ordinary shares and/or securities carrying rights to shares in the Company and/or to debt securities, without pre-emptive
subscription rights for existing shareholders (seventh resolution).
The maximum aggregate par value of the shares that may be issued under the sixth and seventh resolutions, directly or on the conversion,
exchange, redemption or exercise of securities carrying rights to shares, may not exceed €61 million. The maximum nominal amount of debt
securities that may be issued under said resolutions is set at €1 billion.
The Board of Directors is responsible for drawing up a report in compliance with Articles R. 225-113 and R. 225-114 of the French Commercial
Code. Our responsibility is to express an opinion on the fairness of the fi nancial information taken from the fi nancial statements, on the
proposal to waive shareholders’ pre-emptive subscription rights and on certain other information about the capital increases given in the
Board’s report.
We performed our procedures in accordance with professional guidelines applicable in France. Those guidelines require us to perform the
necessary procedures to check the information contained in the Board of Directors’ report about these operations and the method to be used
to determine the price of the securities to be issued.
Subject to our review of the fi nal terms and conditions of any share issues decided by the Board, we have no observations to make on the
proposed method of determining the issue price for securities to be issued under the seventh resolution, as described in the Board’s report.
As the method for determining the issue price for securities to be issued under the sixth resolution has not been described in the Board’s
report we cannot give an opinion on whether said method is appropriate.
Furthermore, as the issue price for securities to be issued under both the sixth and seventh resolutions has not been set, we are not in a
position to express an opinion on the fi nal terms and conditions of the future issues, and consequently, on the proposal made to shareholders
in the seventh resolution to waive their pre-emptive subscription rights.
In accordance with Article R. 225-116 of the French Commercial Code, we will prepare a further report if and when the Board uses these
authorizations to issue shares and/or securities carrying rights to shares.
Neuilly-sur-Seine and Paris-La Défense, April 9, 2008
The Statutory Auditors
PricewaterhouseCoopers Audit Ernst & Young Audit
Dominique Ménard Laurent Miannay
•
•
191Faurecia > 2007 Registration document
COMBINED SHAREHOLDERS’ GENERAL MEETING OF MAY 27, 2008 9Statutory Auditors’ reports
STATUTORY AUDITORS’ REPORT ON EMPLOYEE RIGHTS ISSUES
This is a free translation into English of the Statutory Auditors’ special report on employee rights issues issued in the French language and is
provided solely for the convenience of English speaking readers. This report should be read in conjunction with, and construed in accordance
with, French law and professional auditing standards applicable in France.
(eighth resolution of the Ordinary and Extraordinary Shareholders’ Meeting of May 27, 2008)
To the shareholders,
In our capacity as Statutory Auditors of Faurecia S.A., and in accordance with Articles L. 225-135 et seq. of the French Commercial Code
(Code de commerce), we present below our report on the proposed issue of shares, without pre-emptive subscription rights for existing
shareholders, to be offered to employees of Faurecia, representing a maximum amount of €5,120,000.
This resolution is being submitted for shareholder approval in application of Article L. 225-129-6 of the French Commercial Code and Article
L. 443-5 of the French Labor Code (Code du travail).
On the basis described in its report, the Board of Directors is seeking a twenty-six month authorization to set the terms and conditions of the
employee rights issue(s) and is proposing that shareholders waive their pre-emptive subscription rights.
The Board of Directors is responsible for drawing up a report in compliance with Articles R. 225-113 and R. 225-114 of the French Commercial
Code. Our responsibility is to express an opinion on the fairness of the fi nancial information taken from the fi nancial statements, on the proposal
to waive shareholders’ pre-emptive subscription rights and on certain other information about the rights issue(s) given in the Board’s report.
We performed our procedures in accordance with professional guidelines applicable in France. Those guidelines require us to perform the
necessary procedures to check the information contained in the Board of Directors’ report about these operations and the method to be used
to determine the price of the shares to be issued.
Subject to our review of the fi nal terms and conditions of any employee rights issue(s) decided by the Board, we have no observations to make
on the proposed method of determining the issue price of the shares to be issued, as described in the Board’s report.
As the issue price has not been set, we are not in a position to express an opinion on the fi nal terms and conditions of any future employee
rights issues, and consequently, on the proposal made to shareholders to waive their pre-emptive subscription rights.
In accordance with Article R. 225-116 of the French Commercial Code, we will prepare a further report if and when the Board uses this
authorization to carry out employee rights issue(s).
Neuilly-sur-Seine and Paris-La Défense, April 9, 2008
The Statutory Auditors
PricewaterhouseCoopers Audit Ernst & Young Audit
Dominique Ménard Laurent Miannay

192 Faurecia > 2007 Registration document
COMBINED SHAREHOLDERS’ GENERAL MEETING OF MAY 27, 20089 Draft resolutions
RESOLUTIONS PRESENTED TO THE ORDINARY SHAREHOLDERS’
MEETING
I - ORDINARY RESOLUTIONS
1. Approval of the parent company and consolidated fi nancial statements and reports of the Board of Directors and the Statutory Auditors.
2. Appropriation of 2007 net income.
3. Approval of the Statutory Auditors’ special report on regulated agreements.
4. Ratifi cation of the appointment of a Director.
5. Powers for formalities.
RESOLUTIONS PRESENTED TO THE EXTRAORDINARY
SHAREHOLDERS’ MEETING
6. Authorization for the Board of Directors to issue shares and/or securities carrying rights to shares in the Company, with pre-emptive
subscription rights for existing shareholders.
7. Authorization for the Board of Directors to issue shares and/or securities carrying rights to shares in the Company, without pre-emptive
subscription rights for existing shareholders.
8. Authorization for the Board of Directors to carry out employee rights issues.
9. Powers to carry out formalities.
First resolution
Approval of parent company and consolidated fi nancial statements and reports of the Board of Directors and the Statutory Auditors.
Having reviewed the Board of Directors’ management report and the Statutory Auditors’ general report, the Shareholders’ Meeting approves
said reports in their entirety, as well as the parent company and consolidated fi nancial statements for the year ended December 31, 2007,
as presented.
193Faurecia > 2007 Registration document
COMBINED SHAREHOLDERS’ GENERAL MEETING OF MAY 27, 2008 9Draft resolutions
Second resolution
Appropriation of 2007 net income.
Based on the Board of Directors’ recommendation, the Shareholders’ Meeting resolves to appropriate the parent company’s net income for
the year ended December 31, 2007 as follows (in euros):
Net income for the year 77,154,195,96
Appropriation to the legal reserve 128,097.91
Appropriation to retained earnings 77,026,098.05
As required by law, it is hereby noted that dividends paid in the last three years were as follows:
YearNumber of shares carrying
dividend rightsNet dividend
(in €) Tax credit
Aggregate payment
(in €)
2004 24,212,051 1.10 - 1.10
2005 24,233,601 - - -
2006 24,259,236 - - -
Third resolution
Approval of the Statutory Auditors’ special report on regulated agreements.
Having reviewed the special report drawn up by the Statutory Auditors on agreements governed by Articles L. 225-38 et seq. of the French
Commercial Code, the Shareholders’ Meeting takes note of this report and approves the terms and conclusions thereof.
Fourth resolution
Ratifi cation of the appointment of a Director.
The Shareholders’ Meeting acknowledges the resignation of Sylvie Rucar and resolves to ratify the appointment of Isabel Marey-Semper as
Director for the remaining term of Sylvie Rucar’s offi ce, expiring at the Ordinary Shareholders’ Meeting to be held in 2013 to approve the 2012
fi nancial statements.
Fifth resolution
Powers to carry out formalities.
Full powers are given to the bearer of a copy or extract of these minutes in order to:
- carry out all fi lings, publications and other formalities;
- sign all instruments and documents and take all other necessary actions.

194 Faurecia > 2007 Registration document
COMBINED SHAREHOLDERS’ GENERAL MEETING OF MAY 27, 20089 Draft resolutions
II - EXTRAORDINARY RESOLUTIONS
Sixth resolution
Authorization for the Board of Directors to issue shares and/or securities carrying rights to shares in the Company, with pre-emptive subscription
rights for existing shareholders.
Having reviewed the Board of Directors’ report and the Statutory Auditors’ special report, based on the Auditors’ report and in accordance
with Article L. 225-129 et seq. of the French Commercial Code, the Shareholders’ Meeting:
I - Grants the Board of Directors a 26-month authorization as from the date of this Meeting to increase the Company’s capital on
one or more occasions as follows:
a) by issuing, in France or abroad, shares and/or securities carrying immediate or deferred rights to shares in the Company and/or equity
warrants exercisable for the Company’s shares, on a stand-alone basis or attached to securities issued by Faurecia. Shares issued under
this authorization shall be denominated in euros and other securities may be denominated either in euros or in a foreign currency;
b) by capitalizing income, reserves or additional paid-in capital through granting bonus shares or raising the par value of existing shares:
- any shares issued under this authorization shall rank pari passu with all existing shares, except for differences in cum-rights dates.
II - Resolves that:
The aggregate par value of the shares to be issued directly and/or on conversion, exchange, redemption or exercise of other securities
issued pursuant to this authorization must not have the effect of increasing the Company’s capital to above €231,765,336 from its current
level of €170,765,336. This ceiling includes the par value of any additional shares to be issued to protect the rights of holders of existing
securities, but does not include any issue and/or redemption premiums.
III - Resolves that:
The maximum nominal amount of debt securities issued under this authorization that carry rights to the Company’s shares may not exceed
€1,000,000,000.
IV - Resolves that:
Existing shareholders shall have a pre-emptive right to subscribe for the shares and/or other securities issued under this authorization,
pro-rata to their existing holdings.
V - Resolves that:
a) any securities not taken up by shareholders exercising their pre-emptive rights may be offered to the public;
b) in the case of a capital increase carried out by capitalizing income, reserves or additional paid-in capital, any rights to fractions of shares
shall be non-transferable and non-tradable and that the corresponding shares will be sold, with the sale proceeds allocated among the
rights holders within 30 days of the date when the whole number of shares allotted to them is recorded in their securities account;
c) if the Company issues complex securities, existing shareholders shall have no pre-emptive rights to subscribe for the shares to be issued
to the holders of these securities.
VI - The Shareholders’ Meeting gives the Board of Directors full powers to:
- decide on the type of securities to be issued based on fi nancial opportunities in France or abroad, and to set the terms and conditions for
their issue in accordance with the applicable laws and regulations;
- place on record the capital increase(s) carried out under this authorization and amend the Company’s bylaws accordingly;
- carry out all publication and other formalities, enter into any and all agreements with fi nancial institutions related to the issue(s), make any
consequent amendments to the Company’s bylaws, and generally take all other necessary actions.
VII - This authorization supersedes the authorizations to increase the Company’s capital given to the Board of Directors by the
Shareholders’ Meeting of May 22, 2006.
195Faurecia > 2007 Registration document
COMBINED SHAREHOLDERS’ GENERAL MEETING OF MAY 27, 2008 9Draft resolutions
Seventh resolution
Authorization for the Board of Directors to issue shares and/or securities carrying rights to shares in the Company, without pre-emptive
subscription rights for existing shareholders.
Having reviewed the Board of Directors’ report and the Statutory Auditors’ special report, the Shareholders’ Meeting authorizes the Board
of Directors to issue shares and/or securities carrying immediate or deferred rights to shares in the Company, subject to the ceiling set in
paragraph II of the sixth resolution above. Said issue(s) shall be denominated in euros and may be carried out on one or more occasions, in
France or abroad. Any such issues may be made without pre-emptive subscription rights for existing shareholders where deemed appropriate
by the Board of Directors.
The maximum nominal amount of debt securities issued under this authorization that carry rights to the Company’s shares may not exceed
€1,000,000,000. This ceiling is not cumulative with that set in paragraph III of the sixth resolution above.
The Shareholders’ Meeting resolves that the Board of Directors may offer existing shareholders a priority right to subscribe for any issues
carried out under this authorization, in accordance with Article L. 225-135 of the French Commercial Code.
This authorization is given to the Board of Directors for a period of twenty-six months as from the date of this Meeting.
The shareholders expressly waive their pre-emptive subscription rights in the event that the Board of Directors uses this authorization, and
note that the price of the shares to be issued on the purchase, conversion, exchange or exercise of warrants shall equal at least the average
weighted price of the Faurecia share on the Paris stock exchange over the three trading days preceding the pricing date, less a maximum
discount of 5%.
Eighth resolution
Authorization for the Board of Directors to carry out employee rights issues.
Having reviewed the Board of Directors’ report and the Statutory Auditors’ special report, in accordance with Article L. 225-129-6 of the
French Commercial Code, the Shareholders’ Meeting authorizes the Board of Directors to increase the Company’s capital by carrying out
employee rights issues, on one or more occasions and at its sole discretion, subject to the conditions set out in Article L. 443-5 of the French
Labor Code. The maximum nominal amount of said capital increase(s) may not exceed €5,120,000.
The Shareholders’ Meeting gives the Board of Directors full powers to determine the timing and amount of any such capital increase(s) –
subject to the authorized ceiling – as well as the terms and conditions thereof. It also authorizes the Board to set (i) the issue price for the
newly-issued shares in accordance with Article L. 443-5 of the French Labor Code; (ii) the conditions for paying up the shares; and (iii) the
subscription terms and period.
The Board of Directors shall have full powers to carry out all measures and formalities related to the capital increase(s), amend the Company’s
bylaws to refl ect the new capital and take all other necessary actions.
This authorization is given for a period of twenty-six months as from the date of this Meeting.
Ninth resolution
Powers to carry out formalities.
Full powers are given to the bearer of a copy or extract of the minutes of this Meeting in order to:
- carry out all fi lings, publications and other formalities,
- sign all instruments and documents and take all other necessary actions.

196 Faurecia > 2007 Registration document
COMBINED SHAREHOLDERS’ GENERAL MEETING OF MAY 27, 20089
CROSS-REFERENCE TABLE
197Faurecia > 2007 Registration document

198 Faurecia > 2007 Registration document
CROSS-REFERENCE TABLE
1. PERSONS RESPONSIBLE 4
2. STATUTORY AUDITORS 3, 70; 186-187
3. SELECTED FINANCIAL INFORMATION 2
4. RISK FACTORS 15-17; 124-129
5. INFORMATION ABOUT THE ISSUER
5.1 History and development of the issuer 169-170
5.2 Investments14; 20; 90-93; 94-95;
100-102
6. BUSINESS OVERVIEW
6.1 Principal activities 6-11; 20-25
6.2 Principal markets 89; 93
6.3 Exceptional factors 61; 111
6.4 Possible dependency: patents, licenses, industrial, commercial or fi nancial contracts 17
6.5 The basis for any statements made by the issuer regarding its competitive position 8-11
7. ORGANIZATIONAL STRUCTURE 184-185
7.1 Brief description of the Group 6-7; 68; 169-170
7.2 List of signifi cant subsidiaries 132-135; 156-157; 184-185
8. PROPERTY, PLANT AND EQUIPMENT
8.1 Existing or planned material tangible fi xed assets 173
8.2A description of any environmental issues that may affect the issuer’s utilization of the tangible fi xed assets 49-57
9. OPERATING AND FINANCIAL REVIEW
9.1 Financial condition 14
9.2 Operating results 12
10. CAPITAL RESOURCES
10.1 Information concerning the issuer’s capital resources 72; 180-183
10.2 Sources and amounts of cash fl ows 14; 80
10.3 Information on borrowing requirements and funding structure 15-16; 117-118
10.4Information regarding any restrictions on the use of capital resources that have materially affected, or could materially affect the issuer’s operations 16 ; 117 -118
10.5 Information regarding the anticipated sources of funds required for planned investments 14
11. RESEARCH AND DEVELOPMENT, PATENTS AND LICENSES 19-25
12. TREND INFORMATION 61
13. PROFIT FORECASTS OR ESTIMATES n/a
14.ADMINISTRATIVE, MANAGEMENT, AND SUPERVISORY BODIES AND SENIOR MANAGEMENT
14.1 Members of the administrative, management or supervisory bodies 64-69; 171; 172-179
14.2Administrative, management, and supervisory bodies and senior management confl icts of interests 173
15 REMUNERATION AND BENEFITS
15.1 The amount of remuneration paid and benefi ts in kind 66-67; 69; 130; 154
15.2The total amounts set aside or accrued by the issuer or its subsidiaries to provide pension, retirement or similar benefi ts 111-115
16. BOARD PRACTICES
16.1 Expiry date of current terms of offi ce 174-179
16.2Service contracts between members of the administrative, management or supervisory bodies and the Company 173

199Faurecia > 2007 Registration document
CROSS-REFERENCE TABLE
16.3 Information about the issuer’s Audit Committee and Remuneration Committee 65-66; 162-163
16.4 Corporate governance regime 63; 70
17. EMPLOYEES
17.1 Number of employees 2; 40-47
17.2 Shareholdings and stock options 38-39; 107-108; 182-183
17.3 Description of any arrangements for involving the employees in the capital of the issuer 38-39
18. MAJOR SHAREHOLDERS
18.1 Any shareholder owning over 5% of the Company’s capital 72
18.2 Different voting rights 72; 172; 182
18.3 Control of the Company 64; 72; 182
18.4A description of any arrangements, known to the issuer, the operation of which may at a subsequent date result in a change in control of the issuer 173
19. RELATED PARTY TRANSACTIONS 130; 154; 161
20.FINANCIAL INFORMATION CONCERNING THE ISSUER’S ASSETS AND LIABILITIES, FINANCIAL POSITION AND PROFITS AND LOSSES
20.1 Historical fi nancial information 5; 77-82; 140-142; 158
20.2 Pro forma fi nancial information n/a
20.3 Financial statements 75-135; 140-157
20.4 Auditing of historical annual fi nancial information 136; 158
20.5 Age of latest fi nancial information 71
20.6 Interim and other fi nancial information 188
20.7 Dividend policy 73; 74; 171
20.8 Legal and arbitration proceedings 17; 111
20.9 Signifi cant change in the issuer’s fi nancial or trading position n/a
21. ADDITIONAL INFORMATION
21.1 Share capital 72; 180-183
21.2 Memorandum and articles of association 171
21.2.1 A description of the issuer’s objects and purposes 171
21.2.2A description of the rights, preferences and restrictions attached to each class of the existing shares 172
21.2.3A description of what action is necessary to change the rights of holders of the shares, indicating where the conditions are more signifi cant than is required by law 171-172
21.2.4A description of the conditions governing the manner in which Annual General Meetings and Extraordinary General Meetings of Shareholders are called 172
21.2.5An indication of the articles of association, statutes, charter or bylaw provisions, if any, governing the ownership threshold above which shareholder ownership must be disclosed 172
21.2.6
A description of the conditions imposed by the memorandum and articles of association, statutes, charter or bylaws governing changes in the capital, where such conditions are more stringent than is required by law 171-172
22. MATERIAL CONTRACTS 173
23.THIRD PARTY INFORMATION AND STATEMENT BY EXPERTS AND DECLARATIONS OF ANY INTEREST n/a
24. DOCUMENTS ON DISPLAY 171
25. INFORMATION ON HOLDINGS 156-157
200 Faurecia > 2007 Registration document
CROSS-REFERENCE TABLE
STATEMENT BY THE PERSON RESPONSIBLE FOR THE REGISTRATION DOCUMENT 4
MANAGEMENT REPORT
Analysis of the results, fi nancial position and risks of the parent company and the Group and a list of authorizations concerning capital increases (disclosed in accordance with Article L. 225-100 and L. 225-100-2 of the French Commercial Code)
6-61; 64-67; 71-74; 138-139; 171-173; 180-183
Disclosures required pursuant to Article L. 225-100-3 of the French Commercial Code concerning factors that could affect a public tender offer 171
Information on share buyback programs (as required under paragraph 2 of Article L. 225-211 of the French Commercial Code) n/a
FINANCIAL STATEMENTS
Parent company fi nancial statements 140-157
Statutory Auditors’ report on the parent company fi nancial statements 160
Consolidated fi nancial statements 75-135
Statutory Auditors’ report on the consolidated fi nancial statements 136

Design and creation:
BUSINESS REVIEW AND RESULTS OF OPERATIONS
1.1 Business review 6
1.2 Results of operations 12
1.3 Financial structure and debt 14
1.4 Outlook 14
1.5 Risk management 15
RESEARCH & DEVELOPMENT
2.1 Automaker Expectations 21
2.2 Innovation 22
2.3 Product Planning 23
2.4 Engineering Productivity 24
2.5 Premium Attitude 25
HUMAN RESOURCES
3.1 Safety in the workplace 28
3.2 Skills development 32
3.3 Strengthening economic
and social dialogue 36
3.4 Employee incentive plans 38
ENVIRONMENT
4.1 Faurecia’s products
and the environment 51
4.2 Faurecia’s manufacturing sites
and the environment 54
QUALITY
5.1 Breakthrough Quality Plan 60
5.2 Customer Awards 61
5.3 Outlook for 2008 61
CORPORATE GOVERNANCE
6.1 Board of Directors 64
6.2 Executive Committee 68
6.3 Auditing of Accounts 70
6.4 Faurecia and its Shareholders 71
FAURECIA – CONSOLIDATED FINANCIAL STATEMENTS
7.1 Consolidated income statements 77
7.2 Consolidated balance sheets 78
7.3 Consolidated cash fl ow statements 80
7.4 Statement of changes in
consolidated shareholders’ equity 81
7.5 Notes to the consolidated fi nancial
statements 82
7.6 Consolidated companies as of
December 31, 2007 132
7.7 Statutory Auditors’ reporton the
consolidatedfi nancial statements 136
LEGAL AND FINANCIAL INFORMATION
8.1 Faurecia S.A. 138
8.2 Internal control 162
8.3 Additional information
on Faurecia S.A. 169
COMBINED SHAREHOLDERS’ GENERAL MEETING OF MAY 27, 2008
9.1 Statutory Auditors’ reports 190
9.2 Agenda 192
9.3 Draft resolutions 192
CROSS-REFERENCE TABLE 197

FAU
REC
IA -
20
07
REG
ISTR
ATIO
N D
OC
UM
ENT


