295
HUMPHREY ® FIELD ANALYZER II USER’S GUIDE Model 720 • 730 • 735 • 740 • 745 • 750

HUMPHREY®
FIELD ANALYZER II USER’S GUIDE
Model 720 • 730 • 735 • 740 • 745 • 750

Humphrey SystemsA Division of Carl Zeiss, Inc.5160 Hacienda DriveDublin, CA 94568
General Inquiries (925) 557-4100(877) 486-7473
Customer Service (800) 341-6968
Copyright© 1994, 1998 Humphrey Systems. All rights reserved.
TrademarksHumphrey Field Analyzer is a registered trademark of Humphrey Systems. STATPAC, FastPac, and SITA are trademarks of Humphrey Systems.Hewlett-Packard and LaserJet are registered trademarks of Hewlett-Packard Corporation. Windows is a trademark of Microsoft Corporation. IBM is aregistered trademark of the International Business Machines Corporation. GoPrint is a trademark of the AeroComm company.
Every effort has been made to ensure that the information contained in this manual is true and correct at the time of printing. Any omissions or errorsare unintentional and will be corrected in future releases.
This book may not be reproduced in whole or in part by any means of information storage, retrieval, or reproduction without written permission fromHumphrey Systems.

Humphrey® Field Analyzer IIRevision Control
PART NUMBER REVISION TITLE RELEASE DATE
29900-1 A Humphrey® Field Analyzer II 7-1994User’s GuideModels 730, 740, 750
47653-1 A Humphrey® Field Analyzer II 10-1998User’s GuideModels 720, 730, 735, 740, 745, 750
• Contains information pertaining tosoftware revisions through A10.

Introduction/Instrument Setup 1-1
About Visual Fields 1-2
The Humphrey Advantage 1-5
Using This Guide 1-8
Safety Precautions 1-9
System Components 1-11
Optional Components 1-14
System Assembly 1-16
General Operation 2-1
General Information 2-2
The Main Menu Screen 2-9
System Setup 2-10
Additional Setup 2-21
Help Screens 2-23
Setting-up Tests 3-1
Selecting the Test Pattern and Test Eye 3-2
Entering Patient Data 3-8
Using Trial Lenses 3-19
Preparing the Patient 3-22
Test Parameters & Strategies 4-1
Setting Test Parameters 4-2
Test Strategies 4-4
SITA™ Testing 4-10
Blue-Yellow (SWAP) Testing 4-11
Alternate Color Testing 4-16
Table of Contents (this manual contains 296 pages)
REV. A10 9/98 PN 47653 HUMPHREY FIELD ANALYZER IIREV. A 10/98 PN 47653-1 HUMPHREY FIELD ANALYZER II
1Introduction/Instrument Setup
(16 pages)
2GeneralOperation
(24 pages)
3Setting-upTests
(24 pages)
4Test Parameters &Strategies
(16 pages)

Testing 5-1
Start Test Options 5-2
Monitoring and Maintaining the Patient’s Eye Position 5-4
Supplemental Testing 5-7
Test In Progress 5-10
Test Complete Options 5-14
Testing: A Step-by-Step Guide 5-16
Test Reliability 6-1
Factors Affecting Reliability 6-2
Patient Compliance 6-2
Patient Fixation 6-3
Trial Lenses 6-3
Evaluating Reliability 6-4
Fixation Losses 6-4
False Positive Errors 6-4
False Negative Errors 6-6
Fluctuation Values 6-6
STATPAC Analysis & Printing Results 7-1
Introduction to STATPAC Analysis 7-2
Threshold Test Printout Formats 7-4
SITA Printout Formats 7-21
Blue-Yellow Printout Formats 7-23
Printing Current Threshold Test Results 7-25
Screening Printout Formats 7-26
Printing Current Screening Test Results 7-27
Printing Previously Saved Test Results 7-28
Grayscale Symbols 7-30
Remote Printer Access 7-30
REV. A10 9/98 PN 47653 HUMPHREY FIELD ANALYZER IIREV. A 10/98 PN 47653-1 HUMPHREY FIELD ANALYZER II
5Testing
(18 pages)
6TestReliability
(8 pages)
7STATPAC Analysis &Printing Results
(30 pages)
File Functions 8-1
File Functions Menu 8-2
Retrieving the File Directory 8-4
Selecting Tests from the Directory 8-6
Performing File Functions 8-11
External 5.25" Floppy Drive 8-18
Organizing Patient Files 8-22
Database Management 9-1
Introduction to Database Management 9-2
Patient Database Protection Procedures 9-3
Configuration Backup and Restore 9-8
How to Handle Database Failures 9-13
Merge Database 9-23
Cleanup Hard Disk Database 9-24
Practices with Multiple Humphrey Field Analyzers 9-25
Care and Handling of Removable Storage Media 9-25
Custom Testing 10-1
Creating Custom Tests 10-2
Deleting Custom Tests 10-15
Performing Custom Tests 10-17
Printout Format 10-19
Kinetic Testing 11-1
Performing Kinetic Tests 11-2
Viewing Kinetic Tests 11-23
Printing Kinetic Tests 11-26
8FileFunctions
(22 pages)
9DatabaseManagement
(26 pages)
10CustomTesting
(20 pages)
REV. A 10/98 PN 47653-1 HUMPHREY FIELD ANALYZER II
11KineticTesting
(30 pages)

Care & Cleaning 12-1
General Use Principles 12-2
Cleaning the HFA II 12-2
Replacing Parts 12-4
Operating the Printrex Printer 12-10
Touch Screen Calibration 12-12
Using Floppy Disks 12-13
A HFA II Product Specifications A-1
B Warranty Statement and Notification of Copyright B-1
C Icon Glossary C-1
D Goldmann Conversion Tables D-1
E Test Patterns E-1
F Installing New HFA II Software F-1
G How SITA Works / Acknowledgments G-1
H Troubleshooting H-1
Appendix(34 pages)
REV. A 10/98 PN 47653-1 HUMPHREY FIELD ANALYZER II
Index(6 pages)
12Care &Cleaning
(14 pages)
REV. A 10/98 PN 47653-1 HUMPHREY FIELD ANALYZER II
Introduction/Instrument Setup 1
Welc
ome
About Visual Fields 1-2
The Humphrey Advantage 1-5
Using This Guide 1-8
Safety Precautions 1-9
System Components 1-11
Optional Components 1-14
System Assembly 1-16
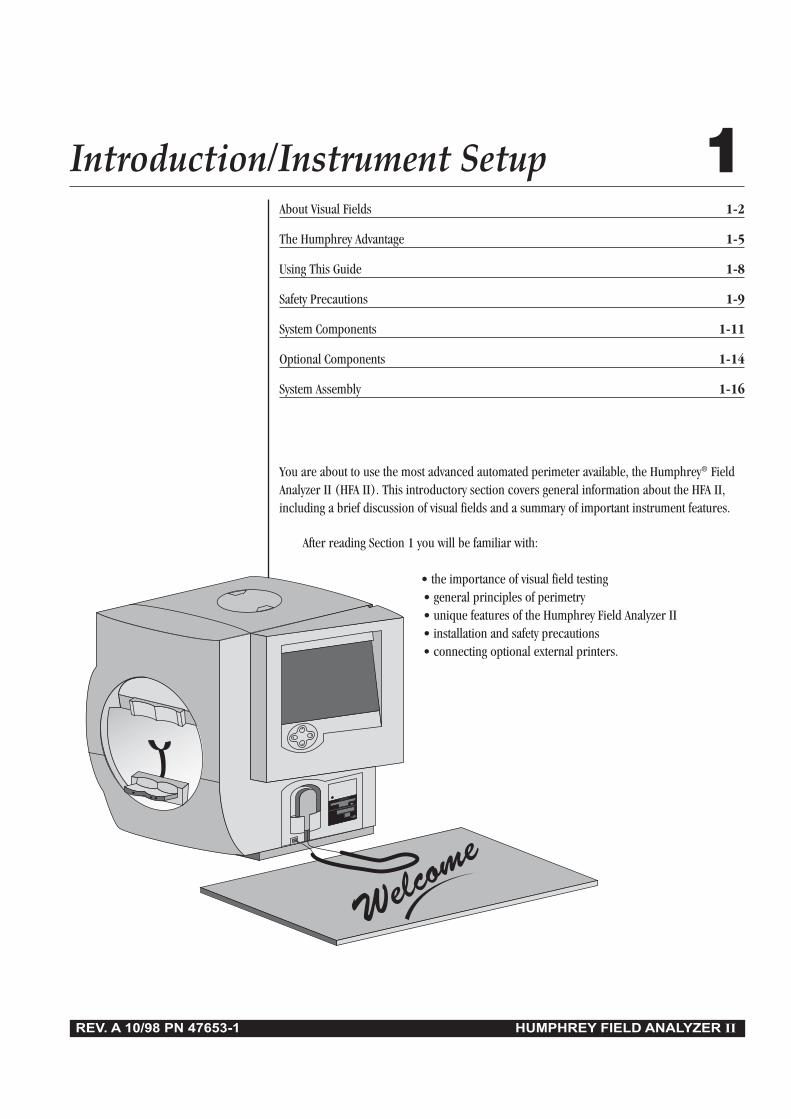
You are about to use the most advanced automated perimeter available, the Humphrey® FieldAnalyzer II (HFA II). This introductory section covers general information about the HFA II,including a brief discussion of visual fields and a summary of important instrument features.
After reading Section 1 you will be familiar with:
• the importance of visual field testing• general principles of perimetry• unique features of the Humphrey Field Analyzer II• installation and safety precautions• connecting optional external printers.

1-2 INTRODUCTION / INSTRUMENT SETUP
REV. A 10/98 PN 47653-1 HUMPHREY FIELD ANALYZER II
ABOUTVISUAL FIELDS
When asked to assess one’s own vision, the average person often will confidently reply “I see20/20”, “20/100” or whatever the result of their visual acuity test. Fortunately, doctorsappreciate the complexities involved in evaluating visual function and rely on an extensive andvaried battery of diagnostic tests and instruments as part of the ocular examination. Withoutquestion, one of the most essential tools in the modern ophthalmic office is the computerizedperimeter, used to evaluate the visual field.
The purpose of visual field testing, or perimetry, is to provide information critical to:
• diagnosing ocular diseases, especially glaucoma
• evaluating neurological diseases
• monitoring the progress of ocular and neurological diseases.
Visual field testing can lead to early detection and treatment of disease. In the case of glau-coma, visual fields play a major role in identifying visual field defects and evaluating theefficacy of the therapy used to control the disease process.
What visual field When evaluating visual performance, clinicians are primarily interested in two retinaltests measure functions: resolution and contrast sensitivity. Resolution is the ability to identify discrete forms
(letters, numbers, symbols), and is commonly measured with the visual acuity test. Resolutionrapidly diminishes with increasing distance from the fovea and is, therefore, a poor indicatorof overall visual performance.
A better means of evaluating visual function—especially those areas less sensitive than thefovea—is contrast sensitivity testing. Contrast sensitivity is the ability to detect a stimulus (spotof light or other target) against a darker or brighter background. Standard Humphreyperimetry may be thought of as contrast sensitivity testing applied throughout the peripheralvisual field.
In perimetry, the term “threshold” is used to describe a very specific level of stimulus detec-tion. The threshold represents the point at which a stimulus is seen 50% of the time andmissed 50% of the time. The assumption is that all stimuli brighter than the threshold valuewill be seen and all stimuli dimmer will be missed. Reviewing the threshold value at each pointtested in the visual field is an important part of the diagnostic process.
Visual field tests can yield information that is general in nature, as with screening tests, ormore exacting and quantitative, as with threshold tests. In deciding which test type is mostappropriate for a patient the practitioner is influenced by many factors, including the patient’spresenting complaint, family history, age, degree of cooperation, and time available to runthe test.

INTRODUCTION / INSTRUMENT SETUP 1-3
REV. A 10/98 PN 47653-1 HUMPHREY FIELD ANALYZER II
Normal versus The visual field normally extends more than 90° temporally, 60° nasally and superiorly,pathologic fields and about 70° inferiorly. That means a person can potentially perceive stimuli within this
range while staring at a fixed point.
Superior
Inferior
60°
Nas
al60°
Temporal
90°
70°
Figure 1.1: The Boundaries of the Normal Visual Field
A more comprehensive understanding of the normal field takes into account that visualsensitivity is not constant (or equal) throughout the range. As previously stated, vision is mostacute at the fovea and decreases toward the periphery of the retina. It is easy to see why thevisual field is often expressed as a “hill of vision in a sea of darkness”.
BLINDSPOT
FOVEA
Figure 1.2: The Normal Hill of Vision
Several factors affect the normal hill of vision causing variations in its overall height and shape.Among them are a patient’s age, ambient light, stimulus size, and stimulus duration. In general,deviations from the normal hill are viewed as visual field defects and caused by some patho-logical change.

1-4 INTRODUCTION / INSTRUMENT SETUP
REV. A 10/98 PN 47653-1 HUMPHREY FIELD ANALYZER II
A defect (or scotoma) is categorized as either relative or absolute. A relative defect is an areathat has depressed vision or less than normal sensitivity; an absolute defect is an area wherethe perception of light is absent. The point at which the optic nerve enters the retina is referredto as the blind spot, and is an example of an absolute scotoma.
Some defect patterns are characteristic of certain diseases, a fact which makes visual fieldtesting a valuable part of the diagnostic process. Furthermore, by having patients repeat thesame tests at later dates, practitioners gain insight into the progression of the disease and theeffectiveness of treatment.
Methods of testing Over the years, visual field testing devices have varied in size, complexity, and testingthe visual field methodology. The fundamental premise has remained the same, however; patients must
respond when they see a stimulus.
In kinetic testing, a target of fixed stimulus characteristics is moved into the visual field from anon-seeing area, until it is detected by the patient. Typically, the target is brought toward thecenter from several directions and the operator marks the location at which the patient firstdetects the target (threshold point).
Kinetic test results can only be reliably related to specific parts of the visual field if points arejoined to form an isopter, or ring of equal contrast sensitivity. Targets of varying size andbrightness are used during one kinetic test, and for each different target, a different isopter ismapped. When reviewing several isopters, the clinician is visualizing different tiers in the hillof vision.
A second method of evaluating retinal function is known as static threshold testing. The term“static” refers to a stationary (rather than moving) stimulus being used.
In static testing, predefined test locations in the visual field are probed. Through a series ofstimulus presentations of varying brightness intensities, the threshold value is determined foreach test point. When evaluating static test results, clinicians are looking at the topography orcontour of the hill of vision, and whether depressions are evident.
Patient fixation and In order for any visual field test to be clinically useful, it must yield reliable results. Onetest reliability important factor affecting reliability is the steadiness of patient fixation. Unless the eye being
tested accurately fixates on the target while responding to stimuli, the results are unreliable.Other factors adversely affecting reliability are:
• patient fatigue and anxiety
• poor test instructions
• patient discomfort
• improper near vision correction for central testing.

INTRODUCTION / INSTRUMENT SETUP 1-5
REV. A 10/98 PN 47653-1 HUMPHREY FIELD ANALYZER II
Reasons for Certainly the advancements in microprocessor technology within the last 20 years have hadcomputerized perimetry a profound effect on perimetry. Perimeters have evolved into a more precise measuring tool
yielding highly repeatable results.
These changes are better appreciated by examining the benefits computerized perimeters bringto both patient and professional:
• Reproducible testing conditions.• Data storage capability; results can be compared over time and analyzed using expert
system software.• More sensitive testing; many researchers claim static perimetry to be superior to the
kinetic method for identifying defects. Performed manually, static testing would be tootime-consuming.
• Ease of operation; menu-driven software makes automated perimeters easy to learn anduse.
THE HUMPHREYADVANTAGE
Over 15 years of advancements in research, design and development are reflected in theHumphrey® Field Analyzer II. Equally important, the latest models represent improvementssuggested by users from around the world who have generously shared their best ideas withHumphrey Systems. With over 30,000 Humphrey Field Analyzers in use worldwide, HumphreySystems took on the challenge of improving the testing experience for the patient, the operator,and the practitioner. Here are some of the features which differentiate the HFA II from all otherautoperimeters available today.
Ergonomic design The HFA II relieves many physical discomfortsassociated with visual field testing. The chinrest and bowl shape allow patients to assume amore natural and relaxed sitting position whentaking tests.
The special power table and instrument sliderimprove patient comfort by permitting the HFA IIto extend out to the patient instead of the patientstretching toward the instrument. This is espe-cially important for wheelchair bound patients.
The patient response button is easy to operate,especially for patients who have limited use of their hands; for instance, patients with arthritis.The uniquely-shaped button may be placed on a knee, lap or the arm of a chair for betterleverage. The cord angles away from the patient for greater comfort. The response button willbeep each time it is pressed to give immediate feedback to the patient and to the user.
Reliable Results
Reliable ResultsPat
ient
Com
plia
nc
e
Patie
nt Comfort
1-6 INTRODUCTION / INSTRUMENT SETUP
REV. A 10/98 PN 47653-1 HUMPHREY FIELD ANALYZER II
Easy operation Sophisticated instrumentation need not be complicated. The HFA II offers a number of featuresintended to make the instrument easier to use:
• Touch screen design speeds data input.• Menu and icon commands simplify operation.• On-screen video eye monitor is standard on all models.• Confirmation screens reduce unintentional data loss.• A keyboard and trackball or mouse can be connected to the HFA II as optional data
input devices.
Speedy testing Humphrey Systems’ SITA™ testing strategies allow precise visual field measurements withunprecedented speed. With the SITA strategies, users can obtain visual field information in halfthe time it takes using conventional testing algorithms without compromising accuracy. SITA
represents the very latest in autoperimetry technology and it is only available with yourHumphrey Field Analyzer II.
Sophisticated data The Humphrey Field Analyzer’s statistical software, STATPAC™, provides immediate expertanalysis with STATPAC™ system analysis of visual field test results. With STATPAC you can analyze test results at the time
of examination, store test results and analyze them at your convenience, or recall previouslystored tests to analyze for comparative purposes.
STATPAC includes several exclusive features to help you identify visual field change:
• Using results from a single test, STATPAC can point out suspicious areas that otherwisemight not be evident until subsequent tests were done.
• STATPAC can identify areas that look suspicious but which, in fact, compare favorablywith normals data.
• Using results from a series of tests, STATPAC provides a highly sensitive and informativeanalysis of changes in the patient’s visual field over time.
• The Glaucoma Hemifield Test (GHT) compares points in the superior and inferiorhemifields to provide a plain language analysis of test results.
• The HFA II provides separate databases for STATPAC analysis. These include databasesfor SITA and Blue-Yellow perimetry, in addition to the well-established databases for FullThreshold and FastPac test results.
• Another database consisting of stable glaucoma patients is used with the GlaucomaChange Probability Analysis for following change in the progress of the disease.
STATPAC™ For Windows® is a software program for IBM compatible computers that allowsyou to analyze patient files in a Windows environment.
INTRODUCTION / INSTRUMENT SETUP 1-7
REV. A 10/98 PN 47653-1 HUMPHREY FIELD ANALYZER II
Blue-Yellow (SWAP) testing Blue-Yellow perimetry, also known as Short Wavelength Automated Perimetry, or SWAP,(models 745 & 750) has performed better than standard computerized perimetry according to published
longitudinal studies. Working independently, researchers from U.C. Davis and U.C. San Diegohave found that Blue-Yellow perimetry identified early glaucomatous visual field defects yearsbefore they could be detected using standard white-on-white perimetry.
Blue-Yellow perimetry differs from standard static White-on-White perimetry only in that acarefully chosen wavelength of blue light is used as the stimulus, and a specific color andbrightness of yellow light is used for the background illumination. For more information onBlue-Yellow perimetry, see Section 4 and Section 7.
Automatic fixation monitoring The HFA II employs several methods for ensuring that patients maintain proper fixation of thetarget during testing. All models are equipped with a video eye monitor which presents a viewof the patient’s eye on-screen so that users can ensure proper patient fixation. Every HFA II alsooffers standard Heijl-Krakau blind spot monitoring.
Models 740, 745, and 750 also offer Gaze Tracking: a patented, high precision system whichuses real-time image analysis to verify the patient is looking at the fixation target and notlooking around. The gaze tracking device is unaffected by the patient’s head position. Acontinuous record of fixation is available for monitoring on the test screen throughout the test.The gaze track graph is included on the printout to provide a permanent record of the patient’sfixation.
For patients who require a trial lens, the model 750 uses Head Tracking and Vertex Monitoringto help ensure that the patient’s eye is both centered behind the lens and is held at the properdistance from the lens. These features help to eliminate the trial lens as a possible source ofunreliable visual field results.
Data protection features Visual field results need to be saved and protected for future use. The HFA II offers you anumber of data storage methods to retain the results. Floppy disk data storage is available withall models of the HFA II. An efficient “floppy backup” procedure can be performed with HFA IImodels having hard drive capability (models 735, 740, 745 and 750). The HFA II model 750also has a built-in streamer tape drive which can back up the entire contents of the hard drivein a matter of minutes on a single tape. There are a number of additional data protectionfeatures that work internally to safeguard your data from serious loss or damage. This User’sGuide describes in great detail the procedures for creating extra copies of your data.
Year 2000 (Y2K) compliance The HFA II has been programmed from the beginning to be compliant with the year 2000 andY2K regulations. The internal clock, calendar, data entry screens and statistical analysissoftware have all been designed to be unaffected by the year 2000.
Information on the internet Information concerning your HFA II may occasionally be found on the Humphrey Systems’ website. The internet address is : www.humphrey.com

1-8 INTRODUCTION / INSTRUMENT SETUP
REV. A 10/98 PN 47653-1 HUMPHREY FIELD ANALYZER II
USING THIS GUIDETo fully appreciate the capability of the HFA II and develop good testing techniques, werecommend that you rely on the User’s Guide as your training and reference manual. It hasbeen designed to make learning easy. The concise step-by-step instructions and accompanyingillustrations help you get started quickly and with more confidence.
We think you will enjoy working with the HFA II. The friendly touch control makes it inviting tolearn and easy to operate. For optimum results:
• Read your guide in the order written.
• Read it while sitting at the instrument.
• Practice using the HFA II by first testing staff members before using it with patients.
Model differentiation This guide contains operating instructions for Models 720, 730, 735, 740, 745, and 750.Although much of the information is relevant to all models, some information only applies toparticular models.
When a feature or function applies to specific models, this guide specifies the modelnumber(s), often in parentheses, in a prominent location. An example of this is found in theprevious discussion of Blue-Yellow testing (previous page). Conversely, model numbers arenot specified when information is standard or optional on all models.
You can find the model number of your instrument on the rear panel of the HFA II or you mayaccess this information via the “i ” button located in the upper, left-hand corner of the screen(see Section 2: “The “i ” Button”). If you are unsure about the particular capabilities of yourinstrument, refer to Appendix A: “HFA II Product Specifications”.
Text conventions The terms “select,” “choose,” and “press” are used interchangeably. Each term means toinitiate an operator action using the touch screen, external keyboard, trackball, or mouse. Theterms “hard disk” and “hard drive” are used interchangeably in reference to the data storagedevice standard on HFA II models 735, 740, 745 and 750.
UPPER CASE LETTERS are reserved for references to specific command buttons found on thetouch screen. The exceptions to this are messages on test printouts, the words STATPAC, SITA,HFA II, and headings.
Italicized words are used to identify the icon buttons on the right border of the screen, thetitles of figures, pictures, tables, and special notes in this manual.
Bold words are used to highlight warnings and chapter headings.
Additional references The User Guide cannot possibly cover every situation you may encounter with the HFA II,especially interpretation questions. Your HFA II comes with a copy of The Field AnalyzerPrimer which provides an overview of visual field results. The recently published text, Auto-mated Static Perimetry, Second Edition, by Douglas R. Anderson and Vincent Michael Patella(Mosby, Inc., St. Louis), is recommended for in-depth information and analysis of visual fields.

INTRODUCTION / INSTRUMENT SETUP 1-9
REV. A 10/98 PN 47653-1 HUMPHREY FIELD ANALYZER II
SAFETYPRECAUTIONS
The Humphrey Field Analyzer II complies with UL, CSA, CE and IEC safety requirements.Follow all warnings and precautions to ensure the safe installation and operation of theHumphrey Field Analyzer.
Caution: This instrument is NOT anesthetic-proof. Do NOT use it in the presence ofa flammable anesthetic since this creates a risk of explosion!
General safety requirements • Although the Humphrey Field Analyzer II is designed for continuous operation, it shouldbe turned off and covered with the dust cover when not used for an extended period oftime. The HFA II should be used in a cool, dry and dust-free setting.
• The HFA II is classified as type B, class I protection equipment. To prevent electricshock, the instrument must be plugged into an earth grounded outlet.
• Do NOT connect or disconnect cables while power is on.
• Do NOT place any objects on top of the instrument.
• Do NOT place any container holding liquid near the instrument.
• Do NOT place the dust cover on the instrument while the instrument is powered on.
Installation safety • The Humphrey Field Analyzer II is equipped with a three-prong plug. The instrumentprecautions should be plugged into a correctly wired outlet with a ground receptacle. If the plug
does not fit the outlet, contact an electrician. Do NOT disable or remove the ground pin.
• Do NOT overload your AC outlet.
• If the cord or plug is damaged, do NOT continue to use the instrument. Electrical shockor fire hazard may result. Call Humphrey Customer Service for replacement.
• Do not block the ventilation openings. These allow for the release of heat generatedduring operation. A buildup of heat due to blockage can cause failures which mayresult in a fire hazard.
• Use only a stand or table recommended by Humphrey Systems.
• If the stand or table has casters, do NOT try to roll it in deep pile carpet or over objectson the floor such as cables and power cords. Lock the casters to secure the table.
• Do NOT place the instrument on an uneven or sloped surface.
• Do NOT use accessories that are not designed for this instrument. Use only those partsrecommended by Humphrey Systems to achieve optimum performance and safety.Accessories must meet UL, CSA, CE, and IEC safety standards.
• Do NOT use the instrument in or near wet or moist environments.
Caution: Always replace fuses with same type or rating. Failure to do so may createa fire risk. Refer to fuse ratings listed on the label on the rear panel of the instrument or onthe table near the fuse holder.

1-10 INTRODUCTION / INSTRUMENT SETUP
REV. A 10/98 PN 47653-1 HUMPHREY FIELD ANALYZER II
Radio and TV interference The Humphrey Field Analyzer II has passed all domestic and international electromagneticemission/suppression standards. However, it still generates small amounts of radio frequencyenergy and may cause interference to radio, television or other instruments. If the HFA II doescause interference to radio or television reception, the following measures may be necessary:
• Plug the Humphrey Field Analyzer II into a different outlet so that the instrument and the receiving device are on different branch circuits.
• Reorient the HFA II with respect to the TV or the radio antenna.
• Move the receiving device and the HFA II away from each other.
• Use only shielded communication cables.
Power on The power switch is located on the rear panel of the instrument. Once engaged, the HFA IIbegins performing a self-diagnostic checkup. In the event the computer detects a problem, amessage will appear on the start-up screen. Call Humphrey Customer Service if necessary.

INTRODUCTION / INSTRUMENT SETUP 1-11
REV. A 10/98 PN 47653-1 HUMPHREY FIELD ANALYZER II
SYSTEM COMPONENTS
Touch screen
Hard drive (Models 735-750)
Floppy drive (all Models)Tape drive (Model 750)
Optional Printrex printer(connects to parallel port)
Serial ports (RS232)
Parallel printer portVGA port
External 5 1/4" floppydrive port
Power cord outletPower switch
Air filter
Keyboard connector
Touch screenbrightness control
Chin rest control
Patient response button
Figure 1.3: The HFA II – Side View
Figure 1.4: The HFA II – Rear View

1-12 INTRODUCTION / INSTRUMENT SETUP
REV. A 10/98 PN 47653-1 HUMPHREY FIELD ANALYZER II
Forehead rest
Trial lens holderTesting bowl
Chin rest
Table with mountedPrintrex printer
Table height switch
Figure 1.5: The HFA II – Front View with Instrument Table
Slider handle
Extendedinstrument
slider
CasterLock
Blue-Yellow visor handle(model 745, 750)

INTRODUCTION / INSTRUMENT SETUP 1-13
REV. A 10/98 PN 47653-1 HUMPHREY FIELD ANALYZER II
Symbol definitions The following symbols appear on the HFA II:
Figure 1.6: HFA II Symbol Definitions
Power On
Power Off
Important Instructions Found In The Manual
Uninsulated High Voltage Inside The Instrument. Risk Of Electric Shock.
Fuse
Parts Of The Instrument That Touch The Patient Are Of Type B According To The IEC Standard.
Brightness
VGA Monitor
Projector Bulb
Serial RS-232 Communication Port
Printer
Keyboard
Patient Response Button
Floppy Disk Drive
Air Intake Filter

1-14 INTRODUCTION / INSTRUMENT SETUP
REV. A 10/98 PN 47653-1 HUMPHREY FIELD ANALYZER II
OPTIONALCOMPONENTS
Printers Several printers are currently supported by the HFA II:• Printrex Thermal Line Printers
Table-Mounted Model (standard with HFA II)Stand-Alone Model (optional)
• Hewlett-Packard LaserJet Printers (optional): 2, 2P, 2P+, 3, 3P, 3P+, 4, 4L, 4MP, 4P, 5L, 5P, 6L, 6P
Printrex: Table-Mounted and Stand-Alone Model1. With power off to the table and HFA II, connect the printer interface cable to
the parallel port on the HFA II. Refer to Figure 1.4.2. Insert paper supply. Refer to Section 12: “Loading Paper”.3. Turn on power to the table.4. Turn on power to the HFA II.5. From the System Setup screen, select PRINTREX. See Section 2: “Selecting the Printer Type.”
Hewlett-Packard LaserJetBefore you start, check that you have the following supplies:
• HP LaserJet printer• Interface cable• HP printer manual• Toner cartridge• Printer paper.
1. With power off to the HFA II, connect the interface cable to the respective parallel port onthe HFA II (refer to Figure 1.4) and the printer (refer to Hewlett-Packard printermanual).
2. Install the toner cartridge.3. Insert paper supply.4. Connect the printer power cord to the HFA II table or to a wall outlet.5. Turn on power to the printer and the HFA II.6. At the System Setup menu, select HP LASERJET. See Section 2: “Selecting the Printer Type”.
External keyboard The HFA II supports an external keyboard. The keyboard is a standard feature of the Model750 and is optional for all other HFA II models. The keyboard plugs into the back of the HFA IInear the power switch (refer to Figure 1.4 for the location of the plug).
1. Power off the HFA II (keyboard will not work if connected with power on).2. Plug in the keyboard.3. Power on the HFA II.
While any standard PC-type keyboard may be plugged into the HFA II and should work, we canonly guarantee compatibility with the keyboard shipped to you by Humphrey Systems. SeeSection 2: “Using the External Keyboard” for more details.
INTRODUCTION / INSTRUMENT SETUP 1-15
REV. A 10/98 PN 47653-1 HUMPHREY FIELD ANALYZER II
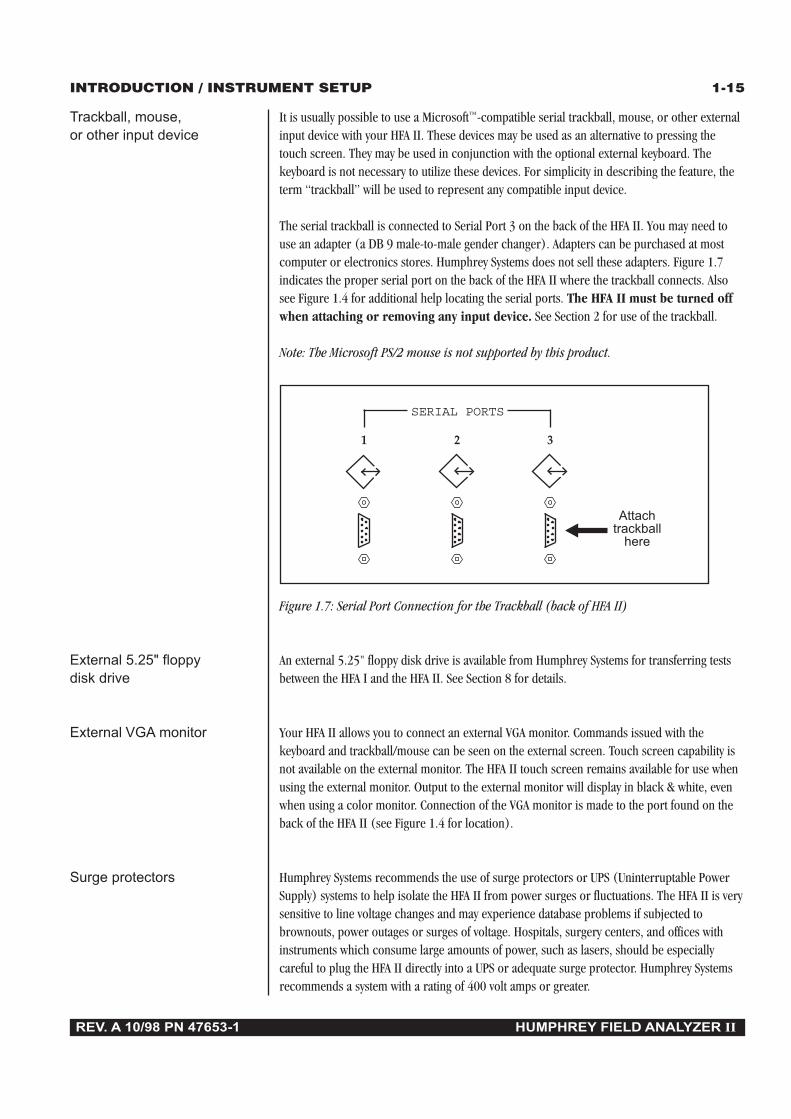
Trackball, mouse, It is usually possible to use a Microsoft™-compatible serial trackball, mouse, or other externalor other input device input device with your HFA II. These devices may be used as an alternative to pressing the
touch screen. They may be used in conjunction with the optional external keyboard. Thekeyboard is not necessary to utilize these devices. For simplicity in describing the feature, theterm “trackball” will be used to represent any compatible input device.
The serial trackball is connected to Serial Port 3 on the back of the HFA II. You may need touse an adapter (a DB 9 male-to-male gender changer). Adapters can be purchased at mostcomputer or electronics stores. Humphrey Systems does not sell these adapters. Figure 1.7indicates the proper serial port on the back of the HFA II where the trackball connects. Alsosee Figure 1.4 for additional help locating the serial ports. The HFA II must be turned offwhen attaching or removing any input device. See Section 2 for use of the trackball.
Note: The Microsoft PS/2 mouse is not supported by this product.
Figure 1.7: Serial Port Connection for the Trackball (back of HFA II)
External 5.25" floppy An external 5.25" floppy disk drive is available from Humphrey Systems for transferring testsdisk drive between the HFA I and the HFA II. See Section 8 for details.
External VGA monitor Your HFA II allows you to connect an external VGA monitor. Commands issued with thekeyboard and trackball/mouse can be seen on the external screen. Touch screen capability isnot available on the external monitor. The HFA II touch screen remains available for use whenusing the external monitor. Output to the external monitor will display in black & white, evenwhen using a color monitor. Connection of the VGA monitor is made to the port found on theback of the HFA II (see Figure 1.4 for location).
Surge protectors Humphrey Systems recommends the use of surge protectors or UPS (Uninterruptable PowerSupply) systems to help isolate the HFA II from power surges or fluctuations. The HFA II is verysensitive to line voltage changes and may experience database problems if subjected tobrownouts, power outages or surges of voltage. Hospitals, surgery centers, and offices withinstruments which consume large amounts of power, such as lasers, should be especiallycareful to plug the HFA II directly into a UPS or adequate surge protector. Humphrey Systemsrecommends a system with a rating of 400 volt amps or greater.
1 2 3
SERIAL PORTS
Attachtrackball
here
1-16 INTRODUCTION / INSTRUMENT SETUP
REV. A 10/98 PN 47653-1 HUMPHREY FIELD ANALYZER II
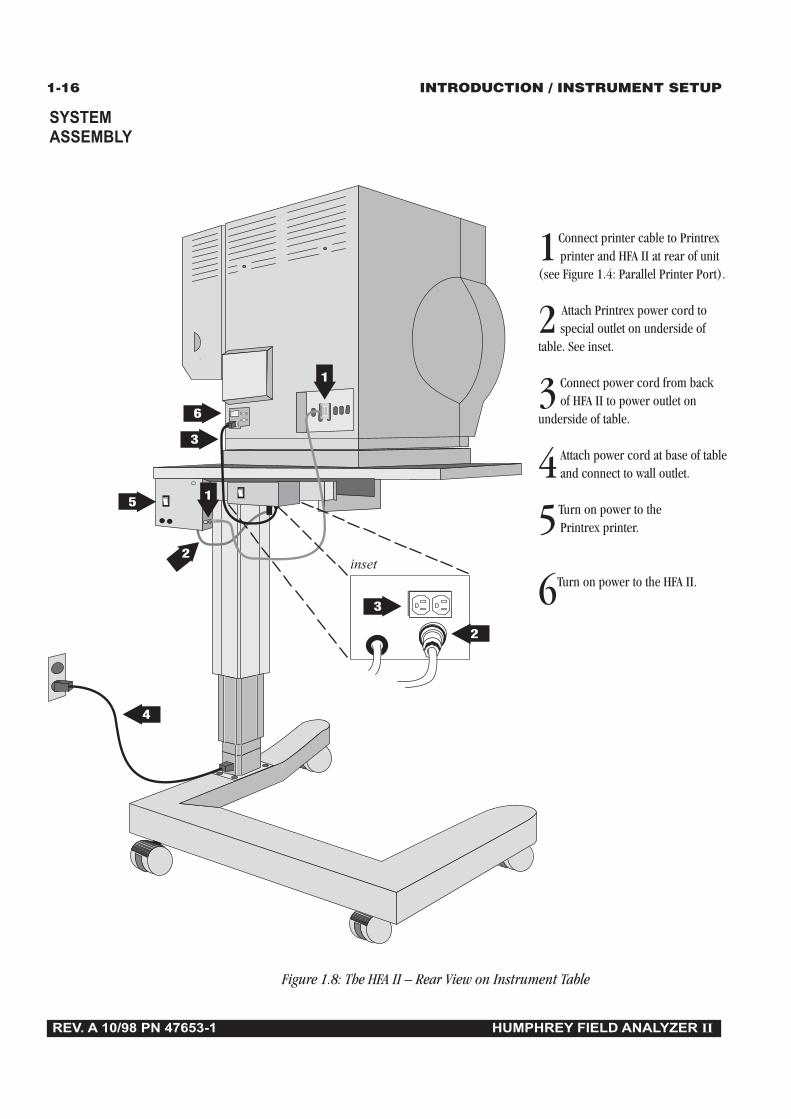
1Connect printer cable to Printrexprinter and HFA II at rear of unit
(see Figure 1.4: Parallel Printer Port).
2 Attach Printrex power cord tospecial outlet on underside of
table. See inset.
3 Connect power cord from backof HFA II to power outlet on
underside of table.
4 Attach power cord at base of tableand connect to wall outlet.
5Turn on power to thePrintrex printer.
6Turn on power to the HFA II.
SYSTEMASSEMBLY
6
5
3
3
1
4
1
2
2
Figure 1.8: The HFA II – Rear View on Instrument Table
inset
REV. A 10/98 PN 47653-1 HUMPHREY FIELD ANALYZER II
General Operation 2General Information 2-2
The Main Menu Screen 2-9
System Setup 2-10
Additional Setup 2-21
Help Screens 2-23
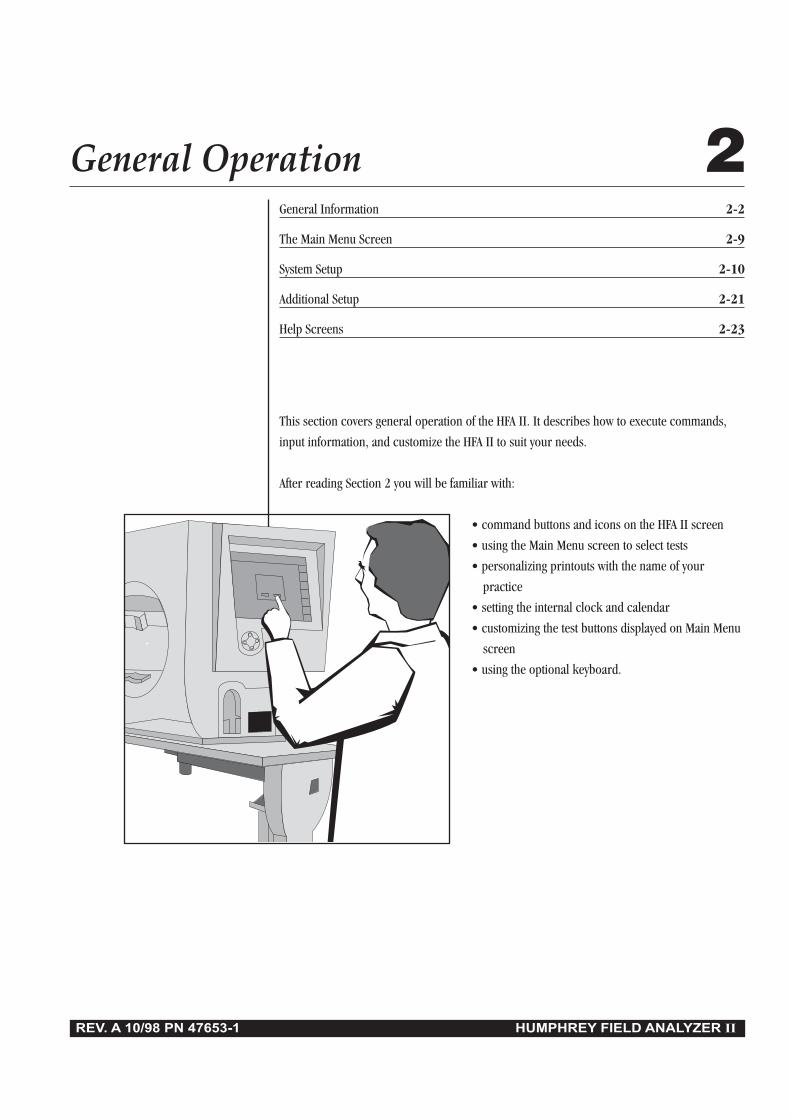
This section covers general operation of the HFA II. It describes how to execute commands,
input information, and customize the HFA II to suit your needs.
After reading Section 2 you will be familiar with:
• command buttons and icons on the HFA II screen
• using the Main Menu screen to select tests
• personalizing printouts with the name of your
practice
• setting the internal clock and calendar
• customizing the test buttons displayed on Main Menu
screen
• using the optional keyboard.
GENERAL OPERATION
REV. A 10/98 PN 47653-1 HUMPHREY FIELD ANALYZER II
2-2
GENERALINFORMATION
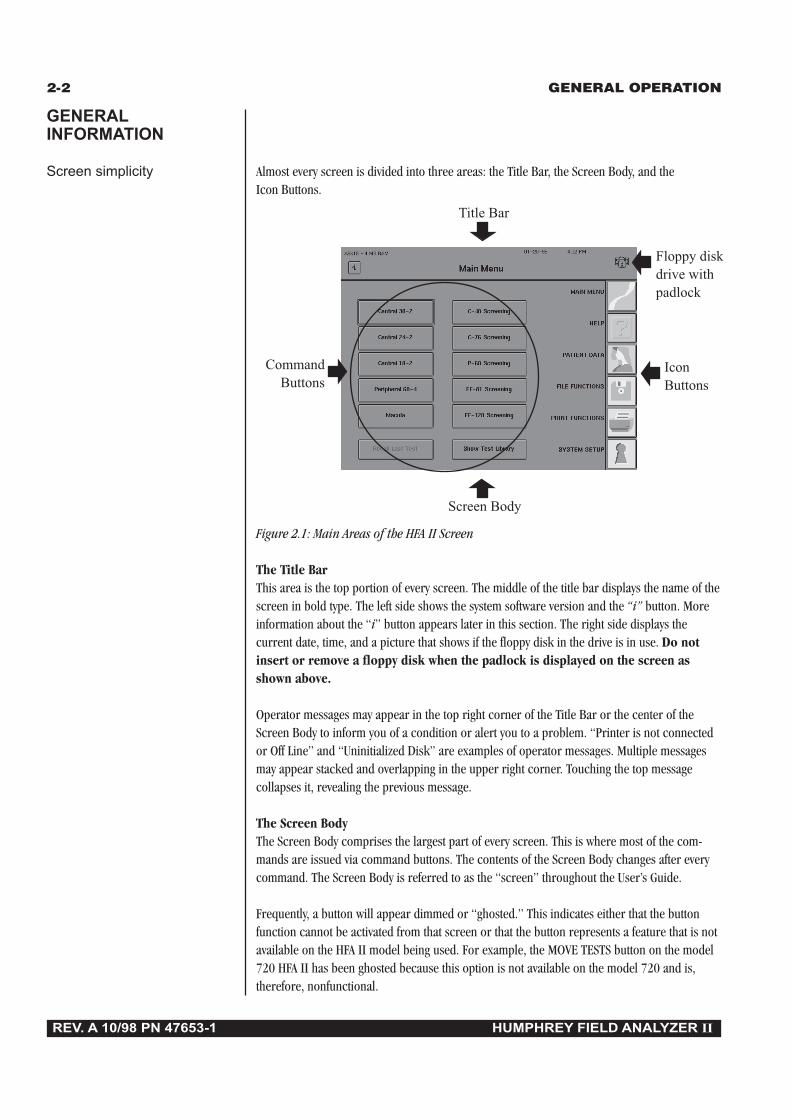
Screen simplicity Almost every screen is divided into three areas: the Title Bar, the Screen Body, and theIcon Buttons.
Figure 2.1: Main Areas of the HFA II Screen
The Title BarThis area is the top portion of every screen. The middle of the title bar displays the name of thescreen in bold type. The left side shows the system software version and the “i” button. Moreinformation about the “i” button appears later in this section. The right side displays thecurrent date, time, and a picture that shows if the floppy disk in the drive is in use. Do notinsert or remove a floppy disk when the padlock is displayed on the screen asshown above.
Operator messages may appear in the top right corner of the Title Bar or the center of theScreen Body to inform you of a condition or alert you to a problem. “Printer is not connectedor Off Line” and “Uninitialized Disk” are examples of operator messages. Multiple messagesmay appear stacked and overlapping in the upper right corner. Touching the top messagecollapses it, revealing the previous message.
The Screen BodyThe Screen Body comprises the largest part of every screen. This is where most of the com-mands are issued via command buttons. The contents of the Screen Body changes after everycommand. The Screen Body is referred to as the “screen” throughout the User’s Guide.
Frequently, a button will appear dimmed or “ghosted.” This indicates either that the buttonfunction cannot be activated from that screen or that the button represents a feature that is notavailable on the HFA II model being used. For example, the MOVE TESTS button on the model720 HFA II has been ghosted because this option is not available on the model 720 and is,therefore, nonfunctional.
CommandButtons
Title Bar
Screen Body
IconButtons
Floppy diskdrive withpadlock

GENERAL OPERATION
REV. A 10/98 PN 47653-1 HUMPHREY FIELD ANALYZER II
2-3
Icon buttons These buttons occupy the right side of most screens. Each has a unique function that can beaccessed at any time unless there is a pop-up window present or the icon buttons are ghosted.See “Pop-up Windows” later in this section for details. The HFA II’s icon buttons are shownbelow along with a brief description of their function.
MAIN MENUThe MAIN MENU icon allows you to return to the Main Menu screen from other system screens.
HELPThe HELP icon gives brief explanations of certain features and procedures available on theHFA II. You should always consult this Guide for further information.
PATIENT DATAPATIENT DATA leads you to the Patient Data screen where you may enter or recall the patient’sname, date of birth, I. D. number, trial lens information, and diagnostic data prior to testing.Main Menu test buttons also automatically lead you to the Patient Data screens.
FILE FUNCTIONSThrough FILE FUNCTIONS you can access the patient test results that have been saved as wellas perform various database management procedures.
PRINT FUNCTIONSPRINT FUNCTIONS allows you to print out hard copies of test results in various styles.
SYSTEM SETUPSYSTEM SETUP lets you define certain user settings. Examples of these are time and date,printer type, visual acuity format, and practice name and address on printouts. Access to theSYSTEM SETUP icon is only available from the Main Menu screen.
UNDOThe UNDO icon takes you back to the previous screen. In some cases pressing the UNDO iconwill appear to take you back two screens. This occurs when the previous screen is a pop-upwindow. The UNDO icon is not available on the Main Menu screen.
GENERAL OPERATION
REV. A 10/98 PN 47653-1 HUMPHREY FIELD ANALYZER II
2-4
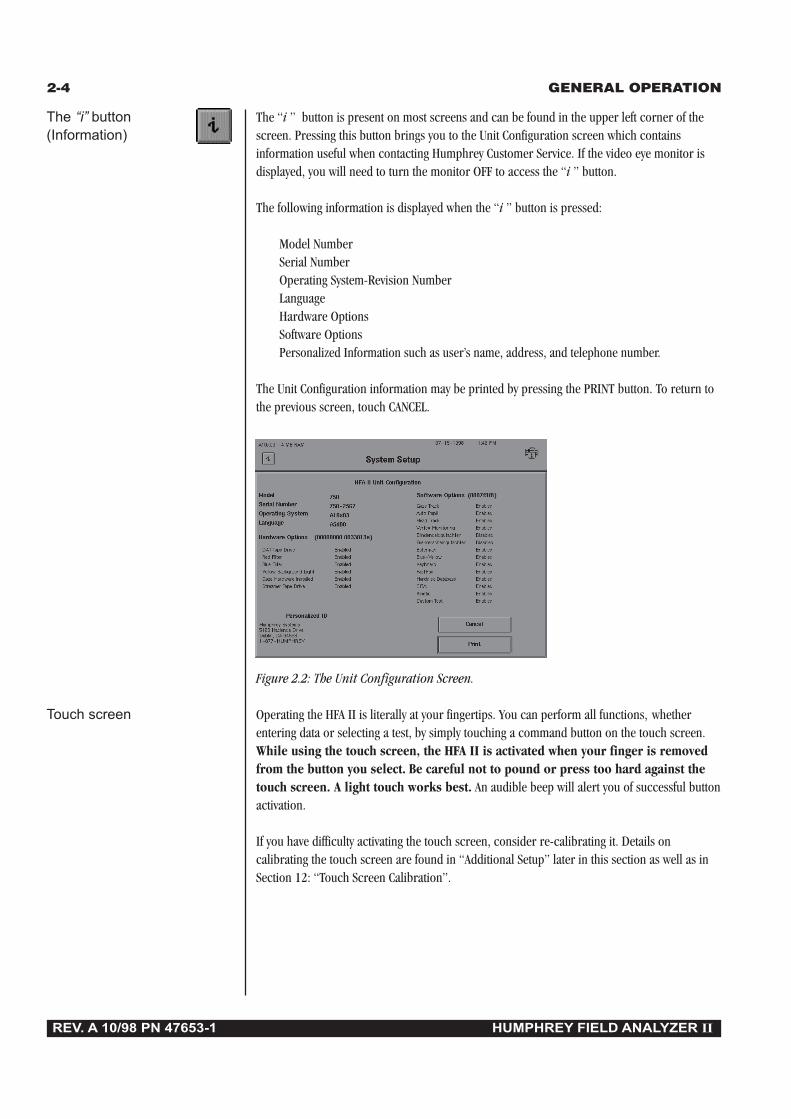
The “i” button The “i ” button is present on most screens and can be found in the upper left corner of the(Information) screen. Pressing this button brings you to the Unit Configuration screen which contains
information useful when contacting Humphrey Customer Service. If the video eye monitor isdisplayed, you will need to turn the monitor OFF to access the “i ” button.
The following information is displayed when the “i ” button is pressed:
Model NumberSerial NumberOperating System-Revision NumberLanguageHardware OptionsSoftware OptionsPersonalized Information such as user’s name, address, and telephone number.
The Unit Configuration information may be printed by pressing the PRINT button. To return tothe previous screen, touch CANCEL.
Figure 2.2: The Unit Configuration Screen.
Touch screen Operating the HFA II is literally at your fingertips. You can perform all functions, whetherentering data or selecting a test, by simply touching a command button on the touch screen.While using the touch screen, the HFA II is activated when your finger is removedfrom the button you select. Be careful not to pound or press too hard against thetouch screen. A light touch works best. An audible beep will alert you of successful buttonactivation.
If you have difficulty activating the touch screen, consider re-calibrating it. Details oncalibrating the touch screen are found in “Additional Setup” later in this section as well as inSection 12: “Touch Screen Calibration”.
GENERAL OPERATION
REV. A 10/98 PN 47653-1 HUMPHREY FIELD ANALYZER II
2-5
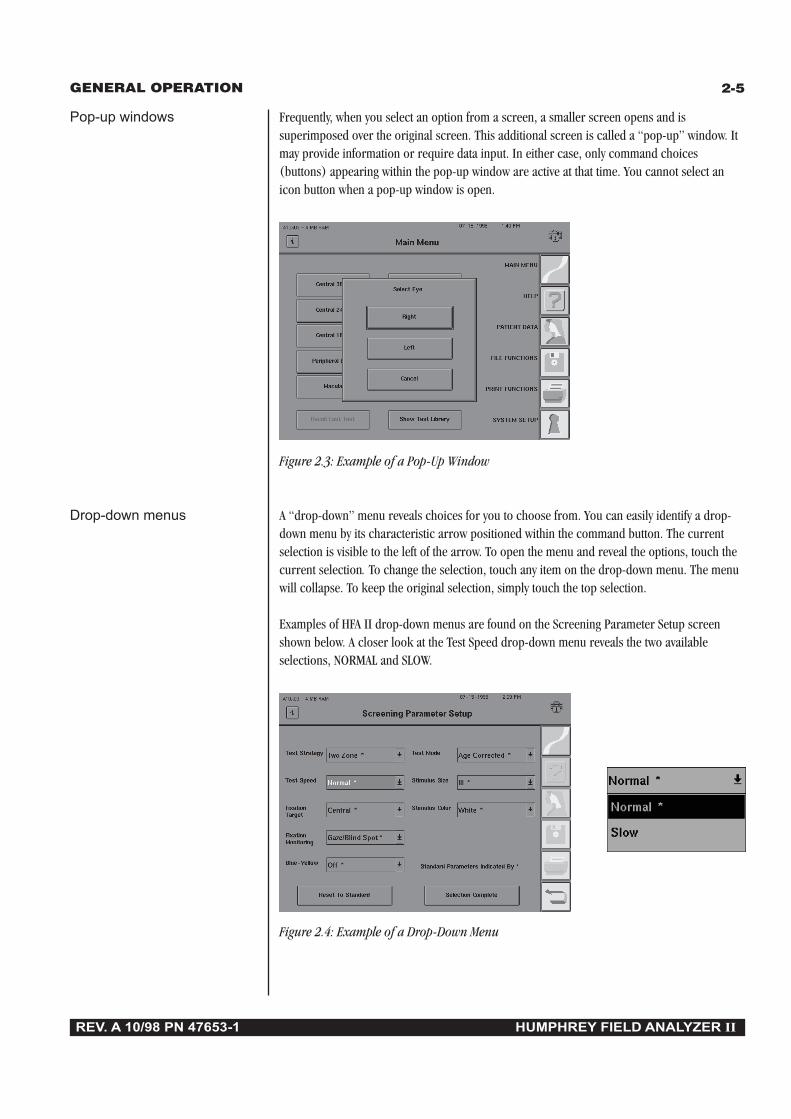
Pop-up windows Frequently, when you select an option from a screen, a smaller screen opens and issuperimposed over the original screen. This additional screen is called a “pop-up” window. Itmay provide information or require data input. In either case, only command choices(buttons) appearing within the pop-up window are active at that time. You cannot select anicon button when a pop-up window is open.
Figure 2.3: Example of a Pop-Up Window
Drop-down menus A “drop-down” menu reveals choices for you to choose from. You can easily identify a drop-down menu by its characteristic arrow positioned within the command button. The currentselection is visible to the left of the arrow. To open the menu and reveal the options, touch thecurrent selection. To change the selection, touch any item on the drop-down menu. The menuwill collapse. To keep the original selection, simply touch the top selection.
Examples of HFA II drop-down menus are found on the Screening Parameter Setup screenshown below. A closer look at the Test Speed drop-down menu reveals the two availableselections, NORMAL and SLOW.
Figure 2.4: Example of a Drop-Down Menu
GENERAL OPERATION
REV. A 10/98 PN 47653-1 HUMPHREY FIELD ANALYZER II
2-6
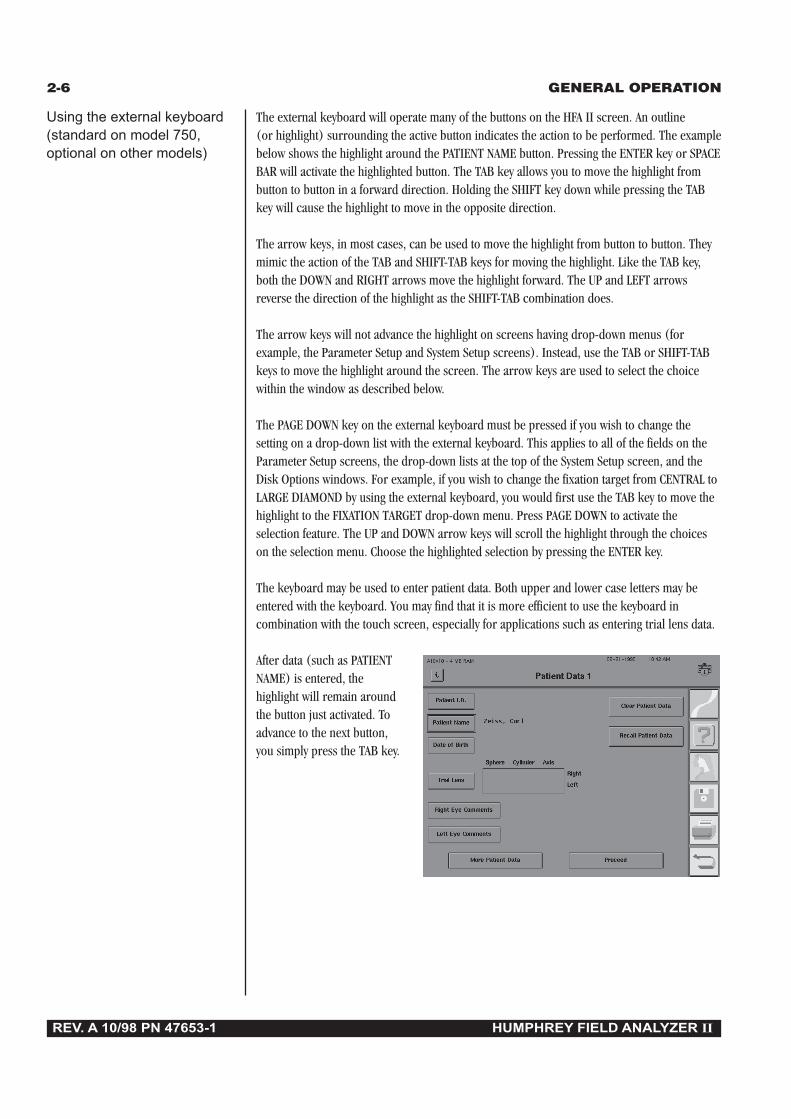
Using the external keyboard The external keyboard will operate many of the buttons on the HFA II screen. An outline(standard on model 750, (or highlight) surrounding the active button indicates the action to be performed. The exampleoptional on other models) below shows the highlight around the PATIENT NAME button. Pressing the ENTER key or SPACE
BAR will activate the highlighted button. The TAB key allows you to move the highlight frombutton to button in a forward direction. Holding the SHIFT key down while pressing the TABkey will cause the highlight to move in the opposite direction.
The arrow keys, in most cases, can be used to move the highlight from button to button. Theymimic the action of the TAB and SHIFT-TAB keys for moving the highlight. Like the TAB key,both the DOWN and RIGHT arrows move the highlight forward. The UP and LEFT arrowsreverse the direction of the highlight as the SHIFT-TAB combination does.
The arrow keys will not advance the highlight on screens having drop-down menus (forexample, the Parameter Setup and System Setup screens). Instead, use the TAB or SHIFT-TABkeys to move the highlight around the screen. The arrow keys are used to select the choicewithin the window as described below.
The PAGE DOWN key on the external keyboard must be pressed if you wish to change thesetting on a drop-down list with the external keyboard. This applies to all of the fields on theParameter Setup screens, the drop-down lists at the top of the System Setup screen, and theDisk Options windows. For example, if you wish to change the fixation target from CENTRAL toLARGE DIAMOND by using the external keyboard, you would first use the TAB key to move thehighlight to the FIXATION TARGET drop-down menu. Press PAGE DOWN to activate theselection feature. The UP and DOWN arrow keys will scroll the highlight through the choiceson the selection menu. Choose the highlighted selection by pressing the ENTER key.
The keyboard may be used to enter patient data. Both upper and lower case letters may beentered with the keyboard. You may find that it is more efficient to use the keyboard incombination with the touch screen, especially for applications such as entering trial lens data.
After data (such as PATIENTNAME) is entered, thehighlight will remain aroundthe button just activated. Toadvance to the next button,you simply press the TAB key.

GENERAL OPERATION
REV. A 10/98 PN 47653-1 HUMPHREY FIELD ANALYZER II
2-7
You may also opt to navigate through the system with the help of the keyboard function keys.F1 through F6 serve as keyboard equivalents of the icon buttons. The function keys and theassociated icon buttons they activate are listed below:
F1 HELPF2 MAIN MENUF3 PATIENT DATAF4 FILE FUNCTIONSF5 PRINT FUNCTIONSF6 SYSTEM SETUP / UNDO
Using the trackball, mouse, It is possible to use any Microsoft™-compatible serial trackball, mouse, or other externalor other input device input device on your HFA II. These devices may be used as an alternative to pressing the
touch screen. They may be used in conjunction with the optional external keyboard, althoughthe keyboard is not necessary to utilize these devices. For simplicity in describing the feature,the term “trackball” will be used to represent any compatible input device. See Section 1:“Optional Components” for directions on connecting the trackball or mouse.
Using a trackball with the HFA II is very similar to using this device with a business or personalcomputer. Trackballs vary, so experiment with your trackball to determine which button maybe used. If using a mouse, only the left-most button is active. Other buttons do not functionwith the HFA II.
The trackball is used in conjunction with the square cursor, which appears as a small, movablebox on the video screen of the HFA II. The cursor moves as you move the trackball. Items areselected by moving the cursor to the desired item and pressing (or clicking) the left-mostbutton on the trackball (or appropriate mouse button). To ensure that the appropriate item isselected, make sure that the cursor is completely within the boundary of the desired item.
To select an item on a drop-down menu, move the cursor to the desired drop-down box. Clickthe trackball button. The drop-down menu will appear. Drag the cursor down to the desireditem until that item is highlighted. Press the trackball button again. The drop-down menu willdisappear and the selected item will appear in the drop-down box, indicating that it has beenselected. This procedure is identical to selecting menu items on many popular computerprograms.
Note: The cursor may not always be visible. To locate the cursor, either move the trackballor press a keyboard button. It is not recommended to press the SPACE BAR or RETURN key,as these will activate the highlighted screen button.
GENERAL OPERATION
REV. A 10/98 PN 47653-1 HUMPHREY FIELD ANALYZER II
2-8
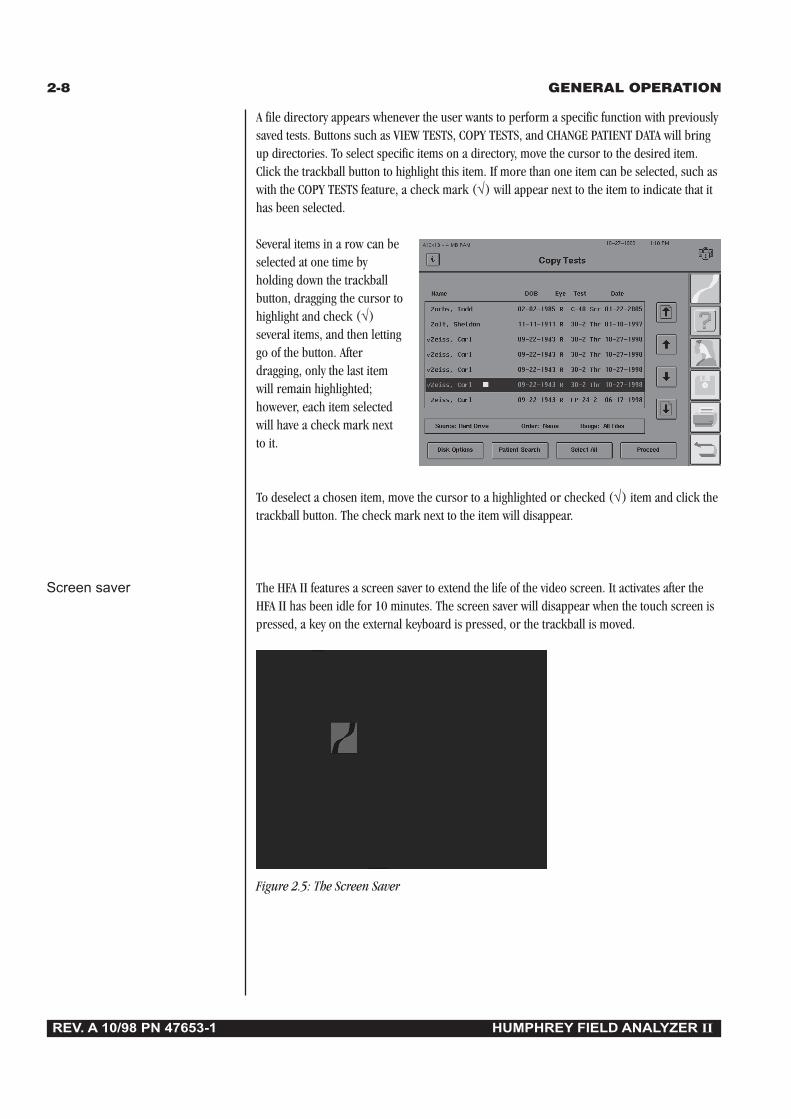
A file directory appears whenever the user wants to perform a specific function with previouslysaved tests. Buttons such as VIEW TESTS, COPY TESTS, and CHANGE PATIENT DATA will bringup directories. To select specific items on a directory, move the cursor to the desired item.Click the trackball button to highlight this item. If more than one item can be selected, such aswith the COPY TESTS feature, a check mark (√) will appear next to the item to indicate that ithas been selected.
Several items in a row can beselected at one time byholding down the trackballbutton, dragging the cursor tohighlight and check (√)several items, and then lettinggo of the button. Afterdragging, only the last itemwill remain highlighted;however, each item selectedwill have a check mark nextto it.
To deselect a chosen item, move the cursor to a highlighted or checked (√) item and click thetrackball button. The check mark next to the item will disappear.
Screen saver The HFA II features a screen saver to extend the life of the video screen. It activates after theHFA II has been idle for 10 minutes. The screen saver will disappear when the touch screen ispressed, a key on the external keyboard is pressed, or the trackball is moved.
Figure 2.5: The Screen Saver

GENERAL OPERATION
REV. A 10/98 PN 47653-1 HUMPHREY FIELD ANALYZER II
2-9
THE MAIN MENU SCREEN
When the HFA II is turned on, the first screen displayed, after the start-up sequence, is theMain Menu screen. Its primary functions are to display a series of test buttons (from which youinitiate the testing procedure), allow recall of the last test performed, and provide access to theSystem Setup screen. A further explanation of Main Menu functions follows Figure 2.6 below.
Figure 2.6: The Main Menu Screen
Command buttons
A Test ButtonEach test button displays the name of a test. Pressing the test button allows you to choose theeye to be tested. See Section 3: “Using Test Buttons” for more information.
Recall Last TestThis button accesses the results from the last right and left eye tests performed. When theHFA II is first powered on, this button appears ghosted. It will remain inaccessible until a testhas been run. The memory is cleared when the instrument is turned off.
Show Test LibraryThis button leads to a list of all available test patterns, including Screening, Threshold,Specialty, Custom, and Kinetic tests. When you want to select a test not found on the Main Menuscreen, choose the SHOW TEST LIBRARY button. See Section 3: “The Test Library” for details.
The Main Menu test buttons may be customized to reflect your needs. Any test in the TestLibrary may be placed on the Main Menu screen. Buttons which are not used very often may beremoved. A second line of text can be added to test buttons to differentiate tests with the samename but having different parameters. See “Altering the Main Menu Screen” for additionalinformation.

GENERAL OPERATION
REV. A 10/98 PN 47653-1 HUMPHREY FIELD ANALYZER II
2-10
SYSTEM SETUPThe System Setup screen is accessed by pressing the SYSTEM SETUP icon located on the MainMenu screen. You may choose from a variety of selections on the two System Setup screens: themain System Setup screen shown in Figure 2.7 and the Additional Setup screen illustrated inFigure 2.8. Your selections will determine the mode in which your HFA II will power-up. Anexplanation of the System Setup functions and procedures to alter the settings are described onthe following pages.
Figure 2.7: The Main System Setup Screen
LanguageThe HFA II allows you to choose among English, German, Spanish, French, Italian andJapanese languages. If you select a different language from the current language set, the HFA IIwill automatically reboot in that language. The original language must be re-selected in orderto be reactivated.
Head Tracking (model 750 only)When Head Tracking is turned ON, the instrument moves the chin rest during a test to keep thepatient’s eye centered behind the trial lens holder. This action helps to reduce trial lensartifacts (test points being blocked from the patient's view by the edge of the trial lens). Thisfeature only works if Gaze Tracking has been successfully initialized and the trial lens holder isin the Up position. For more information see Section 5: “Head Tracking”.
Vertex Monitor (model 750 only)When the Vertex Monitor is turned ON, a beep is sounded and a message is displayed if thepatient’s head is too far back from the trial lens during a test. This helps to eliminate the triallens as a source of visual field defects. This feature only works if Gaze Tracking has beensuccessfully initialized and the trial lens holder is in the Up position. For tips on using thisfeature, see Section 5: “Vertex Monitor”.
Set Time and DateThis allows you to reset the instrument’s internal clock and calendar in a format appropriatefor your geographic region. Accurate date information is critical for correct STATPAC analysis,age-corrected screening tests, and proper trial lens calculations.

GENERAL OPERATION
REV. A 10/98 PN 47653-1 HUMPHREY FIELD ANALYZER II
2-11
Print System LogThe system log prints the instrument serial number and configuration options along withmessages occurring in the HFA II. This feature is designed to be used by Humphrey FieldService representatives. Should you experience a problem with your instrument, it is a goodidea to print the system log before calling Humphrey Customer Service.
Save/Transmit OptionThis option allows the user to change the SAVE button functionality on the End of Test screen.Choices are Transmit Only, Save Only, or Save and Transmit. Transmit allows the user to send(transmit) data via a serial interface cable to an outside computer system at the end of everytest.
PrinterThis option allows you to designate the printer type to be used with your instrument. Thechoices are HP LaserJet and Printrex. The HFA II supports the following HP LaserJet Models:2, 2P, 2P+, 3, 3P, 3P+, 4, 4L, 4MP, 4P, 5L, 5P, 6L, and 6P.
VA (Visual Acuity) FormatSelect 20/20 Snellen, 6/6 Metric, or 1.0 Decimal as the visual acuity format used when enteringpatient data.
Auto Pupil (model 750 only)If Auto Pupil is set to ON, the HFA II will automatically take a measurement of the patient’spupil diameter and enter the finding on the Patient Data 2 screen. An asterisk (*) is addedwhenever the measurement was made automatically. Manual pupil measurement input isdisplayed without an asterisk. The pupil diameter will also appear on the printout. This featureonly works if Gaze Tracking has been successfully initialized. For more information on GazeTracking, see Section 5: “Gaze Tracking”.
Personalized I.D.This allows you to customize hard copy printouts with 5 lines of text (e.g. practice name,address, and telephone number).
Alter Main MenuThis allows you to customize the Main Menu screen by adding test buttons which normally areonly accessible through the test library, by deleting test buttons which are not often used, or byaltering test buttons to power-up with your preferred testing parameters. Additional text may beadded to further describe the parameters or usage of customized buttons. See “Altering theMain Menu Screen” for details.
Additional SetupThis allows you to access additional System Setup functions located on the Additional Setupscreen.
GENERAL OPERATION
REV. A 10/98 PN 47653-1 HUMPHREY FIELD ANALYZER II
2-12
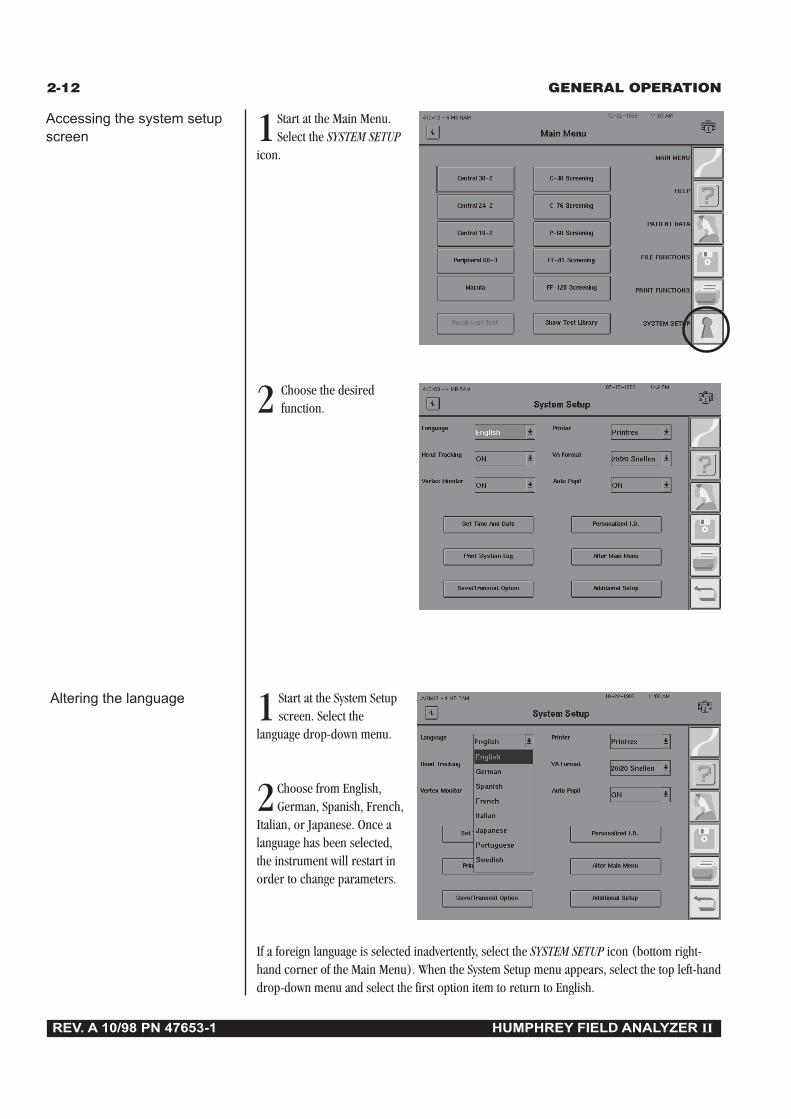
1Start at the Main Menu.Select the SYSTEM SETUP
icon.
2 Choose the desiredfunction.
1 Start at the System Setupscreen. Select the
language drop-down menu.
2Choose from English,German, Spanish, French,
Italian, or Japanese. Once alanguage has been selected,the instrument will restart inorder to change parameters.
If a foreign language is selected inadvertently, select the SYSTEM SETUP icon (bottom right-hand corner of the Main Menu). When the System Setup menu appears, select the top left-handdrop-down menu and select the first option item to return to English.
Accessing the system setupscreen
Altering the language
GENERAL OPERATION
REV. A 10/98 PN 47653-1 HUMPHREY FIELD ANALYZER II
2-13
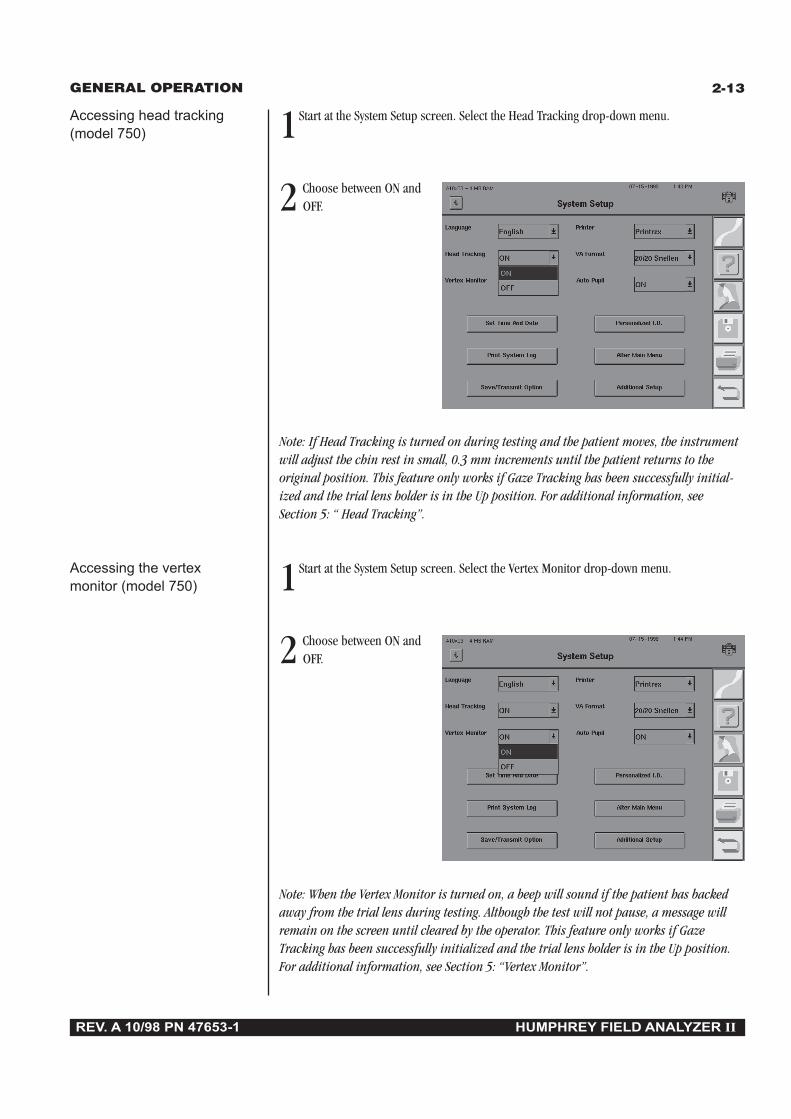
Accessing head tracking 1Start at the System Setup screen. Select the Head Tracking drop-down menu.(model 750)
2 Choose between ON andOFF.
Note: If Head Tracking is turned on during testing and the patient moves, the instrumentwill adjust the chin rest in small, 0.3 mm increments until the patient returns to theoriginal position. This feature only works if Gaze Tracking has been successfully initial-ized and the trial lens holder is in the Up position. For additional information, seeSection 5: “ Head Tracking”.
Accessing the vertex 1Start at the System Setup screen. Select the Vertex Monitor drop-down menu.monitor (model 750)
2 Choose between ON andOFF.
Note: When the Vertex Monitor is turned on, a beep will sound if the patient has backedaway from the trial lens during testing. Although the test will not pause, a message willremain on the screen until cleared by the operator. This feature only works if GazeTracking has been successfully initialized and the trial lens holder is in the Up position.For additional information, see Section 5: “Vertex Monitor”.
GENERAL OPERATION
REV. A 10/98 PN 47653-1 HUMPHREY FIELD ANALYZER II
2-14
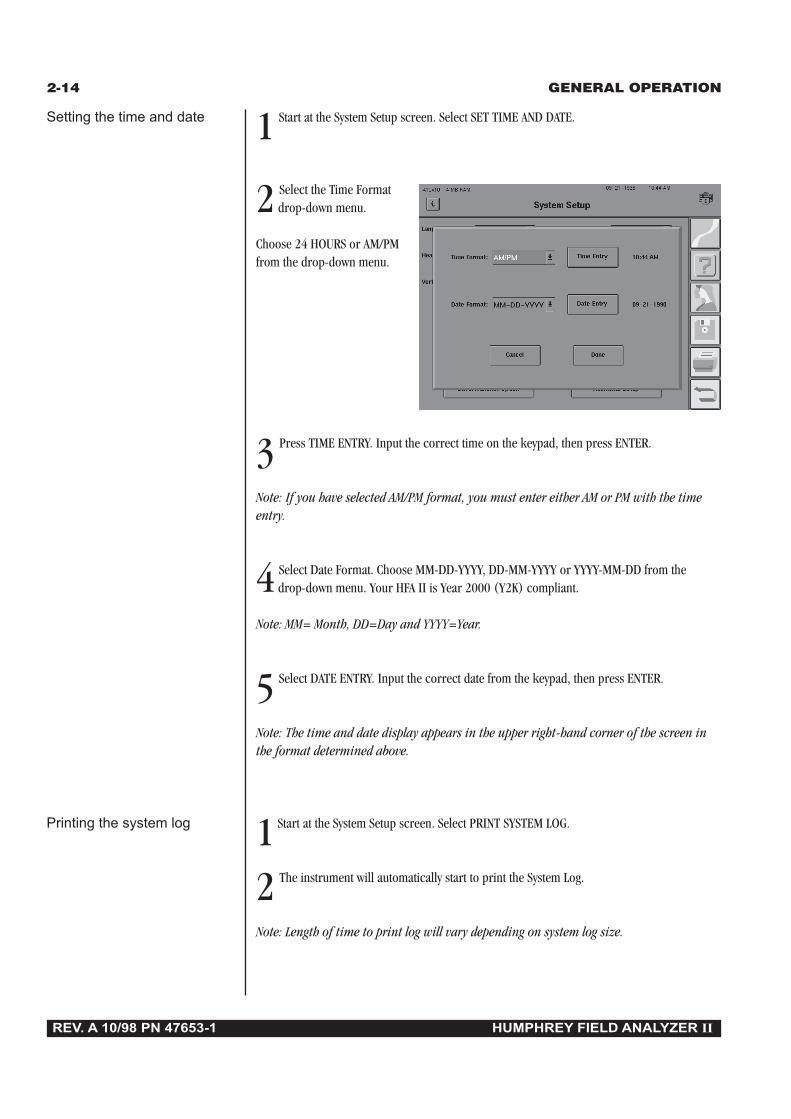
Setting the time and date 1 Start at the System Setup screen. Select SET TIME AND DATE.
2 Select the Time Formatdrop-down menu.
Choose 24 HOURS or AM/PMfrom the drop-down menu.
3 Press TIME ENTRY. Input the correct time on the keypad, then press ENTER.
Note: If you have selected AM/PM format, you must enter either AM or PM with the timeentry.
4 Select Date Format. Choose MM-DD-YYYY, DD-MM-YYYY or YYYY-MM-DD from thedrop-down menu. Your HFA II is Year 2000 (Y2K) compliant.
Note: MM= Month, DD=Day and YYYY=Year.
5 Select DATE ENTRY. Input the correct date from the keypad, then press ENTER.
Note: The time and date display appears in the upper right-hand corner of the screen inthe format determined above.
Printing the system log 1 Start at the System Setup screen. Select PRINT SYSTEM LOG.
2 The instrument will automatically start to print the System Log.
Note: Length of time to print log will vary depending on system log size.
GENERAL OPERATION
REV. A 10/98 PN 47653-1 HUMPHREY FIELD ANALYZER II
2-15
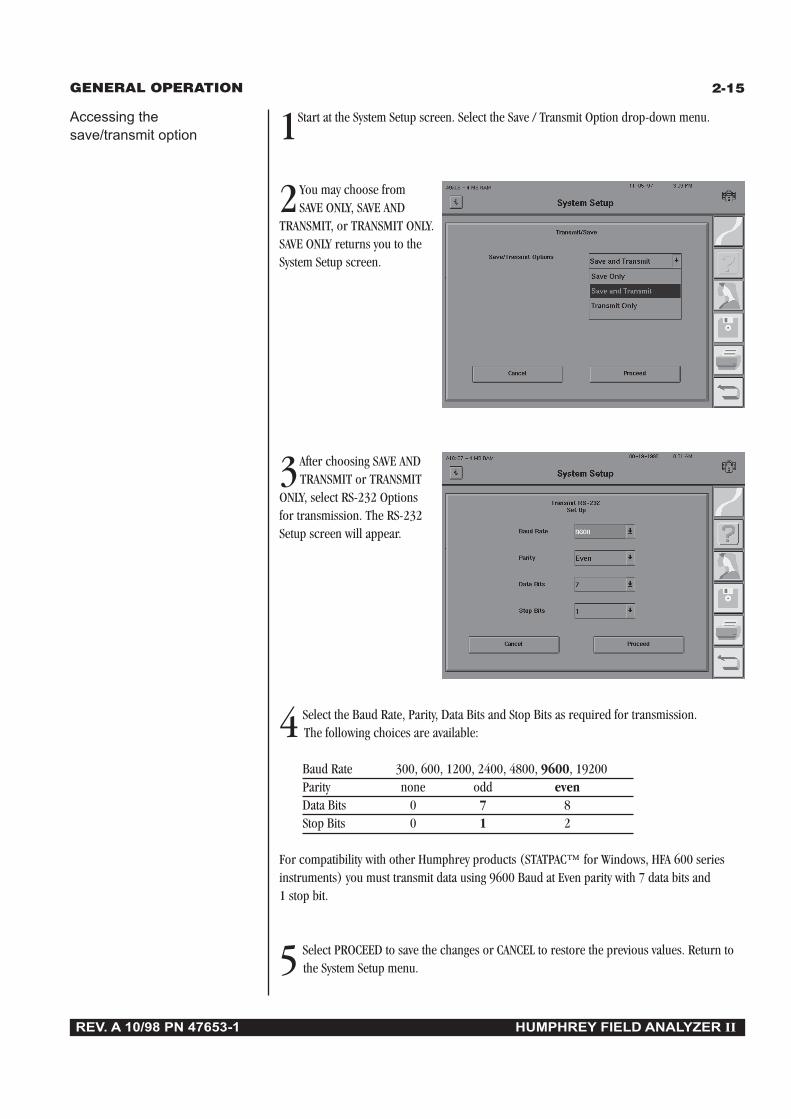
Accessing the 1Start at the System Setup screen. Select the Save / Transmit Option drop-down menu.save/transmit option
2You may choose fromSAVE ONLY, SAVE AND
TRANSMIT, or TRANSMIT ONLY.SAVE ONLY returns you to theSystem Setup screen.
3After choosing SAVE ANDTRANSMIT or TRANSMIT
ONLY, select RS-232 Optionsfor transmission. The RS-232Setup screen will appear.
4 Select the Baud Rate, Parity, Data Bits and Stop Bits as required for transmission.The following choices are available:
Baud Rate 300, 600, 1200, 2400, 4800, 9600, 19200Parity none odd evenData Bits 0 7 8Stop Bits 0 1 2
For compatibility with other Humphrey products (STATPAC™ for Windows, HFA 600 seriesinstruments) you must transmit data using 9600 Baud at Even parity with 7 data bits and1 stop bit.
5 Select PROCEED to save the changes or CANCEL to restore the previous values. Return to the System Setup menu.

GENERAL OPERATION
REV. A 10/98 PN 47653-1 HUMPHREY FIELD ANALYZER II
2-16
Selecting the printer type 1 Start at the System Setup screen. Select the Printer drop-down menu.
2 Choose betweenHP LASERJET and
PRINTREX.
Selecting a visual 1 Start at the System Setup screen. Select the VA Format drop-down menu.acuity format
2Choose from20/20 SNELLEN,
6/6 METRIC, or 1.0 DECIMAL.
GENERAL OPERATION
REV. A 10/98 PN 47653-1 HUMPHREY FIELD ANALYZER II
2-17
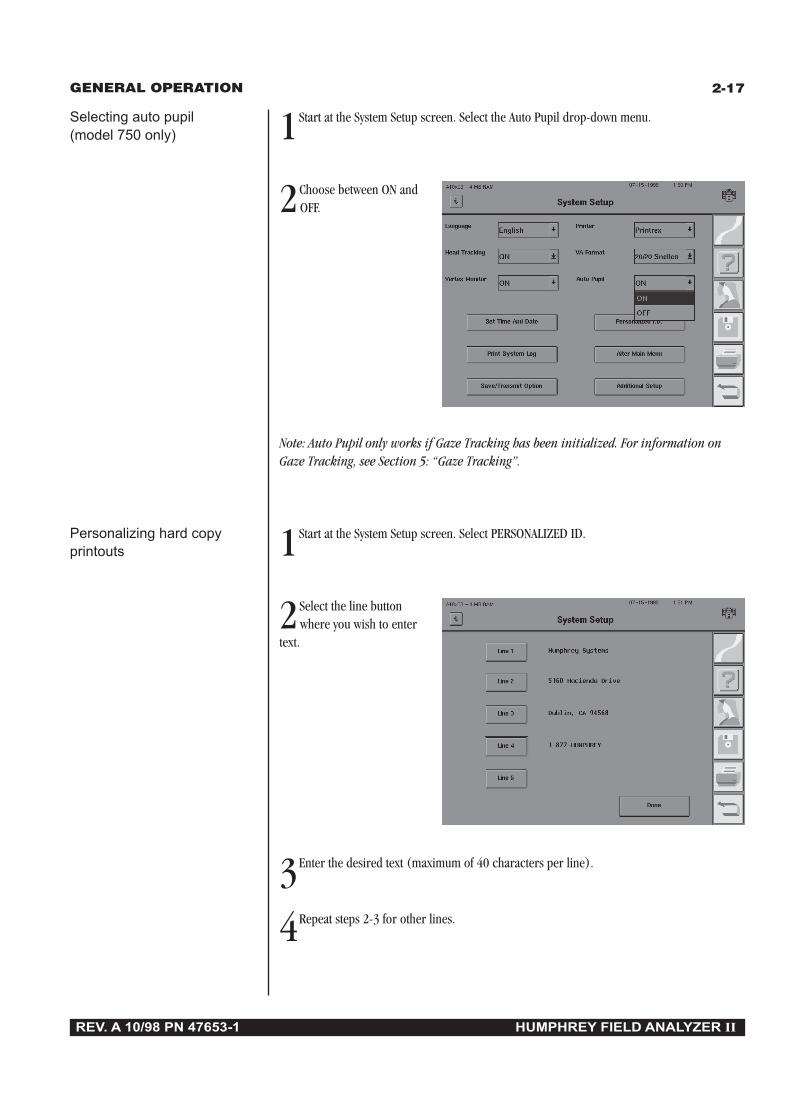
Selecting auto pupil 1Start at the System Setup screen. Select the Auto Pupil drop-down menu.(model 750 only)
2Choose between ON andOFF.
Note: Auto Pupil only works if Gaze Tracking has been initialized. For information onGaze Tracking, see Section 5: “Gaze Tracking”.
Personalizing hard copy 1Start at the System Setup screen. Select PERSONALIZED ID.printouts
2Select the line buttonwhere you wish to enter
text.
3Enter the desired text (maximum of 40 characters per line).
4Repeat steps 2-3 for other lines.
GENERAL OPERATION
REV. A 10/98 PN 47653-1 HUMPHREY FIELD ANALYZER II
2-18
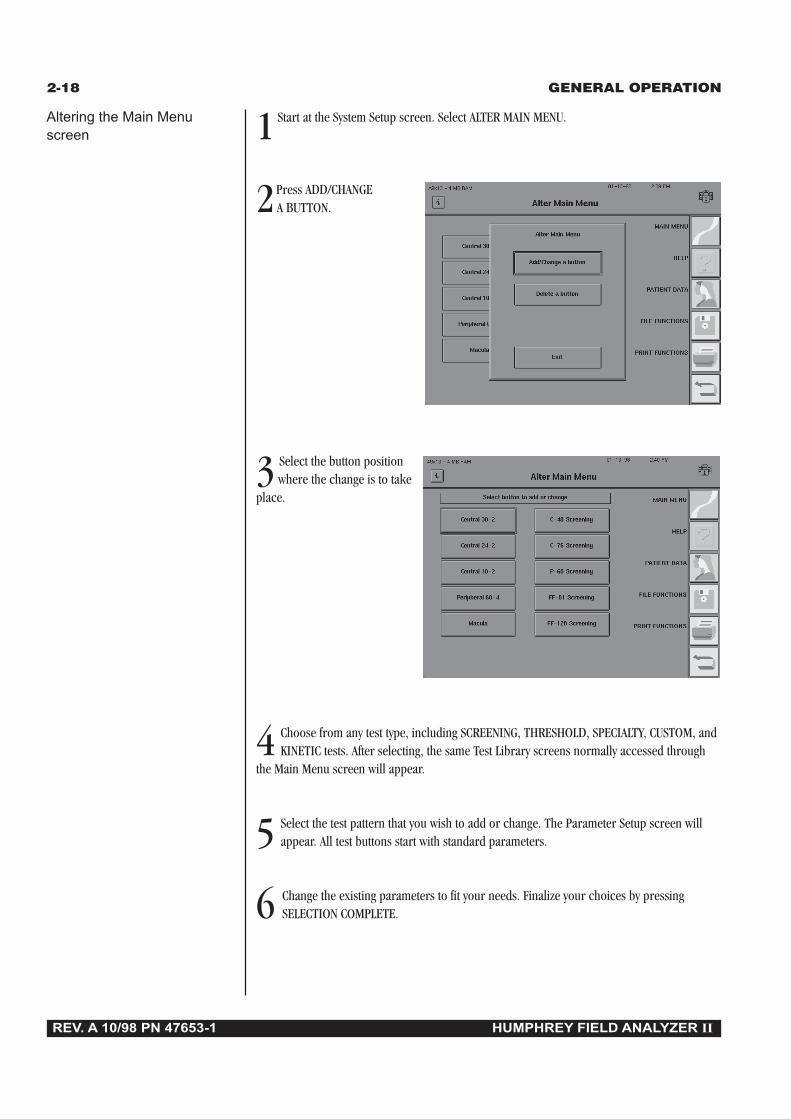
Altering the Main Menu 1 Start at the System Setup screen. Select ALTER MAIN MENU.screen
2Press ADD/CHANGEA BUTTON.
3 Select the button positionwhere the change is to take
place.
4 Choose from any test type, including SCREENING, THRESHOLD, SPECIALTY, CUSTOM, andKINETIC tests. After selecting, the same Test Library screens normally accessed through
the Main Menu screen will appear.
5 Select the test pattern that you wish to add or change. The Parameter Setup screen willappear. All test buttons start with standard parameters.
6 Change the existing parameters to fit your needs. Finalize your choices by pressingSELECTION COMPLETE.
GENERAL OPERATION
REV. A 10/98 PN 47653-1 HUMPHREY FIELD ANALYZER II
2-19
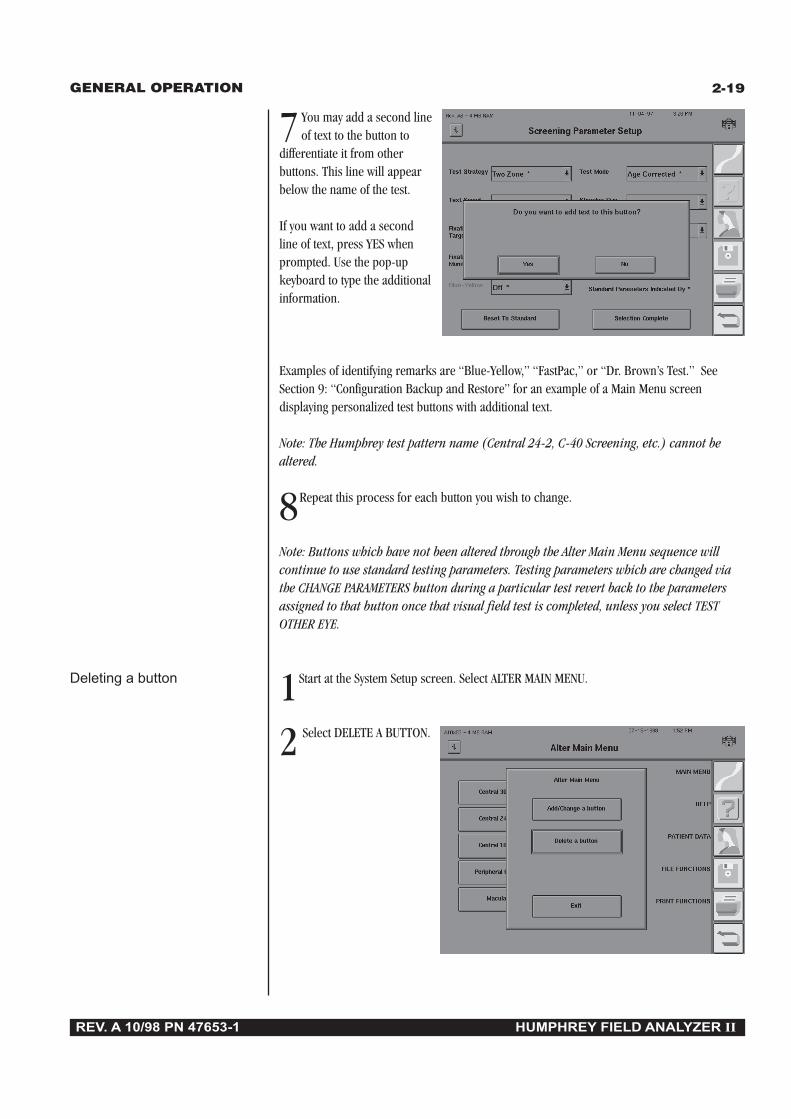
7You may add a second lineof text to the button to
differentiate it from otherbuttons. This line will appearbelow the name of the test.
If you want to add a secondline of text, press YES whenprompted. Use the pop-upkeyboard to type the additionalinformation.
Examples of identifying remarks are “Blue-Yellow,” “FastPac,” or “Dr. Brown’s Test.” SeeSection 9: “Configuration Backup and Restore” for an example of a Main Menu screendisplaying personalized test buttons with additional text.
Note: The Humphrey test pattern name (Central 24-2, C-40 Screening, etc.) cannot bealtered.
8Repeat this process for each button you wish to change.
Note: Buttons which have not been altered through the Alter Main Menu sequence willcontinue to use standard testing parameters. Testing parameters which are changed viathe CHANGE PARAMETERS button during a particular test revert back to the parametersassigned to that button once that visual field test is completed, unless you select TESTOTHER EYE.
Deleting a button 1Start at the System Setup screen. Select ALTER MAIN MENU.
2 Select DELETE A BUTTON.
GENERAL OPERATION
REV. A 10/98 PN 47653-1 HUMPHREY FIELD ANALYZER II
2-20
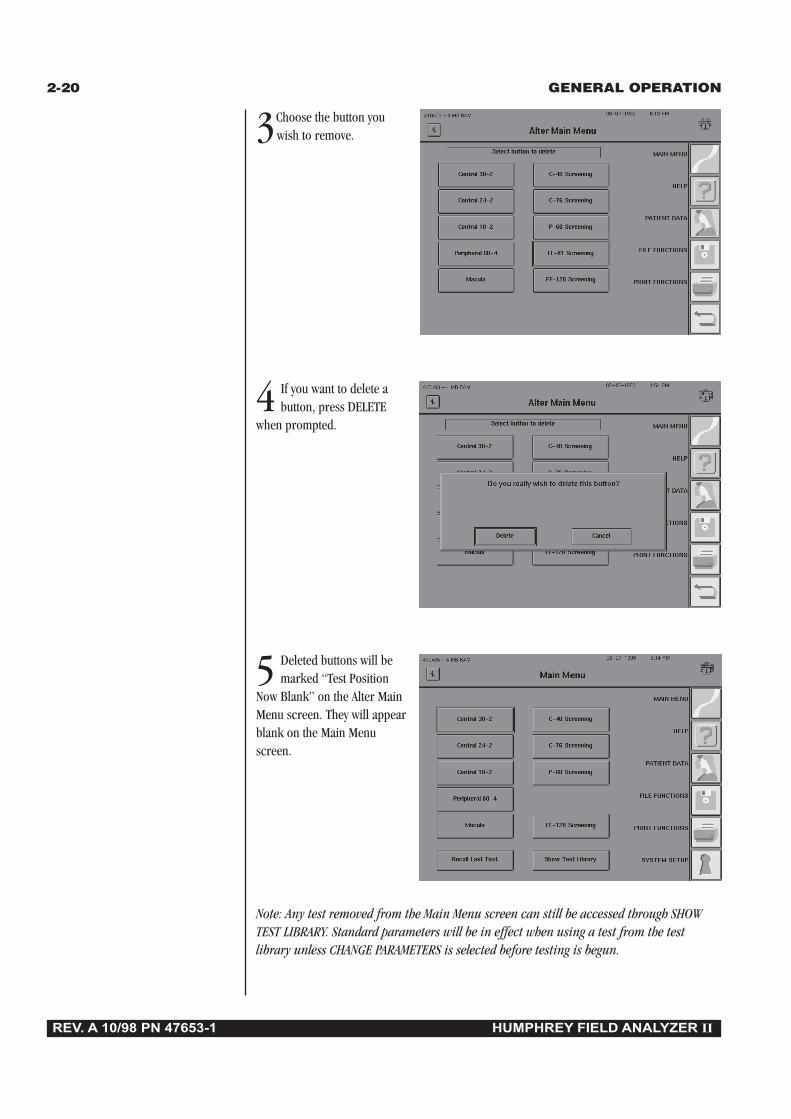
3Choose the button youwish to remove.
4 If you want to delete abutton, press DELETE
when prompted.
5 Deleted buttons will bemarked “Test Position
Now Blank” on the Alter MainMenu screen. They will appearblank on the Main Menuscreen.
Note: Any test removed from the Main Menu screen can still be accessed through SHOWTEST LIBRARY. Standard parameters will be in effect when using a test from the testlibrary unless CHANGE PARAMETERS is selected before testing is begun.

GENERAL OPERATION
REV. A 10/98 PN 47653-1 HUMPHREY FIELD ANALYZER II
2-21
Adding text to an There is no direct method for adding text to an existing button without going through theexisting button “Altering the Main Menu Screen” sequence described previously. Be sure to note the test type
and parameters used on the existing button before selecting ADD/CHANGE A BUTTON.Designate the same test along with the same testing parameters. When the “Do you want to addtext to this button?” dialog box appears, press YES.
ADDITIONAL SETUPThe Additional Setup screen is accessed by pressing the ADDITIONAL SETUP button located on thelower right of the System Setup screen. Brief descriptions of the functions available on this screenare cited below.
Figure 2.8: Additional Setup Screen
SimulationThis button is used to demonstrate and verify software function. Press the button to changebetween ON and OFF. If a test runs while simulation is ON, sample threshold data will appearon the screen in a matter of seconds. Turn simulation OFF before running any tests on patients.Simulation automatically turns OFF when the instrument is powered off.
Switch BeepThe patient response button is designed to give audio feedback every time the button ispressed. Press the SWITCH BEEP button to change between ON and OFF. SWITCH BEEP may beturned OFF prior to a test by pressing this button.
Touch Screen CalibrationOccasionally, pressing the touch screen will activate the button next to the one you intended topress. The touch screen alignment can be reset by pressing this button and following theinstructions on the screen. See Section 12: “Touch Screen Calibration”.
Custom TestThis button brings you the Custom Test Options pop-up window. It allows you to create ordelete a Custom test pattern. For more information see Section 10: “Custom Testing” for moredetails.
GENERAL OPERATION
REV. A 10/98 PN 47653-1 HUMPHREY FIELD ANALYZER II
2-22
Backup ConfigurationYou may save your customized Main Menu buttons (created with the “Altering the Main Menu”feature) and Custom test patterns on a floppy disk. This function protects the information incase of a hard disk problem. See Section 9: “To Backup Configurations”.
Restore ConfigurationThis function allows you to restore the information that was saved using the BACKUPCONFIGURATION button. See Section 9: “To Restore Configurations” for details.
Caution: Restoring from a floppy disk will change the current Main Menu configu-ration. It also replaces all custom tests in the Custom test library.
Cleanup Hard Disk Database (models 735, 740, 745, 750)This feature deletes files containing patient data with no associated test data. This can occurwhen patient data is entered, but the test is not saved. This can also happen when patient datais entered early in the day for convenience, but the patient does not take the visual field test.Pressing the CLEANUP HARD DISK DATABASE button will remove all the “unassociated” datafrom the database. See Section 9: “Cleanup Hard Disk Database” to utilize this feature.
Rebuild Hard Disk Database (models 735, 740, 745, 750)The rebuild function is used in the event of a database failure. Rebuilding the patient databasemay take several hours to complete, depending upon the number of files present. It is best toperform this function at the end of a day or over a weekend. See Section 9: “Rebuild Hard DiskDatabase” for more information.
Rebuild Floppy DatabaseThis allows the user to rebuild the database on a floppy disk. A full floppy disk may takeseveral minutes to rebuild. See Section 9: “Rebuild Floppy Disk Database” for details.
Blue-Yellow InitializationThis button was used for the one-time A6 software initialization procedure. You will not needto perform this initialization.
DiagnosticsThis feature is only accessed by Humphrey Service Technicians. It leads to a variety of testsused for system calibration and repair.
Return to System SetupThis button returns you to the main System Setup screen.
GENERAL OPERATION
REV. A 10/98 PN 47653-1 HUMPHREY FIELD ANALYZER II
2-23
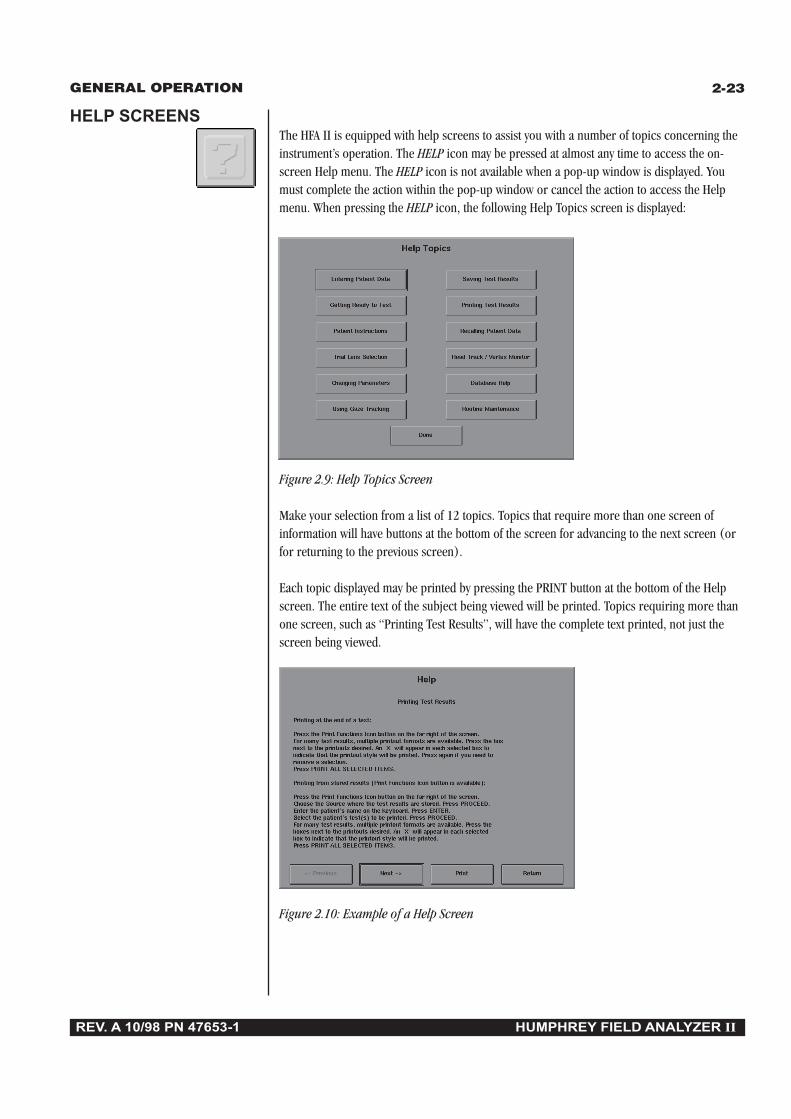
HELP SCREENSThe HFA II is equipped with help screens to assist you with a number of topics concerning theinstrument’s operation. The HELP icon may be pressed at almost any time to access the on-screen Help menu. The HELP icon is not available when a pop-up window is displayed. Youmust complete the action within the pop-up window or cancel the action to access the Helpmenu. When pressing the HELP icon, the following Help Topics screen is displayed:
Figure 2.9: Help Topics Screen
Make your selection from a list of 12 topics. Topics that require more than one screen ofinformation will have buttons at the bottom of the screen for advancing to the next screen (orfor returning to the previous screen).
Each topic displayed may be printed by pressing the PRINT button at the bottom of the Helpscreen. The entire text of the subject being viewed will be printed. Topics requiring more thanone screen, such as “Printing Test Results”, will have the complete text printed, not just thescreen being viewed.
Figure 2.10: Example of a Help Screen

GENERAL OPERATION
REV. A 10/98 PN 47653-1 HUMPHREY FIELD ANALYZER II
2-24
When you have finished with the help topic, press RETURN to return to the Help Topics screen.Pressing DONE on the Help Topics screen will return you to the screen where you first pressedthe HELP icon. For example, if you were at the “End of Test” screen when you originallypressed the HELP icon, you will return to the same “End of Test” screen when you press DONEon the Help Topics screen.
Consult the User’s Guide for additional information on the subject of interest. The following isthe list of on-screen Help topics and the main areas within this User’s Guide to find additionalinformation:
• Entering Patient Data – Section 3
• Getting Ready to Test – Section 3
• Patient Instructions – Section 3
• Trial Lens Selection – Section 3
• Changing Parameters – Section 4
• Using Gaze Tracking – Section 5
• Saving Test Results – Section 5
• Printing Test Results – Section 7
• Recalling Patient Data – Section 3
• Head Tracking/Vertex Monitor – Section 5
• Database Help – Section 9
• Routine Maintenance – Section 12

REV. A10 9/98 PN 47653-1 HUMPHREY FIELD ANALYZER II
Selecting the Test Pattern and Test Eye 3-2
Entering Patient Data 3-8
Using Trial Lenses 3-19
Preparing the Patient 3-22
Pre-test activities are broken down into the steps listed above. This section covers each step indetail so that you can perform them all competently and efficiently.
Also included:
• a complete listing of available tests and their applications• the proper use of trial lenses
• patient testing instructions• hints on positioning the patient comfortably.
Setting-Up Tests 3
ChecklistChecklistChecklistChecklistChecklist
Selecting the test pattern
and test eye
Entering patient data
Using trial lenses
Preparing the patient
✔
✔✔✔
3-2 SETTING-UP TESTS
REV. A 10/98 PN 47653-1 HUMPHREY FIELD ANALYZER II
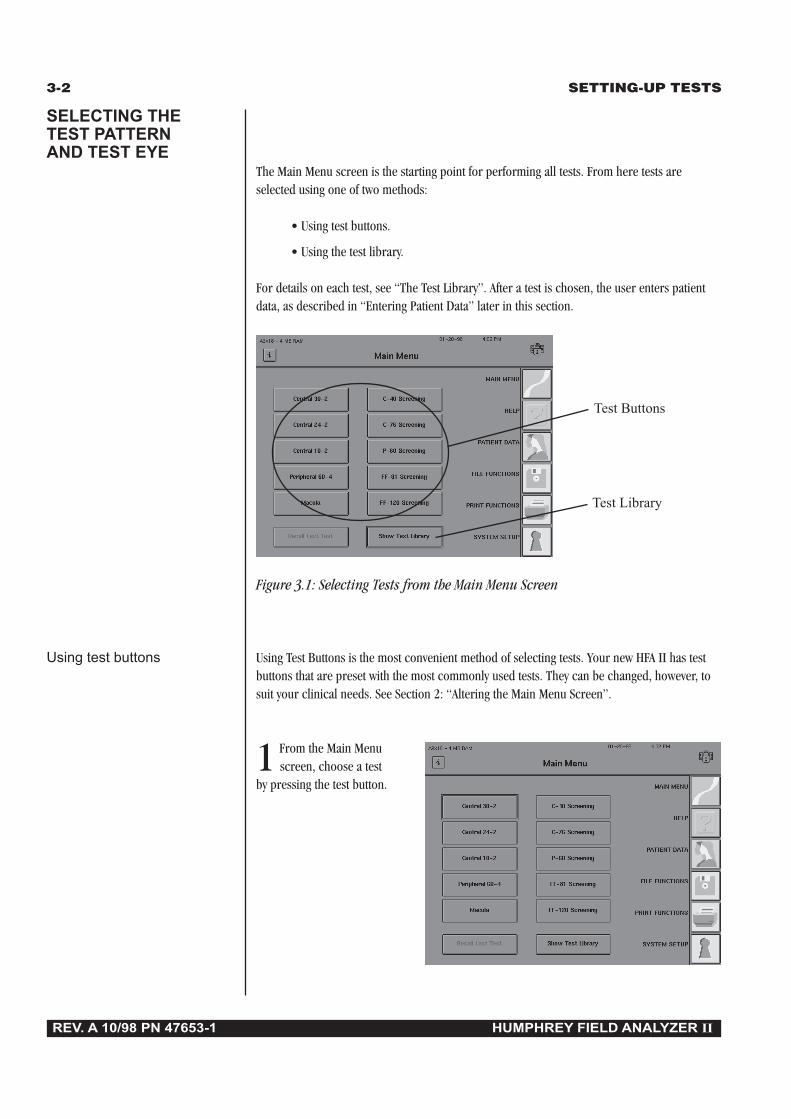
The Main Menu screen is the starting point for performing all tests. From here tests areselected using one of two methods:
• Using test buttons.
• Using the test library.
For details on each test, see “The Test Library”. After a test is chosen, the user enters patientdata, as described in “Entering Patient Data” later in this section.
Figure 3.1: Selecting Tests from the Main Menu Screen
Using test buttons Using Test Buttons is the most convenient method of selecting tests. Your new HFA II has testbuttons that are preset with the most commonly used tests. They can be changed, however, tosuit your clinical needs. See Section 2: “Altering the Main Menu Screen”.
1 From the Main Menu screen, choose a test
by pressing the test button.
SELECTING THETEST PATTERNAND TEST EYE
Test Buttons
Test Library

SETTING-UP TESTS 3-3
REV. A 10/98 PN 47653-1 HUMPHREY FIELD ANALYZER II
2 Select the test eye. ChooseRIGHT or LEFT to proceed,
or CANCEL to go back to theMain Menu screen.
3 Refer to “Entering Patient Data,” later in this section, to continue test setup.
Using the test library Use this method to select a test that does not appear on one of the test buttons.
1 From the Main Menu screen, choose SHOW TEST
LIBRARY.
2Select the test type. Choosefrom KINETIC, SCREENING,
CUSTOM, THRESHOLD, orSPECIALTY.
In this example, SCREENING ischosen.

3-4 SETTING-UP TESTS
REV. A 10/98 PN 47653-1 HUMPHREY FIELD ANALYZER II
3 Select the test pattern.Choose from among several
test patterns.
Refer to “Test Library” belowfor information on each pattern.
4Select the test eye. ChooseRIGHT or LEFT to proceed,
or CANCEL to go back to thetest library.
5 Refer to “Entering Patient Data”, later in this section, to continue test setup.
Test library The HFA II offers a variety of screening and threshold test patterns that meet most clinicalneeds. Tables 3.1, 3.2, and 3.3 describe each pattern in order to assist the professional inchoosing the one best suited to the patient’s needs. Appendix E contains diagrams of theavailable test patterns.
The HFA II model 750 offers Kinetic testing and all HFA II models except the 720 can performCustom testing, but there are no preset patterns for these test types. See Section 10 (Custom)and Section 11 (Kinetic) for more information on these test types.
Screening tests serve an important clinical function by quickly surveying the visual field andflagging areas that are highly suspect. They answer the question, “Is there a problem?”.Abnormal test results warrant further investigation with threshold testing.
SETTING-UP TESTS 3-5
REV. A 10/98 PN 47653-1 HUMPHREY FIELD ANALYZER II
Threshold tests more precisely define the problem by calculating the actual sensitivity level ateach test point. They uncover early depressions and subtle changes in retinal sensitivity.
Specialty tests are specially designed screening tests for specific purposes. See Table 3.3 fordetails about the Specialty tests.
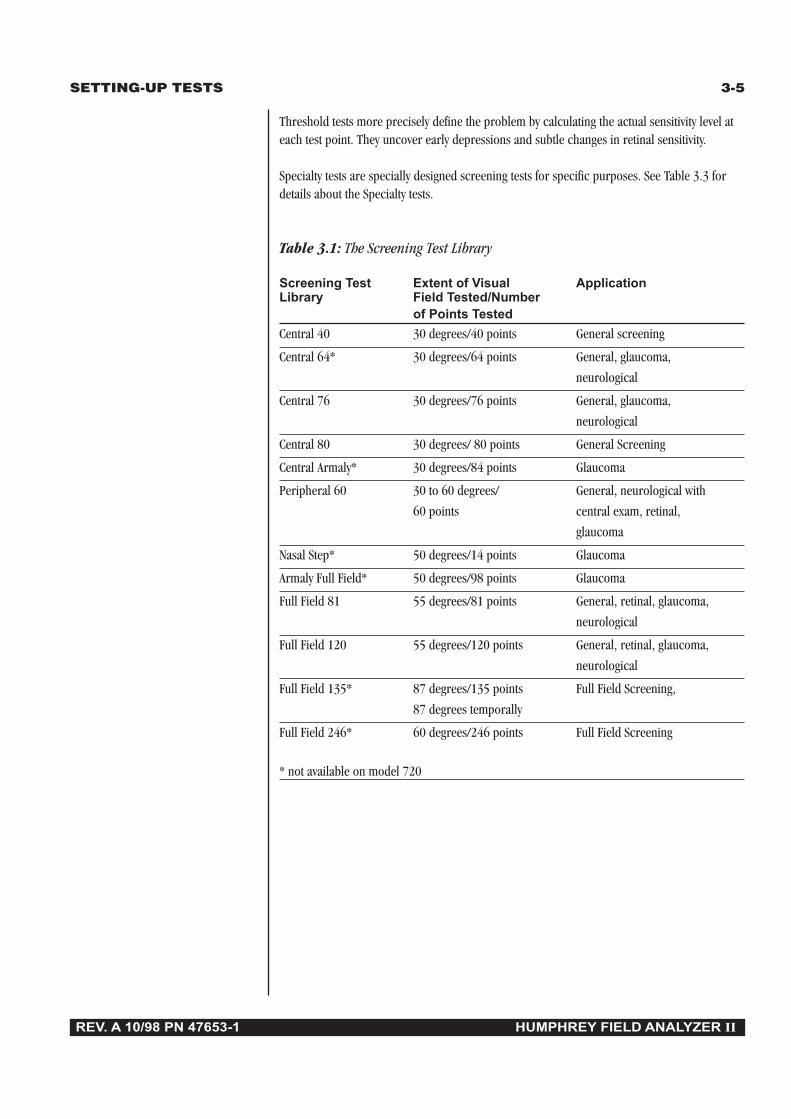
Table 3.1: The Screening Test Library
Screening Test Extent of Visual ApplicationLibrary Field Tested/Number
of Points TestedCentral 40 30 degrees/40 points General screening
Central 64* 30 degrees/64 points General, glaucoma,
neurological
Central 76 30 degrees/76 points General, glaucoma,
neurological
Central 80 30 degrees/ 80 points General Screening
Central Armaly* 30 degrees/84 points Glaucoma
Peripheral 60 30 to 60 degrees/ General, neurological with
60 points central exam, retinal,
glaucoma
Nasal Step* 50 degrees/14 points Glaucoma
Armaly Full Field* 50 degrees/98 points Glaucoma
Full Field 81 55 degrees/81 points General, retinal, glaucoma,
neurological
Full Field 120 55 degrees/120 points General, retinal, glaucoma,
neurological
Full Field 135* 87 degrees/135 points Full Field Screening,
87 degrees temporally
Full Field 246* 60 degrees/246 points Full Field Screening
* not available on model 720

3-6 SETTING-UP TESTS
REV. A 10/98 PN 47653-1 HUMPHREY FIELD ANALYZER II
Table 3.2: The Threshold Test Library
Threshold Test Extent of Visual Field ApplicationLibrary Tested/Number of
Points Tested10-2 10 degrees/68 point grid Macula, retinal, neurological,
advanced glaucoma
24-2 24 degrees/54 point grid Glaucoma, general, neurological
30-2 30 degrees/76 point grid Glaucoma, retinal, neurological,
general
60-4 30 to 60 degrees/60 points Retinal, glaucoma
Nasal Step* 50 degrees/14 points Glaucoma
Macula* 5 degrees/16 points, Macula
2 degree spacing
* not available on Model 720
Table 3.3: The Specialty Test Library
Specialty Test Extent of Visual Field ApplicationLibrary Tested/Number of
Points TestedEsterman Monocular 75 degrees temporal Functional disability
60 degrees nasal/100 points
Esterman Binocular 150 degrees bitemporal/ Functional disability
120 points
Superior 36* 60 degrees, superior Superior Field Screening
hemifield/36 points
Superior 64* 60 degrees, superior Superior Field Screening
hemifield/64 points
* uses the Bottom LED fixation target

SETTING-UP TESTS 3-7
REV. A 10/98 PN 47653-1 HUMPHREY FIELD ANALYZER II
Test library notes: • The Bottom LED fixation target is automatically used by the HFA II in order to test allpoints of the Superior 36 or Superior 64 point Screening Test. Remember to direct thepatient’s fixation to this lower target. If you manually set the Central target to be usedwith either Superior Field test, some of the most superior points will be omitted fromthe test pattern.
• The Full Field 135 Screening Test will not display all tested points on the screen.However, all points will be tested and may be viewed on the printout.
• To better view the central portion of any completed Full Field test, use the ZOOM buttonlocated on the End of Test or View Test screen.
• Any Full Field test whose central 30 degrees have been tested, may be saved, printedand later recalled from disk without completing the peripheral portion of the test.
• The Central 76 point test grid is identical to that of the 30-2 Central threshold test. Thisallows the practitioner to follow up screening tests with threshold testing at the samepoints. Similarly, the Peripheral 60 screening test has the same test pattern as the 60-4threshold test.
• The Macula Threshold Test will test all 16 points twice if the Fluctuation feature isturned ON. If it is turned OFF, the Macula Threshold Test will determine the thresholdonce. With Fluctuation OFF, the instrument will determine the macular threshold twiceonly if there is a discrepancy with expected values. The Fluctuation function may beaccessed through the Change Parameters menu screen. See Section 6: “FluctuationValues” or Section 7: “Global Indices” for further information.
• The Esterman test scores are based on the percent of seen test points; 100 points formonocular tests and 120 for binocular tests. The HFA II automatically determines thefunctional score as a percentage which is printed on the lower right corner of theprintout. The test incorporates the single intensity strategy and uses a 10 dB stimulus.This value has been standardized by international agreement and may not be altered bythe user.
• Humphrey Systems is grateful to the American Academy of Ophthalmology for providingthe rights to offer the Esterman test for your use.
3-8 SETTING-UP TESTS
REV. A 10/98 PN 47653-1 HUMPHREY FIELD ANALYZER II
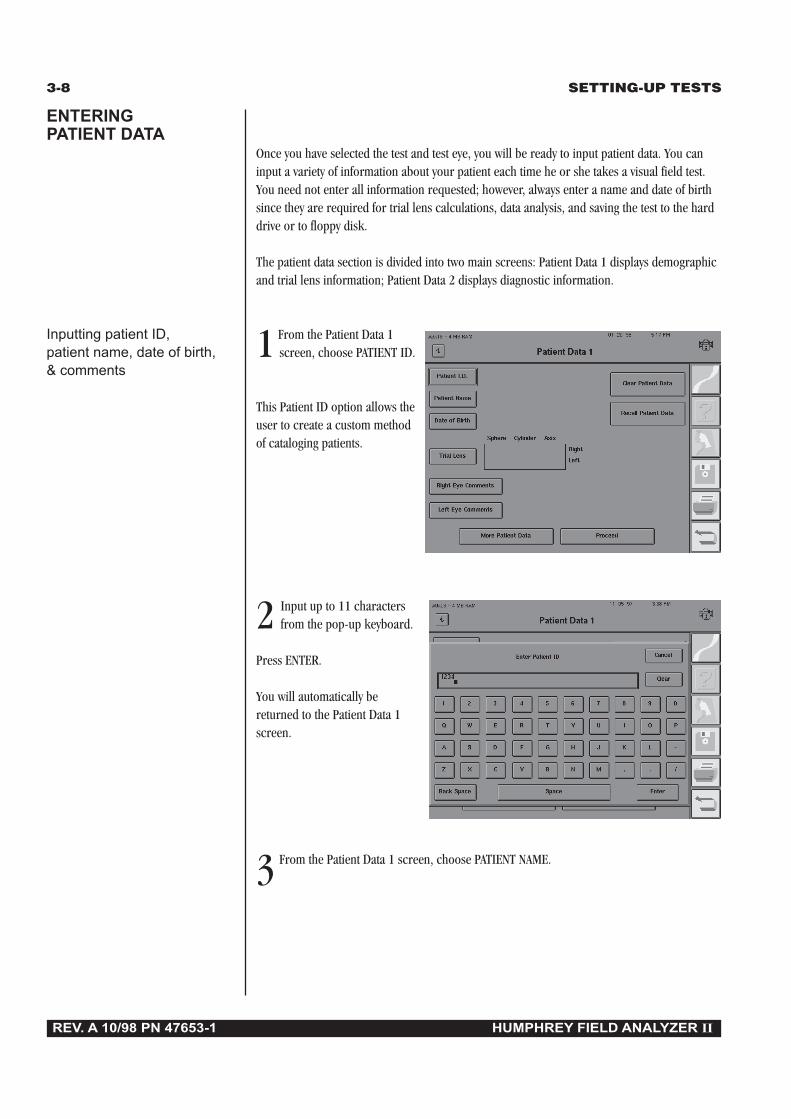
Once you have selected the test and test eye, you will be ready to input patient data. You caninput a variety of information about your patient each time he or she takes a visual field test.You need not enter all information requested; however, always enter a name and date of birthsince they are required for trial lens calculations, data analysis, and saving the test to the harddrive or to floppy disk.
The patient data section is divided into two main screens: Patient Data 1 displays demographicand trial lens information; Patient Data 2 displays diagnostic information.
Inputting patient ID, 1 From the Patient Data 1patient name, date of birth, screen, choose PATIENT ID.& comments
This Patient ID option allows theuser to create a custom methodof cataloging patients.
2 Input up to 11 charactersfrom the pop-up keyboard.
Press ENTER.
You will automatically bereturned to the Patient Data 1screen.
3 From the Patient Data 1 screen, choose PATIENT NAME.
ENTERINGPATIENT DATA

SETTING-UP TESTS 3-9
REV. A 10/98 PN 47653-1 HUMPHREY FIELD ANALYZER II
4Input up to 23 charactersfrom the pop-up keyboard.
Press ENTER.
Note: The HFA II will recognize two tests as belonging to the same patient as long as thefirst and last names have identical spelling and the dates of birth match. The addition ofspaces and/or commas to the names, even if different between entries, does not preventthe HFA II from recognizing these names as identical.
For example, these entries are all handled the same way:“Kennedy, Robin” is the same as“Kennedy ,Robin” or“Kennedy Robin”.
5 Choose DATE OF BIRTH.
6 Input the Month, Day,and Year from the pop-up
keypad, including dashes (-)between entries.
You may enter the year as eithertwo digits or all 4 numbers. Theyear will be displayed in the 4digit format.
Press ENTER.
Note: September 22, 1943 should be entered as 9-22-43. The patient is assumed to be lessthan 100 years old if you enter the year as a two digit number. Your HFA II is Year 2000(Y2K) compliant.
7 Choose RIGHT EYE COMMENTS.
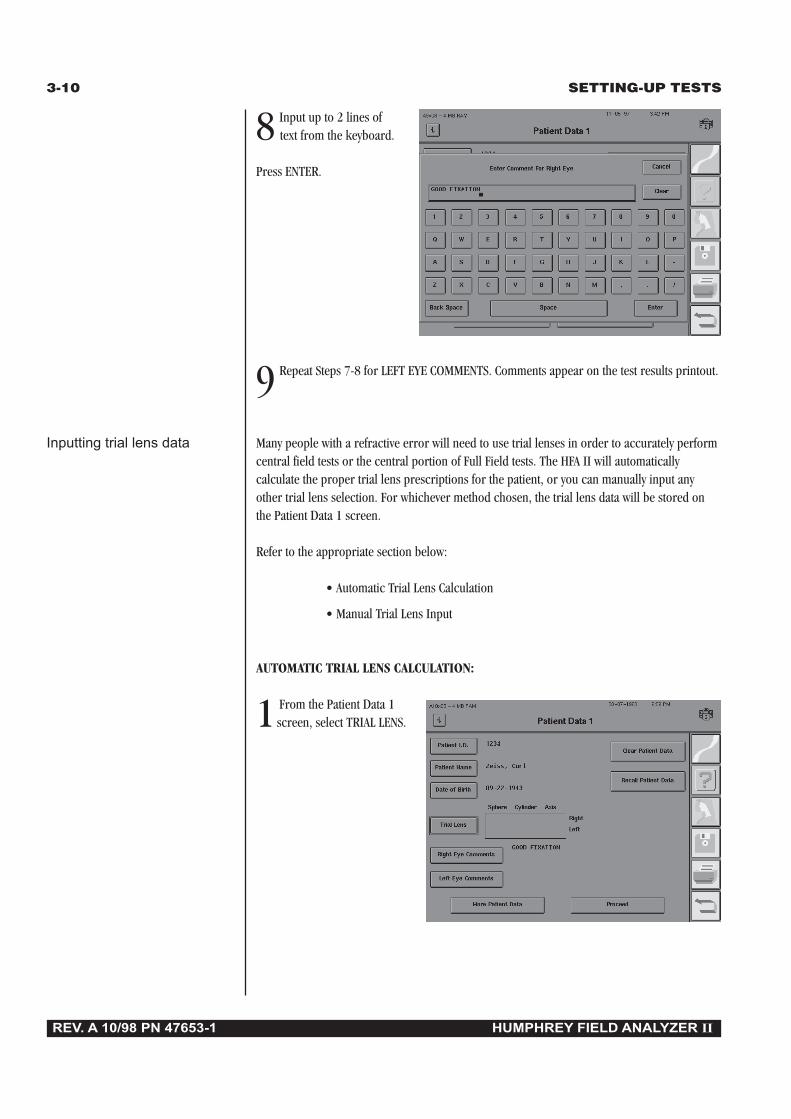
3-10 SETTING-UP TESTS
REV. A 10/98 PN 47653-1 HUMPHREY FIELD ANALYZER II
8 Input up to 2 lines of text from the keyboard.
Press ENTER.
9 Repeat Steps 7-8 for LEFT EYE COMMENTS. Comments appear on the test results printout.
Inputting trial lens data Many people with a refractive error will need to use trial lenses in order to accurately performcentral field tests or the central portion of Full Field tests. The HFA II will automaticallycalculate the proper trial lens prescriptions for the patient, or you can manually input anyother trial lens selection. For whichever method chosen, the trial lens data will be stored onthe Patient Data 1 screen.
Refer to the appropriate section below:
• Automatic Trial Lens Calculation
• Manual Trial Lens Input
AUTOMATIC TRIAL LENS CALCULATION:
1 From the Patient Data 1screen, select TRIAL LENS.

SETTING-UP TESTS 3-11
REV. A 10/98 PN 47653-1 HUMPHREY FIELD ANALYZER II
2 Choose CALCULATE TRIAL LENS.
3For the right eye, selectSPHERE.
If you have not entered thepatient’s date of birth, enter it atthis screen by pressing DATE OFBIRTH. The trial lens cannot becalculated without this patientinformation.
4 Input the patient’s distancesphere correction. Always
remember to enter a plus (+)or minus (-) as the firstcharacter. Press ENTER.
If the patient has no spherecorrection (plano), you mustenter zero (0) for the propertrial lens calculation to be made.
5 Enter correction for cylinder and axis, if needed.

3-12 SETTING-UP TESTS
REV. A 10/98 PN 47653-1 HUMPHREY FIELD ANALYZER II
6 Repeat Steps 4-5 for theleft eye.
Note: SPHERE, CYLINDER, and AXIS may be chosen in any sequence. To correct entries, re-select the command button and then enter the correct data.
7 Select CALCULATE TRIAL LENS.
8 The trial lens data isautomatically entered on the
Patient Data 1 screen.
FOR MANUAL TRIAL LENS INPUT:
1. From the Patient Data 1 screen, select TRIAL LENS.2. Choose MANUAL TRIAL LENS INPUT.3. Repeat Steps 3-6 above.4. Choose ENTRY COMPLETE. The manually entered trial lens data is automatically entered onPatient Data 1.
Note: For guidelines on selecting the proper trial lens (for manual input), refer to “UsingTrial Lenses” and Table 3.4.

SETTING-UP TESTS 3-13
REV. A 10/98 PN 47653-1 HUMPHREY FIELD ANALYZER II
Clearing patient data Often you will want to enter information for a new patient on a blank Patient Data screen.To remove all information on the Patient Data 1 and Patient Data 2 screens, use CLEARPATIENT DATA.
1 From the Patient Data 1 screen, choose CLEAR PATIENT DATA.
2 Read the confirmation question and answer
appropriately.
Note: Clearing Patient Data only deletes information from the screen. It does not deleteinformation from the database if the patient data was previously saved.
Recalling patient data When patients return for follow-up testing, you save time and ensure consistency by recallingpreviously entered patient data from stored files.
1 From the Patient Data 1 screen, choose RECALL PATIENT DATA to automatically transfer patient information from memory to the patient data screen(s).
2 Select the Source(HARD DRIVE or FLOPPY).
Choose PROCEED.
3 The keyboard appears. Typea few letters of the name
you wish to find.
Press ENTER.
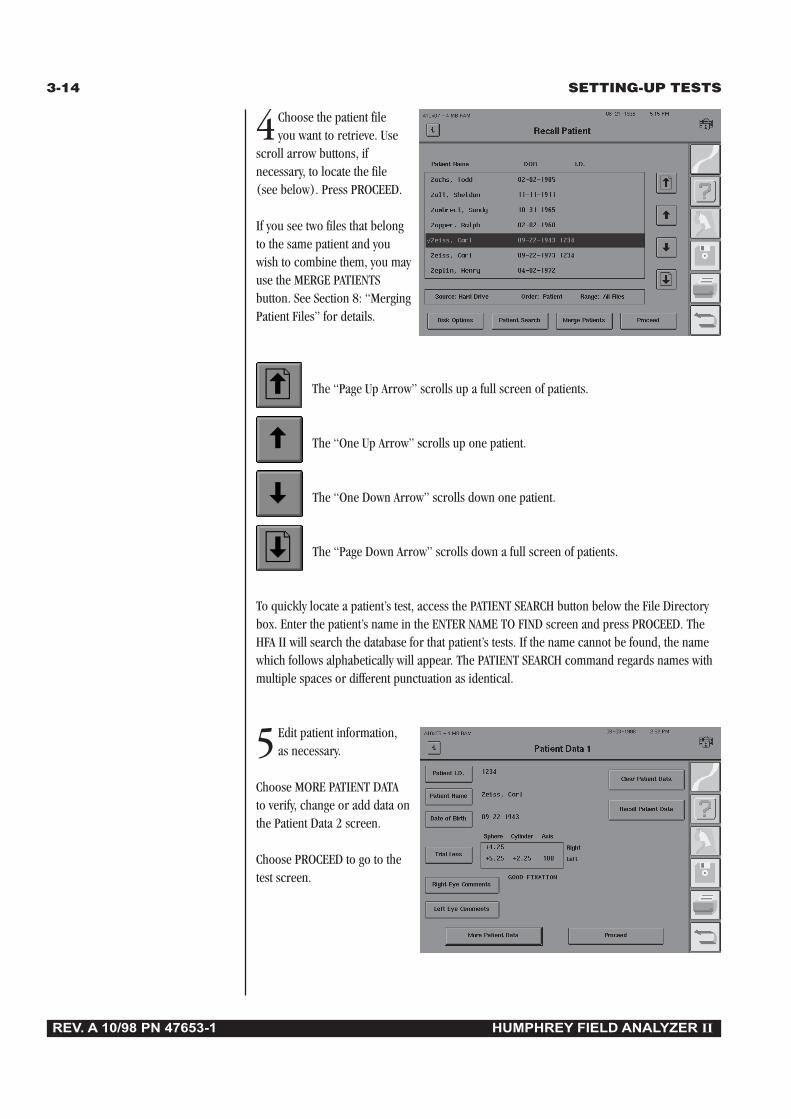
3-14 SETTING-UP TESTS
REV. A 10/98 PN 47653-1 HUMPHREY FIELD ANALYZER II
4 Choose the patient fileyou want to retrieve. Use
scroll arrow buttons, ifnecessary, to locate the file(see below). Press PROCEED.
If you see two files that belongto the same patient and youwish to combine them, you mayuse the MERGE PATIENTSbutton. See Section 8: “MergingPatient Files” for details.
The “Page Up Arrow” scrolls up a full screen of patients.
The “One Up Arrow” scrolls up one patient.
The “One Down Arrow” scrolls down one patient.
The “Page Down Arrow” scrolls down a full screen of patients.
To quickly locate a patient’s test, access the PATIENT SEARCH button below the File Directorybox. Enter the patient’s name in the ENTER NAME TO FIND screen and press PROCEED. TheHFA II will search the database for that patient’s tests. If the name cannot be found, the namewhich follows alphabetically will appear. The PATIENT SEARCH command regards names withmultiple spaces or different punctuation as identical.
5 Edit patient information,as necessary.
Choose MORE PATIENT DATAto verify, change or add data onthe Patient Data 2 screen.
Choose PROCEED to go to thetest screen.

SETTING-UP TESTS 3-15
REV. A 10/98 PN 47653-1 HUMPHREY FIELD ANALYZER II
Patient data 2 screen The Patient Data 2 screen contains diagnostic data fields. When using the external keyboard toenter data, press the TAB key to move to the next data field. The values entered for visual acuityand pupil diameter will also appear on the printout with the test results.
Figure 3.3: The Patient Data 2 Screen
Inputting diagnostic and 1From the Patient Data 2 screen, choose DIAGNOSTIC CODE.procedure codes
2Input up to 14 charactersfrom the pop-up keyboard,
then ENTER.
3 Repeat Steps 1-2 for the other eye.
4 From the Patient Data 2 screen, choose PROCEDURE CODE.

3-16 SETTING-UP TESTS
REV. A 10/98 PN 47653-1 HUMPHREY FIELD ANALYZER II
5 Enter up to 14 charac- ters from the pop-up
keyboard, then ENTER.
6 Repeat Steps 4-5 for the other eye.
Inputting pupil diameter and 1From the Patient Data 2 screen, choose PUPIL DIAMETER.visual acuity
2 Enter up to 4characters (0-14.5;
decimal point counts as onecharacter) from the pop-upkeypad, then ENTER.
3Repeat Steps 1-2 for the other eye. The pupil diameter value will also appear on theprintout.
Note: If the Autopupil feature (model 750 only) is being used, you need not enter a pupildiameter. The automatic pupil measurement will be entered and noted with an asterisk (*)on the Patient Data 2 screen. Gaze Tracking must be initialized for Autopupil to work.
4 From the Patient Data 2 screen, choose VISUAL ACUITY.

SETTING-UP TESTS 3-17
REV. A 10/98 PN 47653-1 HUMPHREY FIELD ANALYZER II
5 Select the appropriateacuity level from the
pop-up menu.
Press ENTER.
6Repeat Steps 4-5 for the other eye. The visual acuity measurement will also appear on theprintout.
Inputting intraocular pressure 1 From the Patient Data 2 screen, choose IOP (intraocular pressure).(IOP)
2 Enter up to 2 characters(0-75) from the pop-up
keypad, then ENTER.
3 Repeat Steps 1-2 for the other eye.

3-18 SETTING-UP TESTS
REV. A 10/98 PN 47653-1 HUMPHREY FIELD ANALYZER II
Entering Cup/Disk (C/D) ratios 1 From the Patient Data 2 screen, choose HORIZONTAL C/D (cup/disk ratio).
2 Enter a decimal pointand up to 2 characters
(.00-.99) from the pop-upkeypad, then ENTER.
3Repeat for the other eye.
4 Repeat Steps 1-3 for Vertical C/D.
When you have finished entering data on Patient Data 2 screen and are ready to test, choosePROCEED. This takes you to the test screen where you can set test parameters, if desired,before beginning the test (see Section 4).
Here is an example of a Patient Data 2 screen with a number of completed data fields. Remember,completing every field is not required for each patient. Refer to “Entering Patient Data”.
Figure 3.4: A Completed Patient Data 2 Screen

SETTING-UP TESTS 3-19
REV. A 10/98 PN 47653-1 HUMPHREY FIELD ANALYZER II
All patients requiring near vision correction should use trial lenses while taking central fieldtests and the central portion of full field tests. For your convenience, the HFA II automati-cally calculates the proper trial lens for your patient, if you know the patient’s distanceprescription and date of birth (refer to “Entering Patient Data” earlier in this section).
If you are not using the automatic trial lens calculation, refer to the following guidelines forselecting trial lenses.
GUIDELINES FOR TRIAL LENS SELECTION:1. Ignore cylinders of 0.25 D or less.2. For cylinder errors up to 1.25 D use the spherical equivalent. Use the full cylinder correction for cylinder errors of 1.50 D or more.3. Refer to Table 3.4 to determine the spherical power to be used.
Table 3.4: Spherical Trial Lens Correction for Central Visual Field Testing
Distance Distance
Rx Greater Rx Equalsthan Zero Zero (Plano) -0.50 -1.00 -1.50 -2.00 -2.50 -3.00 > -3.00
Age Spherical Trial Lens to Be Used
Use Hyperopic Myopic
Under 30 Distance Rx • • • • • • • Dist. Rx + 3.25
30 to 39 Dist. Rx + 1.00 +1.00 +0.50 • • • • • Dist. Rx + 3.25
40 to 44 Dist. Rx + 1.50 +1.50 +1.00 +0.50 • • • • Dist. Rx + 3.25
45 to 49 Dist. Rx + 2.00 +2.00 +1.50 +1.00 +0.50 • • • Dist. Rx + 3.25
50 to 54 Dist. Rx + 2.50 +2.50 +2.00 +1.50 +1.00 +0.50 • • Dist. Rx + 3.25
55 to 59 Dist. Rx + 3.00 +3.00 +2.50 +2.00 +1.50 +1.00 +0.50 • Dist. Rx + 3.25
60 and over Dist. Rx + 3.25 +3.25 +2.75 +2.25 +1.75 +1.25 +0.75 • Dist. Rx + 3.25
• means no spherical trial lens needed
USING TRIALLENSES

3-20 SETTING-UP TESTS
REV. A 10/98 PN 47653-1 HUMPHREY FIELD ANALYZER II
Remember, you only need to use a trial lens when testing the central part of the patient’s visualfield. The trial lens must be removed for the peripheral portion of any Full Field test. A triallens is not used for either Superior Field screening test or any Peripheral threshold orscreening test. The following are examples of trial lens corrections using Table 3.4:
Example A.For an emmetropic (plano) 70 year-old patient, follow the Distance Rx Equals Zero (Plano)column to the 60 & Over row. The trial lens correction for this patient is +3.25 D.
Example B.For the 61 year-old patient with a distance refraction of +1.50 +0.50 X 60, first calculate thespherical equivalent (+1.75). Then follow the Distance Rx Greater than Zero column to the 60& Over row where you are instructed to add +3.25 to the distance Rx of +1.75. The trial lenscorrection for this patient is +5.00 D.
Example C.For the 35 year-old patient with a distance refraction of +2.00 +1.50 X 90, use a +1.50 Dcylinder lens and rotate the axis to 90 in the trial lens holder. Follow the Distance Rx Greaterthan Zero column to the 30-39 row where you are instructed to add +1.00 to the distance Rxof +2.00. The trial lens correction for this patient is +3.00 +1.50 X 90.
Example D.For the 30 year-old patient with a distance refraction of -3.00 +0.25 X 90, the 0.25 cylinder isignored. Follow the -3.00 column to the Age 30-39 row. The • signifies that this patient doesnot need a trial lens correction, as the bowl will be in focus with no correction whatsoever.
Example E.For the 63 year-old patient with a distance refraction of -3.00 +2.00 X 75, use a +2.00 cylinderlens and rotate the axis to 75 in the trial lens holder. Follow the -3.00 sphere column to the 60& Over row. The • indicates that the patient does not require a spherical correction. Use onlythe cylinder trial lens correction.
Example F.A 25 year-old patient with a distance refraction of -4.00. Follow the > -3.00 column to theUnder 30 row where you are instructed to add +3.25 to the distance Rx. The correct trial lensis -0.75.
Note: If your patient is aphakic or needs a high refractive power such as +8.00 D, contactlenses may provide the best visual field testing conditions.
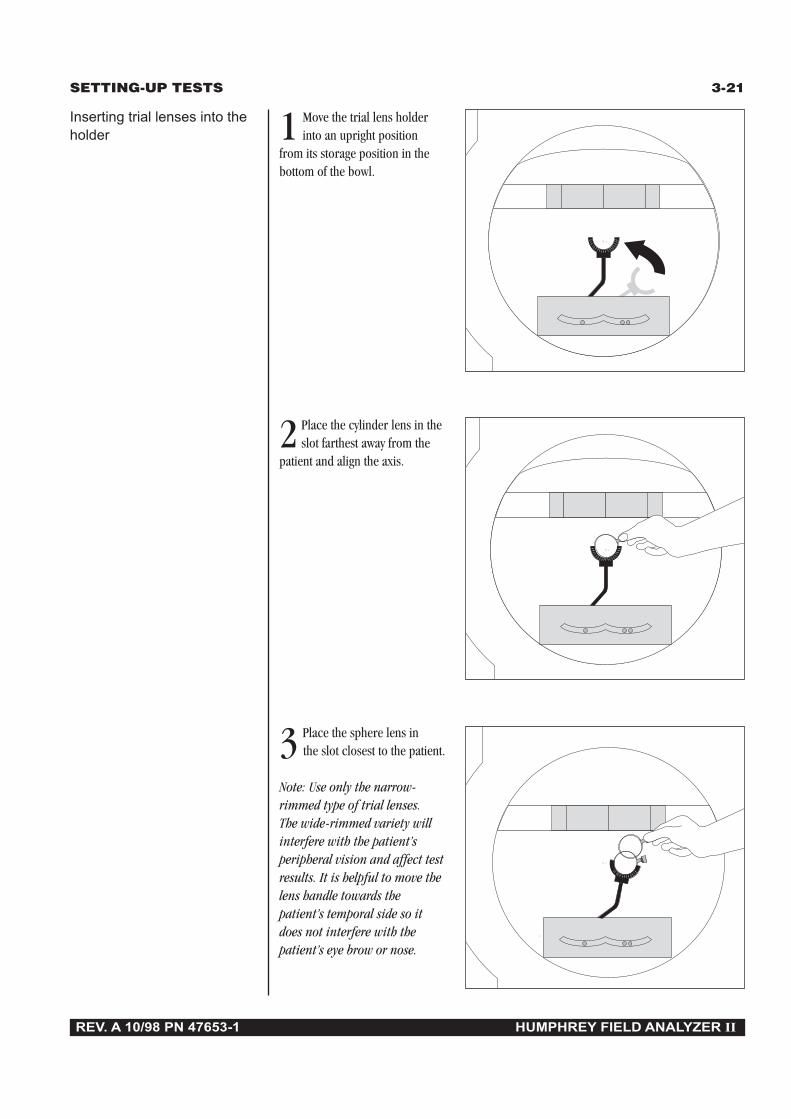
SETTING-UP TESTS 3-21
REV. A 10/98 PN 47653-1 HUMPHREY FIELD ANALYZER II
Inserting trial lenses into the 1 Move the trial lens holderholder into an upright position
from its storage position in thebottom of the bowl.
2 Place the cylinder lens in theslot farthest away from the
patient and align the axis.
3 Place the sphere lens in the slot closest to the patient.
Note: Use only the narrow-rimmed type of trial lenses.The wide-rimmed variety willinterfere with the patient’speripheral vision and affect testresults. It is helpful to move thelens handle towards thepatient’s temporal side so itdoes not interfere with thepatient’s eye brow or nose.
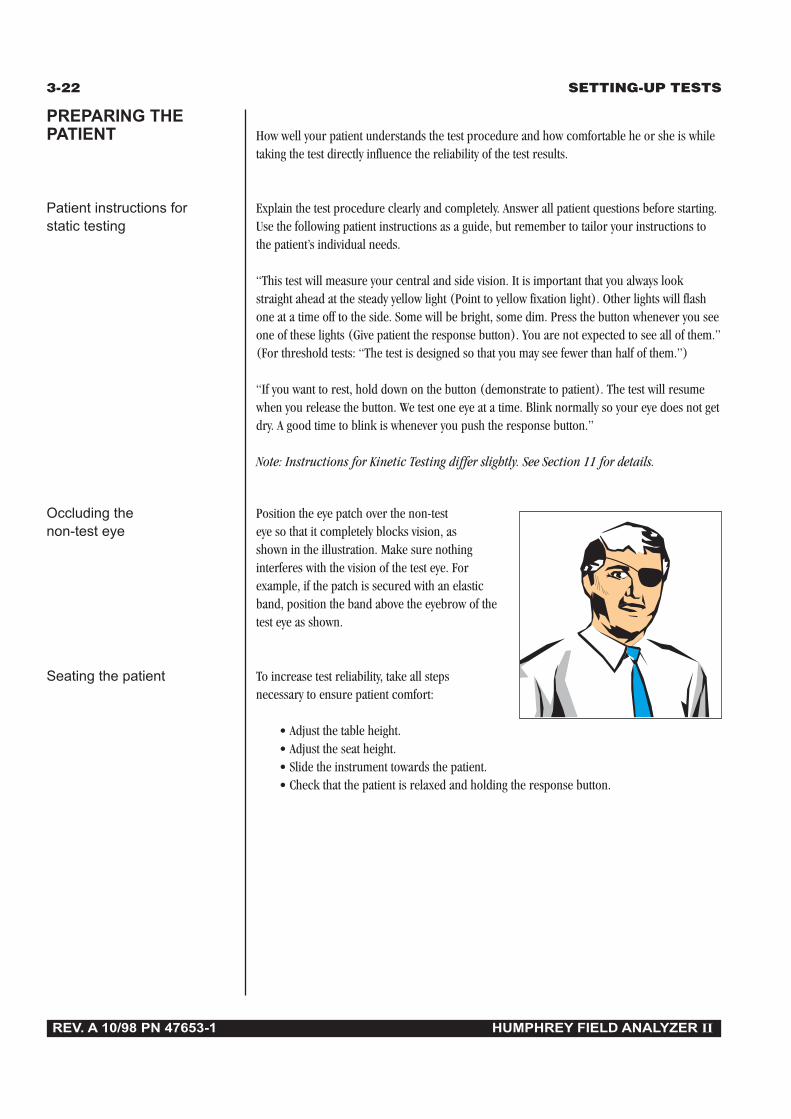
3-22 SETTING-UP TESTS
REV. A 10/98 PN 47653-1 HUMPHREY FIELD ANALYZER II
How well your patient understands the test procedure and how comfortable he or she is whiletaking the test directly influence the reliability of the test results.
Patient instructions for Explain the test procedure clearly and completely. Answer all patient questions before starting.static testing Use the following patient instructions as a guide, but remember to tailor your instructions to
the patient’s individual needs.
“This test will measure your central and side vision. It is important that you always lookstraight ahead at the steady yellow light (Point to yellow fixation light). Other lights will flashone at a time off to the side. Some will be bright, some dim. Press the button whenever you seeone of these lights (Give patient the response button). You are not expected to see all of them.”(For threshold tests: “The test is designed so that you may see fewer than half of them.”)
“If you want to rest, hold down on the button (demonstrate to patient). The test will resumewhen you release the button. We test one eye at a time. Blink normally so your eye does not getdry. A good time to blink is whenever you push the response button.”
Note: Instructions for Kinetic Testing differ slightly. See Section 11 for details.
Occluding the Position the eye patch over the non-testnon-test eye eye so that it completely blocks vision, as
shown in the illustration. Make sure nothinginterferes with the vision of the test eye. Forexample, if the patch is secured with an elasticband, position the band above the eyebrow of thetest eye as shown.
Seating the patient To increase test reliability, take all stepsnecessary to ensure patient comfort:
• Adjust the table height.• Adjust the seat height.• Slide the instrument towards the patient.• Check that the patient is relaxed and holding the response button.
PREPARING THEPATIENT

SETTING-UP TESTS 3-23
REV. A 10/98 PN 47653-1 HUMPHREY FIELD ANALYZER II
Positioning the patient To facilitate patient positioning, the chin rest is divided into two cups, one designated forat the instrument right eye testing the other for left eye testing.
1 Instruct the patient toplace his or her chin on
the appropriate side of thechin rest, then assist withbringing the forehead againstthe forehead rest.
Adjust the table height to beas high as necessary to keepthe patient sitting comfortablyerect, rather than bent overor leaning forward.
Pull the slider handle out torelease the slider. Slide theHFA II toward the patient toallow improved posture forthe test. Release the handle tolock the slider in place.
2 Align the patient on the video eye monitor so
that the pupil is centered inthe target. Press the chin restcontrol in the direction youwant the patient’s eye to movein the video eye monitor.
Place patient’s chin here whentesting the right eye
Place patient’s chin here whentesting the left eye

3-24 SETTING-UP TESTS
REV. A 10/98 PN 47653-1 HUMPHREY FIELD ANALYZER II
3 Move the trial lens asclose to the patient’s eye as
possible without touching thelashes.
If you are running a Blue-Yellow test, the visor beneaththe forehead rest must beextended. You should alsoallow the patient to adapt tothe yellow bowl for about 3minutes before testing. SeeSection 4: Blue-Yellow Testing”for details.
4 Review the patient’s position in the video eye
monitor. The cross (+) shouldbe in the center of the pupil.Adjust as necessary.
When the patient has been properly instructed and comfortably positioned, you are ready tobegin testing.
No trial lenses for Esterman This test is used to assess the level of a patient’s functional visual disability. The Estermanmonocular/binocular tests tests are designed to be done using a patient’s everyday correction. If the patient does not
require glasses to function normally, perform the test without correction. If the patient doeswear glasses to function normally, perform the monocular or binocular test using the patient’sglasses. Do not use trial lenses. You still must use the eye patch when testing with theMonocular version of the Esterman test.
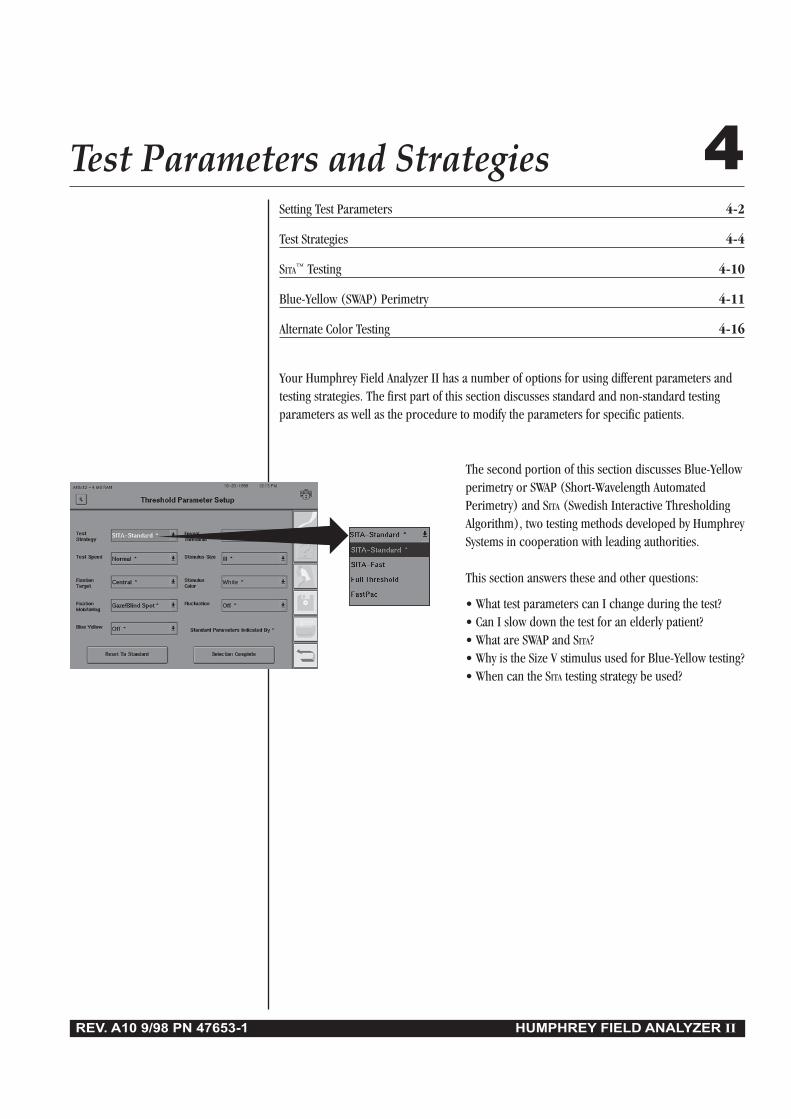
REV. A10 9/98 PN 47653-1 HUMPHREY FIELD ANALYZER II
Setting Test Parameters 4-2
Test Strategies 4-4
SITA™ Testing 4-10
Blue-Yellow (SWAP) Perimetry 4-11
Alternate Color Testing 4-16
Your Humphrey Field Analyzer II has a number of options for using different parameters andtesting strategies. The first part of this section discusses standard and non-standard testingparameters as well as the procedure to modify the parameters for specific patients.
Test Parameters and Strategies 4
The second portion of this section discusses Blue-Yellowperimetry or SWAP (Short-Wavelength AutomatedPerimetry) and SITA (Swedish Interactive ThresholdingAlgorithm), two testing methods developed by HumphreySystems in cooperation with leading authorities.
This section answers these and other questions:
• What test parameters can I change during the test?• Can I slow down the test for an elderly patient?• What are SWAP and SITA?• Why is the Size V stimulus used for Blue-Yellow testing?• When can the SITA testing strategy be used?
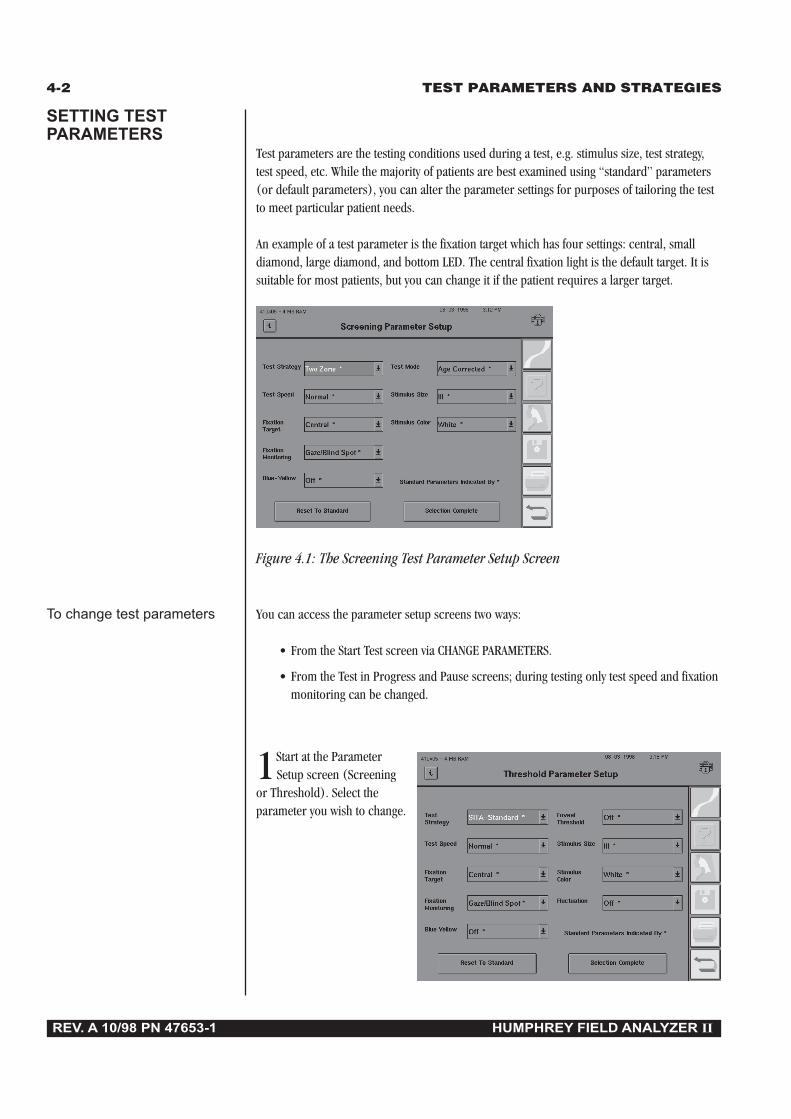
4-2 TEST PARAMETERS AND STRATEGIES
REV. A 10/98 PN 47653-1 HUMPHREY FIELD ANALYZER II
Test parameters are the testing conditions used during a test, e.g. stimulus size, test strategy,test speed, etc. While the majority of patients are best examined using “standard” parameters(or default parameters), you can alter the parameter settings for purposes of tailoring the testto meet particular patient needs.
An example of a test parameter is the fixation target which has four settings: central, smalldiamond, large diamond, and bottom LED. The central fixation light is the default target. It issuitable for most patients, but you can change it if the patient requires a larger target.
Figure 4.1: The Screening Test Parameter Setup Screen
To change test parameters You can access the parameter setup screens two ways:
• From the Start Test screen via CHANGE PARAMETERS.
• From the Test in Progress and Pause screens; during testing only test speed and fixationmonitoring can be changed.
1Start at the ParameterSetup screen (Screening
or Threshold). Select theparameter you wish to change.
SETTING TESTPARAMETERS

TEST PARAMETERS AND STRATEGIES 4-3
REV. A 10/98 PN 47653-1 HUMPHREY FIELD ANALYZER II
2 Select the parameter setting. The current
setting is highlighted.
3 Repeat steps 1-2 for other parameters, then press SELECTION COMPLETE.
Standard parameters One setting for each parameter has been designated as the “standard” setting. It isdistinguished from the others by the appearance of an asterisk (*) on the parameter button.If you want to return all settings to the standard mode, select RESET TO STANDARD.
Note: For the purpose of valid comparison, it is important to keep test parametersconsistent among different test visits for the same patient. This will maintain propercomparability when evaluating test results from many visits. Other than test speed andfixation monitoring, test parameters cannot be changed once testing has begun.

4-4 TEST PARAMETERS AND STRATEGIES
REV. A 10/98 PN 47653-1 HUMPHREY FIELD ANALYZER II
One of the most important test parameter settings is strategy. For both screening and thresholdtesting, the strategy can affect the total test time and the precision to which the measurementsare made. The strategy also dictates whether screening test results are displayed as qualitative(symbols) or quantitative (decibels) information. All threshold strategies yield quantitativeresults. Each measures the threshold at every test point. They differ only in the method used.Refer to Tables 4.1 and 4.2 for a more detailed explanation of screening and thresholdparameters, respectively.
Table 4.1: Screening Test Parameters(Standard parameter settings appear in bold print)
Screening Parameter DescriptionParameters Settings
Test Strategy Two Zone For each point in the test pattern, a stimulus ispresented 6 dB brighter than the expected hill of vi-sion. Printouts display circles (O) for seen stimuliand boxes (■) for missed stimuli. Since screeningis done with an intensity 6 dB brighter than ex-pected threshold, missed points are known to be atleast 6 dB deep.
Three Zone Same as Two Zone, except each missed point ismeasured again at maximum intensity of 10,000apostilbs (0 decibels) to determine if the defect isabsolute. Printouts display circles (O) for seenstimuli, “X’s” for relative defects, and boxes (■) forabsolute defects.
Quantify Defects Same as Two Zone, except the sensitivity at eachmissed point is measured relative to the expectedthreshold. Printouts display circles (O) for seenstimuli, and numbers (in decibels) to indicate thedepth of any defects. The greater the number, thelower the retinal sensitivity (deeper the defect).
Test Speed Normal Two stimulus presentation speeds are available.Slow The test speed may be changed while a test is in
progress. The Normal setting automaticallyadjusts test speed for a slow responding patient.
Fixation Target Central Yellow light in the center of the bowl.
Small Diamond The Small Diamond is located below the Central tar-get, and should be used when a patient cannot seethe central fixation light (e.g. macular degenera-tion). The patient should look in the center of thediamond formed by the four lights.
TEST STRATEGIES
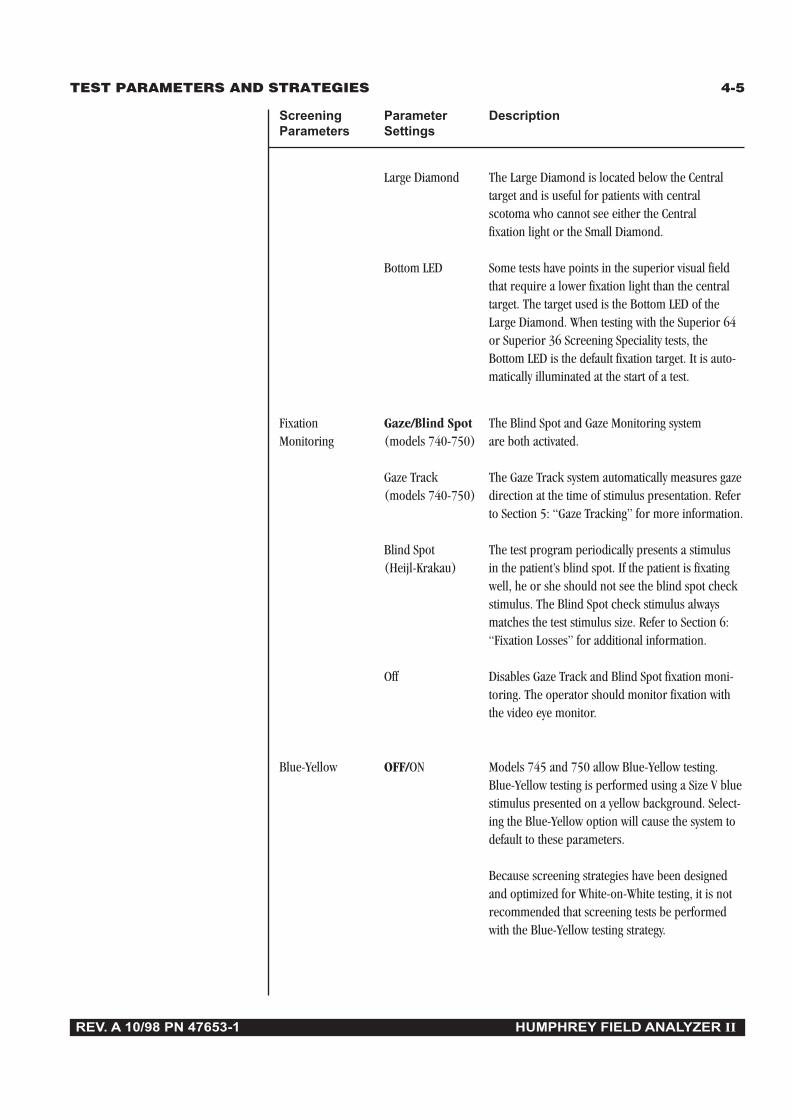
TEST PARAMETERS AND STRATEGIES 4-5
REV. A 10/98 PN 47653-1 HUMPHREY FIELD ANALYZER II
Large Diamond The Large Diamond is located below the Centraltarget and is useful for patients with centralscotoma who cannot see either the Centralfixation light or the Small Diamond.
Bottom LED Some tests have points in the superior visual fieldthat require a lower fixation light than the centraltarget. The target used is the Bottom LED of theLarge Diamond. When testing with the Superior 64or Superior 36 Screening Speciality tests, theBottom LED is the default fixation target. It is auto-matically illuminated at the start of a test.
Fixation Gaze/Blind Spot The Blind Spot and Gaze Monitoring systemMonitoring (models 740-750) are both activated.
Gaze Track The Gaze Track system automatically measures gaze(models 740-750) direction at the time of stimulus presentation. Refer
to Section 5: “Gaze Tracking” for more information.
Blind Spot The test program periodically presents a stimulus(Heijl-Krakau) in the patient’s blind spot. If the patient is fixating
well, he or she should not see the blind spot checkstimulus. The Blind Spot check stimulus alwaysmatches the test stimulus size. Refer to Section 6:“Fixation Losses” for additional information.
Off Disables Gaze Track and Blind Spot fixation moni-toring. The operator should monitor fixation withthe video eye monitor.
Blue-Yellow OFF/ON Models 745 and 750 allow Blue-Yellow testing.Blue-Yellow testing is performed using a Size V bluestimulus presented on a yellow background. Select-ing the Blue-Yellow option will cause the system todefault to these parameters.
Because screening strategies have been designedand optimized for White-on-White testing, it is notrecommended that screening tests be performedwith the Blue-Yellow testing strategy.
Screening Parameter DescriptionParameters Settings

4-6 TEST PARAMETERS AND STRATEGIES
REV. A 10/98 PN 47653-1 HUMPHREY FIELD ANALYZER II
Test Mode Age Corrected A hill of vision is assigned to the patient basedon the patient’s age. The expected threshold at thehill’s peak, the fovea, is called the central referencelevel. This central decibel value is indicated on thetest screen and the printout.
The patient’s date of birth must be entered prior tobeginning the test. Age corrected mode may only beused with standard stimulus size and color (Size III,White). If non-standard size and color parametersare selected with Age Corrected Screening, the in-strument will default back to Threshold RelatedStrategy upon leaving the Change Parameter Screen.
Threshold A hill of vision is assigned only after thresholdRelated values for 4 primary points are determined. The cal-
culated threshold at the hill’s peak, or fovea, iscalled the central reference level. This value ap-pears on the test screen and the printout.
Single Intensity The HFA uses a default intensity level of 10 dB to testthe entire visual field. If a different intensity is de-sired, press CLEAR and enter the desired value onthe keypad which appears. Press ENTER. The singleintensity value will appear on the test screen (asStim:) and on the printout as “Stimulus Intensity”.
Single Intensity levels may be set only in evenincrements.
Stimulus Size I, II, III, Five stimulus sizes (diameters) are available onIV, V most instrument models. They range from Size I
(smallest) to Size V (largest).
Stimulus Color White White stimulus projected onto bowl.
Red Red stimulus projected onto bowl.
Blue Blue stimulus projected onto bowl.
Screening Parameter DescriptionParameters Settings

TEST PARAMETERS AND STRATEGIES 4-7
REV. A 10/98 PN 47653-1 HUMPHREY FIELD ANALYZER II
Figure 4.2: The Threshold Parameter Setup Screen
Table 4.2: Threshold Test Parameters(Standard parameter settings appear in bold print)
Threshold Parameter DescriptionParameters Settings
Test Strategy SITA-Standard™ This is the standard testing strategy for the SwedishInteractive Thresholding Algorithm (SITA).SITA-Standard cuts testing time in half relative to theFull Threshold strategy without compromising testreproducibility. See Appendix G for more details.
SITA-Fast™ This is a faster version of SITA. SITA-Fast cuts testingtime in half relative to the FastPac testing strategywithout compromising test reproducibility. See Ap-pendix G for more details.
Full Threshold A “bracketing” technique is used to thresholdeach test point. An initial stimulus is presented at alevel the patient is expected to see. If seen, thestimulus intensity is decreased in 4 decibel steps(0.4 log units) until the patient no longer sees thestimulus; if not seen, it is increased in 4 dB stepsuntil seen. The instrument then changes direction,moving in 2 dB steps until a change in patient re-sponse is made. The last stimulus seen by the pa-tient is recognized as the threshold for that point.
The bracketing process described above begins with4 primary points whose threshold values are deter-mined at the beginning of the test. The results atthese points then influence the starting levels forneighboring points in the pattern.
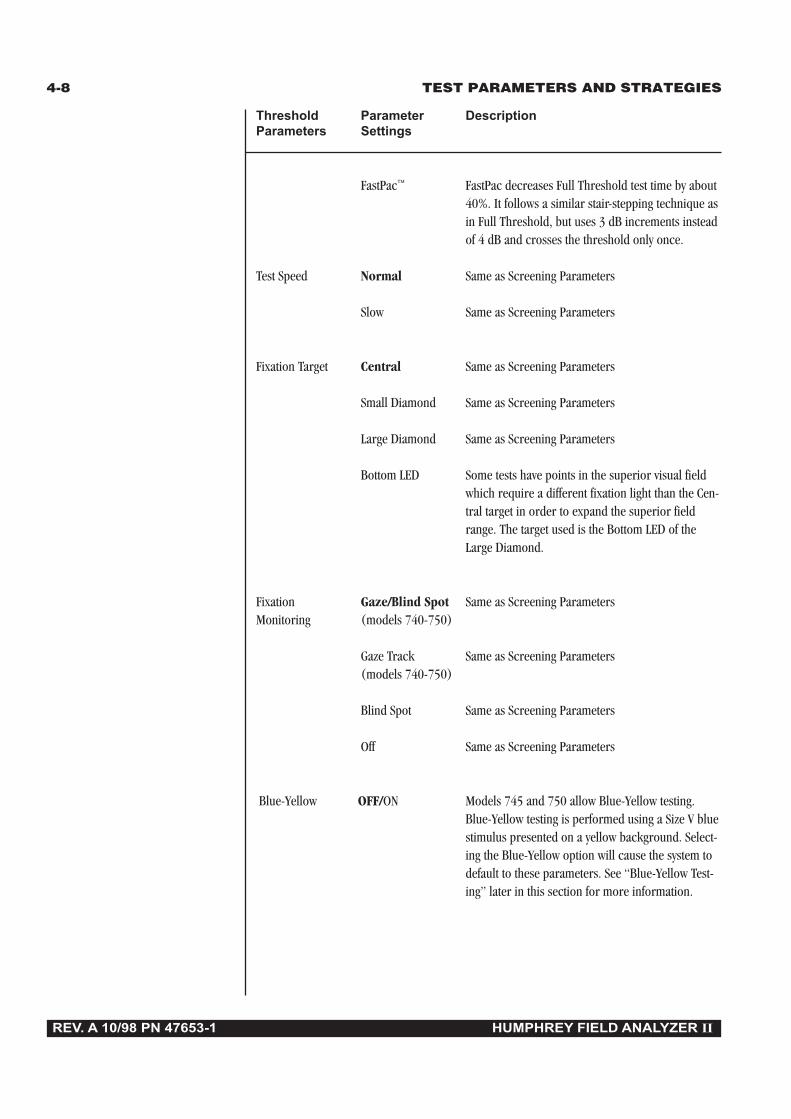
4-8 TEST PARAMETERS AND STRATEGIES
REV. A 10/98 PN 47653-1 HUMPHREY FIELD ANALYZER II
FastPac™ FastPac decreases Full Threshold test time by about40%. It follows a similar stair-stepping technique asin Full Threshold, but uses 3 dB increments insteadof 4 dB and crosses the threshold only once.
Test Speed Normal Same as Screening Parameters
Slow Same as Screening Parameters
Fixation Target Central Same as Screening Parameters
Small Diamond Same as Screening Parameters
Large Diamond Same as Screening Parameters
Bottom LED Some tests have points in the superior visual fieldwhich require a different fixation light than the Cen-tral target in order to expand the superior fieldrange. The target used is the Bottom LED of theLarge Diamond.
Fixation Gaze/Blind Spot Same as Screening ParametersMonitoring (models 740-750)
Gaze Track Same as Screening Parameters(models 740-750)
Blind Spot Same as Screening Parameters
Off Same as Screening Parameters
Blue-Yellow OFF/ON Models 745 and 750 allow Blue-Yellow testing.Blue-Yellow testing is performed using a Size V bluestimulus presented on a yellow background. Select-ing the Blue-Yellow option will cause the system todefault to these parameters. See “Blue-Yellow Test-ing” later in this section for more information.
Threshold Parameter DescriptionParameters Settings

TEST PARAMETERS AND STRATEGIES 4-9
REV. A 10/98 PN 47653-1 HUMPHREY FIELD ANALYZER II
Foveal Threshold Off A threshold value for the fovea will not bemeasured.
On A threshold value for the fovea will be determined atthe beginning of the test. The foveal threshold testpresents stimuli inside the Small Diamond fixationtarget; the Small Diamond will automatically be illu-minated.
Refer to Section 5: “Foveal Threshold” for details onperforming this supplemental test.
Stimulus Size I, II, III, Same as Screening ParametersIV, V
Stimulus Color White Same as Screening Parameters
Red Same as Screening Parameters
Blue Same as Screening Parameters
Fluctuation On Threshold values for ten (10) pre-selected pointsare retested to determine the variability of thepatient’s responses.
Threshold values for the retested points are printedon the numeric printout and appear in parenthesesdirectly below the first test result.
Fluctuation values which differ significantly fromnormal are flagged with appropriate “p” (probabil-ity) values.
Off Threshold values for pre-selected points will not bedetermined twice. Some points may be retested evenif fluctuation is off. Off is the default setting whenBlue-Yellow is turned on.
Note: Short-term Fluctuation (SF) and CorrectedPattern Standard Deviation (CPSD) values willnot be available if fluctuation is off.
Threshold Parameter DescriptionParameters Settings
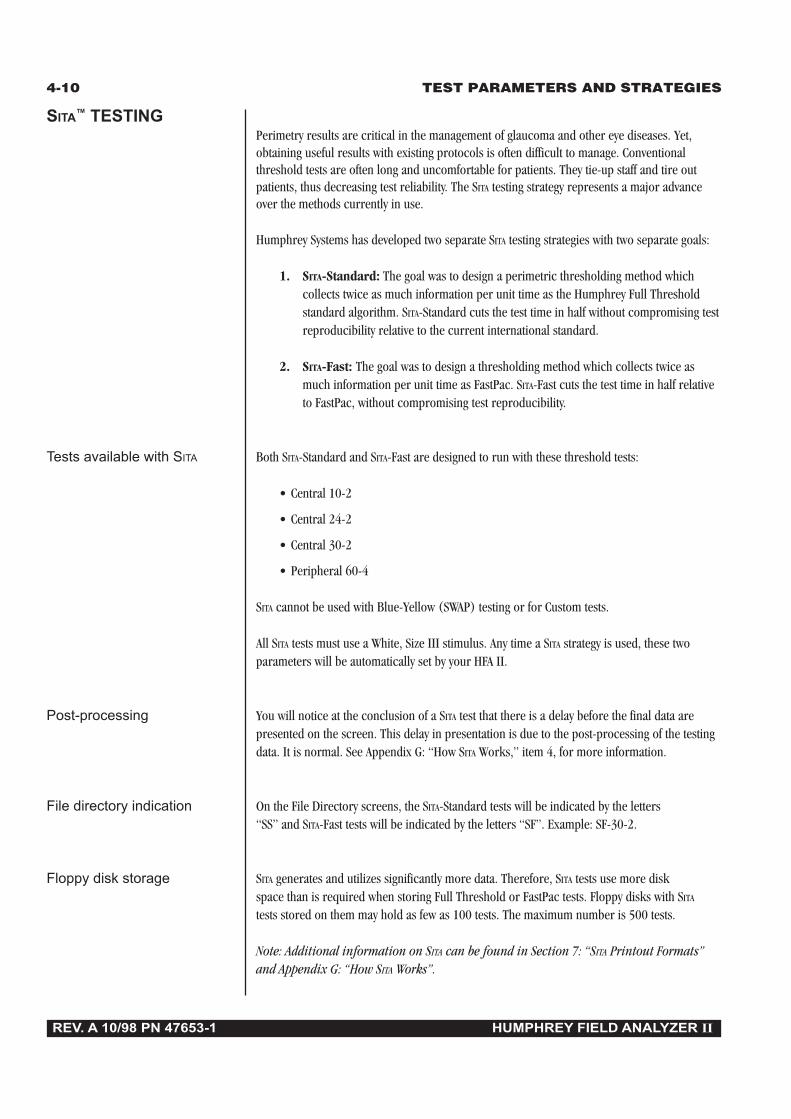
4-10 TEST PARAMETERS AND STRATEGIES
REV. A 10/98 PN 47653-1 HUMPHREY FIELD ANALYZER II
SITA™ TESTINGPerimetry results are critical in the management of glaucoma and other eye diseases. Yet,obtaining useful results with existing protocols is often difficult to manage. Conventionalthreshold tests are often long and uncomfortable for patients. They tie-up staff and tire outpatients, thus decreasing test reliability. The SITA testing strategy represents a major advanceover the methods currently in use.
Humphrey Systems has developed two separate SITA testing strategies with two separate goals:
1. SITA-Standard: The goal was to design a perimetric thresholding method whichcollects twice as much information per unit time as the Humphrey Full Thresholdstandard algorithm. SITA-Standard cuts the test time in half without compromising testreproducibility relative to the current international standard.
2. SITA-Fast: The goal was to design a thresholding method which collects twice asmuch information per unit time as FastPac. SITA-Fast cuts the test time in half relativeto FastPac, without compromising test reproducibility.
Tests available with SITA Both SITA-Standard and SITA-Fast are designed to run with these threshold tests:
• Central 10-2
• Central 24-2
• Central 30-2
• Peripheral 60-4
SITA cannot be used with Blue-Yellow (SWAP) testing or for Custom tests.
All SITA tests must use a White, Size III stimulus. Any time a SITA strategy is used, these twoparameters will be automatically set by your HFA II.
Post-processing You will notice at the conclusion of a SITA test that there is a delay before the final data arepresented on the screen. This delay in presentation is due to the post-processing of the testingdata. It is normal. See Appendix G: “How SITA Works,” item 4, for more information.
File directory indication On the File Directory screens, the SITA-Standard tests will be indicated by the letters“SS” and SITA-Fast tests will be indicated by the letters “SF”. Example: SF-30-2.
Floppy disk storage SITA generates and utilizes significantly more data. Therefore, SITA tests use more diskspace than is required when storing Full Threshold or FastPac tests. Floppy disks with SITA
tests stored on them may hold as few as 100 tests. The maximum number is 500 tests.
Note: Additional information on SITA can be found in Section 7: “SITA Printout Formats”and Appendix G: “How SITA Works”.
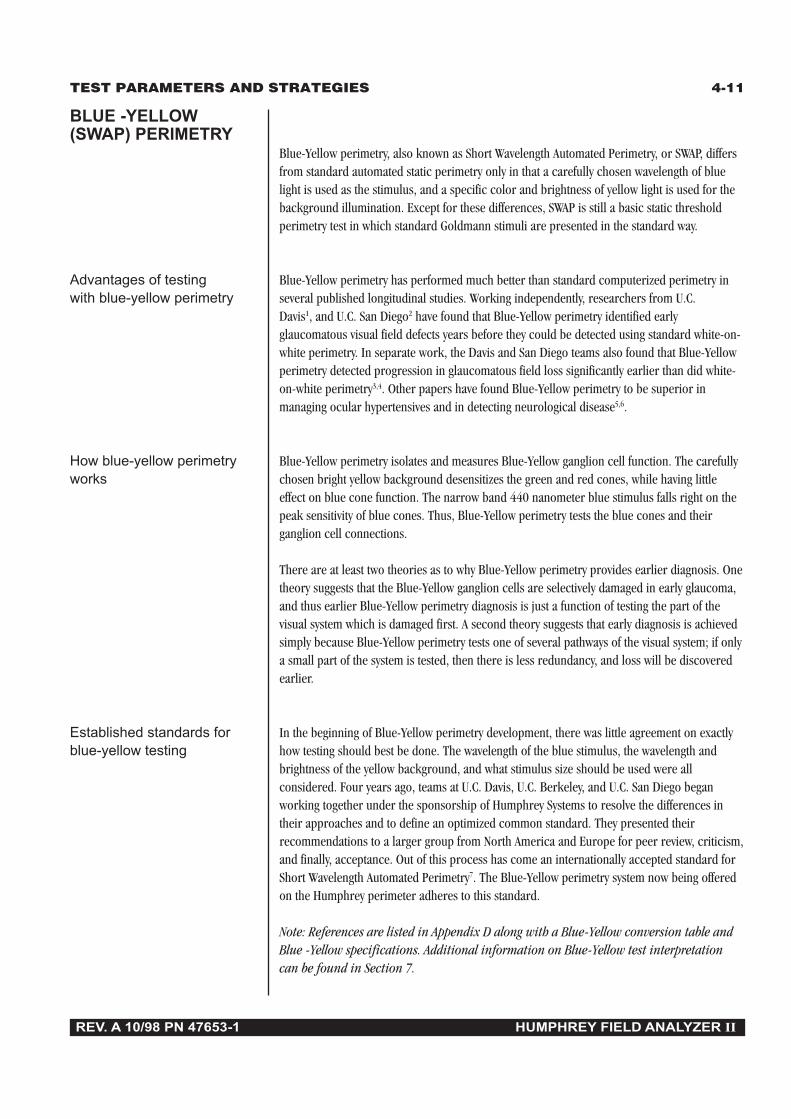
TEST PARAMETERS AND STRATEGIES 4-11
REV. A 10/98 PN 47653-1 HUMPHREY FIELD ANALYZER II
Blue-Yellow perimetry, also known as Short Wavelength Automated Perimetry, or SWAP, differsfrom standard automated static perimetry only in that a carefully chosen wavelength of bluelight is used as the stimulus, and a specific color and brightness of yellow light is used for thebackground illumination. Except for these differences, SWAP is still a basic static thresholdperimetry test in which standard Goldmann stimuli are presented in the standard way.
Advantages of testing Blue-Yellow perimetry has performed much better than standard computerized perimetry inwith blue-yellow perimetry several published longitudinal studies. Working independently, researchers from U.C.
Davis1, and U.C. San Diego2 have found that Blue-Yellow perimetry identified earlyglaucomatous visual field defects years before they could be detected using standard white-on-white perimetry. In separate work, the Davis and San Diego teams also found that Blue-Yellowperimetry detected progression in glaucomatous field loss significantly earlier than did white-on-white perimetry3,4. Other papers have found Blue-Yellow perimetry to be superior inmanaging ocular hypertensives and in detecting neurological disease5,6.
How blue-yellow perimetry Blue-Yellow perimetry isolates and measures Blue-Yellow ganglion cell function. The carefullyworks chosen bright yellow background desensitizes the green and red cones, while having little
effect on blue cone function. The narrow band 440 nanometer blue stimulus falls right on thepeak sensitivity of blue cones. Thus, Blue-Yellow perimetry tests the blue cones and theirganglion cell connections.
There are at least two theories as to why Blue-Yellow perimetry provides earlier diagnosis. Onetheory suggests that the Blue-Yellow ganglion cells are selectively damaged in early glaucoma,and thus earlier Blue-Yellow perimetry diagnosis is just a function of testing the part of thevisual system which is damaged first. A second theory suggests that early diagnosis is achievedsimply because Blue-Yellow perimetry tests one of several pathways of the visual system; if onlya small part of the system is tested, then there is less redundancy, and loss will be discoveredearlier.
Established standards for In the beginning of Blue-Yellow perimetry development, there was little agreement on exactlyblue-yellow testing how testing should best be done. The wavelength of the blue stimulus, the wavelength and
brightness of the yellow background, and what stimulus size should be used were allconsidered. Four years ago, teams at U.C. Davis, U.C. Berkeley, and U.C. San Diego beganworking together under the sponsorship of Humphrey Systems to resolve the differences intheir approaches and to define an optimized common standard. They presented theirrecommendations to a larger group from North America and Europe for peer review, criticism,and finally, acceptance. Out of this process has come an internationally accepted standard forShort Wavelength Automated Perimetry7. The Blue-Yellow perimetry system now being offeredon the Humphrey perimeter adheres to this standard.
Note: References are listed in Appendix D along with a Blue-Yellow conversion table andBlue -Yellow specifications. Additional information on Blue-Yellow test interpretationcan be found in Section 7.
BLUE -YELLOW(SWAP) PERIMETRY
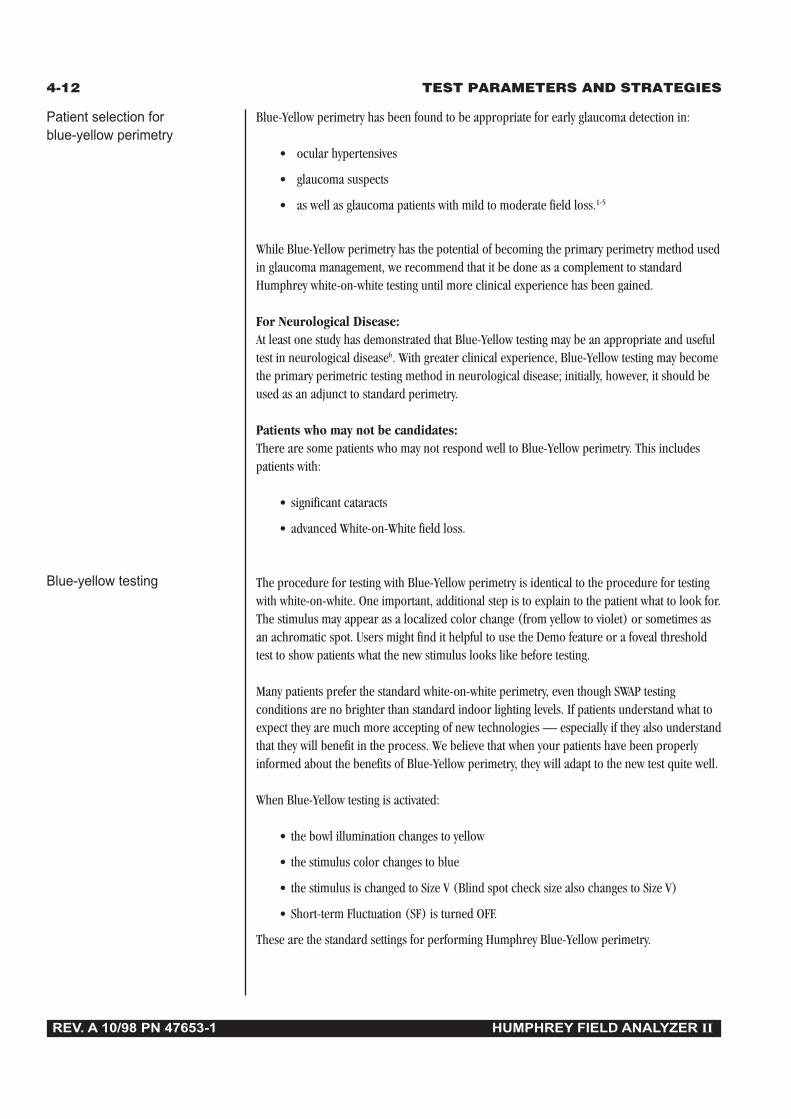
4-12 TEST PARAMETERS AND STRATEGIES
REV. A 10/98 PN 47653-1 HUMPHREY FIELD ANALYZER II
Patient selection for Blue-Yellow perimetry has been found to be appropriate for early glaucoma detection in:blue-yellow perimetry
• ocular hypertensives
• glaucoma suspects
• as well as glaucoma patients with mild to moderate field loss.1-5
While Blue-Yellow perimetry has the potential of becoming the primary perimetry method usedin glaucoma management, we recommend that it be done as a complement to standardHumphrey white-on-white testing until more clinical experience has been gained.
For Neurological Disease:At least one study has demonstrated that Blue-Yellow testing may be an appropriate and usefultest in neurological disease6. With greater clinical experience, Blue-Yellow testing may becomethe primary perimetric testing method in neurological disease; initially, however, it should beused as an adjunct to standard perimetry.
Patients who may not be candidates:There are some patients who may not respond well to Blue-Yellow perimetry. This includespatients with:
• significant cataracts
• advanced White-on-White field loss.
The procedure for testing with Blue-Yellow perimetry is identical to the procedure for testingwith white-on-white. One important, additional step is to explain to the patient what to look for.The stimulus may appear as a localized color change (from yellow to violet) or sometimes asan achromatic spot. Users might find it helpful to use the Demo feature or a foveal thresholdtest to show patients what the new stimulus looks like before testing.
Many patients prefer the standard white-on-white perimetry, even though SWAP testingconditions are no brighter than standard indoor lighting levels. If patients understand what toexpect they are much more accepting of new technologies — especially if they also understandthat they will benefit in the process. We believe that when your patients have been properlyinformed about the benefits of Blue-Yellow perimetry, they will adapt to the new test quite well.
When Blue-Yellow testing is activated:
• the bowl illumination changes to yellow
• the stimulus color changes to blue
• the stimulus is changed to Size V (Blind spot check size also changes to Size V)
• Short-term Fluctuation (SF) is turned OFF.
These are the standard settings for performing Humphrey Blue-Yellow perimetry.
Blue-yellow testing
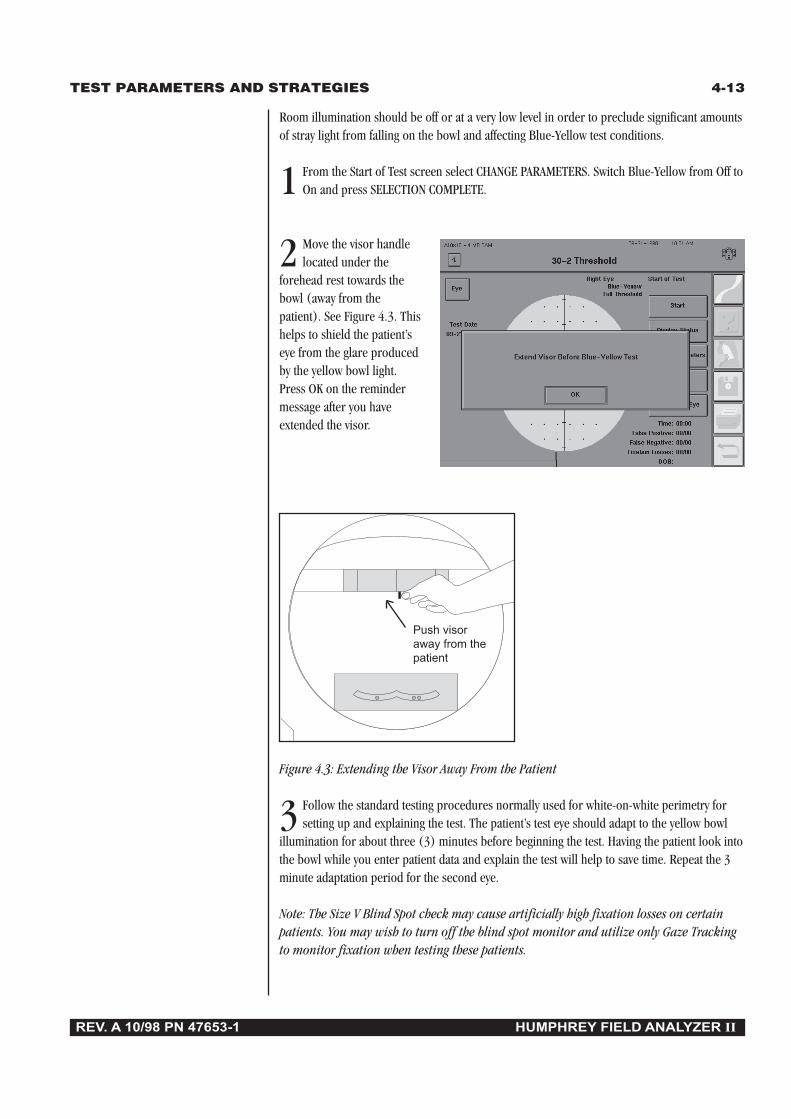
TEST PARAMETERS AND STRATEGIES 4-13
REV. A 10/98 PN 47653-1 HUMPHREY FIELD ANALYZER II
Room illumination should be off or at a very low level in order to preclude significant amountsof stray light from falling on the bowl and affecting Blue-Yellow test conditions.
1 From the Start of Test screen select CHANGE PARAMETERS. Switch Blue-Yellow from Off toOn and press SELECTION COMPLETE.
2 Move the visor handlelocated under the
forehead rest towards thebowl (away from thepatient). See Figure 4.3. Thishelps to shield the patient’seye from the glare producedby the yellow bowl light.Press OK on the remindermessage after you haveextended the visor.
Figure 4.3: Extending the Visor Away From the Patient
3 Follow the standard testing procedures normally used for white-on-white perimetry forsetting up and explaining the test. The patient’s test eye should adapt to the yellow bowl
illumination for about three (3) minutes before beginning the test. Having the patient look intothe bowl while you enter patient data and explain the test will help to save time. Repeat the 3minute adaptation period for the second eye.
Note: The Size V Blind Spot check may cause artificially high fixation losses on certainpatients. You may wish to turn off the blind spot monitor and utilize only Gaze Trackingto monitor fixation when testing these patients.
Push visoraway from thepatient
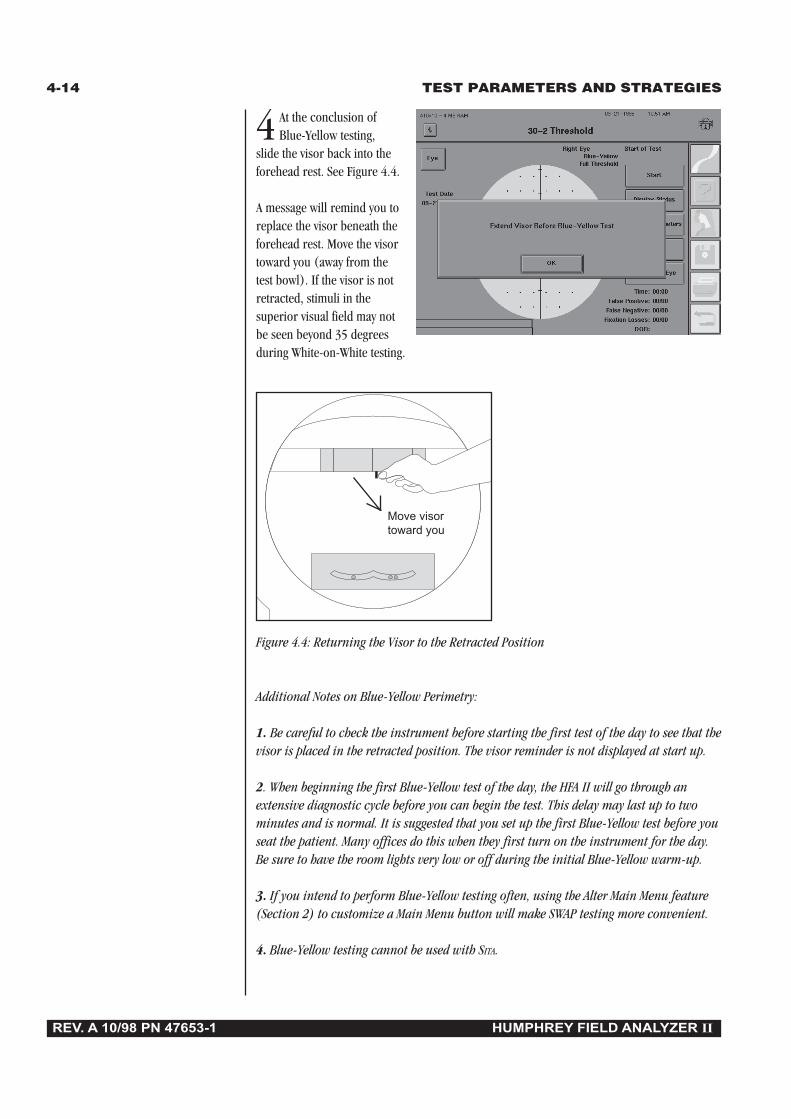
4-14 TEST PARAMETERS AND STRATEGIES
REV. A 10/98 PN 47653-1 HUMPHREY FIELD ANALYZER II
4 At the conclusion ofBlue-Yellow testing,
slide the visor back into theforehead rest. See Figure 4.4.
A message will remind you toreplace the visor beneath theforehead rest. Move the visortoward you (away from thetest bowl). If the visor is notretracted, stimuli in thesuperior visual field may notbe seen beyond 35 degreesduring White-on-White testing.
Figure 4.4: Returning the Visor to the Retracted Position
Additional Notes on Blue-Yellow Perimetry:
1. Be careful to check the instrument before starting the first test of the day to see that thevisor is placed in the retracted position. The visor reminder is not displayed at start up.
2. When beginning the first Blue-Yellow test of the day, the HFA II will go through anextensive diagnostic cycle before you can begin the test. This delay may last up to twominutes and is normal. It is suggested that you set up the first Blue-Yellow test before youseat the patient. Many offices do this when they first turn on the instrument for the day.Be sure to have the room lights very low or off during the initial Blue-Yellow warm-up.
3. If you intend to perform Blue-Yellow testing often, using the Alter Main Menu feature(Section 2) to customize a Main Menu button will make SWAP testing more convenient.
4. Blue-Yellow testing cannot be used with SITA.
Move visortoward you

TEST PARAMETERS AND STRATEGIES 4-15
REV. A 10/98 PN 47653-1 HUMPHREY FIELD ANALYZER II
5. Corrected Pattern Standard Deviation (CPSD) values are not available when Short-termFluctuation is turned OFF. Fluctuation may be turned ON at the Parameter Setup screenwithout altering any other test parameters. The test will run longer as the HFA II retestsadditional points when fluctuation is turned ON. If you wish to run most Blue-Yellowtests with fluctuation ON, refer to Section 2: “Altering the Main Menu Screen”.
6. Blue-Yellow perimetry tests take only about 15% longer than conventional perimetry.The most likely explanation for this is simply that current testing algorithms are not fullyoptimized for Blue-Yellow. In any case, 15% is only about 1 additional minute in a 6minute test, and does not appear to be a serious drawback. SWAP and STATPAC for Blue-Yellow both fully support the use of FastPac. Using FastPac will greatly improve patientacceptance simply because it significantly shortens test time.
Specificity is the ability of a diagnostic technique to correctly identify actual normals as beingnormal. Humphrey’s STATPAC for Blue-Yellow was designed to provide the same level ofspecificity for SWAP as currently enjoyed in standard white-on-white Humphrey perimetry.
The original Blue-Yellow research protocols called for laborious determination of the yellow-ness of the crystalline lens. One conclusion of these protocols was that such measurementsadded little if anything to the diagnostic power of the procedure8. Measurement of the crystal-line lens does add information about the overall height of the hill of vision, but most of thevisual field information used in glaucoma diagnosis has to do with localized sensitivity loss, notwith general sensitivity. From a practical point of view, crystalline lens measurements do notappear to be worth the clinical time consumed.
Although Humphrey’s Blue-Yellow Perimetry is available for screening tests in addition tothreshold tests, research studies dealing with Blue-Yellow have involved threshold testingexclusively. Because screening strategies have been optimized for white testing, you may findan increased number of screening fields to appear abnormal. We suggest for now you useBlue-Yellow testing only with the threshold testing strategies.
Specificity of blue-yellowtesting

4-16 TEST PARAMETERS AND STRATEGIES
REV. A 10/98 PN 47653-1 HUMPHREY FIELD ANALYZER II
In addition to the standard white stimulus, all central field tests may be performed using a blueor red stimulus on a white background. The filters to create the colored stimuli are listed andcharacterized below.
Color Filter
Blue 440 nm Blue (models 745, 750)
OCLI Dichroic Blue (models 730, 735, 740)
Red Hoya R62
Note: This is not the same as Blue-Yellow Testing. See previous discussion for details.
1. From the start test screen, select CHANGE PARAMETERS.2. Open the stimulus color drop-down menu and choose either BLUE or RED.3. Proceed as you would for any white stimulus test.
Note: The decibel to apostilb comparison chart in the Appendix is different in color testingthan it is in white testing. In color testing, zero decibels still represents the maximuminstrument brightness although that maximum brightness is less than 10,000 asb. Decibelvalues are still valid for comparison of relative brightness for a given color filter.
ALTERNATECOLOR TESTING(models 730-750)
Performing a color test

REV. A 10/98 PN 47653-1 HUMPHREY FIELD ANALYZER II
Testing 5Start Test Options 5-2
Monitoring and Maintaining the Patient's Eye Position 5-4
Supplemental Testing 5-7
Test In Progress 5-10
Test Complete Options 5-14
Testing: A Step-by-Step Guide 5-16
During the testing phase, your responsibility shifts to monitoring the patient’s progress toensure a successful outcome and reliable results. This section explores your options availableduring the test. It helps to answer the following questions, and others:
• How do I pause the test to allow the patient to rest?
• If I’ve chosen the wrong eye to begin testing, how do I switch?
• Can I restart a test once it has begun?
• How do Head Tracking and Vertex Monitoring help when trial lenses are used?
• Must I print the test results immediately following a test?

REV. A 10/98 PN 47653-1 HUMPHREY FIELD ANALYZER II
TESTING5-2
After you have chosen a test and specified which eye is to be tested, you will arrive at the Startof Test screen. From this screen you can start the test, display a list of all current parameters,change the parameter settings, and change the test eye.
Figure 5.1: The Start of Test Screen
STARTThis button initiates the testing sequence, starting with supplemental testing, if chosen.Supplemental tests include foveal threshold measurement or initialization of the Gaze Trackingfixation monitoring system (models 740-750). Refer to “Supplemental Testing” in this sectionfor additional information.
DISPLAY STATUSThis choice presents a displayof all current test parametersettings. Select OK to collapsethe pop-up window. You cannotchange any setting throughDISPLAY STATUS. These settingsmust be changed by pressingCHANGE PARAMETERS asdescribed in Section 4. The testcontinues to run when DISPLAYSTATUS is selected during atest.
CHANGE PARAMETERSThis function allows you to alter any testing parameter (e.g. test speed, stimulus color) prior tostarting the test. Once the test begins, only two parameters may be changed: fixation monitor-ing and test speed. See previous discussion in Section 4: “Setting Test Parameters” for details.
START TEST OPTIONS
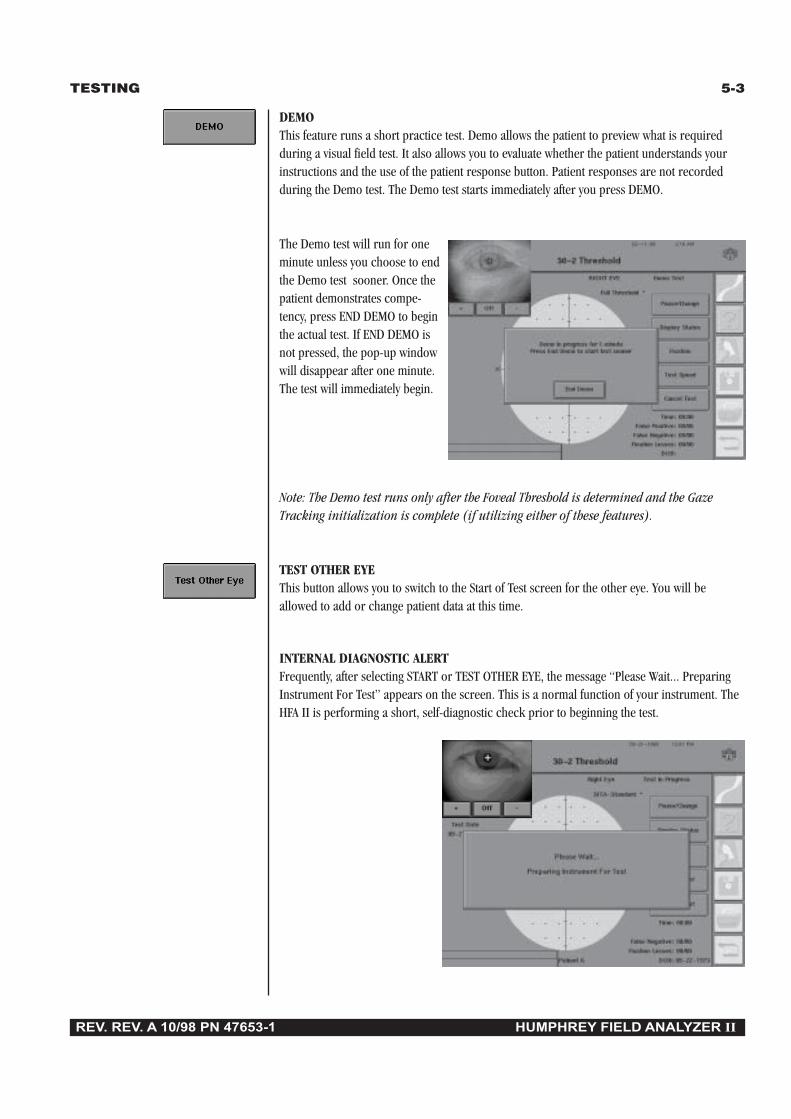
REV. REV. A 10/98 PN 47653-1 HUMPHREY FIELD ANALYZER II
TESTING 5-3
DEMOThis feature runs a short practice test. Demo allows the patient to preview what is requiredduring a visual field test. It also allows you to evaluate whether the patient understands yourinstructions and the use of the patient response button. Patient responses are not recordedduring the Demo test. The Demo test starts immediately after you press DEMO.
The Demo test will run for oneminute unless you choose to endthe Demo test sooner. Once thepatient demonstrates compe-tency, press END DEMO to beginthe actual test. If END DEMO isnot pressed, the pop-up windowwill disappear after one minute.The test will immediately begin.
Note: The Demo test runs only after the Foveal Threshold is determined and the GazeTracking initialization is complete (if utilizing either of these features).
TEST OTHER EYEThis button allows you to switch to the Start of Test screen for the other eye. You will beallowed to add or change patient data at this time.
INTERNAL DIAGNOSTIC ALERTFrequently, after selecting START or TEST OTHER EYE, the message “Please Wait... PreparingInstrument For Test” appears on the screen. This is a normal function of your instrument. TheHFA II is performing a short, self-diagnostic check prior to beginning the test.

REV. A 10/98 PN 47653-1 HUMPHREY FIELD ANALYZER II
TESTING5-4
MONITORING ANDMAINTAINING THEPATIENT’S EYEPOSITION
Video Eye Monitor All HFA II models feature a video eye monitor. This monitor, which is automatically visible onthe Start of Test screen, enables you to view the patient’s test eye. Accurate placement of the eyeis important. When the cross-hatches are seen over the pupil, the eye is centered.
Use the video eye monitor to:
• position the test eye in the center of the trial lens holder
• monitor the patient during testing.
The three controls on the video eye monitor are: a plus sign (+) to brighten the image, aminus sign (-) to dim the image, and an OFF button to turn off the monitor display. To re-display the monitor, press the upper-left EYE button.
Figure 5.2: The Video Eye Monitor
Gaze Tracking Gaze Tracking is a unique fixation tracking system that records whether the patient is(models 740-750) properly fixating while stimuli are being presented. A brief initialization procedure is required
at the start of each test to calibrate and adjust the gaze tracker to the patient’s eye. It isimperative, therefore, that the patient maintain the same position during gaze initialization andtesting. Deviations are recorded and displayed on the test screen and on the printout.
Note: Some patients with small pupils, ptotic lids, interfering lashes, or strongprescriptions may not be good candidates for the gaze monitoring.
At the Start of Test screen, you can make changes to the fixation monitoring system or turn themonitoring system off entirely by pressing CHANGE PARAMETERS. Gaze monitoring may onlybe selected at the start of a test, although it may be turned off at any time during the test.
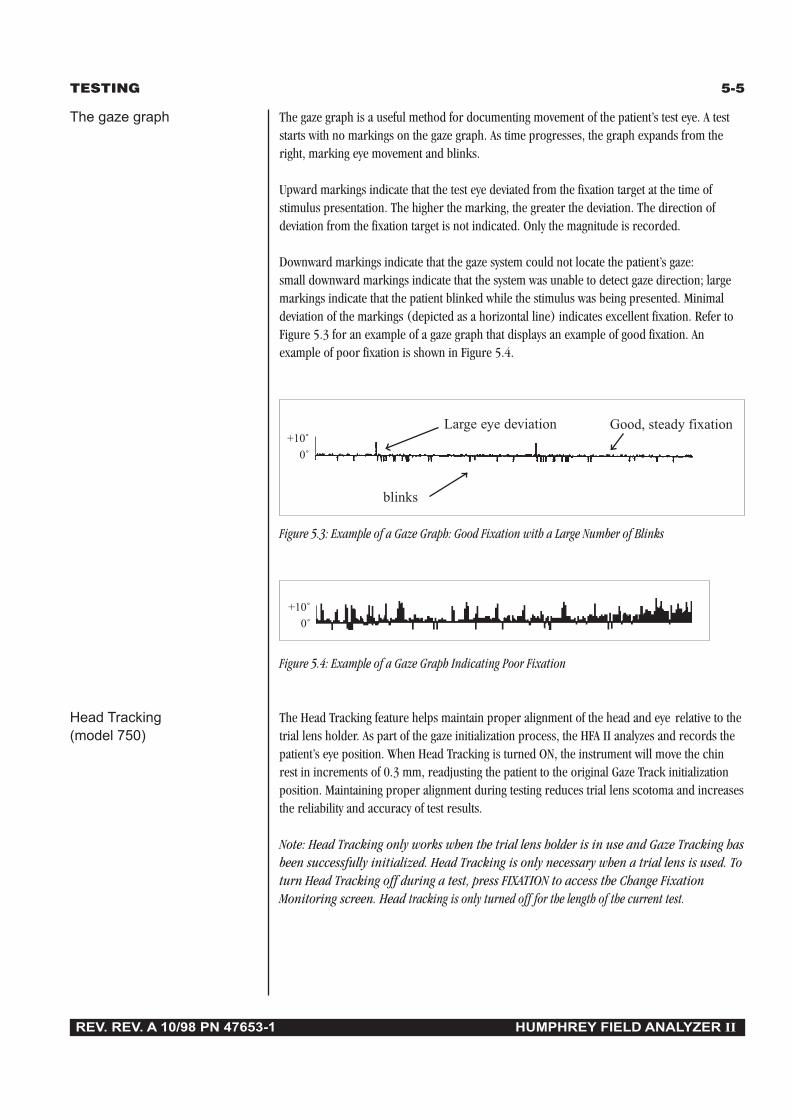
REV. REV. A 10/98 PN 47653-1 HUMPHREY FIELD ANALYZER II
TESTING 5-5
The gaze graph The gaze graph is a useful method for documenting movement of the patient’s test eye. A teststarts with no markings on the gaze graph. As time progresses, the graph expands from theright, marking eye movement and blinks.
Upward markings indicate that the test eye deviated from the fixation target at the time ofstimulus presentation. The higher the marking, the greater the deviation. The direction ofdeviation from the fixation target is not indicated. Only the magnitude is recorded.
Downward markings indicate that the gaze system could not locate the patient’s gaze:small downward markings indicate that the system was unable to detect gaze direction; largemarkings indicate that the patient blinked while the stimulus was being presented. Minimaldeviation of the markings (depicted as a horizontal line) indicates excellent fixation. Refer toFigure 5.3 for an example of a gaze graph that displays an example of good fixation. Anexample of poor fixation is shown in Figure 5.4.
Figure 5.3: Example of a Gaze Graph: Good Fixation with a Large Number of Blinks
Figure 5.4: Example of a Gaze Graph Indicating Poor Fixation
Head Tracking The Head Tracking feature helps maintain proper alignment of the head and eye relative to the(model 750) trial lens holder. As part of the gaze initialization process, the HFA II analyzes and records the
patient’s eye position. When Head Tracking is turned ON, the instrument will move the chinrest in increments of 0.3 mm, readjusting the patient to the original Gaze Track initializationposition. Maintaining proper alignment during testing reduces trial lens scotoma and increasesthe reliability and accuracy of test results.
Note: Head Tracking only works when the trial lens holder is in use and Gaze Tracking hasbeen successfully initialized. Head Tracking is only necessary when a trial lens is used. Toturn Head Tracking off during a test, press FIXATION to access the Change FixationMonitoring screen. Head tracking is only turned off for the length of the current test.
+10˚0˚
+10˚0˚
Large eye deviation
blinks
Good, steady fixation

REV. A 10/98 PN 47653-1 HUMPHREY FIELD ANALYZER II
TESTING5-6
It is possible in certainsituations for the HeadTracking feature to “lose itsplace”. The most commonreason for this is a suddenshift of the eye or reposition-ing of the head. A patientwhose head does not movewith the chin rest will causeHead Tracking to beep. Apop-up window will appeargiving you the opportunity tocontinue or discontinueusing Head Tracking. The HFA II continues testing while the message is on the screen. Youshould re-instruct your patient at this point. Make sure that the chin rest supports the patient’shead. This will ensure that the head moves with the chin rest.
Vertex Monitor The Vertex Monitor will beep and display a message on the touch screen if the patient backs(model 750) away more than 7 mm from his or her original position. This helps to eliminate the trial lens as
a source of visual field defects. Refer to Section 2: “System Setup – Vertex Monitor” forinstructions on turning on the Vertex Monitor.
The vertex reading is based on the initial patient position in front of the trial lens. To set:
1. Make sure that the trial lens holder is in the up position in front of the eye2. Properly align and instruct the patient3. Initialize the Gaze Tracking feature
The Vertex Monitor alarm willbeep if the patient has backedaway from the trial lens. Testingwill continue uninterrupted anda message will remain on thescreen until cleared by theoperator. Check the position ofthe patient’s forehead andreposition if necessary. If theVertex Monitor continues tosound, press RE-INITIALIZEVERTEX. The test will pause asthe screen displays the GazeTrack initialization sequence. This will reset the Vertex Monitor. The Vertex Monitor may alsobe turned off from this screen or by pressing FIXATION from the Test in Progress screen. TheVertex Monitor is turned off only for the length of the current test.
Note: The Vertex Monitor only works when the trial lens holder is in use and Gaze Track-ing has been successfully initialized. The Vertex Monitor is only necessary when a triallens is used.
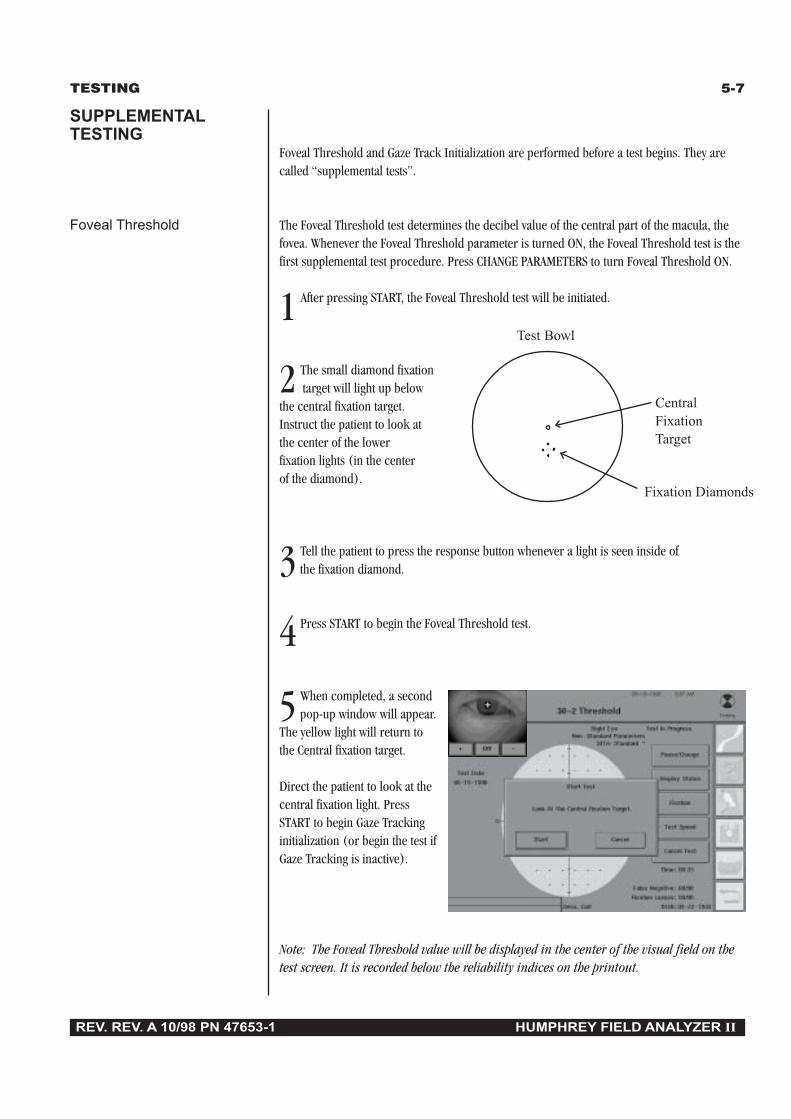
REV. REV. A 10/98 PN 47653-1 HUMPHREY FIELD ANALYZER II
TESTING 5-7
Foveal Threshold and Gaze Track Initialization are performed before a test begins. They arecalled “supplemental tests”.
Foveal Threshold The Foveal Threshold test determines the decibel value of the central part of the macula, thefovea. Whenever the Foveal Threshold parameter is turned ON, the Foveal Threshold test is thefirst supplemental test procedure. Press CHANGE PARAMETERS to turn Foveal Threshold ON.
1 After pressing START, the Foveal Threshold test will be initiated.
2 The small diamond fixationtarget will light up below
the central fixation target.Instruct the patient to look atthe center of the lowerfixation lights (in the centerof the diamond).
3 Tell the patient to press the response button whenever a light is seen inside ofthe fixation diamond.
4 Press START to begin the Foveal Threshold test.
5 When completed, a secondpop-up window will appear.
The yellow light will return tothe Central fixation target.
Direct the patient to look at thecentral fixation light. PressSTART to begin Gaze Trackinginitialization (or begin the test ifGaze Tracking is inactive).
Note: The Foveal Threshold value will be displayed in the center of the visual field on thetest screen. It is recorded below the reliability indices on the printout.
SUPPLEMENTALTESTING
Test Bowl
CentralFixationTarget
Fixation Diamonds
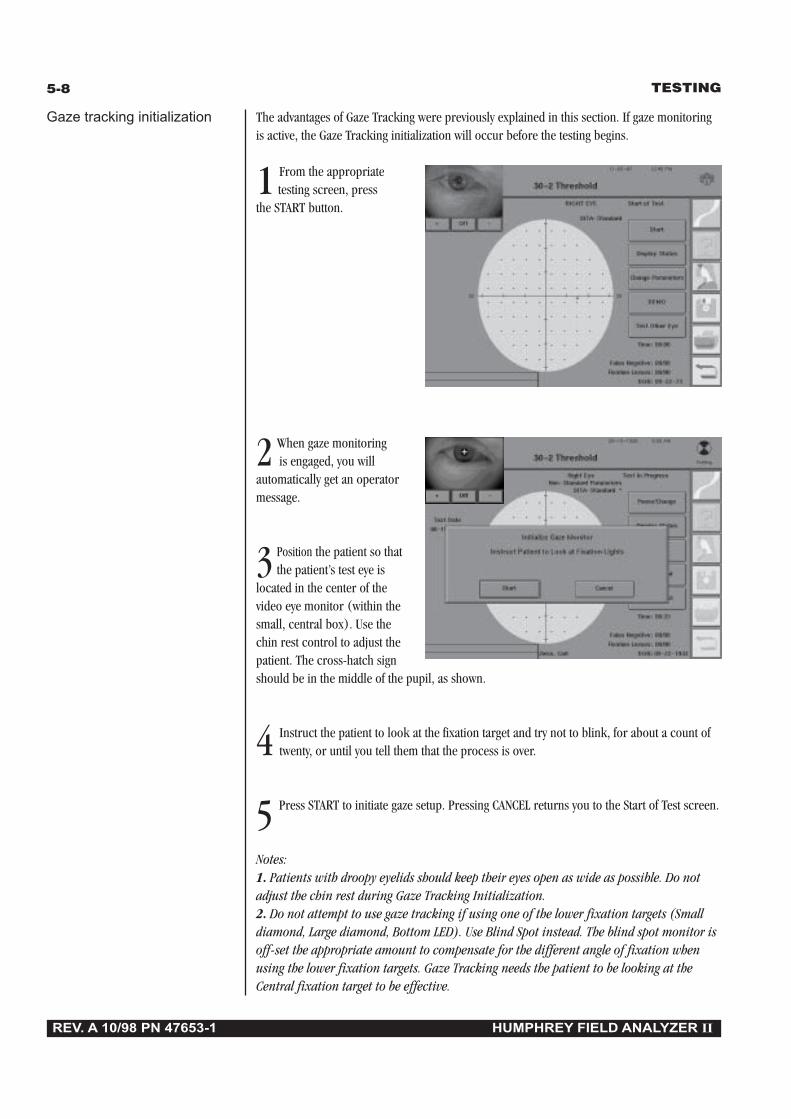
REV. A 10/98 PN 47653-1 HUMPHREY FIELD ANALYZER II
TESTING5-8
Gaze tracking initialization The advantages of Gaze Tracking were previously explained in this section. If gaze monitoringis active, the Gaze Tracking initialization will occur before the testing begins.
1 From the appropriatetesting screen, press
the START button.
2 When gaze monitoringis engaged, you will
automatically get an operatormessage.
3 Position the patient so thatthe patient’s test eye is
located in the center of thevideo eye monitor (within thesmall, central box). Use thechin rest control to adjust thepatient. The cross-hatch signshould be in the middle of the pupil, as shown.
4 Instruct the patient to look at the fixation target and try not to blink, for about a count oftwenty, or until you tell them that the process is over.
5 Press START to initiate gaze setup. Pressing CANCEL returns you to the Start of Test screen.
Notes:1. Patients with droopy eyelids should keep their eyes open as wide as possible. Do notadjust the chin rest during Gaze Tracking Initialization.2. Do not attempt to use gaze tracking if using one of the lower fixation targets (Smalldiamond, Large diamond, Bottom LED). Use Blind Spot instead. The blind spot monitor isoff-set the appropriate amount to compensate for the different angle of fixation whenusing the lower fixation targets. Gaze Tracking needs the patient to be looking at theCentral fixation target to be effective.
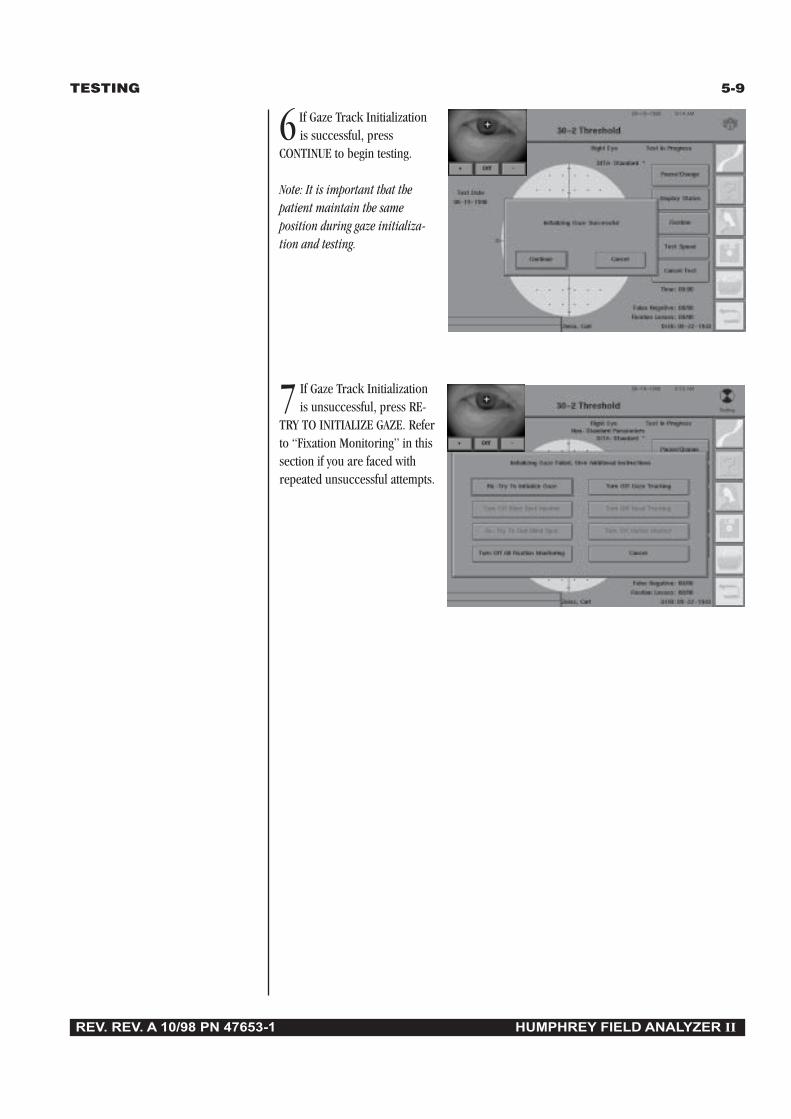
REV. REV. A 10/98 PN 47653-1 HUMPHREY FIELD ANALYZER II
TESTING 5-9
6 If Gaze Track Initializationis successful, press
CONTINUE to begin testing.
Note: It is important that thepatient maintain the sameposition during gaze initializa-tion and testing.
7 If Gaze Track Initializationis unsuccessful, press RE-
TRY TO INITIALIZE GAZE. Referto “Fixation Monitoring” in thissection if you are faced withrepeated unsuccessful attempts.
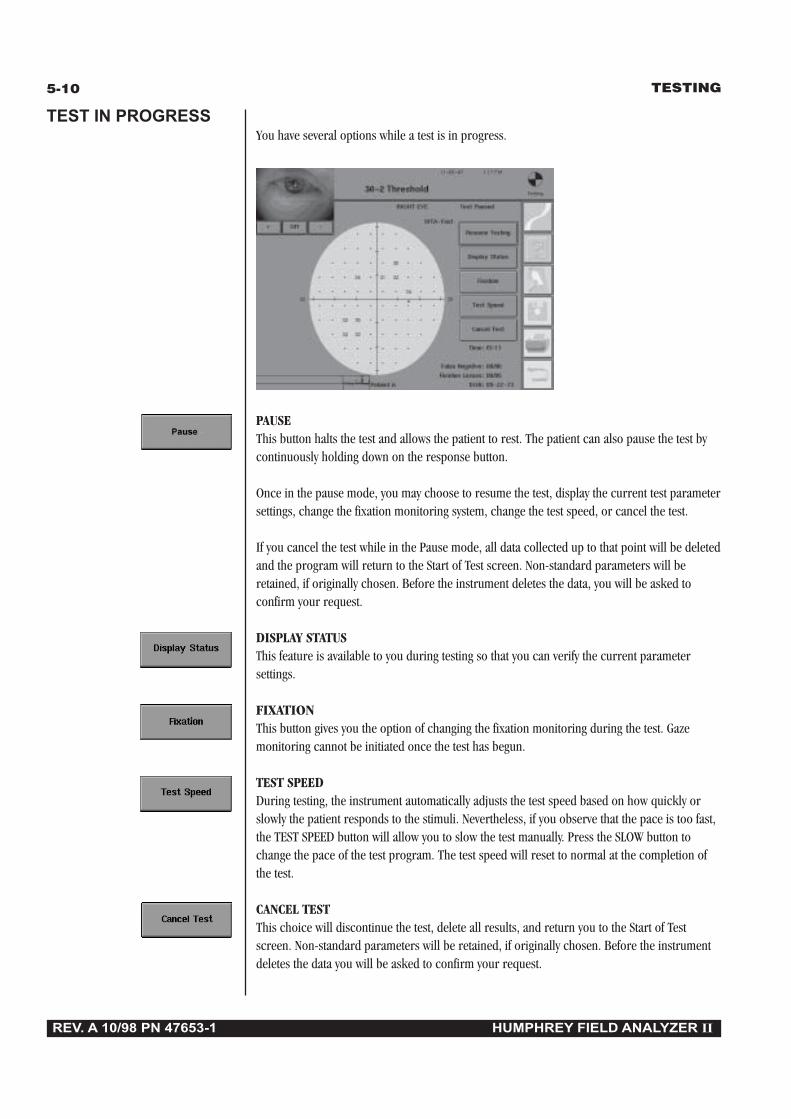
REV. A 10/98 PN 47653-1 HUMPHREY FIELD ANALYZER II
TESTING5-10
You have several options while a test is in progress.
PAUSEThis button halts the test and allows the patient to rest. The patient can also pause the test bycontinuously holding down on the response button.
Once in the pause mode, you may choose to resume the test, display the current test parametersettings, change the fixation monitoring system, change the test speed, or cancel the test.
If you cancel the test while in the Pause mode, all data collected up to that point will be deletedand the program will return to the Start of Test screen. Non-standard parameters will beretained, if originally chosen. Before the instrument deletes the data, you will be asked toconfirm your request.
DISPLAY STATUSThis feature is available to you during testing so that you can verify the current parametersettings.
FIXATIONThis button gives you the option of changing the fixation monitoring during the test. Gazemonitoring cannot be initiated once the test has begun.
TEST SPEEDDuring testing, the instrument automatically adjusts the test speed based on how quickly orslowly the patient responds to the stimuli. Nevertheless, if you observe that the pace is too fast,the TEST SPEED button will allow you to slow the test manually. Press the SLOW button tochange the pace of the test program. The test speed will reset to normal at the completion ofthe test.
CANCEL TESTThis choice will discontinue the test, delete all results, and return you to the Start of Testscreen. Non-standard parameters will be retained, if originally chosen. Before the instrumentdeletes the data you will be asked to confirm your request.
TEST IN PROGRESS

REV. REV. A 10/98 PN 47653-1 HUMPHREY FIELD ANALYZER II
TESTING 5-11
Printing partial If a test is paused or cannot be run to completion, it may be printed by pressing the PRINTtests FUNCTIONS icon button. Partial tests cannot be saved. Paused tests may be resumed after
printing and saved when completed.
Fixation monitoring The test will pause when the FIXATION button is pressed. It will remain paused while thefixation monitoring screen is displayed. Pressing any of the available buttons will change theparameter for the remainder of this test only. All monitoring devices will revert to the previoussettings for testing the next eye.
A “ghosted” button indicates either that choice is not available or the feature is not an optionwith your model HFA II. After one of the following options is chosen, the test will continue.
RE-TRY TO INITIALIZE GAZEThis will repeat the initialization process for Gaze Tracking. The Head Tracking and Vertexmonitoring systems will be re-initialized at the same time. Appropriate situations to re-initialize gaze are:
• The patient dramatically shifted his or her eye position.
• The Gaze Graph indicates poor fixation even though the patient was fixating in a steadymanner.
• Many downward markings show on the Gaze Graph indicating that Gaze Track washaving trouble detecting the patient’s gaze direction.
• Head tracking moved the patient’s head too far in the wrong direction.
• The vertex monitor alarm was sounding too often, even with good head positioning.

REV. A 10/98 PN 47653-1 HUMPHREY FIELD ANALYZER II
TESTING5-12
TURN OFF BLIND SPOT MONITORPress this button to turn off the Heijl-Krakau method of Blind Spot Monitoring. If Gaze/BlindSpot had been chosen at the start of the test and gaze tracking is initialized, the gaze trackingwill continue to monitor fixation while the blind spot monitor is turned off. If both gazetracking and blind spot monitoring are turned off, you can visually assess the patient’s ability tofixate by observing with the video eye monitor.
RE-TRY TO FIND BLIND SPOTThis will initiate discovery of the patient’s blind spot by using the stimulus to search in the areaof the blind spot for the exact location. This is sometimes necessary, for example, when thepatient’s head tilts during the test.
TURN OFF ALL FIXATION MONITORINGThis will turn off both Gaze Tracking and Blind Spot Monitoring if pressed. In this case, youcan monitor the patient’s fixation by watching the video eye monitor for the duration of the test.Both Head Tracking and Vertex Monitoring will be turned off as well when Gaze Tracking isdiscontinued.
TURN OFF GAZE TRACKINGThis will turn off the Gaze Tracking device as well as Head Tracking and Vertex Monitoring forthe current test. Blind spot monitoring is not affected.
TURN OFF HEAD TRACKINGOnly Head Tracking will be turned off by pressing this button.
TURN OFF VERTEX MONITORINGOnly the Vertex Monitor will be turned off by pressing this button.
Note: Putting the trial lens holder down during the test will also turn off the Head Track-ing and Vertex Monitoring devices. You should never put down the trial lens holder afterthe test has begun.
CANCELThis button will resume testing without any changes.

REV. REV. A 10/98 PN 47653-1 HUMPHREY FIELD ANALYZER II
TESTING 5-13
Tips for Gaze Tracking The keys to successful Gaze and Head Tracking are the same keys that make for successfuland Head Tracking visual field testing. Make sure the patient's chair has been moved close enough to the
instrument, and that the patient is sitting in a comfortable and erect position. Remember toslide the instrument toward the patient so the patient can sit in a comfortable, upright position.
Always monitor and encourage the patient. Early correction of any poor compliance will helpto increase the reliability of the visual field results.
Gaze Tracking may not work well in the following situations:
• Very small pupils or droopy eyelids.• High powered trial lenses.• Excessive eye movements.• Cloudy media.
Remember, if Gaze Tracking does not initialize successfully, Head Tracking, pupil sizemeasurement, and Vertex Monitoring cannot be utilized. Blind spot monitoring andvisual observation are still available to assess the reliability of the patient results in thesecases.
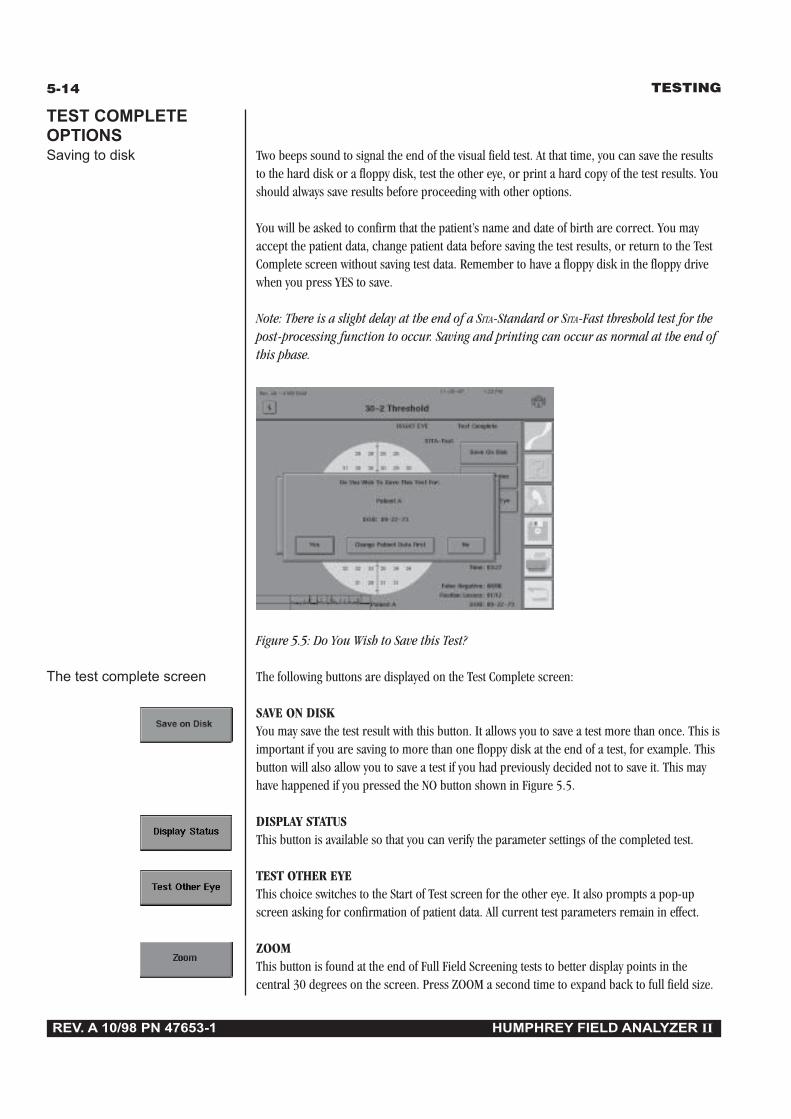
REV. A 10/98 PN 47653-1 HUMPHREY FIELD ANALYZER II
TESTING5-14
TEST COMPLETEOPTIONSSaving to disk Two beeps sound to signal the end of the visual field test. At that time, you can save the results
to the hard disk or a floppy disk, test the other eye, or print a hard copy of the test results. Youshould always save results before proceeding with other options.
You will be asked to confirm that the patient’s name and date of birth are correct. You mayaccept the patient data, change patient data before saving the test results, or return to the TestComplete screen without saving test data. Remember to have a floppy disk in the floppy drivewhen you press YES to save.
Note: There is a slight delay at the end of a SITA-Standard or SITA-Fast threshold test for thepost-processing function to occur. Saving and printing can occur as normal at the end ofthis phase.
Figure 5.5: Do You Wish to Save this Test?
The test complete screen The following buttons are displayed on the Test Complete screen:
SAVE ON DISKYou may save the test result with this button. It allows you to save a test more than once. This isimportant if you are saving to more than one floppy disk at the end of a test, for example. Thisbutton will also allow you to save a test if you had previously decided not to save it. This mayhave happened if you pressed the NO button shown in Figure 5.5.
DISPLAY STATUSThis button is available so that you can verify the parameter settings of the completed test.
TEST OTHER EYEThis choice switches to the Start of Test screen for the other eye. It also prompts a pop-upscreen asking for confirmation of patient data. All current test parameters remain in effect.
ZOOMThis button is found at the end of Full Field Screening tests to better display points in thecentral 30 degrees on the screen. Press ZOOM a second time to expand back to full field size.
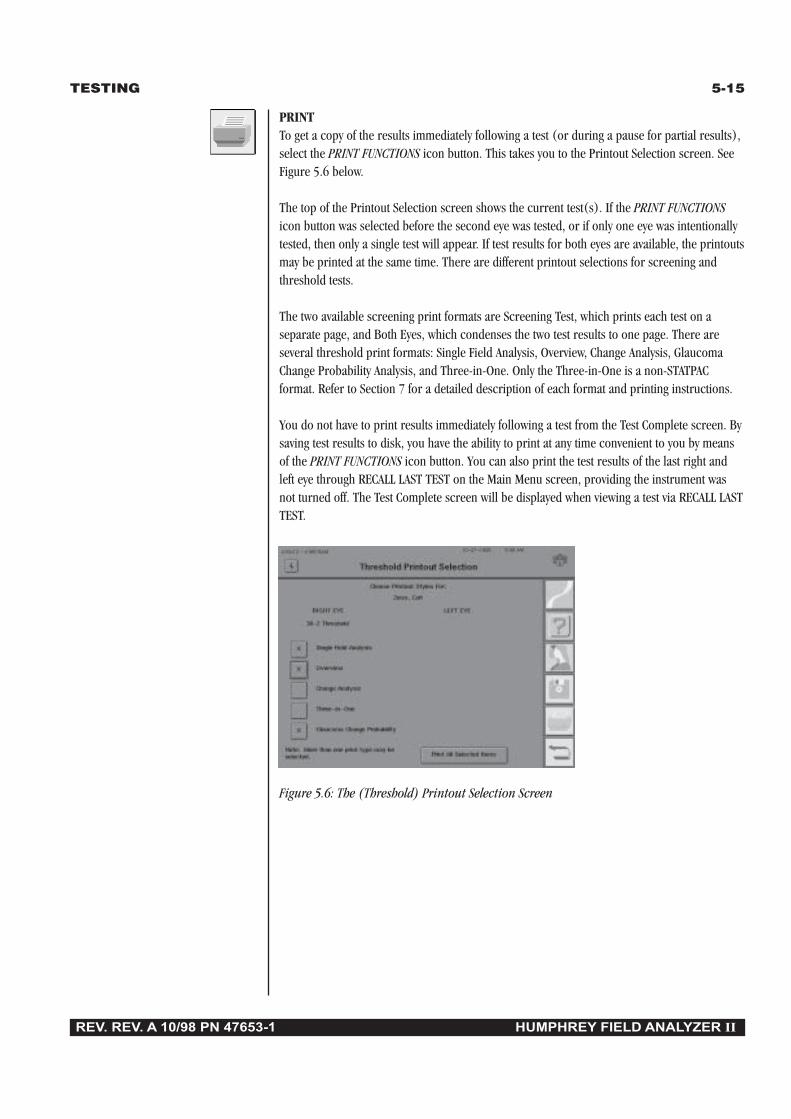
REV. REV. A 10/98 PN 47653-1 HUMPHREY FIELD ANALYZER II
TESTING 5-15
PRINTTo get a copy of the results immediately following a test (or during a pause for partial results),select the PRINT FUNCTIONS icon button. This takes you to the Printout Selection screen. SeeFigure 5.6 below.
The top of the Printout Selection screen shows the current test(s). If the PRINT FUNCTIONSicon button was selected before the second eye was tested, or if only one eye was intentionallytested, then only a single test will appear. If test results for both eyes are available, the printoutsmay be printed at the same time. There are different printout selections for screening andthreshold tests.
The two available screening print formats are Screening Test, which prints each test on aseparate page, and Both Eyes, which condenses the two test results to one page. There areseveral threshold print formats: Single Field Analysis, Overview, Change Analysis, GlaucomaChange Probability Analysis, and Three-in-One. Only the Three-in-One is a non-STATPACformat. Refer to Section 7 for a detailed description of each format and printing instructions.
You do not have to print results immediately following a test from the Test Complete screen. Bysaving test results to disk, you have the ability to print at any time convenient to you by meansof the PRINT FUNCTIONS icon button. You can also print the test results of the last right andleft eye through RECALL LAST TEST on the Main Menu screen, providing the instrument wasnot turned off. The Test Complete screen will be displayed when viewing a test via RECALL LASTTEST.
Figure 5.6: The (Threshold) Printout Selection Screen
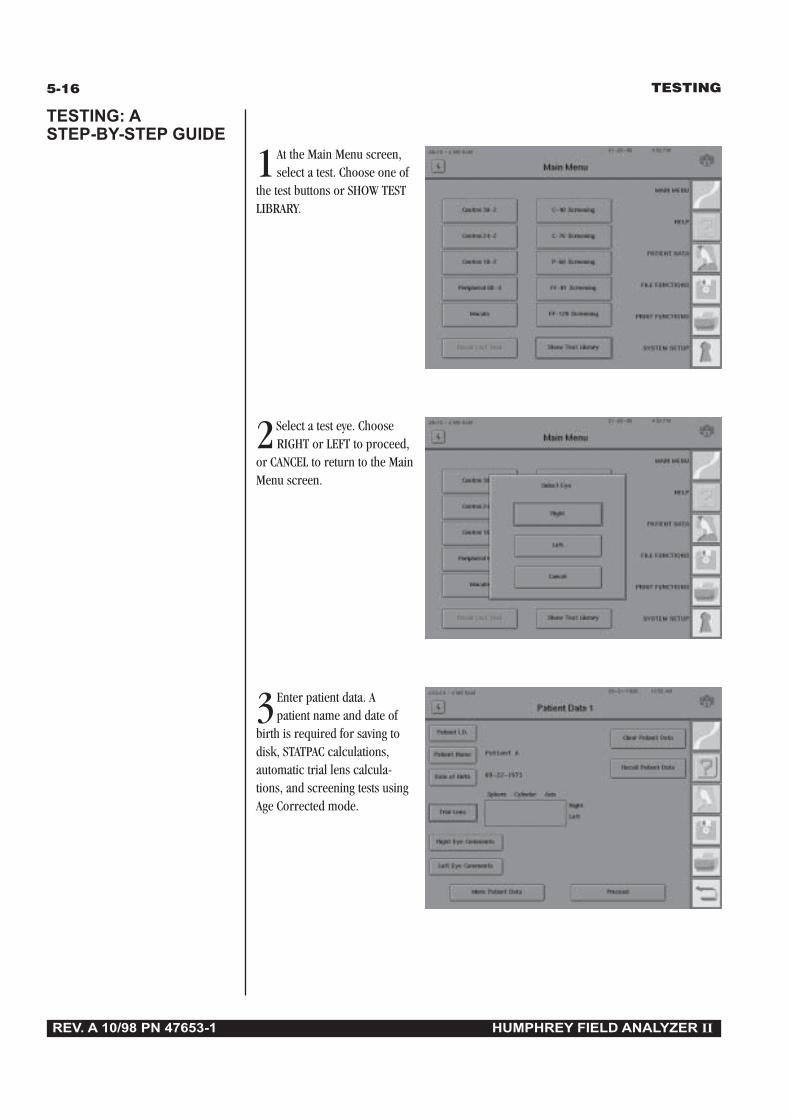
REV. A 10/98 PN 47653-1 HUMPHREY FIELD ANALYZER II
TESTING5-16
1At the Main Menu screen,select a test. Choose one of
the test buttons or SHOW TESTLIBRARY.
2Select a test eye. ChooseRIGHT or LEFT to proceed,
or CANCEL to return to the MainMenu screen.
3Enter patient data. Apatient name and date of
birth is required for saving todisk, STATPAC calculations,automatic trial lens calcula-tions, and screening tests usingAge Corrected mode.
TESTING: ASTEP-BY-STEP GUIDE
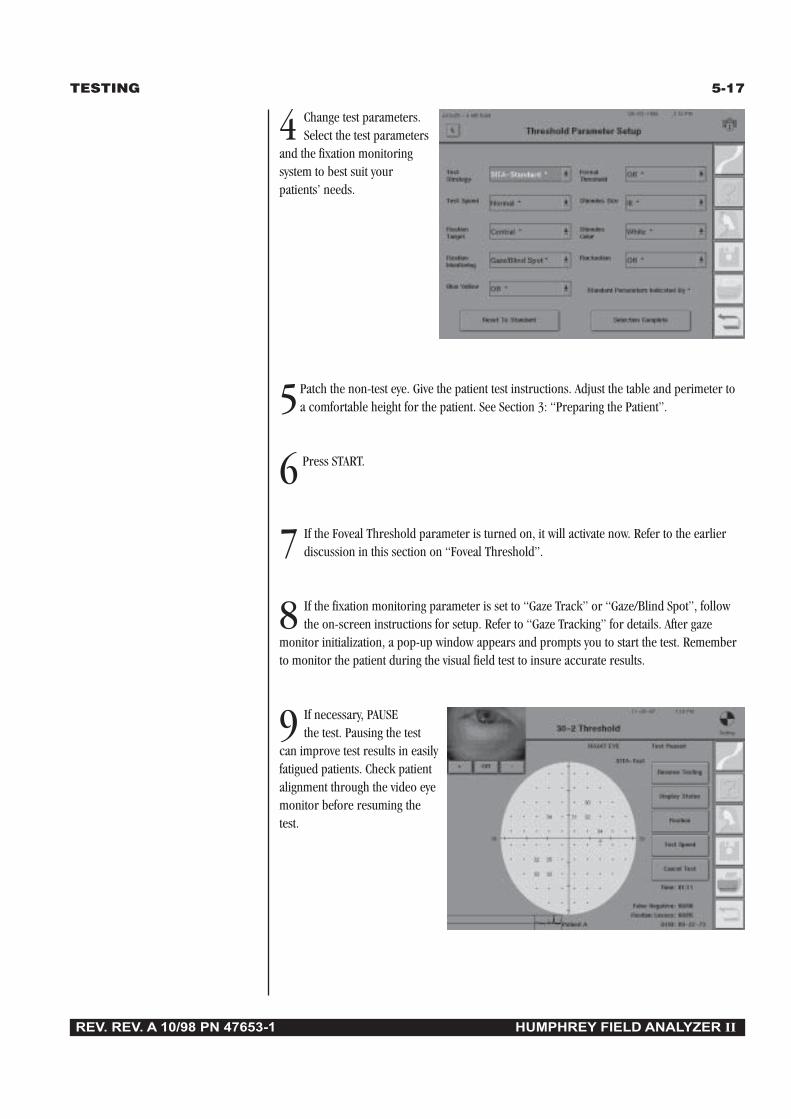
REV. REV. A 10/98 PN 47653-1 HUMPHREY FIELD ANALYZER II
TESTING 5-17
4 Change test parameters.Select the test parameters
and the fixation monitoringsystem to best suit yourpatients’ needs.
5Patch the non-test eye. Give the patient test instructions. Adjust the table and perimeter toa comfortable height for the patient. See Section 3: “Preparing the Patient”.
6 Press START.
7 If the Foveal Threshold parameter is turned on, it will activate now. Refer to the earlierdiscussion in this section on “Foveal Threshold”.
8 If the fixation monitoring parameter is set to “Gaze Track” or “Gaze/Blind Spot”, followthe on-screen instructions for setup. Refer to “Gaze Tracking” for details. After gaze
monitor initialization, a pop-up window appears and prompts you to start the test. Rememberto monitor the patient during the visual field test to insure accurate results.
9 If necessary, PAUSEthe test. Pausing the test
can improve test results in easilyfatigued patients. Check patientalignment through the video eyemonitor before resuming thetest.
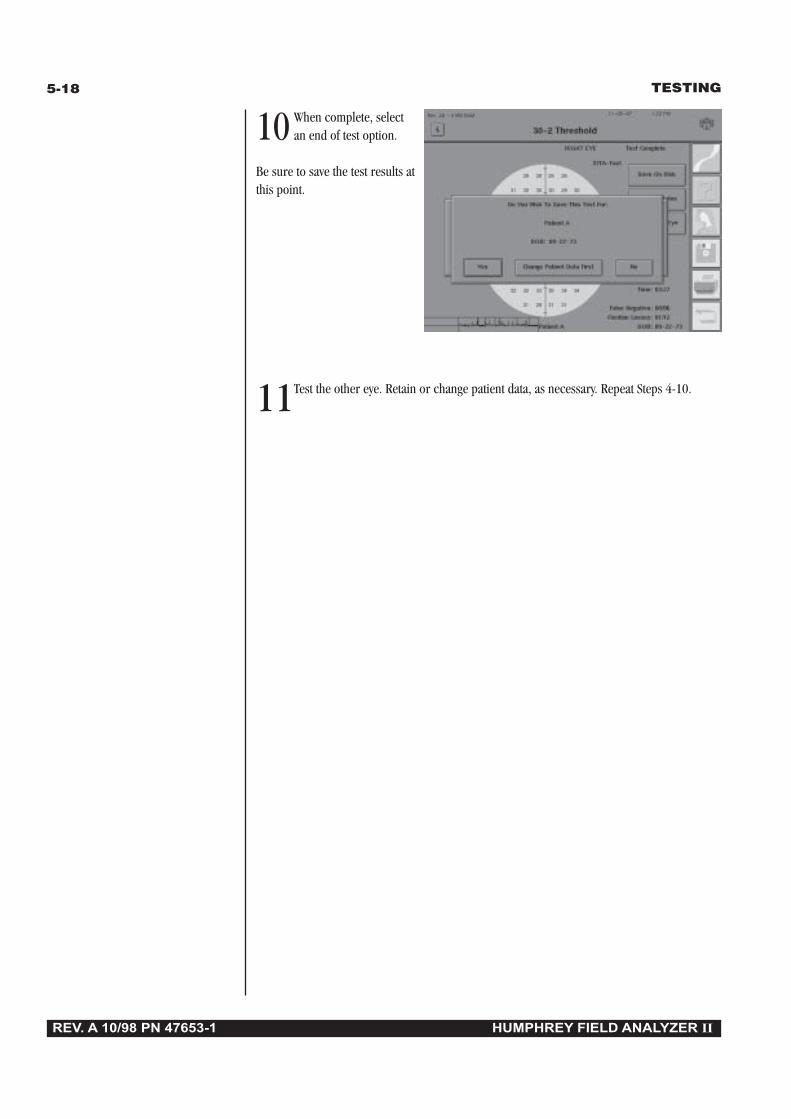
REV. A 10/98 PN 47653-1 HUMPHREY FIELD ANALYZER II
TESTING5-18
10 When complete, selectan end of test option.
Be sure to save the test results atthis point.
11Test the other eye. Retain or change patient data, as necessary. Repeat Steps 4-10.

REV. A 10/98 PN 47653-1 HUMPHREY FIELD ANALYZER II
Test Reliability 6Factors Affecting Reliability 6-2
Patient Compliance 6-2
Patient Fixation 6-3
Trial Lenses 6-3
Evaluating Reliability 6-4
Fixation Losses 6-4
False Positive Errors 6-4
False Negative Errors 6-6
Fluctuation Values 6-6
Visual field testing represents a team effort between the perimetrist and thepatient. Success, as measured by reliable test results, is best attained by
taking the necessary steps and precautions to help the patient take the test.
RELIABILITY
6-2 TEST RELIABILITY
REV. A 10/98 PN 47653-1 HUMPHREY FIELD ANALYZER II
FACTORS AFFECTINGRELIABILITY
Patient compliance The importance of the perimetrist reigns above all other factors affecting test reliability. Thiswas true before the advent of automation and still proves to be true with computerizedperimetry. The “human factor,” that is, the interaction between the perimetrist and the patient,cannot be overlooked when discussing test reliability.
It is the perimetrist’s job to promote patient cooperation and to motivate the patient to putforth his or her best effort.
Tips for achieving patient compliance:
• Create the proper environment.Do not position the perimeter in a noisy or busy location where the patient can beeasily distracted while listening to test instructions or while taking the visual field test.
Keep the room temperature cool so the patient is less likely to become drowsy.
• Foster a relaxed atmosphere.Vision tests sometimes make patients anxious, especially if it is a new experience.Allow patients time to relax, use the rest room, or drink water.
• Seat the patient comfortably.Use an adjustable office chair (with or without arms) to accommodate tall and shortpatients. The perimeter and table will accommodate a full-size office chair with armsor a wheelchair. Be sure to slide the instrument toward the patient and adjust thetable height to best meet comfort demands. The patient should be sitting comfortablyerect, and not leaning excessively forward.
• Give clear test instructions.Consider the possibility that the patient may not hear well. In such cases, face patientswhile explaining the test procedure so they can benefit from lip reading and gestures.Avoid giving instructions while the patient is wearing an eye patch.
Emphasize that it is normal and expected that many stimuli will not be seen. Thresh-old tests are designed such that fewer than 50% of the stimuli presented will be seen.
• Keep the patient motivated during the test.Pause the test, as necessary, to allow the patient ample rest time. Encourage thepatient frequently and assure them, by using verbal confirmations, that they are doinga good job (e.g. “You’re doing fine” or “Keep up the good work”).
Unless the patient has a proven record for reliability, don’t abandon them duringtesting, especially during the first few minutes. Correcting a problem immediatelymay prevent having to repeat an entire test.

TEST RELIABILITY 6-3
REV. A 10/98 PN 47653-1 HUMPHREY FIELD ANALYZER II
Patient fixation Improper or erratic fixation may make test results meaningless. The perimetrist can play animportant role by emphasizing fixation while explaining the test procedure.
Tips for improving patient fixation:
• Choose a fixation target that is appropriate for the patient. When you tell the patientto look at the yellow fixation light, verify that they can see the light by asking, “Do yousee the yellow light? Is it clear?”. If the light is not clear, consider modifying the triallens correction. If the patient cannot see the light, for example, due to maculardisease, change to the small or large diamond to help the patient fixate throughoutthe test.
• Use the Demo test to make sure the patient understands the test and is respondingproperly. Re-instruct the patient as necessary, especially if they are inclined to lookaround for stimuli.
• Fixation is more difficult with a dry cornea. Encourage the patient to blink normallywhenever they press the response button. Lack of blinking can cause part of thevisual field to “white out” for some patients.
• Inform your patient in advance that it is normal for the background to seem tochange or for the fixation target to seem to move. Barring other problems, theyshould not let these phenomena distract them. Encourage them to take breaks andpause the test by holding down on the response button if fatigue is a problem.
• Observe the patient by means of the video eye monitor. Encourage correct behavior.
• Record any observations that are relevant to reliability by entering your comments onthe patient data screen, or by writing your comments directly on the printout.
Trial lenses Using trial lenses incorrectly or using none when one is needed is another source of unreliabletest results.
Things to remember about trial lenses:
• Use a trial lens, when necessary. Use only the thin, wire-rimmed variety. Let theautomatic calculation program (see Section 3: “Inputting Trial Lens Data”) deter-mine the correct lens power to use. Verify with the patient that the fixation light is notblurred.
• Use trial lenses only for central tests (within 30°), or the central part of a full fieldtest. Remove trial lenses and lower the trial lens holder for peripheral tests (beyond30°). You cannot start the peripheral part of a full field test until the trial lens holderhas been lowered.
• Place the sphere correction in the slot closest to the patient’s eye and the cylinderlens behind the sphere. Adjust the trial lens holder so that the lenses are as close tothe patient’s eye as comfort will allow, without touching any lashes.
• Tell the patient that it is important to stay close to the trial lens and centered behindit. Model 750 owners should use Head Tracking and Vertex Monitoring to help keepthe trial lens centered and set at the proper distance (see Section 5).

6-4 TEST RELIABILITY
REV. A 10/98 PN 47653-1 HUMPHREY FIELD ANALYZER II
Even with the most careful perimetric technique, sometimes test results are unreliable. Toassist with evaluating reliability, the HFA II offers several tools that measure accuracy andconsistency. “Catch trials” are special stimuli (or lack of) which are used for monitoring.
Fixation losses When the fixation monitoring test parameter is set to blind spot (Heijl-Krakau) mode, properfixation is checked by projecting 5% of stimuli at the presumed location of the physiologicalblind spot. Only if the patient indicates seeing the blind spot check stimulus will the instrumentrecord a fixation loss. A high fixation loss score indicates that the patient did not fixate wellduring the test, or that the blind spot was incorrectly located.
The printout will show the total number of fixation losses followed by the total number ofstimuli presented within the blind spot. In the example shown in Figure 6.1 below, the patienthad 17 fixation losses out of a total of 26 check stimuli presented.
If fixation losses exceed 20%, XX will be printed after the score. When the test is in progress,the HFA II will beep once if the patient responds to two of the last five fixation checks. If, afterhearing the beep, the patient appears to be fixating properly, you may wish to replot the blindspot. High fixation loss scores may be due to an erroneously plotted blind spot, caused bypatient head tilt. Straightening the head, or replotting the blind spot can remedy this situation.
Gaze Tracking may be used as the sole fixation monitor or in conjunction with the Heijl-Krakaublind spot mode described above. If a patient has demonstrated both good fixation and testtaking reliability in the past, you may prefer using just Gaze Tracking. Because blind spotmonitoring adds time to the test, using the Gaze Tracker alone can shorten test time.
False positive errors Another indication of poor reliability is when a patient responds to catch trials in which nostimulus has been projected. This is referred to as a false positive response and tracked as afalse positive error.
The printout will show the total number of false positive errors followed by the total number oftrials. If errors exceed 33% of the trials, XX will appear on the screen and on the printoutalthough test reliability may be compromised at false positive rates that are much lower than33%. A high false positive score may indicate that the patient is overly concerned about notseeing all the stimuli. The “trigger happy” person will need to be re-instructed and reassuredthat it is normal for many stimuli to be missed.
In addition to a high false positive finding, trigger happy patients often show threshold resultsthat are abnormally high. An example of this phenomenon is shown in Figure 6.1. Any findingof 40 dB or greater indicates a hypersensitive result which can only be due to patient overreac-tion or guessing when pressing the patient response button. It is best to note the results earlyin the exam and start the test over than to allow the test to run to completion and be com-pletely invalid.
EVALUATINGRELIABILITY

TEST RELIABILITY 6-5
REV. A 10/98 PN 47653-1 HUMPHREY FIELD ANALYZER II
Figure 6.1: Sample Printout Showing Poor Reliability.
The example above indicates a very unreliable patient. A high number of fixation losses, falsepositive errors, and false negative errors have been recorded. Poor fixation is indicated by thegaze graph. Also note the number of points where threshold results are 40 dB or higher.
False PositiveFalse Negative
Fixation Losses
Gaze Graph
XX
Abnormally high results

6-6 TEST RELIABILITY
REV. A 10/98 PN 47653-1 HUMPHREY FIELD ANALYZER II
False negative errors Occasionally during a test, a stimulus is repeated at a particular location and at a level muchbrighter than has already been seen. If the patient does not respond to this trial stimulus, afalse negative error is recorded.
The printout will show the total number of false negative errors followed by the total number oftrials. If errors exceed 33% of the trials, XX will appear on the screen and the printout. A highfalse negative score may indicate a fatigued patient, inattentive patient or a malingerer, but it isalso commonly seen in reliable patients who have genuine significant visual field loss.
Note: SITA-Standard and SITA-Fast test results will display false negative and false positiveerrors as percentages, not as fractions.
Fluctuation values The fluctuation value is an option that can be used with the Full Threshold and FastPacstrategies. Fluctuation is not measured when using either of the SITA strategies. Whenfluctuation is turned on, the threshold is measured twice at 10 pre-selected points. The HFA IIthen calculates a fluctuation value on the basis of the differences between the first and secondmeasurements at each of the 10 points. This value is an index of how reliable a patient’sresponses were during the test.
A patient who is very consistent will have a low fluctuation value, while a patient whoseresponses vary significantly will have a high value. All fluctuation values significantly outside thenormal limits will be flagged on the printout with p values, e.g. p < 0.01.
The fluctuation option will add about 10% to the test time. When test results are analyzed withSTATPAC, the fluctuation value is used in the calculation of CPSD, one of the four globalindices. If the fluctuation is turned off, the CPSD will not be calculated. A discussion ofp values, STATPAC and global indices can be found in Section 7.
A high fluctuation value may be the first sign of glaucomatous field loss in patients who areotherwise reliable subjects. It is also associated with established field loss in reliable subjects.On the other hand, a high fluctuation value may simply indicate that the patient was inattentiveor did not understand the test.
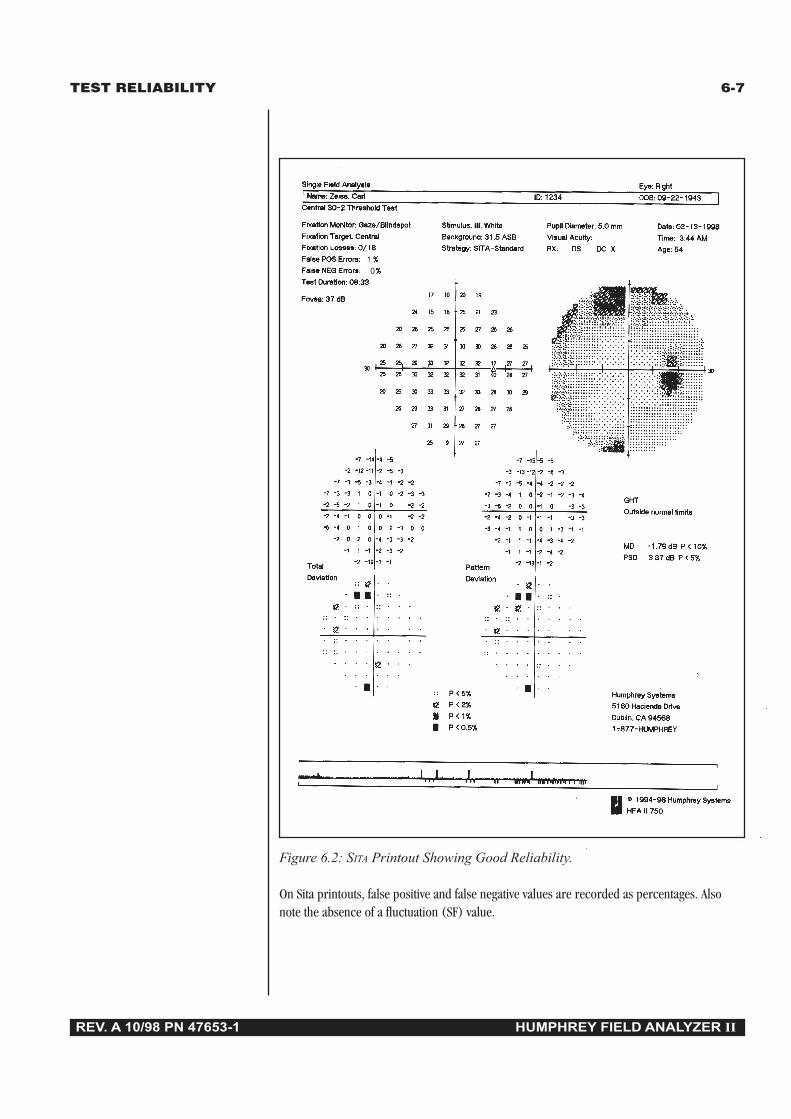
TEST RELIABILITY 6-7
REV. A 10/98 PN 47653-1 HUMPHREY FIELD ANALYZER II
Figure 6.2: SITA Printout Showing Good Reliability.
On Sita printouts, false positive and false negative values are recorded as percentages. Alsonote the absence of a fluctuation (SF) value.
0

6-8 TEST RELIABILITY
REV. A 10/98 PN 47653-1 HUMPHREY FIELD ANALYZER II

REV. A 10/98 PN 47653-1 HUMPHREY FIELD ANALYZER II
STATPAC™ Analysis & Printing Results 7Introduction to STATPAC Analysis 7-2
Threshold Test Printout Formats 7-4
SITA Printout Formats 7-21
Blue-Yellow Printout Formats 7-23
Printing Current Threshold Test Results 7-25
Screening Printout Formats 7-26
Printing Current Screening Test Results 7-27
Printing Previously Saved Test Results 7-28
Grayscale Symbols 7-30
Remote Printer Access 7-30
Humphrey Field Analyzer II printouts provide important information both in diagnosis andcontinued care. They document a patient’s current visual field status as well as changes insensitivity over time. Coupled with Humphrey’s STATPAC software, HFA II printouts provideaccess to sophisticated statistical analysis of visual field results.
Section 7 describes the available print formats and how to generateprintouts both immediately after testing and from stored files. Afterreading this section you will be able to answer the following questions:
• What parameters must be used to get a STATPAC analysis for a whitestimulus test? For Blue-Yellow testing?
• How do I print an Overview printout?
• How do I change the baseline visual fields when using the GlaucomaChange Probability Analysis?
• What should I do if a printer stops printing while I am using the HFA II?
• How are Change Analysis box plots determined?

7-2 STATPAC ANALYSIS & PRINTING RESULTS
REV. A 10/98 PN 47653-1 HUMPHREY FIELD ANALYZER II
The Humphrey Field Analyzer II’s statistical software, STATPAC, provides immediate expertsystem analysis of threshold visual field test results. With STATPAC you can analyze test resultsat the time of examination, store test results and analyze them at your convenience, or recallpreviously stored tests to analyze for comparative purposes.
STATPAC includes several exclusive features to help you judge visual field change.
• Using results from a single test, STATPAC can point out suspicious areas that otherwisemight not be evident until subsequent tests were done.
• STATPAC can identify areas that look suspicious but which, in fact, compare favorablywith normals data.
• Using results from a series of tests, STATPAC provides a highly sensitive and informativeanalysis of changes in the patient’s visual field over time.
If you intend to run a STATPAC analysis, always take two important steps during testing:
1. Make sure that the patient’s name and date of birth are entered exactly as theywere recorded on previous tests. Use the RECALL PATIENT DATA button asdescribed in Section 3: “Recalling Patient Data” to reduce patient data errors.
2. Save the test results to disk (hard drive and/or floppy disk).
These steps will avoid errors when using printouts that require multiple files for the samepatient. Also, because STATPAC uses an age-adjusted model, the analysis cannot be performedproperly unless the patient’s date of birth is provided.
STATPAC threshold STATPAC offers statistical analysis and printouts in several formats: Single Field Analysis,formats Overview, Change Analysis, and Glaucoma Change Probability Analysis.
The Single Field Analysis, as its name implies, analyzes the results of a single threshold test.This is the default printout which provides the most information for a given test.
The Overview presents the results of up to sixteen (16) tests for convenient comparison. Youmay view multiple test results per page for easier analysis.
The Change Analysis compares up to sixteen (16) tests and analyzes indices of change in thepatient’s field over time, flagging significant indicators for your attention.
The Glaucoma Change Probability Analysis highlights changes from a baseline which arelarger than the inter-test variability typically found in stable glaucoma patients.
INTRODUCTION TOSTATPAC ANALYSIS
Performing aSTATPAC analysis
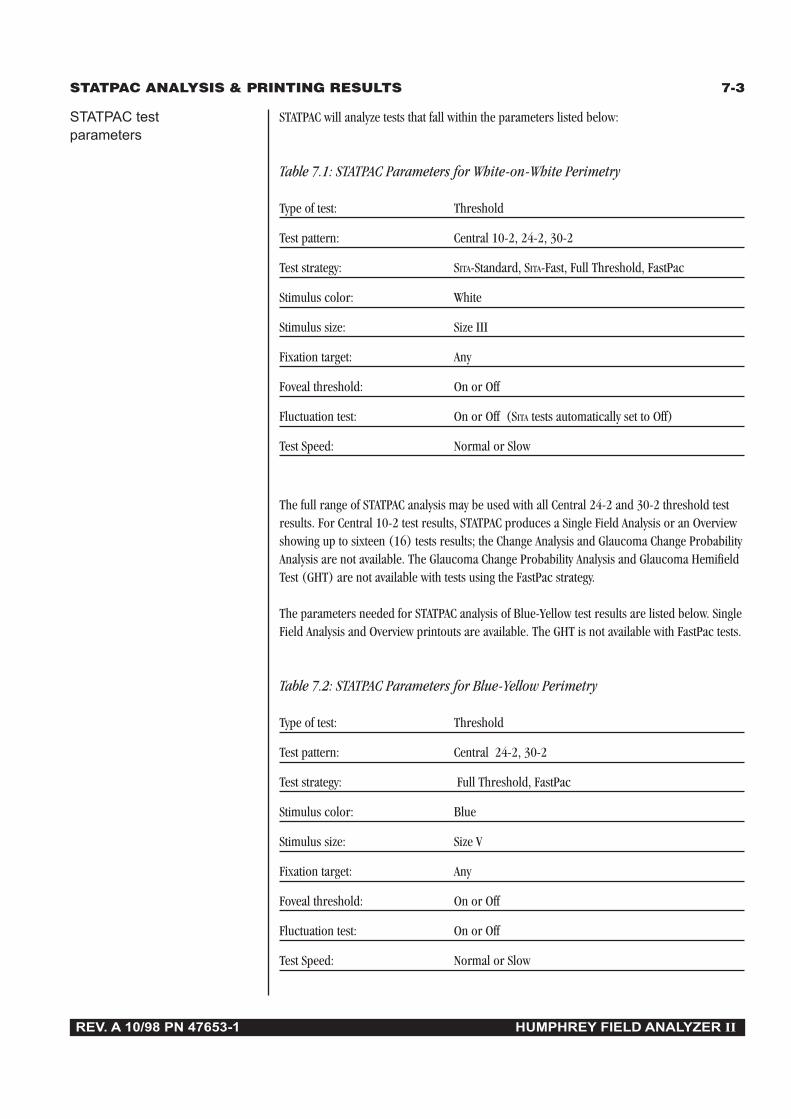
STATPAC ANALYSIS & PRINTING RESULTS 7-3
REV. A 10/98 PN 47653-1 HUMPHREY FIELD ANALYZER II
STATPAC test STATPAC will analyze tests that fall within the parameters listed below:parameters
Table 7.1: STATPAC Parameters for White-on-White Perimetry
Type of test: Threshold
Test pattern: Central 10-2, 24-2, 30-2
Test strategy: SITA-Standard, SITA-Fast, Full Threshold, FastPac
Stimulus color: White
Stimulus size: Size III
Fixation target: Any
Foveal threshold: On or Off
Fluctuation test: On or Off (SITA tests automatically set to Off)
Test Speed: Normal or Slow
The full range of STATPAC analysis may be used with all Central 24-2 and 30-2 threshold testresults. For Central 10-2 test results, STATPAC produces a Single Field Analysis or an Overviewshowing up to sixteen (16) tests results; the Change Analysis and Glaucoma Change ProbabilityAnalysis are not available. The Glaucoma Change Probability Analysis and Glaucoma HemifieldTest (GHT) are not available with tests using the FastPac strategy.
The parameters needed for STATPAC analysis of Blue-Yellow test results are listed below. SingleField Analysis and Overview printouts are available. The GHT is not available with FastPac tests.
Table 7.2: STATPAC Parameters for Blue-Yellow Perimetry
Type of test: Threshold
Test pattern: Central 24-2, 30-2
Test strategy: Full Threshold, FastPac
Stimulus color: Blue
Stimulus size: Size V
Fixation target: Any
Foveal threshold: On or Off
Fluctuation test: On or Off
Test Speed: Normal or Slow

7-4 STATPAC ANALYSIS & PRINTING RESULTS
REV. A 10/98 PN 47653-1 HUMPHREY FIELD ANALYZER II
Until this point, the User’s Guide has focused on the use and operation of the HFA II. Inattempting to explain the information provided on printouts, however, we must enter the realmof interpretation of field results.
Reliability indices Humphrey Field Analyzer printouts have always included reliability indices to help youdetermine the reliability of the patient’s responses in interpreting test results. These indicesinclude fixation losses, false positive errors, and false negative errors. Now, Gaze Tracking canalso be used for reliability information.
The reliability indices for each test appear on the Single Field Analysis, Overview, GlaucomaChange Probability Analysis, and Three-in-One printout. For Full Threshold and FastPac teststrategies, the HFA II prints “XX” after scores that fall outside the reliability limits used in thenormative database. In addition, STATPAC printouts include the message, “LOW RELIABILITY”,in such cases. For SITA-Standard and SITA-Fast tests, the “XX” is not printed after high numbersof false positive or false negative errors, but is printed after fixation losses of 20% or more.
For Full Threshold and FastPac tests, false positive errors, false negative errors, and fixationlosses are printed as a ratio, such as “3/10” . The first number represents the number oferrors committed, while the second number represents the number of times the instrumentchecked for each of these errors. In SITA-Standard and SITA-Fast tests, fixation losses are alsoprinted as a ratio, but false negative and false positive errors are printed as a percentage, suchas “25%”.
The visual fields used in developing STATPAC for the Full Threshold and FastPac strategies werethose of subjects whose reliability indices were within certain limits. Test results showingfixation loss scores of 20% or more and false positive or false negative errors of 33% or morewere excluded as unreliable. The significance limits thus derived were more restrictive thanthey would have been had unreliable test results not been excluded.
Thus, clinical results having poor reliability but for which the STATPAC analysis is normal maywell be normal. Results showing poor reliability and for which the STATPAC analysis is outsidenormal limits require careful analysis. Utilize the gaze tracking graph to help determine howsteady patient fixation was during the length of the test.
If the only “XX” on a test result applies to fixation losses and you are sure the patient wasfixating well, the problem may have been poor blind spot positioning rather than poor patientreliability. High false negative response rates are commonly seen in abnormal fields producedby completely reliable patients. On the other hand, test results may indeed be unreliablealready at false positive rates lower than the level required to generate the “XX” symbol.
Foveal threshold If you used the foveal threshold option when the test was run, the HFA II will print themeasured value just below the test time. When the patient’s foveal threshold is significantlydepressed (p < 5%), a probability symbol will appear next to the value shown. This symbol isidentical to those used for the probability plots and indicates the deviation from age normal.See the following discussions on Total and Pattern deviations for details.
THRESHOLD TESTPRINTOUT FORMATS

STATPAC ANALYSIS & PRINTING RESULTS 7-5
REV. A 10/98 PN 47653-1 HUMPHREY FIELD ANALYZER II
Figure 7.1: The Single Field Analysis Printout
The single field analysis The Single Field Analysis is based on the results of a single central threshold test. The topprintout of the page presents patient data, test reliability indices, and the test results in the grayscale
and numeric formats. The information that STATPAC adds is found in the lower half of the page.
Grayscale Results
Numeric (dB) Results
Test Parameters
Patient Data
Reliability Indices
Probability Symbols
Gaze Graph
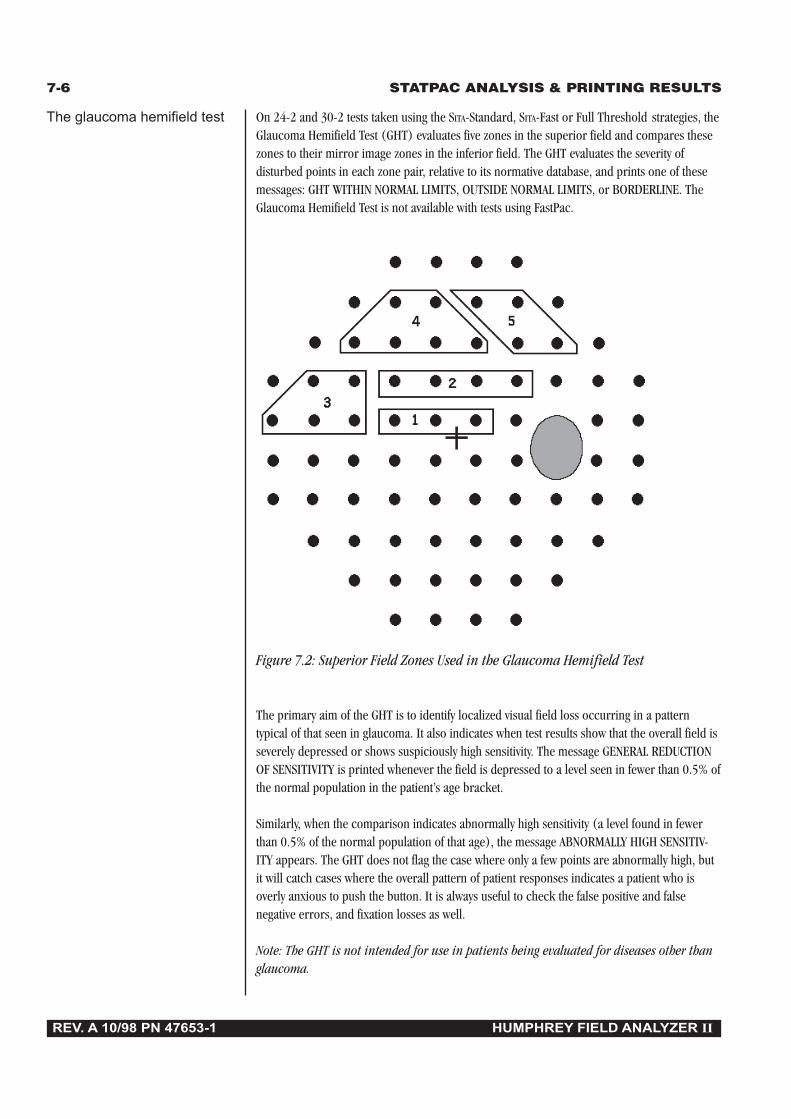
7-6 STATPAC ANALYSIS & PRINTING RESULTS
REV. A 10/98 PN 47653-1 HUMPHREY FIELD ANALYZER II
The glaucoma hemifield test On 24-2 and 30-2 tests taken using the SITA-Standard, SITA-Fast or Full Threshold strategies, theGlaucoma Hemifield Test (GHT) evaluates five zones in the superior field and compares thesezones to their mirror image zones in the inferior field. The GHT evaluates the severity ofdisturbed points in each zone pair, relative to its normative database, and prints one of thesemessages: GHT WITHIN NORMAL LIMITS, OUTSIDE NORMAL LIMITS, or BORDERLINE. TheGlaucoma Hemifield Test is not available with tests using FastPac.
Figure 7.2: Superior Field Zones Used in the Glaucoma Hemifield Test
The primary aim of the GHT is to identify localized visual field loss occurring in a patterntypical of that seen in glaucoma. It also indicates when test results show that the overall field isseverely depressed or shows suspiciously high sensitivity. The message GENERAL REDUCTIONOF SENSITIVITY is printed whenever the field is depressed to a level seen in fewer than 0.5% ofthe normal population in the patient’s age bracket.
Similarly, when the comparison indicates abnormally high sensitivity (a level found in fewerthan 0.5% of the normal population of that age), the message ABNORMALLY HIGH SENSITIV-ITY appears. The GHT does not flag the case where only a few points are abnormally high, butit will catch cases where the overall pattern of patient responses indicates a patient who isoverly anxious to push the button. It is always useful to check the false positive and falsenegative errors, and fixation losses as well.
Note: The GHT is not intended for use in patients being evaluated for diseases other thanglaucoma.

STATPAC ANALYSIS & PRINTING RESULTS 7-7
REV. A 10/98 PN 47653-1 HUMPHREY FIELD ANALYZER II
Total deviation plots On the left in the lower half of the Single Field Analysis printout is a pair of plots, one above theother, labeled Total Deviation. The numeric values in the upper portion of these plots representthe difference in decibels (dB) between the patient’s test results and the age-corrected normalvalues at each tested point in the visual field.
The lower total deviation plot, called a probability plot, translates the values in the upper plotinto shaded symbols which indicate the statistical significance of each decibel deviation. Theseare explained in the legend labeled Probability Symbols. The darker the symbol the less likelyit is that the field is normal in that location (although the likelihood of abnormality alsodepends upon the actual prevalence of disease in the patient population). For instance, atotally black square indicates that the deviation from normal found at that point locationoccurs in fewer than 0.5% of normal subjects. Notice that this probability statement is made ona point-by-point basis, allowing the practitioner to read the results like an isopter plot orgraytone.
Pattern deviation plots To the right of the total deviation plots in the Single Field Analysis printout are two additionalplots, labeled Pattern Deviation. These are similar to the total deviation plots, exceptthat here STATPAC has adjusted the analysis of the test results for any changes in the height ofthe measured hill of vision caused, for example, by cataracts or small pupils. Similarly,STATPAC corrects for any patients who are “supernormal”, adjusting the expected hill of visionupward by the appropriate amount and thereby making the analysis more sensitive to localizedscotomas.
Thus, the numeric Pattern Deviation plot shows the deviation in decibels from the age-corrected normal values, adjusted for any shift in overall sensitivity. The pattern deviationprobability plot indicates the statistical significance of the result at each point. Again, thedarker the symbol the more significant the deviation from the normal threshold value.
Global indices A short table labeled Global Indices appears on the far right side of the page. HereSTATPAC has made some calculations to provide overall guidelines to help the practitionerassess the field results as a whole rather than on the point-by-point basis shown in the TotalDeviation and Pattern Deviation plots. The four global indices are calculated from deviations inthe age-corrected normals data. The “p” (probability) values for the global indices, discussedbelow, do not need to be corrected again for age.
Mean Deviation (MD) is the average elevation or depression of the patient’s overall fieldcompared to the normal reference field. If the deviation is significantly outside the populationnorms, a “p” value is given. For example, if p < 2%, this means that fewer than 2% of thenormal population shows an MD larger than that found in this test. Categories for p values arep < 10%, p < 5%, p < 2%, p < 1%, and p < 0.5%.
A significant MD may indicate that the patient has an overall depression, or that there issignificant loss in one part of the field and not in others. MD is best interpreted in relation tothe Total and Pattern Deviation charts.
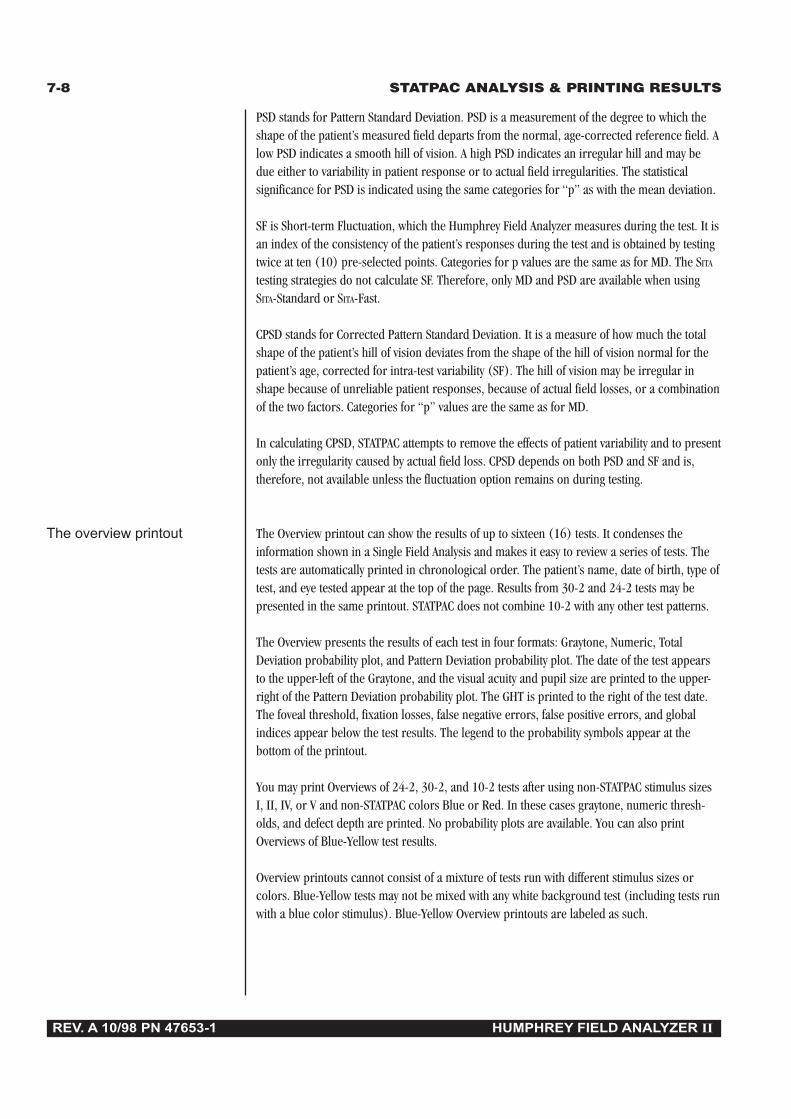
7-8 STATPAC ANALYSIS & PRINTING RESULTS
REV. A 10/98 PN 47653-1 HUMPHREY FIELD ANALYZER II
PSD stands for Pattern Standard Deviation. PSD is a measurement of the degree to which theshape of the patient’s measured field departs from the normal, age-corrected reference field. Alow PSD indicates a smooth hill of vision. A high PSD indicates an irregular hill and may bedue either to variability in patient response or to actual field irregularities. The statisticalsignificance for PSD is indicated using the same categories for “p” as with the mean deviation.
SF is Short-term Fluctuation, which the Humphrey Field Analyzer measures during the test. It isan index of the consistency of the patient’s responses during the test and is obtained by testingtwice at ten (10) pre-selected points. Categories for p values are the same as for MD. The SITA
testing strategies do not calculate SF. Therefore, only MD and PSD are available when usingSITA-Standard or SITA-Fast.
CPSD stands for Corrected Pattern Standard Deviation. It is a measure of how much the totalshape of the patient’s hill of vision deviates from the shape of the hill of vision normal for thepatient’s age, corrected for intra-test variability (SF). The hill of vision may be irregular inshape because of unreliable patient responses, because of actual field losses, or a combinationof the two factors. Categories for “p” values are the same as for MD.
In calculating CPSD, STATPAC attempts to remove the effects of patient variability and to presentonly the irregularity caused by actual field loss. CPSD depends on both PSD and SF and is,therefore, not available unless the fluctuation option remains on during testing.
The overview printout The Overview printout can show the results of up to sixteen (16) tests. It condenses theinformation shown in a Single Field Analysis and makes it easy to review a series of tests. Thetests are automatically printed in chronological order. The patient’s name, date of birth, type oftest, and eye tested appear at the top of the page. Results from 30-2 and 24-2 tests may bepresented in the same printout. STATPAC does not combine 10-2 with any other test patterns.
The Overview presents the results of each test in four formats: Graytone, Numeric, TotalDeviation probability plot, and Pattern Deviation probability plot. The date of the test appearsto the upper-left of the Graytone, and the visual acuity and pupil size are printed to the upper-right of the Pattern Deviation probability plot. The GHT is printed to the right of the test date.The foveal threshold, fixation losses, false negative errors, false positive errors, and globalindices appear below the test results. The legend to the probability symbols appear at thebottom of the printout.
You may print Overviews of 24-2, 30-2, and 10-2 tests after using non-STATPAC stimulus sizesI, II, IV, or V and non-STATPAC colors Blue or Red. In these cases graytone, numeric thresh-olds, and defect depth are printed. No probability plots are available. You can also printOverviews of Blue-Yellow test results.
Overview printouts cannot consist of a mixture of tests run with different stimulus sizes orcolors. Blue-Yellow tests may not be mixed with any white background test (including tests runwith a blue color stimulus). Blue-Yellow Overview printouts are labeled as such.
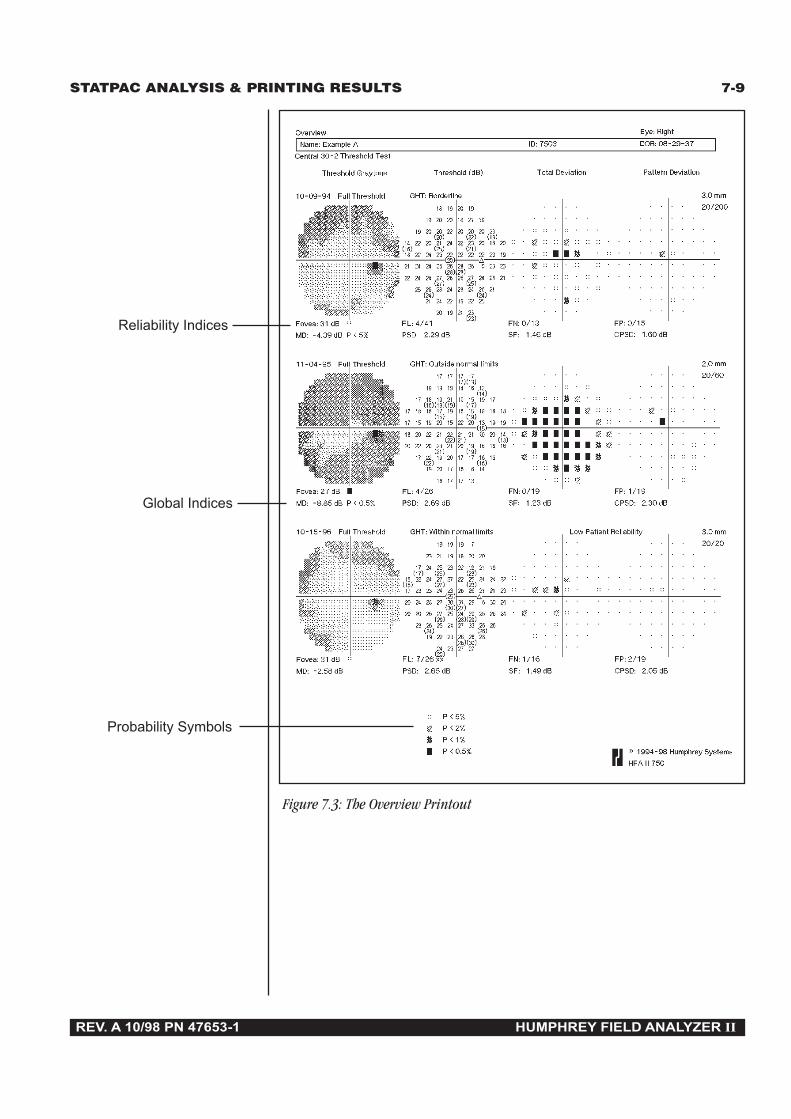
STATPAC ANALYSIS & PRINTING RESULTS 7-9
REV. A 10/98 PN 47653-1 HUMPHREY FIELD ANALYZER II
Probability Symbols
Reliability Indices
Global Indices
Figure 7.3: The Overview Printout

7-10 STATPAC ANALYSIS & PRINTING RESULTS
REV. A 10/98 PN 47653-1 HUMPHREY FIELD ANALYZER II
The change analysis Like the Overview printout, the Change Analysis printout shows analyses of up to sixteenprintout (16) test results on one sheet. In this case, STATPAC gives you an analytical summary of
changes in the patient’s visual field from the time of the earliest test you have included inthe summary to the time of the most recent test included.
STATPAC presents the Change Analysis in the form of a box plot analysis of test results, asummary of four global indices, and a linear regression analysis of Mean Deviation. Theindices are the same four presented in the Single Field Analysis, but this time they are plottedover time to indicate changes in the patient’s visual field.
The box plot Box plots are helpful in making a quick determination about the nature and extent ofvisual field changes over time. The box plot is a modified histogram that gives a five-numbersummary of the test results. It displays a concise summary of the Total Deviation decibel valuefor each test, showing the median, the two extreme values and the 15th and 85th percentiledeviations.
The summary is made up of the differences at each tested point between the patient’s measuredfield and the STATPAC age-corrected reference field. STATPAC plots the extreme values of thesedifferences (the 100th and zero percentile, or top and bottom end points of the line shown at(b) in Figure 7.4, the median difference (the three dark lines inside the box shown at (a), andthe 85th and 15th percentile differences (the top and bottom of the box).
Look at the box plot in Figures 7.4 and 7.5. The four things to note are:
1. The overall shape of the box, how elongated or compact it is.2. The location of the three dark lines inside the box that indicate the median (a).3. The top and bottom end points of the line along which the box lies (b).4. Where the patient’s box is plotted against the normal scale on the left of the printout.
(b) 100% best value= average maximum positivedeviation from age normal
(a) 85% 85th percentile50% median15% 15th percentile
(b) 0% worst value= average maximum negativedeviation from age normal
Figure 7.4: The Box Plot
To facilitate interpreting your patient’s field results, a “normal” box is presented to the left ofthe patient’s scale (see Figure 7.5). This is the mean of the boxes derived from the normalsdata on which the STATPAC model is based.

STATPAC ANALYSIS & PRINTING RESULTS 7-11
REV. A 10/98 PN 47653-1 HUMPHREY FIELD ANALYZER II
Figure 7.5: The Change Analysis Printout
Box Plot or Histogram
Summary ofGlobal Indices
Linear Regression

7-12 STATPAC ANALYSIS & PRINTING RESULTS
REV. A 10/98 PN 47653-1 HUMPHREY FIELD ANALYZER II
In cases where the patient is suffering from a cataract, the visual field is depressed more orless evenly. The only change from test to test and from the normal box plot is a generaldepression over time. Therefore, the shape of the box plot remains fairly normal, but thewhole symbol is moved downward on the graph.
A visual field with a deep scotoma covering a small number of points will result in a box plot inwhich the box is more or less normal and there is a long tail. When a scotoma deepens overtime, the length of the tail increases.
If the scotoma enlarges to involve more than 15% of the points tested, the lower limit of thebox will be further depressed, and depending on the extent and gravity of the field loss, theboxes may be very elongated.
The box plot section of the Change Analysis printout gives the dates of the tests included in theanalyses. Change Analysis is available for the 24-2 and 30-2, as well as combinations of 24-2and 30-2 tests, but not for the 10-2 pattern. If 24-2 and 30-2 tests are mixed in the ChangeAnalysis printout, global indices are calculated only on the 24-2 portion of the 30-2 testresults.
Change analysis The lower half of the Change Analysis printout displays summaries of the global indices MDsummary of global indices (Mean Deviation), PSD (Pattern Standard Deviation), SF (Short-term Fluctuation), and
CPSD (Corrected Pattern Standard Deviation) for the tests shown in the box plot.
The summary results are presented chronologically and in the same order as in the box plots.Thus, test dates may be taken from the box plot.
To facilitate interpretation, the p < 5% and p < 1% limits for the normal population are shownas dashed reference lines. If, for example, the symbol indicating a test appears above the 5%line, the index value on the test is not significant at the 5% level. If it falls below the 5% line,the index value is significant at the 5% level. Similarly, if the symbol falls below the 1% line, theindex value is significant at the 1% level; that is, less than 1% of the normal population has anindex value as large as or larger than that found in the test.
Linear regression If five or more fields are analyzed on a Change Analysis printout, and all test results to beanalyzed were run with the same strategy, STATPAC will automatically perform a linear regres-sion analysis of mean deviation (MD). One of two messages, MD SLOPE NOT SIGNIFICANT orMD SLOPE SIGNIFICANT, will be printed below the MD plot when a linear regression analysishas been performed. The calculated slope of MD in decibels per year and a tolerance for thatslope, expressed as a p value, will also be printed.
A “significant” message means that it is likely that mean deviation has changed in the directionof the estimated slope, and the lower the “p” value, the more likely it is. However, it remainsfor the clinician to establish whether this indication on the test results is caused by progressivefield loss or by other factors.
STATPAC ANALYSIS & PRINTING RESULTS 7-13
REV. A 10/98 PN 47653-1 HUMPHREY FIELD ANALYZER II
A linear regression analysis tests the hypothesis that a slope is zero; that is, that there havebeen no changes in the patient’s visual field. If this hypothesis is rejected after analysis at the p> 5% level, the slope is said to be significant and the analysis continues at the 1% and 0.1%levels of significance. The result is then displayed as being significant at p < 5%, p < 1%, orp < 0.1%.
Not only the significance level but also the magnitude of the slope is important. If, for example,the MD slope is -3.6 dB per year, plus or minus 0.9, this means that there is a 95% confidencelevel that the slope is between -2.7 and -4.5 dB per year. The slope is significant at a “p” levelof less than 1%. This is a slope magnitude on the order of more than thirty times the rate ofchange due to aging in the normal population. A slope of only one or two tenths of a decibelper year would be viewed with considerably less concern, as it is similar in magnitude to theage correction which has already been applied to the data.
If the hypothesis that the slope is zero, that is, that there has been no change in the patient’svisual field, is not rejected, the message NOT SIGNIFICANT appears and STATPAC show a “p”value of p > 5%. This indicates that the slope was not significant at the largest “p” valueSTATPAC is programmed to consider, 5%.
The larger the number of tests analyzed, the more easily the small changes in MD are detected.A low number of observations involves a higher risk that the analysis will fail to detect adeterioration over time. This is the reason that STATPAC will not perform an analysis on fewerthan five test results.
The application of the linear regression analysis means that the following assumptions havebeen made:
1. The true MD changes linearly with time.2. The differences between the measured and the true MD are independent, and
identically and normally distributed.
Note: For the Change Analysis printout, you can mix tests done using the FastPac strategywith those using Full Threshold. Because some of the STATPAC limits are slightly differentdepending on whether FastPac was used or not, the significance lines for plotting PSD, SF,and CPSD will not be on the printout if you are analyzing a series of FastPac and non-FastPac tests. Significance lines, however, will be displayed for Mean Deviation. When SITA
tests are included, the normal box plot is not displayed for comparison (see Figure 7.6).
The Change Analysis program will also perform a regression analysis of mean deviation overtime when a series of tests using mixed strategies are used. When strategies are mixed, aminimum of six test results are required for regression analysis; when all tests have used thesame test strategy, only five results are required. When tests are mixed with SITA results, or SITA-Standard or SITA-Fast are mixed with each other, no linear regression will be performed.Mixture of strategies is not recommended, however, as the relationship of results acrossstrategies is complex and difficult to quantify.
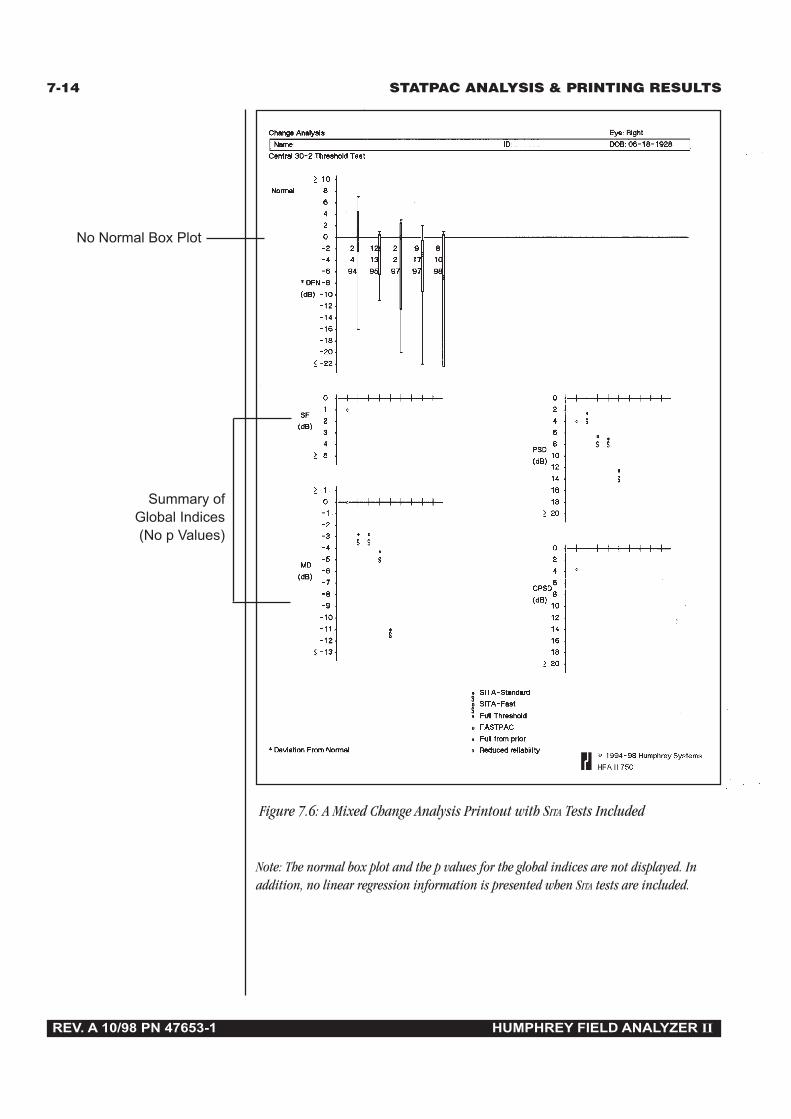
7-14 STATPAC ANALYSIS & PRINTING RESULTS
REV. A 10/98 PN 47653-1 HUMPHREY FIELD ANALYZER II
Figure 7.6: A Mixed Change Analysis Printout with SITA Tests Included
Note: The normal box plot and the p values for the global indices are not displayed. Inaddition, no linear regression information is presented when SITA tests are included.
No Normal Box Plot
Summary ofGlobal Indices(No p Values)

STATPAC ANALYSIS & PRINTING RESULTS 7-15
REV. A 10/98 PN 47653-1 HUMPHREY FIELD ANALYZER II
The glaucoma change The Glaucoma Change Probability Analysis is designed to facilitate interpretation of Centralprobability analysis 30-2 and 24-2 threshold test results in patients with suspect or manifest glaucoma. Itprintout is intended to allow maximum use of available test results. This analysis is particularly
useful in determining change over time, that is, in separating random variation from truechange.
The Glaucoma Change Probability Analysis works from baseline data for the individual patientto create change probability maps and to calculate significance limits for measured changes inmean deviation. Because the global indices (MD, SF, PSD, and CPSD) are not necessarilysensitive to important localized changes, the Glaucoma Change Probability Analysis offerspoint-by-point significance limits. This allows analysis of smaller areas of the visible field defectand enables early detection of change.
The Glaucoma Change Probability plots identify those locations in the visual field which havechanged by more than what would be expected simply due to normal variability. The signifi-cance limits for this analysis were obtained by testing a large group of glaucoma patients fourtimes in the course of a month. Normal variability in these patients was found to depend on thedepth of the original defect at baseline, the location in the visual field, and the overall MeanDeviation of the visual field. Points changing from baseline by more than the empiricalsignificance limits are highlighted with small triangles.
In general, the Glaucoma Change Probability Analysis will use the average of the first twoselected tests as a baseline and all subsequent tests as follow-up. There are two exceptions:
1. If only two tests are selected, the first will be used as the baseline and the second asfollow-up.
2. If the mean deviation of the first test falls significantly below the regression line ofthose of the other tests (p < 5%), and five or more tests are to be analyzed, STATPACwill discard the first test, use the second and third tests to calculate the patient’sbaseline, and analyze the subsequent tests as follow-up tests.
Note: Baseline tests should be representative of the actual baseline status of the patient.Baselines established from tests in which the patient was obviously inattentive,inexperienced, or too eager to press the response button can lead to false positive or falsenegative conclusions upon follow-up. Create a new pair of baseline tests if significantchange has occurred (cataract surgery, for example).
The Glaucoma Change Probability Analysis was designed to allow comparison of a series offollow-up tests with the baseline findings in order to detect and confirm changes in the visualfield. Prudence requires that changes detected in one follow-up test be confirmed in at leastone additional test before medical therapy is significantly changed or surgery is ordered.
The glaucoma change probability printout (Figure 7.7 and 7.8) includes the patient informa-tion that appears on other STATPAC printouts. Two data presentations (graytone and totaldeviation plot) for the baseline tests are printed on the upper left section of the printout.A plot of the Mean Deviation (MD) for each test plus the linear regression analysis of meandeviation, which is discussed below, occupy the upper right section of the printout. The firstcolumn on the left of the printout contains the graytone presentation of test results. The totaldeviation plot appears in the second column. These are the only two data presentations given

7-16 STATPAC ANALYSIS & PRINTING RESULTS
REV. A 10/98 PN 47653-1 HUMPHREY FIELD ANALYZER II
for the two baseline tests. Just above them is printed a message indicating whether the resultsof the glaucoma hemifield test (GHT) were within normal limits, outside normal limits, orborderline. The mean deviation from normal for this test is printed between the graytone andthe total deviation plot.
For each of up to fourteen (14) follow-up tests there are two more test result analyses: thechange from baseline plot (third column), and its associated probability map (fourth col-umn). The change from baseline plot in the third column subtracts the follow-up test resultfrom the baseline and indicates changes at each tested point in dB notation. If, for example, apoint is indicated with -6, this means that the tested point was 6 dB lower than the baseline forthe same point. A zero (0) means no change from baseline. All results use age-correctedvalues over the follow-up period.
The change probability map The change probability map in the fourth column gives the statistical significance of thedecibel changes shown in the change from baseline plot. It compares the changesbetween the baseline and follow-up fields to the inter-test variability typical of stable glaucomapatients and then shows a plot of point locations which have changed significantly. A solidtriangle identifies a degree of deterioration found less than 5% of the time at that location inmedically stable glaucoma patients, that is, deterioration significant at the 5% level. An opentriangle identifies improvement significant at the 5% level. Points not changing by a significantamount are indicated by a single, solid dot.
An X signifies that the program was unable to determine whether the encountered change wassignificant or not. This occurs mainly with deepening field defects which were already quitedeep at baseline. The finite amount of empirical data available to us and the practical limitationof the maximum attainable brightness of the instrument made it difficult to obtain exactsignificance limits for deterioration in points which are already highly depressed.
The very same reasons, finite amount of data and limits to the maximum brightness, also makeit difficult to determine change with certainty in fields where the mean deviation from normalexceeds -15. In addition, variability is extremely large in highly disturbed fields (MD < -15).Since variability increases with increasing MD in this range, STATPAC analysis can only verifystability, not deterioration or improvement. STATPAC printouts carry the message AVERAGEMEAN DEVIATION OF ALL TESTS TOO LOW when the average MD of baseline and follow-uptests is lower than -15.
Change in mean STATPAC also evaluates the significance of change in mean deviation over time. The objectivedeviation is to highlight those clinical cases where the MD changes by more than is typically observed
in stable glaucoma patients. The amount of change in decibels is printed under the messageMD Change. If the MD change is significant at the 10%, 5%, or 2.5% level, that p value isprinted along with a solid triangle to indicate degradation or an open triangle to indicateimprovement. If the amount of change is not judged to be significant, the words “Not Signifi-cant” follow the decibel value.

STATPAC ANALYSIS & PRINTING RESULTS 7-17
REV. A 10/98 PN 47653-1 HUMPHREY FIELD ANALYZER II
Figure 7.7: The Glaucoma Change Probability - Baseline
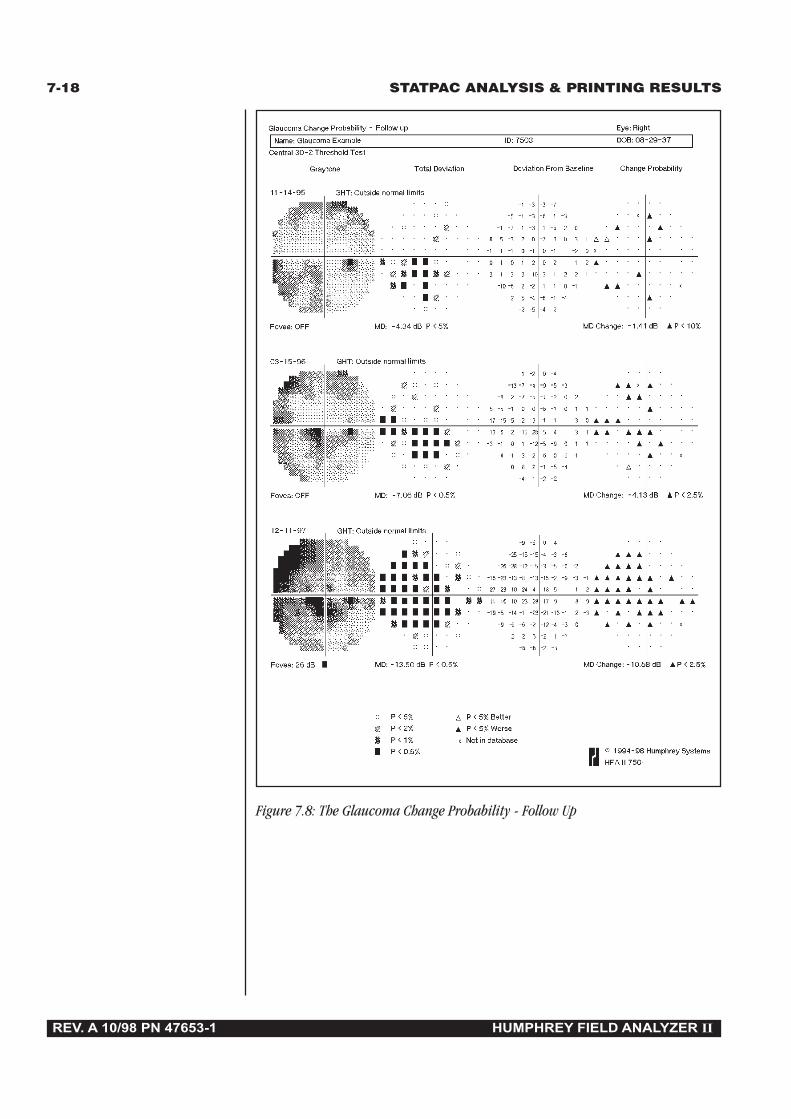
7-18 STATPAC ANALYSIS & PRINTING RESULTS
REV. A 10/98 PN 47653-1 HUMPHREY FIELD ANALYZER II
Figure 7.8: The Glaucoma Change Probability - Follow Up
STATPAC ANALYSIS & PRINTING RESULTS 7-19
REV. A 10/98 PN 47653-1 HUMPHREY FIELD ANALYZER II
Modified linear The STATPAC linear regression of mean deviation, accompanied by the message “MD Sloperegression analysis Significant” or “Not Significant” appears on the Glaucoma Change Probability Analysis
printout as well as the Change Analysis.
STATPAC modifies this regression analysis whenever marked learning effects are present. Whenat least five tests are chosen for analysis, the modified STATPAC regression analysis discards thefirst test result in a series if its mean deviation is significantly out of line with and worse thanthe trend shown in later tests (p < 5%). If the modified method is used, the value shown islabeled Modified MD Slope.
When STATPAC determines that a first test result should be omitted from its calculations tocorrect for learning effects, it also automatically discards this test result from the calculation ofthe probability plots.
On statistics and When considering the probability statements in this statistical package, it is important to beprobability conscious of what they do and do not mean. They are an aid to interpretation, not a diagnosis.
The doctor’s judgement is still the most important element in determining the clinicalsignificance of perimetric findings.
The probability statements are based on the distribution seen in the normal population. Sayingthat less than 5% of the normal population deviates from the norm by a certain amount meansjust that and not more. It does not mean that there is only a 5% chance that the result isnormal.
The positive predictive rate depends, of course, on the prevalence of defective fields in thepopulation studied. The probability that a given result is abnormal depends on the relativeprevalence in the population of defects caused by disease versus the prevalence of the samefield “defect” in normals. If a certain field result is seen 5% of the time in normals, and similarglaucomatous field defects are seen in 0.5% of the population, then the result is ten times aslikely to be associated with normality as with disease.
Certainly one should also be aware that some patients commonly seen in a clinical practicemay not meet the criteria of normality (for example, visual acuity) which had to be applied increating a normals data base. These patients may fall outside normal limits established in thisstatistical package for reasons other than field loss, such as cataracts.
A note of caution Rules of common sense must be applied when using STATPAC. This statistical packagerepresents an attempt to aid the practitioner in making medical decisions. There will besituations where it will not give the proper analysis either because of its own limitations orbecause it was applied to inappropriate data. Obviously, the practitioner must bear the ultimateresponsibility for all decisions and must use STATPAC with its limitations in mind. In cases ofuncertainty, consultation with sub-specialists is often the prudent course.
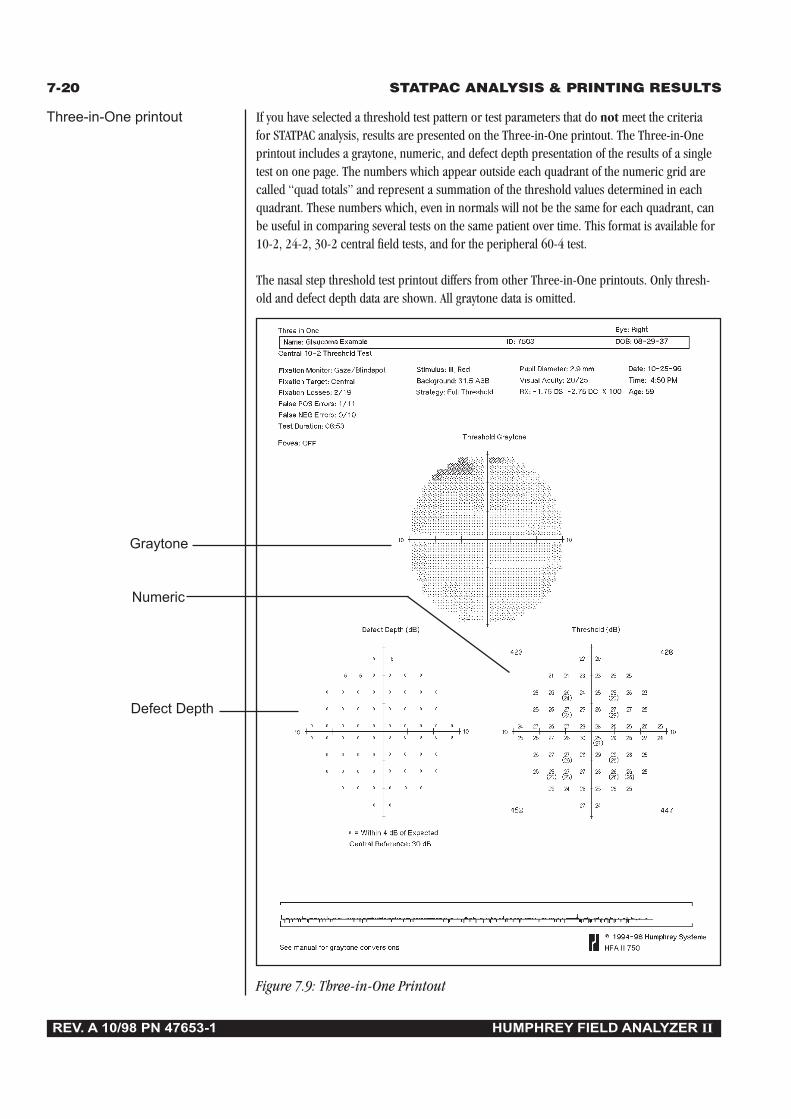
7-20 STATPAC ANALYSIS & PRINTING RESULTS
REV. A 10/98 PN 47653-1 HUMPHREY FIELD ANALYZER II
Three-in-One printout If you have selected a threshold test pattern or test parameters that do not meet the criteriafor STATPAC analysis, results are presented on the Three-in-One printout. The Three-in-Oneprintout includes a graytone, numeric, and defect depth presentation of the results of a singletest on one page. The numbers which appear outside each quadrant of the numeric grid arecalled “quad totals” and represent a summation of the threshold values determined in eachquadrant. These numbers which, even in normals will not be the same for each quadrant, canbe useful in comparing several tests on the same patient over time. This format is available for10-2, 24-2, 30-2 central field tests, and for the peripheral 60-4 test.
The nasal step threshold test printout differs from other Three-in-One printouts. Only thresh-old and defect depth data are shown. All graytone data is omitted.
Figure 7.9: Three-in-One Printout
Graytone
Numeric
Defect Depth
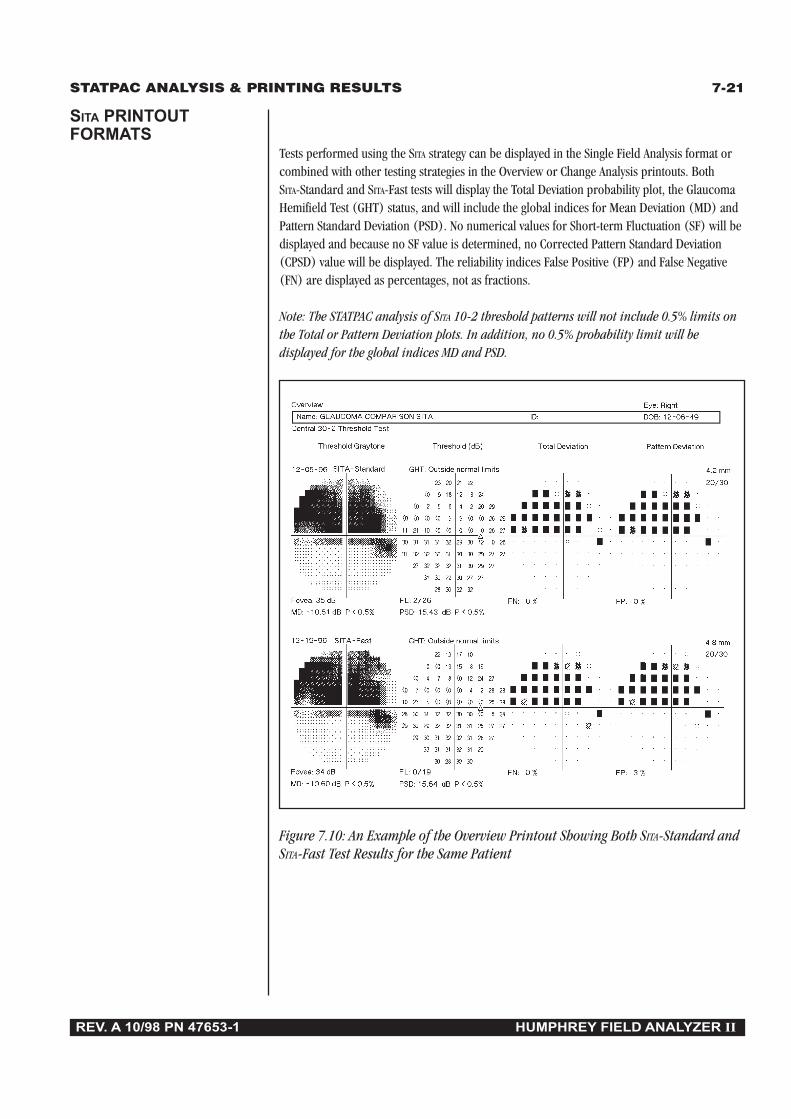
STATPAC ANALYSIS & PRINTING RESULTS 7-21
REV. A 10/98 PN 47653-1 HUMPHREY FIELD ANALYZER II
Tests performed using the SITA strategy can be displayed in the Single Field Analysis format orcombined with other testing strategies in the Overview or Change Analysis printouts. BothSITA-Standard and SITA-Fast tests will display the Total Deviation probability plot, the GlaucomaHemifield Test (GHT) status, and will include the global indices for Mean Deviation (MD) andPattern Standard Deviation (PSD). No numerical values for Short-term Fluctuation (SF) will bedisplayed and because no SF value is determined, no Corrected Pattern Standard Deviation(CPSD) value will be displayed. The reliability indices False Positive (FP) and False Negative(FN) are displayed as percentages, not as fractions.
Note: The STATPAC analysis of SITA 10-2 threshold patterns will not include 0.5% limits onthe Total or Pattern Deviation plots. In addition, no 0.5% probability limit will bedisplayed for the global indices MD and PSD.
SITA PRINTOUTFORMATS
Figure 7.10: An Example of the Overview Printout Showing Both SITA-Standard andSITA-Fast Test Results for the Same Patient

7-22 STATPAC ANALYSIS & PRINTING RESULTS
REV. A 10/98 PN 47653-1 HUMPHREY FIELD ANALYZER II
Figure 7.11: An Example of a Single Field Analysis Printout for SITA

STATPAC ANALYSIS & PRINTING RESULTS 7-23
REV. A 10/98 PN 47653-1 HUMPHREY FIELD ANALYZER II
BLUE-YELLOWPRINTOUT FORMATS
Blue-Yellow printouts use the same grayscale as White-on-White testing. The grayscale will looksignificantly darker with Blue-Yellow testing in most cases. This is because Blue-Yellow testingnormally generates lower threshold values than does White-on-White testing. It is particularlyimportant to pay most attention to the STATPAC probability plots rather than the traditionalgrayscale. If interpreted using standard White-on-White perimetry rules, the grayscale may leadto misinterpretation of test results.
Single field analysis printout The Single Field Analysis printout is modified slightly with STATPAC for Blue-Yellow. A boxoutlines the global indices and the words “BLUE-YELLOW” in the lower right portion of theprintout. This helps to differentiate it from the White-on-White Single Field Analysis printout(see Figure 7.12).
Figure 7.12: The Single Field Analysis Printout for Blue-Yellow (SWAP)
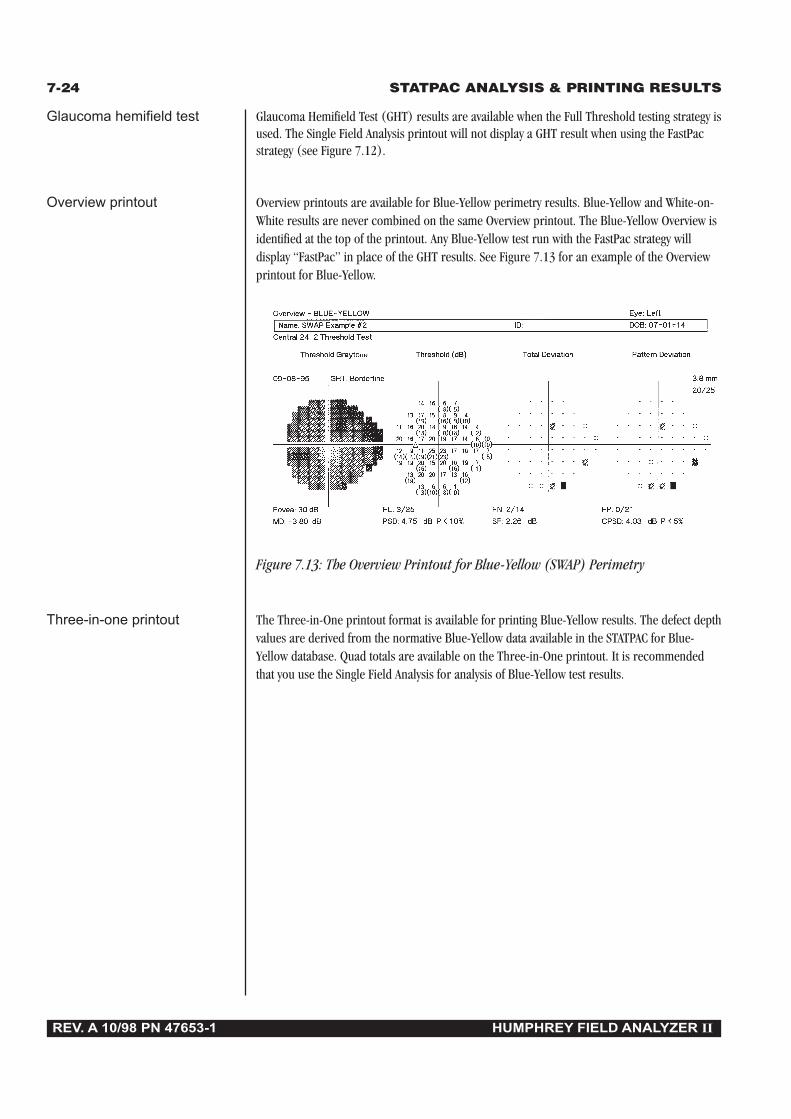
7-24 STATPAC ANALYSIS & PRINTING RESULTS
REV. A 10/98 PN 47653-1 HUMPHREY FIELD ANALYZER II
Glaucoma hemifield test Glaucoma Hemifield Test (GHT) results are available when the Full Threshold testing strategy isused. The Single Field Analysis printout will not display a GHT result when using the FastPacstrategy (see Figure 7.12).
Overview printout Overview printouts are available for Blue-Yellow perimetry results. Blue-Yellow and White-on-White results are never combined on the same Overview printout. The Blue-Yellow Overview isidentified at the top of the printout. Any Blue-Yellow test run with the FastPac strategy willdisplay “FastPac” in place of the GHT results. See Figure 7.13 for an example of the Overviewprintout for Blue-Yellow.
Figure 7.13: The Overview Printout for Blue-Yellow (SWAP) Perimetry
Three-in-one printout The Three-in-One printout format is available for printing Blue-Yellow results. The defect depthvalues are derived from the normative Blue-Yellow data available in the STATPAC for Blue-Yellow database. Quad totals are available on the Three-in-One printout. It is recommendedthat you use the Single Field Analysis for analysis of Blue-Yellow test results.

STATPAC ANALYSIS & PRINTING RESULTS 7-25
REV. A 10/98 PN 47653-1 HUMPHREY FIELD ANALYZER II
At the end of a threshold test, you can print the results in any or all of the STATPAC formats thatapply to your test parameters, as well as in the Three-in-One format.
To print results, select the PRINT FUNCTIONS icon. The printout selection menu will appearwith print options. If both eyes have just been tested, it is possible to choose different printoutsfor right and left eye; the selections need not be the same for both.
If STATPAC criteria have beenmet, the print menu willdisplay with Single FieldAnalysis highlighted. Foradditional formats, touch thebox next to the desiredselection. An “X” appearswithin the box of all selectedprintouts. Touching the box asecond time clears yourselection.
When you have made your printout selection(s), choose PRINT ALL SELECTED ITEMS. Theinformation has now been sent to the printer; you can proceed with your next commandimmediately. To leave the Printout Selection screen without printing, press the UNDO icon.
To print a single field 1. Make sure the patient’s name and date of birth are entered correctly, then save theanalysis of current test results on disk.results 2. From the Test Complete screen, select the PRINT FUNCTIONS icon. This takes you to
the Printout Selection screen where Single Field Analysis is highlighted.3. Choose PRINT ALL SELECTED ITEMS.
To print an overview, change 1. Make sure the patient’s name and date of birth are entered correctly, then save theanalysis, or glaucoma change results on disk.probability of current test 2. From the Test Complete screen, select the PRINT FUNCTIONS icon. This takes you toresults the printout selection menu where Single Field Analysis is highlighted.
3. De-select Single Field Analysis if you do not want it to print. Select either Overview,Change Analysis, Glaucoma Change Probability Analysis, or all three.
4. Choose PRINT ALL SELECTED ITEMS.5. The HFA II displays all the files on the current disk that match the patient’s name and date
of birth. If there are more than sixteen such files, the most recent sixteen, including thetest results you just saved, will be highlighted on the screen.
6. Deselect those files you do not want to be included in the printout, then choose PROCEED.
PRINTING CURRENTTHRESHOLD TESTRESULTS
7-26 STATPAC ANALYSIS & PRINTING RESULTS
REV. A 10/98 PN 47653-1 HUMPHREY FIELD ANALYZER II
SCREENINGPRINTOUTFORMATS
It is the test strategy used in each screening test that determines the format of the printed testresults (see Table 7.3).
Table 7.3: Screening Printout Formats: All Screening Test Patterns
Strategy Format Description
Two Zone Points seen OPoints missed ■
Three Zone Points seen ORelative defect XAbsolute defect ■
Quantify Defects Points seen ONumbers (in dB) show depth of defect
When you have tested both the right and left eyes for the same patient, you have the option ofprinting a single screening test per page (referred to as “Screening Test” on printout selectionmenu), or a combination of the right and left eye on one page (referred to as “Both Eyes”). Toobtain the screening printout for both eyes, screening tests may be central or peripheral butnot full field patterns (see Example 7.14). The printout of both eyes is also known as the“O. U. Printout”.
The Quantify Defects Full Field screening test is printed on two pages. The first page consists ofthe Full Field printout. The second page is an enhanced view of the Central 30 degrees,allowing for easier reading of the central portion of the printout. If there are no defectsquantified in the Central 30 degrees, the printout will only be one page long. The printout willbe in the full field format.
Reading screening test The type of test and test parameters are printed at the top of the printout along with the patientprintouts data, test date and test time. Like threshold test printouts, screening printouts include reliability
indices to help you determine the reliability of the patient’s responses.
When a screening test uses the Threshold Related testing mode, the central (and peripheral)reference level values are determined from patient responses and appear on the printout andtest screen. When the Age Corrected mode is used, the central (and peripheral) referencelevels display values based on the patient’s age.
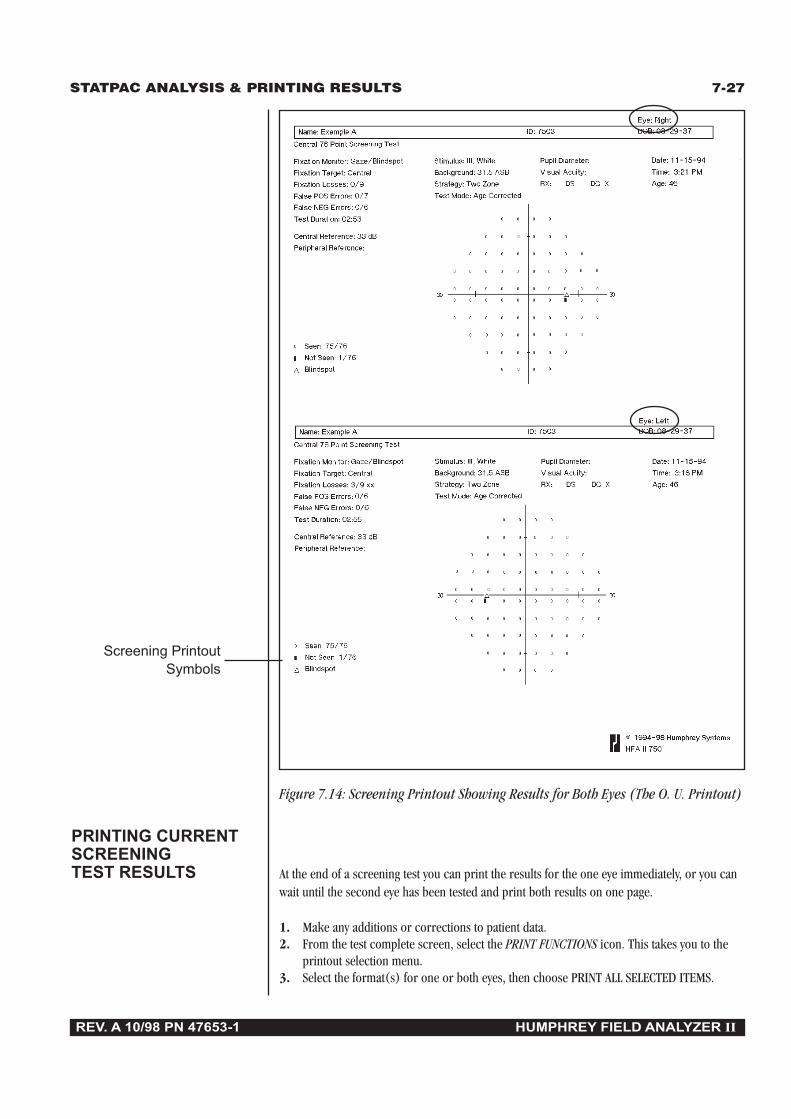
STATPAC ANALYSIS & PRINTING RESULTS 7-27
REV. A 10/98 PN 47653-1 HUMPHREY FIELD ANALYZER II
Figure 7.14: Screening Printout Showing Results for Both Eyes (The O. U. Printout)
Screening PrintoutSymbols
At the end of a screening test you can print the results for the one eye immediately, or you canwait until the second eye has been tested and print both results on one page.
1. Make any additions or corrections to patient data.2. From the test complete screen, select the PRINT FUNCTIONS icon. This takes you to the
printout selection menu.3. Select the format(s) for one or both eyes, then choose PRINT ALL SELECTED ITEMS.
PRINTING CURRENTSCREENINGTEST RESULTS
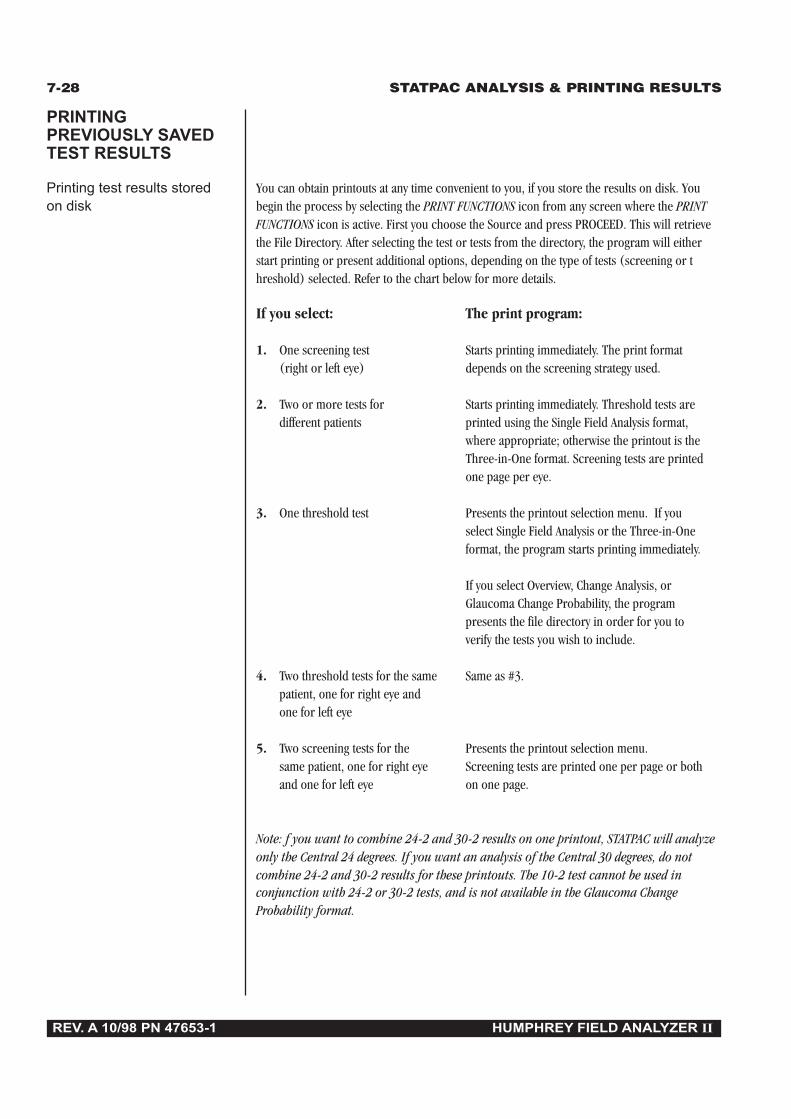
7-28 STATPAC ANALYSIS & PRINTING RESULTS
REV. A 10/98 PN 47653-1 HUMPHREY FIELD ANALYZER II
Printing test results stored You can obtain printouts at any time convenient to you, if you store the results on disk. Youon disk begin the process by selecting the PRINT FUNCTIONS icon from any screen where the PRINT
FUNCTIONS icon is active. First you choose the Source and press PROCEED. This will retrievethe File Directory. After selecting the test or tests from the directory, the program will eitherstart printing or present additional options, depending on the type of tests (screening or threshold) selected. Refer to the chart below for more details.
If you select: The print program:
1. One screening test Starts printing immediately. The print format(right or left eye) depends on the screening strategy used.
2. Two or more tests for Starts printing immediately. Threshold tests aredifferent patients printed using the Single Field Analysis format,
where appropriate; otherwise the printout is theThree-in-One format. Screening tests are printedone page per eye.
3. One threshold test Presents the printout selection menu. If youselect Single Field Analysis or the Three-in-Oneformat, the program starts printing immediately.
If you select Overview, Change Analysis, orGlaucoma Change Probability, the programpresents the file directory in order for you toverify the tests you wish to include.
4. Two threshold tests for the same Same as #3.patient, one for right eye andone for left eye
5. Two screening tests for the Presents the printout selection menu.same patient, one for right eye Screening tests are printed one per page or bothand one for left eye on one page.
Note: f you want to combine 24-2 and 30-2 results on one printout, STATPAC will analyzeonly the Central 24 degrees. If you want an analysis of the Central 30 degrees, do notcombine 24-2 and 30-2 results for these printouts. The 10-2 test cannot be used inconjunction with 24-2 or 30-2 tests, and is not available in the Glaucoma ChangeProbability format.
PRINTINGPREVIOUSLY SAVEDTEST RESULTS

STATPAC ANALYSIS & PRINTING RESULTS 7-29
REV. A 10/98 PN 47653-1 HUMPHREY FIELD ANALYZER II
Printing from recall last test The HFA II holds in temporary memory the last right eye and left eye tested (they neednot be for the same patient) until the instrument is powered off, at which time the memoryis cleared.
1. From the Main Menu screen, select RECALL LAST TEST.2. Select the test eye (right or left) to proceed, or CANCEL.3. Follow the instructions outlined above for printing current test results.
Printing from view test You can print any file you have retrieved through the View Test feature.
1. From the Main Menu screen, select the FILE FUNCTIONS icon.2. Select VIEW TEST.3. Designate the Source and Directory Order, then press PROCEED.4. Select the test you want to retrieve.5. Choose PROCEED to display the test results.6. Follow the instructions outlined previously for printing current test results.
Printing delay Whenever the File Directory Box is open (see example), printing will not occur.
If you have already started a printing function, and a File Directory box is on the screen, finishyour selection or press the MAIN MENU icon in order to allow printing to continue.

7-30 STATPAC ANALYSIS & PRINTING RESULTS
REV. A 10/98 PN 47653-1 HUMPHREY FIELD ANALYZER II
GRAYSCALESYMBOLS
The grayscale representation of the patient’s visual field provides an immediate idea of the sizeand depth of any field defects present. Each variation of the pattern corresponds to a 5 dBchange in sensitivity. The comparative scale below (Table 7.4) shows the ten (10) grayscalepatterns and relates them to decibels and apostilbs. An explanation of the relationship betweenthese units of measurement along with conversion tables can be found in the Appendix.
Note: Blue-Yellow printouts use the same relationship between grayscale symbol anddecibel values as White-on-White testing. The grayscale will look significantly darker withBlue-Yellow testing in most cases. This is because Blue-Yellow testing normally generateslower threshold values than does White-on-White testing. Note that the maximal (0 dB)stimulus in Blue-Yellow testing is 6 foot-lamberts, not 10,000 apostilbs.
Table 7.4: The Grayscale Shades Found on HFA II Printouts and Their NumericalEquivalents in Apostilbs (ASB) and Decibels (dB).
REMOTE PRINTERACCESS
It is possible to link the HFA II to a compatible printer without using cables. The same printercan be shared with other devices or computers in your office. One system, known as GoPrint™,allows HFA II owners to communicate to any HFA II-compatible printer within a certaindistance, regardless of whether or not the instrument and the printer are in the same room.One “Computer-GoPrint” device is connected to the HFA II, while a second “Printer-GoPrint”device is connected to your printer. GoPrint is produced by the AeroComm company. Checkyour computer or electronics store for details and availability of a GoPrint system.
Perform the following steps to set up a GoPrint system:
1. Insert the connector cable of the Computer-GoPrint into the parallel printer port onthe back of the HFA II.
2. Insert the connector cable of the Printer-GoPrint into the printer port of your printer.3. Plug in both GoPrint power supplies.4. Turn on both the HFA II and the printer.5. Make sure that the appropriate printer type (e.g. Printrex, LaserJet) is designated on
your HFA II under PRINTER on the System Setup screen.

REV. A 10/98 PN 47653-1 HUMPHREY FIELD ANALYZER II
File Functions 8File Functions Menu 8-2
Retrieving the File Directory 8-4
Selecting Tests from the Directory 8-6
Performing File Functions 8-11
External 5.25" Floppy Disk Drive 8-18
Organizing Patient Files 8-22
At the end of every test you have the opportunity to save the test data. When you elect to save,the test results and associated patient data are stored with all previously stored tests on either
an internal hard disk, a removable floppy disk, or both. This packet of storedinformation is called a file, and for each right eye and each left eyetested there is a separate file.
Once saved, tests can be retrieved, edited, copied, moved to anotherstorage medium, or deleted. These activities are part of the FileFunctions menu. The entire collection of tests on a hard disk or floppy
disk is referred to as a database. It is absolutely essential to makebackup copies of all of your databases regularly in case they become
lost or damaged.
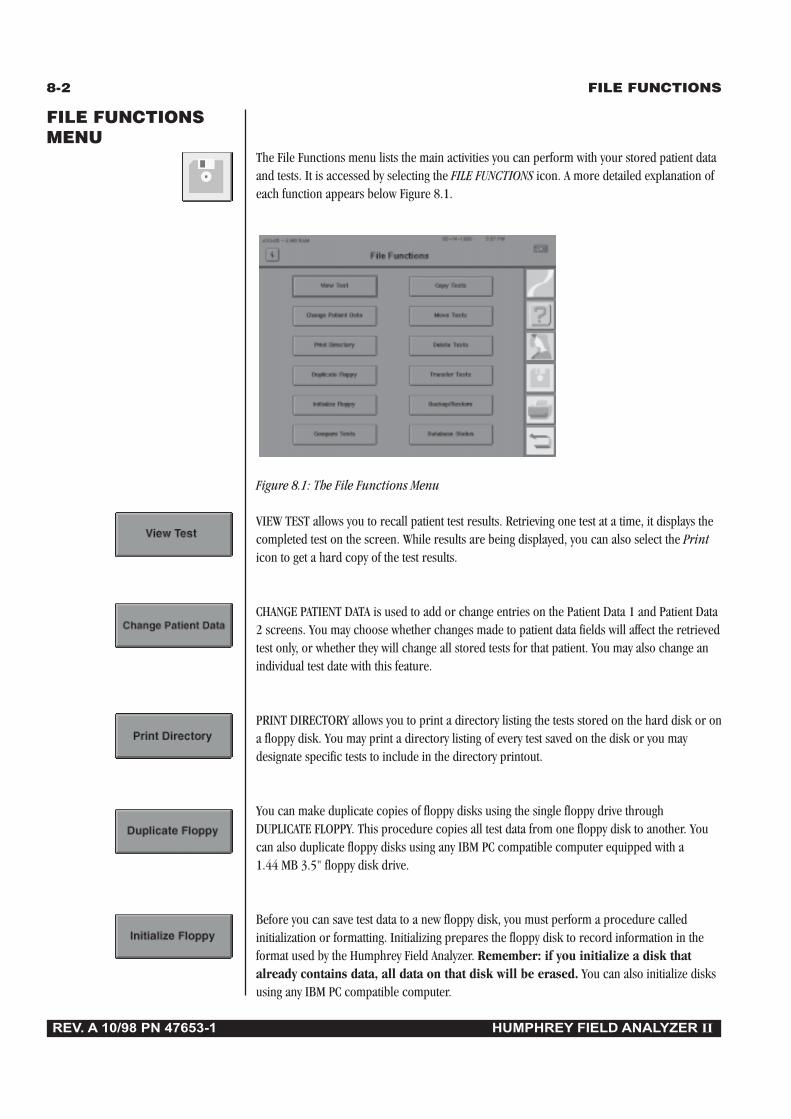
8-2 FILE FUNCTIONS
REV. A 10/98 PN 47653-1 HUMPHREY FIELD ANALYZER II
FILE FUNCTIONSMENU
The File Functions menu lists the main activities you can perform with your stored patient dataand tests. It is accessed by selecting the FILE FUNCTIONS icon. A more detailed explanation ofeach function appears below Figure 8.1.
Figure 8.1: The File Functions Menu
VIEW TEST allows you to recall patient test results. Retrieving one test at a time, it displays thecompleted test on the screen. While results are being displayed, you can also select the Printicon to get a hard copy of the test results.
CHANGE PATIENT DATA is used to add or change entries on the Patient Data 1 and Patient Data2 screens. You may choose whether changes made to patient data fields will affect the retrievedtest only, or whether they will change all stored tests for that patient. You may also change anindividual test date with this feature.
PRINT DIRECTORY allows you to print a directory listing the tests stored on the hard disk or ona floppy disk. You may print a directory listing of every test saved on the disk or you maydesignate specific tests to include in the directory printout.
You can make duplicate copies of floppy disks using the single floppy drive throughDUPLICATE FLOPPY. This procedure copies all test data from one floppy disk to another. Youcan also duplicate floppy disks using any IBM PC compatible computer equipped with a1.44 MB 3.5" floppy disk drive.
Before you can save test data to a new floppy disk, you must perform a procedure calledinitialization or formatting. Initializing prepares the floppy disk to record information in theformat used by the Humphrey Field Analyzer. Remember: if you initialize a disk thatalready contains data, all data on that disk will be erased. You can also initialize disksusing any IBM PC compatible computer.
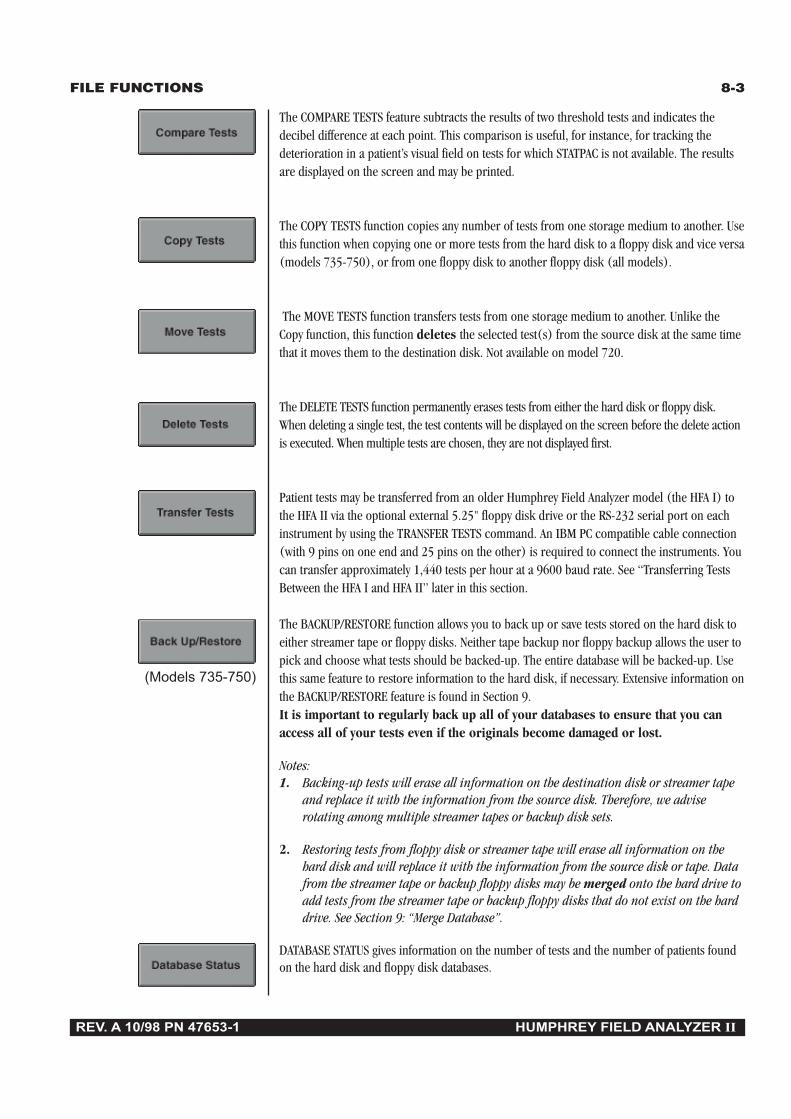
FILE FUNCTIONS 8-3
REV. A 10/98 PN 47653-1 HUMPHREY FIELD ANALYZER II
The COMPARE TESTS feature subtracts the results of two threshold tests and indicates thedecibel difference at each point. This comparison is useful, for instance, for tracking thedeterioration in a patient’s visual field on tests for which STATPAC is not available. The resultsare displayed on the screen and may be printed.
The COPY TESTS function copies any number of tests from one storage medium to another. Usethis function when copying one or more tests from the hard disk to a floppy disk and vice versa(models 735-750), or from one floppy disk to another floppy disk (all models).
The MOVE TESTS function transfers tests from one storage medium to another. Unlike theCopy function, this function deletes the selected test(s) from the source disk at the same timethat it moves them to the destination disk. Not available on model 720.
The DELETE TESTS function permanently erases tests from either the hard disk or floppy disk.When deleting a single test, the test contents will be displayed on the screen before the delete actionis executed. When multiple tests are chosen, they are not displayed first.
Patient tests may be transferred from an older Humphrey Field Analyzer model (the HFA I) tothe HFA II via the optional external 5.25" floppy disk drive or the RS-232 serial port on eachinstrument by using the TRANSFER TESTS command. An IBM PC compatible cable connection(with 9 pins on one end and 25 pins on the other) is required to connect the instruments. Youcan transfer approximately 1,440 tests per hour at a 9600 baud rate. See “Transferring TestsBetween the HFA I and HFA II” later in this section.
The BACKUP/RESTORE function allows you to back up or save tests stored on the hard disk toeither streamer tape or floppy disks. Neither tape backup nor floppy backup allows the user topick and choose what tests should be backed-up. The entire database will be backed-up. Usethis same feature to restore information to the hard disk, if necessary. Extensive information onthe BACKUP/RESTORE feature is found in Section 9.It is important to regularly back up all of your databases to ensure that you canaccess all of your tests even if the originals become damaged or lost.
Notes:1. Backing-up tests will erase all information on the destination disk or streamer tape
and replace it with the information from the source disk. Therefore, we adviserotating among multiple streamer tapes or backup disk sets.
2. Restoring tests from floppy disk or streamer tape will erase all information on thehard disk and will replace it with the information from the source disk or tape. Datafrom the streamer tape or backup floppy disks may be merged onto the hard drive toadd tests from the streamer tape or backup floppy disks that do not exist on the harddrive. See Section 9: “Merge Database”.
DATABASE STATUS gives information on the number of tests and the number of patients foundon the hard disk and floppy disk databases.
(Models 735-750)

8-4 FILE FUNCTIONS
REV. A 10/98 PN 47653-1 HUMPHREY FIELD ANALYZER II
RETRIEVING THEFILE DIRECTORY
Selecting a particular File Function is only the first step in accomplishing the task. The nextstep involves calling up the directory of tests. The directory is a list of tests contained on aspecified storage medium. It is from the directory that you select the test or tests to be includedin the particular File Function.
Disk options Before the directory is displayed you are asked to specify certain minimum criteria:
• Source• Destination (where applicable)• Directory Order
These are found on the Disk Options screen (see Figure 8.2 below).
Figure 8.2: The Disk Options Screen
Source: In order to successfully locate the desired tests, you must designate the source of thetests—the location on which they are currently stored. The primary choices are HARD DRIVEor FLOPPY. When transferring tests, HFA I SERIAL CABLE and HFA I EXTERNAL FLOPPY will alsoappear on the Source list. The choice of TAPE is available as an option with the RESTOREfunction (model 750).
Destination: The Disk Options screen includes a destination choice. Destinations include FLOPPY, HARDDRIVE and HFA I EXTERNAL FLOPPY. HFA II owners who wish to copy tests to the HFA I mustuse an optional 5.25" external floppy drive. Choosing the HFA I EXTERNAL FLOPPY as theDestination allows you to copy HFA II tests to an HFA I floppy disk. This special floppy drive isavailable through Humphrey Systems. TAPE becomes an option with BACKUP (model 750).
Note: The Source and the Destination can both be set to FLOPPY at the same time. Thisoccurs when you want to copy data from one floppy disk to another. The HFA II will alertyou to when to insert the Source disk and when to insert the Destination disk into thefloppy disk drive. Be careful not to mix up the Source and Destination floppy disks. Datacan be lost!
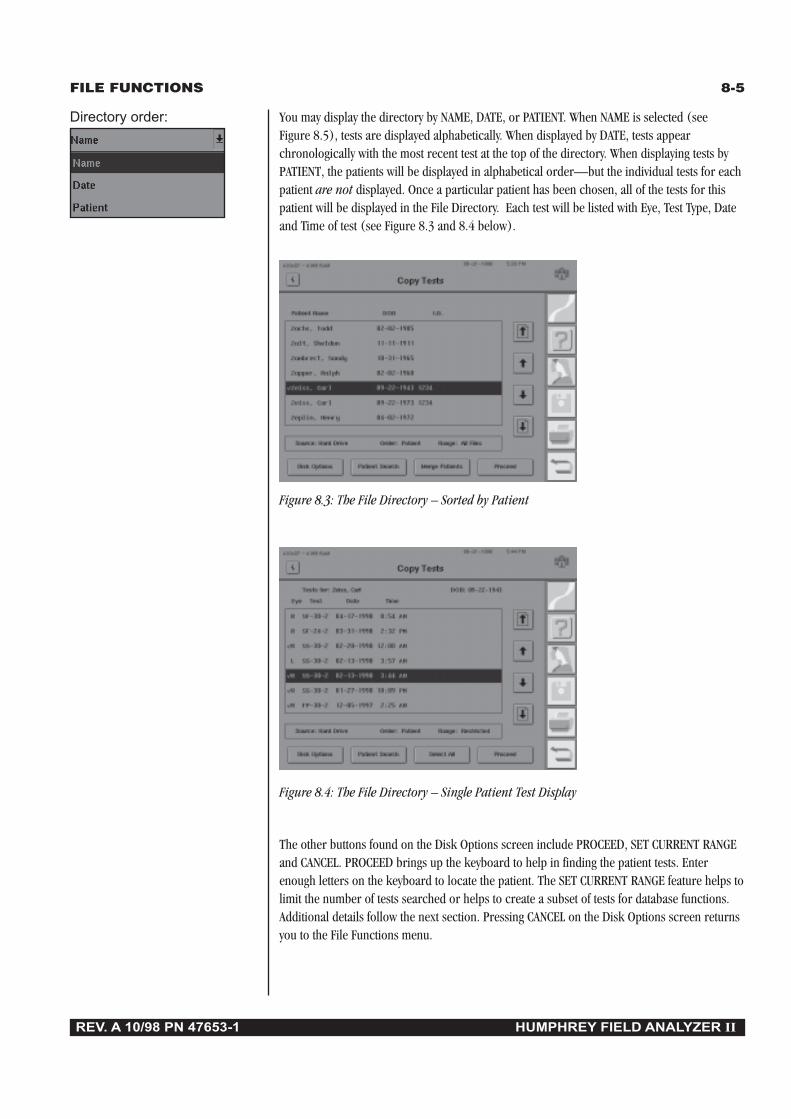
FILE FUNCTIONS 8-5
REV. A 10/98 PN 47653-1 HUMPHREY FIELD ANALYZER II
Directory order: You may display the directory by NAME, DATE, or PATIENT. When NAME is selected (seeFigure 8.5), tests are displayed alphabetically. When displayed by DATE, tests appearchronologically with the most recent test at the top of the directory. When displaying tests byPATIENT, the patients will be displayed in alphabetical order—but the individual tests for eachpatient are not displayed. Once a particular patient has been chosen, all of the tests for thispatient will be displayed in the File Directory. Each test will be listed with Eye, Test Type, Dateand Time of test (see Figure 8.3 and 8.4 below).
Figure 8.3: The File Directory – Sorted by Patient
Figure 8.4: The File Directory – Single Patient Test Display
The other buttons found on the Disk Options screen include PROCEED, SET CURRENT RANGEand CANCEL. PROCEED brings up the keyboard to help in finding the patient tests. Enterenough letters on the keyboard to locate the patient. The SET CURRENT RANGE feature helps tolimit the number of tests searched or helps to create a subset of tests for database functions.Additional details follow the next section. Pressing CANCEL on the Disk Options screen returnsyou to the File Functions menu.
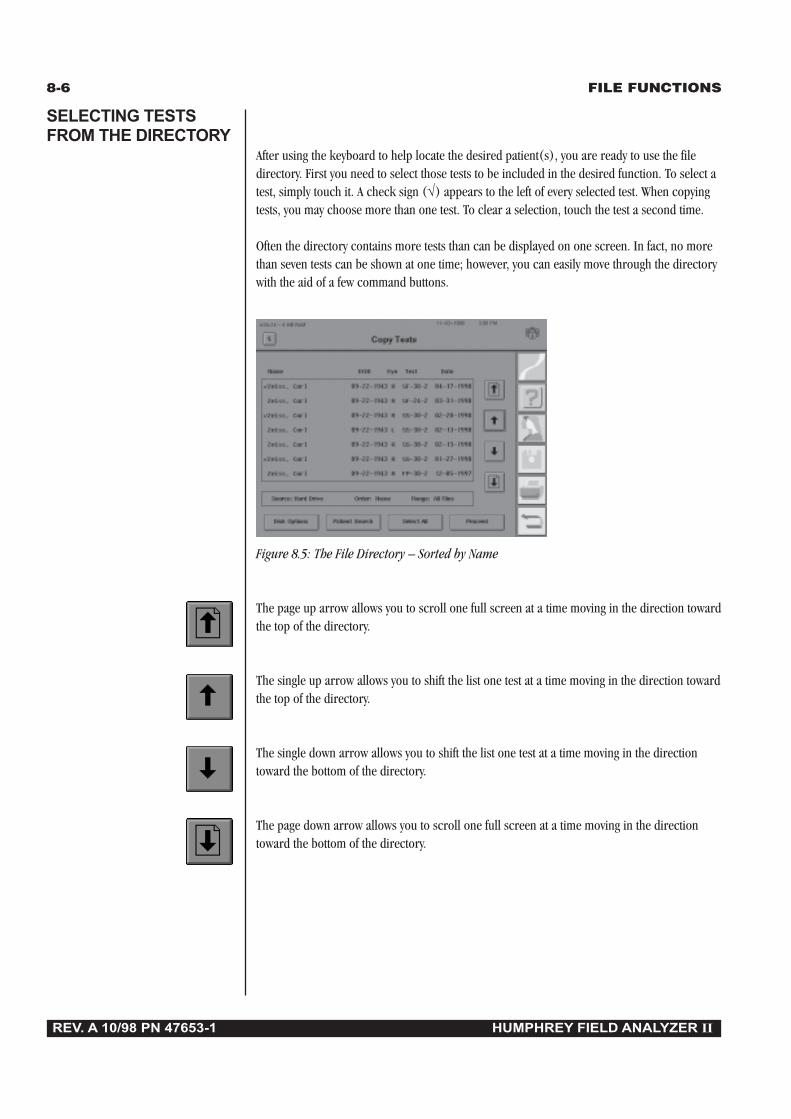
8-6 FILE FUNCTIONS
REV. A 10/98 PN 47653-1 HUMPHREY FIELD ANALYZER II
SELECTING TESTSFROM THE DIRECTORY
After using the keyboard to help locate the desired patient(s), you are ready to use the filedirectory. First you need to select those tests to be included in the desired function. To select atest, simply touch it. A check sign (√) appears to the left of every selected test. When copyingtests, you may choose more than one test. To clear a selection, touch the test a second time.
Often the directory contains more tests than can be displayed on one screen. In fact, no morethan seven tests can be shown at one time; however, you can easily move through the directorywith the aid of a few command buttons.
Figure 8.5: The File Directory – Sorted by Name
The page up arrow allows you to scroll one full screen at a time moving in the direction towardthe top of the directory.
The single up arrow allows you to shift the list one test at a time moving in the direction towardthe top of the directory.
The single down arrow allows you to shift the list one test at a time moving in the directiontoward the bottom of the directory.
The page down arrow allows you to scroll one full screen at a time moving in the directiontoward the bottom of the directory.

FILE FUNCTIONS 8-7
REV. A 10/98 PN 47653-1 HUMPHREY FIELD ANALYZER II
There are a number of buttons at the bottom of the File Directory screen which help to simplifythe search for the desired patient tests.
To review or change the search criteria as designated on the Disk Options screen, select DISKOPTIONS. See “Disk Options” and Figure 8.2.
When the directory order is set to Name or Patient (alphabetical searches), PATIENT SEARCHallows you to quickly locate a specific test within the directory by entering a name on the pop-up keyboard. When the directory order is set to Date, PATIENT SEARCH is replaced with DATESEARCH and you use the keypad to enter the desired date. In both cases, the search is limitedto only those tests meeting the search criteria in Disk Options.
SELECT ALL selects and puts a check mark (√) next to every test in the directory. The SELECTALL button changes to SELECT NONE allowing you the opportunity to deselect all tests.
Note: Pressing SELECT ALL selects all the available tests, not just the seven (7) beingviewed on the screen.
After you have selected all the tests necessary for the File Function, choose PROCEED toexecute the function. A confirmation screen will always be presented noting how many testshave been selected before any action takes place.
Abbreviations used on theFile Directory screen to identifytests strategies include:
BY Blue-Yellow
FP FastPac
SF SITA-Fast
SS SITA-Standard
OR
OR
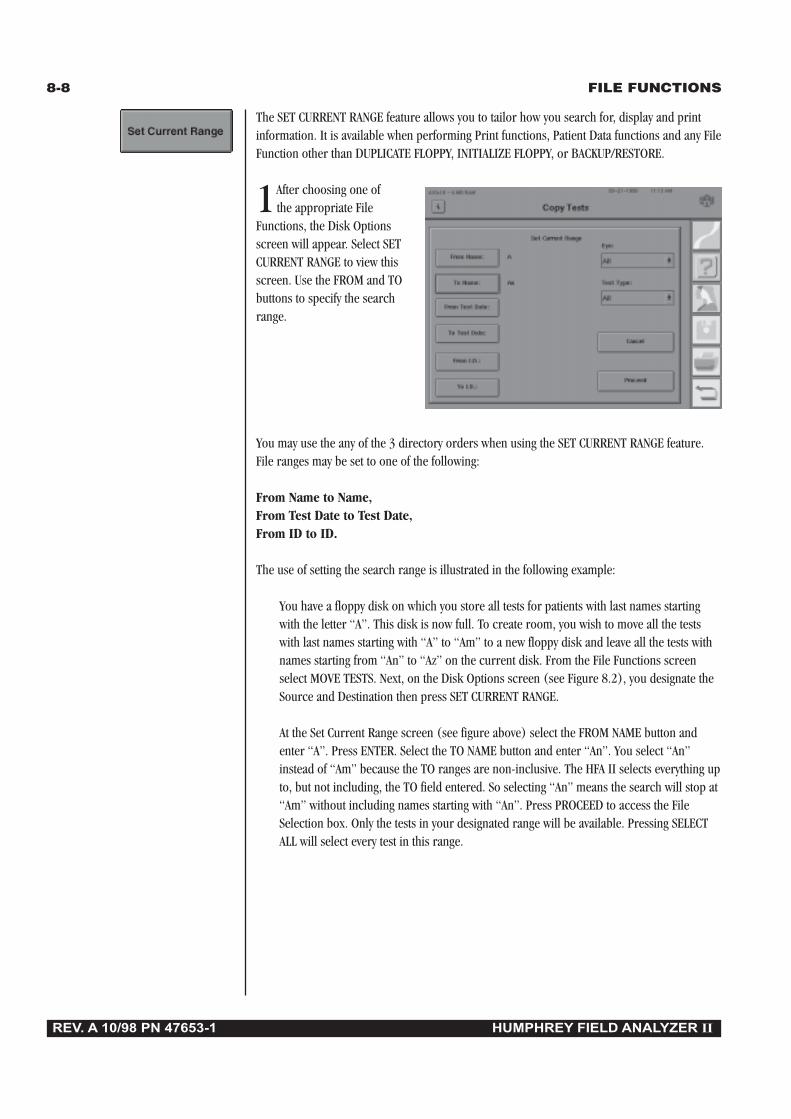
8-8 FILE FUNCTIONS
REV. A 10/98 PN 47653-1 HUMPHREY FIELD ANALYZER II
The SET CURRENT RANGE feature allows you to tailor how you search for, display and printinformation. It is available when performing Print functions, Patient Data functions and any FileFunction other than DUPLICATE FLOPPY, INITIALIZE FLOPPY, or BACKUP/RESTORE.
1After choosing one ofthe appropriate File
Functions, the Disk Optionsscreen will appear. Select SETCURRENT RANGE to view thisscreen. Use the FROM and TObuttons to specify the searchrange.
You may use the any of the 3 directory orders when using the SET CURRENT RANGE feature.File ranges may be set to one of the following:
From Name to Name,From Test Date to Test Date,From ID to ID.
The use of setting the search range is illustrated in the following example:
You have a floppy disk on which you store all tests for patients with last names startingwith the letter “A”. This disk is now full. To create room, you wish to move all the testswith last names starting with “A” to “Am” to a new floppy disk and leave all the tests withnames starting from “An” to “Az” on the current disk. From the File Functions screenselect MOVE TESTS. Next, on the Disk Options screen (see Figure 8.2), you designate theSource and Destination then press SET CURRENT RANGE.
At the Set Current Range screen (see figure above) select the FROM NAME button andenter “A”. Press ENTER. Select the TO NAME button and enter “An”. You select “An”instead of “Am” because the TO ranges are non-inclusive. The HFA II selects everything upto, but not including, the TO field entered. So selecting “An” means the search will stop at“Am” without including names starting with “An”. Press PROCEED to access the FileSelection box. Only the tests in your designated range will be available. Pressing SELECTALL will select every test in this range.

FILE FUNCTIONS 8-9
REV. A 10/98 PN 47653-1 HUMPHREY FIELD ANALYZER II
When SET CURRENT RANGE is accessed, the following choices are also available:
EYE Choose from All, Left or RightTEST TYPE Choose from All, Threshold, Screening, Kinetic, or Custom
If, for example, “Left” is chosen under EYE, only tests done on left eyes in the range you setwill be chosen. Further, if “Threshold” is chosen under TEST TYPE, then only threshold tests inthe selected range will be searched. Of course, you may select ‘Left” and “Threshold” at thesame time if you only want to search for threshold tests performed on left eyes.
2 After the desired range(s) has been specified, press PROCEED. The HFA II will nowlist on the File Directory screen only the tests matching your specified range(s) until you
complete or cancel the current operation.
The SET CURRENT RANGE feature is particularly useful if you are using alphabetical floppydisks and you fill a disk (as in the example above). By selecting a range of tests to copy ormove to a new disk, instead of selecting individual tests, you may use the SELECT ALL button andcopy or move the full range selected.

8-10 FILE FUNCTIONS
REV. A 10/98 PN 47653-1 HUMPHREY FIELD ANALYZER II
Merging patient files MERGE PATIENTS allows you to resolve any inconsistencies in how you entered the nameand date of birth for an individual patient. Slight differences in patient identification over anumber of visits can cause the HFA II to treat tests taken by the same patient as tests taken bydifferent patients. As a result, some of a patient’s tests may not be included in STATPAC analysis.For example, if patient Patricia Smith is entered into the Patient Data 1 screen as “Smith,Patricia” on one visit but as “Smith, Patty” on another, the HFA II will think that two differentpatients took these tests.
To help avoid these differences, you should enter a returning patient’s data via the RECALLPATIENT DATA button. The MERGE PATIENTS feature is available during patient data recall tohelp clear up extra patient entries. See Section 3: “Recalling Patient Data” for additionalinformation.
MERGE PATIENTS may be accessed on any File Directory screen when the directory displaysPatient order.
1Select the desired testfunction (VIEW TEST,COPY TEST, etc.)
2Select PATIENT fromDirectory Order. PressPROCEED.
3Choose the two tests youwish to merge. A check
mark will appear next to theselected tests once they havebeen chosen.
4Press MERGE PATIENTS.A pop-up window will
display both choices, includingthe date of birth and the IDnumber.
5Press the button to theleft of the name you wish to
use as the correct test. An “X”will appear next to that patient.
6Press PROCEED. All the test results for the two patient entries selected will be combinedinto the file marked with the “X”.
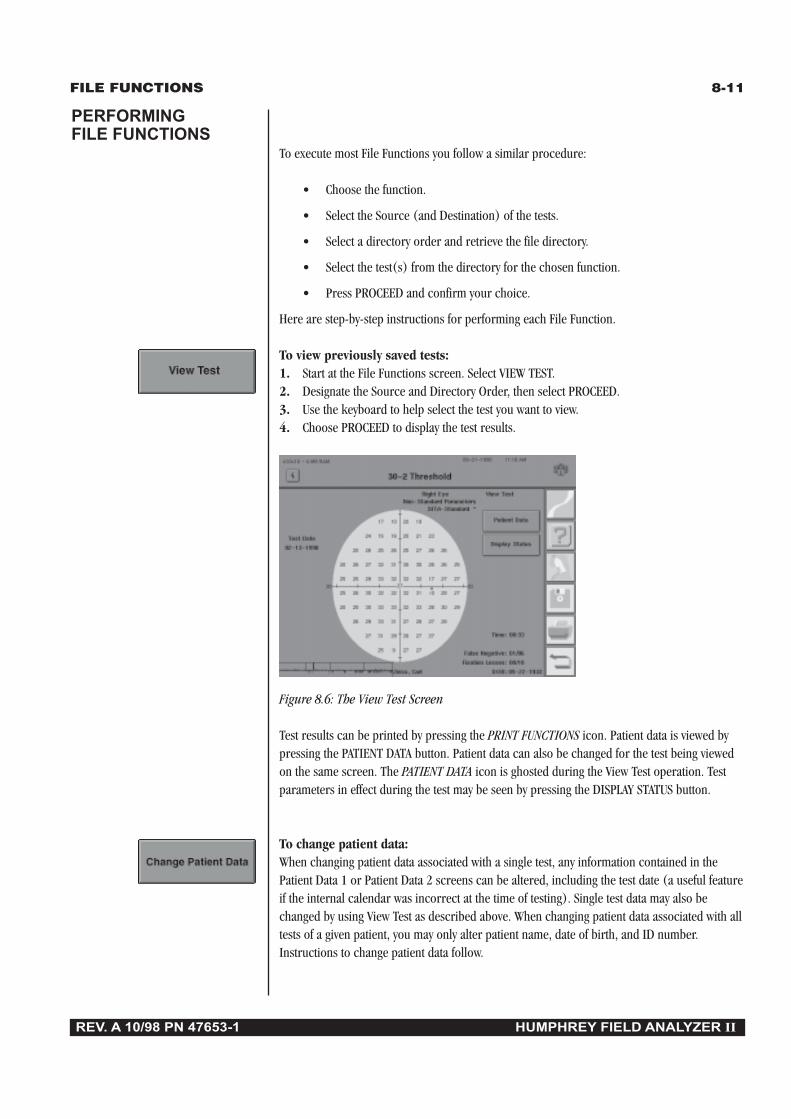
FILE FUNCTIONS 8-11
REV. A 10/98 PN 47653-1 HUMPHREY FIELD ANALYZER II
To execute most File Functions you follow a similar procedure:
• Choose the function.
• Select the Source (and Destination) of the tests.
• Select a directory order and retrieve the file directory.
• Select the test(s) from the directory for the chosen function.
• Press PROCEED and confirm your choice.
Here are step-by-step instructions for performing each File Function.
To view previously saved tests:1. Start at the File Functions screen. Select VIEW TEST.2. Designate the Source and Directory Order, then select PROCEED.3. Use the keyboard to help select the test you want to view.4. Choose PROCEED to display the test results.
Figure 8.6: The View Test Screen
Test results can be printed by pressing the PRINT FUNCTIONS icon. Patient data is viewed bypressing the PATIENT DATA button. Patient data can also be changed for the test being viewedon the same screen. The PATIENT DATA icon is ghosted during the View Test operation. Testparameters in effect during the test may be seen by pressing the DISPLAY STATUS button.
To change patient data:When changing patient data associated with a single test, any information contained in thePatient Data 1 or Patient Data 2 screens can be altered, including the test date (a useful featureif the internal calendar was incorrect at the time of testing). Single test data may also bechanged by using View Test as described above. When changing patient data associated with alltests of a given patient, you may only alter patient name, date of birth, and ID number.Instructions to change patient data follow.
PERFORMINGFILE FUNCTIONS
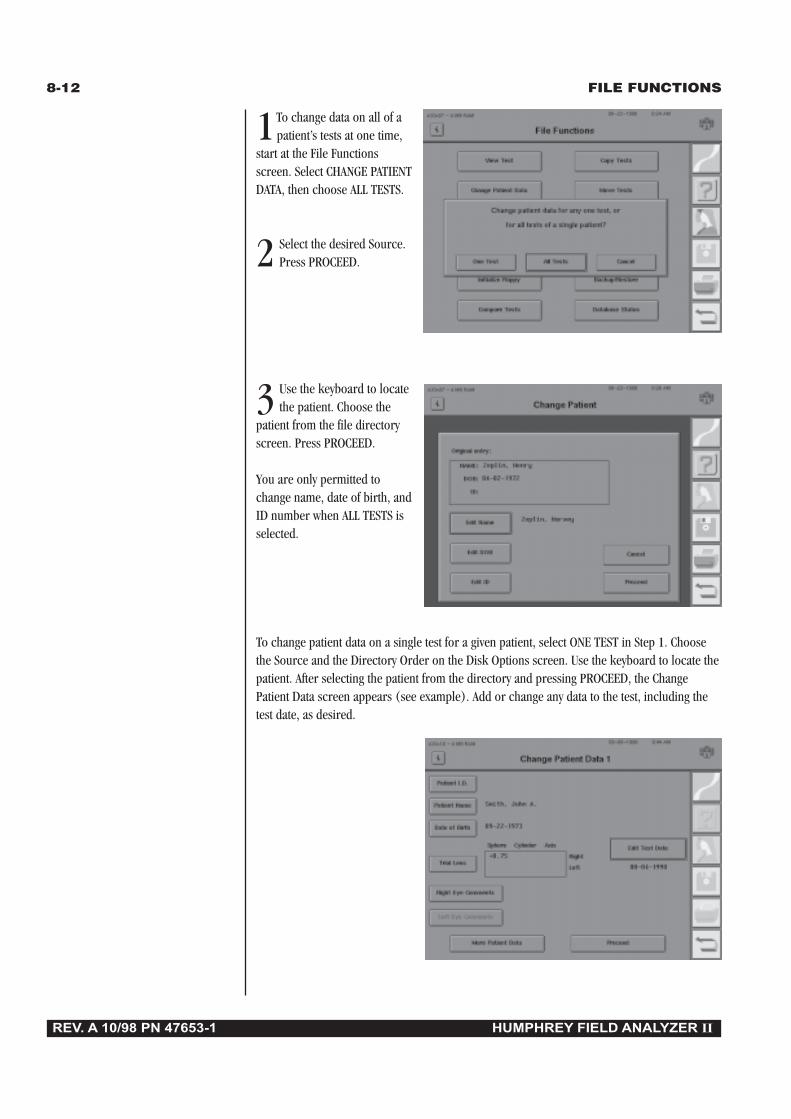
8-12 FILE FUNCTIONS
REV. A 10/98 PN 47653-1 HUMPHREY FIELD ANALYZER II
1To change data on all of apatient’s tests at one time,
start at the File Functionsscreen. Select CHANGE PATIENTDATA, then choose ALL TESTS.
2 Select the desired Source.Press PROCEED.
3 Use the keyboard to locatethe patient. Choose the
patient from the file directoryscreen. Press PROCEED.
You are only permitted tochange name, date of birth, andID number when ALL TESTS isselected.
To change patient data on a single test for a given patient, select ONE TEST in Step 1. Choosethe Source and the Directory Order on the Disk Options screen. Use the keyboard to locate thepatient. After selecting the patient from the directory and pressing PROCEED, the ChangePatient Data screen appears (see example). Add or change any data to the test, including thetest date, as desired.

FILE FUNCTIONS 8-13
REV. A 10/98 PN 47653-1 HUMPHREY FIELD ANALYZER II
To print a file directory:
1From the File Functionsmenu select PRINT
DIRECTORY.
2Select either HARDDRIVE or FLOPPY to
indicate which directory youwant to print. If you wish toprint a partial directory ofeither, choose PARTIAL.
3If you select HARD DRIVE, a message will appear telling you how many tests will be listedon the directory. Pressing YES will initiate printing the directory in Name order.
If you select FLOPPY, a directory of all tests on the floppy disk will be printed in Name order. Ifyou select PARTIAL, you can then specify either HARD DRIVE or FLOPPY as the Source, andeither Name or Date as the order. The keyboard and the file directory screen will be displayedto allow you to choose the tests to include in the partial directory. Directories cannot beprinted in Patient order. To print a complete chronological (Date) directory, choose PARTIALand the press the SELECT ALL button on the file directory screen before pressing PROCEED.
Note: You may cancel printing at any time by selecting CANCEL from the print progresspop-up window.
To duplicate floppy disks:1. Start at the File Functions screen. Select DUPLICATE FLOPPY.2. Put the Source disk (the disk you want to copy) in the floppy drive.3. Select OK to proceed or CANCEL to return to the File Functions menu. If you select OK, the
next screen displays, “Reading Source Disk”.4. When instructed to do so, remove the Source disk and put the Destination disk in the
floppy drive. Note that this procedure will erase all old data from the Destination floppydisk prior to copying the information from the Source disk onto it. Press OK to proceed,or CANCEL to abort the procedure and leave the Destination floppy unchanged. If youselect OK, the next screen displays, “Writing to Destination Disk”. Remember to makesure that the Destination disk has NO valuable information on it before you decide toduplicate information onto it. Everything on the Destination disk will be replacedwith all of the information on the Source disk when the DUPLICATE FLOPPY functionis used.
5. Remove the Destination disk when you see the confirmation message, “Floppy SuccessfullyDuplicated”. If the duplication fails, repeat Steps 1-4. If the duplication fails again, repeatSteps 1-4 with a different Destination disk. Direct problems to Humphrey Customer Service.Duplication may also be done using any IBM PC compatible computer.
Caution: Use only High Density (HD) 1.44 MB disks. Regular density (720 K) and2.88 MB Super High Density (SHD) disks will not work with the HFA II. You risklosing data if you use anything but High Density floppy disks.
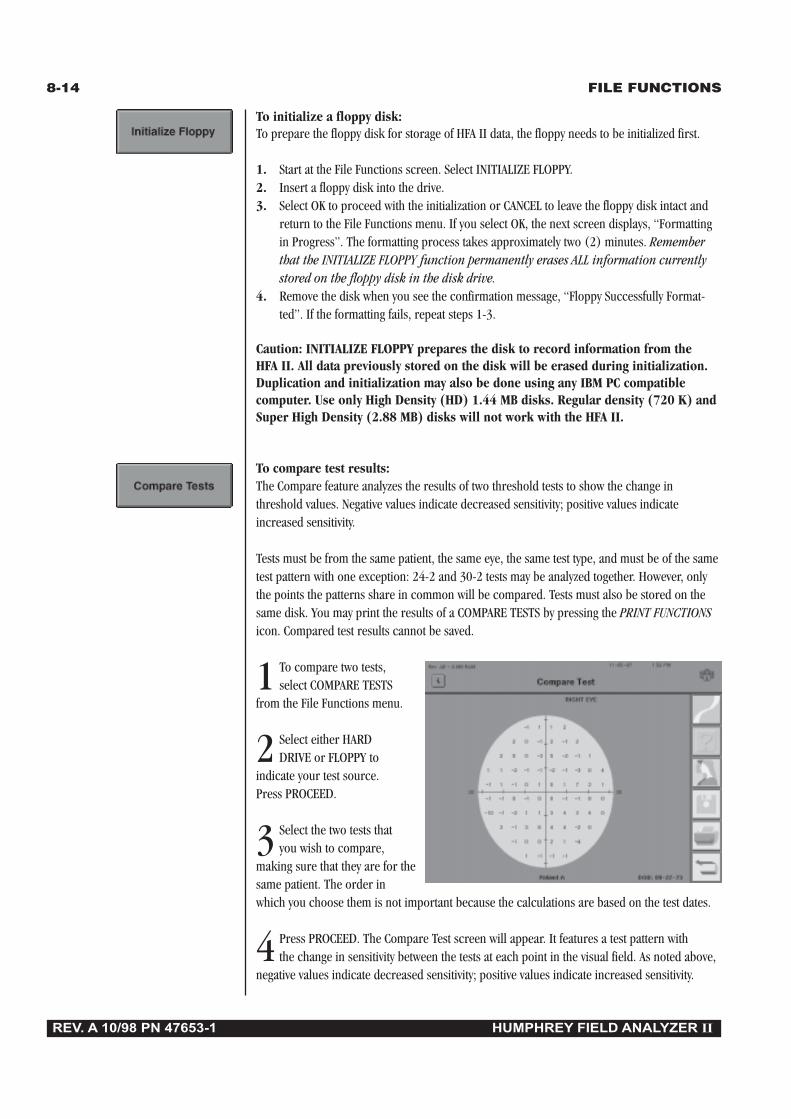
8-14 FILE FUNCTIONS
REV. A 10/98 PN 47653-1 HUMPHREY FIELD ANALYZER II
To initialize a floppy disk:To prepare the floppy disk for storage of HFA II data, the floppy needs to be initialized first.
1. Start at the File Functions screen. Select INITIALIZE FLOPPY.2. Insert a floppy disk into the drive.3. Select OK to proceed with the initialization or CANCEL to leave the floppy disk intact and
return to the File Functions menu. If you select OK, the next screen displays, “Formattingin Progress”. The formatting process takes approximately two (2) minutes. Rememberthat the INITIALIZE FLOPPY function permanently erases ALL information currentlystored on the floppy disk in the disk drive.
4. Remove the disk when you see the confirmation message, “Floppy Successfully Format-ted”. If the formatting fails, repeat steps 1-3.
Caution: INITIALIZE FLOPPY prepares the disk to record information from theHFA II. All data previously stored on the disk will be erased during initialization.Duplication and initialization may also be done using any IBM PC compatiblecomputer. Use only High Density (HD) 1.44 MB disks. Regular density (720 K) andSuper High Density (2.88 MB) disks will not work with the HFA II.
To compare test results:The Compare feature analyzes the results of two threshold tests to show the change inthreshold values. Negative values indicate decreased sensitivity; positive values indicateincreased sensitivity.
Tests must be from the same patient, the same eye, the same test type, and must be of the sametest pattern with one exception: 24-2 and 30-2 tests may be analyzed together. However, onlythe points the patterns share in common will be compared. Tests must also be stored on thesame disk. You may print the results of a COMPARE TESTS by pressing the PRINT FUNCTIONSicon. Compared test results cannot be saved.
1 To compare two tests,select COMPARE TESTS
from the File Functions menu.
2 Select either HARDDRIVE or FLOPPY to
indicate your test source.Press PROCEED.
3 Select the two tests thatyou wish to compare,
making sure that they are for thesame patient. The order inwhich you choose them is not important because the calculations are based on the test dates.
4 Press PROCEED. The Compare Test screen will appear. It features a test pattern with the change in sensitivity between the tests at each point in the visual field. As noted above,
negative values indicate decreased sensitivity; positive values indicate increased sensitivity.

FILE FUNCTIONS 8-15
REV. A 10/98 PN 47653-1 HUMPHREY FIELD ANALYZER II
To copy tests:This function copies one or more tests from one disk to another, leaving the original recordunchanged.
1. Start at the File Functions screen. Select COPY TESTS.2. Designate the Source and Destination disks and Directory Order, then PROCEED.3. Select the test(s) you want to copy or SELECT ALL to copy all tests saved on the Source.4. Select PROCEED to begin copying tests.5. The selected tests will be added to the information on the Destination disk without
affecting the information already stored there.
To move tests:This function moves tests to a different disk and then automatically deletes the originalrecord from the source disk.
1. Start at the File Functions screen. Select MOVE TESTS.2. Designate the Source and Destination disks and Directory Order, then PROCEED.3. Select the test(s) you want to move or SELECT ALL to move all tests saved on the Source.4. Select PROCEED to begin moving tests.5. The selected tests will be removed from the Source and added to the Destination disk
without affecting the information already stored on the Destination disk..
To delete tests:This function deletes test records from the designated disk.
1. Start at the File Functions screen. Select DELETE TESTS.2. Designate the Source disk and Directory Order, then PROCEED.3. Select the test(s) you want to delete or SELECT ALL to delete all tests on the designated
Source disk.4. Select PROCEED. A pop-up window will ask, “Are you sure?” Choose YES to permanently
delete the designated tests or CANCEL to return to the directory.
Caution: All tests deleted using the DELETE function are permanently erased fromthe disk. Once the DELETE function has begun, it can be stopped by pressingCANCEL, but tests already deleted before CANCEL was pressed are not recoverable.

8-16 FILE FUNCTIONS
REV. A 10/98 PN 47653-1 HUMPHREY FIELD ANALYZER II
Transferring tests between There are two ways to transfer results between the HFA I and HFA II:the HFA I and HFA II
• By Serial Cable (using TRANSFER TESTS):From the HFA I 635 or 640, approximately 1700 tests will transfer per hour.
• By optional external 5.25" floppy disk drive (using TRANSFER TESTS):A full 5.25" HFA I floppy disk will take approximately 10 minutes to transfer.
There is only one way to transfer test results from HFA II to HFA I:
• By optional external 5.25" floppy disk drive (using the COPY TESTS function).
Note: HFA I instruments with 3.5" floppy drives can only transfer tests from HFA I to HFA IIby the Serial Cable method. There is no way to transfer test data from the HFA II to anHFA I with a 3.5" floppy drive.
There are certain limitations to which tests will transfer from the HFA I to the HFA II. A nameand date of birth must be included on the original HFA I test in order to transfer itto the HFA II. The transfer process will not warn you of improperly labeled HFA I tests or testresults which are not eligible to be transferred. The following is a list of restrictions specific tothe test type being transferred:
Threshold• Fast Threshold or Master files will not transfer
• Compared, Averaged or Merged tests will not transfer
• Tests originally acquired on the HFA II
The Macula test: Only the first two threshold values at each point will be displayed and printed.
Note: The Peripheral 30/60-2 test on the HFA I is the Peripheral 60-4 on the HFA II. The testresults will transfer, but the 4 points not found in the 60-4 pattern will not be included.
ScreeningAll screening tests will transfer from HFA I to HFA II except:
• The C-166 Screening test
• A screening test where the user selected the Central or Peripheral Reference Level
• Auto Diagnostic tests
Note: The Peripheral 68 test on the HFA I is the P-60 on the HFA II. These test results willtransfer, but the 8 points not found in the P-60 pattern will not be included.
CustomCustom Arc and Profile tests will not transfer.
KineticKinetic test results can only be transferred from the HFA I via 5.25" floppy disk (using theoptional 5.25" external floppy drive). Kinetic test results cannot be transferred from the HFA IIto the HFA I.

FILE FUNCTIONS 8-17
REV. A 10/98 PN 47653-1 HUMPHREY FIELD ANALYZER II
To transfer tests from the To transfer tests via serial cable:HFA I to the HFA II viaserial cable 1. Connect the HFA I and HFA II with an IBM PC compatible serial connector cable
(9 pins on one end and 25 pins on the other). There are three serial ports on theback panel of the HFA II. Plug the end of the cable with nine (9) pins into serial portnumber 1 on the HFA II (the one next to the printer port). Plug the 25 pin connectorinto the serial port on the back of the HFA I. Refer to “System Components” inSection 1 of this guide for a detailed illustration of the ports on the HFA II.
2. Turn both instruments ON.
ON THE HFA II:3. From the System Setup screen, select SAVE/TRANSMIT OPTION.
4. Select RS-232 OPTIONS.
5. On the RS-232 Options screen, set BAUD RATE to 9600, PARITY to Even, DATA BITSto 7, and STOP BITS to 1.
6. Press PROCEED. The Transmit/Save screen will then appear. Press PROCEED.
7. Press the MAIN MENU icon on the upper right of the screen.
8. From the Main Menu, select FILE FUNCTIONS.
9. Select TRANSFER TESTS.
10. Select HFA I SERIAL CABLE as the Source.
11. Choose HARD DRIVE or FLOPPY as the Destination, then press PROCEED.
ON THE HFA I:12. From the Main Menu, select CONFIGURATION MENU.
13. Make sure the BAUD RATE is set to 9600 and the PARITY is set to EVEN on theConfiguration Menu screen, then select RETURN (to the Main Menu).
14. Select DISK FUNCTIONS.
15. Select TRANSMIT FILES.
16. Select the disk drive on which the tests you want to transfer are stored.
17. If you want to transmit a limited number of files, highlight those files and chooseSELECTION COMPLETE. If you want to transmit all the files on the HFA I disk, do nothighlight any files. Just choose SELECTION COMPLETE.
ON THE HFA II:18. A pop-up window will update the user on the progress and success of test transfer.
19. When the “tests transferred” count on the pop-up window has not changed forseveral seconds, test transfer is complete. Press CANCEL. If you do not press CANCELwithin about 10 minutes, the HFA II will automatically proceed to the next step.
20. The transferred tests will then be moved from temporary to permanent storage. PressOK when the pop-up window informs you that the transmission is complete.

8-18 FILE FUNCTIONS
REV. A 10/98 PN 47653-1 HUMPHREY FIELD ANALYZER II
EXTERNAL 5.25"FLOPPY DISK DRIVE(optional on all models)
An optional external 5.25" floppy drive is available from Humphrey Systems. With the externalfloppy drive:
1. Most test results from the HFA I may be transferred to the HFA II.2. Most test results may be copied to larger 5.25" floppy disks for use with the HFA I.3. Most threshold results may be copied to the larger 5.25" floppy disks for use with
STATPAC for Windows.
There are certain limitations that must be understood about 5.25" floppy disks before attempt-ing to transfer or copy data using the external 5.25" floppy drive.
1. Only double-sided, double-density (DSDD) floppy disks may be used with the external5.25" floppy drive. These are the same disks normally used by the HFA I. Never usedouble-sided, high-density (DSHD) floppy disks.
2. It is important to understand that 5.25" floppies cannot be used interchange-ably between the HFA I and HFA II. The internal disk drive on the HFA I andexternal disk drive attached to the HFA II read and write data to the 5.25"floppy disk in a slightly different fashion. You should always label the 5.25"floppy as to which HFA (I or II) originally formatted the disk. Not observingthe following guidelines will cause data to be lost.
a. 5.25" floppy disks that were originally formatted by the HFA I can be read by eitherthe HFA I or HFA II, but only the HFA I can write new test data onto these disks. HFA Ifloppy disks can only be re-formatted on the HFA I. Do not attempt to write to anHFA I disk with the HFA II.
b. 5.25" floppy disks that were formatted by the HFA II can be read by either the HFA Ior HFA II, but only the HFA II can write new information on these disks. The HFA IIcan only use new 5.25" floppy disks or 5.25" floppy disks that have been bulk-erased. Never attempt to reformat a used HFA II floppy disk. Do not attemptto write to an HFA II disk with the HFA I.
3. When tests are going from HFA I to HFA II you always use the TRANSFER TESTS button.When tests are going from HFA II to HFA I you always use the COPY TESTS button.
4. When transferring tests from the HFA I to the HFA II, all the eligible tests on the disk willbe transferred. You do not have the ability to choose which HFA I tests should be trans-ferred. Therefore, make sure only the tests you wish to have transferred are on the HFA I5.25" floppy disk in the external floppy drive.
5. When HFA II data is going to the HFA I, data unique to the HFA II, such as gaze trackingplots or SITA tests will not transfer. Additional test transfer limitations were listed earlier inthis section.

FILE FUNCTIONS 8-19
REV. A 10/98 PN 47653-1 HUMPHREY FIELD ANALYZER II
Connecting the 5.25" external Turn off your instrument and connect the external floppy drive (see Figure 8.7 below). Attachfloppy drive to the HFA II the gender changer to the external drive interface cable and plug into the HFA II slot marked
“External Floppy” (refer to “System Components” in Section 1 of this guide for furtherinformation regarding the location of this slot). Make sure that the external floppy drive powercable is plugged-in. Turn your HFA II back on.
Caution: Never leave the external drive cable plugged into the back of the HFA IIwithout the external disk drive’s power cord also plugged in. This may cause theHFA II to confuse the internal and external floppy drives, and permanent loss ofinformation may result for both the floppy disk and the hard drive.
5.25" Floppy Drive
Power Supply
HFA II Connector Panel
Interface Cable
Gender Changer
Figure 8.7: Connecting the 5.25" Floppy Drive to the HFA II.

8-20 FILE FUNCTIONS
REV. A 10/98 PN 47653-1 HUMPHREY FIELD ANALYZER II
The HFA II can transfer tests from HFA I 5.25" floppy disks to HFA II floppy disks or the harddisk. When performing this function, the HFA II transfers every eligible test from the HFA Idisk. Therefore, it is important to make sure that only tests you want to transfer are on theHFA I disk you are transferring from.
ON THE HFA I1. If you wish to transfer only certain tests from the HFA I to the HFA II, format a new 5.25"
floppy disk on the HFA I and save the tests to be transferred on this disk.
ON THE HFA II2. Insert the HFA I 5.25" floppy disk that contains the tests you want to transfer to the HFA II
into the external 5.25" floppy drive.3. From the File Functions menu, select TRANSFER TESTS.4. Select HFA I EXTERNAL FLOPPY as the Source and HARD DRIVE or FLOPPY DISK as the
Destination.5. Select PROCEED. All eligible tests on the HFA I disk will be transferred to the Destination
disk and saved as HFA II tests. You will not be informed as to which tests do not transfer.Refer to the introduction to “Transferring Tests Between the HFA I and HFA II” foradditional information.
To copy tests from the ON THE HFA IIHFA II to the HFA I via the 1. Insert either a new, unformatted 5.25" DSDD floppy disk or a floppy that has beenexternal 5.25" floppy drive previously formatted only by the HFA II into the external floppy drive.
2. From the File Functions screen on the HFA II, select COPY TESTS.3. Select the appropriate Source and HFA I EXTERNAL FLOPPY as the Destination. Press
PROCEED.4. Select the tests to be copied, then select PROCEED.5. A pop-up window will confirm that the number of tests to copy is correct. Press YES if the
appropriate tests were selected.6. If the floppy has not yet been formatted, press FORMAT when prompted. The HFA II will
copy the tests to the floppy automatically after formatting the disk. Be sure to label thisnew floppy as an HFA II 5.25" floppy disk. If the disk was previously formatted by an HFAII, copying will proceed normally.
Caution: Be careful not to accidentally format a 5.25" floppy which containsdata. Formatting the floppy permanently erases all previously stored data.
ON THE HFA I7. Upon completion of the COPY function on the HFA II, insert the floppy disk into the HFA I
floppy drive.8. Select DISK FUNCTIONS from the Main Menu.9. Select COPY FROM FLOPPY TO HARD DRIVE or COPY FROM FLOPPY TO FLOPPY, then
select PROCEED.
To transfer tests from theHFA I to the HFA II via theexternal 5.25" floppy drive

FILE FUNCTIONS 8-21
REV. A 10/98 PN 47653-1 HUMPHREY FIELD ANALYZER II
Database Status By pressing DATABASE STATUS you get information on the number of tests and the number ofpatients found on the hard disk and floppy disk databases. If no floppy disk is in the disk drive,“No Disk” will be displayed indicating the information is unavailable. Should the HFA II beunable to access the hard drive, “NA” will be displayed. If you back up your hard disk to floppydisks (see Section 9) and insert a backup floppy disk, the Database Status feature will recog-nize the floppy and indicate “Backup”. Under Hard Drive on models 720 and 730, “No HD”will be seen.
Please note that when patient information has been entered but not saved with test results, theDatabase Status pop-up window may give a false sense of the true number of patients with testsin the database. See Section 9: “Cleanup Hard Disk Database” for additional information.
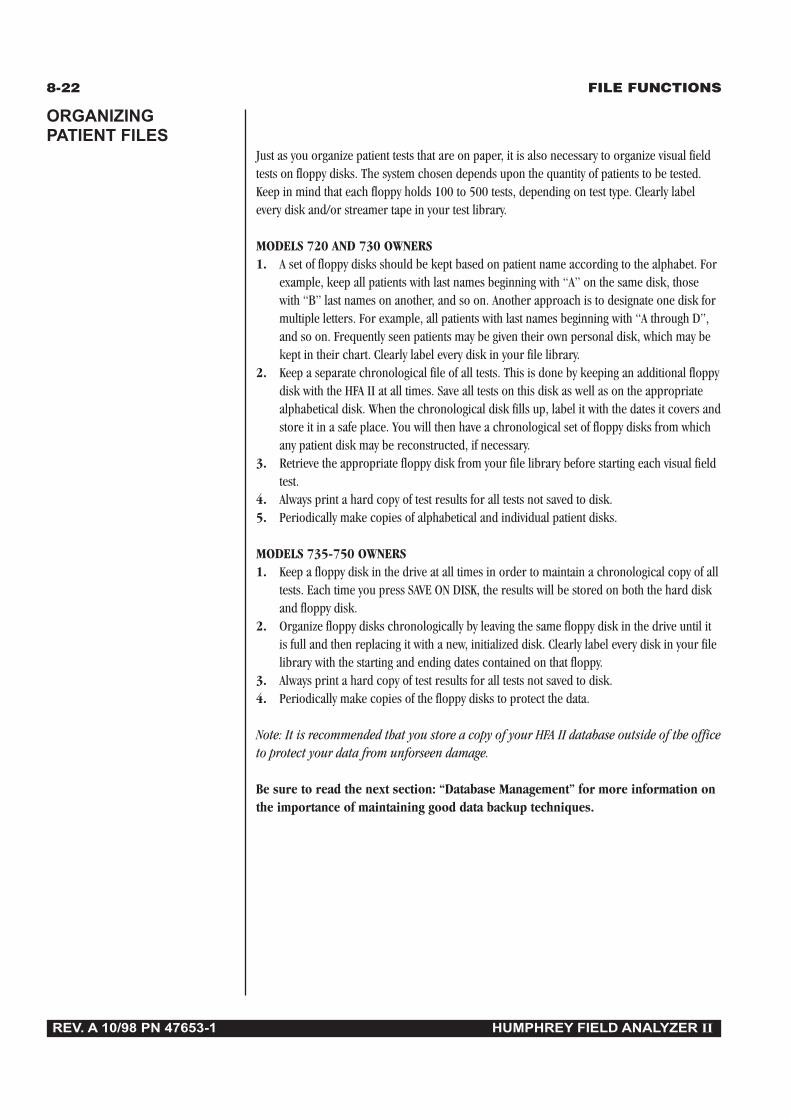
8-22 FILE FUNCTIONS
REV. A 10/98 PN 47653-1 HUMPHREY FIELD ANALYZER II
ORGANIZINGPATIENT FILES
Just as you organize patient tests that are on paper, it is also necessary to organize visual fieldtests on floppy disks. The system chosen depends upon the quantity of patients to be tested.Keep in mind that each floppy holds 100 to 500 tests, depending on test type. Clearly labelevery disk and/or streamer tape in your test library.
MODELS 720 AND 730 OWNERS1. A set of floppy disks should be kept based on patient name according to the alphabet. For
example, keep all patients with last names beginning with “A” on the same disk, thosewith “B” last names on another, and so on. Another approach is to designate one disk formultiple letters. For example, all patients with last names beginning with “A through D”,and so on. Frequently seen patients may be given their own personal disk, which may bekept in their chart. Clearly label every disk in your file library.
2. Keep a separate chronological file of all tests. This is done by keeping an additional floppydisk with the HFA II at all times. Save all tests on this disk as well as on the appropriatealphabetical disk. When the chronological disk fills up, label it with the dates it covers andstore it in a safe place. You will then have a chronological set of floppy disks from whichany patient disk may be reconstructed, if necessary.
3. Retrieve the appropriate floppy disk from your file library before starting each visual fieldtest.
4. Always print a hard copy of test results for all tests not saved to disk.5. Periodically make copies of alphabetical and individual patient disks.
MODELS 735-750 OWNERS1. Keep a floppy disk in the drive at all times in order to maintain a chronological copy of all
tests. Each time you press SAVE ON DISK, the results will be stored on both the hard diskand floppy disk.
2. Organize floppy disks chronologically by leaving the same floppy disk in the drive until itis full and then replacing it with a new, initialized disk. Clearly label every disk in your filelibrary with the starting and ending dates contained on that floppy.
3. Always print a hard copy of test results for all tests not saved to disk.4. Periodically make copies of the floppy disks to protect the data.
Note: It is recommended that you store a copy of your HFA II database outside of the officeto protect your data from unforseen damage.
Be sure to read the next section: “Database Management” for more information onthe importance of maintaining good data backup techniques.

REV. A 10/98 PN 47653-1 HUMPHREY FIELD ANALYZER II
Database Management 9Introduction to Database Management 9-2
Patient Database Protection Procedures 9-3
Configuration Backup and Restore 9-8
How to Handle Database Failures 9-13
Merge Database 9-23
Cleanup Hard Disk Database 9-24
Practices with Multiple Humphrey Field Analyzers 9-25
Care and Handling of Removable Storage Media 9-25
The Humphrey Field Analyzer II is like a computer in many respects. Its hard drive can “crash”and its floppy disk can “get corrupted”. Because visual field test results represent an importantpart of your patient’s ophthalmic history, it is imperative that you take steps to safeguard the
integrity of the data by creating backup copies of all tests. In addition topatient data, you can protect Custom test patterns, Main Menu buttondefinitions, and System Setup selections against loss in the event of a harddisk failure. Maintaining up-to-date backup copies of your patientdatabase is insurance against loss.
After reading this section you will be familiar with:• recommended backup techniques• how to backup and restore menu configurations• how to deal with database failures• how to keep a similar database on multiple HFA IIs• proper handling of streamer tapes and floppy disks
Caution: Never turn off the HFA II while the hard drive or floppy disk drive isrunning. This may cause permanent loss of valuable data.
Insurance Policy

9-2 DATABASE MANAGEMENT
REV. A 10/98 PN 47653-1 HUMPHREY FIELD ANALYZER II
Database errors are inevitable. Power surges, temperature changes, and mechanical failurecan disrupt the proper operation of storage devices, and prevent you from successfully savingor retrieving data. Because both hard and floppy disks store information magnetically, theinformation can be damaged by static electricity and strong magnets.
Database management is not difficult and should not consume much time. HumphreySystems strongly recommends that all HFA customers make extra copies of theirpatient database and setup configurations. In the event of a database problem, andyou need to restore your database, you will have the solution at hand.
For the sake of simplicity, this manual separates database management into two categories:functions which manipulate data (Copy Tests, Delete Tests, and Change Patient Data, forexample), and functions which preserve database integrity (Backup Configuration, RebuildHard Disk Database, etc.). This section discusses preserving database integrity. All otherdatabase management functions are explained in Section 8: “File Functions”.
Database integrity functions Functions associated with preserving database integrity can be found on both the File Functionsand Additional Setup Menus. These functions are outlined below.
On File Functions MenuCreates an exact copy of a floppy disk; used for duplicating patient database information ontoadditional floppy disks.
Backup: Copies patient files from the hard disk to streamer tape or floppy disk.
Restore: Copies patient files from a streamer tape or a set of floppy disks to the hard drive.Used in the event of a hard disk failure. The Source and Destination you choosedetermines whether you are backing up or restoring data.
Provides information on the number of tests and the number of patients found on the harddrive and floppy disk databases. It can also identify a backup floppy disk (see Section 8).
On Additional Setup MenuCopies Custom Test Patterns, Main Menu button definitions, and System Setup selections to afloppy disk.
Reinstates Custom Test Patterns, Main Menu button definitions, and System Setup selections.
A database repair utility; used only in the event of hard disk database problems.
A database repair utility; used only in the event of floppy disk database problems.
Deletes files containing patient data with no associated test data.
INTRODUCTION TODATABASEMANAGEMENT
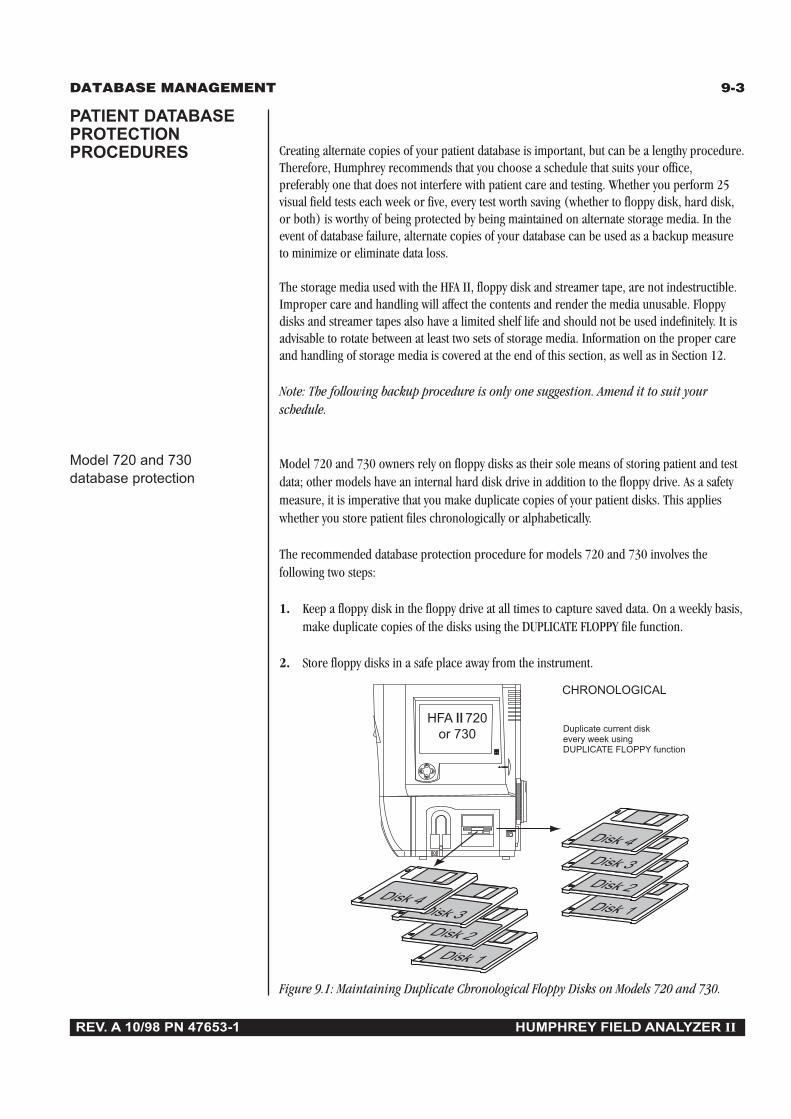
DATABASE MANAGEMENT 9-3
REV. A 10/98 PN 47653-1 HUMPHREY FIELD ANALYZER II
Creating alternate copies of your patient database is important, but can be a lengthy procedure.Therefore, Humphrey recommends that you choose a schedule that suits your office,preferably one that does not interfere with patient care and testing. Whether you perform 25visual field tests each week or five, every test worth saving (whether to floppy disk, hard disk,or both) is worthy of being protected by being maintained on alternate storage media. In theevent of database failure, alternate copies of your database can be used as a backup measureto minimize or eliminate data loss.
The storage media used with the HFA II, floppy disk and streamer tape, are not indestructible.Improper care and handling will affect the contents and render the media unusable. Floppydisks and streamer tapes also have a limited shelf life and should not be used indefinitely. It isadvisable to rotate between at least two sets of storage media. Information on the proper careand handling of storage media is covered at the end of this section, as well as in Section 12.
Note: The following backup procedure is only one suggestion. Amend it to suit yourschedule.
Model 720 and 730 owners rely on floppy disks as their sole means of storing patient and testdata; other models have an internal hard disk drive in addition to the floppy drive. As a safetymeasure, it is imperative that you make duplicate copies of your patient disks. This applieswhether you store patient files chronologically or alphabetically.
The recommended database protection procedure for models 720 and 730 involves thefollowing two steps:
1. Keep a floppy disk in the floppy drive at all times to capture saved data. On a weekly basis,make duplicate copies of the disks using the DUPLICATE FLOPPY file function.
2. Store floppy disks in a safe place away from the instrument.
Figure 9.1: Maintaining Duplicate Chronological Floppy Disks on Models 720 and 730.
Model 720 and 730database protection
PATIENT DATABASEPROTECTIONPROCEDURES
Disk 1Disk 2Disk 3
Disk 1Disk 2
Disk 3
HFA II 720or 730 Duplicate current disk
every week using DUPLICATE FLOPPY function
Disk 4
Disk 4
CHRONOLOGICAL
Duplicate current diskevery week usingDUPLICATE FLOPPY function
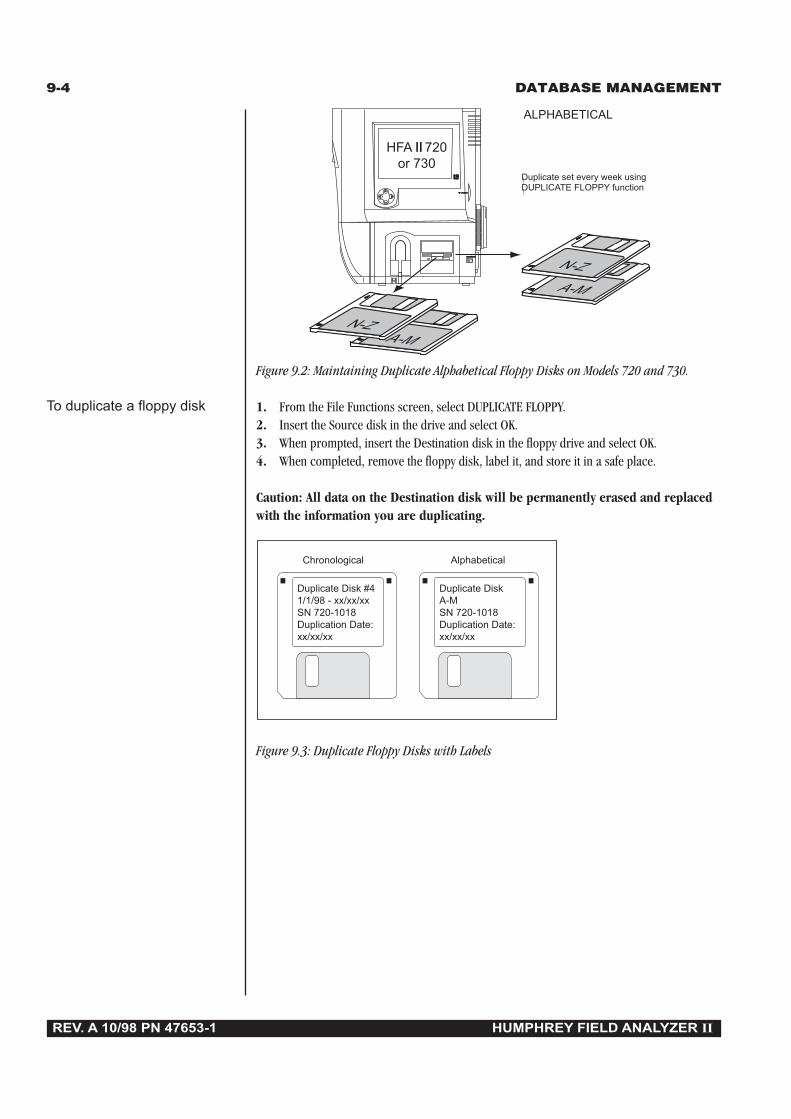
9-4 DATABASE MANAGEMENT
REV. A 10/98 PN 47653-1 HUMPHREY FIELD ANALYZER II
Figure 9.2: Maintaining Duplicate Alphabetical Floppy Disks on Models 720 and 730.
1. From the File Functions screen, select DUPLICATE FLOPPY.2. Insert the Source disk in the drive and select OK.3. When prompted, insert the Destination disk in the floppy drive and select OK.4. When completed, remove the floppy disk, label it, and store it in a safe place.
Caution: All data on the Destination disk will be permanently erased and replacedwith the information you are duplicating.
Figure 9.3: Duplicate Floppy Disks with Labels
A-M
A-M
HFA II 720or 730
ALPHABETICAL
N-Z
N-Z
Duplicate set every week using DUPLICATE FLOPPY function
Duplicate Disk #41/1/98 - xx/xx/xxSN 720-1018Duplication Date:xx/xx/xx
Duplicate DiskA-MSN 720-1018Duplication Date:xx/xx/xx
Chronological Alphabetical
To duplicate a floppy disk
Duplicate set every week usingDUPLICATE FLOPPY function
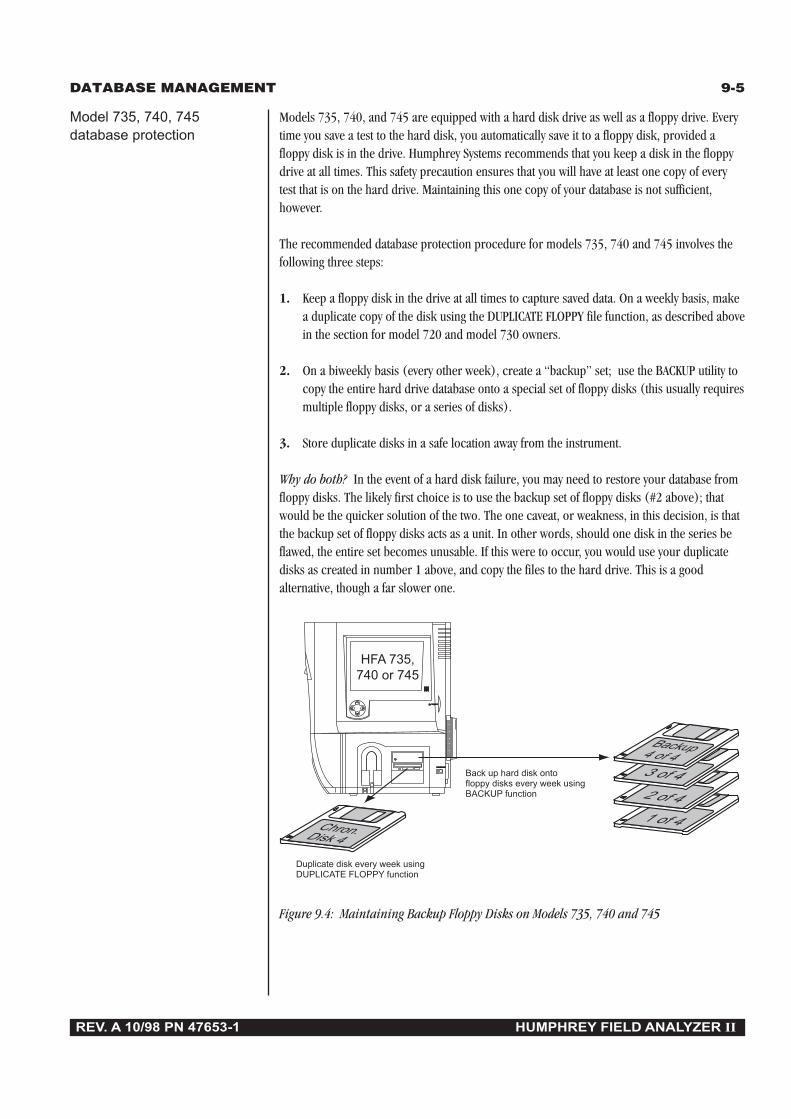
DATABASE MANAGEMENT 9-5
REV. A 10/98 PN 47653-1 HUMPHREY FIELD ANALYZER II
Models 735, 740, and 745 are equipped with a hard disk drive as well as a floppy drive. Everytime you save a test to the hard disk, you automatically save it to a floppy disk, provided afloppy disk is in the drive. Humphrey Systems recommends that you keep a disk in the floppydrive at all times. This safety precaution ensures that you will have at least one copy of everytest that is on the hard drive. Maintaining this one copy of your database is not sufficient,however.
The recommended database protection procedure for models 735, 740 and 745 involves thefollowing three steps:
1. Keep a floppy disk in the drive at all times to capture saved data. On a weekly basis, makea duplicate copy of the disk using the DUPLICATE FLOPPY file function, as described abovein the section for model 720 and model 730 owners.
2. On a biweekly basis (every other week), create a “backup” set; use the BACKUP utility tocopy the entire hard drive database onto a special set of floppy disks (this usually requiresmultiple floppy disks, or a series of disks).
3. Store duplicate disks in a safe location away from the instrument.
Why do both? In the event of a hard disk failure, you may need to restore your database fromfloppy disks. The likely first choice is to use the backup set of floppy disks (#2 above); thatwould be the quicker solution of the two. The one caveat, or weakness, in this decision, is thatthe backup set of floppy disks acts as a unit. In other words, should one disk in the series beflawed, the entire set becomes unusable. If this were to occur, you would use your duplicatedisks as created in number 1 above, and copy the files to the hard drive. This is a goodalternative, though a far slower one.
Figure 9.4: Maintaining Backup Floppy Disks on Models 735, 740 and 745
Model 735, 740, 745database protection
1 of 42 of 43 of 4
Backup4 of 4
HFA 735,740 or 745
Duplicate disk every week using DUPLICATE FLOPPY function
Backup every week using BACKUP function
Chron.Disk 4
Back up hard disk ontofloppy disks every week usingBACKUP function
Duplicate disk every week usingDUPLICATE FLOPPY function
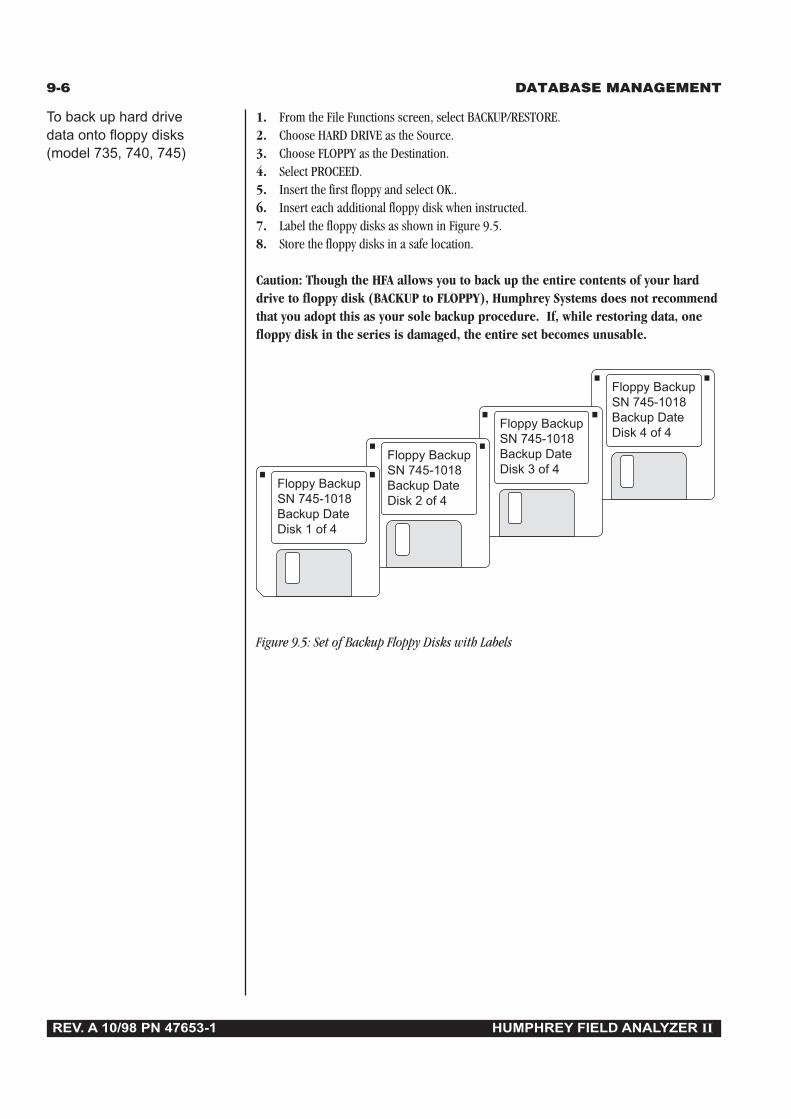
9-6 DATABASE MANAGEMENT
REV. A 10/98 PN 47653-1 HUMPHREY FIELD ANALYZER II
To back up hard drive 1. From the File Functions screen, select BACKUP/RESTORE.data onto floppy disks 2. Choose HARD DRIVE as the Source.(model 735, 740, 745) 3. Choose FLOPPY as the Destination.
4. Select PROCEED.5. Insert the first floppy and select OK..6. Insert each additional floppy disk when instructed.7. Label the floppy disks as shown in Figure 9.5.8. Store the floppy disks in a safe location.
Caution: Though the HFA allows you to back up the entire contents of your harddrive to floppy disk (BACKUP to FLOPPY), Humphrey Systems does not recommendthat you adopt this as your sole backup procedure. If, while restoring data, onefloppy disk in the series is damaged, the entire set becomes unusable.
Figure 9.5: Set of Backup Floppy Disks with Labels
Floppy BackupSN 745-1018Backup DateDisk 4 of 4
Floppy BackupSN 745-1018Backup DateDisk 3 of 4
Floppy BackupSN 745-1018Backup DateDisk 2 of 4
Floppy BackupSN 745-1018Backup DateDisk 1 of 4

DATABASE MANAGEMENT 9-7
REV. A 10/98 PN 47653-1 HUMPHREY FIELD ANALYZER II
Model 750 The model 750, which comes equipped with both a floppy disk drive and streamer tape drive,database protection affords owners a different method for backing up hard disk data. The streamer tape is the
most efficient and effective method of database protection for the HFA II.
The recommended database protection procedure for model 750 involves the following threesteps:
1. Keep a floppy disk in the drive at all times to capture saved data. On a weekly basis, makea copy of the disk using the DUPLICATE FLOPPY file function.
2. On a weekly basis, perform a streamer tape backup of the entire database using theBACKUP utility. Include the backup date on the tape label and rotate between two or moretapes for added protection.
3. Store backup floppy disks and streamer tapes in a safe location away from the instrument.
Figure 9.6: Maintaining Backup Disks and Streamer Tape on the Model 750
To back up hard drive 1. From the File Functions screen, select BACKUP/RESTORE.data onto streamer tape 2. Choose HARD DRIVE as the Source.(model 750 only) 3. Choose TAPE as the Destination.
4. Select PROCEED.5. Insert the streamer tape into the drive.6. Wait for the tape drive light to stop flashing. Select OK.7. When completed, the instrument will automatically eject the tape.8. Label the tape as shown in Figure 9.7.9. Store the tape in a safe location.
Figure 9.7: Backup Streamer Tape with Label
Backup date3/9/98
SN: 750-1018
HFA 750
Duplicate disk every week using DUPLICATE FLOPPY function
Backup every week using BACKUP function
Chron.Disk 4

9-8 DATABASE MANAGEMENT
REV. A 10/98 PN 47653-1 HUMPHREY FIELD ANALYZER II
Custom test patterns, Main Menu button definitions, and System Setup choices can be backedup on a floppy disk. This backup includes all changes made via the Alter Main Menu feature. Italso includes settings in the System Setup and Additional Setup screens, including PersonalizedID, printer choice, etc. Backup copies of your configuration ensure that your settings will bepreserved for the future. This may be important if you wish to restore settings that you havedeleted or if an unexpected data loss occurs. A restoration cannot occur unless a backup isperformed first. This backup, however, is not instrument specific.
Notes:1. You may not backup or restore an individual Custom test pattern. All Custom
test patterns must be backed up and restored as a group.
2. Configuration Backup is separate from the Patient Database Backup.
3. Offices with multiple HFA IIs: If Setup selections, Custom test patterns andMain Menu configurations are the same on several HFA IIs, only one backupcopy of the configuration is necessary. This copy can be used with the “RestoreConfiguration” procedure to set all HFA IIs to the same configuration.
1From the Main Menuscreen, press the
SYSTEM SETUP icon.
Note: This example showsnumerous test buttons alteredby the user. See Section 2:“Altering the Main MenuScreen” for details. The MainMenu configuration will besaved with this procedure.
2 Select ADDITIONAL SETUP.
CONFIGURATIONBACKUP ANDRESTORE
To backup configurations

DATABASE MANAGEMENT 9-9
REV. A 10/98 PN 47653-1 HUMPHREY FIELD ANALYZER II
3Press BACKUPCONFIGURATION.
4 A pop-up window willdisplay the message,
“Configuration Backup willformat a floppy disk and save thecurrent setup, including the MainMenu definitions”.
Press CONTINUE.
5 Put the floppy disk tobe formatted into the floppy
drive. Press OK.

9-10 DATABASE MANAGEMENT
REV. A 10/98 PN 47653-1 HUMPHREY FIELD ANALYZER II
6 If you are sure that you havechosen the correct disk,
press CONTINUE.
Note: Even if you choose a blank, formatted disk, your HFA II will format it again toensure the integrity of the disk.
7 A pop-up window willdisplay the message, “Floppy
Successfully Formatted.”
Press OK to begin the backup.
8When the “ConfigurationBackup is complete”
message appears, press OK toreturn to the Additional Setupscreen.
9 Eject the Configuration Backup floppy disk. Label and date the disk. Store the disk in asafe place.
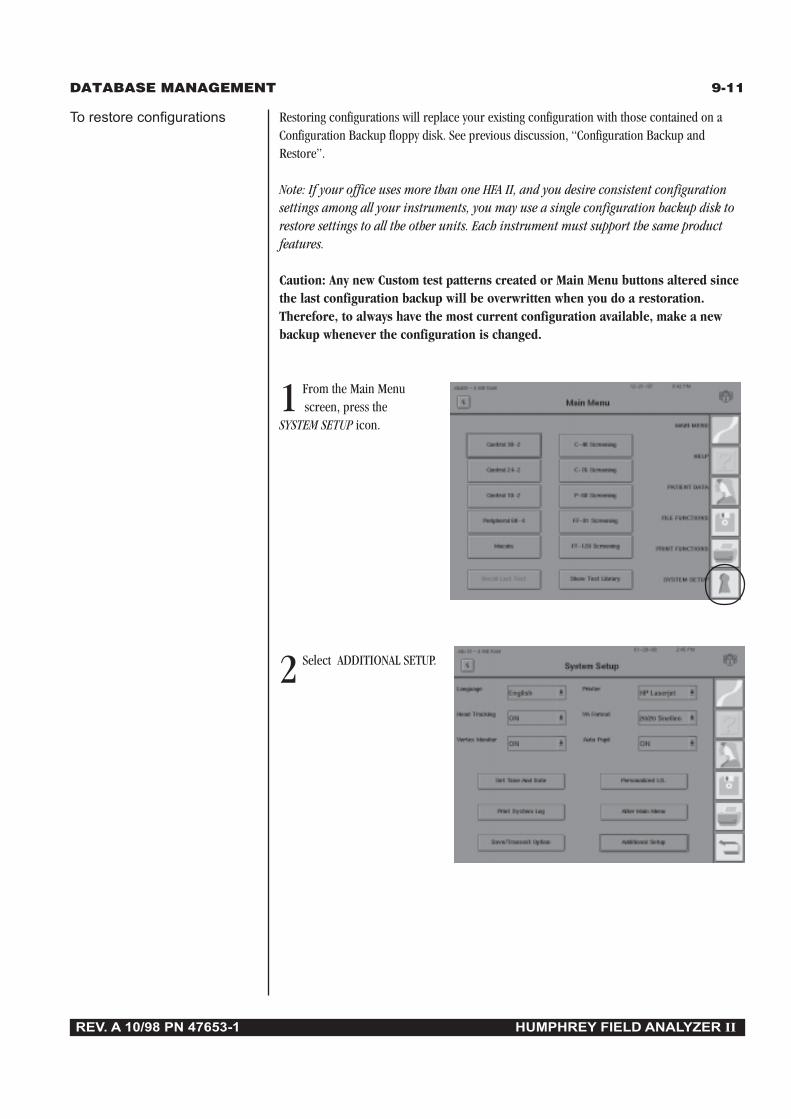
DATABASE MANAGEMENT 9-11
REV. A 10/98 PN 47653-1 HUMPHREY FIELD ANALYZER II
Restoring configurations will replace your existing configuration with those contained on aConfiguration Backup floppy disk. See previous discussion, “Configuration Backup andRestore”.
Note: If your office uses more than one HFA II, and you desire consistent configurationsettings among all your instruments, you may use a single configuration backup disk torestore settings to all the other units. Each instrument must support the same productfeatures.
Caution: Any new Custom test patterns created or Main Menu buttons altered sincethe last configuration backup will be overwritten when you do a restoration.Therefore, to always have the most current configuration available, make a newbackup whenever the configuration is changed.
1 From the Main Menu screen, press the
SYSTEM SETUP icon.
2 Select ADDITIONAL SETUP.
To restore configurations

9-12 DATABASE MANAGEMENT
REV. A 10/98 PN 47653-1 HUMPHREY FIELD ANALYZER II
3Press RESTORECONFIGURATION.
4 Insert the appropriateConfiguration Backup floppy
disk.
Press CONTINUE.
The Main Menu and Custom testconfigurations will be restored.
5When restoration iscomplete, press OK.
After a 15 second pause, yourHFA II will automatically restartusing the restored configuration.
6 Return the Configuration Backup floppy disk to a safe place.
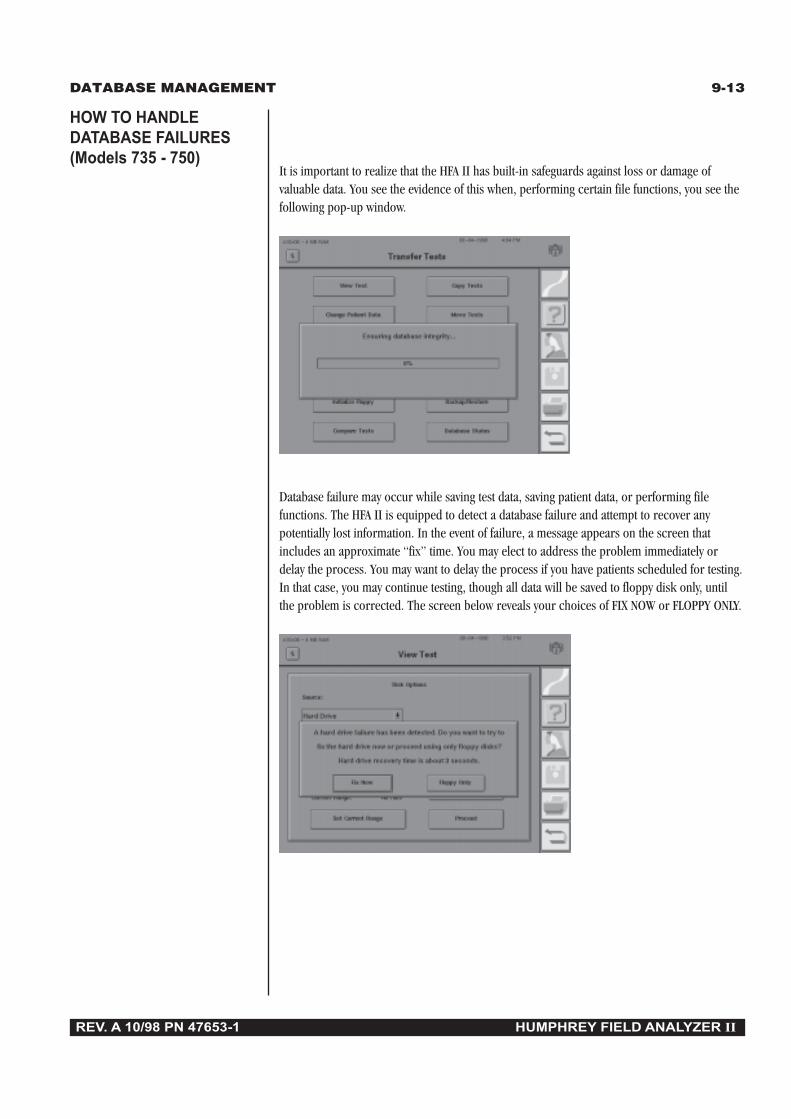
DATABASE MANAGEMENT 9-13
REV. A 10/98 PN 47653-1 HUMPHREY FIELD ANALYZER II
It is important to realize that the HFA II has built-in safeguards against loss or damage ofvaluable data. You see the evidence of this when, performing certain file functions, you see thefollowing pop-up window.
Database failure may occur while saving test data, saving patient data, or performing filefunctions. The HFA II is equipped to detect a database failure and attempt to recover anypotentially lost information. In the event of failure, a message appears on the screen thatincludes an approximate “fix” time. You may elect to address the problem immediately ordelay the process. You may want to delay the process if you have patients scheduled for testing.In that case, you may continue testing, though all data will be saved to floppy disk only, untilthe problem is corrected. The screen below reveals your choices of FIX NOW or FLOPPY ONLY.
HOW TO HANDLEDATABASE FAILURES(Models 735 - 750)
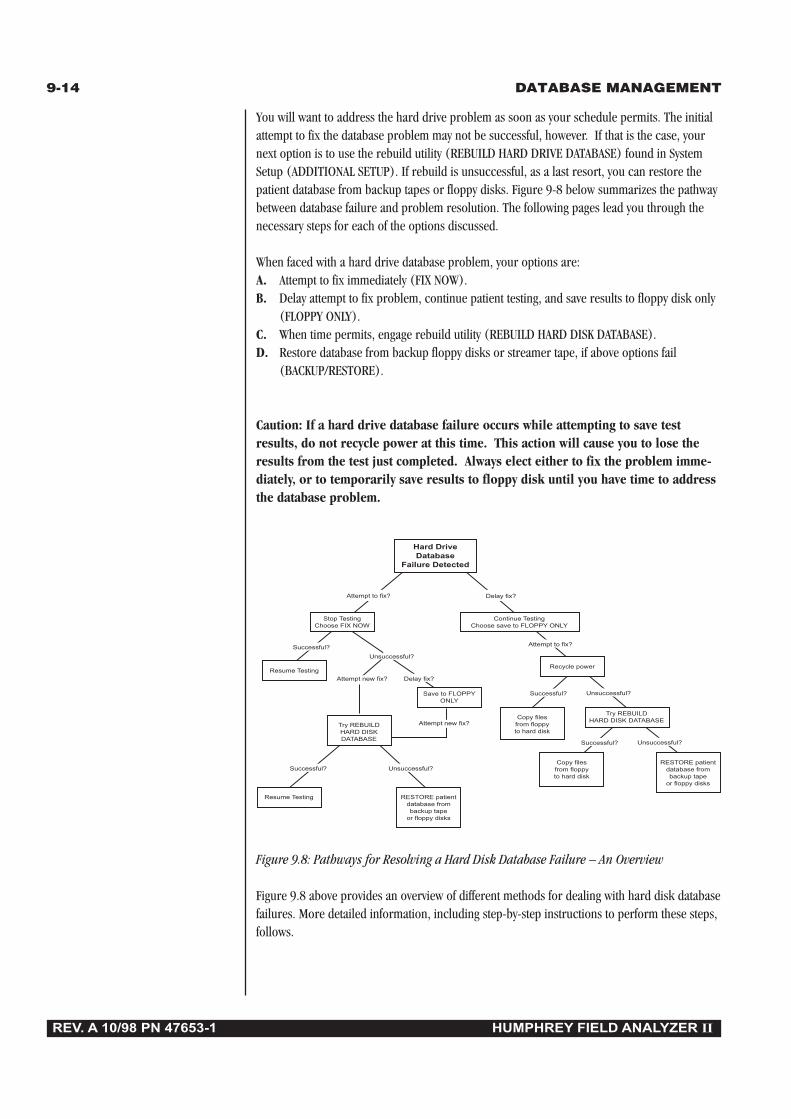
9-14 DATABASE MANAGEMENT
REV. A 10/98 PN 47653-1 HUMPHREY FIELD ANALYZER II
You will want to address the hard drive problem as soon as your schedule permits. The initialattempt to fix the database problem may not be successful, however. If that is the case, yournext option is to use the rebuild utility (REBUILD HARD DRIVE DATABASE) found in SystemSetup (ADDITIONAL SETUP). If rebuild is unsuccessful, as a last resort, you can restore thepatient database from backup tapes or floppy disks. Figure 9-8 below summarizes the pathwaybetween database failure and problem resolution. The following pages lead you through thenecessary steps for each of the options discussed.
When faced with a hard drive database problem, your options are:A. Attempt to fix immediately (FIX NOW).B. Delay attempt to fix problem, continue patient testing, and save results to floppy disk only
(FLOPPY ONLY).C. When time permits, engage rebuild utility (REBUILD HARD DISK DATABASE).D. Restore database from backup floppy disks or streamer tape, if above options fail
(BACKUP/RESTORE).
Caution: If a hard drive database failure occurs while attempting to save testresults, do not recycle power at this time. This action will cause you to lose theresults from the test just completed. Always elect either to fix the problem imme-diately, or to temporarily save results to floppy disk until you have time to addressthe database problem.
Figure 9.8: Pathways for Resolving a Hard Disk Database Failure – An Overview
Figure 9.8 above provides an overview of different methods for dealing with hard disk databasefailures. More detailed information, including step-by-step instructions to perform these steps,follows.
Hard DriveDatabase
Failure Detected
Delay fix?
Save to FLOPPYONLY
Attempt to fix?
Try REBUILDHARD DISKDATABASE
Resume Testing
Resume Testing RESTORE patientdatabase frombackup tape
or floppy disks
Stop TestingChoose FIX NOW
Continue TestingChoose save to FLOPPY ONLY
Recycle power
Try REBUILDHARD DISK DATABASECopy files
from floppyto hard disk
Copy filesfrom floppyto hard disk
RESTORE patientdatabase frombackup tape
or floppy disks
Successful? Attempt to fix?
Attempt new fix? Delay fix?
Unsuccessful?
Successful? Unsuccessful?
Successful? Unsuccessful?
Successful? Unsuccessful?
Attempt new fix?
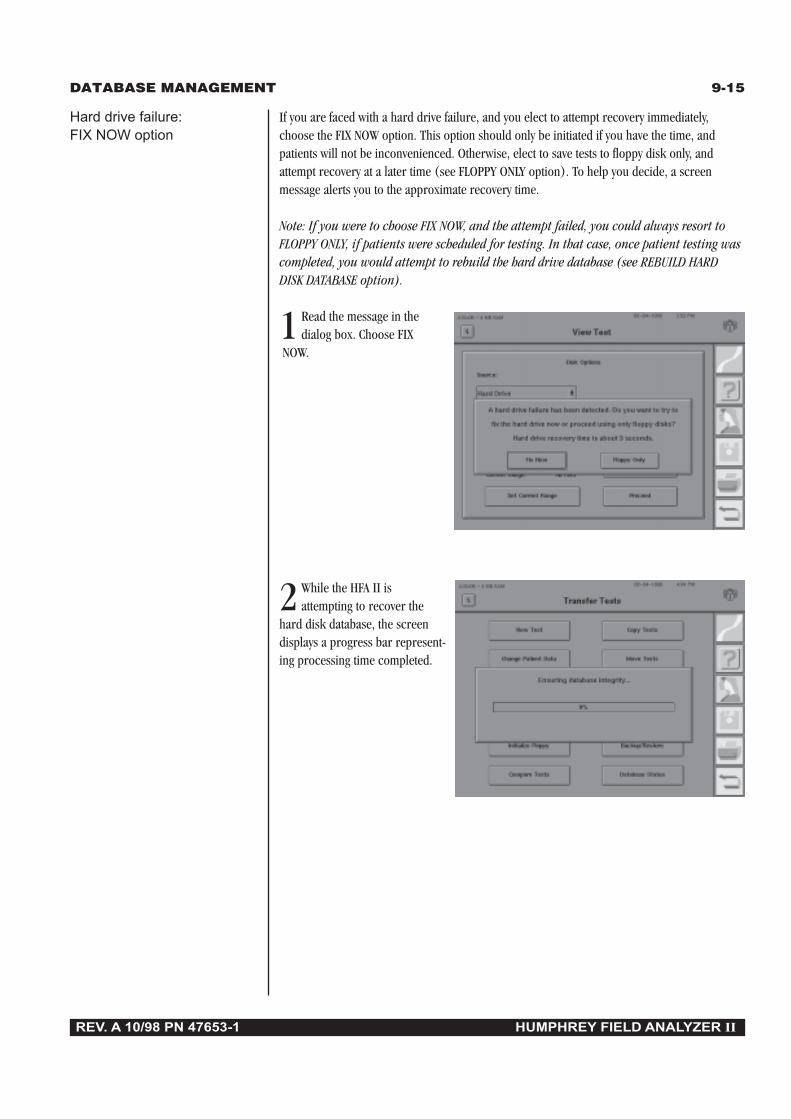
DATABASE MANAGEMENT 9-15
REV. A 10/98 PN 47653-1 HUMPHREY FIELD ANALYZER II
Hard drive failure: If you are faced with a hard drive failure, and you elect to attempt recovery immediately,FIX NOW option choose the FIX NOW option. This option should only be initiated if you have the time, and
patients will not be inconvenienced. Otherwise, elect to save tests to floppy disk only, andattempt recovery at a later time (see FLOPPY ONLY option). To help you decide, a screenmessage alerts you to the approximate recovery time.
Note: If you were to choose FIX NOW, and the attempt failed, you could always resort toFLOPPY ONLY, if patients were scheduled for testing. In that case, once patient testing wascompleted, you would attempt to rebuild the hard drive database (see REBUILD HARDDISK DATABASE option).
1Read the message in thedialog box. Choose FIX
NOW.
2While the HFA II isattempting to recover the
hard disk database, the screendisplays a progress bar represent-ing processing time completed.
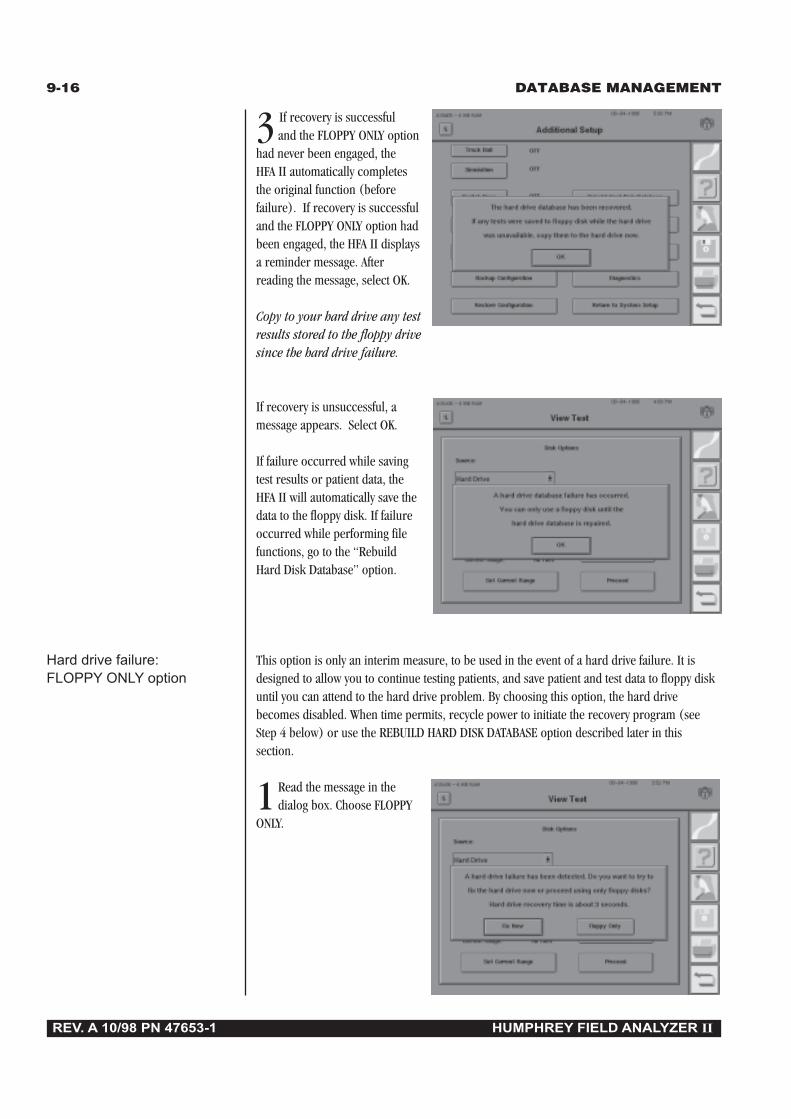
9-16 DATABASE MANAGEMENT
REV. A 10/98 PN 47653-1 HUMPHREY FIELD ANALYZER II
3 If recovery is successfuland the FLOPPY ONLY option
had never been engaged, theHFA II automatically completesthe original function (beforefailure). If recovery is successfuland the FLOPPY ONLY option hadbeen engaged, the HFA II displaysa reminder message. Afterreading the message, select OK.
Copy to your hard drive any testresults stored to the floppy drivesince the hard drive failure.
If recovery is unsuccessful, amessage appears. Select OK.
If failure occurred while savingtest results or patient data, theHFA II will automatically save thedata to the floppy disk. If failureoccurred while performing filefunctions, go to the “RebuildHard Disk Database” option.
Hard drive failure: This option is only an interim measure, to be used in the event of a hard drive failure. It isFLOPPY ONLY option designed to allow you to continue testing patients, and save patient and test data to floppy disk
until you can attend to the hard drive problem. By choosing this option, the hard drivebecomes disabled. When time permits, recycle power to initiate the recovery program (seeStep 4 below) or use the REBUILD HARD DISK DATABASE option described later in thissection.
1 Read the message in thedialog box. Choose FLOPPY
ONLY.
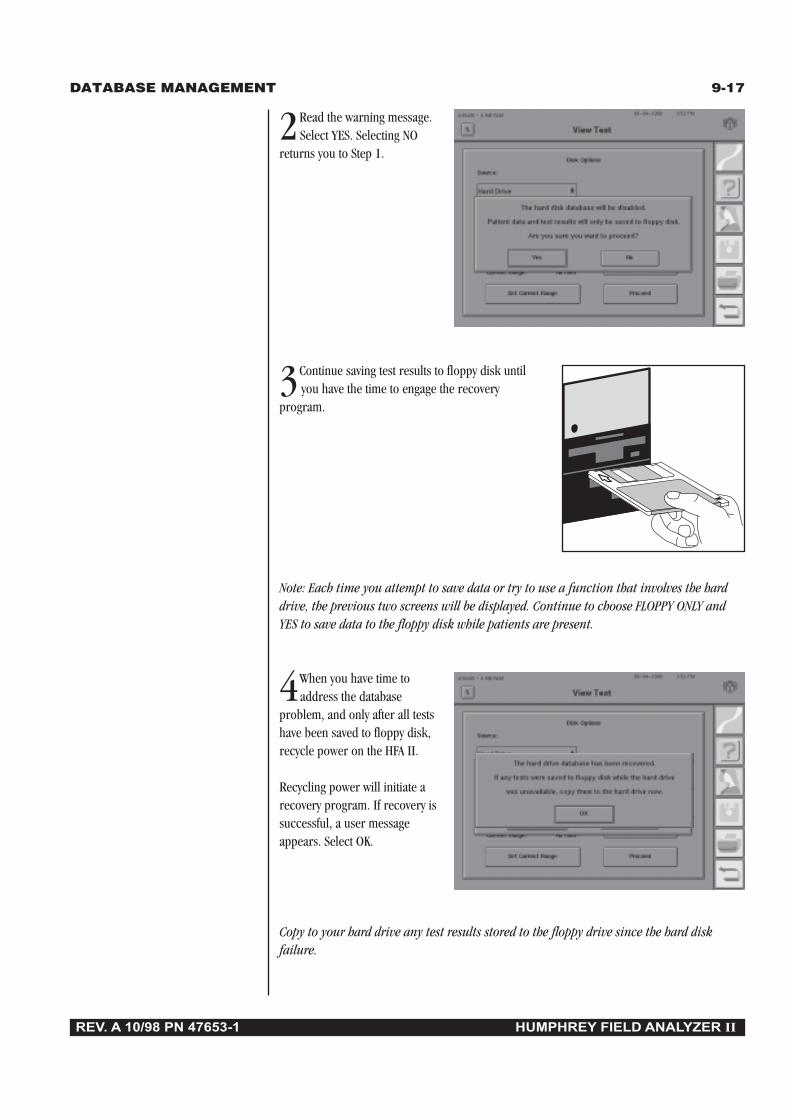
DATABASE MANAGEMENT 9-17
REV. A 10/98 PN 47653-1 HUMPHREY FIELD ANALYZER II
2Read the warning message.Select YES. Selecting NO
returns you to Step 1.
3Continue saving test results to floppy disk untilyou have the time to engage the recovery
program.
Note: Each time you attempt to save data or try to use a function that involves the harddrive, the previous two screens will be displayed. Continue to choose FLOPPY ONLY andYES to save data to the floppy disk while patients are present.
4When you have time toaddress the database
problem, and only after all testshave been saved to floppy disk,recycle power on the HFA II.
Recycling power will initiate arecovery program. If recovery issuccessful, a user messageappears. Select OK.
Copy to your hard drive any test results stored to the floppy drive since the hard diskfailure.
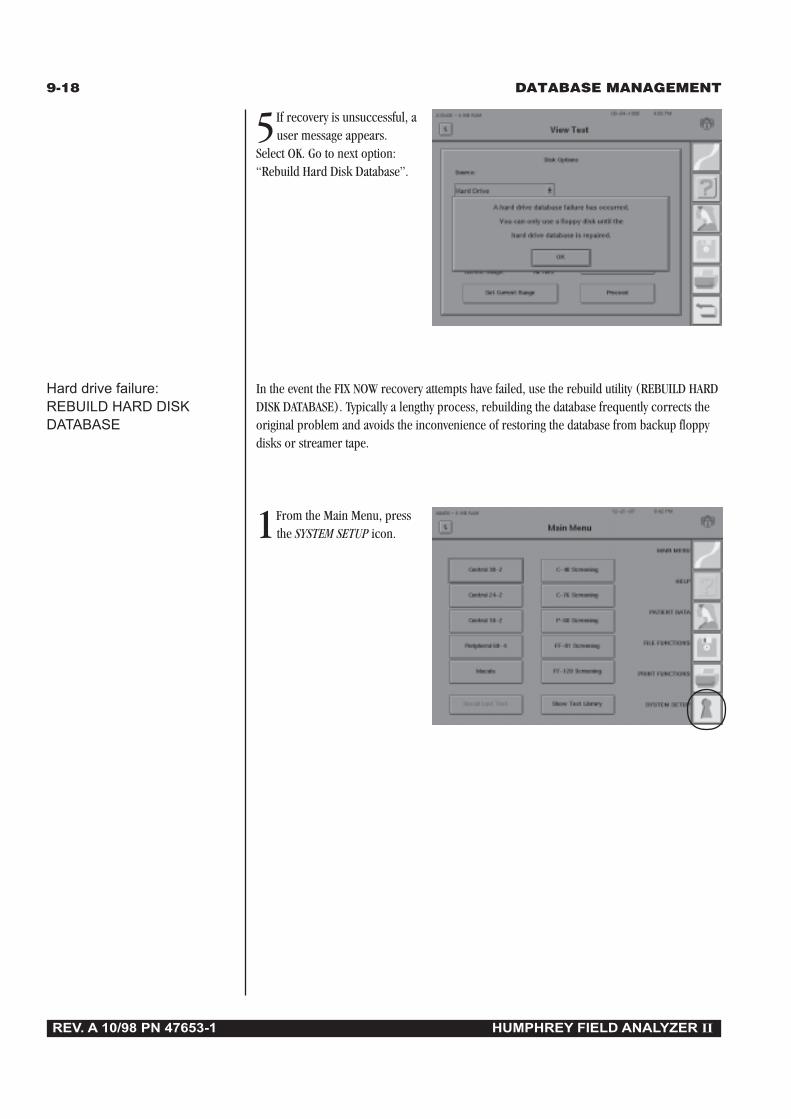
9-18 DATABASE MANAGEMENT
REV. A 10/98 PN 47653-1 HUMPHREY FIELD ANALYZER II
5If recovery is unsuccessful, auser message appears.
Select OK. Go to next option:“Rebuild Hard Disk Database”.
Hard drive failure: In the event the FIX NOW recovery attempts have failed, use the rebuild utility (REBUILD HARDREBUILD HARD DISK DISK DATABASE). Typically a lengthy process, rebuilding the database frequently corrects theDATABASE original problem and avoids the inconvenience of restoring the database from backup floppy
disks or streamer tape.
1From the Main Menu, pressthe SYSTEM SETUP icon.
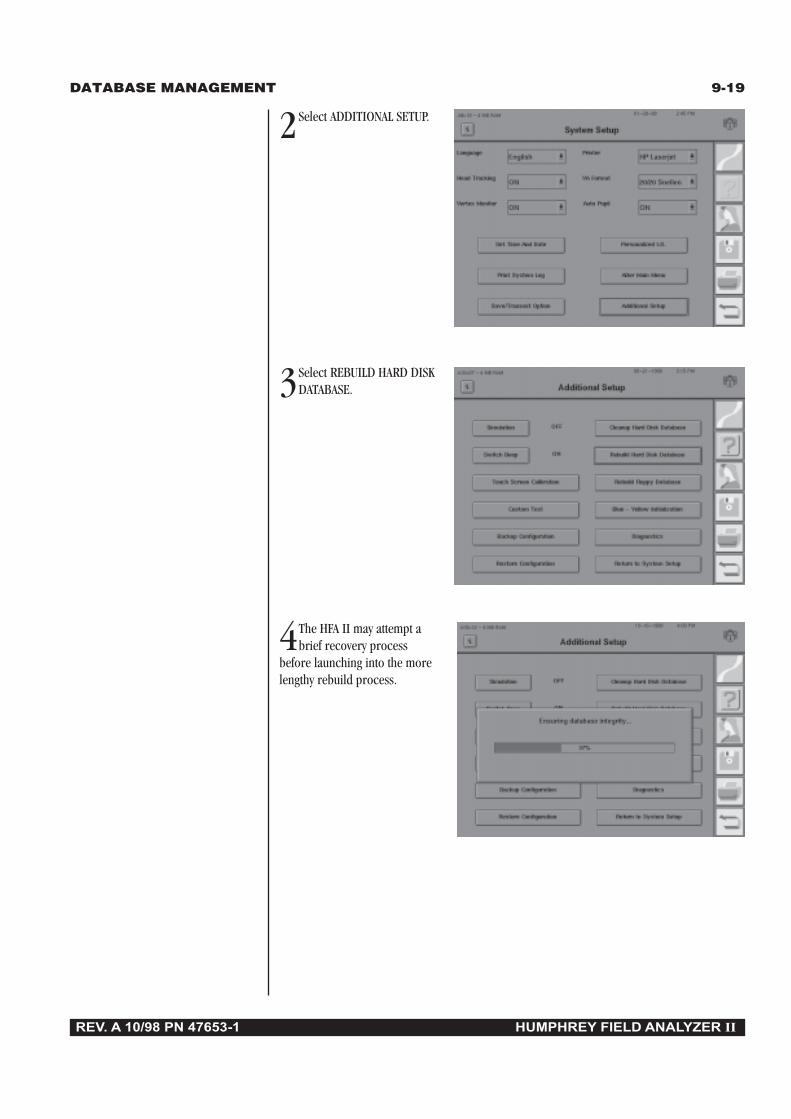
DATABASE MANAGEMENT 9-19
REV. A 10/98 PN 47653-1 HUMPHREY FIELD ANALYZER II
2Select ADDITIONAL SETUP.
3Select REBUILD HARD DISKDATABASE.
4The HFA II may attempt abrief recovery process
before launching into the morelengthy rebuild process.
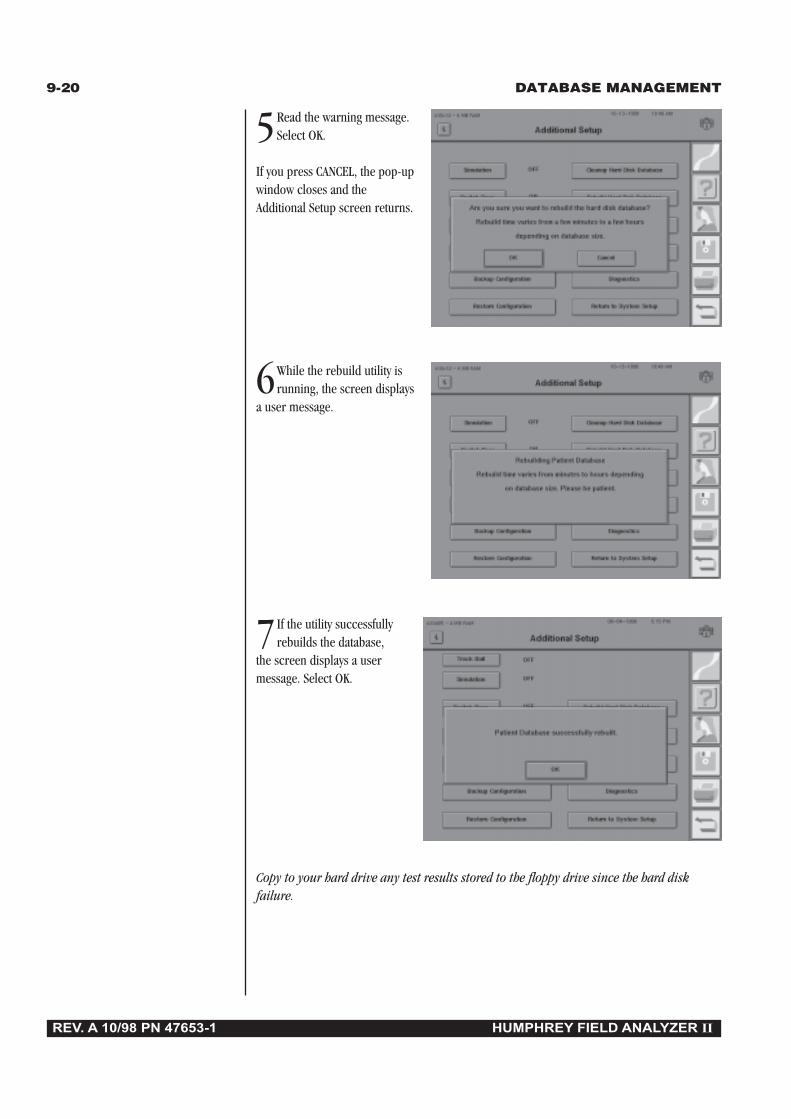
9-20 DATABASE MANAGEMENT
REV. A 10/98 PN 47653-1 HUMPHREY FIELD ANALYZER II
5Read the warning message.Select OK.
If you press CANCEL, the pop-upwindow closes and theAdditional Setup screen returns.
6While the rebuild utility isrunning, the screen displays
a user message.
7If the utility successfullyrebuilds the database,
the screen displays a usermessage. Select OK.
Copy to your hard drive any test results stored to the floppy drive since the hard diskfailure.
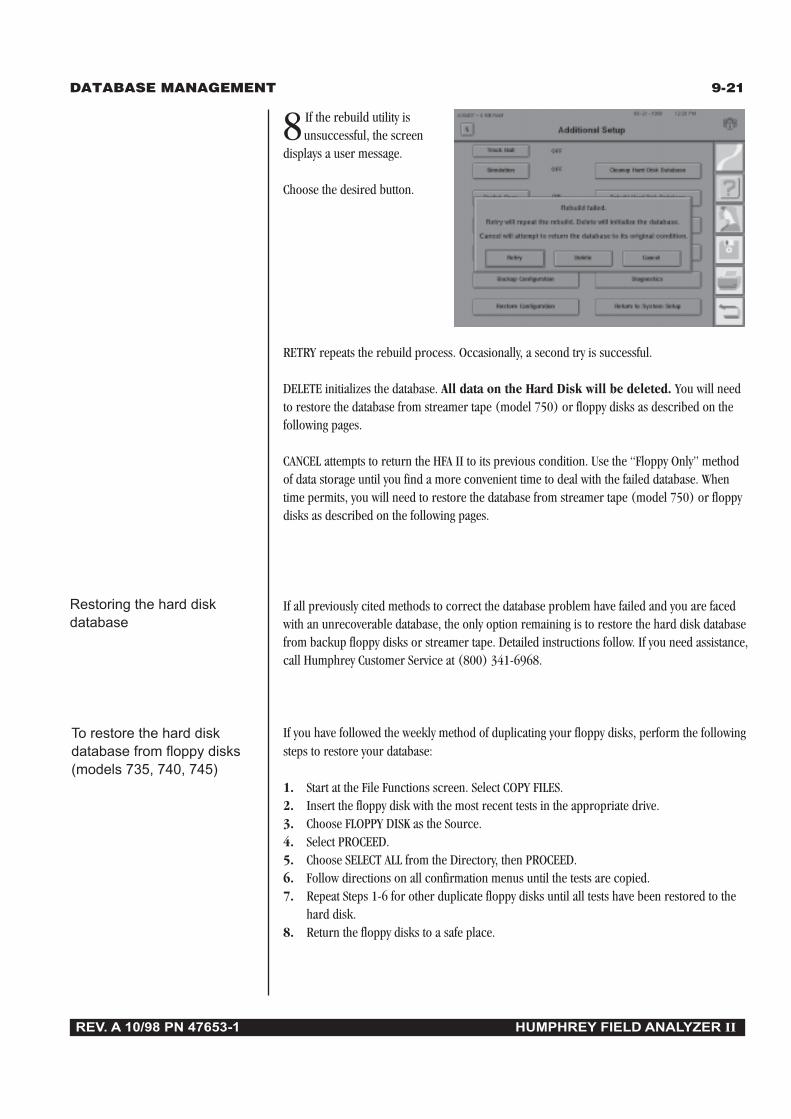
DATABASE MANAGEMENT 9-21
REV. A 10/98 PN 47653-1 HUMPHREY FIELD ANALYZER II
8 If the rebuild utility isunsuccessful, the screen
displays a user message.
Choose the desired button.
RETRY repeats the rebuild process. Occasionally, a second try is successful.
DELETE initializes the database. All data on the Hard Disk will be deleted. You will needto restore the database from streamer tape (model 750) or floppy disks as described on thefollowing pages.
CANCEL attempts to return the HFA II to its previous condition. Use the “Floppy Only” methodof data storage until you find a more convenient time to deal with the failed database. Whentime permits, you will need to restore the database from streamer tape (model 750) or floppydisks as described on the following pages.
If all previously cited methods to correct the database problem have failed and you are facedwith an unrecoverable database, the only option remaining is to restore the hard disk databasefrom backup floppy disks or streamer tape. Detailed instructions follow. If you need assistance,call Humphrey Customer Service at (800) 341-6968.
If you have followed the weekly method of duplicating your floppy disks, perform the followingsteps to restore your database:
1. Start at the File Functions screen. Select COPY FILES.2. Insert the floppy disk with the most recent tests in the appropriate drive.3. Choose FLOPPY DISK as the Source.4. Select PROCEED.5. Choose SELECT ALL from the Directory, then PROCEED.6. Follow directions on all confirmation menus until the tests are copied.7. Repeat Steps 1-6 for other duplicate floppy disks until all tests have been restored to the
hard disk.8. Return the floppy disks to a safe place.
Restoring the hard diskdatabase
To restore the hard diskdatabase from floppy disks(models 735, 740, 745)

9-22 DATABASE MANAGEMENT
REV. A 10/98 PN 47653-1 HUMPHREY FIELD ANALYZER II
If you have backed up your entire database onto a series of backup floppy disks, perform thefollowing steps to restore your database:
1. Start at the File Functions screen. Select BACKUP/RESTORE.2. Choose FLOPPY as the Source. Press PROCEED.3. You are given the option of replacing the database or merging the database.
Press REPLACE.4. Insert the first backup floppy disk. Press OK.5. Insert the remaining disks, as requested.6. When complete, return the backup floppy disks to a safe place.7. Copy to your hard drive all tests stored to the chronological floppy disk since your last
backup.
Note: The option referred to in Step 3 will not be available if the hard disk database hasbeen disabled following a database failure. The hard disk is disabled as a result ofchoosing SAVE TO FLOPPY ONLY.
Caution: Humphrey Systems does NOT recommend a floppy disk backup of theentire database as your only method of data backup. If during restoration one ofthe disks is damaged, the entire set of disks becomes unusable.
Model 750 owners can restore information to the hard disk from the backup streamer tapeusing the BACKUP/RESTORE feature. In order to make sure that the information restored toyour hard disk is up-to-date, it is important to make backups of your hard disk frequently.
1. Start at the File Functions screen. Select BACKUP/RESTORE.2. Insert the streamer tape into the tape drive.3. Choose TAPE as the Source.4. Select PROCEED.5. You are given the option of replacing the database or merging the database.
Press REPLACE.6. A screen will appear showing the progress of the restoration. When completed, be sure to
return the tape to a safe place.7. Copy to your hard disk any tests stored only to the floppy disk since your last tape backup.
Note: The option referred to in Step 5 will not be available if the hard disk database hasbeen disabled following a database failure. The hard disk is disabled as a result ofchoosing SAVE TO FLOPPY ONLY.
A floppy disk can have problems similar to a hard disk when it comes to database retrieval.Occasionally, data cannot be accessed from a floppy disk. Rebuilding the floppy disk databasemay fix the problem.
1. From the Additional Setup screen, press REBUILD FLOPPY DATABASE. A message willappear asking “Are you sure you want to rebuild the floppy disk database?”. Press OK tostart the rebuild process or CANCEL to return to the Additional Setup screen.
To restore hard diskdatabase from streamertape (model 750)
To restore the hard diskdatabase from backupfloppy disks(models 735, 740, 745)
Floppy disk failure:REBUILD FLOPPY DISKDATABASE
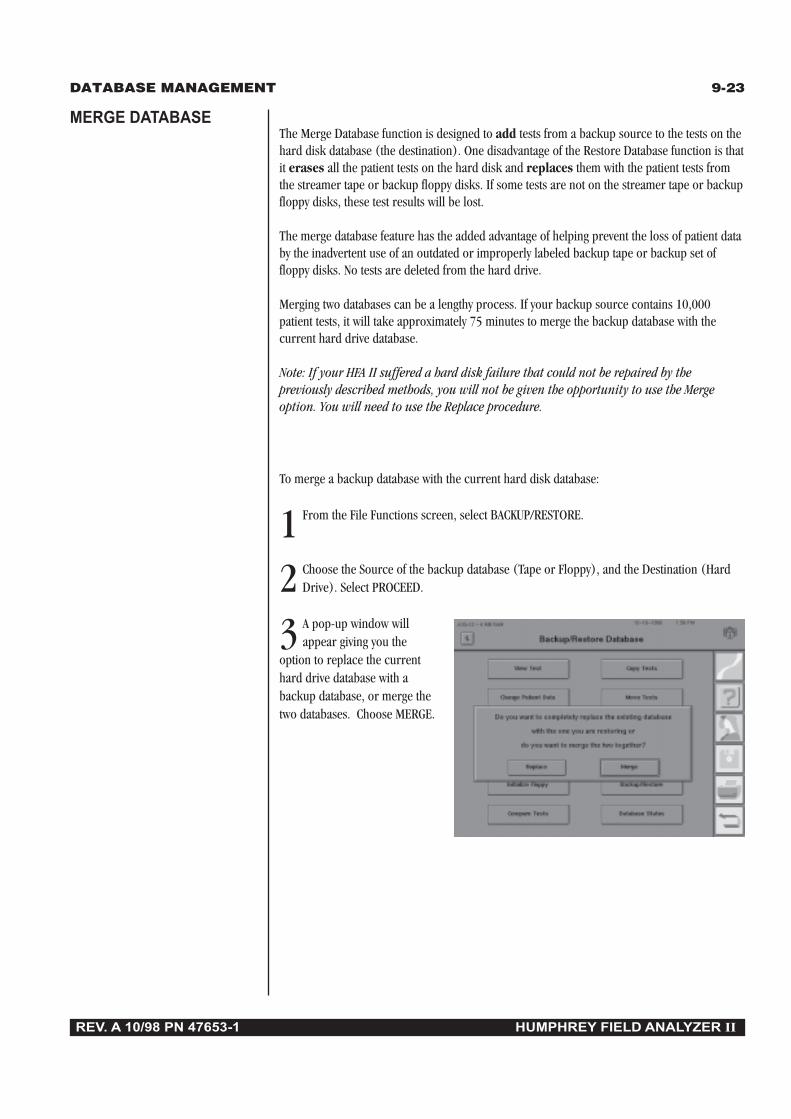
DATABASE MANAGEMENT 9-23
REV. A 10/98 PN 47653-1 HUMPHREY FIELD ANALYZER II
The Merge Database function is designed to add tests from a backup source to the tests on thehard disk database (the destination). One disadvantage of the Restore Database function is thatit erases all the patient tests on the hard disk and replaces them with the patient tests fromthe streamer tape or backup floppy disks. If some tests are not on the streamer tape or backupfloppy disks, these test results will be lost.
The merge database feature has the added advantage of helping prevent the loss of patient databy the inadvertent use of an outdated or improperly labeled backup tape or backup set offloppy disks. No tests are deleted from the hard drive.
Merging two databases can be a lengthy process. If your backup source contains 10,000patient tests, it will take approximately 75 minutes to merge the backup database with thecurrent hard drive database.
Note: If your HFA II suffered a hard disk failure that could not be repaired by thepreviously described methods, you will not be given the opportunity to use the Mergeoption. You will need to use the Replace procedure.
To merge a backup database with the current hard disk database:
1 From the File Functions screen, select BACKUP/RESTORE.
2 Choose the Source of the backup database (Tape or Floppy), and the Destination (HardDrive). Select PROCEED.
3 A pop-up window willappear giving you the
option to replace the currenthard drive database with abackup database, or merge thetwo databases. Choose MERGE.
MERGE DATABASE

9-24 DATABASE MANAGEMENT
REV. A 10/98 PN 47653-1 HUMPHREY FIELD ANALYZER II
CLEANUP HARD DISKDATABASE
4 Insert the backup database tape or first backup floppy disk, and select OK. A pop-upwindow with the phrase “Restoring from tape/floppy” and a progress indicator will
appear. The HFA II is analyzing the tape or floppy disk to determine how long it will take tomerge the two databases.
5 When the analysis iscomplete, a screen will
appear indicating the time it willtake to merge the two databases.Press CONTINUE to complete themerge procedure or pressCANCEL to stop it.
When the merge is complete, and the database integrity ensured, you will be returned to theFile Functions screen.
This feature deletes files containing patient data with no associated test data. This can occurwhen patient data is entered, but the test is not saved. This can also happen when patient datais entered early in the day for convenience, but the patient does not take the visual field test.Pressing the CLEANUP HARD DISK DATABASE button will remove all the “unassociated” datafrom the database.
In addition to removing extra patient data, this feature also acts as a hard disk utility byreorganizing internal files and storage, thereby freeing up hard disk space. Some rearrange-ment of the data structure will take place which may improve database access.
Caution: Some offices enter patient data (and trial lens information) but do notsave all test results. The next time the patient is tested, the patient data is stillavailable via the RECALL PATIENT DATA feature. Using the CLEANUP HARD DISKDATABASE feature will remove this type of patient data information (not linked toactual test results).

DATABASE MANAGEMENT 9-25
REV. A 10/98 PN 47653-1 HUMPHREY FIELD ANALYZER II
Some offices have more than one HFA II to serve their patients. Some practices have more thanone office. It is often convenient to keep the same patient test data on every instrument. Thisway, returning patients may be tested on any of the practice’s HFA IIs and each instrument willhave a complete record of previous tests. This is especially important when you desire anOverview or Glaucoma Change Probability printout which displays multiple visual field results.Having all patient data on all instruments also ensures that the doctor will not accidentally omitany test results when analyzing these printouts.
Humphrey Systems recommends the following method to maintain identical patient databaseson multiple HFA IIs:
1. Keep a floppy disk in the floppy drive of each instrument.2. Every two weeks, remove the floppy disk from each HFA II.3. Copy its contents onto the hard drive of each of the other instruments.
A. From the File Functions screen, choose COPY TESTS.B. Set the Source to FLOPPY and the Destination to HARD DRIVE.C. Select PROCEED.D. Press SELECT ALL.E. Choose PROCEED.
4. When the copying is completed, return the floppy disk to its original HFA II.
Note: If there are tests on the floppy disk that have been previously copied to the hard disk,these tests will be recopied to the hard drive without creating any duplicate tests.
If all of the HFA IIs are kept current, the Weekly Tape Drive Backup will only need to beperformed on one of the HFA IIs. Backing up another HFA II, however, provides additionalsecurity by creating a second copy to store off site.
PRACTICES WITHMULTIPLE FIELDANALYZERS
Both floppy disks and streamer tapes encode data magnetically. This delicate information caneasily be corrupted or erased. When handling or storing removable media, follow the warningsbelow:
• Do not expose removable media to a magnetic field. Keep all magnets at least five feetaway.
• Do not expose removable media to temperatures above 120° F (50° C) or below 50° F(10° C).
• Never tamper with the insides of a disk or tape.• Never get removable media wet.• Write protect removable media before performing restorations from them.• Only use high quality 1.44 MB “Double-Sided, High-Density” floppy diskettes.
CARE AND HANDLINGOF REMOVABLESTORAGE MEDIA

9-26 DATABASE MANAGEMENT
REV. A 10/98 PN 47653-1 HUMPHREY FIELD ANALYZER II

REV. A 10/98 PN 47653-1 HUMPHREY FIELD ANALYZER II
Creating Custom Tests 10-2
Deleting Custom Tests 10-15
Performing Custom Tests 10-17
Printout Format 10-19
The Custom Testing feature of the Humphrey Field Analyzer II givesthe user the flexibility to focus on any aspect of the visual field. Bydesigning either a threshold or screening test pattern, the user maycreate a unique visual field test to apply to any diagnostic situation.
This chapter discusses how you can create your own Custom tests.Once created, these tests may be saved to the hard disk or to afloppy disk. Custom tests can be used as desired, and the resultsmay be printed out and saved.
Note: SITA-Standard and SITA-Fast are not available for usewith Custom tests.
Custom Testing 10
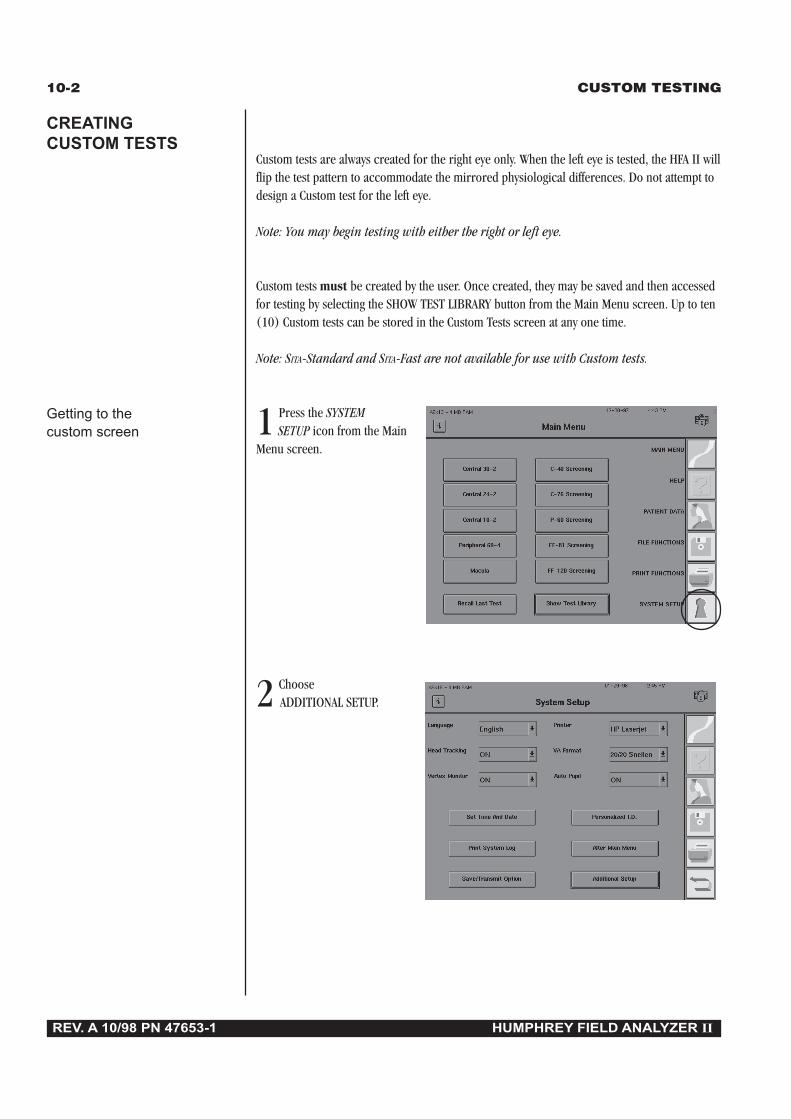
10-2 CUSTOM TESTING
REV. A 10/98 PN 47653-1 HUMPHREY FIELD ANALYZER II
Custom tests are always created for the right eye only. When the left eye is tested, the HFA II willflip the test pattern to accommodate the mirrored physiological differences. Do not attempt todesign a Custom test for the left eye.
Note: You may begin testing with either the right or left eye.
Custom tests must be created by the user. Once created, they may be saved and then accessedfor testing by selecting the SHOW TEST LIBRARY button from the Main Menu screen. Up to ten(10) Custom tests can be stored in the Custom Tests screen at any one time.
Note: SITA-Standard and SITA-Fast are not available for use with Custom tests.
1 Press the SYSTEMSETUP icon from the Main
Menu screen.
2 Choose ADDITIONAL SETUP.
CREATINGCUSTOM TESTS
Getting to thecustom screen

CUSTOM TESTING 10-3
REV. A 10/98 PN 47653-1 HUMPHREY FIELD ANALYZER II
3Select CUSTOM TEST.
4Choose one of theCustom Test Options.
The following are the Custom Test Options:
CREATE THRESHOLD TESTThis button allows the user to design a Custom Threshold visual field test.
CREATE SCREENING TESTThis button allows the user to design a Custom Screening visual field test.
DELETE CUSTOM TESTThis button allows the user to remove a previously created Custom test pattern from theCustom Tests screen. If chosen, the test pattern is deleted and its button disappears from theCustom Tests screen. If the button had been placed on the Main Menu screen via the Alter MainMenu sequence, it will also disappear.

10-4 CUSTOM TESTING
REV. A 10/98 PN 47653-1 HUMPHREY FIELD ANALYZER II
Once deleted, the test pattern cannot be retrieved unless it had been previously copied to anexternal floppy disk. Refer to Section 9: “Configuration Backup and Restore” for details. As asafety measure, it is suggested that you backup the test patterns before deleting any one ofthem (should a future need for the test arise).
Note: You may not restore an individual Custom test pattern. All test patterns must berestored as a group. Also, the test patterns created after the last backup will be lost when abackup is restored. Therefore, it is recommended that a new floppy disk backup is createdafter each button change.
CANCELChoosing CANCEL returns you to the Additional Setup screen, without creating or deleting aCustom test.
5 When CREATE THRESHOLDTEST or CREATE SCREEN-
ING TEST is chosen, the CustomPoint Options pop-up windowappears.
Use the drop-down menus toselect the desired POINTPATTERN, FIELD SIZE, andPOINT SPACING.
Press SELECTION COMPLETEwhen done.
Point PatternThis allows the user to decide between a Single Point (X, Y) or a Grid point pattern (X, Y).Single Point (X, Y) is used to create test points one-at-a-time on the test field by entering the“X” and “Y” coordinates for each point. Grid (X, Y) is used to place an entire square orrectangular grid of points on the field at one time. There can be a maximum of 248 points in atest.
When entering single points, the “X” coordinate designates the distance in degrees the pointwill be located to the left or right of the center of the test field. For example, an entry of “15”will place the point 15 degrees to the right of the center, while an entry of “-10” will place thepoint 10 degrees to the left of the center.
The “Y” coordinate designates the distance in degrees the point will be located above or belowthe center of the test field. For example, an entry of “6” will place the point 6 degrees abovethe center, while “-12” will place the point 12 degrees below the center. The combination of“X” and “Y” coordinates locates the point in the test pattern.
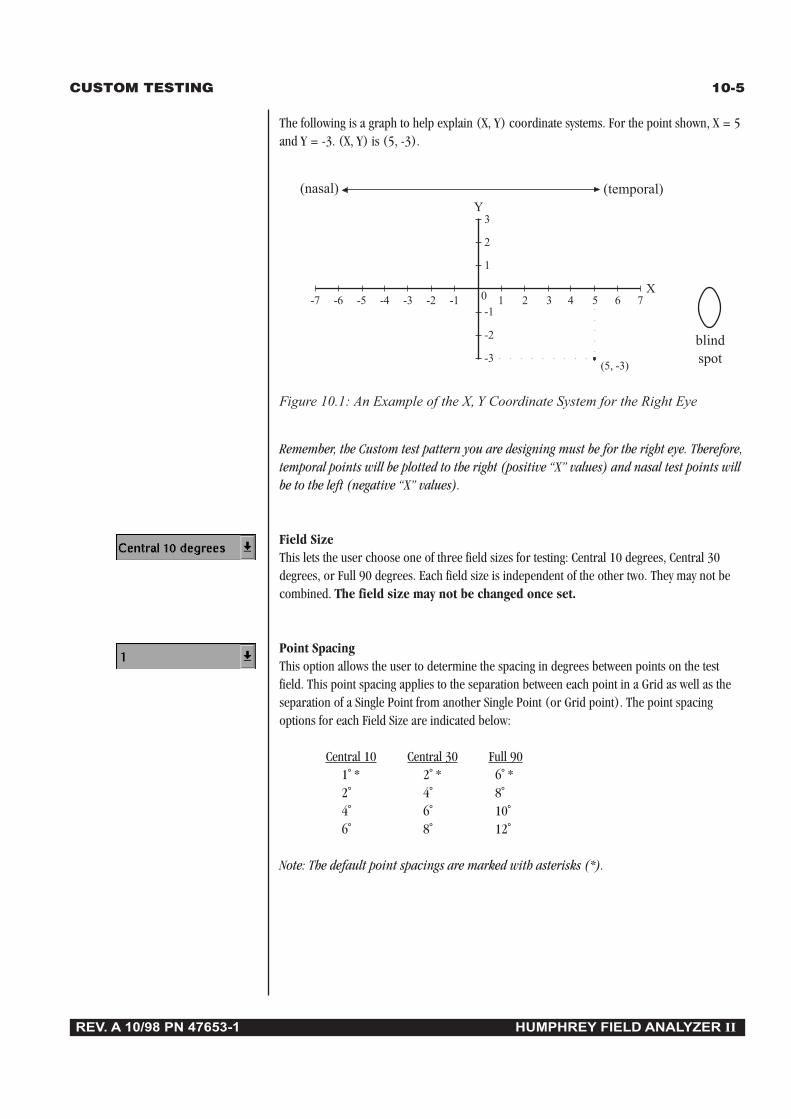
CUSTOM TESTING 10-5
REV. A 10/98 PN 47653-1 HUMPHREY FIELD ANALYZER II
The following is a graph to help explain (X, Y) coordinate systems. For the point shown, X = 5and Y = -3. (X, Y) is (5, -3).
Remember, the Custom test pattern you are designing must be for the right eye. Therefore,temporal points will be plotted to the right (positive “X” values) and nasal test points willbe to the left (negative “X” values).
Field SizeThis lets the user choose one of three field sizes for testing: Central 10 degrees, Central 30degrees, or Full 90 degrees. Each field size is independent of the other two. They may not becombined. The field size may not be changed once set.
Point SpacingThis option allows the user to determine the spacing in degrees between points on the testfield. This point spacing applies to the separation between each point in a Grid as well as theseparation of a Single Point from another Single Point (or Grid point). The point spacingoptions for each Field Size are indicated below:
Central 10 Central 30 Full 90 1˚ * 2˚ * 6˚ * 2˚ 4˚ 8˚ 4˚ 6˚ 10˚ 6˚ 8˚ 12˚
Note: The default point spacings are marked with asterisks (*).
-7 -6 -5 -4 -3 -2 -1 1 2 3 4 5 6 7
1
2
3
-1
-2
-3
0
○ ○ ○ ○ ○ ○ ○ ○ ○
○
○
○
○
○
(5, -3)
Y
X
(nasal) (temporal)
blindspot
Figure 10.1: An Example of the X, Y Coordinate System for the Right Eye
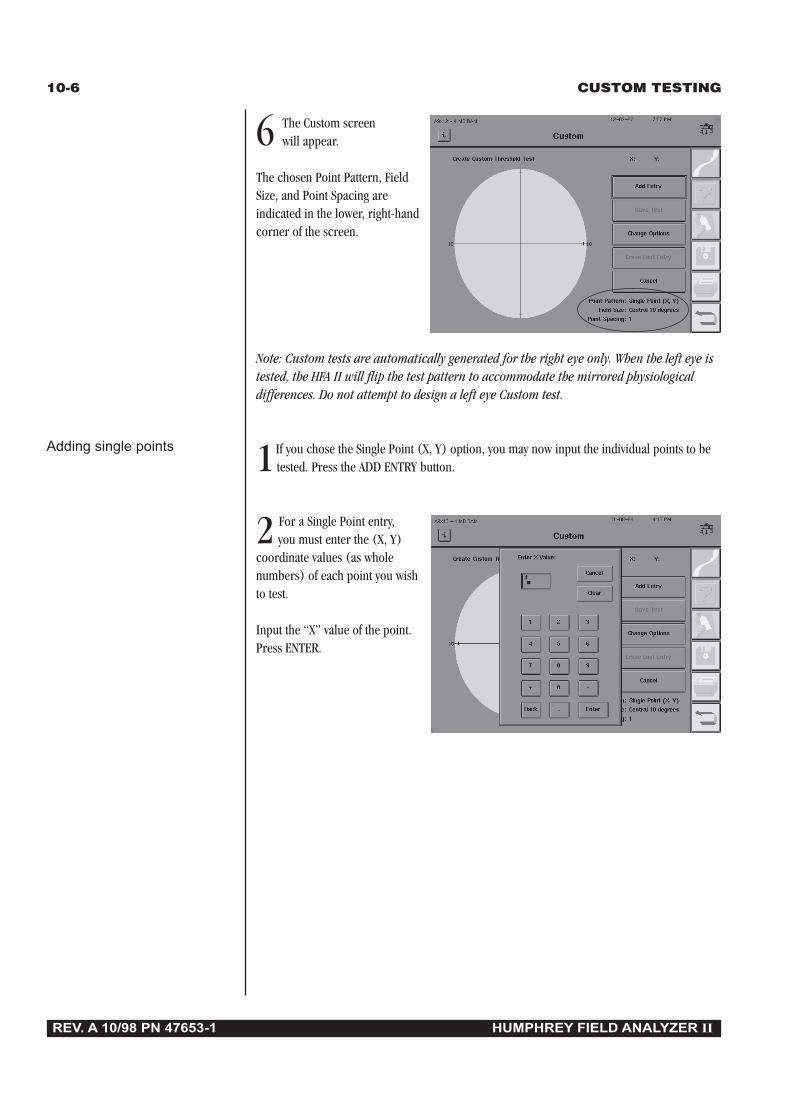
10-6 CUSTOM TESTING
REV. A 10/98 PN 47653-1 HUMPHREY FIELD ANALYZER II
6 The Custom screenwill appear.
The chosen Point Pattern, FieldSize, and Point Spacing areindicated in the lower, right-handcorner of the screen.
Note: Custom tests are automatically generated for the right eye only. When the left eye istested, the HFA II will flip the test pattern to accommodate the mirrored physiologicaldifferences. Do not attempt to design a left eye Custom test.
1If you chose the Single Point (X, Y) option, you may now input the individual points to betested. Press the ADD ENTRY button.
2 For a Single Point entry,you must enter the (X, Y)
coordinate values (as wholenumbers) of each point you wishto test.
Input the “X” value of the point.Press ENTER.
Adding single points

CUSTOM TESTING 10-7
REV. A 10/98 PN 47653-1 HUMPHREY FIELD ANALYZER II
the point
3 Input the “Y” value ofthe same point. Press
ENTER.
4 The Custom screen nowdisplays this point.
The entered point’s (X, Y)coordinate value is displayed inthe upper, right-hand portion ofthe screen.
5 To input an additionalpoint, repeat steps 1
through 4. Your next point willalso appear on the screen.
When you have completed theentry of Custom points, youneed to save the points forfuture testing. See “SavingCustom Tests” later in thissection.
the first point the second point
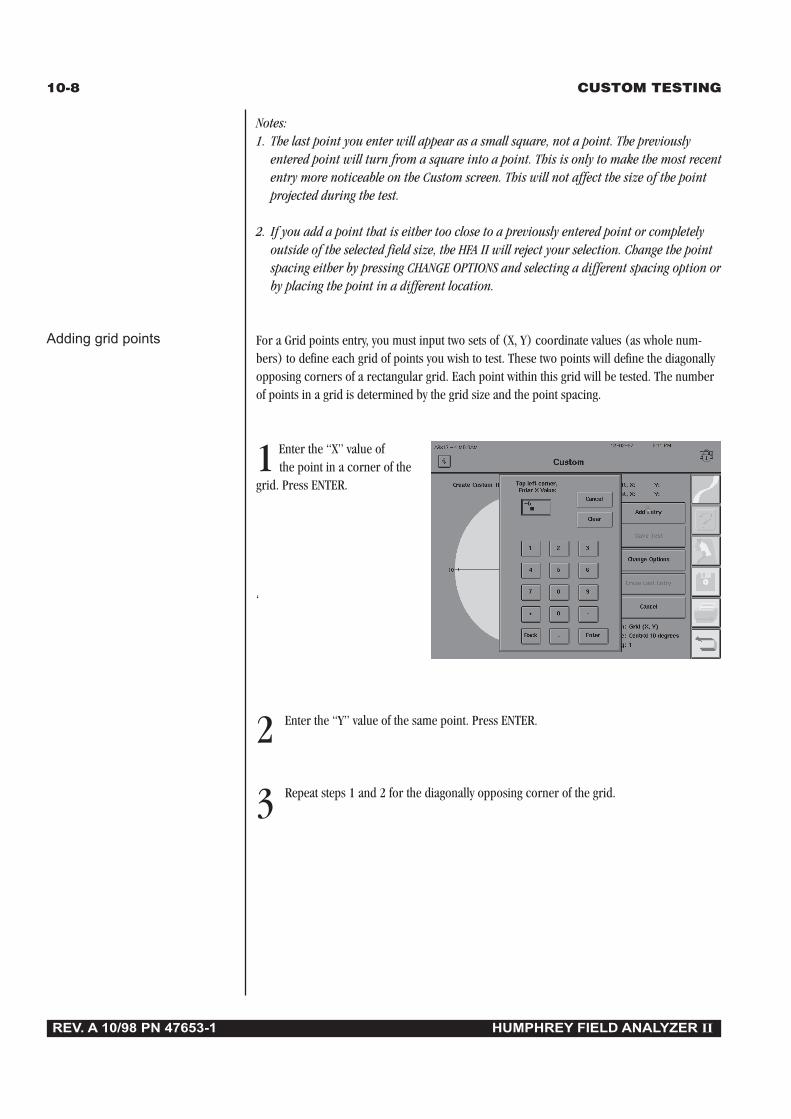
10-8 CUSTOM TESTING
REV. A 10/98 PN 47653-1 HUMPHREY FIELD ANALYZER II
Notes:1. The last point you enter will appear as a small square, not a point. The previously
entered point will turn from a square into a point. This is only to make the most recententry more noticeable on the Custom screen. This will not affect the size of the pointprojected during the test.
2. If you add a point that is either too close to a previously entered point or completelyoutside of the selected field size, the HFA II will reject your selection. Change the pointspacing either by pressing CHANGE OPTIONS and selecting a different spacing option orby placing the point in a different location.
For a Grid points entry, you must input two sets of (X, Y) coordinate values (as whole num-bers) to define each grid of points you wish to test. These two points will define the diagonallyopposing corners of a rectangular grid. Each point within this grid will be tested. The numberof points in a grid is determined by the grid size and the point spacing.
1 Enter the “X” value ofthe point in a corner of the
grid. Press ENTER.
‘
2 Enter the “Y” value of the same point. Press ENTER.
3 Repeat steps 1 and 2 for the diagonally opposing corner of the grid.
Adding grid points
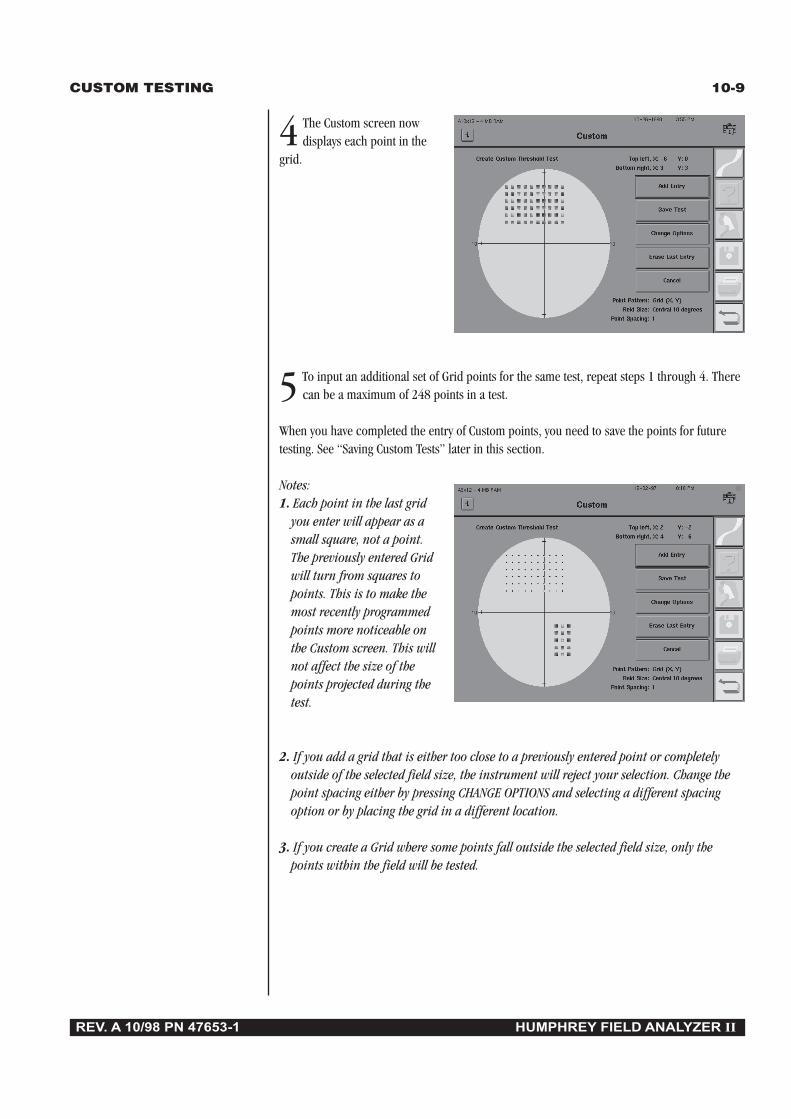
CUSTOM TESTING 10-9
REV. A 10/98 PN 47653-1 HUMPHREY FIELD ANALYZER II
4 The Custom screen nowdisplays each point in the
grid.
5 To input an additional set of Grid points for the same test, repeat steps 1 through 4. Therecan be a maximum of 248 points in a test.
When you have completed the entry of Custom points, you need to save the points for futuretesting. See “Saving Custom Tests” later in this section.
Notes:1. Each point in the last grid
you enter will appear as asmall square, not a point.The previously entered Gridwill turn from squares topoints. This is to make themost recently programmedpoints more noticeable onthe Custom screen. This willnot affect the size of thepoints projected during thetest.
2. If you add a grid that is either too close to a previously entered point or completelyoutside of the selected field size, the instrument will reject your selection. Change thepoint spacing either by pressing CHANGE OPTIONS and selecting a different spacingoption or by placing the grid in a different location.
3. If you create a Grid where some points fall outside the selected field size, only thepoints within the field will be tested.
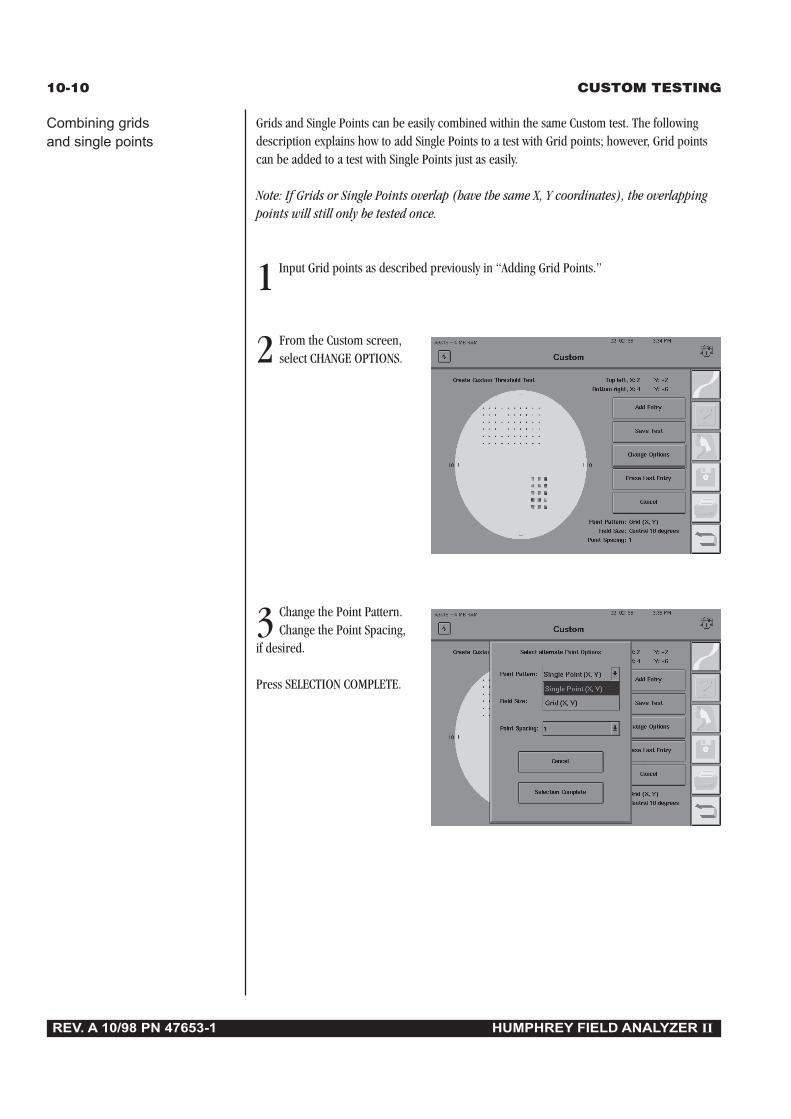
10-10 CUSTOM TESTING
REV. A 10/98 PN 47653-1 HUMPHREY FIELD ANALYZER II
Grids and Single Points can be easily combined within the same Custom test. The followingdescription explains how to add Single Points to a test with Grid points; however, Grid pointscan be added to a test with Single Points just as easily.
Note: If Grids or Single Points overlap (have the same X, Y coordinates), the overlappingpoints will still only be tested once.
1 Input Grid points as described previously in “Adding Grid Points.”
2 From the Custom screen,select CHANGE OPTIONS.
3 Change the Point Pattern.Change the Point Spacing,
if desired.
Press SELECTION COMPLETE.
Combining gridsand single points

CUSTOM TESTING 10-11
REV. A 10/98 PN 47653-1 HUMPHREY FIELD ANALYZER II
4 Press ADD ENTRY.
5 Input Single Points as described previously in “Adding Single Points”.
Figure 10.2: An Example of a Point and Grid Combination

10-12 CUSTOM TESTING
REV. A 10/98 PN 47653-1 HUMPHREY FIELD ANALYZER II
Erasing gridsor single points
Please read this entire section before removing any points. Unwanted Grids or Single Pointscan be removed from a Custom test that you are creating. However, only the last entry can beremoved. If you input a Single Point or Grid that you are unsure of, it is best to erase it andinput it again later. The ERASE LAST ENTRY button is disabled if there are no points.
1 From the Custom screen,press ERASE LAST ENTRY.
The last Single Point or Grid youhave entered will automaticallybe removed from the test field.No warning will be issuedbefore deleting the last entry.
2 Subsequent selections of the ERASE LAST ENTRY button will delete the next previous entry.
When all desired test points have been entered, you must save the test. Saving the Custom testpattern you programmed creates a test button on the Custom Test screen which is specific tothat test. This button is used to recall the test pattern for future use. Be sure to save yourCustom test pattern as described below.
1From the Custom screen,select SAVE TEST.
Saving custom tests

CUSTOM TESTING 10-13
REV. A 10/98 PN 47653-1 HUMPHREY FIELD ANALYZER II
2 A message will appear inthe pop-up window, “Are
you sure you have entered all thepoints for this test?”
Press NO if you need to add morepoints. Press YES if you are readyto advance to the ParameterSetup screen.
3 Make any desiredchanges to the default
parameters.
Press SELECTION COMPLETE.
If you are creating a CustomScreening test, the ScreeningParameter Setup screen willappear.
Note: SITA-Standard and SITA-Fast are not available for use with Custom tests.
4 Name the completedCustom test.
Press YES if you wish to personal-ize the Custom Test. Press NO ifyou wish to use the default name:“Custom Threshold” (or “CustomScreening”).
Note: If you choose not to use unique names to identify your Custom test patterns, thenmore than one Custom test can be named Custom Threshold (or Custom Screening). It isrecommended that you add information as described in the following step.
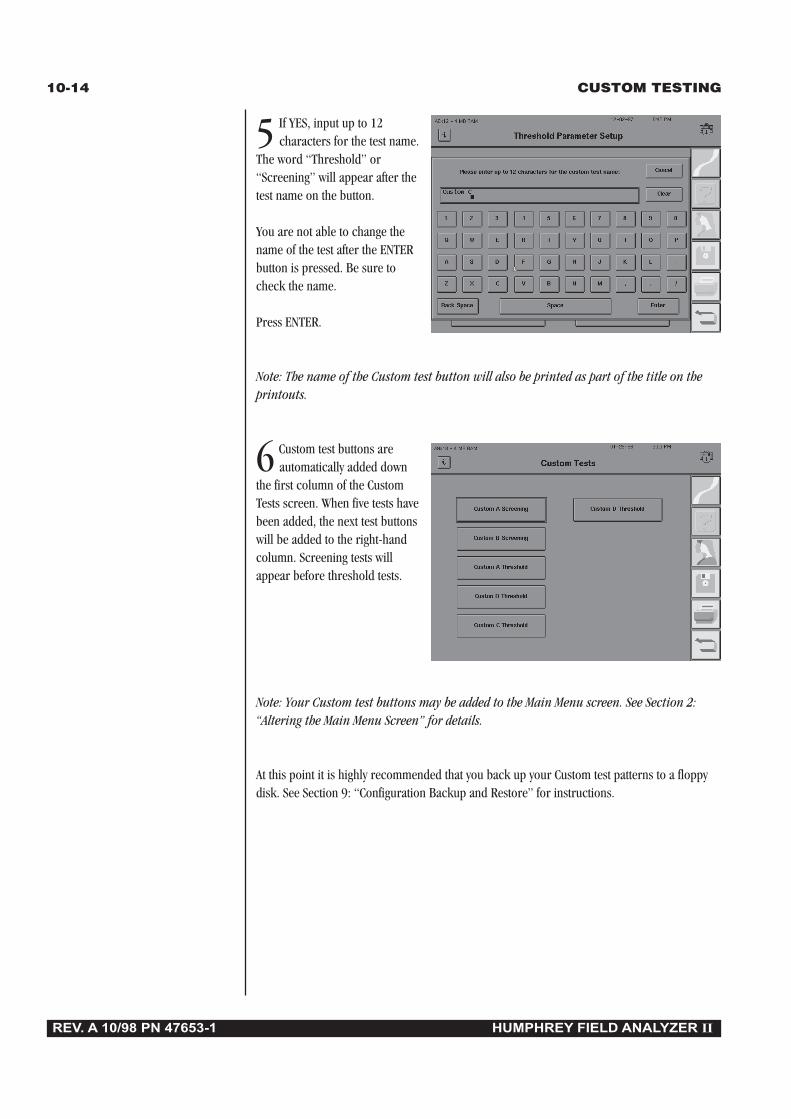
10-14 CUSTOM TESTING
REV. A 10/98 PN 47653-1 HUMPHREY FIELD ANALYZER II
5 If YES, input up to 12characters for the test name.
The word “Threshold” or“Screening” will appear after thetest name on the button.
You are not able to change thename of the test after the ENTERbutton is pressed. Be sure tocheck the name.
Press ENTER.
Note: The name of the Custom test button will also be printed as part of the title on theprintouts.
6 Custom test buttons areautomatically added down
the first column of the CustomTests screen. When five tests havebeen added, the next test buttonswill be added to the right-handcolumn. Screening tests willappear before threshold tests.
Note: Your Custom test buttons may be added to the Main Menu screen. See Section 2:“Altering the Main Menu Screen” for details.
At this point it is highly recommended that you back up your Custom test patterns to a floppydisk. See Section 9: “Configuration Backup and Restore” for instructions.
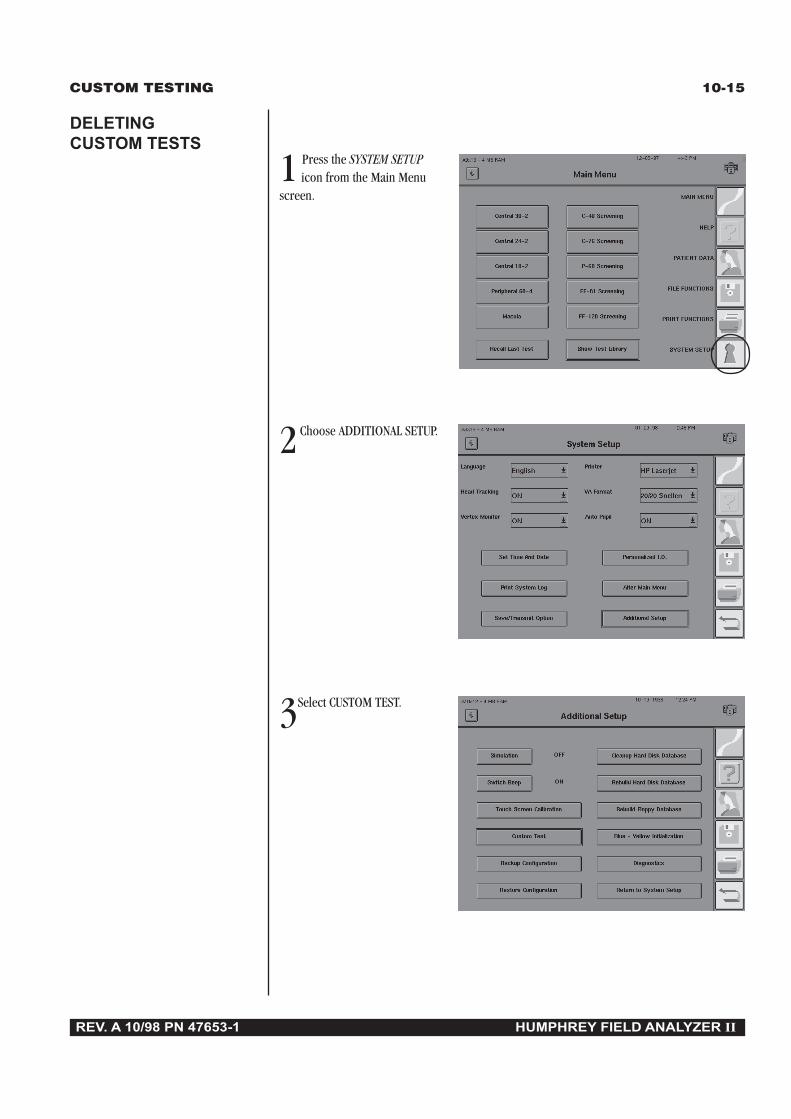
CUSTOM TESTING 10-15
REV. A 10/98 PN 47653-1 HUMPHREY FIELD ANALYZER II
1 Press the SYSTEM SETUPicon from the Main Menu
screen.
2Choose ADDITIONAL SETUP.
3Select CUSTOM TEST.
DELETINGCUSTOM TESTS
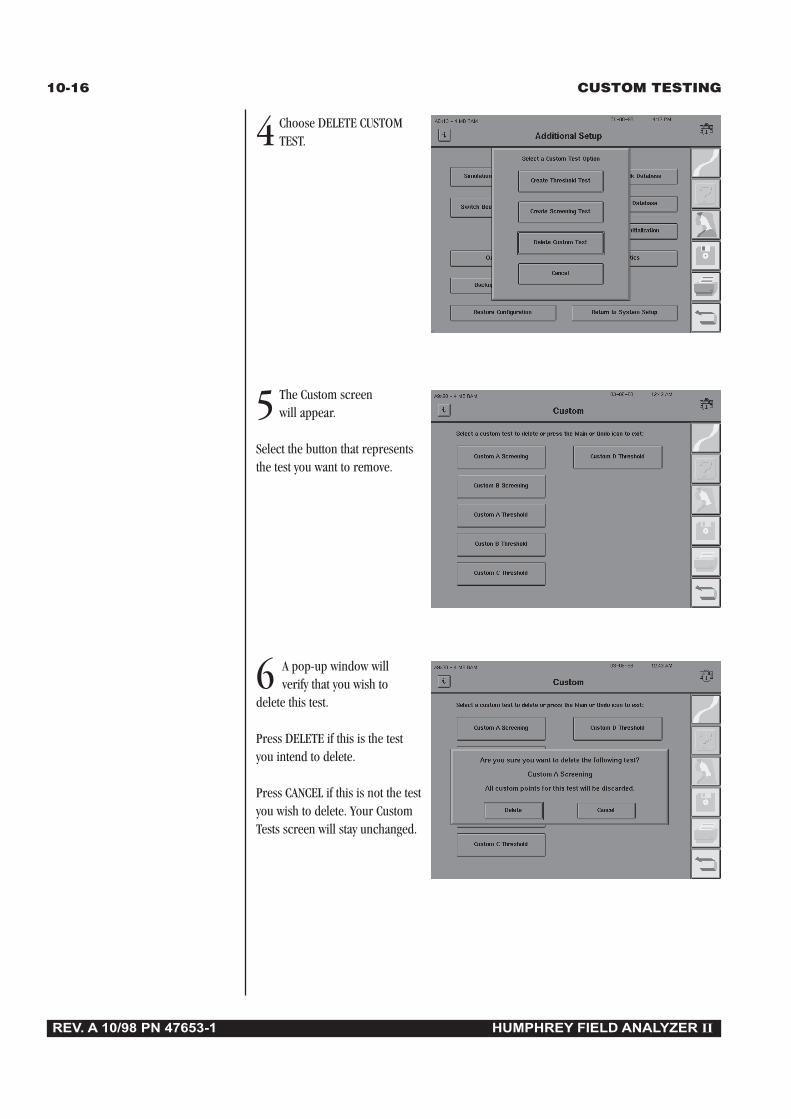
10-16 CUSTOM TESTING
REV. A 10/98 PN 47653-1 HUMPHREY FIELD ANALYZER II
4 Choose DELETE CUSTOMTEST.
5 The Custom screenwill appear.
Select the button that representsthe test you want to remove.
6 A pop-up window willverify that you wish to
delete this test.
Press DELETE if this is the testyou intend to delete.
Press CANCEL if this is not the testyou wish to delete. Your CustomTests screen will stay unchanged.
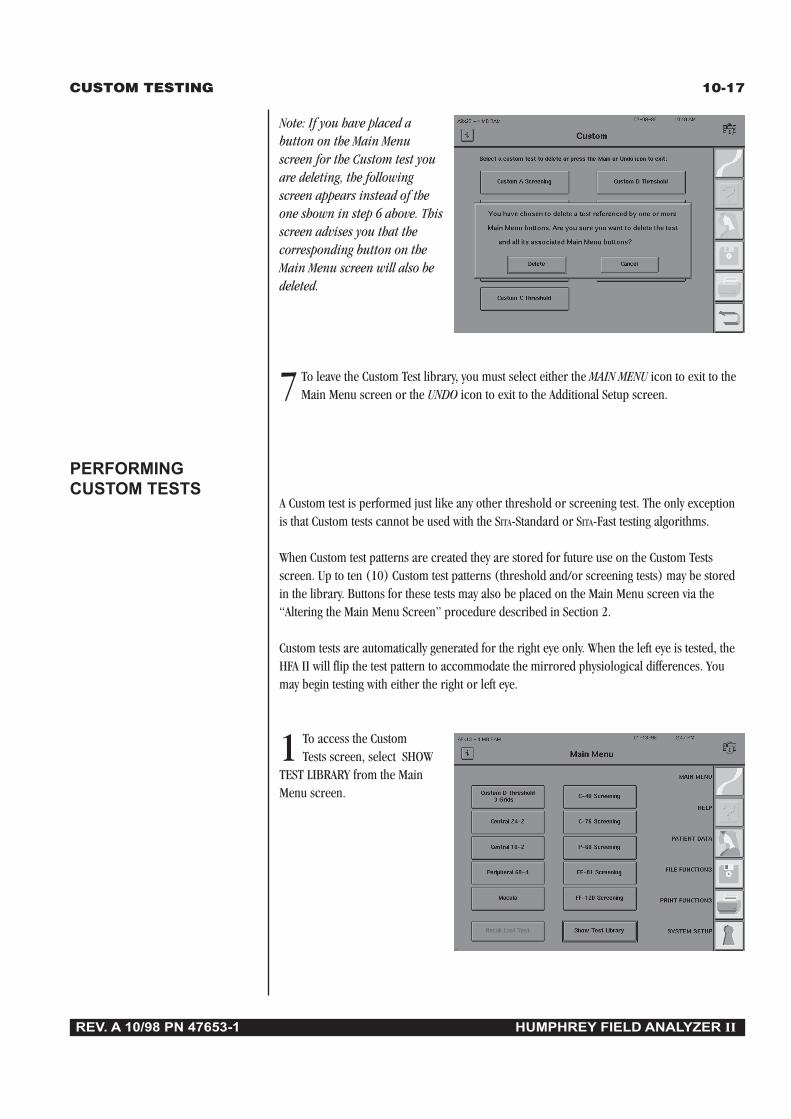
CUSTOM TESTING 10-17
REV. A 10/98 PN 47653-1 HUMPHREY FIELD ANALYZER II
Note: If you have placed abutton on the Main Menuscreen for the Custom test youare deleting, the followingscreen appears instead of theone shown in step 6 above. Thisscreen advises you that thecorresponding button on theMain Menu screen will also bedeleted.
7 To leave the Custom Test library, you must select either the MAIN MENU icon to exit to theMain Menu screen or the UNDO icon to exit to the Additional Setup screen.
A Custom test is performed just like any other threshold or screening test. The only exceptionis that Custom tests cannot be used with the SITA-Standard or SITA-Fast testing algorithms.
When Custom test patterns are created they are stored for future use on the Custom Testsscreen. Up to ten (10) Custom test patterns (threshold and/or screening tests) may be storedin the library. Buttons for these tests may also be placed on the Main Menu screen via the“Altering the Main Menu Screen” procedure described in Section 2.
Custom tests are automatically generated for the right eye only. When the left eye is tested, theHFA II will flip the test pattern to accommodate the mirrored physiological differences. Youmay begin testing with either the right or left eye.
1 To access the CustomTests screen, select SHOW
TEST LIBRARY from the MainMenu screen.
PERFORMINGCUSTOM TESTS
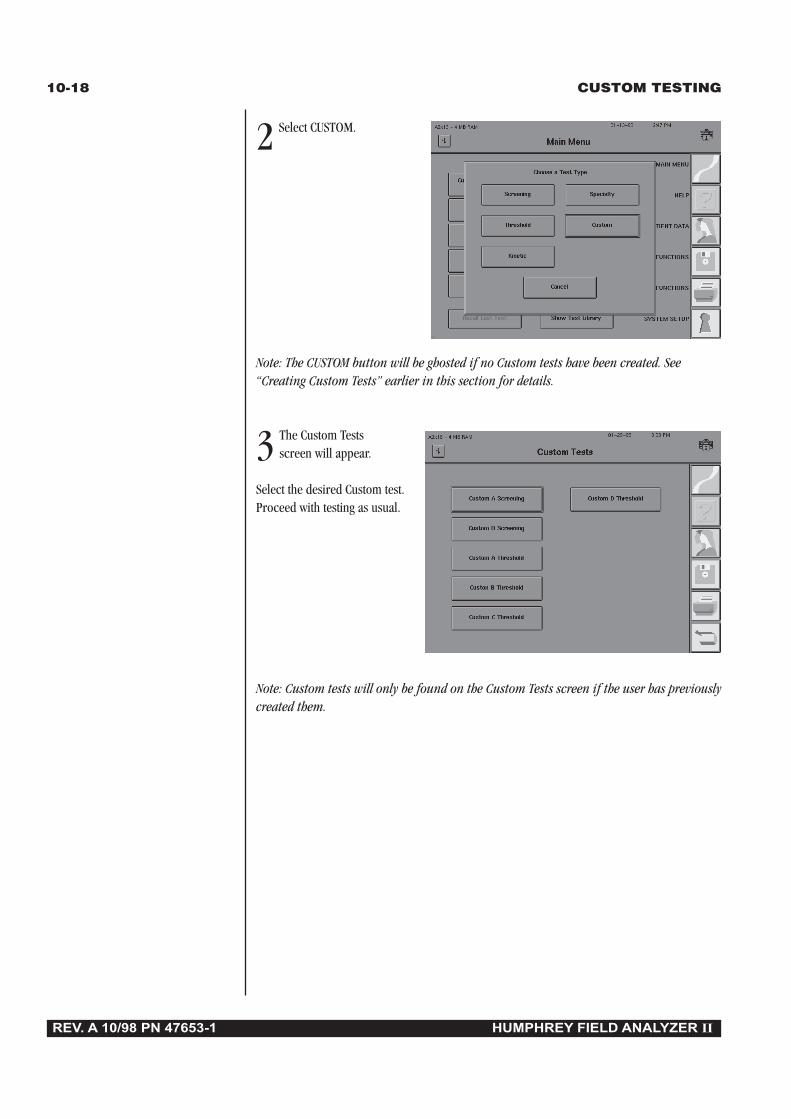
10-18 CUSTOM TESTING
REV. A 10/98 PN 47653-1 HUMPHREY FIELD ANALYZER II
2 Select CUSTOM.
Note: The CUSTOM button will be ghosted if no Custom tests have been created. See“Creating Custom Tests” earlier in this section for details.
3 The Custom Testsscreen will appear.
Select the desired Custom test.Proceed with testing as usual.
Note: Custom tests will only be found on the Custom Tests screen if the user has previouslycreated them.

CUSTOM TESTING 10-19
REV. A 10/98 PN 47653-1 HUMPHREY FIELD ANALYZER II
PRINTOUTFORMAT
There are two printout formats: one for Screening tests and one for Threshold tests. The format isdetermined by the testing strategy used and cannot be changed.
ScreeningPrintouts for Custom Screening tests will look similar to the existing Screening printouts. Asingle printout style will be available for each Custom Screening test except when points existin both the central and peripheral visual field. When a Custom visual field is larger than 30degrees and the “Quantified Defects” strategy is being used, an additional Central 30 degreefield will be printed if a point has been quantified within the central 30 degrees. In all othersituations, only one printout is made.
ThresholdCustom Threshold printouts will contain only the numeric dB values for each point. The visualfield takes up the majority of the page. There will be no gray scale, defect depth, or STATPAC™
analysis on these printouts.
Figure 10.3: An Example of a Custom Threshold Printout

10-20 CUSTOM TESTING
REV. A 10/98 PN 47653-1 HUMPHREY FIELD ANALYZER II
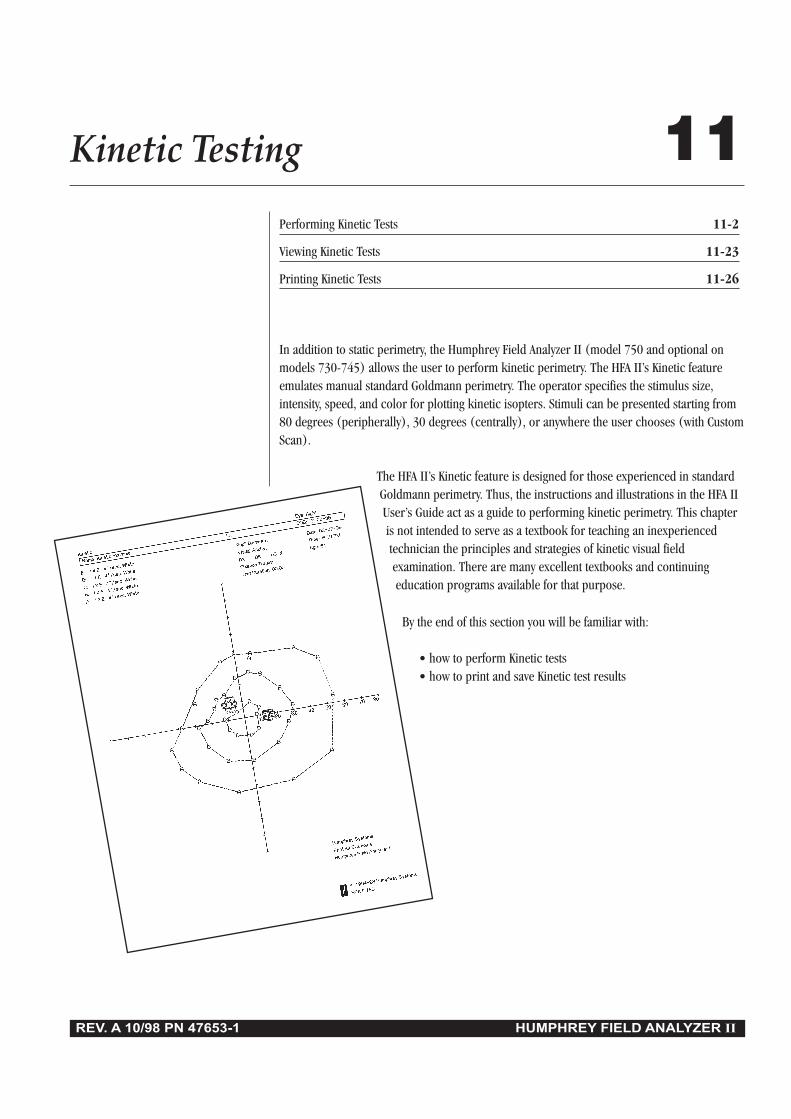
REV. A 10/98 PN 47653-1 HUMPHREY FIELD ANALYZER II
Kinetic Testing 11Performing Kinetic Tests 11-2
Viewing Kinetic Tests 11-23
Printing Kinetic Tests 11-26
In addition to static perimetry, the Humphrey Field Analyzer II (model 750 and optional onmodels 730-745) allows the user to perform kinetic perimetry. The HFA II’s Kinetic featureemulates manual standard Goldmann perimetry. The operator specifies the stimulus size,intensity, speed, and color for plotting kinetic isopters. Stimuli can be presented starting from80 degrees (peripherally), 30 degrees (centrally), or anywhere the user chooses (with CustomScan).
The HFA II’s Kinetic feature is designed for those experienced in standardGoldmann perimetry. Thus, the instructions and illustrations in the HFA IIUser’s Guide act as a guide to performing kinetic perimetry. This chapteris not intended to serve as a textbook for teaching an inexperiencedtechnician the principles and strategies of kinetic visual fieldexamination. There are many excellent textbooks and continuingeducation programs available for that purpose.
By the end of this section you will be familiar with:
• how to perform Kinetic tests• how to print and save Kinetic test results

11-2 KINETIC TESTING
REV. A 10/98 PN 47653-1 HUMPHREY FIELD ANALYZER II
This section is formatted to highlight critical steps in performing kinetic perimetry. You caneither refer to each step as needed or read the following pages as a tutorial.
1 From the Main Menuscreen, select SHOW TEST
LIBRARY.
Note: A KINETIC button may be placed on the Main Menu screen via the Alter Main Menusequence described in Section 2: “Altering the Main Menu Screen.”
2 Select KINETIC.
Getting to thekinetic test screen
PERFORMINGKINETIC TESTS
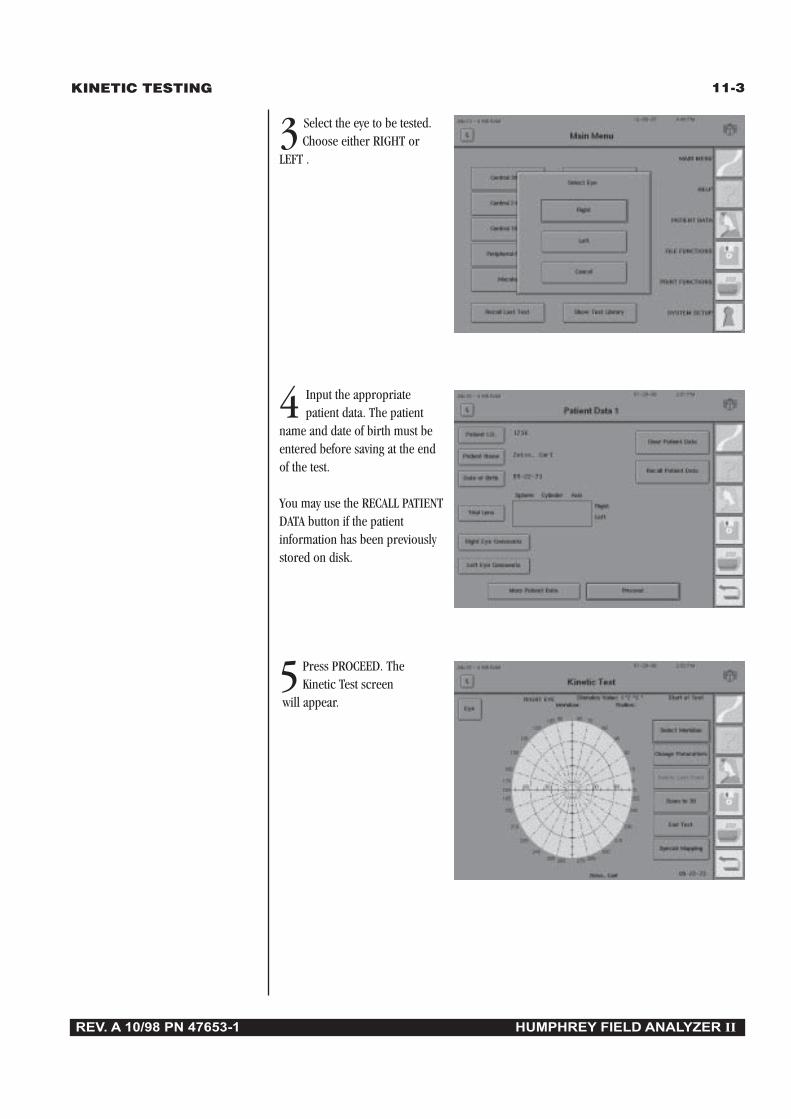
11-3
REV. A 10/98 PN 47653-1 HUMPHREY FIELD ANALYZER II
KINETIC TESTING
3 Select the eye to be tested.Choose either RIGHT or
LEFT .
4 Input the appropriate patient data. The patient
name and date of birth must beentered before saving at the endof the test.
You may use the RECALL PATIENTDATA button if the patientinformation has been previouslystored on disk.
5 Press PROCEED. TheKinetic Test screen
will appear.

11-4 KINETIC TESTING
REV. A 10/98 PN 47653-1 HUMPHREY FIELD ANALYZER II
Kinetic Testing always uses the central fixation target. Gaze Tracking and Blind Spot Monitoringare not available. The current stimulus value setting will be displayed in standard Goldmannnotation in the top, middle portion of the Kinetic Test screen.
The default settings for the kinetic stimulus are:
• Stimulus Color: White• Stimulus Value: I2E (20 dB)• Stimulus Speed: 4 degrees per second
Unless the default settings are changed, Kinetic Testing will begin in the peripheral field atapproximately 75˚ nasally and temporally or 55˚ in the superior and inferior fields.
Each Kinetic test can have up to eight (8) sets of parameters that define different isopters. Theresults of the first isopter will be marked on the Kinetic test field with the upper-case letter “A”.The second isopter will be indicated with a “B” on the display. Each subsequent new set ofparameters will be marked by the next letter of the alphabet.
1From the Kinetic Test screen,press CHANGE PARAMETERS.
2 Use the drop-down menus tomake any needed changes.
See the following pages forexplanations.
Press SELECTION COMPLETEwhen done. You will return to theKinetic Test screen.
Setting parameters:Using the kineticparameter setup screen

11-5
REV. A 10/98 PN 47653-1 HUMPHREY FIELD ANALYZER II
KINETIC TESTING
Note: Asterisks (*) below denote the default setting.
Stimulus SizeThis drop-down menu allows the user to set the size of the test stimulus. Sizes can be set to oneof the five standard Goldmann test stimulus sizes. They are designated by Roman numerals I*through V.
Stimulus IntensityThis drop-down menu lists numbers corresponding to the first (“coarse”) Goldmann intensityfilter, which helps to determine the intensity of the stimulus. The values corresponding to thevarious standard Goldmann filters are:
Goldmann HumphreyFilter Number Intensity
1 25 dB 2* 20 dB 3 15 dB 4 10 dB
Stimulus Intensity ModifierThis drop-down menu lists the letters corresponding to the second (“fine”) Goldmannintensity filter, which also helps to determine the intensity of the stimulus. The valuescorresponding to these filters are:
Goldmann Humphrey Goldmann HumphreyFilter Letter Intensity Filter Letter Intensity
A +4 dB A´ +24 dB B +3 dB B´ +23 dB C +2 dB C´ +22 dB D +1 dB D´ +21 dB E* +0 dB E´ +20 dB
The actual intensity of the test stimulus is equal to the combined values of the StimulusIntensity and the Stimulus Intensity Modifier. For example, a stimulus with an Intensity of “3”and Intensity Modifier of “C” will have a resultant intensity of 17 dB (15 + 2).
Stimulus ColorThis drop-down menu allows the user to choose between the following stimulus colors: white*,red, and blue.
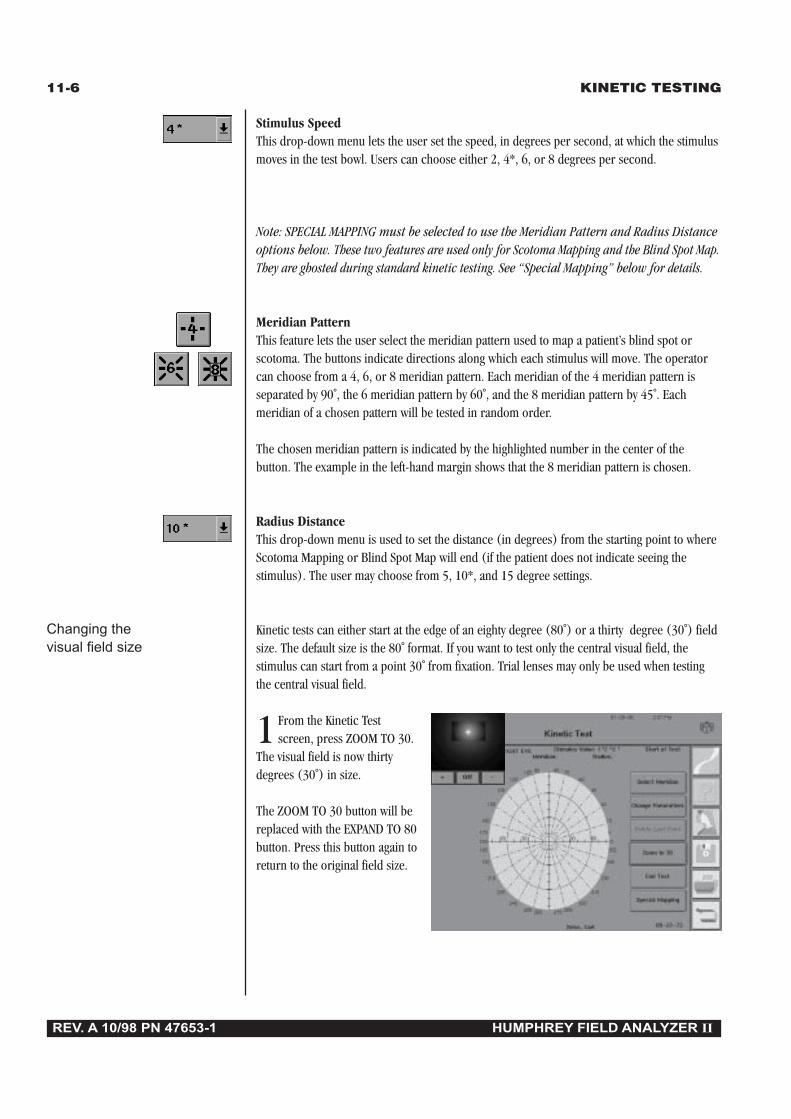
11-6 KINETIC TESTING
REV. A 10/98 PN 47653-1 HUMPHREY FIELD ANALYZER II
Stimulus SpeedThis drop-down menu lets the user set the speed, in degrees per second, at which the stimulusmoves in the test bowl. Users can choose either 2, 4*, 6, or 8 degrees per second.
Note: SPECIAL MAPPING must be selected to use the Meridian Pattern and Radius Distanceoptions below. These two features are used only for Scotoma Mapping and the Blind Spot Map.They are ghosted during standard kinetic testing. See “Special Mapping” below for details.
Meridian PatternThis feature lets the user select the meridian pattern used to map a patient’s blind spot orscotoma. The buttons indicate directions along which each stimulus will move. The operatorcan choose from a 4, 6, or 8 meridian pattern. Each meridian of the 4 meridian pattern isseparated by 90˚, the 6 meridian pattern by 60˚, and the 8 meridian pattern by 45˚. Eachmeridian of a chosen pattern will be tested in random order.
The chosen meridian pattern is indicated by the highlighted number in the center of thebutton. The example in the left-hand margin shows that the 8 meridian pattern is chosen.
Radius DistanceThis drop-down menu is used to set the distance (in degrees) from the starting point to whereScotoma Mapping or Blind Spot Map will end (if the patient does not indicate seeing thestimulus). The user may choose from 5, 10*, and 15 degree settings.
Kinetic tests can either start at the edge of an eighty degree (80˚) or a thirty degree (30˚) fieldsize. The default size is the 80˚ format. If you want to test only the central visual field, thestimulus can start from a point 30˚ from fixation. Trial lenses may only be used when testingthe central visual field.
1 From the Kinetic Testscreen, press ZOOM TO 30.
The visual field is now thirtydegrees (30˚) in size.
The ZOOM TO 30 button will bereplaced with the EXPAND TO 80button. Press this button again toreturn to the original field size.
Changing thevisual field size

11-7
REV. A 10/98 PN 47653-1 HUMPHREY FIELD ANALYZER II
KINETIC TESTING
The projector has limits on how far out it can project a light stimulus. The following graphshows the projector’s limitation when using the 80˚ field size:
The HFA II will display the stimulus inside the bowl for one second at the starting point of thechosen meridian. It will then begin moving the stimulus toward fixation and into the patient’sfield of vision. If the patient does not respond by the time the stimulus reaches the centralfixation point, the target will continue into the opposite quadrant until there is a response (orend without one).
Once the patient pushes the response button, the stimulus will stop, and the screen willindicate the response location with an upper-case letter. You will automatically return to theKinetic Test screen so that you may select the next meridian.
Presenting a stimulusalong a meridian
Peripheral testing limits
0˚
30˚
180˚
150˚
60˚120˚90˚
210˚
240˚270˚
300˚
330˚
80˚
80˚
67˚
67˚
58˚50˚58˚
80˚
62˚ 60˚62˚
80˚
Figure 11.1: Peripheral 80˚ Testing Limits for Selected Meridians

11-8 KINETIC TESTING
REV. A 10/98 PN 47653-1 HUMPHREY FIELD ANALYZER II
To present a stimulus to a patient, follow the steps below:
1 From the Kinetic Test screen,choose SELECT MERIDIAN.
2 A keypad will appearas a pop-up window.
Input the meridian value(in degrees) for the test stimulus.
Using the optional externalkeyboard may be easier forentering the meridian values. TheRETURN/ENTER key can also beused to start the test.
Note: Meridians are positive, whole numbers between 0˚ and 359˚.
3 Prepare the patient for the test. Explain that the light will not be seen for a short time andthen it will move into the patient's field of vision. Ask the patient to press the response
button as soon as the light is seen. See Section 3: “Preparing the Patient” for additional details.
4 Press ENTER. After a slight pause, the test stimulus will begin to move toward the fixationpoint in the middle of the bowl.
Note: The Humphrey Field Analyzer II does not automatically monitor the patient’sfixation during kinetic perimetry. Both Gaze Tracking and Blind Spot Monitoring areturned off. For reliable test results, it is imperative that the operator constantly monitorfixation with the video eye monitor.
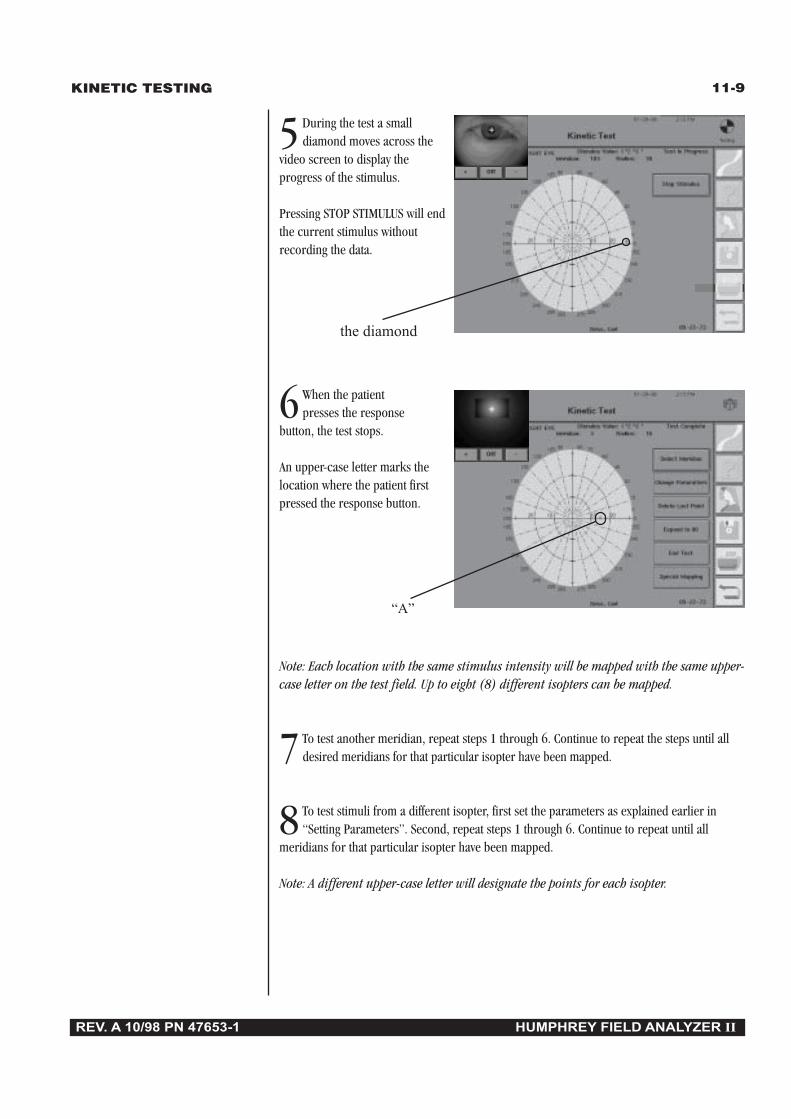
11-9
REV. A 10/98 PN 47653-1 HUMPHREY FIELD ANALYZER II
KINETIC TESTING
5 During the test a smalldiamond moves across the
video screen to display theprogress of the stimulus.
Pressing STOP STIMULUS will endthe current stimulus withoutrecording the data.
6 When the patientpresses the response
button, the test stops.
An upper-case letter marks thelocation where the patient firstpressed the response button.
Note: Each location with the same stimulus intensity will be mapped with the same upper-case letter on the test field. Up to eight (8) different isopters can be mapped.
7 To test another meridian, repeat steps 1 through 6. Continue to repeat the steps until alldesired meridians for that particular isopter have been mapped.
8 To test stimuli from a different isopter, first set the parameters as explained earlier in“Setting Parameters”. Second, repeat steps 1 through 6. Continue to repeat until all
meridians for that particular isopter have been mapped.
Note: A different upper-case letter will designate the points for each isopter.
“A”
the diamond

11-10 KINETIC TESTING
REV. A 10/98 PN 47653-1 HUMPHREY FIELD ANALYZER II
Unwanted test points can be removed from a Kinetic test that you are creating. However, onlythe last entry can be removed. If you are unsure of a patient response, it is best to erase it andtest that meridian again.
1 From the Kinetic Testscreen, press DELETE LAST
POINT.
The last entry you have made willautomatically be removed fromthe test field. No warning willbe issued before deleting thelast entry.
2 Subsequent selections of the DELETE LAST POINT button will erase the next previousentry.
Note: The DELETE LAST POINT button is disabled if there are no entries.
You may wish to retest a previously tested meridian. If you have not deleted the previousresponse, characters representing both responses will appear on the display and in the kineticresults printout. However, only the point representing the patient’s final response will be usedin forming the isopter.
Special Mapping tests may be performed individually or in addition to any other Kinetic Testingmethod. Special Mapping provides the user with three additional testing methods which aredescribed on the following pages:
• Scotoma Mapping• Blind Spot Map• Custom Scan
Erasing entries
Repeating points alongthe same meridian
Special mapping
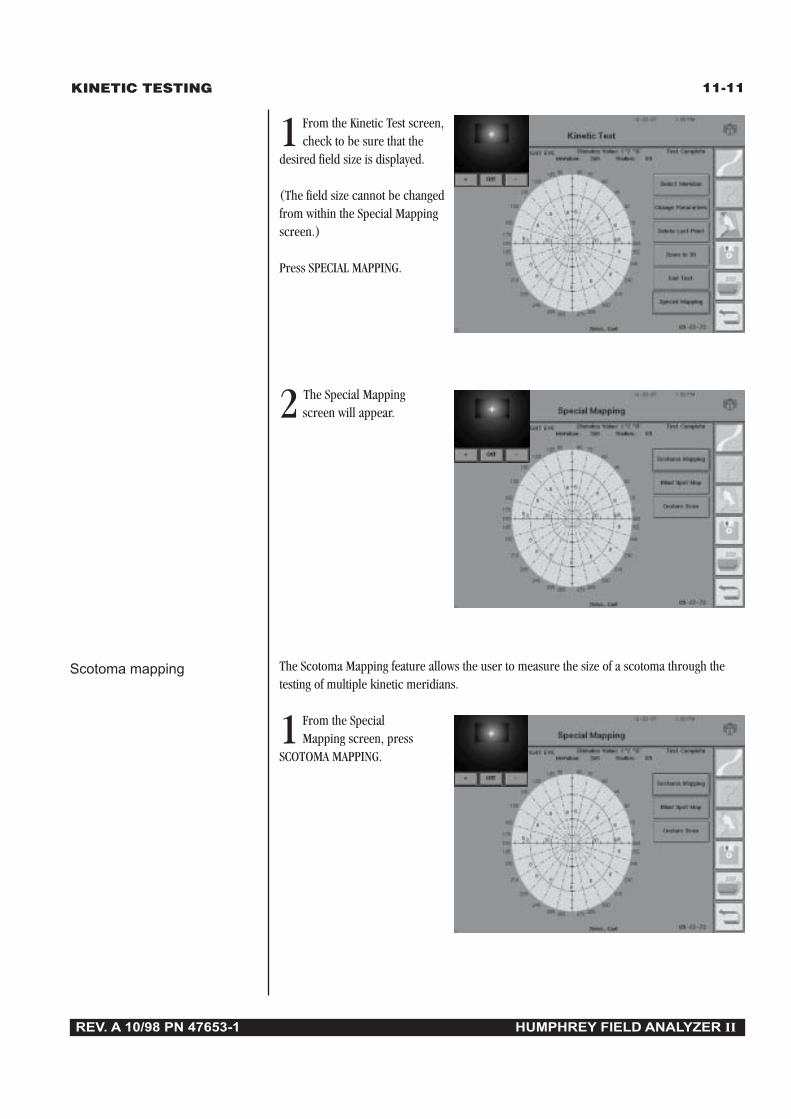
11-11
REV. A 10/98 PN 47653-1 HUMPHREY FIELD ANALYZER II
KINETIC TESTING
1 From the Kinetic Test screen,check to be sure that the
desired field size is displayed.
(The field size cannot be changedfrom within the Special Mappingscreen.)
Press SPECIAL MAPPING.
2 The Special Mappingscreen will appear.
The Scotoma Mapping feature allows the user to measure the size of a scotoma through thetesting of multiple kinetic meridians.
1 From the SpecialMapping screen, press
SCOTOMA MAPPING.
Scotoma mapping
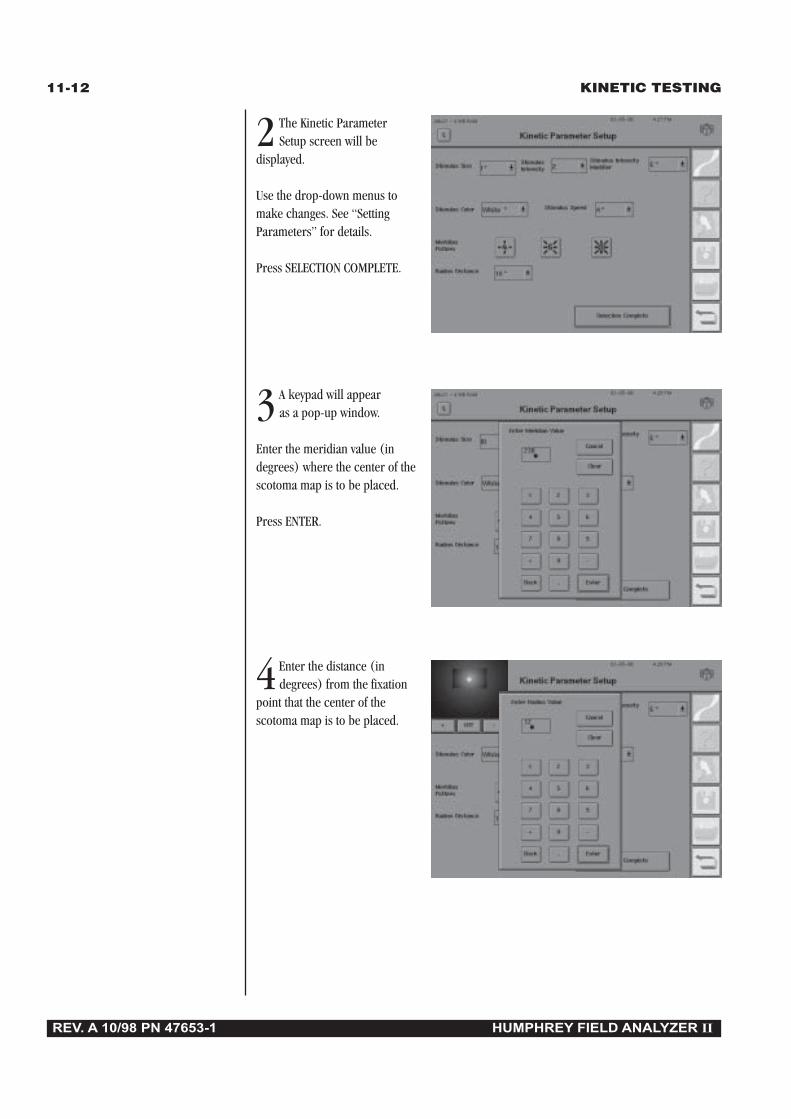
11-12 KINETIC TESTING
REV. A 10/98 PN 47653-1 HUMPHREY FIELD ANALYZER II
2 The Kinetic ParameterSetup screen will be
displayed.
Use the drop-down menus tomake changes. See “SettingParameters” for details.
Press SELECTION COMPLETE.
3 A keypad will appearas a pop-up window.
Enter the meridian value (indegrees) where the center of thescotoma map is to be placed.
Press ENTER.
4 Enter the distance (indegrees) from the fixation
point that the center of thescotoma map is to be placed.
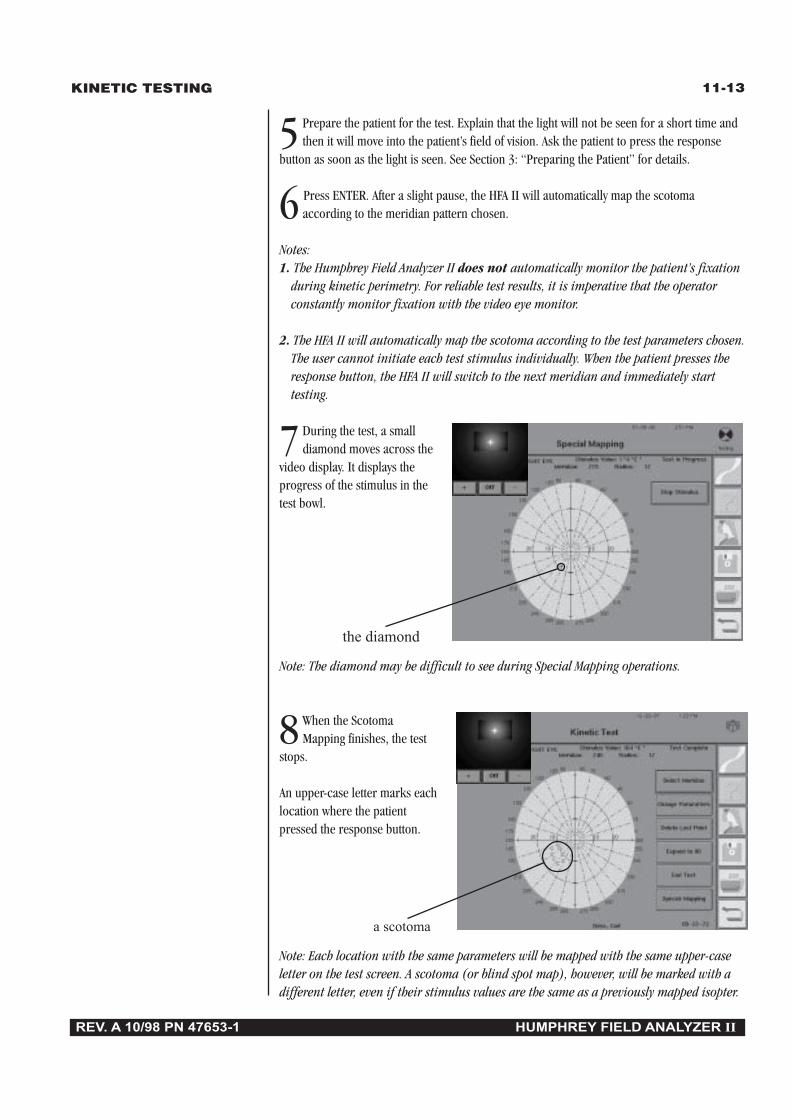
11-13
REV. A 10/98 PN 47653-1 HUMPHREY FIELD ANALYZER II
KINETIC TESTING
5 Prepare the patient for the test. Explain that the light will not be seen for a short time andthen it will move into the patient’s field of vision. Ask the patient to press the response
button as soon as the light is seen. See Section 3: “Preparing the Patient” for details.
6 Press ENTER. After a slight pause, the HFA II will automatically map the scotomaaccording to the meridian pattern chosen.
Notes:1. The Humphrey Field Analyzer II does not automatically monitor the patient’s fixation
during kinetic perimetry. For reliable test results, it is imperative that the operatorconstantly monitor fixation with the video eye monitor.
2. The HFA II will automatically map the scotoma according to the test parameters chosen.The user cannot initiate each test stimulus individually. When the patient presses theresponse button, the HFA II will switch to the next meridian and immediately starttesting.
7 During the test, a smalldiamond moves across the
video display. It displays theprogress of the stimulus in thetest bowl.
Note: The diamond may be difficult to see during Special Mapping operations.
8 When the ScotomaMapping finishes, the test
stops.
An upper-case letter marks eachlocation where the patientpressed the response button.
Note: Each location with the same parameters will be mapped with the same upper-caseletter on the test screen. A scotoma (or blind spot map), however, will be marked with adifferent letter, even if their stimulus values are the same as a previously mapped isopter.
a scotoma
the diamond

11-14 KINETIC TESTING
REV. A 10/98 PN 47653-1 HUMPHREY FIELD ANALYZER II
The Special Mapping feature has a built-in program to find and map the blind spot. Most oftenthe I4E stimulus, which is the smallest but most intense Goldmann stimulus, can be used toplot the blind spot. A larger target may be required if the I4E isopter is too small and fails toenclose the blind spot.
The Humphrey Field Analyzer II will move the stimulus to a point approximately 15˚ temporalto fixation and just below the horizontal axis for the eye being tested. Starting at this centerpoint, the stimulus will move out toward the periphery in each of the directions shown on theMeridian Pattern button. It stops when the patient pushes the response button. In this way, theHFA II will map the blind spot borders.
1 From the SpecialMapping screen, press
BLIND SPOT MAP.
2 The Kinetic ParametersSetup screen will appear.
Use the drop-down menus tomake any changes. See “SettingParameters” in this section fordetails.
3 Prepare the patient for the test. Explain that the light will not be seen for a short time andthen it will move into the patient's field of vision. Ask the patient to press the response
button as soon as the light is seen. See Section 3: “Preparing the Patient” for details.
Blind spot map
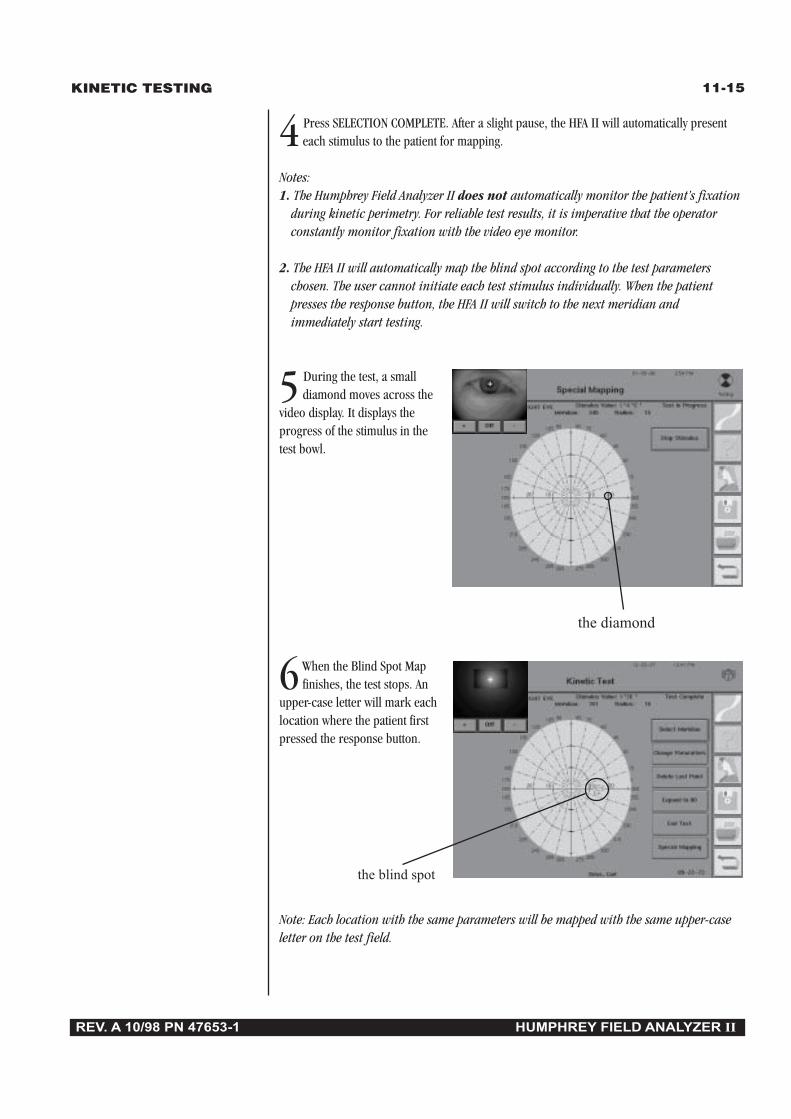
11-15
REV. A 10/98 PN 47653-1 HUMPHREY FIELD ANALYZER II
KINETIC TESTING
4 Press SELECTION COMPLETE. After a slight pause, the HFA II will automatically presenteach stimulus to the patient for mapping.
Notes:1. The Humphrey Field Analyzer II does not automatically monitor the patient’s fixation
during kinetic perimetry. For reliable test results, it is imperative that the operatorconstantly monitor fixation with the video eye monitor.
2. The HFA II will automatically map the blind spot according to the test parameterschosen. The user cannot initiate each test stimulus individually. When the patientpresses the response button, the HFA II will switch to the next meridian andimmediately start testing.
5 During the test, a smalldiamond moves across the
video display. It displays theprogress of the stimulus in thetest bowl.
6 When the Blind Spot Mapfinishes, the test stops. An
upper-case letter will mark eachlocation where the patient firstpressed the response button.
Note: Each location with the same parameters will be mapped with the same upper-caseletter on the test field.
the diamond
the blind spot

11-16 KINETIC TESTING
REV. A 10/98 PN 47653-1 HUMPHREY FIELD ANALYZER II
Custom scan The Humphrey Field Analyzer II allows the operator to move stimuli either from peripheral-to-central, from central-to-peripheral, or from point-to-point within the field without goingthrough the fixation point.
1 From the Special Mappingscreen, select CUSTOM
SCAN.
2 You will see the Custom Scan screen. Select CHANGE PARAMETERS if desired. Set theparameters. See “Setting Parameters” for details.
Press SELECTION COMPLETE.
3 Press SELECT STARTPOINT.
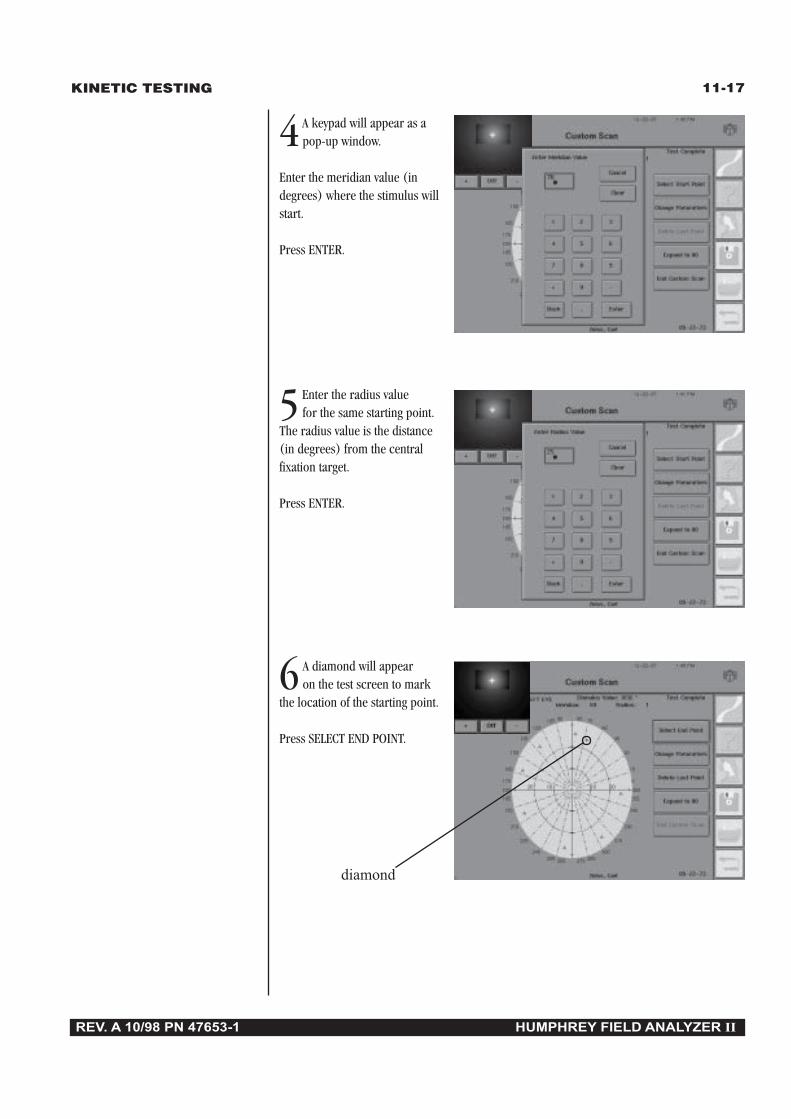
11-17
REV. A 10/98 PN 47653-1 HUMPHREY FIELD ANALYZER II
KINETIC TESTING
4 A keypad will appear as apop-up window.
Enter the meridian value (indegrees) where the stimulus willstart.
Press ENTER.
5 Enter the radius valuefor the same starting point.
The radius value is the distance(in degrees) from the centralfixation target.
Press ENTER.
6 A diamond will appearon the test screen to mark
the location of the starting point.
Press SELECT END POINT.
diamond

11-18 KINETIC TESTING
REV. A 10/98 PN 47653-1 HUMPHREY FIELD ANALYZER II
7 A keypad will appear as apop-up window.
Enter the meridian value (indegrees) where the stimulus willend.
Press ENTER.
8 Enter the radius value (indegrees) for the same
ending point.
9 Prepare the patient for the test. Explain that the light will not be seen for a short time andthen it will move into the patient’s field of vision. Ask the patient to press the response
button as soon as the light is seen. See Section 3: “Preparing the Patient” for details.
10Press ENTER. After a slight pause the test stimulus will be presented to the patient formapping.
Note: The Humphrey Field Analyzer II does not automatically monitor the patient’sfixation during kinetic perimetry. For reliable test results, it is imperative that theoperator constantly monitors fixation with the video eye monitor.

11-19
REV. A 10/98 PN 47653-1 HUMPHREY FIELD ANALYZER II
KINETIC TESTING
diamond
11During the test asmall diamond moves
across the video display. Itdisplays the progress of thestimulus in the test bowl.
12 When the patientpresses the response
button, the test stops.
An upper-case letter marks thelocation where the patient pressedthe response button.
Note: Each point with the same parameters will be mapped with the same letter.
13 To perform another Custom Scan, repeat steps 1 through 12. Repeat the steps until all desired meridians for each particular isopter are mapped.
14 After all desiredisopters have been
mapped, press END CUSTOMSCAN to return to the Kinetic Testscreen.
“B”
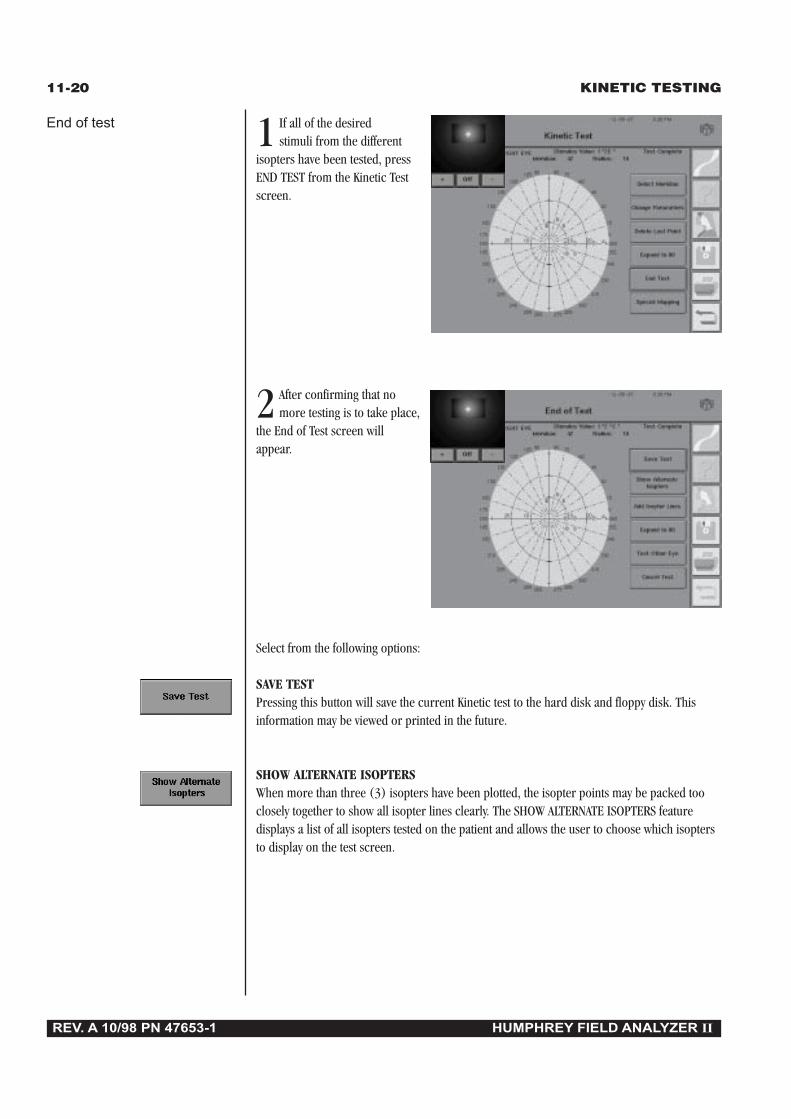
11-20 KINETIC TESTING
REV. A 10/98 PN 47653-1 HUMPHREY FIELD ANALYZER II
1 If all of the desiredstimuli from the different
isopters have been tested, pressEND TEST from the Kinetic Testscreen.
2 After confirming that nomore testing is to take place,
the End of Test screen willappear.
Select from the following options:
SAVE TESTPressing this button will save the current Kinetic test to the hard disk and floppy disk. Thisinformation may be viewed or printed in the future.
SHOW ALTERNATE ISOPTERSWhen more than three (3) isopters have been plotted, the isopter points may be packed tooclosely together to show all isopter lines clearly. The SHOW ALTERNATE ISOPTERS featuredisplays a list of all isopters tested on the patient and allows the user to choose which isoptersto display on the test screen.
End of test
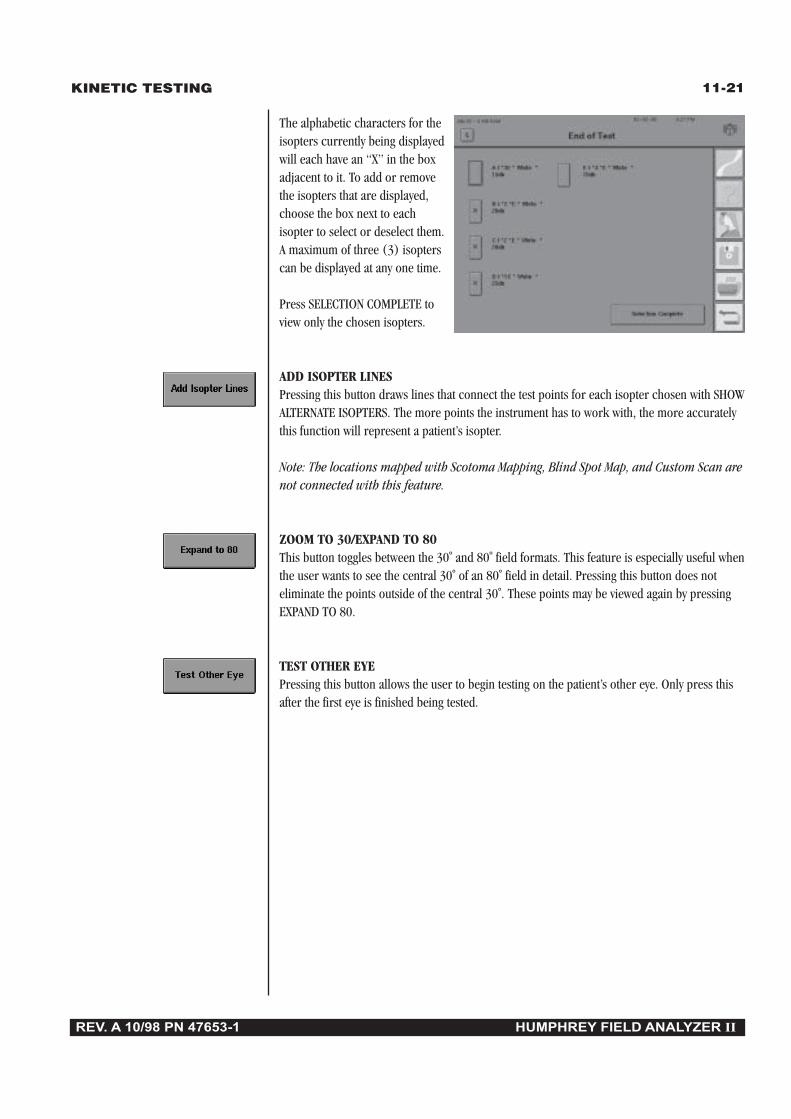
11-21
REV. A 10/98 PN 47653-1 HUMPHREY FIELD ANALYZER II
KINETIC TESTING
The alphabetic characters for theisopters currently being displayedwill each have an “X” in the boxadjacent to it. To add or removethe isopters that are displayed,choose the box next to eachisopter to select or deselect them.A maximum of three (3) isopterscan be displayed at any one time.
Press SELECTION COMPLETE toview only the chosen isopters.
ADD ISOPTER LINESPressing this button draws lines that connect the test points for each isopter chosen with SHOWALTERNATE ISOPTERS. The more points the instrument has to work with, the more accuratelythis function will represent a patient’s isopter.
Note: The locations mapped with Scotoma Mapping, Blind Spot Map, and Custom Scan arenot connected with this feature.
ZOOM TO 30/EXPAND TO 80This button toggles between the 30˚ and 80˚ field formats. This feature is especially useful whenthe user wants to see the central 30˚ of an 80˚ field in detail. Pressing this button does noteliminate the points outside of the central 30˚. These points may be viewed again by pressingEXPAND TO 80.
TEST OTHER EYEPressing this button allows the user to begin testing on the patient’s other eye. Only press thisafter the first eye is finished being tested.

11-22 KINETIC TESTING
REV. A 10/98 PN 47653-1 HUMPHREY FIELD ANALYZER II
CANCEL TESTThis button deletes all data on the current test and takes the user back to the Start of Testscreen. A dialog box warns the operator that the test will be canceled. Pressing YES will cancelthe test. Pressing NO will return the user to the End of Test screen without affecting the testdata. Even if a test is deleted using CANCEL TEST, patient data will be unchanged.
PrintPrinting can be performed via the PRINT FUNCTIONS icon on the right-hand side of the screen.After pressing this icon, the Kinetic Printout Selection screen is displayed. Refer to step 5 in“Printing Sequence” later in this section. Also see “Printing Kinetic Tests” for furtherinformation.
3 After all of the adjustments are made and the data is saved, press the MAIN MENU icon toexit Kinetic Testing.

11-23
REV. A 10/98 PN 47653-1 HUMPHREY FIELD ANALYZER II
KINETIC TESTING
Just as with static tests, previously saved Kinetic tests can be viewed by using the VIEW TESTbutton on the File Functions screen or from the RECALL LAST TEST button on the Main Menuscreen. RECALL LAST TEST will automatically take the user to the View Test screen for theKinetic test (if the Kinetic test was the last test performed on the instrument). To view a Kinetictest other than the last test performed, follow the instructions below:
1 From the Main Menuscreen, select the FILE
FUNCTIONS icon.
2 Choose VIEW TEST.
3 Designate the desired Sourceand Directory Order.
Select PROCEED.
VIEWINGKINETIC TESTS
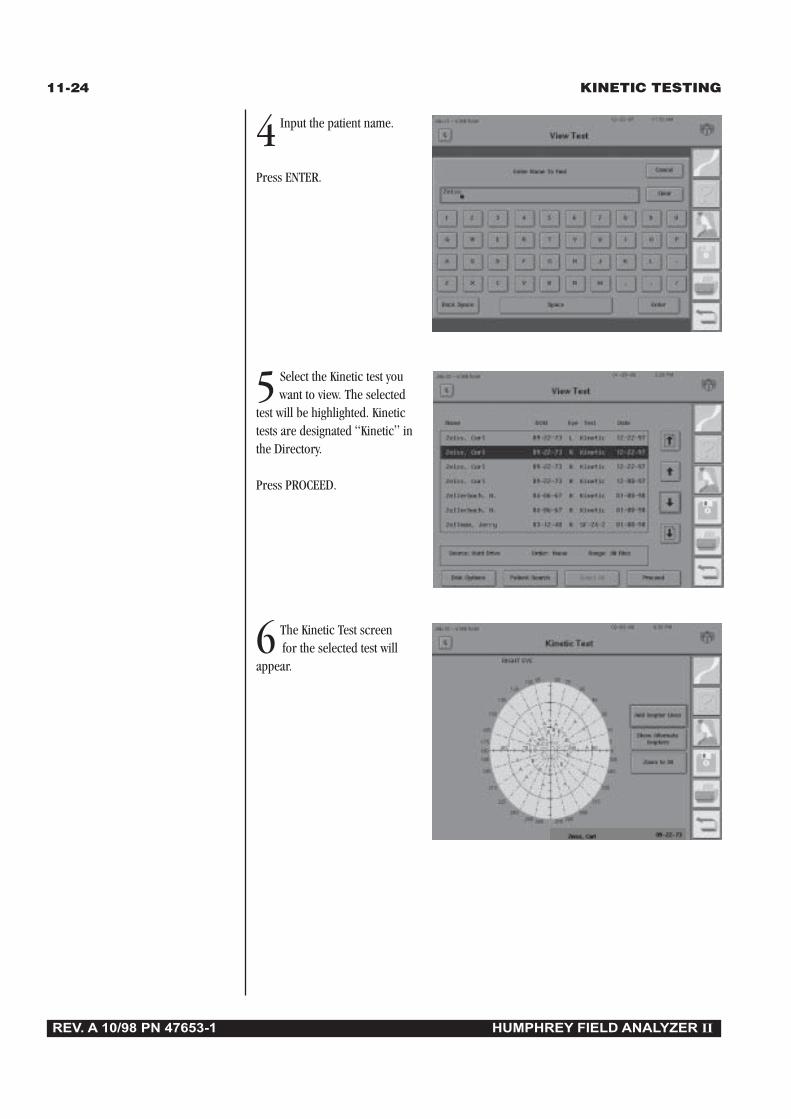
11-24 KINETIC TESTING
REV. A 10/98 PN 47653-1 HUMPHREY FIELD ANALYZER II
4 Input the patient name.
Press ENTER.
5 Select the Kinetic test youwant to view. The selected
test will be highlighted. Kinetictests are designated “Kinetic” inthe Directory.
Press PROCEED.
6 The Kinetic Test screen for the selected test will
appear.

11-25
REV. A 10/98 PN 47653-1 HUMPHREY FIELD ANALYZER II
KINETIC TESTING
7 Select from the following options:
ADD ISOPTER LINESThis option allows you toconnect the same isopter results(the same upper-case letters) bylines.
SHOW ALTERNATE ISOPTERSThis option allows you to choosewhich isopter(s) to display onthe screen.
Note: Only three (3) different isopters can be viewed at once.
ZOOM TO 30/EXPAND TO 80This option allows the user to zoom in or out of the screen. Zooming in may allow you to seemore clearly the upper-case letters that are located close to each other. Zooming out may allowyou to see the upper-case letters that are outside of the 30˚ field.
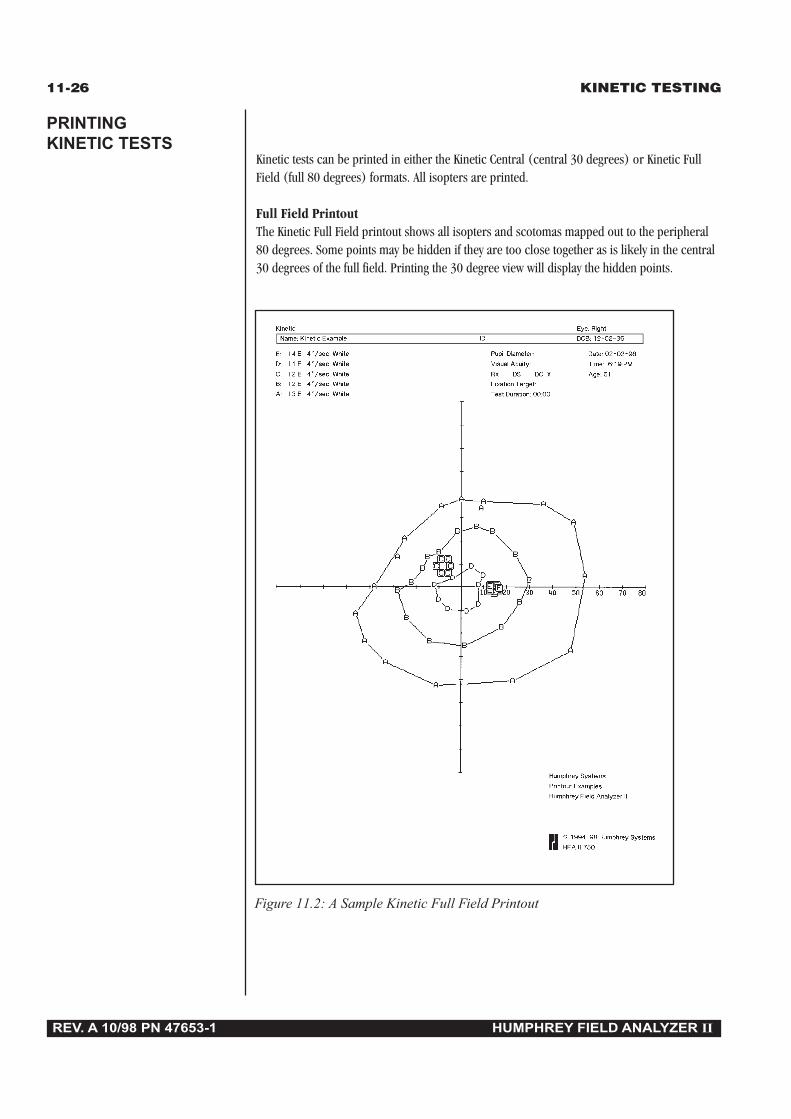
11-26 KINETIC TESTING
REV. A 10/98 PN 47653-1 HUMPHREY FIELD ANALYZER II
Kinetic tests can be printed in either the Kinetic Central (central 30 degrees) or Kinetic FullField (full 80 degrees) formats. All isopters are printed.
Full Field PrintoutThe Kinetic Full Field printout shows all isopters and scotomas mapped out to the peripheral80 degrees. Some points may be hidden if they are too close together as is likely in the central30 degrees of the full field. Printing the 30 degree view will display the hidden points.
PRINTINGKINETIC TESTS
Figure 11.2: A Sample Kinetic Full Field Printout

11-27
REV. A 10/98 PN 47653-1 HUMPHREY FIELD ANALYZER II
KINETIC TESTING
Central PrintoutThe Kinetic Central printout documents the central 30 degrees of the visual field. Figure 11.3shows the central 30 degrees of the Full Field printout in Figure 11.2.
Figure 11.3: A Sample Kinetic Central Field Printout

11-28 KINETIC TESTING
REV. A 10/98 PN 47653-1 HUMPHREY FIELD ANALYZER II
Isopter points are shown as upper-case letters. They are connected to form the isopter lines.Points that define the borders of a scotoma map, a blind spot, or a custom scan, however, arenot connected to each other. The user may connect scotoma-map points with colored pencilsand shade them. This is often done in manual Goldmann perimetry to facilitate clinicalinterpretation of test results.
The following is the list of print styles for each type of test point:
Type Style ExampleIsopter Upper-case AScotoma Outlined BBlind Spot Outlined CCustom Scan Inverse D D
Occasionally an isopter point will appear on the printout but it will not be connected to otherisopter points. This situation occurs when a meridian has been retested. Only the most recentpoint on a meridian will be used for the isopter map.
To print a Kinetic test, follow the instructions below:
1 Press the PRINT FUNCTIONSicon from any screen.
2 Designate the desired Sourceand Directory Order.
Select PROCEED.
Printout legend
Printing sequence
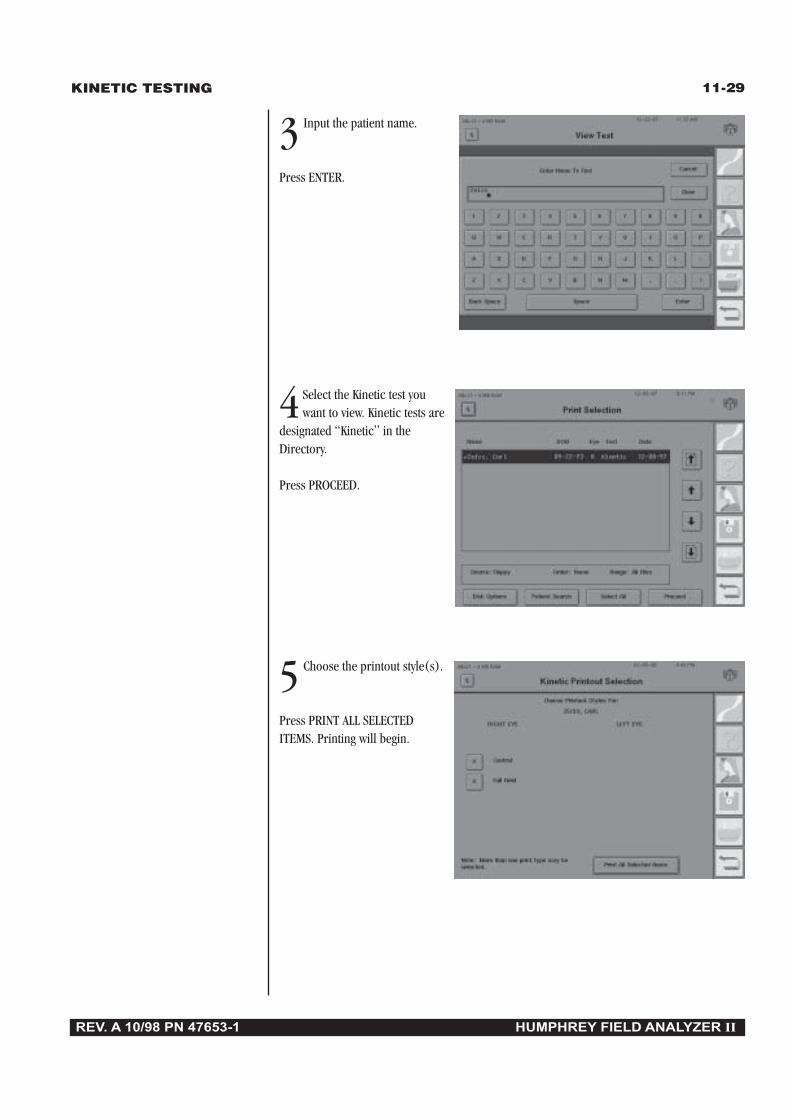
11-29
REV. A 10/98 PN 47653-1 HUMPHREY FIELD ANALYZER II
KINETIC TESTING
3 Input the patient name.
Press ENTER.
4 Select the Kinetic test youwant to view. Kinetic tests are
designated “Kinetic” in theDirectory.
Press PROCEED.
5 Choose the printout style(s).
Press PRINT ALL SELECTEDITEMS. Printing will begin.

11-30 KINETIC TESTING
REV. A 10/98 PN 47653-1 HUMPHREY FIELD ANALYZER II

REV. A 10/98 PN 47653-1 HUMPHREY FIELD ANALYZER II
Care and Cleaning 12General Use Principles 12-2
Cleaning the HFA II 12-2
Replacing Parts 12-4
Operating the Printrex Printer 12-10
Touch Screen Calibration 12-12
Using Floppy Disks 12-13
The HFA II is designed to meet the demands of your busy schedule, andbecause it plays an important part of patient care, you’ll want to keep itin top working condition.
This section focuses on proper care of your instrument.

12-2 CARE AND CLEANING
REV. A 10/98 PN 47653-1 HUMPHREY FIELD ANALYZER II
GENERAL USEPRINCIPLES
• Although the HFA II is designed for continuous operation, it should be turned offwhen not used for an extended period of time and covered with the dust cover.
• The HFA II should be used in a cool, dry and dust-free setting.
• Do NOT connect or disconnect cables while power is on.
• Do NOT place any container holding liquid near the instrument.
• Do NOT place objects on top of the instrument.
• Avoid turning the instrument on and off during the day to preserve the life of the bowllamps.
CLEANING THE HFA IIUse a mild, non-abrasive cleaner, distilled water or isopropyl alcohol applied to a soft cloth toclean the surfaces cited below. Clean as often as necessary.
EXTERIOR SURFACENever spray cleaner directly on the instrument.
BOWL SURFACETake precautions to avoid scratching the bowl surface. Remove all jewelry and be careful oflong fingernails and fingernail polish as these can permanently damage the bowl surface. Wipethe bowl gently. Excessive rubbing in one area can alter the surface. Avoid getting cleanerinside fixation targets and on mirrored surfaces.
TOUCH SCREENThe touch screen may require frequent cleaning to remove finger marks. Never spray cleanerdirectly on the screen.
FOREHEAD REST AND CHIN RESTClean molded surfaces after each patient. If using adhesive chin and headrest papers, replacethem after every patient.
PATIENT RESPONSE BUTTONDo NOT immerse in water.
REV. A 10/98 PN 47653-1 HUMPHREY FIELD ANALYZER II
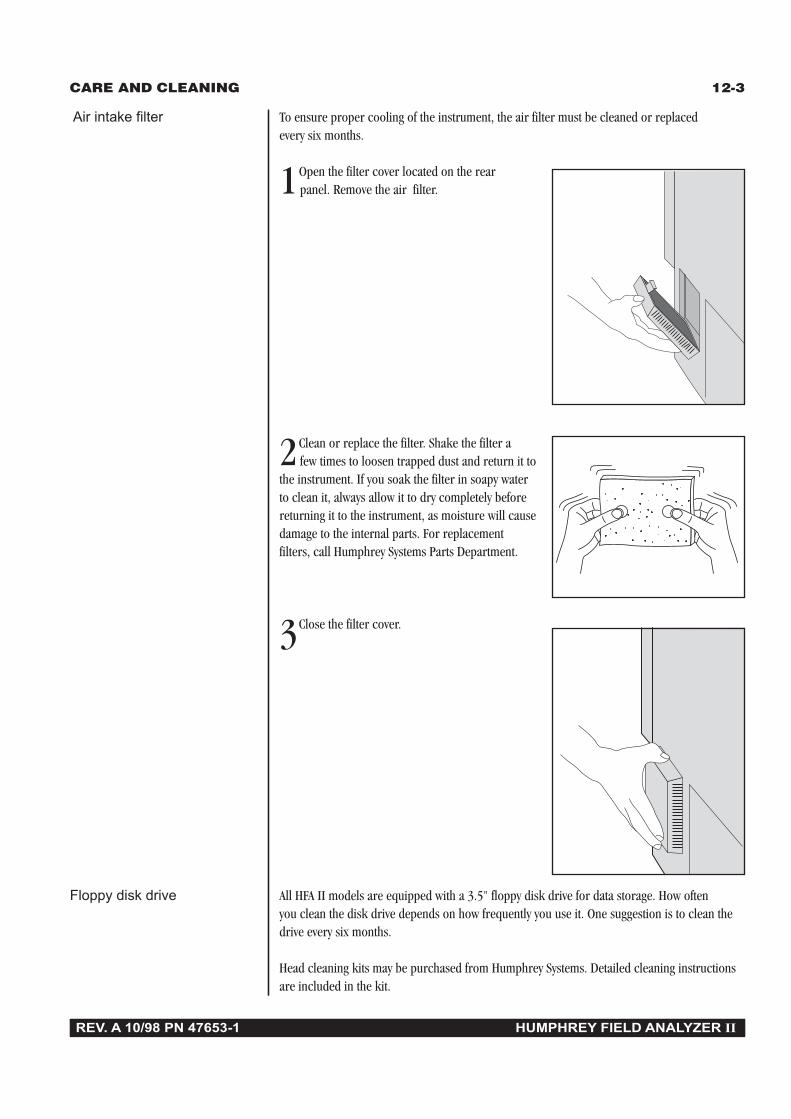
CARE AND CLEANING 12-3
REV. A 10/98 PN 47653-1 HUMPHREY FIELD ANALYZER II
Air intake filter To ensure proper cooling of the instrument, the air filter must be cleaned or replacedevery six months.
1Open the filter cover located on the rearpanel. Remove the air filter.
2Clean or replace the filter. Shake the filter afew times to loosen trapped dust and return it to
the instrument. If you soak the filter in soapy waterto clean it, always allow it to dry completely beforereturning it to the instrument, as moisture will causedamage to the internal parts. For replacementfilters, call Humphrey Systems Parts Department.
3Close the filter cover.
Floppy disk drive All HFA II models are equipped with a 3.5" floppy disk drive for data storage. How oftenyou clean the disk drive depends on how frequently you use it. One suggestion is to clean thedrive every six months.
Head cleaning kits may be purchased from Humphrey Systems. Detailed cleaning instructionsare included in the kit.
REV. A 10/98 PN 47653-1 HUMPHREY FIELD ANALYZER II
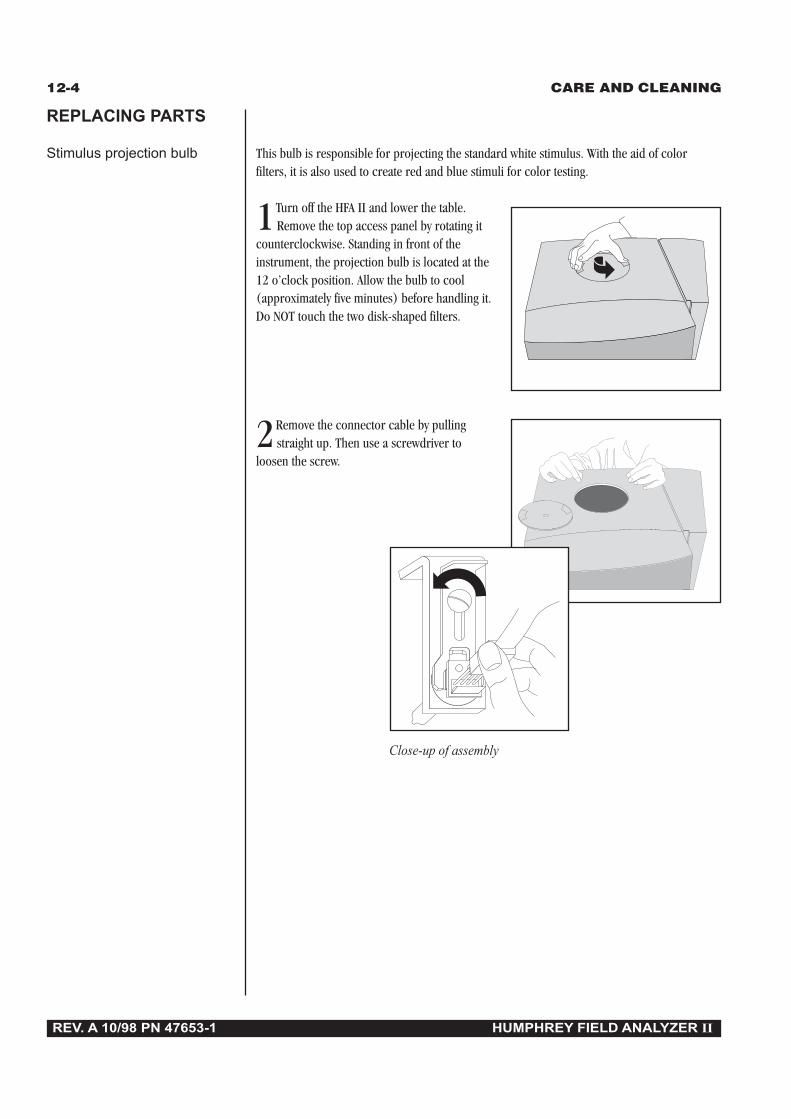
12-4 CARE AND CLEANING
REV. A 10/98 PN 47653-1 HUMPHREY FIELD ANALYZER II
REPLACING PARTS
Stimulus projection bulb This bulb is responsible for projecting the standard white stimulus. With the aid of colorfilters, it is also used to create red and blue stimuli for color testing.
1Turn off the HFA II and lower the table.Remove the top access panel by rotating it
counterclockwise. Standing in front of theinstrument, the projection bulb is located at the12 o’clock position. Allow the bulb to cool(approximately five minutes) before handling it.Do NOT touch the two disk-shaped filters.
2Remove the connector cable by pullingstraight up. Then use a screwdriver to
loosen the screw.
Close-up of assembly

CARE AND CLEANING 12-5
REV. A 10/98 PN 47653-1 HUMPHREY FIELD ANALYZER II
3 Slide the wishbone shaped plate that holds thebulb assembly in place.
4 Remove the burned out bulb assembly. Insertreplacement into the housing. Do NOT touch the
glass part of the bulb with your fingers. If your fingertouches the bulb, wipe the bulb with a soft cloth.
5 Slide plate, tighten screw and replace connectorcable.
6 Replace the top access panel.

12-6 CARE AND CLEANING
REV. A 10/98 PN 47653-1 HUMPHREY FIELD ANALYZER II
Background illumination The bulbs responsible for illuminating the bowl surface are a fluorescent type (not incan-bulbs descent) and have a long life expectancy. If you get a bowl illumination error, do NOT
attempt to replace the bulb. Being highly specialized, these bulbs are to be replaced only by aHumphrey Systems Service Representative.
Patient response button Should the response button malfunction, disconnect it and replace it with a new responsebutton.
1Two fuses are located in the rear of the unit.Turn off power. Unplug the power cord.
2 Using a small screwdriver, gently pry open thecover to expose the fuse holder. Information
about the proper replacement fuses is found adjacentto the fuse holder.
Instrument fuses

CARE AND CLEANING 12-7
REV. A 10/98 PN 47653-1 HUMPHREY FIELD ANALYZER II
3 Slide out each fuse holder (marked with anarrow) and check the filament for breakage.
Remove defective fuses.
4 Insert the new fuse(s) in the holder. Slide theholder back into the housing with arrows pointing
to the right. Push the cover up and in until it snapsclosed. Plug in the power cord.

12-8 CARE AND CLEANING
REV. A 10/98 PN 47653-1 HUMPHREY FIELD ANALYZER II
Power table fuses FOR TABLE WITH MOUNTED PRINTREX PRINTERThere are two sets of fuses on this HFA II power table. Set A, located at the base of the liftingcolumn, controls power to the table itself and the instrument (assuming the instrument isplugged into the outlet under the table). Set B controls the lifting mechanism and the printer.Information on the replacement fuses and proper ratings are posted next to the fuse locationsdescribed below.
Replace fuse set A if the HFA II, printer, and power table do not operate. Replace fuse set B ifthe table and printer do not operate.
Figure 12.1. HFA II Power Table With Mounted Printer Showing Location of Fuses
Note: Some tables do not have Fuse (B). Actual fuse ratings may vary. Replace fuses withthe same rating as the original fuse supplied with the table.
POWER TABLE FUSE RATINGS
100 V or 115 V Tables 230 V TablesFuse: 8A, 125 V Fuse: 4 A 250 VSlo-Blow Metric Slo-Blow Metric
Fuse (B)Controls the table liftingmechanism and printer
INSET power supply close-up
Fuse (A)Controls the table liftingmechanism and printer
Printrexprinter fuse

CARE AND CLEANING 12-9
REV. A 10/98 PN 47653-1 HUMPHREY FIELD ANALYZER II
FUSE SET A
1 Turn off the power. Unplug thepower cord that is attached to the
table at the base of the lifting column.Move the table away from the wall toaccess the back of the table.
2 Use needle-nose pliers orfingernails to gently slide the fuse
drawer from its housing.
3 Remove defective fuses. Insertnew fuses in housing.
4 Replace the fuse drawer. Plug inthe power cord.
FUSE SET B
1 Turn off the power. Unplug thepower cord that is attached to the
table at the base of the lifting column.Move the table away from the wall toaccess the back of the table.
2 Locate two fuse housings on thepower box. Unscrew each fuse
holder using a flathead screwdriver.
3 Replace defective fuses.
FOR TABLE WITHOUT MOUNTED PRINTERThere is only one set of fuses in this table model. Follow above instructions for Fuse Set A only.
Note: For continued protection against fire hazard, replace only with same type andrating of fuse.

12-10 CARE AND CLEANING
REV. A 10/98 PN 47653-1 HUMPHREY FIELD ANALYZER II
OPERATING THEPRINTREX PRINTER
The operating instructions for the Printrex Thermal Line printer are given below. For infor-mation on HP LaserJet printers, refer to Hewlett-Packard documentation.
Loading paper Loading paper is extremely simple because it does not have to be threaded or aligned.
1 Unlock the door of theprinter by pressing on
the open circles printed onthe two latches at the lowercorners of the door. Pull upon the latches to open thedoor.
2 Remove the paper rollholder from the printer
and remove the paper rollbar from the holder. Slip theempty core off the bar.
3 Slip the paper roll barthrough the core of the
new paper roll and installthe paper roll on the holderso the paper feeds from thetop of the roll toward thefront of the holder. Feed afew inches of paper from theroll so it will extend over theplaten after insertion.
4 Insert the paper roll inthe printer and close
the door with the latchesunlocked. Press on the solidcircles printed on the doorlatches to lock them.
5 Press the Line/Local button on the left side of the Printrex printer. The green “On Line”light should go on. The printer will not print if the green light is off.
6 Tear off the extra paper. There are two tear bars, one on the bottom of the front doorfor tearing up and one on the printer housing for tearing down. Pull up or down and
slightly to the right or left to tear paper.

CARE AND CLEANING 12-11
REV. A 10/98 PN 47653-1 HUMPHREY FIELD ANALYZER II
Controls and indicators Figure 12.2 shows the control panel. It contains two push button switches (Paper Advance andLine / Local) and three indicators (On Line, Error and Power).
Figure 12.2. The Printrex Printer Control Panel
The normal power up process places the printer in the On Line mode and Line / Local switchtoggles the printer between On Line and Local. Pressing the Paper Advance button when in theLocal mode causes continuous paper advance in one-character line increments. The PaperAdvance button is disabled in the On Line mode.
The Power indicator is on whenever power is applied to the printer. The On Line indicator is onwhenever the printer is under control of the HFA II. The Error indicator lights continuously whenthe printer is out of paper and flashes under certain error conditions such as door open.
About thermal paper Storage of thermal paper for the HFA II requires special care. Humphrey Systems recommendsthat you store your printouts in plain paper folders away from possible contact with water orany of these substances:
• Organic Solvents (including alcohol)• Cleaning fluids• Placticizers such as cellophane tape or PVC film (plastic sleeves)• Petroleum solvents (gasoline, toluene, or benzene)• Wet-type diazo copy paper• Certain types of carbon papers• Castcoated papers• Papers containing tributyl phosphate• Dissimilar thermal systems• Carbonless paper CB solvents (most)• Ammonia• Certain oils• Water (for prolonged periods of time)
At present, one roll of thermal paper (purchased through Humphrey Systems Parts Depart-ment) will yield 120 printouts; one box of 6 rolls will yield 720 printouts.
PAPERADVANCE
LINE/LOCAL
ONLINE
ERROR
POWER

12-12 CARE AND CLEANING
REV. A 10/98 PN 47653-1 HUMPHREY FIELD ANALYZER II
TOUCH SCREENCALIBRATION
Maintaining proper calibration of the touch screen is critical. The touch screen is properlycalibrated if the screen recognizes the location where your finger touches the screen andresponds appropriately. For example, when dealing with the Main Menu, if you select RECALLLAST TEST and the instrument responds as if you selected SHOW TEST LIBRARY, the touchscreen is not correctly calibrated.
The touch screen’s response may drift periodically. If errors appear, follow these steps:
1. Go to the Main Menu and press the SYSTEM SETUP icon.2. Press ADDITIONAL SETUP.3. Press TOUCH SCREEN CALIBRATION.4. Verify that you wish to calibrate the touch screen by selecting CONTINUE.5. Using the eraser side of a pencil, touch the square which appears in the upper left-hand
corner of the screen, keeping the orientation of the pencil perpendicular to the screen.6. Touch the square in the lower right-hand corner, again keeping the pencil perpendicular
to the screen.7. You will return to the Additional Setup screen. With your finger, touch the screen in
several locations to determine whether it is properly calibrated.8. If the touch screen response is still not accurate, re-calibrate by repeating steps 1
through 7.
There are two additional ways to re-calibrate the touch screen should you have difficultygetting to the TOUCH SCREEN CALIBRATION button on the Additional Setup Screen. If youcannot press the SYSTEM SETUP icon on the Main Menu and you have an external keyboardattached, press the F6 key. Press the external keyboard’s Tab key until you highlight theADDITIONAL SETUP button. Press the Enter/Return key on the external keyboard. Again pressthe Tab key until TOUCH SCREEN CALIBRATION is highlighted. Press the Enter/Return keyagain. Follow the instructions on the screen to continue the calibration as described above.
The other method for touch screen calibration can be achieved when turning the HFA II poweron. If you continuously hold the patient response button down while the HFA II is powering up,the option to calibrate the touch screen will be displayed. Calibrate the screen as above.
If you accidentally start up the HFA II and get the touch screen calibration screen, you cancontinue the regular start up by cancelling out of the calibration mode. This ocasionallyhappens when the patient reponse button is continuously pressed down because of the way itwas replaced in the holder. Make sure the response button is not depressed when it is replacedin the holder.

CARE AND CLEANING 12-13
REV. A 10/98 PN 47653-1 HUMPHREY FIELD ANALYZER II
USING FLOPPYDISKS
All HFA II models use 1.44 MB 3.5" high density floppy disks for storing patient data. To ensurethe integrity of the data, learn how to care for and handle floppy disks properly.
Because floppy disks store information magnetically, the information can be destroyed by staticelectricity and strong magnets. Typical sources of magnetic fields include telephones, fluores-cent desk lamps, magnetic desk accessories and other electrical appliances.
• Keep your floppy disks at least 5 feet from these sources of magnetic fields.
• Do NOT touch the recording surface of the disk.
• Store floppy disks in their protective folder and in the original boxes supplied by themanufacturer or in any filing system designed for 3.5" floppy disks.
• Remember to label floppy disks for easy identification. Be careful to not let the labeladhere to the sliding cover of the floppy disk.
• Do NOT store floppy disks on top of the HFA II.
To insert a disk in the drive, first take it out of its protective case. Hold the disk so the arrow isaimed at the drive and insert it completely into the drive.
To remove a floppy disk from the drive, press the ejector button. Never remove the disk:
• When the indicator light is on.
• If the drive is running and the disk is moving.
• If the padlock is visible over the floppy drive image in the upper-right corner of thescreen (see Figure 2.1).
Note: Use only 1.44 MB double-sided high density (HD) disks.
Disk ejection button
Insert disk here

12-14 CARE AND CLEANING
REV. A 10/98 PN 47653-1 HUMPHREY FIELD ANALYZER II

REV. A10 9/98 PN 47653 HUMPHREY FIELD ANALYZER II
APPENDIX A A-1
REV. A 10/98 PN 47653-1 HUMPHREY FIELD ANALYZER IIHUMPHREY FIELD ANALYZER II
Appendix A: HFA II Product Specifications
Maximum Stimulus 10,000 ASBIntensity
Stimulus Duration 200 msec
Stimulus Wave Length Broadband visible light
Testing Distance 30 cm
Bowl Illumination 31.5 ASB
Max. Horizontal Range 86 degrees
Electrical Requirements 100-120V/230V AC, 50-60 Hz,100-120V, 4A, 400W230V, 1.8A, 400W
Dimensions Height 23 5/8" (575mm), Width 22 3/4" (580mm),Depth 19" (482mm), Weight 80 lbs. (36.4kg)
Environmental Requirements Operating Temperature: 41˚F to 95˚F5˚C to 35˚C
Operating Humidity: 20% to 85%non-condensing
Max. wet bulb: 78˚F (26˚C)
External Printer Centronic Parallel
External Monitor VGA
Communication Port RS 232D Serial Port
Keyboard PC AT Keyboard
External Floppy Drive 5.25" Floppy Drive
A-1

TESTING FEATURES Model Model Model Model Model Model720 730 735 740 745 750
Threshold Test LibraryCentral Field Test Patterns:
10-2, 24-2, 30-2 X X X X X XMacula X X X X X
Peripheral Field Test Patterns60-4 X X X X X XNasal Step X X X X X
Testing StrategiesSITA-Standard, SITA-Fast X X X X X XFull Threshold X X X X X XFastPac X X X X X X
Screening Test LibraryCentral Field Test Patterns:
C-40, C-76, C-80 X X X X X XC-64, C-Armaly X X X X X
Peripheral Field Test Patterns:P-60, FF-81, FF-120 X X X X X XFF-135, FF-246, FF-Armaly X X X X XNasal Step X X X X X
Testing Strategies:Two Zone, Three Zone &Quantify Defects X X X X X XAge Level Referenced &Threshold Related Modes X X X X X XSingle Intensity (Two Zone) X X X X X X
Specialty Test LibraryEsterman Monocular X X X X X XEsterman Binocular X X X X X XSuperior 36 Screening X X X X X XSuperior 64 Screening X X X X X X
Kinetic Testing Option Option Option Option X
Custom Testing X X X X X
Stimulus Color FiltersWhite-on-White X X X X X XRed, Blue-on-White X X X X XBlue-on-Yellow (SWAP) Option* Option* Option* X X
General Testing FeaturesGoldmann Stimulus Sizes III I-V I-V I-V I-V I-VFoveal Threshold Testing X X X X XAutomatic Pupil Measurement X
* Available as a field upgrade only, cannot be factory ordered.
REV. A10 9/98 PN 47653 HUMPHREY FIELD ANALYZER II
A-2 APPENDIX A
REV. A 10/98 PN 47653-1 HUMPHREY FIELD ANALYZER II

REV. A10 9/98 PN 47653 HUMPHREY FIELD ANALYZER II
APPENDIX A A-3
REV. A 10/98 PN 47653-1 HUMPHREY FIELD ANALYZER IIHUMPHREY FIELD ANALYZER II
APPENDIX A A-3
DATA ANALYSIS Model Model Model Model Model ModelSOFTWARE 720 730 735 740 745 750
STATPAC Limited X X X X XSTATPAC for SITA Limited X X X X XSTATPAC for Blue-Yellow * Limited X X X X XSTATPAC for Windows™ Option Option Option Option Option Option
Glaucoma Hemifield Test (GHT) ** X X X X X X
PRINTOUT FORMATSSTATPAC Formats (Full Thresh., FastPac)
Single Field Analysis X X X X X XOverview X X X X XChange Analysis X X X X XGlaucoma Change Probability X X X X X
STATPAC for SITA FormatsSingle Field Analysis (Size III) X X X X X XOverview (Size III) X X X X XChange Analysis X X X X X
STATPAC for Blue-Yellow *Single Field (Size V) X X X X X XOverview (Size V) X X X X X
Non-STATPAC FormatsThree-in-One X X X X X XOverview (Sizes I, II, & IV) X X X X XScreening O.U. Printout (Both Eyes) X X X X X XCompare X X X X X X
DATA STORAGESingle 3.5" Floppy Drive X X X X X XInternal Hard Disk Drive X X X XStreamer Tape Drive Backup XExternal 5.25" Floppy Drive Option Option Option Option Option Option
FILE SORTINGAlphabetical, Chronological, Patient X X X X X X
* HFA II model 720, 730, 735, and 740 can read and print out Blue-Yellow perimetry results and are equipped withSTATPAC for Blue-Yellow analysis software.Models 730, 735, and 740 require a field upgrade to perform Blue-Yellow perimetry.
** Glaucoma Hemifield Test (GHT) is not available with any FastPac test (White-on-White or Blue-Yellow).

REV. A10 9/98 PN 47653 HUMPHREY FIELD ANALYZER II
A-4 APPENDIX A
REV. A 10/98 PN 47653-1 HUMPHREY FIELD ANALYZER II
USER FEATURES Model Model Model Model Model Model720 730 735 740 745 750
Fixation MonitoringHeijl-Krakau Blindspot X X X X X XVideo Eye Monitor X X X X X XTrial Lens Holder X X X X X XGaze Tracking X X XHead Tracking XVertex Monitor X
Operator InterfaceHelp Menus X X X X X XTouchscreen on CRT X X X X X XKeyboard Option Option Option Option Option XTrackball / Mouse * Option Option Option Option Option OptionExternal VGA Monitor Option Option Option Option Option Option
PrinterPrintrex Thermal Printer X X X X X XHP Laser Jet Printers** Option Option Option Option Option Option
Patient Data InputName, Date of Birth, Patient ID X X X X X XTrial Lens, Visual Acuity X X X X X XPupil Size X X X X X XIOP, Cup/Disk Ratio X X X X XDiagnosis Code, Procedure Code X X X X XComments Window X X X X X
* Must be IBM-compatible Serial mouse or trackball. The Microsoft PS/2 mouse is not supported.
** Models include 2, 2P, 2P+, 3, 3P, 3P+, 4, 4L, 4MP, 4P, 5L, 5P, 6L, 6P.
Technical Documents Available on Request.All Specifications Subject to Change.

WarrantyFor one year from the date of delivery to the original purchaser, Seller warrants its HFA II (the“instrument”) to be free from defects in material or workmanship. In the event of failure,Seller’s obligation is limited to repairing or replacing on an exchange basis parts which havebeen promptly reported by Purchaser during such one-year period as being defective and areso found by Seller upon inspection. The procedure for warranty claims shall be as follows:when the Purchaser believes the instrument is defective, he shall promptly report the defect tothe Seller. Whenever possible, the Seller shall provide “in the customer’s office” service to re-pair the Purchaser’s instrument. This warranty covers all parts, labor, travel and expenses forthe warranty period.
At the Seller’s discretion, the repair of the HFA II may be made in the Seller’s repair depart-ment. In this case, all shipping costs will be paid by the Seller unless the Purchaser’s HFA II isfound upon inspection not to be eligible for repair under this warranty, in which case the Pur-chaser shall be responsible for one-half the shipping costs. If the instrument is determined tobe ineligible for repair under warranty, Seller will so notify Purchaser, and repairs desired byPurchaser will be performed at Seller’s normal rates. All replaced parts will become the prop-erty of the Seller.
This warranty specifically covers the HFA II including Printrex parallel printer and instrumenttable. This warranty does NOT cover consumable items such as operating supplies, paper orfloppy disks NOR DOES it cover the servicing of any external printer. These items will be cov-ered by the manufacturer’s warranty and arrangement for service must be made through themanufacturer. This warranty will NOT apply if repair or parts replacement is required becauseof accident, neglect, misuse, transportation or causes other than ordinary use, or supplies oraccessories that do not meet the proper operating specifications of the Seller. This warrantydoes NOT apply to any articles that have been repaired or altered except by the Seller.
All data stored on the hard disk and floppy disks are the Purchaser’s records, and it is his orher responsibility to preserve the integrity of these files. Humphrey Systems is not responsiblefor the loss of patient files stored on the hard disk, backup tape cartridges or backup floppydisks.
The entire risk as to the quality and performance of the software is with the Purchaser. TheSeller does not warrant that the software will meet the Purchaser’s requirements, that the op-eration of the software will be uninterrupted or error-free, or that all software errors will becorrected. The Purchaser assumes the responsibility for the installation, use and results ob-tained from the instrument and programs.
The warranty does NOT extend to any diskette which has been damaged as a result of accident,misuse, abuse, or as a result of service, or modification by anyone other than the Seller. Shouldsuch software prove defective following its purchase, the Purchaser (and not the Seller) as-sumes the entire cost of all necessary service, repair, or correction. The Seller shall have no li-ability or responsibility to the original person or entity with respect to any claim, loss, liability,or damage caused or alleged to be caused directly or indirectly by any software supplied by theSeller.
Appendix B: Warranty Statement andNotification of Copyright
REV. A10 9/98 PN 47653 HUMPHREY FIELD ANALYZER II
B-1
REV. A 10/98 PN 47653-1 HUMPHREY FIELD ANALYZER II

This disclaimer includes but is not limited to any interruption of services, loss of business oranticipatory profits, or any incidental, consequential, and/or other damages of any kind result-ing from the purchase, use or operation of the instrument or any software supplied by theSeller. Some states do NOT allow the limitation or exclusion of implied warranties or of inci-dental or consequential damages so these limitations and exclusions concerning the Seller’s ofsoftware may not apply.
Every reasonable effort has been made to ensure that the product manuals and promotionalmaterials accurately describe the instruments specifications and capabilities at the time of pub-lication. However, because of on-going improvements and product updates, the Seller cannotguarantee the accuracy of printed materials after the date of publication, and disclaims liabilityfor changes, errors or omissions.
Seller shall in no event be liable to Purchaser for the loss of profits, loss of use or consequen-tial damages. Purchaser agrees that Seller will not be liable for any damages caused by acts ofGod, or by the Purchaser’s failure to fulfill the Purchaser’s responsibilities as to proper instal-lation, use, management and supervision of the instrument. This warranty shall only apply tothe original Purchaser and shall not, in any way, be transferrable or assignable.
THE FORGOING WARRANTY IS IN LIEU OF ALL OTHER WARRANTIES EXPRESS OR IMPLIED, IN-CLUDING, BUT NOT LIMITED TO, THE IMPLIED WARRANTY OF MERCHANTABILITY OR WAR-RANTY OF FITNESS FOR A PARTICULAR PURPOSE. (ALL INSTRUMENT SPECIFICATIONS ARESUBJECT TO CHANGE WITHOUT NOTICE.)
Service ContractA Warranty Extension Agreement (Service Contract) is available after the one-year, new instru-ment warranty expires. For information call the Humphrey Systems Customer Service Depart-ment at 1-800-341-6968.
The Warranty on your HP PrinterThe HP LaserJet printers are covered by Hewlett-Packard’s one year parts and labor warranty.For more information, including the telephone number of the Hewlett-Packard sales/servicecenter nearest you, call HP at (800) 835-4747.
REV. A10 9/98 PN 47653 HUMPHREY FIELD ANALYZER II
B-2 APPENDIX B
REV. A10 9/98 PN 47653-1 HUMPHREY FIELD ANALYZER II

NOTIFICATION OFCOPYRIGHT
This software program is a proprietary product of Humphrey Systems and in certain in-stances contains material proprietary to Microsoft Corporation, FairCom Corporation, Soft-ware Components Group and Magma Systems. These proprietary products are protected bycopyright laws and international treaty. You must treat the software like any other copy-righted material.
SOFTWARE This agreement is a legal contract between you, the end user, and Humphrey SystemsLICENSE AGREEMENT governing your use of the software. Opening the sealed package indicates your acceptance
of this agreement. If you have any questions concerning this agreement contact HumphreySystems, Attention Customer Service, 5160 Hacienda Drive, Dublin, CA 94568.Telephone 1-800-341-6968.
LICENSE 1. In consideration of payment of the LICENSE fee which is part of the price you paid foryour HFA II unit, and your agreement to abide by the terms and conditions of this LICENSEand the Limited Warranty, Humphrey Systems as LICENSOR, grants to you, the LICENSEE, anonexclusive right to use and display this Software program on a single HFA II unit so longas you comply with the terms of the LICENSE. If the single HFA II unit on which you use theSoftware is a multiuser system, the LICENSE covers all users on that single system.
2. As the LICENSEE, you own the physical media, HFA II, on which the Software is originallyor subsequently recorded or fixed, but an express condition of this LICENSE is thatHumphrey Systems retains title and ownership to the Software recorded on the original diskcopies and all subsequent copies of the Software.
3. This Software is copyrighted. Unauthorized copying of the Software, including Softwarewhich has been modified, merged or included with other software is expressly forbidden.You may be held legally responsible for any copyright infringement which is caused or en-couraged by your failure to abide by the terms of the LICENSE.
4. Humphrey Systems may create updated versions of the Software. You may purchase theseupdates as offered by Humphrey Systems.
5. You may not sublicense, rent or lease the Software, but you may permanently transferyour LICENSE to use the Software by delivering the original HFA II and materials comprisingthe Software package, including the Certificate of License, to a third party who accepts theterms and conditions of this Agreement. As LICENSEE, you will simultaneously destroy allcopies of the Software and accompanying materials in your possession. The new recipient ofthe Software and accompanying HFA II accepts this Agreement and is licensed under theterms of this Agreement upon initially using the Software.
6. Humphrey Systems warrants the operation of the Software only with the operating systemfor which it was designed. Use of the Software with an operating system other than that forwhich it was designed will not be supported by Humphrey Systems.
REV. A10 9/98 PN 47653 HUMPHREY FIELD ANALYZER II
APPENDIX B B-3
REV. A 10/98 PN 47653-1 HUMPHREY FIELD ANALYZER II

LIMITED WARRANTY Neither Humphrey Systems nor Microsoft Corporation, Magma Systems, FairComCorporation, Software Components Group, nor anyone else who has been involved in the cre-ation, production, or delivery of this Software shall be liable for any direct, indirect, conse-quential or incidental damage (including damage for loss of business profits, business inter-ruption, loss of business information, and the like) arising out of the use or inability to usesuch Software, even if Humphrey Systems, Microsoft Corporation, FairCom Corporation, orSoftware Components Group has been advised of the possibility of such damages.
ACKNOWLEDGMENT You acknowledge that you have read this LICENSE and Limited Warranty, understand them,and agree to be bound by their terms and conditions.
REV. A10 9/98 PN 47653 HUMPHREY FIELD ANALYZER II
B-4 APPENDIX B
REV. A 10/98 PN 47653-1 HUMPHREY FIELD ANALYZER II
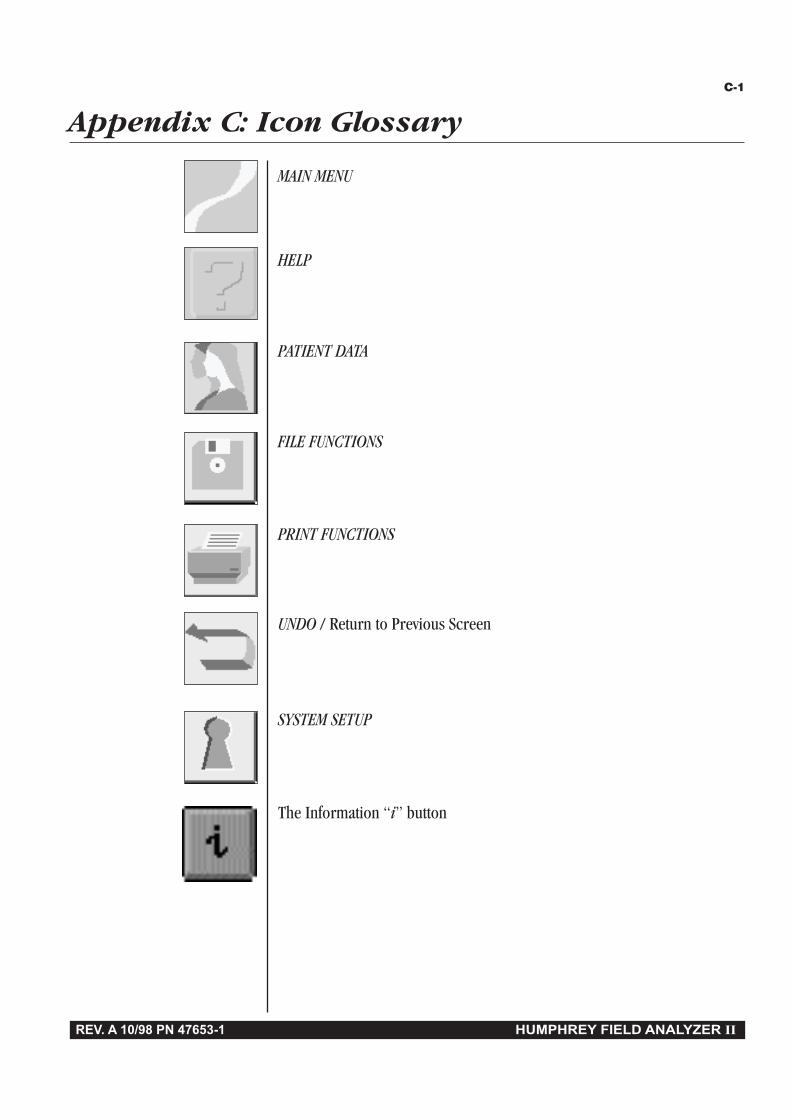
MAIN MENU
HELP
PATIENT DATA
FILE FUNCTIONS
PRINT FUNCTIONS
UNDO / Return to Previous Screen
SYSTEM SETUP
The Information “i” button
Appendix C: Icon Glossary
REV. A10 9/98 PN 47653 HUMPHREY FIELD ANALYZER II
C-1
REV. A 10/98 PN 47653-1 HUMPHREY FIELD ANALYZER II

REV. A10 9/98 PN 47653 HUMPHREY FIELD ANALYZER II
A-10 APPENDIX A
REV. A 10/98 PN 47653-1 HUMPHREY FIELD ANALYZER II
C-2 APPENDIX C

The decibel notation the Field Analyzer uses can be expressed in terms of Goldmann units or apo-stilbs. The conversion between decibels (dB) and apostilbs (asb) and Goldmann units are listed inTable D-1. For example, a threshold sensitivity of 25 dB using a size III stimulus is equal to aGoldmann III-Ie stimulus or 32 asb. A threshold sensitivity of 0 dB using a size III stimulus is equiva-lent to a Goldmann V 4e stimulus or 10,000 asb. A simplified chart to convert from dB values toGoldmann units is available in Tables D-1 through D-6.
To use the conversion tables, first locate the table which lists the target size you used for the test.For example, you may have completed a central 30-2 threshold test using a size III target and youwant to find out what the Goldmann equivalent is for 15 dB. Using Table D-4, find 15 dB. Readthe horizontal and vertical columns that intersect at 15 dB. The Goldmann equivalent is either a II4e, III 3e, IV 2e, or V 1e.
Appendix D: Goldmann Conversion Tables
REV. A10 9/98 PN 47653 HUMPHREY FIELD ANALYZER II
D-1
REV. A 10/98 PN 47653-1 HUMPHREY FIELD ANALYZER II

REV. A10 9/98 PN 47653 HUMPHREY FIELD ANALYZER II
A-12 APPENDIX A
REV. A 10/98 PN 47653-1 HUMPHREY FIELD ANALYZER II
D-2 APPENDIX D
dB = Asb Goldmann Conversion Table
Table D-1 Conversion of Goldmann units to decibels and apostilbs
Intensity Actual Stimulus SizedB Asb I II III IV V0 10,000 III 4e IV 4e V 4e1 7,943 III 4d IV 4d V 4d2 6,310 III 4c IV 4c V 4c3 5,012 III 4b IV 4b V 4b4 3,981 III 4a IV 4a V 4a5 3,162 II 4e III 4e IV 4e V 4e6 2,512 II 4d III 4d IV 4d V 4d7 1,995 II 4c III 4c IV 4c V 4c8 1,585 II 4b III 4b IV 4b V 4b9 1,259 II 4a III 4a IV 4a V 4a10 1,000 I 4e II 4e III 4e IV 4e V 4e11 794 I 4d II 4d III 4d IV 4d V 4d12 631 I 4c II 4c III 4c IV 4c V 4c13 501 I 4b II 4b III 4b IV 4b V 4b14 398 I 4a II 4a III 4a IV 4a V 4a15 316 I 3e II 3e III 3e IV 3e V 3e16 251 I 3d II 3d III 3d IV 3d V 3d17 200 I 3c II 3c III 3c IV 3c V 3c18 159 I 3b II 3b III 3b IV 3b V 3b19 126 I 3a II 3a III 3a IV 3a V 3a20 100 I 2e II 2e III 2e IV 2e V 2e21 79 I 2d II 2d III 2d IV 2d V 2d22 63 I 2e II 2c III 2c IV 2c V 2c23 50 I 2b II 2b III 2b IV 2b V 2b24 40 I 2a II 2a III 2a IV 2a V 2a25 32 I 1e II 1e III 1e IV 1e V 1e26 25 I 1d II 1d III 1d IV 1d V 1d27 20 I 1c II 1c III 1c IV 1c V 1c28 16 I 1b II 1b III 1b IV 1b V 1b29 13 I 1a II 1a III 1a IV 1a V 1a30 10 I 4e I 1e II 1e III 1e IV 1e31 8 I 4d I 1d II 1d III 1d IV 1d32 6 I 4c I 1c II 1c III 1c IV 1c33 5 I 4b I 1b II 1b III 1b IV 1b34 4 I 4a I 1a II 1a III 1a IV 1a35 3.2 I 3e I 4e I 1e II 1e III 1e36 2.5 I 3d I 4d I 1d II 1d III 1d37 2.0 I 3c I 4c I 1c II 1c III 1c38 1.6 I 3b I 4b I 1b II 1b III 1b39 1.3 I 3a I 4a I 1a II 1a III 1a40 1.0 I 2e I 3e I 4e I 1e II 1e41 0.8 I 2d I 3d I 4d I 1d II 1d42 0.6 I 2c I 3c II 4c I 1c II 1c43 0.5 I 2b I 3b I 4b I 1b II 1b44 0.4 I 2a I 3a I 4a I 1a II 1a45 0.32 I 1e I 2e I 3e I 4e I 1e46 0.25 I 1d I 2d I 3d I 4d I 1d47 0.20 I 1c I 2c I 3c I 4c I 1c48 0.16 I 1b I 2b I 3b I 4b I 1b49 0.13 I 1a I 2a I 3a I 4a I 1a50 0.10 I 1e I 2e I 3e I 4e51 0.08 I 1d I 2d I 3d I 4d

REV. A10 9/98 PN 47653 HUMPHREY FIELD ANALYZER II
APPENDIX A A-13
REV. A 10/98 PN 47653-1 HUMPHREY FIELD ANALYZER IIHUMPHREY FIELD ANALYZER II
Conversion Tables: Goldmann Units to Decibels
Table D-2 Using a size I target 4 3 2 1
e d c b a e d c b a e d c b a e d c b a0 15 16 17 18 19 20 21 22 23 24 25 26 27 28 29 30 31 32 33 34I 10 11 12 13 14 15 16 17 18 19 20 21 22 23 24 25 26 27 28 29II 5 6 7 8 9 10 11 12 13 14 15 16 17 18 19 20 21 22 23 24III 0 1 2 3 4 5 6 7 8 9 10 11 12 13 14 15 16 17 18 19
Table D-3 Using a size II target 4 3 2 1
e d c b a e d c b a e d c b a e d c b a0 20 21 22 23 24 25 26 27 28 29 30 31 32 33 34 35 36 37 38 39I 15 16 17 18 19 20 21 22 23 24 25 26 27 28 29 30 31 32 33 34II 10 11 12 13 14 15 16 17 18 19 20 21 22 23 24 25 26 27 28 29III 5 6 7 8 9 10 11 12 13 14 15 16 17 18 19 20 21 22 23 24IV 0 1 2 3 4 5 6 7 8 9 10 11 12 13 14 15 16 17 18 19
Table D-4 Using a size III target 4 3 2 1
e d c b a e d c b a e d c b a e d c b a0 25 26 27 28 29 30 31 32 33 34 35 36 37 38 39 40 41 42 43 44I 20 21 22 23 24 25 26 27 28 29 30 31 32 33 34 35 36 37 38 39II 15 16 17 18 19 20 21 22 23 24 25 26 27 28 29 30 31 32 33 34III 10 11 12 13 14 15 16 17 18 19 20 21 22 23 24 25 26 27 28 29IV 5 6 7 8 9 10 11 12 13 14 15 16 17 18 19 20 21 22 23 24V 0 1 2 3 4 5 6 7 8 9 10 11 12 13 14 15 16 17 18 19
Table D-5 Using a size IV target 4 3 2 1
e d c b a e d c b a e d c b a e d c b a0 30 31 32 33 34 35 36 37 38 39 40 41 42 43 44 45 46 47 48 49I 25 26 27 28 29 30 31 32 33 34 35 36 37 38 39 40 41 42 43 44II 20 21 22 23 24 25 26 27 28 29 30 31 32 33 34 35 36 37 38 39III 15 16 17 18 19 20 21 22 23 24 25 26 27 28 29 30 31 32 33 34IV 10 11 12 13 14 15 16 17 18 19 20 21 22 23 24 25 26 27 28 29V 5 6 7 8 9 10 11 12 13 14 15 16 17 18 19 20 21 22 23 24
Table D-6 Using a size V target 4 3 2 1
e d c b a e d c b a e d c b a e d c b a0 35 36 37 38 39 40 41 42 43 44 45 46 47 48 49 50 51 52 53 54I 30 31 32 33 34 35 36 37 38 39 40 41 42 43 44 45 46 47 48 49II 25 26 27 28 29 30 31 32 33 34 35 36 37 38 39 40 41 42 43 44III 20 21 22 23 24 25 26 27 28 29 30 31 32 33 34 35 36 37 38 39IV 15 16 17 18 19 20 21 22 23 24 25 26 27 28 29 30 31 32 33 34V 10 11 12 13 14 15 16 17 18 19 20 21 22 23 24 25 26 27 28 29
APPENDIX D D-3
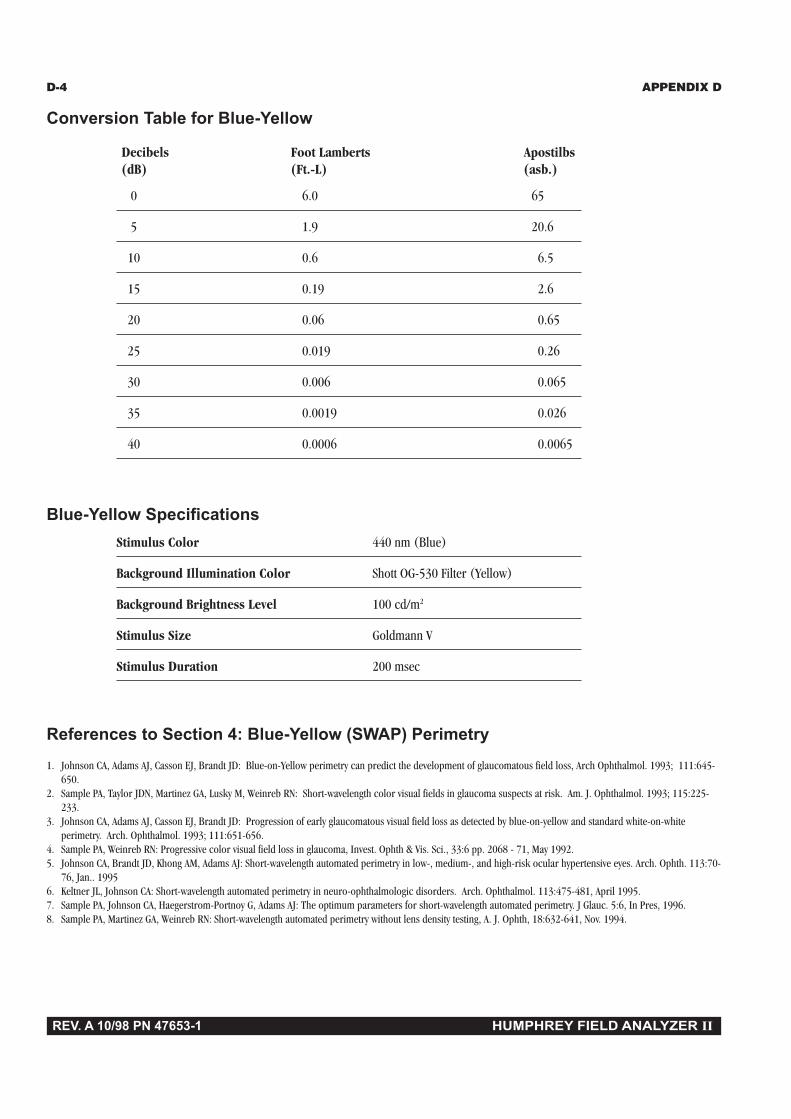
D-4 APPENDIX D
Conversion Table for Blue-Yellow
Decibels Foot Lamberts Apostilbs(dB) (Ft.-L) (asb.)
0 6.0 65
5 1.9 20.6
10 0.6 6.5
15 0.19 2.6
20 0.06 0.65
25 0.019 0.26
30 0.006 0.065
35 0.0019 0.026
40 0.0006 0.0065
Blue-Yellow SpecificationsStimulus Color 440 nm (Blue)
Background Illumination Color Shott OG-530 Filter (Yellow)
Background Brightness Level 100 cd/m2
Stimulus Size Goldmann V
Stimulus Duration 200 msec
References to Section 4: Blue-Yellow (SWAP) Perimetry
1. Johnson CA, Adams AJ, Casson EJ, Brandt JD: Blue-on-Yellow perimetry can predict the development of glaucomatous field loss, Arch Ophthalmol. 1993; 111:645-650.
2. Sample PA, Taylor JDN, Martinez GA, Lusky M, Weinreb RN: Short-wavelength color visual fields in glaucoma suspects at risk. Am. J. Ophthalmol. 1993; 115:225-233.
3. Johnson CA, Adams AJ, Casson EJ, Brandt JD: Progression of early glaucomatous visual field loss as detected by blue-on-yellow and standard white-on-whiteperimetry. Arch. Ophthalmol. 1993; 111:651-656.
4. Sample PA, Weinreb RN: Progressive color visual field loss in glaucoma, Invest. Ophth & Vis. Sci., 33:6 pp. 2068 - 71, May 1992.5. Johnson CA, Brandt JD, Khong AM, Adams AJ: Short-wavelength automated perimetry in low-, medium-, and high-risk ocular hypertensive eyes. Arch. Ophth. 113:70-
76, Jan.. 19956. Keltner JL, Johnson CA: Short-wavelength automated perimetry in neuro-ophthalmologic disorders. Arch. Ophthalmol. 113:475-481, April 1995.7. Sample PA, Johnson CA, Haegerstrom-Portnoy G, Adams AJ: The optimum parameters for short-wavelength automated perimetry. J Glauc. 5:6, In Pres, 1996.8. Sample PA, Martinez GA, Weinreb RN: Short-wavelength automated perimetry without lens density testing, A. J. Ophth, 18:632-641, Nov. 1994.
REV. A10 9/98 PN 47653 HUMPHREY FIELD ANALYZER IIREV. A 10/98 PN 47653-1 HUMPHREY FIELD ANALYZER II
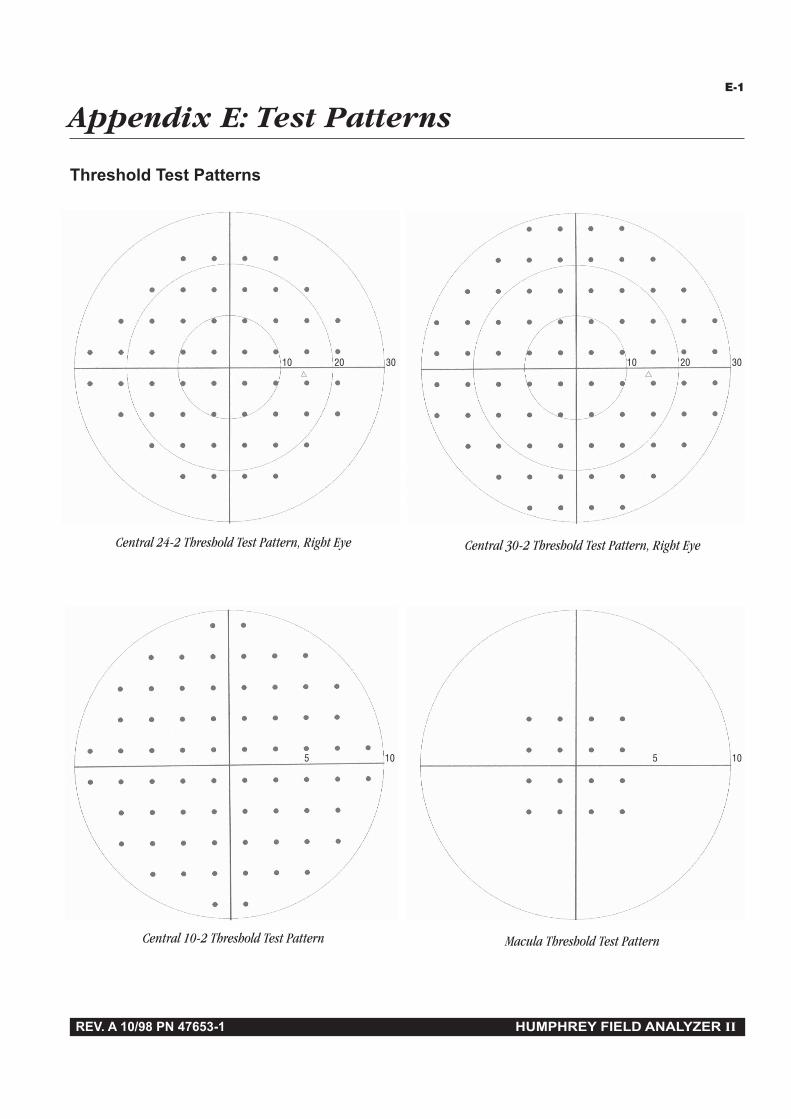
Appendix E: Test PatternsE-1
REV. A10 9/98 PN 47653 HUMPHREY FIELD ANALYZER IIREV. A 10/98 PN 47653-1 HUMPHREY FIELD ANALYZER II
10 3020 10 3020
5 10 5 10
Central 30-2 Threshold Test Pattern, Right EyeCentral 24-2 Threshold Test Pattern, Right Eye
Threshold Test Patterns
Macula Threshold Test PatternCentral 10-2 Threshold Test Pattern

REV. A10 9/98 PN 47653 HUMPHREY FIELD ANALYZER II
A-16 APPENDIX A
REV. A 10/98 PN 47653-1 HUMPHREY FIELD ANALYZER II
E-2 APPENDIX E
10 30 40 50 6020 10 20 30 40 50 60
Peripheral 60-4 Threshold Test Pattern, Right EyeNasal Step Threshold Test Pattern, Right Eye
Threshold Test Patterns
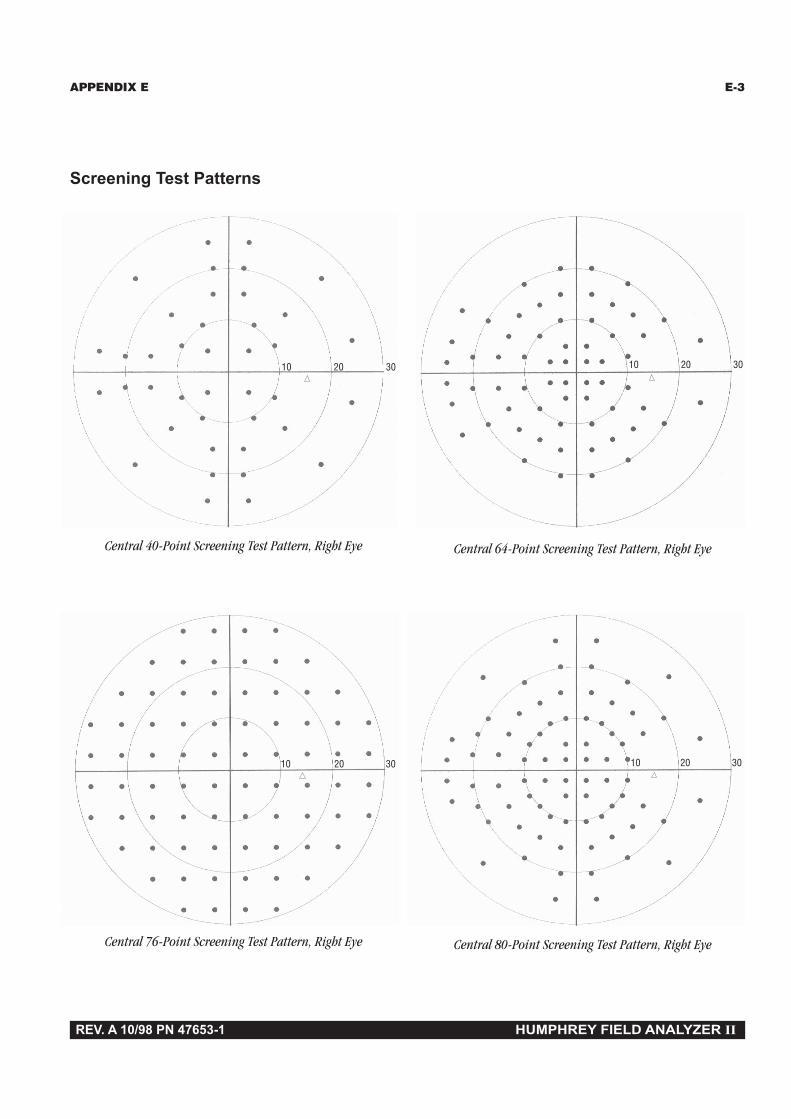
REV. A10 9/98 PN 47653 HUMPHREY FIELD ANALYZER II
APPENDIX A A-17
REV. A 10/98 PN 47653-1 HUMPHREY FIELD ANALYZER IIHUMPHREY FIELD ANALYZER II
APPENDIX E E-3
20 3010 20 3010
10 20 3010 3020
Central 64-Point Screening Test Pattern, Right EyeCentral 40-Point Screening Test Pattern, Right Eye
Screening Test Patterns
Central 80-Point Screening Test Pattern, Right EyeCentral 76-Point Screening Test Pattern, Right Eye
kjkljoo

REV. A10 9/98 PN 47653 HUMPHREY FIELD ANALYZER II
A-18 APPENDIX A
REV. A 10/98 PN 47653-1 HUMPHREY FIELD ANALYZER II
E-4 APPENDIX E
3010 20 40 50 602010 30
10 20 30 40 50 60 10 20 30 40 50 60
Full Field Armaly Screening Test Pattern, Right EyeCentral Armaly Screening Test Pattern, Right Eye
Screening Tests Patterns
Peripheral 60 Screening Test Pattern, Right EyeNasal Step Screening Test Pattern, Right Eye
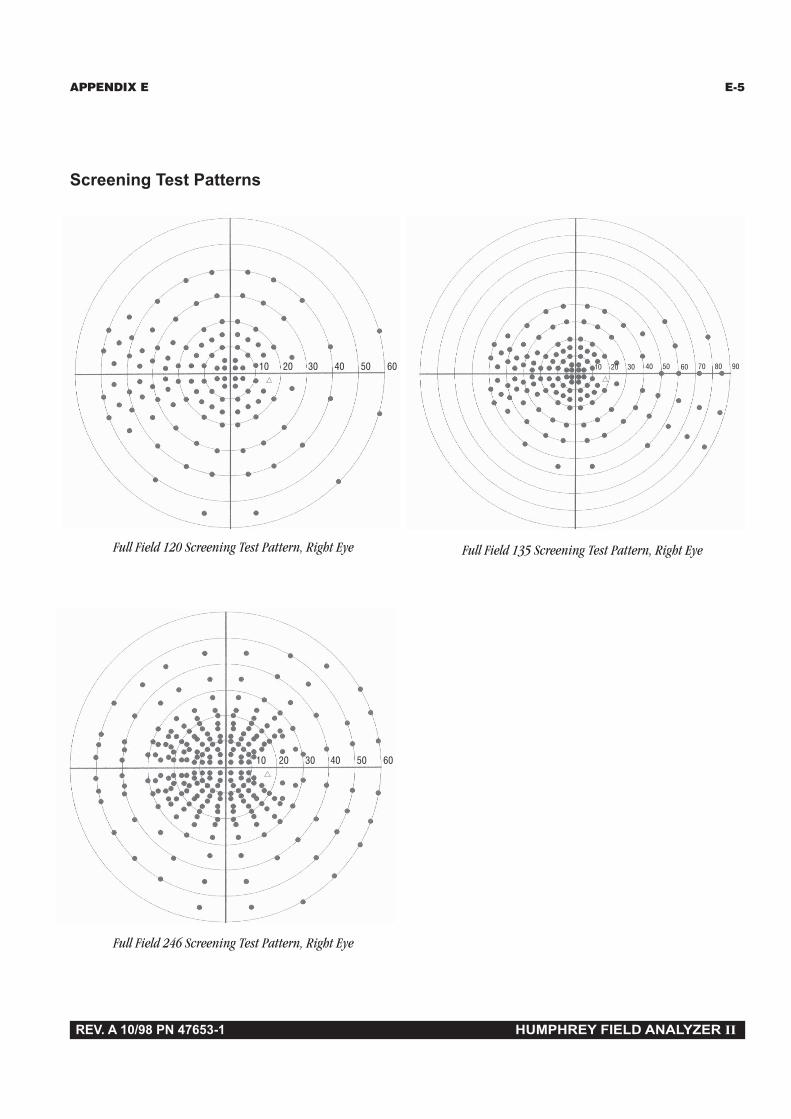
REV. A10 9/98 PN 47653 HUMPHREY FIELD ANALYZER II
APPENDIX A A-19
REV. A 10/98 PN 47653-1 HUMPHREY FIELD ANALYZER IIHUMPHREY FIELD ANALYZER II
APPENDIX E E-5
40 50 602010 30 5040 60 9070 802010 30
40 50 602010 30
Full Field 135 Screening Test Pattern, Right EyeFull Field 120 Screening Test Pattern, Right Eye
Screening Test Patterns
Full Field 246 Screening Test Pattern, Right Eye

REV. A10 9/98 PN 47653 HUMPHREY FIELD ANALYZER II
A-20 APPENDIX A
REV. A 10/98 PN 47653-1 HUMPHREY FIELD ANALYZER II
E-6 APPENDIX E
40302010 50 60 40302010 50 60
30 4050 60
7080 90
1020
4050 6030
7080 90
1020
Superior 64 Screening Test Pattern, Right EyeSuperior 36 Screening Test Pattern, Right Eye
Specialty Tests Patterns
Esterman Binocular Test PatternEsterman Monocular Test Pattern, Right Eye
REV. A10 9/98 PN 47653 HUMPHREY FIELD ANALYZER II
APPENDIX A A-21
REV. A 10/98 PN 47653-1 HUMPHREY FIELD ANALYZER IIHUMPHREY FIELD ANALYZER II
Please take a moment to read the following information before attempting to install any newHFA II software.
Backup all data first Make sure you have backed up (made copies of) all of your data. You should becareful to ensure you have copies of all your data on either floppy disks (all models) orstreamer tape (model 750). Refer to Section 9: “Database Management” for instructions onhow to back up your data.
Identify the current software Identify the software your instrument is currently running. Turn on your instrument and allowit to warm up. In the upper, left-hand corner of the Main Menu screen, the software revisionwill be identified (e.g. “Rev. AX - 4 MB RAM”). Follow the appropriate directions belowaccording to your current software.
If you are currently running Current users of A6 or later software should follow the step-by-step instructions that begin onrecent HFA II software the following pages.
If you are currently You may install HFA II software over revision A5 or earlier software. But, if your HFA II has arunning A5 or earlier software hard disk drive, you will need to upgrade the database on your HFA II as part of the
installation. In addition, all HFA II owners will have to upgrade any floppy disks with patienttests stored using A5 or earlier software before continuing their use. Refer to the instructionsentitled A6 Software Installation Notes (PN 30223), which were enclosed with the A6 updatematerial for details. The installation of any new software will be identical to the A6 softwareinstallation and upgrade procedure described in that document. Be careful to follow thedirections in that document. If you do not have a copy of the A6 Software Installation Notes,please call Humphrey Systems at 1-800-341-6968 to request a copy before attempting newsoftware installation.
If you have trouble If a system error occurs during any part of the installation process:installing your new 1. Remove the floppy disk from the disk drive and power down the unit.software 2. Repeat the installation process starting at Step 1 (see next page).
If the system failure occurs a second time, call Humphrey Customer Service at 1-800-341-6968to obtain advice or a new set of software.
Appendix F: Installing New HFA II Software
F-1

REV. A10 9/98 PN 47653 HUMPHREY FIELD ANALYZER II
A-22 APPENDIX A
REV. A 10/98 PN 47653-1 HUMPHREY FIELD ANALYZER II
SOFTWAREINSTALLATION
The HFA II software is been supplied to you on 3 floppy disks. Each floppy disk has beenmarked “System Software ‘X’,” where “X” is the letter or number of the software release. Thedisks have also been labeled “Disk 1,” “Disk 2,” and “Disk 3”. Be sure you have received thecorrect disks before beginning the installation, and make sure you have copies or havebacked-up all of your data. The total time for software installation is about 15 minutes.
1With the HFA II turnedoff, insert Disk 1 into the
floppy disk drive.
Turn on the HFA II.
2 The first screen willhave a button in the
lower, left-hand cornerlabeled INSTALL NOW. Pressthis button to begin theinstallation.
3 An “Installation In Progress” pop-up window will display the percent completion of theinstallation. Floppy disks are exchanged at approximately 23% and 67% of the installation.
4 When prompted forDisk 2, remove
Disk 1 by pressing the ejectbutton on the floppy drive.Insert Disk 2. Press OK.
F-2 APPENDIX F

REV. A10 9/98 PN 47653 HUMPHREY FIELD ANALYZER II
APPENDIX A A-23
REV. A 10/98 PN 47653-1 HUMPHREY FIELD ANALYZER IIHUMPHREY FIELD ANALYZER II
5 When prompted forDisk 3, remove Disk 2.
Insert Disk 3. Press OK.
6 After “InstallationSuccessful” appears on
the screen, remove Disk 3 fromthe floppy drive.
Turn the HFA II off. Wait 10seconds, then turn the powerback on.
APPENDIX F F-3
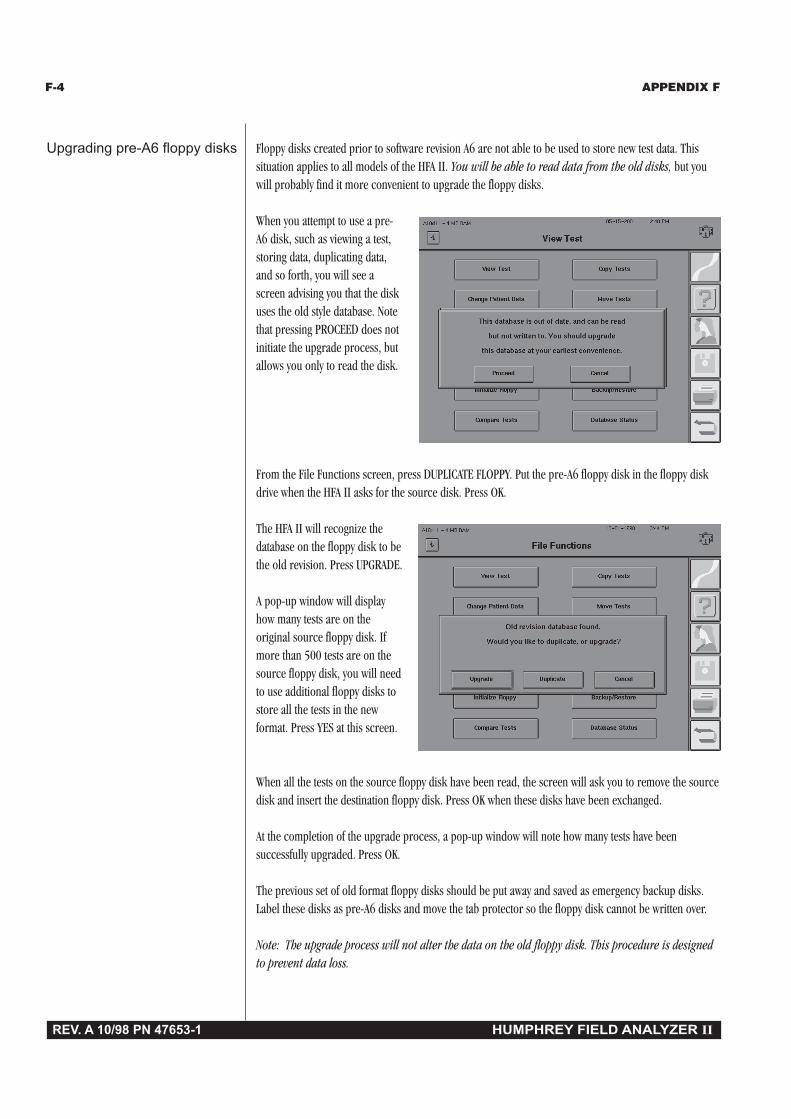
REV. A10 9/98 PN 47653 HUMPHREY FIELD ANALYZER II
A-24 APPENDIX A
REV. A 10/98 PN 47653-1 HUMPHREY FIELD ANALYZER II
F-4 APPENDIX F
Upgrading pre-A6 floppy disks Floppy disks created prior to software revision A6 are not able to be used to store new test data. Thissituation applies to all models of the HFA II. You will be able to read data from the old disks, but youwill probably find it more convenient to upgrade the floppy disks.
When you attempt to use a pre-A6 disk, such as viewing a test,storing data, duplicating data,and so forth, you will see ascreen advising you that the diskuses the old style database. Notethat pressing PROCEED does notinitiate the upgrade process, butallows you only to read the disk.
From the File Functions screen, press DUPLICATE FLOPPY. Put the pre-A6 floppy disk in the floppy diskdrive when the HFA II asks for the source disk. Press OK.
The HFA II will recognize thedatabase on the floppy disk to bethe old revision. Press UPGRADE.
A pop-up window will displayhow many tests are on theoriginal source floppy disk. Ifmore than 500 tests are on thesource floppy disk, you will needto use additional floppy disks tostore all the tests in the newformat. Press YES at this screen.
When all the tests on the source floppy disk have been read, the screen will ask you to remove the sourcedisk and insert the destination floppy disk. Press OK when these disks have been exchanged.
At the completion of the upgrade process, a pop-up window will note how many tests have beensuccessfully upgraded. Press OK.
The previous set of old format floppy disks should be put away and saved as emergency backup disks.Label these disks as pre-A6 disks and move the tab protector so the floppy disk cannot be written over.
Note: The upgrade process will not alter the data on the old floppy disk. This procedure is designedto prevent data loss.

REV. A10 9/98 PN 47653 HUMPHREY FIELD ANALYZER II
APPENDIX A A-25
REV. A 10/98 PN 47653-1 HUMPHREY FIELD ANALYZER IIHUMPHREY FIELD ANALYZER II
To better explain how SITA works, we will use analogies. Think of perimetry testingas taking a patient’s case history. Think of SITA as an experienced doctor. Think ofcurrent perimetry strategies as student doctors. With these analogies in mind, wewill describe how SITA reduces test time in the following four ways:
1. SITA Asks Smart QuestionsThe importance of asking smart questions is familiar to any experienced doctor. When studentstake a patient’s case history, they often ask questions that are off the mark and do not yieldcritical information. They sometimes miss clues that the patient is offering—information whichcould lead directly to the proper diagnosis if pursued. After many years of taking histories,however, experience teaches practitioners precision and economy in framing their questions.
Good perimetry is similar to taking a good history. It is a matter of getting information from thepatient in a quick and efficient manner. In perimetry, the most critical factors are the following:
A. Start with stimuli at each point that are already very near the threshold, thus avoidingthe long, inefficient process of gradually brightening or dimming the stimulus whilesearching for the threshold.
B. Make optimal use of the information contained in the patient’s responses to thosestimuli. This is important both in terms of calculating the threshold at the point beingtested, and in terms of determining how bright the initial stimulus should be at thenext point to be tested.
SITA considers many factors in determining what stimuli to present at each point during the test.These factors include age, normative data, detailed characteristics of abnormal and normaltests, and patient responses so far in the test. They are combined and weighted into the SITA
visual field model, which continually updates calculations of the threshold at each point.
2. SITA Tailors the Testing Pace to the IndividualWhen taking a history, all doctors know that some patients are quick to respond to questionsand others are not. If they rush elderly patients, they will not get much good information. Ifthey go too slowly with young, bright patients they may lose both their interest and theircooperation.
In a threshold test, fewer than half of the stimuli will be seen. Thus, the perimeter must decidehow long to wait after stimulus presentation before moving to the next point. The test mustallow a reasonable amount of time between presentations, but waiting too long will unneces-sarily prolong testing and make the test uninteresting. Thus, it is very important to know howquickly a particular patient reacts to stimuli and to make careful use of that information. If atest proceeds too slowly, the patient may get frustrated and fatigued, and the results may,therefore, be inaccurate.
Appendix G: How SITA Works / Acknowledgements

REV. A10 9/98 PN 47653 HUMPHREY FIELD ANALYZER II
A-26 APPENDIX A
REV. A 10/98 PN 47653-1 HUMPHREY FIELD ANALYZER II
The original Humphrey Full Threshold testing algorithm measured patient response time andmade small adjustments to test pacing. SITA takes this idea much further using patented timingtechniques. It is extraordinarily responsive to patient reaction times. One way to think aboutSITA is that the patient runs the perimeter, rather than the reverse.
3. SITA Knows When to QuitStudent doctors are often given a list of questions to ask while taking histories. At first they willadhere to that list, even when they already have more than enough information to make theproper diagnosis. Later on, they start learning when to stop, and they also develop a sense ofwhen to probe further on issues which the patient did not make clear enough.
SITA does the same thing. SITA knows when enough is enough. The standard Full Thresholdalgorithm used in the Humphrey Field Analyzer II crosses the threshold twice. It quits onlyafter the answer is near what is expected. When the answer is different from the expectedvalue, the measurement is repeated—again crossing the threshold twice.
Using such fixed criteria, sometimes too much information is gathered, and sometimes notenough. SITA computes when to stop testing at each location, based on a patented “informationindex.” This technique allows the instrument to spend extra time at test locations where SITA isunsure about the result, and to spend less time at locations where the answers are highlyconsistent.
When the information index reaches a predetermined value, testing at that point is discontin-ued—the point is then closed. The information index depends not only on patient responses atthat location, but also on responses to stimuli presented at other locations nearby. Thus, it ispossible that a test point residing in a part of the visual field where all measured thresholdswere more or less in agreement might be closed earlier than a test point in a more variableregion. This might happen even if the responses at these two test points were otherwiseidentical.
4. SITA Carefully Recalculates All Threshold Values at the End of TestingExperienced doctors tend to be very skilled at putting the puzzle together. At the end of theexamination, they assess all of the information and make a diagnosis which is consistent withall of the available data. SITA does the same thing, ignoring nothing. At the end of the test itthinks the problem through, completely, one last time.
The original Humphrey algorithm—and other methods in current use—base the calculatedthreshold on the last apparent crossing of threshold. All answers leading up to that finalcrossing are ignored, and all answers at adjacent points are ignored as well. Such an approachis highly vulnerable to patient response errors.
SITA looks at the complete pattern of patient responses at each tested point. During the test allresponses are considered, not just the last seen value. At the end of the exam, SITA againconsiders the totality of the responses at each point and recalculates the whole field result toproduce a further refinement of its measurements.
G-2 APPENDIX G

REV. A10 9/98 PN 47653 HUMPHREY FIELD ANALYZER II
APPENDIX A A-27
REV. A 10/98 PN 47653-1 HUMPHREY FIELD ANALYZER IIHUMPHREY FIELD ANALYZER II
SITA acknowledgments A number of people have been instrumental over the years in the development of SITA.Without their dedication and years of hard work, this revolutionary perimetric algorithmwould not be available for you today. We are grateful to the following team of perimetricpioneers:
Department of Ophthalmology, University of LundMalmö General Hospital, Malmö, SwedenBoel Bengtsson Anders Heijl, M.D., Ph.D.
Department of Mathematical StatisticsUniversity of Lund, Lund, Sweden
Jonny Olsson, Ph.D. Holger Rootzén, Ph.D.
Humphrey Systems, Dublin, CaliforniaWill Matievich Vincent Michael Patella, O.D.
Over one-thousand subjects from around the world were recruited to participate for the multipleperimetry tests necessary to develop the STATPAC for SITA database. Research centers located around theworld assisted in the collection of data over a two year period. Our thanks goes out to the hundreds ofauxiliary personnel who assisted in this project.
We are especially grateful to the following researchers who acted as principal investigators for theiruniversities, hospitals, and clinics in the recruitment of subjects and in the collection of data. None ofthese individuals, however, has endorsed or approved the final package. We could not have developedSTATPAC for SITA without their kind help.
Douglas R. Anderson, M.D. Bascom Palmer Eye Institute, MiamiPaul Chew, M.D. National University Hospital, SingaporeSek Jin Chew, M.D. & Paul Foster, FRCS National Eye Centre, SingaporeStephen M. Drance, O.C., M.D. Univ. of British Columbia, VancouverMurray Fingeret, O.D. St. Albans VA Hospital, New YorkAnders Heijl, M.D., Ph.D. & Boel Bengtsson University of Lund, MalmöAiko Iwase, M.D. Tajimi Hospital, TajimiChris A. Johnson, Ph.D. University of California, DavisYoshiaki Kitazawa, M.D. Gifu University, GifuC. Matsumoto, M.D. Kinki University, OsakaJean-Philippe Nordmann, M.D. Hôpital Tenon, ParisHarry A. Quigley, M.D. Wilmer Institute, BaltimoreR. Ramakrishnan, M.D. Aravind Eye Hospital, MaduraiAlan L. Robin, M.D. Wilmer Institute; Univ. of MarylandG. Chandra Sekhar, M.D. L.V. Prasad Eye Institute, HyderabadRavi Thomas, M.D. Schell Eye Hospital, VelloreL. Vijaya, M.D. Medical Research Foundation, MadrasJohn M. Wild, Ph.D. Aston University, Birmingham
APPENDIX G G-3

REV. A10 9/98 PN 47653 HUMPHREY FIELD ANALYZER II
A-28 APPENDIX A
REV. A 10/98 PN 47653-1 HUMPHREY FIELD ANALYZER II
G-4 APPENDIX G

REV. A10 9/98 PN 47653 HUMPHREY FIELD ANALYZER II
APPENDIX A A-29
REV. A 10/98 PN 47653-1 HUMPHREY FIELD ANALYZER IIHUMPHREY FIELD ANALYZER II
The following are a number of situations which may occur when using your HFA II. Not all potential situations are listed nor are all thepossible solutions. Please refer to the section numbers found in the parentheses “( )” to find additional information on the subject ofconcern in this User’s Guide. Additional information may also be found on the web site for Humphrey Systems: www.humphrey.com
Should you still have difficulties after attempting to solve your problem, call Humphrey Customer Service at 1-800-341-6968. Have thisUser’s Guide available, print a copy of the System Log and know your HFA II model and serial number before calling Customer Service.
To find the Model and Serial Number (1)• Look on the rear panel of the HFA II to find the information plate attached near the cable connections
in the lower right-hand corner of the instrument.• These numbers may also be found at the top of the System Log or on the Unit Configuration (“i” Information) screen.
Write these numbers here for future reference:
Model Number: _______________________________
Serial Number: _______________________________
How to print the System Log (2) How to print the Unit Configuration information (2)• Start at the Main Menu. •Press the “i” button in the upper left-hand corner of most screens.• Press System Setup icon. - If the eye monitor is visible, press OFF to display “i” button.• Press PRINT SYSTEM LOG. •Press PRINT.
PROBLEM POSSIBLE CAUSE OR SOLUTION
Start-up Difficulties
HFA II will not turn on • Check power cord connections to HFA II, power table and wall outlet (1)• Check power switch on power table (1)• Check fuse in HFA II (near power switch) and power table (1, 12)
HFA II turns on but Main Menu • If black screen is present and patient response button drawing is visible,screen never appears press patient response button to verify error code - write down the error
code - then turn HFA II off then on again - if this continues call CustomerService and mention error code
• If this happens after installation of new software: Turn off HFA II, re-installsoftware starting with disk #1 in floppy drive - turn power on to HFA II andfollow directions
• Check brightness knob on right side of touch screen (1)• Check to see if patient response button is being down pressed in holder
Calibration screen displayed at start-up • Patient response button stuck in down position (12)- follow directions on screen or recycle power- lift patient response button out of holder; replace in proper direction
Appendix H: Troubleshooting
H-1
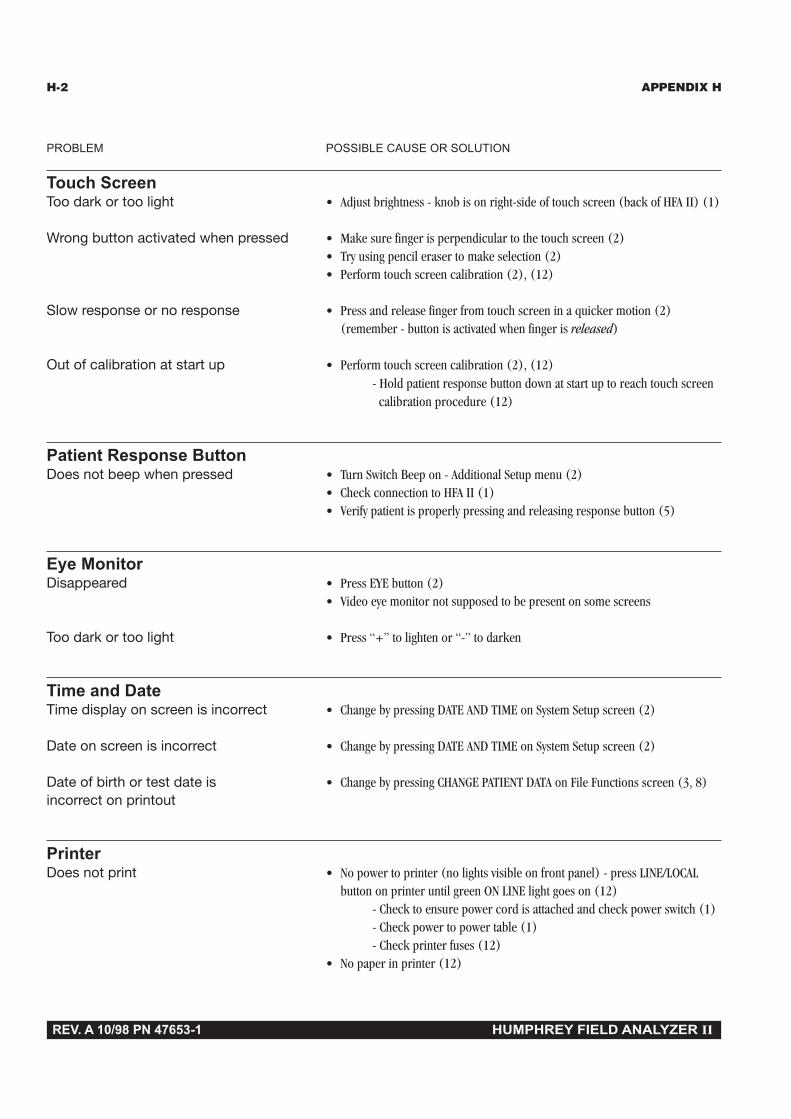
REV. A10 9/98 PN 47653 HUMPHREY FIELD ANALYZER II
A-30 APPENDIX A
REV. A 10/98 PN 47653-1 HUMPHREY FIELD ANALYZER II
PROBLEM POSSIBLE CAUSE OR SOLUTION
Touch ScreenToo dark or too light • Adjust brightness - knob is on right-side of touch screen (back of HFA II) (1)
Wrong button activated when pressed • Make sure finger is perpendicular to the touch screen (2)• Try using pencil eraser to make selection (2)• Perform touch screen calibration (2), (12)
Slow response or no response • Press and release finger from touch screen in a quicker motion (2)(remember - button is activated when finger is released)
Out of calibration at start up • Perform touch screen calibration (2), (12)- Hold patient response button down at start up to reach touch screen calibration procedure (12)
Patient Response ButtonDoes not beep when pressed • Turn Switch Beep on - Additional Setup menu (2)
• Check connection to HFA II (1)• Verify patient is properly pressing and releasing response button (5)
Eye MonitorDisappeared • Press EYE button (2)
• Video eye monitor not supposed to be present on some screens
Too dark or too light • Press “+” to lighten or “-” to darken
Time and DateTime display on screen is incorrect • Change by pressing DATE AND TIME on System Setup screen (2)
Date on screen is incorrect • Change by pressing DATE AND TIME on System Setup screen (2)
Date of birth or test date is • Change by pressing CHANGE PATIENT DATA on File Functions screen (3, 8)incorrect on printout
PrinterDoes not print • No power to printer (no lights visible on front panel) - press LINE/LOCAL
button on printer until green ON LINE light goes on (12)- Check to ensure power cord is attached and check power switch (1)- Check power to power table (1)- Check printer fuses (12)
• No paper in printer (12)
H-2 APPENDIX H

REV. A10 9/98 PN 47653 HUMPHREY FIELD ANALYZER II
APPENDIX A A-31
REV. A 10/98 PN 47653-1 HUMPHREY FIELD ANALYZER IIHUMPHREY FIELD ANALYZER II
PROBLEM POSSIBLE CAUSE OR SOLUTION
PrinterNo signal from HFA II or printer off-line • Printer off-line -Printrex: ON LINE light not on - press LINE / LOCAL (12)
• Check printer cable connection (1)• Check cable is correct and not damaged• Check to ensure correct printer is selected on System Setup menu (2)• Printer buffer full - turn off printer and turn back on• No printout selected to print (7)
Improper printout • Random characters or multiple pages printed- Check that correct printer is selected on System Setup menu (2)- Printer needs to be turned off to be reset
• Abnormal value printed- reprint visual field(printer occasionally prints double characters)
• Printrex printout blank - paper may be upside-down
Printouts fade over time • Do not store printouts in plastic covers or use adhesive tape onthermal paper (12)
Printout ProblemsNo change probability symbols on • GCP requires 3 tests to show change probability symbols (7)Glaucoma Change Probability (GCP)printout
No Single Field Analysis printout • Test pattern not eligible for STATPAC analysis (7)• One or more test parameters not valid for STATPAC (7)
Quad totals not shown • Available on Three-in-One printout only (7)
No SF or CPSD values on • SF and CPSD are not displayed when SITA test strategy is used (4, 7)threshold printout • Fluctuation was turned off for the test (CPSD is not calculated when
fluctuation is off)
Glaucoma Hemifield Test (GHT) • FastPac test strategy used (GHT not available with FastPac) (7)results not displayed • Test not eligible for STATPAC analysis (7)
Printout does not include all eligible • Some test parameters not valid for STATPAC (7)tests for a patient when printing • Patient name or date of birth incorrect on some tests (3, 8)Overview or Glaucoma Change • Search via RECALL PATIENT DATA - fix with Merge Patients feature (3, 8)Probability (GCP) printout • Sixteen (16) test maximum for Overview and GCP printouts (7)
APPENDIX H H-3

REV. A10 9/98 PN 47653 HUMPHREY FIELD ANALYZER II
A-32 APPENDIX A
REV. A 10/98 PN 47653-1 HUMPHREY FIELD ANALYZER II
PROBLEM POSSIBLE CAUSE OR SOLUTION
Blind Spot MonitorCan’t change Blind Spot size • HFA II uses same stimulus size for testing and Blind Spot check (3)
Can’t find blind spot • Realign patient (5)• Verify that proper eye is being tested (5)• Check to make sure the patient’s non-testing eye is occluded (5)• Make sure patient is not looking around but fixating on fixation light (5)• Select FIXATION button and then press RE-TRY TO FIND BLIND SPOT (5)
Blind Spot alarm beep • Same as “Can’t find blind spot” abovekeeps sounding • Blind Spot may be turned off during test by pressing FIXATION
Gaze TrackingGaze Tracking will not initialize • High power trial lens being used (5)
• Droopy eyelid - ask patient to open eye wider during initialization (5)• Interfering eyelashes - ask patient to open eye wider during initialization• Small pupils (5)• Excessive eye movement or blinking (5)• Dry eyes• Deep-set eyes
Head TrackingHead Tracking does not work • Head Tracking not turned on (2)
• Trial lens holder not in Up position (5)• Gaze Tracking was not initialized at the start of the test (5)
Head Tracking alarm • Patient’s chin not moving with the chin rest - re-instruct patient (5)activated too often • Reset Head Tracking (5)
• Turn off Head Tracking - press TURN OFF HEAD TRACKING
Vertex MonitoringVertex Monitoring does not work • Vertex Monitoring not turned on (2)
• Trial lens holder not in Up position (5)• Gaze Tracking was not initialized at the start of the test (5)
Vertex Monitoring alarm beep • Patient moving away from trial lens - reposition patient (5)goes off too often • Vertex Monitoring needs to be reset - press RE-INITIALIZE VERTEX (5)
• Turn off Vertex Monitoring - press TURN VERTEX OFF (5)
H-4 APPENDIX H
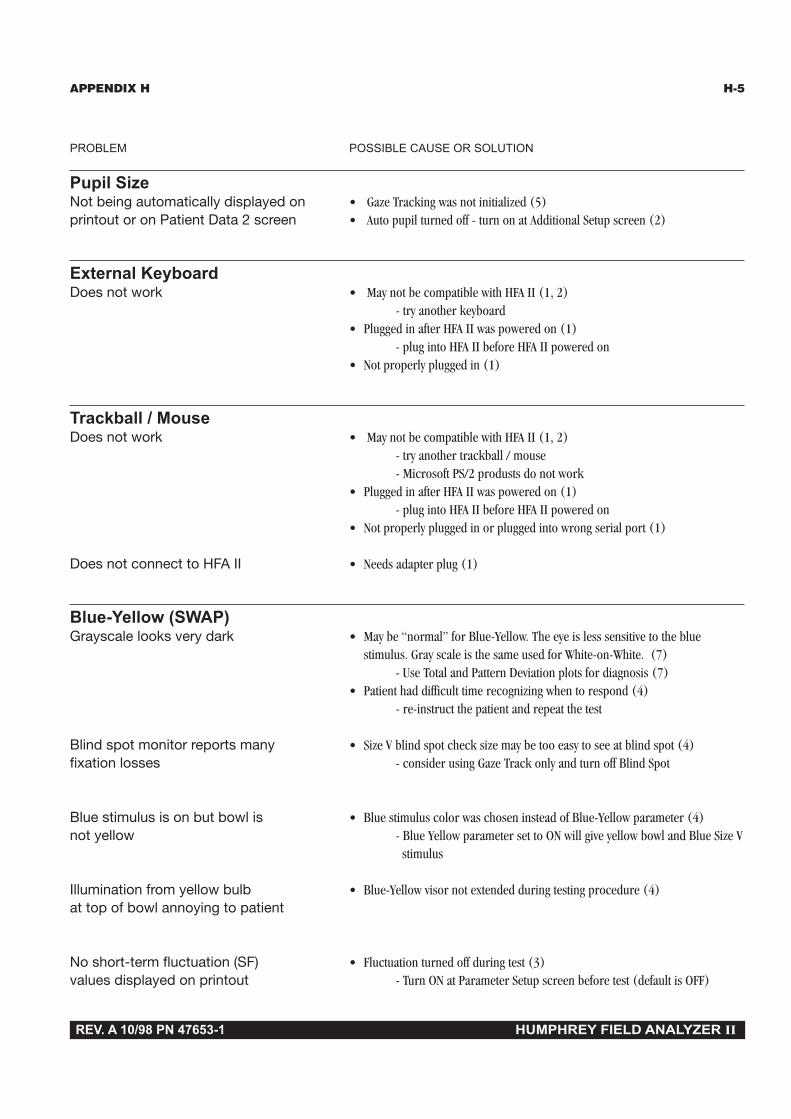
REV. A10 9/98 PN 47653 HUMPHREY FIELD ANALYZER II
APPENDIX A A-33
REV. A 10/98 PN 47653-1 HUMPHREY FIELD ANALYZER IIHUMPHREY FIELD ANALYZER II
PROBLEM POSSIBLE CAUSE OR SOLUTION
Pupil SizeNot being automatically displayed on • Gaze Tracking was not initialized (5)printout or on Patient Data 2 screen • Auto pupil turned off - turn on at Additional Setup screen (2)
External KeyboardDoes not work • May not be compatible with HFA II (1, 2)
- try another keyboard• Plugged in after HFA II was powered on (1)
- plug into HFA II before HFA II powered on• Not properly plugged in (1)
Trackball / MouseDoes not work • May not be compatible with HFA II (1, 2)
- try another trackball / mouse- Microsoft PS/2 produsts do not work
• Plugged in after HFA II was powered on (1)- plug into HFA II before HFA II powered on
• Not properly plugged in or plugged into wrong serial port (1)
Does not connect to HFA II • Needs adapter plug (1)
Blue-Yellow (SWAP)Grayscale looks very dark • May be “normal” for Blue-Yellow. The eye is less sensitive to the blue
stimulus. Gray scale is the same used for White-on-White. (7)- Use Total and Pattern Deviation plots for diagnosis (7)
• Patient had difficult time recognizing when to respond (4)- re-instruct the patient and repeat the test
Blind spot monitor reports many • Size V blind spot check size may be too easy to see at blind spot (4)fixation losses - consider using Gaze Track only and turn off Blind Spot
Blue stimulus is on but bowl is • Blue stimulus color was chosen instead of Blue-Yellow parameter (4)not yellow - Blue Yellow parameter set to ON will give yellow bowl and Blue Size V
stimulus
Illumination from yellow bulb • Blue-Yellow visor not extended during testing procedure (4)at top of bowl annoying to patient
No short-term fluctuation (SF) • Fluctuation turned off during test (3)values displayed on printout - Turn ON at Parameter Setup screen before test (default is OFF)
APPENDIX H H-5

REV. A10 9/98 PN 47653 HUMPHREY FIELD ANALYZER II
A-34 APPENDIX A
REV. A 10/98 PN 47653-1 HUMPHREY FIELD ANALYZER II
PROBLEM POSSIBLE CAUSE OR SOLUTION
Testing ProblemsTest completed immediately after • SIMULATION set to ONSTART button pressed - Go to Additional Setup screen, set SIMULATION to OFF
Full field test stops before complete • Trial lens holder in up position for peripheral portion of test- test peripheral field without a trial lens and put holder down (3)
Hard Disk ProblemsMessage indicating hard disk failure • Refer to “How to Handle Hard Disk Failures” for step-by-step instructions (9)
• Make sure external 5.25" floppy drive is not connected with the power off (8)
Patient names exist in database •Test results not saved with patient informationwithout test data - use CLEANUP HARD DISK DATABASE feature to remove (9)
Floppy Disk ProblemsFloppy cannot be used by HFA II • Disk may not be properly formatted (8)
- Use INITIALIZE FLOPPY feature (all previous data will be erased).• Disk may be the wrong format (8)
- Make sure you use only High Density (HD) 1.44 MB floppy disks- Do not use Super High Density (2.88 MB) disks
Floppy disk error is indicated • Disk may be damaged or corrupted (9)- Use REBUILD FLOPPY DATABASE feature (9)
Floppy disk must be updated • Data on disk is in HFA II pre-A6 software format (F)- Refer to Appendix F for upgrade / duplicate procedure
Data Transfer ProblemsTransfer of files between HFA I • Check cable attachments (8)and HFA II via serial cable does not work • RS-232 port settings are incorrect (2, 8, HFA I Manual)
•Tests missing after data transfer • Tests were ineligible to be transferred (8)
Data on 5.25" floppy disks corrupted • 5.25" floppy disks were used with incorrect format (8)after using external floppy drive
Routine CleaningAir Intake Filter • Clean every 6 months or when dirty (12)
Floppy disk drive • Clean every 6 months or when dirty (12)
H-6 APPENDIX H
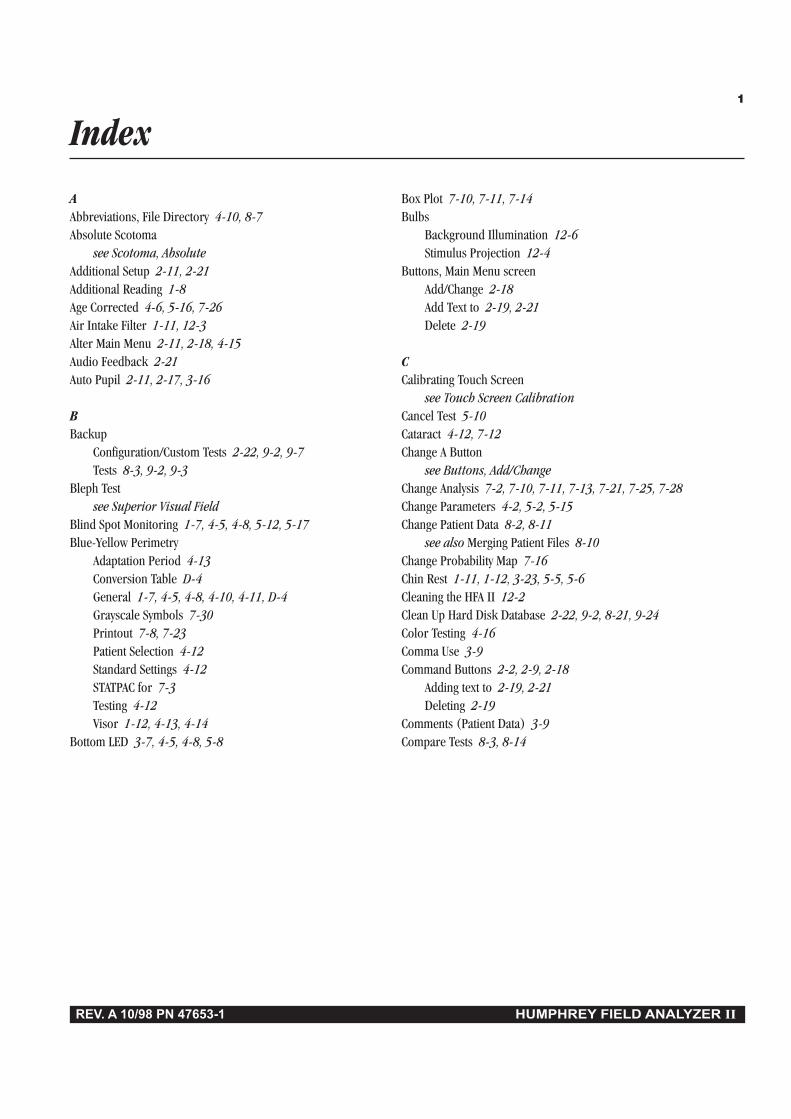
REV. A10 9/98 PN 47653 HUMPHREY FIELD ANALYZER IIREV. A 10/98 PN 47653-1 HUMPHREY FIELD ANALYZER II
AAbbreviations, File Directory 4-10, 8-7Absolute Scotoma
see Scotoma, AbsoluteAdditional Setup 2-11, 2-21Additional Reading 1-8Age Corrected 4-6, 5-16, 7-26Air Intake Filter 1-11, 12-3Alter Main Menu 2-11, 2-18, 4-15Audio Feedback 2-21Auto Pupil 2-11, 2-17, 3-16
BBackup
Configuration/Custom Tests 2-22, 9-2, 9-7Tests 8-3, 9-2, 9-3
Bleph Testsee Superior Visual Field
Blind Spot Monitoring 1-7, 4-5, 4-8, 5-12, 5-17Blue-Yellow Perimetry
Adaptation Period 4-13Conversion Table D-4General 1-7, 4-5, 4-8, 4-10, 4-11, D-4Grayscale Symbols 7-30Printout 7-8, 7-23Patient Selection 4-12Standard Settings 4-12STATPAC for 7-3Testing 4-12Visor 1-12, 4-13, 4-14
Bottom LED 3-7, 4-5, 4-8, 5-8
Box Plot 7-10, 7-11, 7-14Bulbs
Background Illumination 12-6Stimulus Projection 12-4
Buttons, Main Menu screenAdd/Change 2-18Add Text to 2-19, 2-21Delete 2-19
CCalibrating Touch Screen
see Touch Screen CalibrationCancel Test 5-10Cataract 4-12, 7-12Change A Button
see Buttons, Add/ChangeChange Analysis 7-2, 7-10, 7-11, 7-13, 7-21, 7-25, 7-28Change Parameters 4-2, 5-2, 5-15Change Patient Data 8-2, 8-11
see also Merging Patient Files 8-10Change Probability Map 7-16Chin Rest 1-11, 1-12, 3-23, 5-5, 5-6Cleaning the HFA II 12-2Clean Up Hard Disk Database 2-22, 9-2, 8-21, 9-24Color Testing 4-16Comma Use 3-9Command Buttons 2-2, 2-9, 2-18
Adding text to 2-19, 2-21Deleting 2-19
Comments (Patient Data) 3-9Compare Tests 8-3, 8-14
Index1

2 INDEX
REV. A 10/98 PN 47653-1 HUMPHREY FIELD ANALYZER II
ConfigurationBackup 2-22, 9-2, 9-8Restore 2-22, 9-2, 9-11
Copy Tests 8-3, 8-13, 8-15Copyright Information B-3Corrected Pattern Standard Deviation (CPSD) 4-15, 7-8, 7-12, 7-
21Cup/Disk Ratio 3-18Cursor 2-7Custom Testing
Adding Points 10-6Backup 9-8Button 2-21Creating Tests 10-2Deleting Tests 10-3, 10-15Erasing Points 10-12Field Size 10-5General Chapter 10Grids 10-4Naming 10-13Performing 10-17Point Spacing 10-5Printouts 10-19Saving 10-12Transferring 8-16
Customer Service H-1Customize Main Menu
see Alter Main Menu
DDatabase
Backup Section 9Clean Up Hard Disk 2-22, 9-2, 8-21, 9-24Errors 9-13Failure 9-13Management Section 9Merging 9-23Protection Procedures 9-3Rebuilding
see Rebuild DatabaseRestoring
see Restore DatabaseStatus 8-3, 8-21, 9-2
Dateof Birth 3-9,Search 8-7Set 2-10, 2-14
Delete A Buttonsee Buttons, Delete
Delete Tests 8-3, 8-15Demo Test 4-12, 5-3Diagnostic Code 3-15Diagnostics Button 2-22Directory Order 8-5Directory, Printing 8-2, 8-13Disk Options 8-4, 8-7Disks, Care Of 9-25, 12-13Display Status 5-2, 5-10, 5-14, 8-11Drop-Down Menu (or List) 2-5Duplicate Floppy 8-2, 8-13, 9-2, 9-3, 9-4, 9-5
EEnd of Test Screen 5-14Environmental Requirements A-1Esterman Disability Testing 3-6, 3-7, 3-24External Floppy Drive
see Floppy Drive, ExternalExternal Keyboard
see Keyboard, ExternalEye Monitor
see Video Eye MonitorEye Patch 3-22, 5-17
FFalse Negative Errors 6-6, 7-4, 7-21False Positive Errors 6-4, 7-4, 7-21FastPac™ Testing Strategy 4-8, 7-4, 7-13, 7-24Field of Vision 1-3File Directory 2-8, 8-4, 8-6, 8-7, 8-11File Functions 2-3, Section 8, 9-2Filter
Air Intake 1-11, 12-3Color 4-16
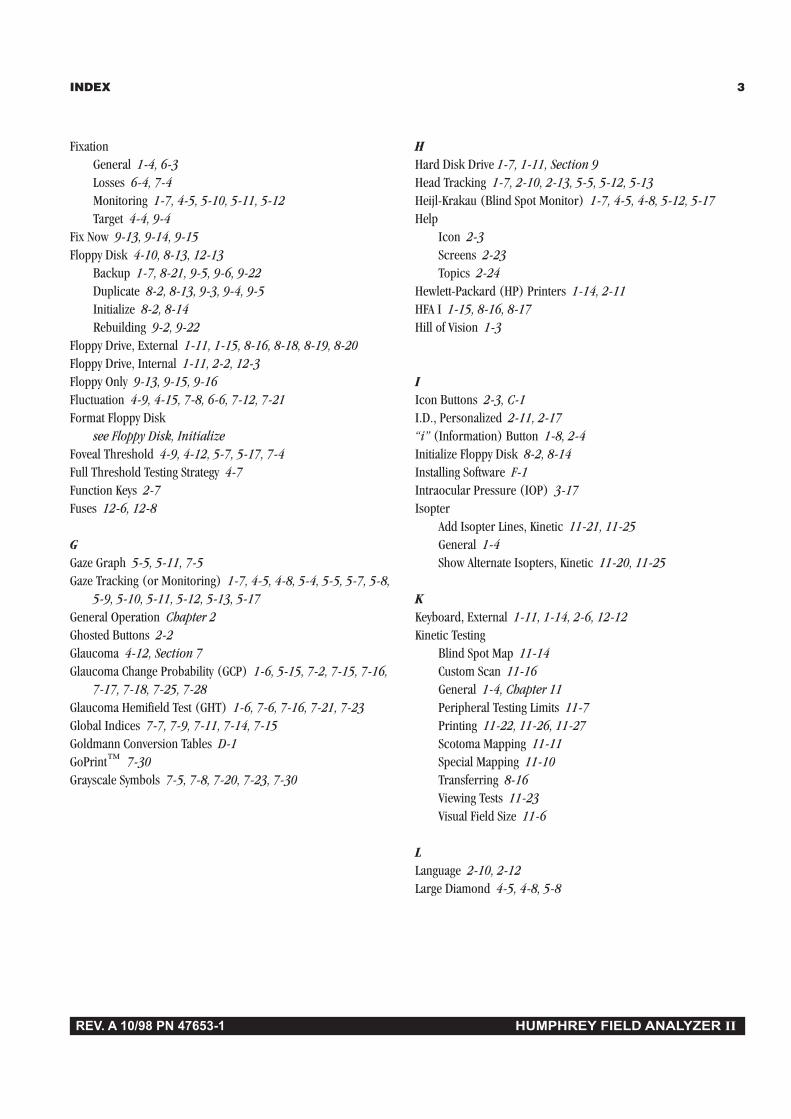
INDEX 3
REV. A 10/98 PN 47653-1 HUMPHREY FIELD ANALYZER II
FixationGeneral 1-4, 6-3Losses 6-4, 7-4Monitoring 1-7, 4-5, 5-10, 5-11, 5-12Target 4-4, 9-4
Fix Now 9-13, 9-14, 9-15Floppy Disk 4-10, 8-13, 12-13
Backup 1-7, 8-21, 9-5, 9-6, 9-22Duplicate 8-2, 8-13, 9-3, 9-4, 9-5Initialize 8-2, 8-14Rebuilding 9-2, 9-22
Floppy Drive, External 1-11, 1-15, 8-16, 8-18, 8-19, 8-20Floppy Drive, Internal 1-11, 2-2, 12-3Floppy Only 9-13, 9-15, 9-16Fluctuation 4-9, 4-15, 7-8, 6-6, 7-12, 7-21Format Floppy Disk
see Floppy Disk, InitializeFoveal Threshold 4-9, 4-12, 5-7, 5-17, 7-4Full Threshold Testing Strategy 4-7Function Keys 2-7Fuses 12-6, 12-8
GGaze Graph 5-5, 5-11, 7-5Gaze Tracking (or Monitoring) 1-7, 4-5, 4-8, 5-4, 5-5, 5-7, 5-8,
5-9, 5-10, 5-11, 5-12, 5-13, 5-17General Operation Chapter 2Ghosted Buttons 2-2Glaucoma 4-12, Section 7Glaucoma Change Probability (GCP) 1-6, 5-15, 7-2, 7-15, 7-16,
7-17, 7-18, 7-25, 7-28Glaucoma Hemifield Test (GHT) 1-6, 7-6, 7-16, 7-21, 7-23Global Indices 7-7, 7-9, 7-11, 7-14, 7-15Goldmann Conversion Tables D-1GoPrint™ 7-30Grayscale Symbols 7-5, 7-8, 7-20, 7-23, 7-30
HHard Disk Drive 1-7, 1-11, Section 9Head Tracking 1-7, 2-10, 2-13, 5-5, 5-12, 5-13Heijl-Krakau (Blind Spot Monitor) 1-7, 4-5, 4-8, 5-12, 5-17Help
Icon 2-3Screens 2-23Topics 2-24
Hewlett-Packard (HP) Printers 1-14, 2-11HFA I 1-15, 8-16, 8-17Hill of Vision 1-3
IIcon Buttons 2-3, C-1I.D., Personalized 2-11, 2-17“i” (Information) Button 1-8, 2-4Initialize Floppy Disk 8-2, 8-14Installing Software F-1Intraocular Pressure (IOP) 3-17Isopter
Add Isopter Lines, Kinetic 11-21, 11-25General 1-4Show Alternate Isopters, Kinetic 11-20, 11-25
KKeyboard, External 1-11, 1-14, 2-6, 12-12Kinetic Testing
Blind Spot Map 11-14Custom Scan 11-16General 1-4, Chapter 11Peripheral Testing Limits 11-7Printing 11-22, 11-26, 11-27Scotoma Mapping 11-11Special Mapping 11-10Transferring 8-16Viewing Tests 11-23Visual Field Size 11-6
LLanguage 2-10, 2-12Large Diamond 4-5, 4-8, 5-8

4 INDEX
REV. A 10/98 PN 47653-1 HUMPHREY FIELD ANALYZER II
Lenssee Trial Lens
License, Software B-3Linear Regression 7-11, 7-12, 7-19
MMacula Test 3-7, 8-16Main Menu Screen 2-3, 2-9, 5-16Mean Deviation (MD) 7-7Merge
Databases 8-3, 9-23Patient Files 3-14, 8-10
Model Number 1-8, 2-4Monitor, External VGA 1-15Mouse
see TrackballMove Tests 8-3, 8-15Multiple HFA IIs 9-25
OOperation, General Chapter 2Optional Components 1-14Organizing Patient Files 8-22O. U. Printout 7-26, 7-27Overview Printout 5-15, 7-2, 7-8, 7-9, 7-21, 7-24, 7-25, 7-28
P“p” Values
see Probability ValuesParameters
Change 5-2, 5-4, 5-7Kinetic 11-4Reset to Standard 4-3Screening 4-4STATPAC (Blue-Yellow) 7-3STATPAC (White-on-White) 7-3Test 4-2, 7-5Threshold 4-7
Partial Tests 5-11Parts, Replacement 12-4Patient
Changing Data 3-13, 8-2Clearing Data 3-13Data 2-3, 3-8, 3-15, 5-16, 8-11, 9-3Data 2 Screen 3-15, 3-18I.D. 3-8Instructions 3-22
Preparing for Testing 3-22, 3-23Recalling Data 3-13Reliability 1-4, Section 6Response Button 1-5, 1-11, 2-21, 12-6Search 3-14, 8-7Pattern Deviation Plots 7-7
Pattern Standard Deviation (PSD) 7-8, 7-12, 7-21Pausing Tests 5-10, 5-17Personalized I.D.
see I.D., PersonalizedPop-Up Window (or Menu) 2-5Post-Processing 4-10, 5-14Power Switch 1-10, 1-13Print Directory 8-2, 8-13Print Functions Icon 2-3, 5-15, 7-25, 7-27, 7-28, 8-11Printer
Installation 1-14Paper 12-10, 12-11Port 1-11Remote Printing 7-30Setup 2-11, 2-16
Printing ResultsCurrent 5-15, 7-25Delay 7-29General Section 7, 5-15Partial Results 5-11Recall Last Test 7-29Stored on Disk 7-28View File 7-29
PrintoutsBlue-Yellow 7-8, 7-23Change Analysis 7-2, 7-10, 7-11, 7-13, 7-21, 7-25, 7-28Custom 10-19Glaucoma Change Probability Analysis (GCP) 1-6, 5-15, 7-2,
7-15, 7-16, 7-17, 7-18, 7-25, 7-28Interpretation 7-4Kinetic 11-22, 11-26, 11-27Kinetic Legend 11-28O. U. (Both Eyes) 7-26, 7-27Overview 5-15, 7-2, 7-8, 7-9, 7-21, 7-24, 7-25, 7-28Screening 7-26Single Field Analysis (SFA) 5-15, 7-2, 7-5, 7-22, 7-23, 7-25,
7-28SITA 6-7, 7-21System Log 2-14Three-in-One 5-15, 7-20, 7-24Threshold 7-25
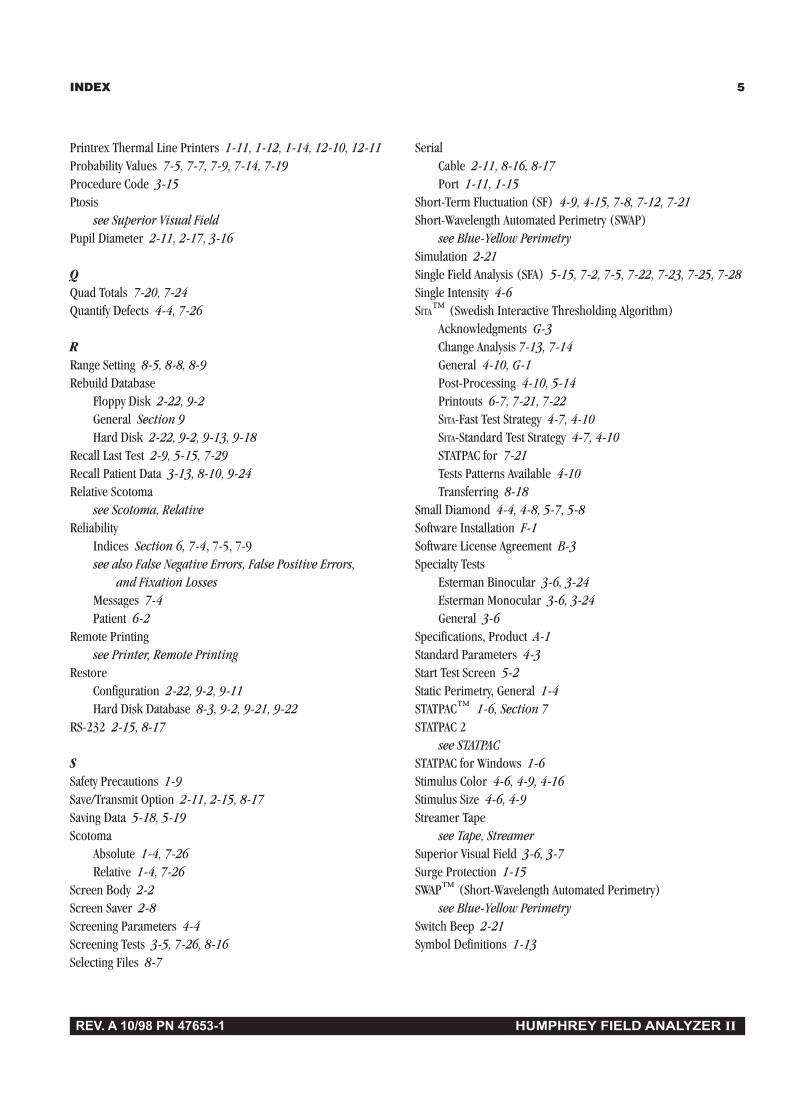
INDEX 5
REV. A 10/98 PN 47653-1 HUMPHREY FIELD ANALYZER II
Printrex Thermal Line Printers 1-11, 1-12, 1-14, 12-10, 12-11Probability Values 7-5, 7-7, 7-9, 7-14, 7-19Procedure Code 3-15Ptosis
see Superior Visual FieldPupil Diameter 2-11, 2-17, 3-16
QQuad Totals 7-20, 7-24Quantify Defects 4-4, 7-26
RRange Setting 8-5, 8-8, 8-9Rebuild Database
Floppy Disk 2-22, 9-2General Section 9Hard Disk 2-22, 9-2, 9-13, 9-18
Recall Last Test 2-9, 5-15, 7-29Recall Patient Data 3-13, 8-10, 9-24Relative Scotoma
see Scotoma, RelativeReliability
Indices Section 6, 7-4, 7-5, 7-9see also False Negative Errors, False Positive Errors,
and Fixation LossesMessages 7-4Patient 6-2
Remote Printingsee Printer, Remote Printing
RestoreConfiguration 2-22, 9-2, 9-11Hard Disk Database 8-3, 9-2, 9-21, 9-22
RS-232 2-15, 8-17
SSafety Precautions 1-9Save/Transmit Option 2-11, 2-15, 8-17Saving Data 5-18, 5-19Scotoma
Absolute 1-4, 7-26Relative 1-4, 7-26
Screen Body 2-2Screen Saver 2-8Screening Parameters 4-4Screening Tests 3-5, 7-26, 8-16Selecting Files 8-7
SerialCable 2-11, 8-16, 8-17Port 1-11, 1-15
Short-Term Fluctuation (SF) 4-9, 4-15, 7-8, 7-12, 7-21Short-Wavelength Automated Perimetry (SWAP)
see Blue-Yellow PerimetrySimulation 2-21Single Field Analysis (SFA) 5-15, 7-2, 7-5, 7-22, 7-23, 7-25, 7-28Single Intensity 4-6SITA™ (Swedish Interactive Thresholding Algorithm)
Acknowledgments G-3Change Analysis 7-13, 7-14General 4-10, G-1Post-Processing 4-10, 5-14Printouts 6-7, 7-21, 7-22SITA-Fast Test Strategy 4-7, 4-10SITA-Standard Test Strategy 4-7, 4-10STATPAC for 7-21Tests Patterns Available 4-10Transferring 8-18
Small Diamond 4-4, 4-8, 5-7, 5-8Software Installation F-1Software License Agreement B-3Specialty Tests
Esterman Binocular 3-6, 3-24Esterman Monocular 3-6, 3-24General 3-6
Specifications, Product A-1Standard Parameters 4-3Start Test Screen 5-2Static Perimetry, General 1-4STATPAC™ 1-6, Section 7STATPAC 2
see STATPACSTATPAC for Windows 1-6Stimulus Color 4-6, 4-9, 4-16Stimulus Size 4-6, 4-9Streamer Tape
see Tape, StreamerSuperior Visual Field 3-6, 3-7Surge Protection 1-15SWAP™ (Short-Wavelength Automated Perimetry)
see Blue-Yellow PerimetrySwitch Beep 2-21Symbol Definitions 1-13

6 INDEX
REV. A 10/98 PN 47653-1 HUMPHREY FIELD ANALYZER II
SystemComponents 1-11Installation 1-16Log 2-11, 2-14
System SetupAdditional Setup Screen 2-11, 2-21Icon 2-3Screen 2-10, 2-12
TTable
Adjustment 1-5, 3-22Slider 1-12, 3-23
Tape Drive 1-7, 1-11, 9-7, 9-22Tape, Streamer 1-7, 9-7, 9-21, 9-22Test Buttons 3-2Test Complete Screen 5-14, 5-15Test In Progress Screen 5-10Test Library 2-9, 3-3, 3-4, 5-16Test Mode 4-6Test Other Eye Button 2-19, 5-14Test Parameters 4-2Test Patterns E-1Test Speed 4-4, 4-8, 5-10Test Strategies 4-4, 4-7Text Conventions 1-8Three-in-One 5-15, 7-20, 7-24Three Zone Test Strategy 4-4Threshold
Definition 1-2Printouts 7-4Related Test Mode 4-6, 7-26Test Library 3-6Test Parameters 4-7Transferring 8-16
Time and Date Setup 2-10, 2-14Title Bar 2-2Total Deviation Plots 7-7Touch Screen
Activation 2-4Brightness Control 1-11Calibration 2-21, 12-12
Trackball 1-15, 2-7Transfer Tests
General 8-3, 8-16HFA I to HFA II 8-17, 8-16, 8-18, 8-20HFA II to HFA I 8-16, 8-18, 8-20Limitations 8-16
Transmit Filessee Save/Transmit Option
Trial LensAutomatic Calculation 3-10Holder 1-12, 3-21, 3-24Manual Input 3-12Patient Reliability 6-3Plano Rx 3-11Selection Guidelines 3-19, 3-20
Troubleshooting Guide H-1Two Zone Test Strategy 4-4, 7-26
UUndo Icon 2-3Unit Configuration 2-4Upgrading Pre-A6 Floppy Disks F-4
VVertex Monitor 1-7, 2-10, 2-13, 5-6, 5-12, 5-13VGA Monitor 1-11, 1-15Video Eye Monitor 5-4View Test (or File) 7-29, 8-2, 8-11Visor 1-12, 4-13, 4-14Visual Acuity 2-11, 2-16Visual Fields, General 1-2, 1-3Visual Field, Superior
see Superior Visual Field
WWarranty Statement B-1Web Site 1-7, H-1
YYear 2000 (Y2K) 1-7, 2-14, 3-9
ZZoom Button 3-7, 5-14


