FBI Headquarters Consolidation U.S. General Services Administration 4-46 Transportation Impact Assessment Springfield Figure 4-11: No-build Condition Intersection LOS for PM Peak Hour (continued)
Transcript
FBI Headquarters Consolidation U.S. General Services Administration 4-46 Transportation Impact Assessment Springfield
Figure 4-11: No-build Condition Intersection LOS for PM Peak Hour (continued)
FBI Headquarters Consolidation U.S. General Services Administration 4-47 Transportation Impact Assessment
Springfield
Table 4-19: No-build Condition for AM and PM Peak Hours
Delay(sec/veh)
LOS CheckDelay
(sec/veh)LOS Check
1 Loisdale Road/Commerce Street & Franconia Road (Westbound) (Signalized)
WB (Franconia Rd) L 92.8 F 90.8 F
WB (Franconia Rd) T 29.8 C 32.3 C
WB (Franconia Rd) R 1.5 A 0.8 A
WB Overall (Franconia Rd) 20.8 C 25.4 C
NB (Commerce St) L 0.7 A 2.4 A
NB (Commerce St) T 1.5 A 1.9 A
NB Overall (Commerce St) 1.1 A 2.3 A
SB (Commerce St) T 70.6 E 73.8 E
SB (Commerce St) R 68.1 E 64.0 E
SB Overall (Commerce St) 69.5 E 71.1 EOverall 24.0 C Pass 31.1 C Pass
2 Loisdale Road/Commerce Street & Franconia Road (Eastbound) (Signalized)
EB (Franconia Rd) L 72.9 E 76.4 E
EB (Franconia Rd) T 38.0 D 52.0 D
EB (Franconia Rd) R 0.7 A 4.9 A
EB Overall (Franconia Rd) 23.1 C 21.7 C
NB (Loisdale Rd) T 70.5 E 72.1 E
NB (Loisdale Rd) R 63.4 E 55.4 E
NB Overall (Loisdale Rd) 69.0 E 69.5 E
SB (Loisdale Rd) L 2.7 A 0.1 A
SB (Loisdale Rd) T 2.7 A 0.2 A
SB Overall (Loisdale Rd) 2.7 A 0.2 A
Overall 35.7 D Pass 32.1 C Pass
PM Peak Hour
# Intersection and ApproachLane
Group
AM Peak Hour
FBI Headquarters Consolidation U.S. General Services Administration 4-48 Transportation Impact Assessment
Springfield
Table 4-19: No-build Condition for AM and PM Peak Hours (continued)
Delay(sec/veh)
LOS CheckDelay
(sec/veh)LOS Check
3 Loisdale Road & Loisdale Court/Mall Access (Signalized)EB (Loisdale Court) L 74.0 E 76.0 E
EB (Loisdale Court) LT 74.1 E 74.0 E
EB (Loisdale Court) R 65.6 E 53.5 D
EB Overall (Loisdale Court) 72.0 E 68.3 E
WB (Mall Access) L 67.6 E 65.1 E
WB (Mall Access) T 67.2 E 53.8 D
WB (Mall Access) R 66.5 E 53.9 D
WB Overall (Mall Access) 66.9 E 57.7 E
NB (Loisdale Rd) L 2.1 A 11.9 B
NB (Loisdale Rd) T 3.4 A 12.0 B
NB (Loisdale Rd) R 0.0 A 0.0 A
NB Overall (Loisdale Rd) 3.1 A 11.3 B
SB (Loisdale Rd) L 3.2 A 7.0 A
SB (Loisdale Rd) T 5.4 A 13.3 B
SB (Loisdale Rd) R 4.9 A 10.0 B
SB Overall (Loisdale Rd) 5.0 A 11.6 B
Overall 9.1 A Pass 21.9 C Pass
4 Loisdale Road & Ramp from NB I-95/Spring Mall Drive (Signalized)
EB (Ramp from NB I-95) L 66.4 E 69.0 E
EB (Ramp from NB I-95) T 67.8 E 68.8 E
EB (Ramp from NB I-95) R 59.1 E 61.4 E
EB Overall (Ramp from NB I-95) 66.4 E 68.8 E
WB (Spring Mall Dr) L 17.4 B 68.9 E
WB (Spring Mall Dr) R 119.4 F 52.5 D
WB Overall (Spring Mall Dr) 87.8 F 60.1 E
NB (Loisdale Rd) TR 14.9 B 20.5 C
NB (Loisdale Rd) R 8.5 A 16.2 B
NB Overall (Loisdale Rd) 13.8 B 19.8 B
SB (Loisdale Rd) L 4.2 A 5.5 A
SB (Loisdale Rd) T 4.6 A 4.1 A
SB Overall (Loisdale Rd) 4.5 A 4.7 A
Overall 32.9 C Pass 23.7 C Pass
PM Peak Hour
# Intersection and ApproachLane
Group
AM Peak Hour
FBI Headquarters Consolidation U.S. General Services Administration 4-49 Transportation Impact Assessment
Springfield
Table 4-19: No-build Condition for AM and PM Peak Hours (continued)
Delay(sec/veh)
LOS CheckDelay
(sec/veh)LOS Check
5 Loisdale Road & Metropolitan Center Drive (Signalized)WB (Metropolitan Center Dr) L 69.0 E 71.6 E
FBI Headquarters Consolidation U.S. General Services Administration 4-54 Transportation Impact Assessment
Springfield
Table 4-19: No-build Condition for AM and PM Peak Hours (continued)
Delay(sec/veh)
LOS CheckDelay
(sec/veh)LOS Check
19 Franconia-Springfield Parkway & Spring Village Drive/Bonniemill Lane (Signalized)EB (Franconia-Springfield Pkwy) L 160.7 F 140.4 F
EB (Franconia-Springfield Pkwy) T 43.8 D 20.4 C
EB (Franconia-Springfield Pkwy) R 6.5 A 15.3 B
EB Overall (Franconia-Springfield Pkwy) 44.8 D Pass 22.7 C Pass
WB (Franconia-Springfield Pkwy) L 272.2 F 106.7 F
WB (Franconia-Springfield Pkwy) T 8.2 A 19.2 B
WB (Franconia-Springfield Pkwy) R 7.2 A 6.3 A
WB Overall (Franconia-Springfield Pkwy) 19.8 B Pass 23.3 C Pass
NB (Bonniemill Ln) L 123.1 F 86.9 F
NB (Bonniemill Ln) T 121.2 F 86.3 F
NB (Bonniemill Ln) R 171.6 F 86.8 F
NB Overall (Bonniemill Ln) 166.2 F Fail 86.8 F Fail
SB (Spring Village Dr) L 148.2 F 117.3 F
SB (Spring Village Dr) T 121.2 F 86.5 F
SB (Spring Village Dr) R 121.5 F 86.8 F
SB Overall (Spring Village Dr) 139.6 F Fail 105.2 F Fail
Overall 46.8 D Pass 27.6 C Pass
20 Franconia-Springfield Parkway & I-95 HOT Lane Ramps (Signalized) a
EB (Franconia-Springfield Pkwy) L (AM) 36.8 D - -
EB (Franconia-Springfield Pkwy) T 10.9 B 25.7 C
EB (Franconia-Springfield Pkwy) R (PM) - - 16.8 B
EB Overall (Franconia-Springfield Pkwy) 14.4 B Pass 25.5 C Pass
WB (Franconia-Springfield Pkwy) L (PM) - - 35.2 D
WB (Franconia-Springfield Pkwy) T 21.8 C 5.7 A
WB (Franconia-Springfield Pkwy) R (AM) 17.4 B - -
WB Overall (Franconia-Springfield Pkwy) 21.2 C Pass 7.6 A Pass
NB (I-95 HOT Lane Off-ramp) LTR (AM) 39.2 D - -
NB Overall (I-95 HOT Lane Off-ramp) 39.2 D Pass - -
SB (I-95 HOT Lane Off-ramp) LTR (PM) - - 41.0 D
SB (I-95 HOT Lane Off-ramp) R (PM) - - 40.1 D
SB Overall (I-95 HOT Lane Off-ramp) - - 40.6 D Pass
Overall 17.5 B Pass 15.8 B Pass
PM Peak Hour
# Intersection and ApproachLane
Group
AM Peak Hour
FBI Headquarters Consolidation U.S. General Services Administration 4-55 Transportation Impact Assessment
Springfield
Table 4-19: No-build Condition for AM and PM Peak Hours (continued)
Delay(sec/veh)
LOS CheckDelay
(sec/veh)LOS Check
21EB (Franconia-Springfield Pkwy) L 85.5 F 81.8 F
EB (Franconia-Springfield Pkwy) T 36.3 D 65.6 E
EB (Franconia-Springfield Pkwy) R 32.9 C 53.0 D
EB Overall (Franconia-Springfield Pkwy) 49.6 D Pass 64.7 E Fail
WB (Manchester Blvd) L 77.7 E 112.4 F
WB (Manchester Blvd) T 83.4 F 77.9 E
WB (Manchester Blvd) R 37.7 D 36.7 D
WB Overall (Manchester Blvd) 76.8 E Fail 76.5 E Fail
NB (Beulah St) L 168.3 F 214.3 F
NB (Beulah St) T 65.8 E 78.2 E
NB (Beulah St) R 48.1 D 63.0 E
NB Overall (Beulah St) 119.6 F Fail 146.6 F Fail
SB (Beulah St) L 73.9 E 89.5 F
SB (Beulah St) T 161.6 F 201.2 F
SB (Beulah St) R 79.1 E 74.9 E
SB Overall (Beulah St) 114.8 F Fail 137.8 F Fail
Overall 84.1 F Fail 96.9 F Fail
22 Franconia Road & Beulah Street (Signalized)
EB (Franconia Rd) L 40.7 D 39.9 D
EB (Franconia Rd) TR 49.6 D 60.2 E
EB Overall (Franconia Rd) 49.5 D Pass 60.0 E Fail
WB (Franconia Rd) L 64.3 E 100.1 F
WB (Franconia Rd) TR 18.4 B 17.5 B
WB Overall (Franconia Rd) 39.4 D Pass 49.3 D Pass
NB (Beulah St) LT 51.5 D 60.6 E
NB (Beulah St) R 28.1 C 23.3 C
NB Overall (Beulah St) 31.3 C Pass 34.4 C Pass
SB (Driveway) LTR 129.3 F 164.6 F
SB Overall (Driveway) 129.3 F Fail 164.6 F Fail
Overall 39.9 D Pass 51.1 D Pass
23 I-95 NB On-ramp & Commerce Street (Signalized) b
EB (Commerce St) L - - 1.8 A
EB (Commerce St) T - - 0.1 A
EB Overall (Commerce St) - - 0.2 A
WB (Commerce St) T - - 6.1 A
WB (Commerce St) R - - 5.4 A
WB Overall (Commerce St) - - 5.9 A
Overall - - - 2.8 A Pass
PM Peak Hour
Franconia-Springfield Parkway/Manchester Boulevard & Beulah Street (Signalized)
# Intersection and ApproachLane
Group
AM Peak Hour
FBI Headquarters Consolidation U.S. General Services Administration 4-56 Transportation Impact Assessment
Springfield
Table 4-19: No-build Condition for AM and PM Peak Hours (continued)
4.7.6 No-build Condition Queuing Analysis
Synchro™ was used to calculate the 50th percentile queue lengths, and SimTraffic™ was used to calculate the 95th percentile queue lengths. The SimTraffic™ simulations have a statistical accuracy of plus or minus 4.5 percent error for the AM peak hour and 4.9 percent error for the PM peak hour simulations. Based on the Synchro™ and SimTraffic™ analysis, queue lengths exceeding the roadway storage capacity would occur at the following signalized intersection approaches (failing queue lengths). The lane group within the approach that would be operating under unacceptable conditions is noted in parentheses.
Loisdale Road and Loisdale Court/Mall Access (Intersection #3) o Westbound Mall Access (right turns) during the AM peak hour o Eastbound Loisdale Court (left and right turns) and westbound Mall Access (right turns) during the
PM peak hour
Delay(sec/veh)
LOS CheckDelay
(sec/veh)LOS Check
24
WB (Metro Station) L 31.3 C 23.4 C
WB Overall (Franconia-Springfield Access Rd) 31.3 C 23.4 C
NB (Frontier Dr Ext) T 27.1 C 22.0 C
NB (Frontier Dr Ext) R 30.1 C 19.4 B
NB Overall (Frontier Dr Ext) 29.2 C 22.0 C
SB (Frontier Dr Ext) to Driveway L 23.6 C 21.2 C
SB (Frontier Dr Ext) L 14.5 B 18.2 B
SB (Frontier Dr Ext) T 0.1 A 0.0 A
SB Overall (Frontier Dr Ext) 14.3 B 16.0 B
Overall 16.4 B Pass 18.7 B Pass
25 Frontier Drive Extension & Metropolitan Center Drive Extension (TWSC)
EB (Metropolitan Center Dr Ext) LR 14.8 B 13.3 B
EB Overall (Metropolitan Center Dr Ext) 14.8 B 13.3 B
NB (Frontier Dr Ext) LT 4.3 A 1.4 A
NB Overall (Frontier Dr Ext) 2.1 - 0.5 -
Overall 2.1 - Pass 4.7 - Pass
LOS = Level of Service
LTR = left / through / right lanes
TWSC = Two-way STOP-Controlled unsignalized intersection (TWSC intersections do not have an overall LOS)
Delay is Measured in Seconds Per Vehicle.
b Intersection not analyzed during the AM peak hour.
a Intersection would operate with a different lane configuration during the AM and PM peak hours.
Red cells denote intersections operating at unacceptable conditions.
Frontier Drive Extension & Metro Station (Signalized)
FBI Headquarters Consolidation U.S. General Services Administration 4-57 Transportation Impact Assessment
Springfield
Loisdale Road and Frontier Drive Extension (Intersection #8) o Northbound Loisdale Road (right turns) during the AM peak hour
Loisdale Road and Hotel Entrance/Newington Road (Intersection #10) o Westbound Newington Road (right turns) during the PM peak hour
Loisdale Road/I-95 (N) Ramp C & D and Fairfax County Parkway (Intersection #11) o Southbound Fairfax County Parkway (through movements) during the AM peak hour
Frontier Drive and Best Buy/Springfield Mall Parking Lot Entrance (Intersection #14) o Westbound Best Buy entrance (left turns) during the AM peak hour o Eastbound Spring Mall Parking lot entrance (combined left, through and right movements) and
northbound Frontier Drive (left turns) during the PM peak hour Frontier Drive and Home Depot/Springfield Mall Garage Entrance (Intersection #15)
o Westbound Home Depot entrance (all movements) during the AM peak hour Frontier Drive and Franconia-Springfield Parkway (Westbound) (Intersection #17)
o Southbound Frontier Drive (through movements) during the AM peak hour Frontier Drive and Franconia-Springfield Parkway (Eastbound) (Intersection #18)
o Eastbound F-S Parkway (eastbound off ramp) (all movements) during the AM peak hour o Northbound Frontier Drive (right turns) during the PM peak hour
Franconia-Springfield Parkway and Spring Village Drive/Bonniemill Lane (Intersection #19) o Eastbound F-S Parkway (through movements) and northbound Bonniemill Lane (right turns) during
the AM peak hour Franconia-Springfield Parkway/Manchester Boulevard and Beulah Street (Intersection #21)
o Westbound Manchester Boulevard (left and through movements), northbound Beulah Street (left turns and through movements) and southbound Beulah Street (through and right movements) during the AM peak hour
o Westbound Manchester Boulevard (left and through movements), northbound Beulah Street (left turns and through movements) and southbound Beulah Street (all movements) during the PM peak hour
Franconia Road and Beulah Street (Intersection #22) o Westbound Franconia (left turns) and eastbound Franconia Road (combined through and right
movements) during the PM peak hour Frontier Drive Extension and Metropolitan Center Drive (Intersection #25)
o Eastbound Metropolitan Center Drive (combined left and right-turns) during the PM peak hour
Based on the analysis, the No-build Condition queue lengths for the unsignalized intersection approaches would be unacceptable (would fail at the 95th percentile) only at the intersection of Frontier Drive Extension and Metropolitan Center Drive Extension (all movements) during the PM peak hour. The remaining intersections in the study area would all have acceptable No-build Condition queue lengths.
4.7.6.1 Complete Intersection Queuing Analysis
This section summarizes the differences in queuing impacts between the No-build Condition and the Existing Condition by quantifying the change in intersection queuing failures. Following the summary, this section also includes the complete results of the queuing analysis in a table.
Based on the Synchro™ and SimTraffic™ analysis, 12 signalized intersections and one unsignalized intersection would experience queuing lengths that would exceed the available storage capacity. The remaining intersections in the study area would provide sufficient storage for the anticipated demand. Compared to the Existing Condition, the No-build Condition would have failing queues for three more intersections during the AM peak hour and four less intersections during the PM peak hour. In the AM peak hour in the Existing Condition, there would be 7
FBI Headquarters Consolidation U.S. General Services Administration 4-58 Transportation Impact Assessment
Springfield
intersections with a failing queue approach compared with 10 in the No-build Condition, an increase of 3. In the PM peak hour in the Existing Condition, there would be 10 intersections with a failing queue approach compared with 6 in the No-build Condition, a decrease of 4.
Table 4-20 provides a summary of the number of intersections that meet the following criteria for approach lane groups in a queue that would change between the Existing Condition and the Comparable No-build Condition:
New Failing Movement o Number of intersections that have a queuing problem in one or more movements that would NOT
have a queuing problem in the previous condition
Additional Failing Movement o Number of intersections that had at least one queuing movement failure in the previous condition
and now would have additional/more queuing movement failures than before
No Change o Number of intersections that would have no change in the number of queuing movement failures
or the number of queuing movement failures would be the same as in the previous condition
Fewer Failing Movements o Number of intersections that would have less queuing movement failures than in the previous
condition, but still would have some failing movements
No Failing Movements o Number of intersections that had queuing movement failures in the previous condition, but would
no longer have queuing movement failures
Table 4-20: Queuing Summary Comparing Existing Condition to No-build Condition
Type of Change Between Conditions
AM PM
New Failing Movement 4 0
Additional Failing Movement 3 2
No Change 14 15
Fewer Failing Movements 1 2
No Failing Movements 1 4
Total Signalized and Unsignalized Intersections
23 23
The results of the No-build Condition queuing analysis for both signalized and unsignalized intersections are presented in table 4-21. Note that the percentile values are expressed in feet, and a car occupies about 25 linear feet of roadway, including the space between cars.
FBI Headquarters Consolidation U.S. General Services Administration 4-59 Transportation Impact Assessment
Springfield
Table 4-21: No-build Condition Queuing
50th Percentile
(feet)
95th Percentile
(feet)
50th Percentile
(feet)
95th Percentile
(feet)
1 Loisdale Road/Commerce Street & Franconia Road (Westbound) (Signalized)
WB (Franconia Rd) L 590 121 169 177 232
WB (Franconia Rd) T 1,100 305 331 261 288
WB (Franconia Rd) R - 126 - 39 -
NB (Commerce St) L 69 2 12 12 42
NB (Commerce St) T 69 12 21 8 29
SB (Commerce St) T 595 108 150 273 306
SB (Commerce St) R 400 2 189 89 365
2 Loisdale Road/Commerce Street & Franconia Road (Eastbound) (Signalized)
Red cells denote approaches and lane groups whose queuing length exceeds capacity.a Intersection not analyzed during the AM peak hour.
# IntersectionLane
Group
Turning Bay/Link Length (feet)
m Volume for 95th percentile queue is metered by upstream signal. Due to upstream metering, the 95th percentile queue may be less than the 50th percentile queue.
Notes:
# 95th percentile volume exceeds capacity, queue may be longer.
~ 50th percentile volume exceeds capacity, queue is theoretically infinite.
AM Peak Hour PM Peak Hour
FBI Headquarters Consolidation U.S. General Services Administration 4-66 Transportation Impact Assessment
Springfield
4.7.6.2 Overall Traffic Impact Assessment
Overall, there would be impacts during the AM and PM peak hour at the Franconia-Springfield Parkway/Manchester Boulevard and Beulah Street intersection (Intersection #21) resulting in direct, long-term, adverse impacts due to the isolated nature of the impacts.
4.7.7 No-build Condition Freeway Volumes
Although freeway analysis was not performed for the No-build Condition, freeway ramp volumes are included in figure 4-12 to allow a comparison to the Existing Condition, Build Condition, and Build with Mitigation Condition freeway ramp volumes presented in Sections 3.7, 5.8, and 6.6, respectively. Full analysis of the freeway volumes is included in the Build with Mitigation Condition in Section 6.6.
FBI Headquarters Consolidation U.S. General Services Administration 4-67 Transportation Impact Assessment
Springfield
Figure 4-12: No-build Condition Freeway Volumes
FBI Headquarters Consolidation U.S. General Services Administration 4-68 Transportation Impact Assessment
Springfield
(This page intentionally left blank.)
FBI Headquarters Consolidation U.S. General Services Administration 5-1 Transportation Impact Assessment
Springfield
Analysis of Build Condition This chapter introduces the Build Condition for the Springfield site and summarizes the potential impact on the pedestrian network, bicycle network, public transit system, parking conditions, truck access, and traffic operations from the consolidation of the FBI HQ on the Springfield site.
Under the Build Condition, GSA would not continue to maintain the FBI HQ building in Washington, D.C., and the Springfield site would be selected. The Springfield Build Condition is unique from the proposed action described in the FBI HQ Consolidation DEIS because it only analyzes the conditions at the Springfield site and does not factor in the impacts from the exchange of the JEH parcel in Washington, D.C.
5.1 Description of Build Condition
Consolidation of the FBI HQ at Springfield would include a Main Building or series of buildings of approximately 2.4 million GSF. The main HQ building would house the majority of the approximately 11,000 employees, plus approximately 400 non-seated contractors, such as custodial staff and food service workers. The Main Building would include a variety of spaces, including general office space, collaborative workspaces, the Mission Briefing Center and auditorium (to be used for training and large meetings), a cafeteria/food court, retail spaces, fitness center, credit union, and medical clinic. The building(s) also would include support spaces such as loading docks, workshops, and police/security spaces. In addition to the Main Building, the site would also contain plaza areas, parking areas, a Central Utility Plant (CUP), a Remote Delivery Facility (RDF) and truck access, a Visitor Center (VC), and gate and access points. The location of some of these elements is shown in figure 5-1.
FBI Headquarters Consolidation U.S. General Services Administration 5-2 Transportation Impact Assessment
Springfield
Figure 5-1: Springfield Site Organization
The remote delivery zone, which would contain a truck-only gate, truck screening facility, and the RDF, would be located in the northwestern portion of the site, with trucks accessing the site from Loisdale Road through the truck gate on the north side of the site. The truck gate would only allow vehicles to enter and exit during non-peak periods, and would be located off of Loisdale Road to prevent trucks from using local neighborhood roads to access the site. Adjacent to this zone would be the service and loading zone, southeast of the remote delivery zone and adjacent to the northern end of the Main Building. This zone would contain the CUP and stand-by generators; a substation would not be necessary at this site. Access to the Main Building for loading and maintenance also would occur in this zone. The 9.28-acre developable area for the Main Building would be located in the center of the site. Based on the size and configuration of the developable area, the planning team determined that the Main Building would be up to 12 stories. The developable area in front of the Main Building would form the plaza zone. This zone would be oriented toward the VC and the Franconia-Springfield Metro Station, on the opposite end of the Main Building developable area from the service and loading zone. This zone would provide a pedestrian-oriented open space for employees and visitors, as well as a stage for a grand
FBI Headquarters Consolidation U.S. General Services Administration 5-3 Transportation Impact Assessment
Springfield
entrance to the Main Building. The visitor zone would be located along the southeastern site boundary in between Frontier Drive Extension (formerly Springfield Center Drive) and Metropolitan Center Drive. This zone would contain the VC, visitor parking, and bus drop-off. The visitor parking lot would accommodate up to 145 spaces. A secondary vehicular entrance would be located within the visitor zone, while the main vehicular gate would be located to the south and west of the visitor zone.
Access to the site would be primarily provided along Frontier Drive Extension (formerly Springfield Center Drive), as shown in figure 5-2. The preliminary conceptual site plan (a plan developed prior to studying the internal and external transportation impacts) contains two vehicular entry control facilities (ECFs): Note that other resources topics in the EIS based their impact assessment on the revised conceptual site plan describe in the Build with Mitigation (Section 6).
West Access: This ECF, located along Loisdale Road, would contain one lane for inbound and one lane for outbound truck traffic during non-peak hours only. No employee vehicular traffic would be allowed through this gate.
South Access: This ECF, located along Frontier Drive Extension, would contain a total of four lanes for employee vehicular traffic. Employee vehicles would enter the site through two inbound lanes and exit the site through two outbound lanes.
East Access: This ECF, located along Metropolitan Center Drive, would contain a total of three lanes for employee vehicular traffic only. Employee vehicles would enter the site through two inbound lanes and would exit the site through one outbound lane.
Visitor vehicular traffic as well as visitor and employee pedestrian traffic would access the site through the vehicular and pedestrian gate located on the west side of the site off of Metropolitan Center Drive, adjacent to the visitor parking lot. This pedestrian entrance point is closest to the Franconia-Springfield Metro Station, which provides access to Metrorail, VRE, and buses.
Employee parking garages would be located to the north and east of the Main Building developable area along the northeastern site boundary, adjacent to Metropolitan Center Drive. In the conceptual site layout analyzed in the EIS, these spaces would be accommodated in two, eight-story parking structures. The FBI is conducting an internal analysis to support a final determination of the total amount of employee parking for this site. The final number and layout of the parking structures to accommodate the required employee and fleet vehicle parking would be determined during the design process.
FBI Headquarters Consolidation U.S. General Services Administration 5-4 Transportation Impact Assessment
Springfield
Figure 5-2: Preliminary Springfield Site Circulation
FBI Headquarters Consolidation U.S. General Services Administration 5-5 Transportation Impact Assessment
Springfield
The key components of the Springfield Build Condition are as follows: Sidewalk improvements along the eastern corner of the Springfield site would be built to connect the onsite sidewalks to the offsite pedestrian network. ADA accessibility and pedestrian access improvements would be made as needed at remaining entry locations.
No offsite bicycle improvements are included as part of the Build Condition. Bicycle improvements such as bicycle parking and showers or locker rooms may be provided as part of the final design, but are not yet known at this time.
No shuttle service is proposed as part of the Build Condition, because the Springfield site is within a 0.5-mile walk of the nearest transit station.
All parking supporting the Build Condition would be accommodated onsite. In the conceptual site layout analyzed in the EIS, these spaces would be accommodated in two, eight-story parking structures.
Truck access would be provided at the West Access ECF; trucks would be required to access the facility at off-peak hours.
Three entry driveways leading to ECF facilities would be developed as part of the site. These include a West Access along Loisdale Road (one-lane entry, one-lane exit, truck access only), a South Access along Frontier Drive Extension (five-lane entry, two-lane exit), and an East Access to/from Metropolitan Center Drive (two-lane entry, one-lane exit).
The Springfield Build Condition includes the following transportation improvements that would be necessary for the site to function based on the magnitude of trips forecasted. These improvements are mitigation measures, discussed in Section 6, but they are also included in the Build Condition to accommodate trip volumes.
Frontier Drive Extension and Site South Access: A traffic signal would be installed and a three-lane approach exiting the Springfield site with two right-turn lanes and one left-turn lane would be created.
Frontier Drive Extension and Metropolitan Center Drive: A traffic signal would be installed and a three-lane eastbound approach from Metropolitan Center Drive, including two left-turn lanes and one right-turn lane, would be created.
The trip generation and modal split assumptions are discussed first, followed by a discussion for each transportation mode.
5.2 Trip Generation and Mode Split
This section covers the trip generation and modal split process and methods used to develop the Build Condition transit and traffic trip volumes.
5.2.1 Trip Generation
The process of trip generation calculation is based on forecasting the number of AM and PM peak hour trips generated by the proposed development. There are several proposed trip generators for the site including an estimated 11,055 FBI employees, a 500-seat Mission Briefing Center, and a fleet of pool cars, according to the FBI. Based on an estimate for commuter-based pool car use, there would be less than five trips produced. It is also assumed that the approximately 400 non-seated contractors providing custodial, food, fitness center, health, and other services would travel outside the peak hours. Therefore, no trips were added to the trip generation calculation for commuter-based pool car use or non-seated contractors. The process for forecasting the FBI employee and Mission Briefing trips is discussed next.
FBI Headquarters Consolidation U.S. General Services Administration 5-6 Transportation Impact Assessment
Springfield
5.2.1.1 FBI Employee Person Trips
Many employees choose to or are scheduled to begin or end work earlier or later than the peak hours to avoid traffic, to schedule shared childcare responsibilities, to take advantage of quiet time at work, and for other reasons. The ITE Trip Generation Manual, 9th Edition, identifies estimates for peak hour trip generation rates for different types of office buildings based on various studies; however, most of these studies are in suburban rather than urban environments, “having little or no transit service, nearby pedestrian amenities, or travel demand management (TDM) programs” (ITE 2012). In addition, FBI employee patterns of arrivals and departures, including the number of employees who will be off-site or on field work at any given time is not typical of most office uses. For these reasons, it was determined that the future FBI trip generation rate is not accurately represented by the ITE Trip Generation Manual; therefore, a special study was undertaken to determine appropriate trip generation rates using the current FBI HQ, which houses more than 50 percent of staff. As stated in the Trip Generation Manual, “when practical, the user is encouraged to supplement the data in this document with local data that have been collected at similar sites” (ITE 2012).
Morning peak hour rates were calculated based on FBI turnstile counts obtained from the FBI representing all persons entering the JEH building (current FBI HQ). Following the guidance of the ITE Trip Generation Handbook, 2nd edition (ITE 2004), three days of turnstile counts (November 12, 2013 [Tuesday], December 4, 2013 [Wednesday], and January 9, 2014 [Thursday]) were obtained. The sample days for normal operations days were selected by the FBI. The survey results produced a peak hour count of 1,344 on November 12, 2013, 1,361 on December 4, 2013, and 1,324 on January 9, 2014, and a peak hour of 7:15 AM to 8:15 AM. To provide a more conservative forecast, the maximum count from the 3-day turnstile counts (1,361) was used, instead of the average. The turnstile counts only represent the inbound flows, but most organizations have two-way flows of workers, even in peak hours. Therefore the ITE Trip Generation Manual Corporate Headquarters land use entering/exiting percentages (AM: 93 percent entering / 7 percent exiting) were used to calculate the morning outbound peak hour flow, based on the maximum count from the survey results. The total person trips (entering and exiting) divided by 5,045 (current number of FBI employees working at the JEH building) was used to develop the AM peak hour rate, which resulted in a 0.29 person trip rate (29.0 percent of employees arrive or leave during the AM peak hour).
Afternoon peak hour rates were calculated based on a JEH building exit-only trip generation survey. Following the ITE guidance (ITE 2004), the trip generation survey was conducted for three days (September 16, 17, and 18, 2014) on a non-holiday week resulting in outgoing trip volumes of 1,174, 1,259, and 1,130, respectively. Based on the PM peak hour occurring between 4:30 PM and 5:30 PM, the PM rate was calculated from the trip generation survey (outbound flow) and the inbound turnstile counts from the inbound survey days.
Based on the turnstile volumes, the highest number of employees entering during the 4:30 to 5:30 PM time slot was 114. The average for the time slot was 73, higher than both the other days’ values (68 and 36 respectively) for the same one-hour period. This meant that the 114 value was skewing the values when averaged and was not a good representation of a typical evening inbound flow. Therefore, the next 15-minute slot for an hourly average (4:45 PM-5:45 PM) was examined. The average of the 4:45 PM to 5:45 PM time slot equals the average of the 3 days for the 4:30 to 5:30 PM time slot, and therefore appears to be more typical of a normal operation. To follow the same process as the inbound flow, the highest value of this time slot was used, for a value of 98. Since the values for the inbound PM flows fluctuated between days and one day seemed to at least double the other two, the percent entering and exiting was adjusted to model the outbound flows in a more conservative manner. The calculated split was 7 percent inbound and 93 percent outbound. Instead the split was rounded down and up to a 5 percent inbound and 95 percent outbound split. The outbound split has the greatest impact on traffic; therefore a higher outbound split percentage is more conservative (worse case) than a lower outbound split.
This resulted in a 0.269 person PM peak hour trip rate (26.9 percent of employees arrive or leave during the PM peak hour) where 5 percent entered and 95 percent exited the JEH building based on the 5,045 existing employees working at the JEH building. Table 5-1 summarizes the JEH building trip generation rates.
FBI Headquarters Consolidation U.S. General Services Administration 5-7 Transportation Impact Assessment
Springfield
Table 5-1: J. Edgar Hoover Building Existing Peak Hour Person Trips
Source Independent Variable Time Period IN OUT TOTAL
Turnstiles (11/12/13, 12/4/13, and 1/9/14)
Survey (9/16/14 - 9/18/14) 5,045 employees
AM Peak Hour 1,361 102 1,463
PM Peak Hour 98 1,259 1,357
Existing number of employees at JEH building 5,045
AM peak hour trip generation rate 0.290
PM peak hour trip generation rate 0.269
5.2.1.2 Mission Briefing Center
The Briefing Center is assumed to have 500 seats, according to the FBI. It is assumed that half (50 percent) of the facility capacity would arrive from offsite and that half would be onsite (walk) trips. The ITE Trip Generation Manual does not contain a “Conference Center” land use; therefore, the study followed the trip rates used by the traffic study for the Washington Convention Center published in the Old Post Office (OPO) Redevelopment Transportation Study (GSA in cooperation with NCPC 2013). The AM peak inbound trip generation rate reported by the OPO study was 0.36; the PM peak outbound trip rate was 0.29, assuming that 100 percent would be inbound in the AM peak and 100 percent outbound in the PM peak.
5.2.1.3 Total Site Forecasted Person Trips
The person trip generation representing the total number of estimated employees at the new site used the trip rates calculated through the JEH building trip generation study. The Mission Briefing Center uses the person trip generation rates provided by the OPO Redevelopment Transportation Study. Table 5-2 contains the Landover site forecasted person trip generation and trip generation assumptions.
Table 5-2: Landover Site Forecasted Trip Generation
Future FBI Person Trips
Time Period
Enter/Exit Percentages
Proportion of Trips during the
Peak Hour
Future Employee Person Trips
IN OUT IN OUT TOTAL
Employees (based on JEH Turnstile Counts and Surveys)
11,055 AM Peak Hour 93% 7% 29% 2,982 224 3,206
PM Peak Hour 5% 95% 26.9% 149 2,825 2,974
Briefing Center (based on the Old Post Office Redevelopment Transportation Study)
250 AM Peak Hour 100% ‐‐ 36% 90 ‐‐ 90
PM Peak Hour ‐‐ 100% 29% ‐‐ 73 73
Total People
11,305 AM Peak Hour ‐‐ ‐‐ ‐‐ 3,072 224 3,296
PM Peak Hour ‐‐ ‐‐ ‐‐ 149 2,898 3,046
FBI Headquarters Consolidation U.S. General Services Administration 5-8 Transportation Impact Assessment
Springfield
5.2.2 Modal Split
Modal split is calculated by apportioning person trips to the available transportation modes used to commute. The process begins with calculating the split for carpools/vanpools, followed by single-occupancy vehicles (SOV), and then works systematically through the other modes. Employees and the Mission Briefing visitors are evaluated separately.
5.2.2.1 Employee Mode Split
Carpool/Vanpool: The number of vehicles is highly dependent on the number of parking spaces available. According to the NCPC Comprehensive Plan Transportation Element (NCPC 2004), the number of parking spaces for a suburban site within 2,000 feet of a Metrorail station is determined by a ratio of one parking space for every three employees, a ratio of 1:3. Because the site is projected to have 11,055 employees, the number of parking spaces is therefore assumed to be 3,685. It should be noted that this number does not reflect the non-seated workers, visitors, and pool fleet, which will require additional parking spaces and will not be subject to NCPC parking policy. Based on information from NCPC and consultant knowledge of carpool/vanpool mode split at other large Federal sites, the carpool/vanpool mode split was initially estimated at approximately 8 percent. Given the significant slugging (casual carpool) population in the I-95 corridor; limited parking at the site and at suburban Metro stations; long trip times when driving, parking, and using Metrorail; vanpool incentive programs and dedicated vanpool and carpool parking at the site; the high percentage of Federal employees living south of the site along the I-95 corridor; and that onsite Transportation Demand Management programs would likely include a ride-matching program customized for FBI employees, it is reasonable to assume that 11 percent (1,216) of FBI employees at this site would take advantage of carpools/vanpools. This is slightly lower than the MWCOG model projection (MWCOG 2014) for this site in 2020 (12.4 percent), but consistent with several existing Federal sites in the region. Based on the Springfield Site Transportation Agreement, the average vehicle occupancy would be four persons resulting in 304 vehicle trips and by extension 304 removed and potentially reserved parking spaces for carpools/ vanpools.
Single-Occupancy Vehicles: After 304 spaces are removed for carpool/vanpools, 3,381 spaces remain for SOV use, a 30.58 percent mode share. It is assumed that the FBI and GSA, through the application of a Transportation Management Plan, would implement policies and actions to deter any nearby on-street parking and offsite parking using the Franconia-Springfield Metro Station parking facilities. This can be accomplished through aggressive monitoring and punitive actions.
Bicycle: As noted in the Existing Condition section, a variety of multi-use paths and on-road bicycle accommodations are available in the study area. Although the land surrounding the site is characterized by low-density single-family housing, given the moderately dense multi-family residential, educational and retail uses nearby, some bicycle accommodations, and the nature of the roadway network surrounding the site, it is expected that approximately 2 percent, or 221 employees, would bicycle to the site, which is consistent with the NCPC 2011 forecast for Federal Employee Commuting Patterns (2008) (NCPC 2011) and the MWCOG 2013 State of the Commute (MWCOG 2011).
Walk: Although the land use surrounding the site is characterized by low-density single-family residential, given the limited supply of onsite parking, the mixed-use and moderately dense and fairly walkable residential, educational and retail land uses nearby, and the nearby network of multi-use paths, it is expected that approximately 3 percent, or 332 employees, would walk to the site. This would include employees who may choose to drive and then walk from adjacent paid parking facilities. This is consistent with the NCPC 2011 forecast for Federal Employee Commuting Patterns (2008) (NCPC 2011).
Commuter Bus: As noted in the Existing Condition section, there is currently one regional bus route (PRTC) serving the Franconia-Springfield Metro Station. It is likely that in the future three commuter bus providers would
FBI Headquarters Consolidation U.S. General Services Administration 5-9 Transportation Impact Assessment
Springfield
service the Springfield site: PRTC as well as Loudoun County Transit and Martz that are currently providing service along the I-95 corridor to the DC core. Given the proximity of the site to the Beltway and I-95, the availability of HOV/HOT lanes, and the anticipated demand for this service from 11,055 employees in a single location, commuter bus service is well suited for this location. This mode is particularly effective for long-distance commuters in the region as commuter buses typically pick up at a Park & Ride in the early AM and drop riders at or near their place of employment. It is expected that commuter bus providers would implement new services to meet the demand of employees commuting to this site providing service from park and ride locations throughout Northern Virginia directly to the site and/or the adjacent Metrorail station. Given the site location in proximity to the large Federal workforce in Northern Virginia and in particular along I-95 to the south of the site, freeway access to the site, and existing commuter bus services in the corridor, a 10 percent (1,105) mode share for commuter bus is assumed, generating 37 vehicle trips.
Local Bus: As noted in the Existing Condition section, there are both local buses and circulator buses operating near the site, connecting the Franconia-Springfield Metro Station to communities throughout Fairfax County, as well as providing connections between Metro and VRE stations. There are 19 local bus routes (14 Fairfax County, 5 Metrobus) serving the Franconia-Springfield Metro Station. (PRTC also has a route serving the station, as described in the Commuter Bus section.) Two of these local buses also directly serve the southwest side of the project site. Not including Franconia-Springfield, these buses serve three Metrorail stations and two VRE stations in total, including as far north as Dunn Loring. As such, the capture area for local bus for this suburban site is quite large. However, this is offset by infrequent headways, long distances, and the long travel times potential employees would experience using these services.
In general, these routes serve suburban areas. Higher density areas in Arlington County and the City of Alexandria are accessible via Metrorail, so FBI employees living in those areas are not likely to use multiple local bus trips to access the site. However, with limited onsite parking availability, some employees would choose to drive and then walk or take local bus from adjacent paid parking facilities to the Franconia-Springfield Metro Station to catch the shuttle. As a result 6 percent, or 663 employees, was selected as the local bus mode split for this site to incorporate employees who drive to a location near the site then use local bus for the final leg as well as employees using only local bus service.
Metro/VRE: Once the data points and assumptions for other modes were applied and the number of employees assigned to each was calculated, it is assumed that the remaining employees will travel to/from the site via Metro or VRE via the Springfield Franconia Metro station which is approximately 0.5 miles one way by roadway. When all other modes are combined they equate to 6,918 trips, leaving 4,137 trips, or 37.42 percent of the total trips, that would use Metro or VRE and walk or take a shuttle to the site. The results of the 2013 Mark Center Transportation/Commuter Survey Report (Washington Headquarters Services 2012) showed 48 percent of employees used public transit in 2013, a trip that requires transferring to a bus at either the Pentagon Metro Station or King Street Metro Station to reach the Mark Center site. These results are relevant because it is a large federal worksite with limited onsite parking and illustrates that a large percentage of employees will utilize transit when parking is not available. This is higher than the 33 percent reported by NCPC for Federal Employees region-wide. However, it is reasonable given the expected parking ratio of 1:3 (one space for every three employees) resulting in only 3,442 SOV parking spaces for 11,055 employees and the proximity of the site to the Springfield-Franconia Metro Station and VRE station.
Table 5-3 summarizes the relevant modal split information sources and percentages referenced in the discussion above.
FBI Headquarters Consolidation U.S. General Services Administration 5-10 Transportation Impact Assessment
Springfield
Table 5-3: Modal Split Summary of Sources
Mode MWCOG 2020
Percent by Mode for TAZ 2025 a
MWCOG 2013 State of the Commute b
2011 NCPC c Federal Employee Commuting
Patterns (2008)
Single-Occupancy Vehicles (SOV)
76.5% 71.5% 54%
Carpool/ Vanpool 12.4% 7.3% 8%
Bicycle NA 2.4%
2%
Walk 0.1% 3%
Commuter Bus NA NA NA
Local Bus 5.3% 18.8% 33%
Metrorail/ Commuter Rail 5.7%
Telework/ Compressed Work Schedules
NA NA NA
Total 99.1% 100% 100%
NA = Not Applicable. Percentages do not always equal 100 percent due to unreported modes and/or rounding. a Represents the forecasted 2020 modal split based on a forecast of more than 2,100 total jobs within the MWCOG travel
demand model traffic analysis zone (TAZ) 1113 located at the proposed site (MWCOG 2014) b MWCOG (2011) c NCPC (2012)
Table 5-4 summarizes the FBI mode split, as discussed above, and provides the resulting trips by mode. Table 5-4: FBI Modal Split Summary
Mode
FBI Development
Percent by Mode
FBI Number of trips by
Mode
Single-Occupancy
Vehicles 30.58% 3,381
Carpool/ Vanpool a
11% 304 trips (1,216
persons)
Bicycle 2% 221
Walk 3% 332
Commuter Bus b 10% 37 trips (1,105
persons)
Local Bus 6% 663
Metrorail/ Commuter Rail
37.42% 4,137
Telework/ Compressed
Work Schedules 0% 0
Total 100% 11,055 a Assumes an average occupancy of four persons per carpool//vanpool b Assumes an average of 30 persons per commuter bus; 1,105 people equates to 37 buses
FBI Headquarters Consolidation U.S. General Services Administration 5-11 Transportation Impact Assessment
Springfield
5.3 Pedestrian Network
Under the Build Condition, sidewalk improvements along the eastern corner of the Springfield site would be built to connect the onsite sidewalks and pedestrian access gate area to the offsite pedestrian network. Because the roadways adjacent to the Springfield site already have sidewalks on at least one side of the road, or would have sidewalks as roadways are constructed for the No-build Condition (e.g., Frontier Drive Extension and Metropolitan Center Drive Extension), only localized pedestrian improvements are anticipated at the locations of the remaining ECFs to provide ADA compliance and pedestrian access, as needed. Within the site, multiple pedestrian pathways would provide access to the Main Building and between elements on the site; the exact location of these pedestrian accommodations would be determined in the final site design process.
Based on the anticipated mode split percentages including 3 percent walk, 37 percent transit, and 16 percent bus, a large number of pedestrians would access the Springfield site via the surrounding pedestrian network from nearby transit stops and residential areas. The large increase in pedestrians would be due to the increased employment density anticipated at the Springfield site and because the Springfield site is within a 0.5-mile walking distance of several transit options. Also, reduced parking was designed following NCPC guidance to encourage employees to access the site via transit. It is expected that most transit riders would follow sidewalks from the Franconia-Springfield Metro Station to the pedestrian gate at the eastern edge of the Springfield site. These sidewalks either currently exist, would be built with future roadways planned in the No-build Condition, or would be built locally around the Springfield East ECF as part of the Build Condition to connect to the pedestrian network.
Therefore, due to the large increase in pedestrians expected to access the site on foot via the pedestrian network, the Build Condition as planned would have direct, long-term, beneficial impacts to the pedestrian network. The pedestrian impacts would overall be beneficial, rather than adverse, because the sidewalks would be used more often, with overall increased use of the otherwise underused complete streets infrastructure. The sidewalk improvements at the East ECF would reduce barriers to accessing the site, and the increase in pedestrians using transit would improve overall sustainability. Under the Build Condition there would be direct, short-term, adverse impacts to the pedestrian network caused by construction vehicles crossing the sidewalk and pedestrian crosswalks and intermittent sidewalk closures.
5.4 Bicycle Network
As noted for the No-build Condition (Section 4.3), the Fairfax County Bicycle Master Plan (Fairfax County 2014a) recommends new bicycle lanes on several roadways within the study area. The only bicycle improvements that are known to be funded and therefore would be complete by 2022 as part of the No-build Condition would be the bicycle lanes on Fairfax Drive Extension, covered bicycle storage at the Franconia-Springfield Metro Station and VRE Station, and pedestrian and bicycle improvements between NVCC and the Metrorail (FCDOT 2014). No offsite bicycle improvements are planned as part of the Springfield Build Condition. No offsite bicycle improvements are planned as part of the Springfield Build Condition.
With the planned Frontier Drive Extension (currently Springfield Center Drive) bicycle lanes directly adjacent to the proposed facility, the overall bicycle mode split to the site is projected to be 2.0 percent, resulting in approximately 226 bicycle roundtrips daily. It is assumed that there would be bicycle facilities on site to encourage the use of the bicycle mode of travel.
The increase in bicycle trips from the Springfield Build Condition would increase overall bicycle volumes in the study area. Given the existing amount of bicycle facilities within the study area and those facilities that are proposed, these additional trips would likely be able to be accommodated without any impacts to pedestrian or vehicle traffic. Therefore, the Springfield Build Condition would have no measurable direct, long-term impacts to
FBI Headquarters Consolidation U.S. General Services Administration 5-12 Transportation Impact Assessment
Springfield
the bicycle network. Also under the Springfield Build Condition, there would be direct, short-term, adverse impacts to the bicycle network on Frontier Drive Extension and Loisdale Road caused by construction vehicles blocking the sidewalks or bike lanes and intermittent closures.
5.5 Public Transit
The following sections describe the Springfield Build Condition for the bus and Metrorail modes within the Springfield study area. Similar to the No-build Condition analysis, commuter rail, commuter bus, carsharing, slugging, and private shuttles are not evaluated for the Build Condition because future ridership information or planning documents were not available. It is anticipated that there would be an increase in people commuting to the site via commuter rail, commuter bus, shuttle, or slugging given the overall increase in total trips in the Build Condition. The projected use of shuttles for future FBI employees, however, is discussed below.
5.5.1 Projected Trips
The projected person trips are explained in the Trip Generation and Modal Split section (see Section 5.2).
5.5.2 Metrorail Analysis
The Metrorail analysis was conducted using projected 2022 No-Build Condition ridership and the additional passenger trips associated with the Springfield Build Condition. The Springfield Build Condition passenger trips were assigned to Metrorail peak hours using the Metrorail/Commuter Rail mode split of 37 percent, and a further reduction of AM peak trips out of the site and PM peak trips into the site, to account for passengers that could use VRE instead of Metrorail. VRE service only operates to Franconia-Springfield Metro Station in the northbound direction during the AM peak and in the southbound direction during the PM peak. The VRE passenger trip reduction was calculated using the current proportion of daily passengers that use VRE instead of Metrorail to and from Franconia-Springfield Metro Station, as shown in table 5-5.
Table 5-5: Franconia-Springfield VRE/Metro Station Ridership Proportions
Franconia-Springfield Station
Northbound Entries Southbound Exits
Total Percent of Total Total Percent of Total
VRE 769 9% 1,012 11%
Metrorail 7,566 91% 7,801 89%
Total 8,335 100% 8,813 100%
Sources: WMATA (2014d); WMATA (2014b); VRE (2014)
With a Metrorail mode split of 37 percent and the VRE reduction (minus nine percent in the AM peak hour and minus 11 percent in the PM peak hour), a total of 1,226 additional AM peak hour passenger trips and 1,134 additional PM peak hour passenger trips are projected. Table 5-6 summarizes the additional Metrorail trips associated with the Springfield Build Condition.
FBI Headquarters Consolidation U.S. General Services Administration 5-13 Transportation Impact Assessment
PM Peak Hour 49 1,084 1,134 a These figures represent the percentage of passengers who would use Metrorail instead of VRE, and constitute the “VRE
Reduction” previously referenced (VRE 2014). Source: Springfield Site Transportation Agreement (Appendix E1)
The additional peak hour Metrorail passenger trips were further disaggregated into AM and PM peak 15-minute periods using existing Peak Hour Factors (PHF) at Franconia-Springfield Metro Station. Overall, this would result in an additional 310 passenger trips during the AM peak 15-minute period and an additional 329 passenger trips during the PM peak 15-minute period, as summarized in table 5-7.
FBI Headquarters Consolidation U.S. General Services Administration 5-14 Transportation Impact Assessment
Source: Springfield Site Transportation Agreement (Appendix E1); WMATA (2014d); WMATA (2014b)
Overall, the Springfield Build Condition would result in an additional 4,223 weekday entries at the Franconia-Springfield Metro Station, bringing the weekday station entry total to 13,301 passengers (see table 5-8). Average weekday exits would theoretically be the same or similar to the average weekday entries.
Table 5-8: Weekday 2022 Projected Metrorail Ridership at Franconia-Springfield Metro Station
Station
Average Weekday Entries
2014 2022
Background Growth
2022 Planned Development
Projects
2022 Total No-build
2022 Additional Springfield Build Trips
2022 Total Springfield Build Trips
Franconia-Springfield
7,566 8,915 163 9,078 4,223 13,301
Source: WMATA (2014b); WMATA (2014d); MWCOG (2015); Springfield Site Transportation Agreement (Appendix E1)
5.5.2.1 Metrorail Passenger Loads
Metrorail passenger loads at Franconia-Springfield Metro Station were calculated based on projected 2022 No-build Condition ridership (background growth plus planned development passenger trips) plus the additional Springfield Build Condition passenger trips disaggregated to peak 15-minute periods. Because Franconia-Springfield is a terminal station, passenger loads are equal to the total number of exiting passengers per train in the outbound direction (trains ending at the station) or the total number of entering passengers per train in the inbound direction (trains beginning at the station). Outbound exiting passengers during the PM peak period were higher than inbound entering passengers during the AM peak period at the station; therefore, PM peak 15-minute exits were used for this analysis.
No expansion of WMATA’s current Metrorail fleet was assumed for this analysis to provide the most conservative estimate of potential capacity issues. The Momentum Plan does call for all eight-car trains on all lines during peak
FBI Headquarters Consolidation U.S. General Services Administration 5-15 Transportation Impact Assessment
Springfield
periods by the year 2020; however, this would require significant upgrades to electrical systems and a significant expansion of WMATA’s current fleet of railcars (WMATA 2014e). All trains were assumed to have six cars with the exception of Blue line trains, which typically have eight during peak periods (WMATA 2014f).
WMATA has three thresholds for railcar occupancy: less than 100 passengers per car (acceptable), between 100 and 120 passengers per car (crowded), and greater than 120 passenger per car (extremely crowded). Capacity is generally considered to be 120 passengers per car. Projected passenger loads under the Springfield Build Condition at the station are well below 100 passengers per car, and therefore would be considered acceptable. Table 5-9 summarizes passenger loads per car under the Springfield Build Condition using PM peak 15-minute exits.
a A 6-minute headway equates to 2.5 trains every 15 minutes. This figure was rounded down to two in order to provide the most conservative load estimate.
b Assumes two 6-car Silver line trains and one 8-car Blue line train. Source: WMATA (2014b); WMATA (2014d); MWCOG (2015); Springfield Site Transportation Agreement (Appendix E1)
5.5.2.2 Station Capacity Analysis
A capacity analysis was conducted for the vertical elements (escalators and stairs), faregate aisles, fare vending machines, and platforms at the Franconia-Springfield Metro Station. The analysis used 2022 Springfield Build Condition peak 15-minute periods of ridership (entries and exits) at the station (see table 5-7).
Volume-to-capacity (v/c) ratios were calculated for the vertical elements and fare elements, and pedestrian LOS was calculated for the platform area. Analysis for vertical elements and faregate aisles used projected ridership from the peak exiting period at the station – the time period when the highest total number of passengers would use each element. Table 5-10 summarizes ridership during the peak exiting periods at Franconia-Springfield Metro Station.
FBI Headquarters Consolidation U.S. General Services Administration 5-16 Transportation Impact Assessment
Springfield
Table 5-10: Springfield Build Condition Weekday Peak 15-Minute Exiting Period Ridership
Source: WMATA (2014b); WMATA (2014d); MWCOG (2015); Springfield Site Transportation Agreement (Appendix E1)
The platform area analysis and fare vending analysis used projected Springfield Build Condition ridership from the peak entering period at the station – the time period when the highest number of passengers would likely use fare vending machines and be waiting on the platform. Table 5-11 summarizes ridership during the peak entering period at Franconia-Springfield Metro Station.
Table 5-11: Springfield Build Condition Weekday Peak 15-Minute Entering Period Ridership
Metro Station Time 2014 2022 No-build 2022 Build
Entries Exits Entries Exits Entries Exits
Franconia-Springfield 7:30 AM – 7:45 AM 445 41 530 89 549 380
Source: WMATA (2014b); WMATA (2014d); MWCOG (2015); Springfield Site Transportation Agreement (Appendix E1)
Overall, vertical elements, faregate aisles, and fare vending machines at the station are projected to operate within capacity, or below a v/c of 0.7. Additionally, platform peak pedestrian LOS (based on the available spacing between passengers) on the busiest platform sections are projected to be at the acceptable LOS B.
Table 5-12 summarizes the results of the Franconia-Springfield Metro Station capacity analysis under the Springfield Build Condition, including the vertical elements, fare elements, and platforms. Further details on the station capacity analysis are found in Appendix E3.
Table 5-12: 2022 Franconia-Springfield Metro Station Build Condition Station Capacity Analysis Summary
Element Volume to Capacity
(V/C) Ratio
Mezzanine/ Platform
Entry Escalators 0.21
Exit Escalators 0.25
Stairs 0.44
Faregate Aisles 0.26
Fare Vending 0.21
Platform Peak LOS B
Sources: WMATA (2014b); WMATA (2014d); Franconia-Springfield Metro Station Site Inventory (December 2014); Springfield Site Transportation Agreement (Appendix E1)
5.5.2.3 NFPA 130 Emergency Evacuation Analysis
An emergency evacuation analysis was conducted to compare evacuation capacity of Franconia-Springfield Metro Station to standards set by NFPA 130 code (TRB 2013). NFPA 130 requires that station platforms be fully evacuated with 4 minutes and that all passengers reach a point of safety within 6 minutes. WMATA Metrorail stations, however, are not required to meet these criteria. Details on the assumptions and calculations
FBI Headquarters Consolidation U.S. General Services Administration 5-17 Transportation Impact Assessment
Springfield
necessitated in NFPA 130 are found in Appendix E4. A summary of the emergency evacuation analyses is included below, with further details on the station analysis included in Appendix E4.
The NFPA 130 analysis used the number of entries and exits from the peak 15-minute period under the Springfield Build Condition (5:00 PM to 5:15 PM) at the station. Table 5-10 summarizes the volume of passengers entering and exiting the station during this period.
Using the Springfield Build Condition peak 15-minute ridership period and NFPA 130 assumptions and guidelines, the platform at the Franconia-Springfield Metro Station could be evacuated in 4.0 minutes, and the entire station could be evacuated to a point of safety within 9.8 minutes.
5.5.3 Bus Analysis
The additional bus trips associated with the Springfield Build Condition are summarized in table 5-13. At a local bus mode split of 6.0 percent, approximately 198 additional AM peak hour bus passenger trips and 183 additional PM peak hour bus passenger trips are projected in the study area.
Table 5-13: Springfield Build Condition Additional Peak Hour Local Bus Passenger Trips
Employees Time Period Proportion of Daily
Total Local Bus Mode
Split TOTAL LOCAL
BUS TRIPS
11,055 AM Peak Hour 29% 6.0% 192
PM Peak Hour 26.9% 6.0% 178
Briefing Center Time Period Proportion of Daily
Total Local Bus Mode
Split TOTAL LOCAL
BUS TRIPS
250 AM Peak Hour 36% 6.0% 5
PM Peak Hour 29% 6.0% 4
Total People Time Period TOTAL LOCAL
BUS TRIPS
11,305 AM Peak Hour 198
PM Peak Hour 183
Source: Springfield Site Transportation Agreement (Appendix E1)
The additional peak hour bus passenger trips associated with the Springfield Build Condition were added to the peak hour bus volumes calculated for the study area in the 2022 No-Build Condition. The trips were added proportionally to each route within the study area based on No-Build Condition ridership. For this analysis, it was assumed that there would be no major changes in bus service in the study area by 2022.
Overall, AM peak hour Springfield Build Condition bus volumes are projected to total 1,106 passengers, and PM peak hour volumes are projected to total 1,087 passengers. These totals are both below the overall capacity of services, as summarized in table 5-14, meaning the additional passenger trips projected could be adequately handled by current service levels. No individual routes are projected to experience capacity issues either. Appendix E6 has further details on the bus capacity analysis.
FBI Headquarters Consolidation U.S. General Services Administration 5-18 Transportation Impact Assessment
Springfield
Table 5-14: Springfield Build Condition Bus Capacity Analysis
Total Capacity 2,459 2,441 2,459 2,441 2,459 2,441
Volume to Capacity Ratio (V/C)
0.31 0.31 0.37 0.37 0.45 0.45
Source: Springfield Site Transportation Agreement (Appendix E1); Springfield Site Trip Generation Summary (see Traffic Analysis section) (2015); WMATA (2014a); WMATA (2014d); MWCOG (2015).
5.5.4 Level of Impact
The increase in public transit trips from the Springfield Build Condition would have the following impacts to transit:
The overall capacity of bus services in the study area would accommodate the projected ridership, and no individual routes would experience capacity issues.
Metrorail car passenger loads through the study area are projected to be at acceptable levels.
Overall, Metrorail vertical elements, faregate aisles, and fare vending machines at the Franconia-Springfield Metro Station are projected to operate below capacity.
Metrorail platform peak pedestrian LOS (based on the available spacing between passengers) on the busiest platform sections are projected to be at the acceptable LOS B at the Franconia-Springfield Metro Station.
Platform and station evacuation times would increase slightly over the No-build Condition. Platform evacuation times would continue to meet NFPA 130 standards, and station evacuation times would continue to exceed NFPA 130 standards.
Therefore, the Springfield Build Condition would have no measurable direct, long-term impacts to public transit. In addition, bus operations along one bus route would have direct, long-term, adverse impacts caused by the potential traffic delays forecasted along Loisdale Road (see Section 5.7 Traffic Analysis). The same bus line that regularly services Springfield Center Drive and Loisdale Road would encounter direct, short-term, adverse impacts caused by construction vehicles blocking some or all of the lanes and intermittent road closures.
5.6 Parking
Under the Build Condition, employee parking garages would be located to the north and east of the Main Building developable area along the northeastern site boundary, adjacent to Metropolitan Center Drive (figure 5-3). Given the distance to the nearest transit station, and in accordance with NCPC parking policy, a parking ratio of one parking space for every three employees would be maintained, equating to approximately 3,600 spots. In the conceptual site layout analyzed in the EIS, these spaces would be accommodated in two, eight-story parking structures. The final number and layout of the parking structures to accommodate the required employee and fleet vehicle parking would be determined during the design process. Up to 145 visitor parking spaces would be provided near the VC.
While all employee and visitor parking is envisioned to be accommodated onsite, it is likely that there would be more employee demand for driving than there are parking spaces due to the less than 1:1 ratio of parking spaces to employees (not all employees would have a parking spot) as recommended by NCPC policies. As an “end-of-
FBI Headquarters Consolidation U.S. General Services Administration 5-19 Transportation Impact Assessment
Springfield
the-line” station, Metrorail may not seem like the best travel option from other sides of the city. Therefore, some employees may try to park on local streets (Frontier Drive Extension would have on-street, short-term, metered parking) or park on local residential streets that do not have parking restrictions. Still others may choose to pay to park in local area parking garages. Development and implementation of a Transportation Management Plan (TMP), which includes Transportation Demand Management (TDM) measures that will encourage employees to use transit and discourage employees from driving and parking offsite, will address these issues and reduce any adverse parking impacts anticipated at the Springfield site. With implementation, monitoring, and enforcement of a TMP, and revisions as needed, the Build Condition would result in no measurable direct, long-term impacts to local area competition for parking. Assuming all construction equipment and employee parking areas would be contained to the Springfield site, there would be no measurable direct, short-term impacts to parking in the study area during the construction period.
FBI Headquarters Consolidation U.S. General Services Administration 5-20 Transportation Impact Assessment
Springfield
Figure 5-3: Greenbelt Site Parking
5.7 Truck Access
Truck access for the Springfield site would occur at the northwestern corner of the site off of Loisdale Road. Trucks would only be permitted to enter and exit during non-peak hours; therefore, peak traffic hours on adjacent
FBI Headquarters Consolidation U.S. General Services Administration 5-21 Transportation Impact Assessment
Springfield
roadways would not be impacted. Truck entrance and exit locations and restricted hours would be noted at entrance locations and communicated to those services that would provide regular truck delivery to the site. It should be noted that the location of the truck access off of Loisdale Road was designed to prevent trucks from using local neighborhood roads to access the site.
Under the Build Condition, there would be no measurable direct, long-term impacts to truck access given communication of truck access regulations. Assuming the Springfield site would have access entrances and exits assigned for construction equipment and general trucks during the construction period, there would be no measurable direct, short-term impacts to truck access.
5.8 Traffic Analysis
The future projected traffic analysis is based on the proposed alternative to consolidate the FBI HQ at the Springfield site. The next sections describe the process the study followed to project future traffic volumes through three primary assumptions: trip generation, modal split, and trip distribution, followed by a discussion of the impacts of the proposed alternative.
5.8.1 Total Vehicle Trips
The projected person trips are explained in the Trip Generation and Modal Split section (see Section 5.2). Once the modal split is applied, the vehicle trip generation can be calculated. Based on the trip generation rates combined with the SOV and HOV modal split and persons per carpool, the total vehicle trips are forecasted to be 1,024 inbound and 75 outbound during the AM peak hour and 49 inbound and 966 outbound during the PM peak hour.
Tables 5-15 and 5-16 summarize the vehicle trips based on the trip generation and the mode split.
FBI Headquarters Consolidation U.S. General Services Administration 5-22 Transportation Impact Assessment
Springfield
(This page intentionally left blank.)
FBI Headquarters Consolidation U.S. General Services Administration 5-23 Transportation Impact Assessment
Total Trips 45 4 864 78 0 0 22 2 49 966 a Assumes a 500-seat facility where external trips represent 50% of attendees.
FBI Headquarters Consolidation U.S. General Services Administration 5-24 Transportation Impact Assessment
Springfield
(This page intentionally left blank.)
FBI Headquarters Consolidation U.S. General Services Administration 5-25 Transportation Impact Assessment
Springfield
5.8.2 Trip Distribution
Based on the Springfield Site Transportation Agreement, it is assumed that 50 percent of existing FBI employees would relocate to the new site, and the other 50 percent would represent new FBI employees who would choose to locate in proximity of the proposed Springfield site.
The trip distribution for work trips is composed of two sources, the existing FBI home zip codes and MWCOG travel demand model. The FBI estimates that approximately 50 percent of the existing FBI staff would retire, transfer to another FBI site outside the National Capital Region, or resign once the new HQ is operational; therefore, 50 percent of the distribution is based on the FBI zip code database. The existing FBI home zip codes are used as the home origin and home destination. The other 50 percent of trips are based on distribution patterns in the Springfield area from the 2020 MWCOG travel demand model for home-based work trips because the model trip tables represent a more local distribution reflecting new employee interest in residing close to the consolidated FBI HQ (MWCOG 2014). The two distribution patterns (home zip code plus MWCOG trip tables) were averaged to form a blended trip distribution. Because the Mission Briefing Center external vehicle trips would most likely not resemble a localized trip pattern, the study used the same blended trip distribution for these vehicle trips.
Table 5-17 shows the Springfield Site Transportation Agreement approved blended trip distribution percentages to/from each origin/destination. Figure 5-4 contains the Springfield site Build Condition trip distribution.
Table 5-17: Springfield Site Build Condition Trip Distribution Summary
Roadway and Direction Percentages AM Trips PM Trips
FBI Headquarters Consolidation U.S. General Services Administration 5-26 Transportation Impact Assessment
Springfield
Figure 5-4: Springfield Site Build Condition Trip Distribution
5.8.3 Entry Control Facility
The ECF is a security check point for all vehicles to pass through to access the internal roadway serving the parking garages, loading docks, and other components of the Springfield site. Each vehicle would be expected to stop at the facility while FBI security personnel screen the vehicle and occupants before being allowed it to proceed. Similar to a tollgate along a highway, the ECF might cause a queue; therefore, the analysis must determine if a queue might spill beyond the planned driveway onto the street network.
FBI Headquarters Consolidation U.S. General Services Administration 5-27 Transportation Impact Assessment
Springfield
The ECF has four elements: separate lanes for FBI security personnel to process each vehicle as it arrives at the Springfield site; barriers separating each lane; a stop line where each vehicle would be processed; and a merging area after the processing area. Each component was coded in the TransModeler™ Traffic Simulation Software (TransModeler™) to best represent the conditions each vehicle would experience as it enters the Springfield site. Based on the preliminary conceptual site plan, TransModeler™ allows the ECF components to be situated at their proper location based on the set-back distances already determined through the site plan planning process. Because the preliminary conceptual site plan called for two lanes serving the ECF from the Frontier Drive Extension, four lanes were initially coded to ensure enough capacity. The preliminary conceptual site plan called for one lane serving the ECF from Metropolitan Center Drive; however, to avoid any potential delays two-lanes were initially coded.
The ECF processing times are a critical component of the analysis because these times determine the number of lanes required at each ECF facility to avoid the queue spilling onto the external roadways (Frontier Drive Extension and Metropolitan Center Drive in this case). It was determined that existing processing times at the JEH building would provide the best indication of future processing time at the three alternative sites. A special ECF processing study was undertaken on December 4, 2014, between 6:20 AM and 7:50 AM during the AM peak period. Processing times and vehicle occupancy were recorded for each vehicle (78 vehicles) entering the JEH parking garage located under the building. A parking garage guard shift change occurred during the survey midpoint allowing approximately half the sampling during the first guard and half during the second guard, thereby providing a good cross section of processing times. Processing times ranged from 7 seconds for SOV up to 103 seconds for vanpools.
Based on the processing times obtained through the survey, a probability triangle was created to develop a range of vehicle processing times to code into TransModeler™. These probabilities range from 10 percent to 90 percent, fitting a triangular distribution (a continuous probability distribution shaped like a triangle defined by three values: the minimum or 10th percentile value, the maximum or 90th percentile value, and the peak or 50th percentile value). Based on the survey, there was an average of 14.1 seconds per vehicle, which includes carpools and vanpools entering. Since the carpool and vanpools represent a small number of vehicle entering and have much higher processing times than SOVs, the average without those vehicles was calculated, resulting in 12.3 seconds per SOV vehicle. The 14.1 second value was assigned the 90th percentile and the 12.3 seconds was assigned the 50th percentile. To be conservative, the 10th percentile was calculated based on the percent difference between 50th percentile value (12.3 seconds) and 90th percentile value (14.1 seconds). The difference of 1.73 percent subtracted from 12.3 seconds resulted in a 10th percentile value of 10.6 seconds per vehicle. Since TransModeler™ requires a percentage assigned to each processing time, the 15th percentile and 85th percentile were interpolated to fill in the remaining available 30 percent in the processing times. Table 5-21 contains the processing probabilities.
Table 5-18: Processing Probabilities
10th Percentile
15th Percentile
50th Percentile
85th Percentile
90th Percentile
Percentage used in TransModeler™
10 15 50 15 10
Vehicles per Second
10.6 10.8 12.3 13.9 14.1
Once the ECFs were coded, simulations were run to observe how TransModeler™ assigned each vehicle to the available lanes. Calibrations were entered to balance the use of available lanes, thus providing the highest capacity given the available queuing space. The ECF analysis was conducted after all the external roadway
FBI Headquarters Consolidation U.S. General Services Administration 5-28 Transportation Impact Assessment
Springfield
mitigation measures (recommended improvements to address failing traffic operations) were determined. This allowed for TransModeler™ to be coded with the recommended lane geometry (number of left-turn, through, and right-turn lanes) and traffic signal timings before testing the ECF queuing, thus the maximum number of inbound FBI vehicles would be entering the Springfield site.
The ECF simulation analysis followed a statistical approach. This was performed by running the simulation 25 times to calculate the standard deviation based on the vehicles hour of travel (VHT) metric. VHT provides a good indication of vehicle delays by requiring more simulations given facility operation and queuing issues. Using the calculated standard deviation, the number of simulations required was calculated to be within plus or minus 2 percent at the 95th percentile confidence interval (when all the required simulation runs are averaged, 95 percent of the results will be accurate to within plus or minus 2 percent).
Once the simulations were completed, three different measures were extracted from TransModeler™ to report the estimated queuing based on the total number of available lanes. These measures included vehicles processed per hour, average queue length (similar to the 50th percentile queue length), and maximum queue length (similar to a 100 percentile queue length). Together, these values provide an indication whether or not the available queue space would provide enough storage or the queue would impact the Frontier Drive Extension or Metropolitan Center Drive.
Based on the ECF processing time probabilities entered into TransModeler™, the software reported an upper limit of approximately 200 vehicles per hour per entry lane being processed. By comparison, the Better Military Traffic Engineering Pamphlet 55-17 (SDDCTEA 2011) reports the lowest range of vehicle throughput for manually controlled operations is 300 vehicles per hour per lane. This value represents conditions at a military base under the BRAVO Force Protection alert status or a condition where each vehicle would be required to be inspected as well as each occupant. The ECF processing time therefore represents a reasonable and conservative estimate.
5.8.4 Development of Build Condition
It is important to note that the Build Condition includes GSA trips removed from the existing GSA site as well as the addition of the forecasted FBI vehicle trips and No-build vehicle trips. The existing vehicle trips generated by the existing GSA site were removed first from the study area network before adding the forecasted FBI vehicle trips. The existing condition volumes obtained for the two intersections serving the GSA site were added together to develop the inbound and outbound flows during both peak hours. The distribution relied on the same source as the planned developments, the Springfield Mall Town Center Traffic Impact Study office distribution pattern (GS 2008) (see Appendix E7). Based on the existing condition traffic counts, a total of 222 vehicle trips were removed from the AM peak hour network, and 94 vehicle trips were removed from the PM peak hour network. Broken down into the entry and exit volumes, 173 vehicles entered and 49 exited during the AM peak hour and 11 vehicles entered and 83 existed during the PM peak hour. Table 5-22 contains the GSA trips removed.
Table 5-22: GSA Site Trips Removed
AM PEAK HOUR PM PEAK HOUR
IN OUT TOTAL IN OUT TOTAL
173 49 222 11 83 94
Because there are multiple routes that could be accessed between the Interstate system (I-95, I-395, and I-495) and the Springfield site, TransModeler™ also performed the selection of which route to assign vehicle trips. Performing the vehicle assignments required validating and calibrating the TransModeler™ developed roadway network. Appendix E8 contains the TransModeler™ validation and calibration process.
FBI Headquarters Consolidation U.S. General Services Administration 5-29 Transportation Impact Assessment
Springfield
Once calibrated and validated based on the existing conditions, the study area intersections (modeled network) were adjusted to match the optimized traffic signal settings calculated through the No-build Condition. This reflects adjusted signal timings based on the No-build Condition projected vehicle volumes because it is assumed that VDOT would revise the traffic signals to improve the vehicle flow over the next 8 years leading to 2022 based on vehicle volumes changing due to the planned developments.
The Springfield site internal roadway network was added to the modeled network based on the preliminary conceptual site plan, which included roadway connections to the external network. Because of the magnitude of the proposed development in terms of FBI vehicle trips, the intersections serving the Springfield site were designed with traffic signals and optimized to handle an estimate of the future Build Condition traffic volumes. These intersection upgrades are probably mitigation measures and would be further analyzed in the Build with Mitigation Condition to determine their final recommended design. Synchro™ was used to develop the traffic signal timing plans and entry and exit driveway lane geometry based on forecasted FBI vehicle volumes. The following potential mitigation measures were coded to reflect necessary upgrades to the intersections serving the site driveways.
A. Frontier Drive Extension and Site South Access: Install a traffic signal and create a three-lane approach exiting the Springfield site with two right-turn lanes and one left-turn lane.
B. Frontier Drive Extension and Metropolitan Center Drive: Install a traffic signal and create a three-lane eastbound approach from Metropolitan Center Drive including two left-turn lanes and one right-turn lane.
The entry driveways leading to ECFs were coded to match or exceed the number of entry lanes designed in the preliminary conceptual site plan to minimize trip assignment (trip redistributions that would occur in the model) based on ECF facility delays. (Note that the revised conceptual site plan shows seven total inbound lanes due to the analysis performed in the mitigation section; however, the preliminary conceptual site plan shows four total inbound lanes). These facilities are considered part of the preliminary conceptual site plan and are not mitigation measures. The following two locations were coded in TransModeler™ to serve as entrances or exits leading to or from the ECFs:
Frontier Drive Extension and Site South Access: Five-lane entry and two-lanes exit Metropolitan Center Drive and Site East Access: Two-lane entry and one-lane exit
Following a few more simulation trails using TransModeler™, it became necessary to improve the manner in which the internal roadways were proposed to operate to avoid major queuing issues inside the fence. Thus, the following adjustments were coded in TransModeler™:
Upgrade the intersection between the roadway accessing the site south access (north-south orientation) and the roadway connecting the site east access and garages to a traffic signal control to avoid causing a queue along the site south access back through the ECF
Assign the middle lane along the roadway serving the garages as reversible depending on the time of day (westbound during the AM peak period and eastbound at all other times)
Once the modeled network contained the No-build Condition traffic signal timings, connections between the Springfield site and external roadways, traffic signals directly serving the proposed site driveways, and internal improvements, TransModeler™ was used to assign vehicle trips to the modeled network through a process called Dynamic Traffic Assignment (DTA). The DTA is a process where vehicle trips are assigned through a testing process during a number of simulation runs. The DTA goal is to develop a trip assignment that provides the best travel times for all vehicles. Once the vehicle travel times are minimized, the number of vehicles assigned to each route where multiple routes between the same origin and destination exist are balanced. This mimics the activity that commuters undertake when they seek alternative routes to avoid traffic delays. Commuters naturally improve
FBI Headquarters Consolidation U.S. General Services Administration 5-30 Transportation Impact Assessment
Springfield
traffic conditions where an alternative route has the capacity to handle the increase in vehicle volumes. To allow the software to test a number of options, the software was set for 30 simulation runs. At the conclusion of the simulation runs, the software recorded the version with the best vehicle travel times; these vehicle routes were used to perform the operation and queue analysis using Synchro™. Because there are several alternative routes available, the DTA result provided a split in six inbound vehicle flows between Franconia Road and the Springfield site via Loisdale Road or Frontier Drive. Table 5-23 contains the DTA vehicle assignment. Figure 5-5 shows the Build Condition trip generation representing the removal of existing GSA trips and addition of consolidated HQ FBI trips. Figure 5-6 shows the Build Condition turning movement volumes, and figure 5-7 shows the build condition lane geometry.
Table 5-23: DTA Vehicle Assignments
Route Origin Primary Route to Site AM Peak Hour PM Peak Hour
Inbound Outbound Inbound Outbound
I-95/495 North Loisdale Road 47% 100% 43% 42%
Frontier Drive 53% 0% 57% 58%
I-95 South
Loisdale Road 53% 0% 100% 0%
Spring Mall Drive/Frontier Drive 47% 0% 0% 0%
Loisdale Road/FCP 0% 100% 0% 100%
I-495 North Loisdale Road 47% 100% 43% 28%
Frontier Drive 53% 0% 57% 72%
I-395 North Loisdale Road 47% 100% 43% 40%
Frontier Drive 53% 0% 57% 60%
Backlick Road Loisdale Road 9% 100% 100% 23%
Frontier Drive 91% 0% 0% 77%
Old Keene Mill Road
Loisdale Road 60% 100% 100% 45%
Frontier Drive 40% 0% 0% 55%
Franconia Road Loisdale Road 0% 0% 0% 21%
Frontier Drive 100% 100% 100% 79%
FSP West Frontier Drive 100% 100% 100% 100%
FSP East Frontier Drive 100% 100% 100% 100%
FCP North Loisdale Road 100% 100% 100% 100%
FCP South Loisdale Road 100% 100% 100% 100%
Notes: FSP = Franconia Springfield Parkway FCP = Fairfax County Parkway
FBI Headquarters Consolidation U.S. General Services Administration 5-31 Transportation Impact Assessment
Springfield
Figure 5-5: Build Condition Trip Generation
FBI Headquarters Consolidation U.S. General Services Administration 5-32 Transportation Impact Assessment
Based on the Synchro™ signalized intersection analysis, the majority of study intersections would operate at acceptable conditions during the morning and afternoon peak hours. However, unlike in the No-build Condition, the intersections of Frontier Drive and Franconia-Springfield Parkway (Westbound) and Frontier Drive and Franconia-Springfield Parkway (Eastbound) would operate at LOS F during the AM peak hour. As with the No-build condition, the intersection of Franconia-Springfield Parkway/Manchester Boulevard and Beulah Street would operate at LOS F during both the AM and PM peak hours. These are the only intersections within the study area that would operate under failing conditions (LOS F) during a peak hour in 2020.
The following approaches to intersections would operate under unacceptable conditions (LOS E or LOS F) during the peak hour (average control delay exceeds 55 seconds):
Loisdale Road/Commerce Street and Franconia Road (Westbound) (Intersection #1) o Westbound Franconia Road (left turns) during both the AM and PM peak hours
Loisdale Road/Commerce Street and Franconia Road (Eastbound) (Intersection #2) o Northbound Loisdale Road (overall) during the PM peak hour
Loisdale Road and Ramp from NB I-95/Spring Mall Drive (Intersection #4) o Westbound Spring Mall Drive (overall) during the AM peak hour
Loisdale Road and Frontier Drive Extension (Intersection # 8) o Southbound Loisdale Drive (overall) during the AM peak hour o Westbound Spring Center Drive (overall) during the PM peak hour
Loisdale Road and Hotel Entrance/Newington Road (Intersection # 10) o Westbound Newington Road (combined left and through movements) during the PM peak hour.
Loisdale Road/I-95 (N) Ramp C and D and Fairfax County Parkway (Intersection # 11) o Eastbound I-95 Northbound off-ramp (overall), westbound Loisdale Road (overall), and
southbound Fairfax County Parkway (left turns) during the AM peak hour o Eastbound I-95 Northbound off-ramp (through movements), westbound Loisdale Road (overall),
and southbound Fairfax County Parkway (left turns) during the PM peak hour Frontier Drive and Franconia Road (Eastbound) (Intersection # 13)
o Northbound Frontier Drive (overall) during the PM peak hour Frontier Drive and Best Buy/Springfield Mall Parking Lot Entrance (Intersection # 14)
o Eastbound Springfield Mall parking lot entrance (left turns), westbound Best Buy entrance (overall), and northbound and southbound Frontier Drive (left turns on both approaches) during the AM peak hour
o Northbound Frontier Road (left turns) at the same intersection during the PM peak hour. Frontier Drive and Home Depot/Springfield Mall Garage Entrance (Intersection # 15)
o Eastbound Springfield Mall garage entrance (left and through movements), westbound Home Depot entrance (overall), and northbound and southbound Frontier Drive (left turns on both approaches) during the AM peak hour
o Northbound and southbound Frontier Drive (left turns on both approaches) during the PM peak hour
Frontier Drive and Spring Mall Drive (Intersection # 16) o Westbound Spring Mall Road (overall) and southbound Frontier Drive (left turns) during the AM
FBI Headquarters Consolidation U.S. General Services Administration 5-38 Transportation Impact Assessment
Springfield
o Southbound Frontier Drive (overall) during the AM peak hour Frontier Drive and Franconia-Springfield Parkway (Eastbound) (Intersection # 18)
o Eastbound Franconia-Springfield Parkway (Eastbound) off-ramp (overall) during the AM peak hour
Franconia-Springfield Parkway and Spring Village Drive/Bonniemill Lane (Intersection # 19) o Eastbound Franconia-Springfield Parkway (left turns), westbound Franconia-Springfield Parkway
(left turns), northbound Bonniemill Lane (overall), and southbound Spring Village Drive (overall) during both the AM and PM peak hours.
Franconia-Springfield Parkway/Manchester Boulevard and Beulah Street (Intersection # 21) o Eastbound Franconia-Springfield Parkway (left turns), westbound Manchester Boulevard
(overall), and northbound and southbound Beulah Street (both overall) during the AM peak hour o Eastbound Franconia-Springfield Parkway (overall), westbound Manchester Boulevard (overall),
and northbound and southbound Beulah Street (both overall) at the same intersection during the PM peak hour
Franconia Road and Beulah Street (Intersection # 22) o Westbound Franconia Road (left turns) and the southbound Driveway opposite Beulah Street
(overall) during the AM peak hour o Eastbound Franconia Road (overall), westbound Franconia Road (left turns), northbound Beulah
Street (left and through movements), and the southbound driveway opposite Beulah Street (overall) during the PM peak hour
Based on the Synchro™ unsignalized intersection analysis, most of the unsignalized intersection minor approaches in the study area would operate at acceptable conditions during the morning and afternoon peak hours. The intersection of Loisdale Road and the northern entrance road to the site would have a failing minor approach for the westbound (overall) approach for the northern entrance road during the PM peak hour. Further, while the intersection of Loisdale Road and the southern entrance road to the site failed in the No-build condition, it would not exist in the Build Condition.
5.8.5.3 Complete Intersection Operations Analysis
This section summarizes the differences in LOS impacts between the Build Condition and the No-build Condition by quantifying the change in intersection operation failures. Following the summary, this section also includes the complete results of the operations analysis in figures and a table.
Based on the Synchro™ signalized intersection analysis, a total of 15 signalized intersections and 1 unsignalized intersection would experience unacceptable conditions for one or more turning movements. Compared to the No-build Condition, the Build Condition would have two more intersections failing during the AM peak hour and there would no change in the number of intersections failing during the PM peak hour. For the Build Condition in the AM peak hour, there are two intersections that passed overall but would now fail, 23 that would not change, and zero that were failing but would now pass, compared to the No-build Condition. For the Build Condition in the PM peak hour, there are zero intersections that passed overall but would now fail, 25 that would not change, and zero that were failing but would now pass, compared to the No-build Condition.
Table 5-24 provides a summary of the number of intersections that meet the following criteria for the overall directional approach that would change between the Build Condition and the No-build Condition:
FBI Headquarters Consolidation U.S. General Services Administration 5-39 Transportation Impact Assessment
The average LOS for the various approaches to the intersections and the overall intersection LOS grades for the Build Condition are shown in figures 5-8 and 5-9 for the AM and PM peak hours, respectfully. Table 5-25 shows the results of the LOS capacity analysis and the intersection projected delay under the No-build Condition compared to the Build Condition during the AM and PM peak hours.
FBI Headquarters Consolidation U.S. General Services Administration 5-40 Transportation Impact Assessment
Springfield
(This page intentionally left blank.)
FBI Headquarters Consolidation U.S. General Services Administration 5-41 Transportation Impact Assessment
Springfield
Figure 5-8: Build Condition Intersection LOS for AM Peak Hour
FBI Headquarters Consolidation U.S. General Services Administration 5-42 Transportation Impact Assessment
Springfield
Figure 5-8: Build Condition Intersection LOS for AM Peak Hour (continued)
FBI Headquarters Consolidation U.S. General Services Administration 5-43 Transportation Impact Assessment
Springfield
Figure 5-9: Build Condition Intersection LOS for PM Peak Hour
FBI Headquarters Consolidation U.S. General Services Administration 5-44 Transportation Impact Assessment
Springfield
Figure 5-9: Build Condition Intersection LOS for PM Peak Hour (continued)
FBI Headquarters Consolidation U.S. General Services Administration 5-45 Transportation Impact Assessment
Springfield
Table 5-25: Comparison of No-build and Build Condition Intersection AM and PM Peak Hour Operations Analysis
Delay(sec/veh) LOS Check
Delay(sec/veh) LOS Check
Delay(sec/veh) LOS Check
Delay(sec/veh) LOS Check
1 Loisdale Road/Commerce Street & Franconia Road (Westbound) (Signalized)
WB (Franconia Rd) L 92.8 F 90.8 F 90.9 F 83.0 F
WB (Franconia Rd) T 29.8 C 32.3 C 31.1 C 38.0 D
WB (Franconia Rd) R 1.5 A 0.8 A 1.5 A 1.1 A
WB Overall (Franconia Rd) 20.8 C 25.4 C 20.8 C 27.0 C
NB (Commerce St) L 0.7 A 2.4 A 0.7 A 4.2 A
NB (Commerce St) T 1.5 A 1.9 A 1.5 A 1.7 A
NB Overall (Commerce St) 1.1 A 2.3 A 1.1 A 3.4 A
SB (Commerce St) T 70.6 E 73.8 E 69.5 E 73.9 E
SB (Commerce St) R 68.1 E 64.0 E 66.8 E 64.0 E
SB Overall (Commerce St) 69.5 E 71.1 E 68.4 E 71.1 EOverall 24.0 C Pass 31.1 C Pass 23.9 C Pass 30.6 C Pass
2 Loisdale Road/Commerce Street & Franconia Road (Eastbound) (Signalized)
EB (Franconia Rd) L 72.9 E 76.4 E 72.9 E 76.4 E
EB (Franconia Rd) T 38.0 D 52.0 D 41.5 D 52.3 D
EB (Franconia Rd) R 0.7 A 4.9 A 1.2 A 5.1 A
EB Overall (Franconia Rd) 23.1 C 21.7 C 25.0 C 22.1 C
NB (Loisdale Rd) T 70.5 E 72.1 E 71.1 E 100.1 F
NB (Loisdale Rd) R 63.4 E 55.4 E 63.3 E 55.4 E
NB Overall (Loisdale Rd) 69.0 E 69.5 E 69.5 E 93.9 F
SB (Loisdale Rd) L 2.7 A 0.1 A 2.9 A 0.1 A
SB (Loisdale Rd) T 2.7 A 0.2 A 2.5 A 0.2 A
SB Overall (Loisdale Rd) 2.7 A 0.2 A 2.7 A 0.2 A
Overall 35.7 D Pass 32.1 C Pass 34.9 C Pass 42.3 D Pass
PM Peak Hour AM Peak Hour PM Peak Hour# Intersection and Approach
Lane Group
No-build Condition Build Condition
AM Peak Hour
FBI Headquarters Consolidation U.S. General Services Administration 5-46 Transportation Impact Assessment
Springfield
Table 5-25: Comparison of No-build and Build Condition Intersection AM and PM Peak Hour Operations Analysis (continued)
FBI Headquarters Consolidation U.S. General Services Administration 5-56 Transportation Impact Assessment
Springfield
(This page intentionally left blank.)
FBI Headquarters Consolidation U.S. General Services Administration 5-57 Transportation Impact Assessment
Springfield
5.8.6 Build Condition Queuing Analysis
Synchro™ was used to calculate the 50th percentile queue lengths, and SimTraffic™ was used to calculate the 95th percentile queue lengths. The SimTraffic simulations have a statistical accuracy of plus or minus 5.0 percent error for the AM and PM peak hour simulations.
Based on the Synchro™ and SimTraffic™ analysis, the following signalized intersection approaches would experience failing queue lengths in Synchro™ or SimTraffic™. The lane group within the approach that would be operating under unacceptable conditions is noted in parentheses.
Loisdale Road/Commerce Street and Franconia Road (Westbound) (Intersection #1) o Southbound Commerce Street (right turns) during the PM peak hour
Loisdale Road/Commerce Street and Franconia Road (Eastbound) (Intersection #2) o Eastbound Franconia Street (through and right movements) and northbound Loisdale Road (right
turns) during the AM peak hour o Northbound Loisdale Road (through movements) during the PM peak hour
Loisdale Road and Loisdale Court/Mall Access (Intersection #3) o Westbound Mall Access (right turns) during the AM peak hour o Eastbound Loisdale Court (left and right turns), westbound Mall Access (right turns) and northbound
Loisdale Road (left turns) during the PM peak hour Loisdale Road and Frontier Drive Extension (Intersection #8)
o Northbound Loisdale Road (right turns) and southbound Loisdale Road (left turns) during the AM peak hour
o Westbound Springfield Center Drive (left and right turns) during the PM peak hour Loisdale Road and Hotel Entrance/Newington Road (Intersection #1)
o Westbound Newington Road (right turns) during the PM peak hour Loisdale Road/I-95 (N) Ramp C and D and Fairfax County Parkway (Intersection #1)
o Southbound Fairfax County Parkway (through movements) during the AM peak hour Frontier Drive and Franconia Road (Eastbound) (Intersection #1)
o Eastbound Franconia Road (right turns) and southbound Frontier Drive (combined left and through movement and through only movement) during the AM peak hour
o Northbound Frontier Drive (through movements) during the PM peak hour Frontier Drive and Best Buy/Springfield Mall Parking Lot Entrance (Intersection #1)
o Westbound Best Buy entrance (left turns) and southbound Frontier Drive (left and through movements) during the AM peak hour
o Eastbound Spring Mall Parking lot entrance (combined left, through and right movements) and northbound Frontier Drive (all movements) during the PM peak hour
Frontier Drive and Home Depot/Springfield Mall Garage Entrance (Intersection #1) o Westbound Home Depot entrance (all movements) and southbound Frontier Drive (left and through
movements) during the AM peak hour o Westbound Home Depot entrance (all movements) and northbound Frontier Drive (all movements)
during the PM peak hour Frontier Drive and Spring Mall Drive (Intersection #1)
o Eastbound Spring Mall Drive (right turns) and southbound Frontier Drive (through movements) during the AM peak hour
o Northbound Frontier Drive (all movements) during the PM peak hour Frontier Drive and Franconia-Springfield Parkway (Westbound) (Intersection #1)
FBI Headquarters Consolidation U.S. General Services Administration 5-58 Transportation Impact Assessment
Springfield
o Southbound Frontier Drive (through movements) during the AM peak hour o Westbound Franconia-Springfield Parkway (combined left and through movements and right turns,
northbound Frontier Drive (through movements) and southbound Frontier Drive (right turns) during the PM peak hour
Frontier Drive and Franconia-Springfield Parkway (Eastbound) (Intersection #1) o Eastbound F-S Parkway (eastbound off ramp) (all movements) during the AM peak hour o Northbound Frontier Drive (right turns) during the PM peak hour
Franconia-Springfield Parkway and Spring Village Drive/Bonniemill Lane (Intersection #1) o Eastbound F-S Parkway (through movements) and northbound Bonniemill Lane (right turns) during
the AM peak hour Franconia-Springfield Parkway/Manchester Boulevard and Beulah Street (Intersection #1)
o Westbound Manchester Boulevard (all movements), northbound Beulah Street (left turns and through movements) and southbound Beulah Street (through and right movements) during the AM peak hour
o Westbound Manchester Boulevard (left and through movements), northbound Beulah Street (left turns and through movements) and southbound Beulah Street (all movements) during the PM peak hour
Franconia Road and Beulah Street (Intersection #1) o Westbound Franconia Road (left turns) during the AM peak hour o Westbound Franconia Road (left turns) and eastbound Franconia Road (combined through and right
movements) during the PM peak hour Frontier Drive Extension and Metro Station (Intersection #1)
o Northbound Frontier Drive Extension (through movements) during the PM peak hour Frontier Drive Extension and Metropolitan Center Drive Extension (Intersection #1)
o Eastbound Metropolitan Center Drive (left turns and combined left/right turns) during the PM peak hour
Based on the analysis, the Build Condition queue lengths for the unsignalized intersection approaches would all have acceptable No-build Condition queue lengths.
5.8.6.3 Complete Intersection Queuing Analysis
This section summarizes the differences in queuing impacts between the No-build Condition and the Build Condition by quantifying the change in intersection queuing failures. Following the summary, this section also includes the complete results of the queuing analysis.
Based on the Synchro™ and SimTraffic™ analysis, 17 signalized intersections would experience queuing lengths that would exceed the available storage capacity. The remaining intersections in the study area would provide sufficient storage for the anticipated demand. Compared to the No-build Condition, the Build Condition would have three more intersections with failing queues during the AM peak hour and would have eight more intersections with failing queues during the PM peak hour. In the AM peak hour in the No-build Condition, there would be 10 intersections with a failing queue approach compared with 13 in the Build Condition, an increase of 3. In the PM peak hour in the No-build Condition, there would be 7 intersections with a failing queue approach compared with 15 in the Build Condition, an increase of 8.
Table 5-26 provides a summary of the number of intersections that meet the following criteria for approach lane groups in a queue that would change between the No-build and the Build Conditions:
FBI Headquarters Consolidation U.S. General Services Administration 5-59 Transportation Impact Assessment
Springfield
Table 5-26: Queuing Summary Comparing No-build Condition to Build Condition
Type of Change Between Conditions
AM PM
New Failing Movement 3 8
Additional Failing Movement 4 2
No Change 18 15
Fewer Failing Movements 0 0
No Failing Movements 0 0
Total Signalized and Unsignalized Intersections
25 25
The results of the No-build Condition compared to the Build Condition queuing analysis for both signalized and unsignalized intersections are presented in table 5-27. Note that the percentile values are expressed in feet, and a car occupies about 25 linear feet of roadway, including the space between cars.
FBI Headquarters Consolidation U.S. General Services Administration 5-60 Transportation Impact Assessment
Springfield
(This page intentionally left blank.)
FBI Headquarters Consolidation U.S. General Services Administration 5-61 Transportation Impact Assessment
Springfield
Table 5-27: Comparison of No-build and Build Condition Queuing Analysis
50th Percentile
(feet)
95th Percentile
(feet)
50th Percentile
(feet)
95th Percentile
(feet)
50th Percentile
(feet)
95th Percentile
(feet)
50th Percentile
(feet)
95th Percentile
(feet)
1 Loisdale Road/Commerce Street & Franconia Road (Westbound) (Signalized)
Red cells denote approaches and lane groups whose queuing length exceeds capacity.a Intersection would be removed for the Build Condition.b Intersection not analyzed during the AM peak hour.c Intersection would operate as a TWSC intersection under the No-build Condition and signalized under the Build Condition.
# Intersection & ApproachLane
Group
Turning Bay/Link Length (feet)
m Volume for 95th percentile queue is metered by upstream signal. Due to upstream metering, the 95th percentile queue may be less than the 50th percentile queue.
Notes:
No-build Condition Build Condition
AM Peak PM Peak AM Peak PM Peak
FBI Headquarters Consolidation U.S. General Services Administration 5-69 Transportation Impact Assessment
Springfield
5.8.7 Overall Traffic Impact Assessment
Overall, the AM peak hour would experience corridor-based delays along Frontier Drive in the southbound direction beginning at Franconia-Springfield Parkway Westbound and extending to Franconia Road. A similar condition would occur during the PM peak hour along Frontier Drive beginning at Franconia Road and extending to Franconia-Springfield Parkway Westbound. A second corridor-based delay would occur along Loisdale Road beginning at Franconia Road and extending back to Spring Mall Drive. Together these conditions would result in direct, long-term, major adverse impacts to study area corridors. In addition there would be isolated intersection impacts during the AM peak hour at the Franconia-Springfield Parkway/Manchester Boulevard and Beulah Street intersection and during the PM peak hour at the Loisdale Road and Frontier Drive Extension intersection. Together these would result in direct, long-term, adverse impacts due to the isolated nature of the impacts. There would be no failing Interstate facilities; therefore, there would be no measurable direct, long-term impacts to the Interstate system (see Section 6.6.7 for further information).
Because the intersection of Franconia-Springfield Parkway/Manchester Boulevard and Beulah Street is forecasted to be failing during the No-build Condition, adding construction-related trips along this route caused by trucks, employees, and equipment would have isolated impacts. There would also be additional short-term truck traffic impacts as a result of the demolition of the existing buildings on the GSA-owned parcel requiring dump trucks to haul the debris away on a continual basis until the parcel is clear of existing building materials. These conditions would result in direct, short-term, adverse construction impacts.
5.8.8 Interstate Analysis
Although freeway analysis was not performed for the Build Condition, freeway ramp volumes are included in figure 5-10 to allow a comparison to the Existing Condition, No-build Condition, and Build with Mitigation Condition freeway ramp volumes presented in Sections 3.7, 4.7, and 6.6, respectively. Full analysis of the freeway volumes is included in the Build with Mitigation Condition in Section 6.6.
FBI Headquarters Consolidation U.S. General Services Administration 5-70 Transportation Impact Assessment
Springfield
Figure 5-10: Build Condition Interstate Volumes
FBI Headquarters Consolidation U.S. General Services Administration 5-71 Transportation Impact Assessment
Springfield
5.9 Transportation Demand Management
TDM “is a set of strategies, programs, services, and physical elements that influence travel behavior by mode, frequency, time, route, or trip length in order to help achieve highly efficient and sustainable use of transportation facilities” (DDOT 2010, p.5). TDM measures for the Springfield Build with Mitigation Condition would be developed as part of a Transportation Management Plan accompanying the Final EIS if the Springfield site is chosen as the preferred consolidation location for the FBI HQ. The TDM measures would encourage the reduction of SOV trips by “focusing the demand for transportation services on alternative modes and providing the public with the incentives as well as information to use these alternatives.”
The introduction of TDM measures would serve to ensure the transportation mode splits planned in this study were achieved as well as serve to mitigate travel mode, frequency, time, route, and/or trip length associated with future trips of the consolidated FBI HQ.
FBI Headquarters Consolidation U.S. General Services Administration 5-72 Transportation Impact Assessment
Springfield
(This page intentionally left blank.)
FBI Headquarters Consolidation U.S. General Services Administration 6-1 Transportation Impact Assessment
Springfield
Mitigation Measures To reduce impacts on the transportation system caused as a result of the proposed action—consolidation of the FBI headquarters at the Springfield site, mitigation measures are recommended in this section for each mode of transportation analyzed. Also included is a sample of Transportation Demand Management measures to encourage non-SOV travel. Overall, the Springfield site requires moderate mitigation to reduce direct impacts of the proposed action.
6.1 Pedestrians Network
The Franconia-Springfield Metro Station is situated approximately one half-mile northeast from the conceptual location of the headquarters building. Providing the best pedestrian connections between the building and the station would be important to encourage transit use, reduce traffic congestion, improve air quality, and provide an alternative to using a shuttle on a daily basis, especially on days with pedestrian-friendly weather.
It is assumed that the Metropolitan Center Drive extension connecting to the Frontier Drive Extension, as well as the Frontier Drive Extension itself, would have a complete streets design with sidewalks on both sides, clearly marked crosswalks, and possibly one or two well-placed mid-block pedestrian crossings using a special traffic signal called a High Intensity Activated Crosswalk or HAWK signal. HAWK signals temporarily stop vehicular traffic and provide safe passage for a pedestrian through the use of a signal with blinking yellow and red lights. Figure 6-1 shows an example of a HAWK signal in Alexandria, Virginia.
FBI Headquarters Consolidation U.S. General Services Administration 6-2 Transportation Impact Assessment
Springfield
Figure 6-1: HAWK Signal in Alexandria, Virginia
Source: City of Alexandria (2015)
As a result of the increased pedestrian volume between the Metrorail and Springfield site, it is recommended as part of the Build with Mitigation Condition to develop a direct pedestrian connection between the Site East Access and Franconia-Springfield Metro Station. This may include using the planned complete street network along Metropolitan Center Drive Extension and Frontier Drive Extension or cutting the angle to form a direct path from Metropolitan Center Drive to the station and crossing Frontier Drive Extension between the Metro Station Access Road and Metropolitan Center Drive. Figure 6-2 illustrates a few options for connecting the Springfield site to the metro station. Given the future development of Frontier Drive Extension, the change in topography in this location, and the future Metropolitan Center Drive Extension, it is recommended that a study be completed to find the best route for all users of the transportation network.
FBI Headquarters Consolidation U.S. General Services Administration 6-3 Transportation Impact Assessment
Springfield
Figure 6-2: Pedestrian Connection Options between the Springfield Site and Franconia-Springfield Metro Station
When compared to the Build Condition, the Build with Mitigation Condition would have no difference in the long-term pedestrian network impacts because the recommended mitigation measures would improve the proposed pedestrian network corridor by adding a new link between the Springfield site and Franconia-Springfield Metro
FBI Headquarters Consolidation U.S. General Services Administration 6-4 Transportation Impact Assessment
Springfield
Station. It is assumed the proposed No-build, Build, and Build with Mitigation Condition pedestrian facilities between the Springfield site and the Metrorail station would be built to accommodate planned development and therefore the increase in pedestrians from the project would not adversely impact the pedestrian network. Therefore, the Build with Mitigation Condition would continue to result in direct, long-term, beneficial impacts that would accrue to not only the FBI employees, but employees and visitors of the Springfield Metro Center II project and the Northern Virginia Community College campus. The Build with Mitigation Condition would continue to include isolated intersection improvements or short-term sidewalk closures causing direct, short-term, adverse construction impacts.
6.2 Bicycles
In order to maximize the number of patrons accessing the site via bicycle, the site should be connected to the existing and planned bicycle network. Although the “segment north of and parallel to Metropolitan Center Drive” is shown as an existing off-road trail in the Fairfax County Bicycle Master Plan, this pathway appears to be overgrown based on Google aerial imagery from 2015 (Fairfax County 2014a; Google maps, https://maps.google.com). Therefore, one recommendation is to rehabilitate the mixed-use path and create a short bicycle connection along Joe Alexander Road between the Springfield site and the overgrown trail, as summarized in table 6-1 and pictured in figure 6-3. These bicycle improvements would mitigate the increase in bicyclists expected with the proposed action at Springfield and provide multi-modal connectivity north of the site including a direct connection to the Franconia-Springfield Parkway Trail. The path alignment is on an old railroad right of way that GSA owns; therefore, coordination between Fairfax County and GSA would be needed as well as the introduction of a public easement if one does not already exist. As noted earlier, it is anticipated that the bicycle lanes along the Frontier Drive Extension would be built as part of the No-build Condition and are therefore not included in the mitigation.
Table 6-1: Recommended Bicycle Mitigation
Roadway From/To Type
Segment north of and parallel to Metropolitan Center Drive
Franconia-Springfield Parkway Trail to Frontier Drive Extension, with connection to Springfield
site along Joe Alexander Road Multi-Use Path
Source: Fairfax County (2014a); Google Maps aerial imagery (https://maps.google.com, accessed June 23, 2015)
FBI Headquarters Consolidation U.S. General Services Administration 6-5 Transportation Impact Assessment
Springfield
Figure 6-3: Recommended Bicycle Mitigation
When compared to the Build Condition, there would be improvements to the bicycle network under the Build with Mitigation Condition resulting in a change from no measureable direct, long-term impacts to direct, long-term, beneficial bicycle network impacts because the recommended mitigation measures would expand the area’s bicycle network. Depending on the timing and sequencing of the transportation mitigation improvements with
FBI Headquarters Consolidation U.S. General Services Administration 6-6 Transportation Impact Assessment
Springfield
surrounding infrastructure projects, there would continue to be direct, short-term, adverse construction impacts in the Build with Mitigation Condition, particularly on Frontier Drive Extension at the intersection with Metropolitan Center Drive where a roundabout would be introduced, interrupting the No-build Condition bicycle lanes.
6.3 Public Transit
6.3.1 Shuttle to Metrorail
To encourage a higher percentage of employees to use transit to the Springfield site, a shuttle bus service is recommended between Franconia-Springfield Metro Station and the Springfield site as part of the Build with Mitigation Condition to accommodate Springfield site patrons who use transit. The shuttle route would likely use the Franconia-Springfield Metro Station Access Road, the Frontier Drive Extension, Metropolitan Center Drive Extension, and Franconia-Springfield Parkway service roads and ramps north of the parkway as illustrated in figure 6-4.
FBI Headquarters Consolidation U.S. General Services Administration 6-7 Transportation Impact Assessment
Springfield
Figure 6-4: Springfield – Franconia-Springfield Metro Station Anticipated Shuttle Route
6.3.1.1 Ridership and Operating Characteristics
Approximately 4,223 patrons (37.4 percent) are expected to use Metrorail to access the site on a daily basis based on the Springfield Site Transportation Agreement (Appendix E1), with 1,149 arriving during the AM peak
FBI Headquarters Consolidation U.S. General Services Administration 6-8 Transportation Impact Assessment
Springfield
hour and 1,084 leaving during the PM peak hour. Using Peak Hour Factors (PHF) of 25 percent during the AM peak hour and 29 percent during the PM peak hour, approximately 290 patrons would arrive at Franconia-Springfield Metro Station destined for the Springfield site during the AM peak 15-minute period and approximately 315 patrons would leave the Springfield site destined for Franconia-Springfield Metro Station during the PM peak 15-minute period. Given that the Springfield site is 0.5-mile from Franconia-Springfield Metro Station, certain patrons to the site would likely opt to walk instead of use a shuttle bus. To account for this, potential peak shuttle bus ridership was reduced by 10 percent. Table 6-2 summarizes projected Metrorail ridership to and from the site and potential shuttle bus ridership by time period.
Table 6-2: Springfield Site Patrons Using Shuttle Buses To/From Site
Time Period Exits (to site) Entries (from site) Exits Using
Shuttle (to site) Entries Using
Shuttle (from site)
AM Peak Hour 1,149 76 1,034 69
PM Peak Hour 49 1,084 44 976
AM Peak 15-Minute 290 19 261 17
PM Peak 15-Minute 14 315 13 284
Total Weekday 4,223 4,223 3,800 3,800
Sources: Springfield Site Transportation Agreement (Appendix E1); WMATA (2014b)
During the AM peak 15-minute period, approximately 261 patrons would arrive at Franconia-Springfield Metro Station and need to board shuttle buses. With a capacity of 47 passengers on a typical 40-foot bus (WMATA, 2013c), this would necessitate an AM peak period shuttle bus headway of 2.7 minutes to ensure no overcrowding. During the PM peak 15-minute period, approximately 284 patrons would need to travel from the site to Franconia-Springfield Metro Station on a shuttle bus. This would necessitate a shuttle bus headway of 2.5 minutes to ensure no overcrowding.
Each shuttle bus would travel 1.55 miles per roundtrip between Franconia-Springfield Metro Station and the site, resulting in a runtime of approximately 6.6 minutes, and a cycle time of approximately 10.6 minutes, including two minutes for loading and two minutes for offloading. To maintain a headway of 2.5 minutes with a cycle time of 10.6 minutes, four 40-foot buses would be necessary (cycle time divided by the desired headway). Appendix E9 has further details on the shuttle bus service plan.
6.3.1.2 Operating and Capital Costs
Final operating and capital costs for the proposed shuttle bus service are dependent on the final contract negotiated between the GSA and the contracted agency or entity (private or public). However, using an operating cost of $122 per hour (WMATA’s 2009 system operating cost inflated to 2022 levels per the Bureau of Labor Statistics (BLS) Consumer Price Index) with 250 days of service per year, the annual operating cost of the shuttle bus would be approximately $782,427 (WMATA 2009; BLS 2015). Additionally, four 40-foot buses would cost approximately $2.24 million in 2022 dollars (APTA 2013; BLS 2015). Table 6-3 summarizes the operating and capital costs of the Springfield shuttle and how these values were determined.
FBI Headquarters Consolidation U.S. General Services Administration 6-9 Transportation Impact Assessment
Springfield
Table 6-3: Springfield Site Shuttle Bus Operating and Capital Costs
# Assumption Value Note/Source/Formula
1 Peak Headway 2.5 minutes Using PM peak period
2 Cycle Time 10.6 minutes 6.6 minute runtime, 4 minute load/unload time
10 Cost per Hour $122 WMATA, 2009; BLS, 2015 (rounded)
11 Annual Operating Cost $782,427 = #9 X #10 (rounded)
12 Capital Cost Per Vehicle (40') $560,973 APTA, 2013; BLS, 2015
13 Vehicles Needed 4 = #2 / #1 (rounded)
14 Vehicle Purchase Cost $2,243,893 = #12 X #13
Note: Calculations may not appear correct due to rounding. Source: WMATA (2009); APTA (2013); BLS (2015)
6.3.1.3 Bus Bay Needs
Currently, the Franconia-Springfield Metro Station bus loop has a total of eight bus bays, all of which are occupied by WMATA, Fairfax Connector, or PRTC routes (WMATA 2015b). Additionally, three new bus bays are planned for construction in 2016, bringing the total number of bus bays at the station to 11. WMATA standards call for a maximum of six buses per hour per bay (WMATA 2008b). The maximum acceptable capacity (based on a two minute loading/unloading time and a three minute layover time), however, is 12 buses per hour (WMATA 2013b). Currently, the station has 70 buses per hour, which is higher than WMATA’s standard capacity of 66 buses per hour with 11 bays, but less than the maximum acceptable capacity of 132 buses per hour with 11 bays. The Springfield site shuttle would require buses every 2.5 minutes, or 24 buses per hour, and therefore require the use of a minimum of two bays. Overall, the 2022 Springfield Build with Mitigation Condition would have a total of 94 buses per hour, less than the maximum acceptable capacity at the station but nearing capacity based on WMATA standards. No additional bus bays would have to be constructed to accommodate the shuttle buses given a maximum acceptable capacity of 12 buses per hour per bay provided local and regional bus service does not substantively increase requiring additional bus bays, as assumed in this analysis. Table 6-4 summarizes the Franconia-Springfield Metro Station bus loop capacity analysis for the Springfield Build with Mitigation Condition with employee shuttles.
FBI Headquarters Consolidation U.S. General Services Administration 6-10 Transportation Impact Assessment
Springfield
Table 6-4: Franconia-Springfield Metro Station Bus Loop Capacity Analysis
Year/Condition Buses Per Hour Bus Bays Standard Capacity
The following recommendations in table 6-5 are made to mitigate the proposed transit impacts of the Springfield Build Condition:
Table 6-5: Recommended Transit Mitigation
Impact Mitigation
To maximize the number of site patrons utilizing Metrorail, a shuttle bus would be implemented between the Springfield site and Franconia-Springfield Metro Station due to the over 0.5-mile walk between the station and the site. The shuttle bus service would contribute additional peak hour trips to the local roadway network and would require the use of two bus bays at the station, which could be accommodated once WMATA constructs three new planned bus bays at the station.
Implement shuttle bus service between Franconia-Springfield Metro Station and
the Springfield site.
The shuttle bus volumes were added to the mitigated roadway system to determine if the additional volume would impact the recommended roadway mitigation measures. A 2.5 minute shuttle headway or 24 buses per peak hour would equate to 36 passenger vehicle trips, assuming that each bus was the equivalent length of 1.5 passenger vehicles. This passenger car equivalent value was added to both the AM and PM peak hour mitigated roadway network to determine the operations and queuing. Based on the Synchro™ and SimTraffic™ results, no additional mitigation measures would be necessary to accommodate the 36 additional trips added to the peak hour networks. Appendix E10 includes the traffic analysis results for those intersections impacted by the additional anticipated shuttle bus route trips. It should be noted that the shuttle route is based on the conceptual Springfield site plan, the latest VDOT plan to extend Frontier Drive, and the revised Franconia-Springfield Metro Station circulation network. A more definitive shuttle bus route would be determined through the TMP.
When compared to the Build Condition, there would be no difference in long-term public transit capacity impacts under the Build with Mitigation Condition because transit service would remain under capacity. Therefore, there would continue to be no measurable direct, long-term impacts to public transit capacity. The recommended traffic mitigations along Loisdale Road and the Frontier Drive Extension, however, would reduce traffic delays for all vehicles to conditions better than the No-build Condition. Because buses along this route would also experience reduced delays including Fairfax Connector Route 334, there would be overall beneficial impacts to bus service compared to the baseline No-build Condition. The implementation of the shuttle between the Franconia-Springfield Metro Station and the Springfield site would cause direct beneficial impacts for the FBI employees. Based on limiting the shuttle service to the use of FBI employees, there would be no impact to the overall public
FBI Headquarters Consolidation U.S. General Services Administration 6-11 Transportation Impact Assessment
Springfield
transit system. The actual shuttle service could operate along a different route and/or could be integrated into an existing or new route provided by a public or private provider.
During construction, when compared to the Build Condition, the level of impacts would deteriorate from direct, short-term, adverse to direct, short-term, major adverse construction impacts caused by construction vehicles blocking the one or more lanes near the project site and intermittent lane closures at a number of isolated intersections affecting all buses servicing the study area.
6.4 Parking
As mentioned in the Build Condition section, parking impacts would largely be addressed through development and implementation of a Transportation Management Plan (TMP), which would include preferred strategies for discouraging employees from parking on local streets. Because the TMP would be implemented as part of the Build Condition, there would be minimal changes in parking impacts between the Build and Build with Mitigation Conditions. The introduction of a roundabout as mitigation at the intersection of Frontier Drive Extension and Metropolitan Center Drive would, however, remove several on-street parking spaces (see proposed mitigation locations in Section 7.2.11.8),
Due to the small reduction in public on-street parking spaces, when compared to the Build Condition, there would be a change in long-term parking impacts from no measurable direct, long-term impacts to direct, long-term, adverse impacts to parking. Compared to the Build Condition, there would be a change in short-term construction parking impacts from no measurable direct, short-term impacts to direct, short-term, adverse impacts under the Build with Mitigation Condition as a result of construction of the roundabout on Frontier Drive Extension that would impact on-street parking.
6.5 Truck Access
No mitigation is recommended for truck access as part of the Build with Mitigation Condition. Note that the Build Condition includes proper signing and communication of truck access restrictions to alleviate impacts to truck access.
When compared to the Build Condition, there would be no difference in the long-term or short-term truck access impacts under the Build with Mitigation Condition, because the recommended mitigation measures would not change the truck access conditions. Under the Build with Mitigation Condition, there would be no measurable direct, long-term or short-term impacts to truck access during operation of the facility or during construction, respectively.
6.6 Traffic Analysis
6.6.1 Development of Mitigated Network
Based on the Build Condition traffic operations and queueing analysis, a number of intersections would fail (defined in the existing condition section) and require mitigation. Rather than mitigate the failing intersections based on the Build Condition DTA traffic assignment, a second DTA was run to reflect the change in travel patterns due to the following proposed major mitigation strategies:
Adding a new 430-foot right-turn lane at the Franconia-Springfield Parkway off-ramp to Frontier Drive Upgrading the intersection of Loisdale Road and Frontier Drive Extension to include a second left-turn
lane for the southbound approach and a second lane departing the intersection south on Loisdale Road to allow a double left from Frontier Drive Extension
FBI Headquarters Consolidation U.S. General Services Administration 6-12 Transportation Impact Assessment
Springfield
Updating the traffic signal timing along Loisdale Road between Franconia Road and Frontier Drive Extension based on all forecasted FBI vehicle trips traveling between Franconia Road and the Springfield site using Loisdale Road
Updating the traffic signal timings along Frontier Drive between Franconia Road and Franconia-Springfield Parkway based on all forecasted FBI vehicle trips traveling between Franconia Road and the Springfield site using Frontier Drive
Synchro™ was used to preliminarily design the lane geometry and traffic signal timings for the Loisdale Road and Frontier Drive intersections between Franconia Road and the Springfield site based on the forecasted FBI vehicle volume through these corridors. The TransModeler™ modeled network was then updated with the Synchro™ lane geometry and traffic signal timings to create a modeled network that offers the FBI vehicle trips the best travel timed among several options to travel between the modeled network edge and Springfield site. The TransModeler ™ DTA was run for 30 simulation runs. At the conclusion of the simulation runs, the software recorded the version with the best vehicle travel times. Since there were a number of possible alternative routes available, the DTA result provided alternative routing to or from all destinations except Franconia-Springfield Parkway and Fairfax County Parkway. Table 6-6 contains the DTA vehicle assignment. Figure 6-5 shows the Build with Mitigation Condition trip generation representing the removal of existing GSA trips and addition of consolidated HQ FBI trips. Figure 6-6 contains the Build with Mitigation Condition turning movement volumes.
Table 6-6: DTA Vehicle Assignments
Route Origin Primary Route to Site AM Peak Hour PM Peak Hour
Inbound Outbound Inbound Outbound
I-95/I-495 North Loisdale Road 47% 100% 43% 42%
Frontier Drive 53% 0% 57% 58%
I-95 South
Loisdale Road 53% 0% 100% 0%
Spring Mall Drive/Frontier Drive 47% 0% 0% 0%
Loisdale Road/FCP 0% 100% 0% 100%
I-495 North Loisdale Road 47% 100% 43% 28%
Frontier Drive 53% 0% 57% 72%
I-395 North Loisdale Road 47% 100% 43% 40%
Frontier Drive 53% 0% 57% 60%
Backlick Road Loisdale Road 9% 100% 100% 23%
Frontier Drive 91% 0% 0% 77%
Old Keene Mill Road
Loisdale Road 60% 100% 100% 45%
Frontier Drive 40% 0% 0% 55%
Franconia Road Loisdale Road 0% 0% 0% 21%
Frontier Drive 100% 100% 100% 79%
FSP West Frontier Drive 100% 100% 100% 100%
FSP East Frontier Drive 100% 100% 100% 100%
FCP North Loisdale Road 100% 100% 100% 100%
FCP South Loisdale Road 100% 100% 100% 100%
Notes: FSP = Franconia Springfield Parkway FCP = Fairfax County Parkway
FBI Headquarters Consolidation U.S. General Services Administration 6-13 Transportation Impact Assessment
Springfield
Figure 6-5: Build with Mitigation Condition Trip Generation
FBI Headquarters Consolidation U.S. General Services Administration 6-14 Transportation Impact Assessment
Springfield
Figure 6-5: Build with Mitigation Condition Trip Generation (continued)
FBI Headquarters Consolidation U.S. General Services Administration 6-15 Transportation Impact Assessment
Springfield
Figure 6-6: Build with Mitigation Condition Turning Movement Volumes
FBI Headquarters Consolidation U.S. General Services Administration 6-16 Transportation Impact Assessment
Springfield
Figure 6-6: Build with Mitigation Condition Turning Movement Volumes (continued)
FBI Headquarters Consolidation U.S. General Services Administration 6-17 Transportation Impact Assessment
Springfield
6.6.2 Recommend Mitigation Measures
Once the DTA was completed, the resulting traffic volumes were entered into Synchro™ to determine the study area intersection operations and queuing. Each intersection that had LOS degradation from a passing LOS (A-D) to a failing LOS (E or F) by lane group (right turns, through movements, or left turns) when compared to the No-build Condition was mitigated by one of the following methods:
Optimizing the existing traffic signal (change the amount of seconds of green to each approach) Coordinating a corridor of traffic signals Revising the existing lane geometry (number of right versus through versus left-turning lanes) Adding new turning lanes Adding through lanes
A list of mitigation measures was developed through an iterative process of testing the different improvement strategies, starting with optimizing the traffic signals and progressing to adding lanes if warranted. The recommended roadway improvements include external roadway mitigation measures that supports the revised Springfield conceptual site plan. If implemented, the external roadway mitigations would improve the traffic operations at all study area intersections to a passing LOS (HCM-based) or if failing would be equal to or better than the No-build Condition operations. The recommended mitigations would also result in no vehicle queues beyond the available storage capacity, or if beyond the storage capacity, would be no greater than 150 feet longer than the queues measured for the No-build Condition. An acceptable queue length increase is not cited in the VDOT Traffic Impact Analysis Regulations (VDOT 2012b); therefore, the 150 feet is referenced from the District Department of Transportation Comprehensive Transportation Review Requirements (DDOT 2012) guidance and provides a reasonable increase (approximately six vehicles or less).
Table 6-7 contains the list of mitigation measures. Figure 6-7 shows the locations of the mitigation measures. Figure 6-8 shows the lane geometry with the mitigation in place and figure 6-9 shows the AM peak hour inbound and PM peak hour outbound FBI vehicle trip paths.
FBI Headquarters Consolidation U.S. General Services Administration 6-18 Transportation Impact Assessment
Springfield
Table 6-7: Recommended Mitigation Measures
Map ID
Mitigation
Strip Land Taking
(Approximate Linear Feet)
A Franconia Road (VA 644) Westbound and Commerce Street
Optimize the traffic signal and coordinate timings with nearby key intersections for AM and PM peak periods
None
B Franconia Road (VA 644) Eastbound and Loisdale Drive
For the Loisdale Road northbound approach, revise the planned roadway improvement
design to lengthen the left‐turn lane by 225 feet resulting in a 775‐foot turn bay and revise
the lane geometry to allow the Loisdale Road northbound left lane to directly feed into
the middle left‐turn lane at the intersection, the Loisdale Road northbound middle lane
directly feed into the right most left‐turn lane at the intersection, and Loisdale Road
northbound right lane directly feed into the left most through lane at the intersection.
For the Franconia Road eastbound approach, revise the planned roadway improvement
design to extend the right‐turn lane by 50 feet resulting in a 350‐foot right‐turn lane.
Optimize the traffic signal and coordinate timings with nearby key intersections for AM
and PM peak periods.
None
C Loisdale Road and Loisdale Court
Optimize the traffic signal for the AM peak period and coordinate timings with nearby key
intersections for AM and PM peak periods. None
D Loisdale Road and I-95 Northbound off-ramp/Spring Mall Drive
For the Spring Mall Drive westbound, revise the planned roadway improvement design by
changing the channelized right‐turn lane to provide a free merge onto Loisdale Road
northbound by reducing the number of departing lanes from three to two on Loisdale
Road northbound, thus allowing the channelized right‐turn to feed into the planned new
third lane.
Optimize the traffic signal and coordinate timings with nearby key intersections for AM
and PM peak periods.
None
E Loisdale Road and Metropolitan Center Drive
Optimize the traffic signal for AM and PM peak periods and coordinate timings with nearby
key intersections for the PM peak period. None
FBI Headquarters Consolidation U.S. General Services Administration 6-19 Transportation Impact Assessment
P Frontier Drive Extension and Metro Station Access Drive
For the northbound Frontier Drive Extension, revise the planned roadway improvement
design to extend the right‐turn lane by 60 feet resulting in a 200‐foot right‐turn lane.
Optimize the traffic signal for the PM peak period. None
Q Frontier Drive Extension and Metropolitan Center Drive Extension
Revise the planned roadway improvement design to create a two‐lane roundabout with
two lane exits for Frontier Drive Extension northbound and southbound and a one lane
exit for Metropolitan Center Drive Extension. Create two‐lane entries for all three
approaches.
For the Frontier Drive Extension southbound approach, create a 175‐foot right‐turn lane
that feeds into a 275‐foot right‐turn bypass lane and rejoins Metropolitan Center Drive
Extension after the intersection serving the Springfield Metro Center Phase II development
(approximately 150 feet west of the roundabout).
None
R Frontier Drive Extension and Site South Access
For the Frontier Drive Extension eastbound approach, revise the planned roadway
improvement design to create a 275‐foot left turn lane.
For the Site South Access southbound approach, create a channelized right‐turn lane that
yields onto westbound Frontier Drive Extension and a one‐lane approach serving left‐
turning vehicles.
The northbound Site South Access departing lanes would need to accommodate the ECF
approximately 165 feet north of the intersection requiring five lanes.
None
S Franconia Road (VA 644) and Beulah Street
Optimize the traffic signal for the PM peak period. None
T Franconia-Springfield Parkway (VA 289) and Beulah Street
For the Franconia‐Springfield Parkway eastbound approach, change the lane geometry to
provide one left‐turn lane, three through lanes, and one right‐turn lane by assigning the
existing right‐turn lane as a through lane and creating a new 200‐foot right‐turn lane.
Extend the new through lane into the existing right‐turn lane past the intersection and
create a new 1,150‐foot fourth lane past the intersection to receive the channelized right
from the Beulah Street southbound approach. Extend the fourth lane to Walking Lane.
None
FBI Headquarters Consolidation U.S. General Services Administration 6-22 Transportation Impact Assessment
Springfield
Figure 6-7: Build with Mitigation Condition Improvement Locations
FBI Headquarters Consolidation U.S. General Services Administration 6-23 Transportation Impact Assessment
Springfield
Figure 6-8: Build with Mitigation Condition Lane Geometry
FBI Headquarters Consolidation U.S. General Services Administration 6-24 Transportation Impact Assessment
Springfield
Figure 6-8: Build with Mitigation Condition Lane Geometry (continued)
FBI Headquarters Consolidation U.S. General Services Administration 6-25 Transportation Impact Assessment
Springfield
Figure 6-9: AM Peak Hour Inbound and PM Peak Hour Outbound FBI Vehicle Trip Paths
FBI Headquarters Consolidation U.S. General Services Administration 6-26 Transportation Impact Assessment
Springfield
6.6.3 Land Use Impact Summary
This section references the Fairfax County internet-based GIS tool (Fairfax County 2015b) to provide an estimate of property impacts. Several of the proposed recommended mitigation measures might require strip takings of property at two intersections, Loisdale Road at Fairfax County Parkway and Loisdale Road and Frontier Drive Extension (Intersection #s 11 and 8, respectively). The Loisdale Road and Fairfax County Parkway mitigation measures would impact the westbound approach extension of the right-turn lane by 60-feet (assuming the planned roadway improvement would extend the right-turn lane to match the existing left-turn lane distance of 365-feet). The parcel impacted would be the parcel situated on the northeast corner of the intersection. The County is already planning to widen Loisdale Road as part of the planned roadway improvements; therefore, this impact would require the strip taking to be extended another 60 feet beyond what the County is already planning.
The Loisdale Road and the Frontier Drive Extension mitigation measures would have two different approaches, northbound and southbound, that would impact property. Similar to the first intersection, the County is already planning to upgrade this intersection; therefore, the actual strip taking requirement for the mitigation is unknown. To be conservative, the southbound approach would include a 400-foot strip taking to add a second left-turn lane to the intersection and the northbound approach would include a 400-foot strip taking to add a right-turn lane.
Five parcels would be impacted by these mitigation measures, three residential and two commercial-zoned privately-owned properties. Note that these potential impacts are based on conceptual roadway changes. During the design phase, the property impacts would be more defined to identify the total square acres impacted and design measures that could be employed to lessen the impact such as narrowing travel lanes or shifting roadway alignment.
6.6.4 Intersection Operations Analysis
Synchro™ was used to calculate the vehicle delay and LOS operation based on the HCM 2000 method for each study area intersection.
Based on the Synchro™ analysis, all but one signalized study area intersection would operate at acceptable overall conditions during the morning and afternoon peak hours. The following intersection in the study area would operate with overall unacceptable conditions:
● Franconia‐Springfield Parkway/Manchester Boulevard and Beulah Street (Intersection #21) would
operate at LOS E during the AM peak hour and LOS F during the PM peak hour.
Note that the Build with Mitigation Condition would result in a better operate than the No-build Condition. The LOS during the AM would improve from LOS F to LOS E and the average control delay would improve by 4.4 seconds per vehicle, greater than a 4 percent decrease. During the PM peak hour the overall LOS would not change, but the average control delay would improve by 4.4 seconds, greater than a 4 percent decrease.
Compared to No-build Condition, the same number of intersections would have overall failures in either the AM or PM peak hour.
Based on the Synchro™ analysis, there would be no signalized intersections that would have lane groups or overall approaches with LOS degradation from an acceptable condition (LOS A through LOS D) to an
FBI Headquarters Consolidation U.S. General Services Administration 6-27 Transportation Impact Assessment
Springfield
unacceptable condition (LOS E or LOS F) when compared to the No-build Condition during the morning or afternoon peak hours.
Based on the unsignalized intersection analysis, there would be one unsignalized intersection where the minor approach would operate at an unacceptable condition during the AM and PM peak hours. The intersection of Loisdale Road and the Northern Entrance Road to GSA Facility (Intersection #6) would have a failing minor street approach; however, this approach would operate as the proposed exit from the truck facility and would only affect trucks attempting to turn left when exiting from the Springfield site. It is assumed that the FBI would be scheduling truck arrivals and departures outside of the peak hour, thus not impacting this intersection. If a truck were to depart during the peak hour, the delay would only impact the exiting truck and not the Loisdale Road mainline.
6.6.4.3 Complete Intersection Operations Analysis
The average LOS for the various approaches to the intersections and the overall intersection LOS grades for the No-build Condition compared to the Build with Mitigation Condition are depicted in figures 6-10 and 6-11 for the AM and PM peak hours, respectfully. Table 6-8 shows the results of the LOS capacity analysis and the intersection projected delay under the Build with Mitigation Condition during the AM and PM peak hours.
FBI Headquarters Consolidation U.S. General Services Administration 6-28 Transportation Impact Assessment
Springfield
(This page intentionally left blank.)
FBI Headquarters Consolidation U.S. General Services Administration 6-29 Transportation Impact Assessment
Springfield
Figure 6-10: Build with Mitigation Condition Intersection LOS for AM Peak Hour
FBI Headquarters Consolidation U.S. General Services Administration 6-30 Transportation Impact Assessment
Springfield
Figure 6-10: Build with Mitigation Condition Intersection LOS for AM Peak Hour (continued)
FBI Headquarters Consolidation U.S. General Services Administration 6-31 Transportation Impact Assessment
Springfield
Figure 6-11: Build with Mitigation Condition Intersection LOS for PM Peak Hour
FBI Headquarters Consolidation U.S. General Services Administration 6-32 Transportation Impact Assessment
Springfield
Figure 6-11: Build with Mitigation Condition Intersection LOS for PM Peak Hour (continued)
FBI Headquarters Consolidation U.S. General Services Administration 6-33 Transportation Impact Assessment
Springfield
Table 6-8: No-build Compared to the Build with Mitigation Condition Intersection AM and PM Peak Hour Operations Analysis
Delay(sec/veh) LOS Check
Delay(sec/veh) LOS Check
Delay(sec/veh) LOS Check
Delay(sec/veh) LOS Check
1 Loisdale Road/Commerce Street & Franconia Road (Westbound) (Signalized)
WB (Franconia Rd) L 92.8 F 90.8 F 87.9 F 85.1 F
WB (Franconia Rd) T 29.8 C 32.3 C 29.0 C 48.5 D
WB (Franconia Rd) R 1.5 A 0.8 A 1.5 A 1.6 A
WB Overall (Franconia Rd) 20.8 C 25.4 C 20.6 C 32.9 C
NB (Commerce St) L 0.7 A 2.4 A 0.7 A 2.7 A
NB (Commerce St) T 1.5 A 1.9 A 1.5 A 1.8 A
NB Overall (Commerce St) 1.1 A 2.3 A 1.1 A 2.4 A
SB (Commerce St) T 70.6 E 73.8 E 69.9 E 78.2 E
SB (Commerce St) R 68.1 E 64.0 E 67.2 E 65.3 E
SB Overall (Commerce St) 69.5 E 71.1 E 68.8 E 74.6 EOverall 24.0 C Pass 31.1 C Pass 23.8 C Pass 34.5 C Pass
2 Loisdale Road/Commerce Street & Franconia Road (Eastbound) (Signalized)
EB (Franconia Rd) L 72.9 E 76.4 E 72.9 E 76.4 E
EB (Franconia Rd) T 38.0 D 52.0 D 41.6 D 51.6 D
EB (Franconia Rd) R 0.7 A 4.9 A 2.0 A 5.1 A
EB Overall (Franconia Rd) 23.1 C 21.7 C 21.4 C 21.8 C
NB (Loisdale Rd) T 70.5 E 72.1 E 71.1 E 74.3 E
NB (Loisdale Rd) R 63.4 E 55.4 E 63.4 E 54.5 D
NB Overall (Loisdale Rd) 69.0 E 69.5 E 69.5 E 71.4 E
SB (Loisdale Rd) L 2.7 A 0.1 A 2.4 A 0.2 A
SB (Loisdale Rd) T 2.7 A 0.2 A 2.4 A 0.3 A
SB Overall (Loisdale Rd) 2.7 A 0.2 A 2.4 A 0.3 A
Overall 35.7 D Pass 32.1 C Pass 32.6 C Pass 33.4 C Pass
PM Peak Hour# Intersection and Approach
Lane Group
No-build Condition Build with Mitigation Condition
AM Peak Hour PM Peak Hour AM Peak Hour
FBI Headquarters Consolidation U.S. General Services Administration 6-34 Transportation Impact Assessment
Springfield
Table 6-8: No-build Compared to the Build with Mitigation Condition Intersection AM and PM Peak Hour Operations Analysis (continued)
No-build Condition Build with Mitigation Condition
AM Peak Hour PM Peak Hour AM Peak Hour
Highway Capacity Manual unable to report accurate delay using default gap acceptance values
Red cells denote intersections operating at unacceptable conditions.
FBI Headquarters Consolidation U.S. General Services Administration 6-44 Transportation Impact Assessment
Springfield
(This page intentionally left blank.)
FBI Headquarters Consolidation U.S. General Services Administration 6-45 Transportation Impact Assessment
Springfield
6.6.5 Queuing Analysis
Synchro™ was used to calculate the 50th percentile queue lengths and SimTraffic™ was used to calculate the 95th percentile queue lengths. The SimTraffic simulations have a statistical accuracy of plus or minus 4.8 percent error for the AM peak hour and 4.9 percent error for the PM peak hour simulations. Based on the Synchro™ and SimTraffic™ analysis, there would be one signalized and two unsignalized intersection approaches would experience failing queue lengths in excess of 150 feet of the No-build Condition length. The lane group within the approach that would be operating under unacceptable conditions is noted in parenthesis. These intersections are as follows:
● Frontier Drive and Franconia‐Springfield Parkway Intersection (Intersections #17 and #18)
Note that these intersections would operate as one coordinated intersection and queues would occur between them and not affect any upstream or downstream intersections
o Southbound Frontier Drive (through movements) during the AM peak hour o Southbound Frontier Drive (left turns) during the PM peak hour
The recommended mitigation for this complex intersection would include specific timing adjustments affecting the operation of both intersections. Currently, Frontier Drive has eight separate travel lanes under the Franconia-Springfield Parkway overpass, four in the southbound direction and four in the northbound direction. The traffic signal is timed to allow access to the northbound and southbound travel lanes at separate times where vehicles using either direction are cleared before the reverse direction occurs. The recommended mitigation would change the traffic signal timings to allow the southbound lanes to store vehicles under the Franconia-Springfield Parkway overpass while they wait to turn left onto Franconia-Springfield Parkway eastbound or proceed south on Frontier Drive toward the Metro station. During the time the southbound vehicles are stored, the reverse moves traveling northbound would occur. This would improve the intersection vehicle throughput and use available pavement to the fullest extent. Under the 95th percentile queue length, a queue might occur that extends back through the north side of the Frontier Drive and Franconia-Springfield Parkway intersection (Intersection #17). Vehicle moves at the north side (Intersection #17) would not be impacted because the queue beyond that point would not impact the next upstream intersection (Spring Mall Drive).
● Loisdale Road and the Northern Entrance Road to GSA Facility (Intersection #6)
Note that this facility would operate as a truck-only access to the Springfield site and would only impact exiting trucks attempting to make a left turn
Frontier Drive Extension and Metropolitan Center Drive Extension intersection (Intersection #25)
Note that the driveway serving the Springfield Metro Center Phase II planned office development is currently designed too close to the proposed roundabout with the Frontier Drive Extension and would need to be moved further west. It is recommended to work with the planned development to move the driveway further west to allow more queue space leading into the proposed roundabout.
FBI Headquarters Consolidation U.S. General Services Administration 6-46 Transportation Impact Assessment
Springfield
6.6.5.1 On-ramp Lane Drop Queuing Analysis
Because Synchro™/SimTraffic™ are tools primarily designed to measure the operations and delay at signalized and unsignalized intersections, these tools are not meant to model the effect of merges caused by a lane drop on an on-ramp to a freeway facility. They tend to show worse conditions than would actually occur. There is a major on-ramp from Franconia Road westbound providing connection to several Interstates (I-95, I-395, and I-495). This ramp begins as a two-lane ramp, but quickly splits 300-feet downstream with vehicles destined to I-95 southbound using the right lane and all other destinations using the left-lane. Based on the Build with Mitigation Condition, it is forecasted that this two-lane ramp would carry 2,088 vehicles per hour with 1,695 of them (81 percent) requiring the use of the left lane. Assuming a 50/50 split between the lanes, this would result in 30 percent of the vehicles using the right lane needing to merge into the left lane.
Because Synchro™/SimTraffic™ is not the proper tool to measure this scenario, TransModeler™ was used to calculate the 95th percentile queue lengths at the Franconia Road and Commerce Street/Loisdale Road intersection to ensure the effect of the merge would not cause a queue on Franconia Road westbound or Loisdale Road northbound. Based on the TransModeler™ simulation result (plus or minus a two percent error), the 95th percentile queues would not extend back to the previous intersection. The Loisdale Road northbound approach to Franconia Road would result in a 95th percentile queue length of 585 feet (out of a total of 775 feet of queue space for the left-turn lanes). The Franconia Road westbound approach to Commerce Street would result in a 95th percentile queue length of 761 feet (out of a total of 1,200 total feet of queue space for the through lanes). Table 6-9 contains the 95th percentile queue summary for the two approaches.
Table 6-9: 95th Percentile Queue for Loisdale Road Northbound Approach to Franconia Road and Franconia Road Westbound Approach to Commerce Street
Lane Group 95th Percentile Queue Length
(Feet) Pass/Fail
Loisdale Road Northbound Approach to Franconia Road Eastbound
Lane One – Left-turn lane 186 Pass
Lane Two – Left-turn lane 585 Pass
Lane Three – Left-turn lane 549 Pass
Lane Five – Through lane 212 Pass
Lane Six – Through lane 290 Pass
Lane Seven – Right-turn lane 124 Pass
Franconia Road Westbound Approach to Commerce Street Southbound
Lane One – Left-turn lane 160 Pass
Lane Two – Through lane 422 Pass
Lane Three – Through lane 761 Pass
Lane Four – Through lane 413 Pass
Lane Five – Right-turn lane No Queue – Free flow Pass
6.6.5.2 Complete Intersection Queuing Analysis
The results of the No-build Condition compared to the Build with Mitigation Condition queuing analysis for both signalized and unsignalized intersections are presented in table 6-10. Note that the percentile values are expressed in feet and a car occupies about 25 linear feet of roadway, including the space between cars.
FBI Headquarters Consolidation U.S. General Services Administration 6-47 Transportation Impact Assessment
Springfield
Table 6-10: Comparison of No-build and Build with Mitigation Condition Queuing Analysis
50th Percentile
(feet)
95th Percentile
(feet)
50th Percentile
(feet)
95th Percentile
(feet)
50th Percentile
(feet)
95th Percentile
(feet)
50th Percentile
(feet)
95th Percentile
(feet)
1 Loisdale Road/Commerce Street & Franconia Road (Westbound) (Signalized)
Red cells denote approaches and lane groups whose queuing length exceeds capacity.a Intersection #7 would be removed for the Build with Mitigation Condition.b Intersection not analyzed during the AM peak hour.
# Intersection & ApproachLane
Group
Turning Bay/Link Length (feet)
m Volume for 95th percentile queue is metered by upstream signal. Due to upstream metering, the 95th percentile queue may be less than the 50th percentile queue.
c Intersection would operate as a TWSC intersection under the No-build Condition and a roundabout under the Build with Mitigation Condition.
No-build Condition Build with Mitigation Condition
AM Peak PM Peak AM Peak PM Peak
FBI Headquarters Consolidation U.S. General Services Administration 6-55 Transportation Impact Assessment
Springfield
6.6.6 Recommended Traffic Mitigation
Recommended traffic mitigation measures were developed to address the substantial traffic impacts caused by the addition of the Consolidated FBI HQ in Springfield. These included traffic signal optimization, road widening, lane geometry improvements at intersections, constructing new pedestrian bridges, and changing roadway designs to construct a roundabout instead of an unsignalized intersection. If implemented, the recommended traffic mitigation measures would maintain acceptable traffic flow conditions based on the Springfield Site Transportation Agreement. The following recommendations in table 6-11 are made to mitigate the proposed traffic impacts of the Springfield Build Condition:
FBI Headquarters Consolidation U.S. General Services Administration 6-56 Transportation Impact Assessment
Springfield
Table 6-11: Recommended Traffic Mitigation
Impact Mitigation
To improve traffic operations along the Loisdale Road and Frontier Drive corridors the traffic signals would be optimized and/or coordinated
Optimize the traffic signals at the following locations: o Franconia Road (VA 644) Westbound and Commerce Street
intersection o Loisdale Road and Loisdale Court intersection o Loisdale Road and Metropolitan Center Drive intersection o Franconia Road (VA 644) Westbound and Frontier Drive
intersection o Frontier Drive and North Mall Entrance intersection o Frontier Drive and Mall South Entrance intersection o Frontier Drive and Spring Mall Drive intersection o Frontier Drive and Franconia-Springfield Parkway (VA 289)
westbound on/off ramps intersection o Franconia Road (VA 644) and Beulah Street intersection
To improve traffic operations at isolated intersections change the intersection geometry including new turn lanes (optimize traffic signal if warranted)
Change the intersection geometry including new turn lanes at the following locations:
o Franconia Road (VA 644) Eastbound and Loisdale Drive intersection
o Loisdale Road and I-95 Northbound off-ramp/Spring Mall Drive intersection
o Loisdale Road and Frontier Drive Extension intersection o Loisdale Road and Newington Road intersection o Loisdale Road and Fairfax County Parkway (VA 286) intersection o Franconia Road (VA 644) Eastbound and Frontier Drive
intersection o Frontier Drive and Franconia-Springfield Parkway (VA 289)
eastbound on/off ramps intersection o Frontier Drive Extension and Metro Station Access Drive
intersection o Frontier Drive Extension and Site South Access intersection o Franconia-Springfield Parkway (VA 289) and Beulah Street
intersection
To improve traffic operations construct a roundabout
Construct a new roundabout at Frontier Drive Extension and Metropolitan Center Drive Extension intersection
To improve traffic operations construct a pedestrian bridge to remove the pedestrian crossing times form the traffic signal
Construct a new pedestrian bridge network and remove the pedestrian crossing times from the traffic signals at the following locations:
o Franconia Road (VA 644) Westbound and Frontier Drive intersection
o Franconia Road (VA 644) Eastbound and Frontier Drive intersection
The mitigation measures were developed to ensure the intersections would operate in a safe manner for all modes. This included assigning adequate pedestrian crossing times for any signalized intersection that required a change in the number of approach lanes and recommending non-motorized bridges to ensure bicycle and pedestrians can safely cross when an at grade crossing would not be safely accommodated. It is assumed that all
FBI Headquarters Consolidation U.S. General Services Administration 6-57 Transportation Impact Assessment
Springfield
planned roadway improvements and mitigation would follow the American Association of State Highway Transportation Officials, VDOT, and FCDOT requirements to ensure all vehicle, bicycle, and pedestrian movements are designed to the latest safety standards.
Overall, the study area would no longer experience corridor-level impacts along Frontier Drive or Loisdale Road resulting in changing the Build Condition impacts from direct, long-term, major adverse to no measurable direct, long-term impacts under the Build with Mitigation Condition. Isolated intersection improvements aimed at addressing the Build Condition impacts specifically along Loisdale Road, Frontier Drive, and the Frontier Drive Extension would be addressed under the Build with Mitigation Condition. This would result in changing the impacts from direct, long-term, adverse impacts to direct, long-term, beneficial impacts, since the operations would improve to a better operation than the No-build Condition. There would be no failing Interstate facilities under the Build Condition and Build with Mitigation Condition; therefore, there would be no measurable direct, long-term impacts to the Interstate system (see Section 6.6.7.3).
The construction impacts would change from direct, short-term, adverse impacts under the Build Condition during construction to direct, short-term, major adverse impacts under the Build with Mitigation Condition during construction. This change reflects the short-term impacts from adding roadway construction related trips caused by trucks, employees, and equipment as well as intermittent lane or road closures at locations where the roadway improvements would occur.
6.6.7 Freeway Analysis Summary
The Highway Capacity Software (HCS) Version 6.65 was used to determine the Interstate operations for these key on- and off-ramps. The HCS modules follow the HCM uninterrupted flow procedures called freeways. The Interstate system is a network of signed roadways that crisscross the country from coast to coast (east-west) and border to border (north-south) and operate as freeways or uninterrupted vehicle flow. Interrupted vehicle flow refers to the roadways with traffic signals, stop signs, and roundabouts.
Based on the proposed FBI trip distribution, 70 percent of forecasted FBI vehicle trips would use the Interstate system (I-95/I-495, I-395, or I-495) to access the proposed site. Reflecting the importance of the Interstate system serving the Springfield site, all three Interstates were evaluated to determine whether or not the added vehicle trips would cause any failing interstate facilities. Based on the agreed Springfield Site Transportation Agreement, the evaluated Interstate facilities focused on the peak direction only and at the primary off-ramps serving the inbound forecasted FBI vehicle trips during the AM peak hour and the on-ramps serving the outbound forecasted FBI vehicle trips during the PM peak hour.
6.6.7.1 Freeway Facilities Types Studied
Several freeway facility types were evaluated including diverge, merge, weave, and complex ramp designs including more than one facility type. In total, the analysis included the evaluation of one diverge (off-ramp), three merges (on-ramp), two weaves, and two complex ramp designs composed of diverge, ramp, and merge areas. Diverge facilities represent an off-ramp from the freeway. Merge facilities represent an on-ramp to the freeway. Weave facilities represent an on-ramp followed by an off-ramp that share the same lane and are spaced close enough to create a crisscross vehicle pattern caused by vehicles entering the freeway potentially blocking vehicles exiting the freeway or vice versa. The vehicle volumes combined with the distance between the on- and off-ramps help determine if a facility qualifies as a weave or two separate merge and diverge areas (HCM, Equation 12-4; TRB 2010). Figures 6-12 and 6-13 illustrate a typical diverge and merge facility, respectfully. Figure 6-14 illustrates a typical weave facility.
FBI Headquarters Consolidation U.S. General Services Administration 6-58 Transportation Impact Assessment
Springfield
Figure 6-12: Typical Diverge Facility
FBI Headquarters Consolidation U.S. General Services Administration 6-59 Transportation Impact Assessment
Springfield
Figure 6-13: Typical Merge Facility
FBI Headquarters Consolidation U.S. General Services Administration 6-60 Transportation Impact Assessment
Springfield
Figure 6-14: Typical Weave Facility
Freeway facilities are evaluated based on the density of vehicles. The higher the density, the slower the vehicles travel and the worse the operations. Based on the vehicle density, the HCM provides LOS equivalents to represent the driver’s perception of the facility operation. Table 6-12 contains the HCM freeway LOS.
FBI Headquarters Consolidation U.S. General Services Administration 6-61 Transportation Impact Assessment
Springfield
Table 6-12: HCM Weaving Segments, Merge, and Diverge Facilities Level of Service
LOS Density
(passenger cars/mile/lane)
Description
A Less than or equal to 10
Passing operation B >10-20
C >20-28
D >28-35
E >35 Unstable conditions
F Demand Exceeds Capacity
Above capacity and unstable conditions
Source: TRB (2010)
All Interstate facilities were evaluated based on a PHF of 0.92 (ratio of the 60-minute volume divided by 4 times the highest 15-minute volume), the lowest accepted by VDOT’s Traffic Impact Analysis Regulations (VDOT 2012b) to be consistent for all three sites and a conservative value for the analysis of future facilities. This PHF is also the same PHF used to evaluate all intersection facilities within the study area.
6.6.7.2 Freeway Facilities Evaluated
The following facilities were evaluated:
AM Peak Hour Inbound Flows Ramp Diverge: I-95 northbound to Loisdale Road/Spring Mall Drive Complex Section: I-95/I-495/I-395/I-495 to Franconia Road (VA 644) eastbound
PM Peak Hour Inbound Flows Weave Section: Fairfax County Parkway between I-95 northbound off-ramp and I-95 southbound on-
ramp/Backlick Road northbound Weave Section: I-95 southbound between Fairfax County Parkway on-ramp and Fairfax County
Parkway off-ramp Complex Section: Franconia Road westbound to I-95/I-495/I-395/I-495
o Ramp Merge: Franconia Road (VA 644) westbound ramp to I-95 NB/I-495 EB o Ramp Merge: Franconia Road (VA 644) westbound ramp to I-395 NB o Ramp Merge: Franconia Road (VA 644) westbound ramp to I-495 NB
I-95 Northbound to Loisdale Road/Spring Mall Drive This facility is a five-lane facility with four through lanes and one lane serving the off-ramp. There is a 370-foot deceleration lane serving the off-ramp.
I-95/I-495/I-395/I-495 to Franconia Road (VA 644) Eastbound This facility is composed of three parts: part one is a four-lane facility with two through lanes and two-lanes serving the off-ramp to Franconia Road westbound, part two is a one-lane ramp facility, and part three is a three-lane facility with two through lanes serving Franconia Road eastbound and one-lane serving the on-ramp from I-95/I-495/I-395/I-495.
FBI Headquarters Consolidation U.S. General Services Administration 6-62 Transportation Impact Assessment
Springfield
Fairfax County Parkway between I-95 Northbound off-ramp and I-95 Southbound on-ramp/Backlick Road Northbound This facility is a three-lane facility along the Fairfax County Parkway mainline with two through lanes and one lane serving the on- and off- ramps. There is a 340-foot distance between the on- and off- ramps and two maneuvering lanes (minimum number of lanes in use to either enter or exit Fairfax County Parkway).
I-95 Southbound between Fairfax County Parkway on-ramp and Fairfax County Parkway off-ramp This facility is a five-lane facility along the freeway mainline with four through lanes and one lane serving the on- and off-ramps. There is an 800-foot distance between the on- and off-ramps and two maneuvering lanes (the minimum number of lanes in use to either enter or exit the freeway).
Franconia Road Westbound to I-95/I-495/I-395/I-495 This facility is composed of three parts: part one is a three-lane facility with one through lane and two lanes serving the off-ramp to the Interstates, part two is a one-lane ramp facility, and part three is three merge facilities described below:
I-95 NB/I-495 EB merge is a four-lane facility with three through lanes serving the freeway mainline, one lane serving the on-ramp from I-395 with a 4,000-foot acceleration lane, and one lane serving the on-ramp from Franconia Road with an 675-foot acceleration lane (It was agreed by VDOT that this merge facility would be analyzed as a four-lane mainline and one-lane on-ramp due to the 4,000-foot length of the lane originating from I-395)
I-395 NB merge is a four lane facility with three through lanes serving the freeway mainline and one lane serving the on-ramp from Franconia Road with a 750-foot acceleration lane
I-495 NB merge is a four lane facility with three through lanes serving the ramp to I-495 and one lane serving the connecting on-ramp from Franconia Road with a 700-foot acceleration lane
Because two of the facilities connecting all three Interstates to Franconia Road were composed of a set of complex merges and diverges, these facilities were evaluated by analyzing each component separately (diverge, ramp, merge). The HCM provides three tables to examine each component. If the facility capacity was lower than the table values, it was concluded that the facility would pass. Figures 6-15, 6-16, and 6-17 illustrate the two complex facilities.
FBI Headquarters Consolidation U.S. General Services Administration 6-63 Transportation Impact Assessment
Springfield
Figure 6-15: I-95/I-495/I-395/I-495 Off-ramp to Franconia Road Eastbound
FBI Headquarters Consolidation U.S. General Services Administration 6-64 Transportation Impact Assessment
Springfield
Figure 6-16: Franconia Road Westbound to I-95 NB/I-495 EB/I-395 NB/I-495 NB
FBI Headquarters Consolidation U.S. General Services Administration 6-65 Transportation Impact Assessment
Springfield
Figure 6-17: Franconia Road On-ramp to I-95 NB/I-495 EB
6.6.7.3 Freeway Analysis
Based on the analysis performed using HCS, one Interstate facility would be projected to fail during the AM peak hour. The diverge facility serving FBI vehicle trips from I-95 from the south to Loisdale Road/Spring Mall Drive
FBI Headquarters Consolidation U.S. General Services Administration 6-66 Transportation Impact Assessment
Springfield
would result in a failing freeway facility (LOS E). Table 6-13 contains the Build with Mitigation Condition HCS freeway analysis.
Table 6-13: Build with Mitigation Condition Freeway Analysis
Freeway Analysis Facility
Type Density
(pc/mi/ln) LOS Check
I-95 Northbound to Loisdale Road/Spring Mall Drive (AM only) Diverge 37.3 E Fail
Fairfax County Parkway between I-95 NB off-ramp and I-95 SB on-ramp/Backlick Road Northbound (PM only)
Weave 23.4 C Pass
I-95 Southbound between Fairfax County Parkway Westbound and Fairfax County Parkway Eastbound (PM only)
Weave 27.9 C Pass
Franconia Road Westbound to I-395 Northbound (PM only) Merge 24.9 C Pass
Franconia Road Westbound to I-495 Northbound (PM only) Merge 16.5 B Pass
Franconia Road Westbound to I-95 Northbound/I-495 Eastbound (PM only)
Merge 28.5 D Pass
Notes: LOS = Level of Service; Density = Passenger cars per mile per lane (pc/mi/ln) Not Reported = Roadway flow rate exceeds capacity
An additional analysis was conducted on the complex set of ramps between I-95/I-495/I-395/I-495 and Franconia Road for both the inbound AM peak hour from the Interstates and outbound PM peak hour to the Interstates. Using the HCM Exhibits 13-8, 13-9, and 13-10 (TRB 2010), three parts of the complex ramp system were measured: diverge area, mainline ramp, and merge area(s). The free flow speeds were assigned the speed limit to be conservative and as agreed in the Springfield Site Transportation Agreement. A special free flow study was performed to check one ramp, since the preliminary finding was the ramp would result in a failing operation based on using the speed limit (see Free Flow Speed Study). Table 6-14 contains the HCM freeway analysis covering the off-ramp to Franconia Road eastbound during the AM peak hour. Table 6-15 contains the HCM freeway analysis covering the on-ramp from Franconia Road to the Interstate.
FBI Headquarters Consolidation U.S. General Services Administration 6-67 Transportation Impact Assessment
If any of the Interstate facilities failed, an addition test was agreed on based on the Springfield Site Transportation Agreement to determine if the difference in vehicle density between the No-build Condition and Build Condition was greater than five percent. This difference would confirm that the forecasted FBI vehicle trips significantly contributed to the facility failing.
Based on the additional analysis, the failing interstate facility would not contribute more than five percent to vehicle density, thus the facility is not impacted by the addition of forecasted FBI vehicle trips. Table 6-16 contains the Build with Mitigation Condition additional freeway analysis.
FBI Headquarters Consolidation U.S. General Services Administration 6-68 Transportation Impact Assessment
Springfield
Table 6-16: Build with Mitigation Condition Freeway Analysis
Additional Freeway Analysis Condition Density
(pc/mi/ln) Density
Difference AM
Check
I-95 Northbound to Loisdale Road/Spring Mall Drive (AM only)
No-build 36.1
3.3% Pass Build with Mitigation
37.3
Notes: Density = Passenger cars per mile per lane (pc/mi/ln)
Free Flow Speed Study
A special free flow speed study was performed for the loop ramp from I-95/I-495/I-395/I-495 to Franconia Road eastbound, since using the posted speed limit as the free flow speed resulted in a failing ramp operation. It was necessary to verify the failing condition by obtaining field data in the analysis. Free flow speed refers to the vehicle speed that occurs during off-peak hours with minimal or no traffic to slow a vehicle. On Tuesday, May 5, 2015 through Wednesday, May 6, 2015, automatic traffic recorders (ATR) were placed on the loop ramp spread 200 feet apart to capture the speeds for each vehicle covering a 48 hour period. The ATRs were planned to collect 48 hours of data; however, a vehicle in the 43rd hour damaged the tubes and the counts stopped being recorded. The data collected still provided plenty of sample data to develop an accurate free flow speed. Figure 6-18 shows the ATR locations.
Figure 6-18: ATR Locations for Speed Study
The speed values were extracted from the ATRs. Eight groups of speeds were developed between 0 and 50 mph. The ATR values were extracted in 15-minute increments covering the 43-hour period the ATRs collected data and placed into the appropriate speed group. Each 15-minute data sample was ordered by speed group. Based on the
FBI Headquarters Consolidation U.S. General Services Administration 6-69 Transportation Impact Assessment
Springfield
results, the average speed was 28 mph and the 85th percentile speed (85th percentage speed in this case as well) was 32 mph over the entire study period. When removing the peak periods, the average speed was still 28 mph, but the 85th percentile speed was 33 mph. Since the free flow speed is the measurement of the speed during non-congested periods, the 33 mph was assigned the free flow speed for the loop ramp. Once the analysis adjusted for the change in free flow speed from 25 mph to 33 mph, the facility no longer failed since the capacity of the ramp increased from 1,900 vehicles per hour to 2,000 vehicles per hour. Figure 6-19 shows the percent of vehicle speeds by time of day.
Figure 6-19: Loop Ramp Percent of Vehicle Speeds by Time of Day
6.6.8 Entry Control Facility Summary
The ECF analysis was performed once the complete set of external roadway mitigation was established. All mitigation measures were coded into TransModeler™ and several scenarios were tested to determine the minimum number of lanes capable of handling the AM peak hour forecasted FBI vehicle trips. It was determined that five lanes at the Site South Access and two lanes at the Site East Access were required to handle the forecasted demand, although four lanes at the Site South Access may have worked if more queue space was available between the ECF and Frontier Drive Extension. This resulted in the following breakdown of vehicles between the two ECFs:
South Entrance from Frontier Drive Extension: 683 vehicles or 67 percent East Entrance from Metropolitan Center Drive: 341 vehicles or 33 percent
Following the process to ensure statistical accuracy for the simulations, TransModeler™ was used to run 25 simulations for each scenario to calculate the standard deviation based on the VHT metric. Appendix E11 contains the statistical results for determining the minimum number of TransModeler™ simulations required to be
FBI Headquarters Consolidation U.S. General Services Administration 6-70 Transportation Impact Assessment
Springfield
within plus or minus 2 percent at the 95th percentile confidence interval. After the statistical procedure, the following six scenarios were completed:
Site South Access and Frontier Drive intersection and Site East Access and Metropolitan Center Drive STOP-sign controlled (Metropolitan Center Drive westbound approach only)
1. Three lanes at the Site South Access and one lane at the Site East Access 2. Four lanes at the Site South Access and two lanes at the Site East Access 3. Five lanes at the Site South Access and two lanes at the Site East Access
Site South Access and Frontier Drive intersection traffic signal controlled and Site East Access and Metropolitan Center Drive STOP-sign controlled (Metropolitan Center Drive westbound approach only)
4. Three lanes at the Site South Access and two lanes at the Site East Access 5. Four lanes at the Site South Access and two lanes at the Site East Access 6. Five lanes at the Site South Access and two lanes at the Site East Access
Depending on the type of traffic control used for the intersection at the Frontier Drive Extension and Site South Access, the number of lanes required to keep the queues from spilling into the intersection ranges between four and five lanes. Under a STOP-sign controlled operation, the ECF would require five lanes but only four lanes under a traffic signal control. Both scenarios would fail with three lanes resulting in the average queue length for all lanes exceeding the average capacity from 663 feet to 739 feet depending on the intersection control type. Under STOP-control, four lanes would result in the average queue length for all lanes exceeding the capacity by 78 feet. The signal control provides a means of balancing the arrivals in a more consistent manner, thus allowing more time for the vehicles in queue to clear before a new wave of arrivals enters the queue. At four lanes with a signal controlling the intersection, the balance allows enough time for the lanes to clear before the next wave arrives. Under a STOP-sign controlled intersection, vehicles traveling on Frontier Drive Extension in the westbound direction temporally halting vehicles waiting to turn into the ECF would be the only means of controlling the arrival rate of vehicles.
The Site East Access would require two lanes to avoid a queue backing up onto Metropolitan Center Drive. One lane would result in a queue extending over 730 feet beyond the entrance to the site. Table 6-17 contains the ECF results with a STOP-controlled intersection serving the Site South Access and table 6-18 contains the ECF results with a traffic signal controlling the intersection serving the Site South Access.
FBI Headquarters Consolidation U.S. General Services Administration 6-71 Transportation Impact Assessment
Springfield
Table 6-17: ECF Analysis Results with STOP-controlled Intersection Serving Site South Access
Entrance Lanes
Three and One Lane Four and Two Lanes Five and Two Lanes
FBI Headquarters Consolidation U.S. General Services Administration 6-72 Transportation Impact Assessment
Springfield
(This page intentionally left blank.)
FBI Headquarters Consolidation U.S. General Services Administration 6-73 Transportation Impact Assessment
Springfield
6.6.9 Signal Warrant Analysis Summary
A signal warrant analysis is a quantitative assessment based on traffic volumes and established standards to determine whether installing a traffic signal at a specific intersection is justified, or warranted. The signal warrant analysis was conducted following the guidelines from the 2009 Manual on Uniform Traffic Control Devices (MUTCD) (FHWA 2012). To be consistent for all three proposed sites the Virginia Supplement to the 2009 MUTCD, 2011 Edition (VDOT 2011) guidelines were also employed. Combining both methods provides an analysis of two signal warrants per intersection, an average daily traffic (ADT) warrant and a peak hour warrant.
The ADT warrant (following the VDOT guidelines) compares a forecasted ADT volume for the intersection to minimum established ADTs based on the number of lanes along the two intersecting roadways. The forecasted intersection ADT is calculated by applying a 10 percent factor to the AM peak hour forecasted volumes (highest left-turn volume). The volumes are then compared to several tables in the VDOT MUTCD Supplement. The first table in the VDOT MUTCD Supplement contains the urban area minimum vehicle volumes to qualify the intersection; the second table in the VDOT MUTCD Supplement contains the urban area interruption of continuous traffic vehicle volumes to qualify the intersection. Both tables also contain 80th percentile volumes for both cases, which is used in urban areas. Based on the ADT warrant analysis, the Frontier Drive Extension and Site South Access intersection could benefit from a traffic signal but would not meet all the ADT warrants. Table 6-19 contains the ADT warrant summary.
Warrant 1B – Interruption of Continuous Traffic 12,280 14,400 Fails
Warrant 1C – Combination of 1A and 1B (80%) 12,280 7,680 Meets
12,280 11,520 Meets The peak hour warrant following the MUTCD requires two categorical tests. If either of the tests passes, then the intersection meets the warrant. The first category includes three tests: a test of the intersection delay under STOP-sign control, a test of the minor street vehicle volume, and a test of the total intersection volume. The intersection delay test determines if the intersection is under a STOP-control, if the delay for the minor-street would exceed four vehicle-hours (number of vehicles in queue times approach vehicle delay) for one lane. The minor street vehicle volume approach test determines whether or not the vehicle volume exceeds 100 vehicles for one lane. The third test of the total intersection volume examines if the total volume entering the intersection exceeds 650 vehicles for a three lane approach. The second categorical test includes one test based on a plotted chart published in the MUTCD (figure 4C-3; FHWA 2012). The chart plots the highest minor street approach volume against the total major street approach volumes. If the plotted point for the highest minor street approach falls higher than the appropriate curve (based on number of lanes for the major and minor approaches), the peak hour warrant is met.
Based on the peak hour warrant analysis, the intersection of Frontier Drive Extension and the Site South Access would not meet the warrant. The intersection fails all parts of the peak hour warrant except for the total entering volume due to low volumes projected to exit from the minor street and low volumes projected along the Frontier
FBI Headquarters Consolidation U.S. General Services Administration 6-74 Transportation Impact Assessment
Springfield
Drive Extension traveling in the westbound direction. Table 6-20 contains the peak hour warrant analysis results. Figure 6-20 shows the MUTCD plotted graph with the intersection point plotted.
Table 6-20: Peak Hour Warrant Analysis
Warrant Forecasted
ADT Warrant
Minimum Limit Category
Check Overall Check
Frontier Drive Extension and Site South Access
Warrant 3A1 – Total Stopping Time <0.01 hour 5 hours Fails
Warrant 3A2 – Minor Street Volume 62 vehicles 150 vehicles Fails
The intersection of the Frontier Drive Extension and Site South Access did not meet either warrant to support the placement of a traffic signal. Therefore, the intersection was further studied to determine if a left-turning lane would be warranted to support a heavy volume of FBI vehicle trips forecasted (over 600 vehicles). Based on the VDOT Access Management Design Standards for Entrances and Intersections, Appendix F (VDOT 2008), a special plotted chart must be used to determine if the intersection warrants a left-turn lane (VDOT 2008). If the plotted point is to the right of the plotted curve representing the lowest left-turn storage value (50-foot lane), the intersection warrants a turning lane.
Based on the plotted point, the intersection does seem to warrant at least one left-turn lane (the plotted point is off the chart to the right, but below the plotted curves). The VDOT Access Management Design Standards for Entrances and Intersections (VDOT 2008) also states that dual left turn lanes should be considered when the hourly volumes exceed 300 vehicles. This statement recommends a dual left turn operation under signal control based on a volume over 600 vehicles. The Synchro™/SimTraffic™ analysis demonstrated that this intersection would operate at LOS A and have a 95th percentile queue under 100 feet operating as an unsignalized intersection. Therefore, it is recommended to have a left-turn lane to handle the large forecasted volume, but not a traffic signal because the intersection failed both traffic signal warrants. Figure 6-21 contains VDOT left-turn signal warrant for the Frontier Drive Extension and Site South Access intersection with the intersection point plotted.
FBI Headquarters Consolidation U.S. General Services Administration 6-76 Transportation Impact Assessment
Springfield
Figure 6-21: VDOT Left-turn Warrant for Frontier Drive Extension and Site South Access with Intersection Point Plotted
Source: VDOT (2008)
FBI Headquarters Consolidation U.S. General Services Administration 6-77 Transportation Impact Assessment
Springfield
6.7 Overall Summary
The following summarizes the conclusions of the transportation evaluation:
A total of 3,296 AM peak hour and 3,047 PM peak hour person trips are projected to be added to all modes of transportation. Total Metrorail and Fairfax Connector transit trips are projected as 1,424 AM peak hour and 1,317 PM peak hour trips. Total vehicle trips are projected as 1,099 AM peak hour and 1,015 PM peak hour trips. The remaining trips would be commuter rail, commuter bus, bicycle, or walking trips.
The pedestrian network would expand under the No-build Condition with the inclusion of the Frontier Drive Extension and Metropolitan Center Drive Extension providing a new connection between the Franconia-Springfield Metro Station and Loisdale Road serving Metropolitan Center Drive and the Northern Virginia Community College (NVCC). The inclusion of the Springfield site would allow for the same connections as the No-build Condition, as well as a new connection as part of the recommended mitigation to be provided between Frontier Drive Extension and Franconia-Springfield Parkway directly serving an access point to the Springfield site. This new connection would provide for direct pedestrian connections between the Metrorail station and the Springfield site as well as the NVCC and proposed development near the site, thereby encouraging non-vehicular travel. It is assumed that all sidewalk curb ramps located adjacent to the parcel would also be constructed to ADA compliance.
The bicycle network would expand with the inclusion of the Frontier Drive Extension and Metropolitan Center Drive Extension providing new access between Frontier Drive and Loisdale Road. As part of the recommended mitigation, a new connection would be provided between Frontier Drive Extension and Franconia-Springfield Parkway directly serving an access point to the Springfield site. These new connections would provide for an interconnected bicycle network linking all proposed bicycle facilities in the study area and would encourage bicycle use to access the Springfield site.
The transit network (Metrorail, Metrobus, and Fairfax Connector) would not be affected by development of the proposed action at the Springfield site. The Franconia-Springfield Metro Station and all bus service would operate below capacity with the addition of the forecasted background growth and transit trips from the Springfield site. Three new bus bays are to be added to the Franconia-Springfield Metro Station and would accommodate the projected bus demand, including recommended shuttle buses operating between the station and Springfield site. It is assumed that WMATA would follow their long-term plan to address growth-related capacity issues for both bus and rail operations.
Parking availability would remain the same because the Springfield site would accommodate all parking needs on-site and implement a robust Transportation Management Plan to discourage employees from seeking alternative parking options in the nearby neighborhoods.
Truck access would be designed to accommodate the Springfield site from Loisdale Road at all times. This plan is not the official plan, but a plan to evaluate as part of the EIS. The Loisdale Road access would operate as a truck only access point, although it is assumed that all truck deliveries would be scheduled during the off-peak hours.
The traffic operations at one intersection (Franconia-Springfield Parkway at Manchester Boulevard/Beulah Street) currently operate at an unacceptable level of service under the Existing Condition. Once the background growth, planned developments, and planned improvements are added (No-build Condition), the same intersection would continue to fail. There are a number of planned roadway improvements within the Springfield site study area to compensate for the vehicle trips added from the background growth.
The addition of the Springfield site to the traffic network would result in three intersections operating at an unacceptable level of service. These three failing intersections would experience equal or better operations than
FBI Headquarters Consolidation U.S. General Services Administration 6-78 Transportation Impact Assessment
Springfield
the No-build Condition as a result of recommended mitigation that include new turning lanes, extended turning lane lengths, new travel lanes, and a new roundabout. Overall, the roadway non-Interstate network would operate much better and experience shorter queues with the addition of the recommended mitigation when compared to the No-build Condition.
FBI Headquarters Consolidation U.S. General Services Administration 7-1 Transportation Impact Analysis
Springfield
References American Public Transportation Association (APTA)
2013 Average New Vehicle Costs for 2012 and 2013 Vehicles by Type. Available online at: http://www.apta.com/resources/statistics/Documents/table22_vehcosttransitlength2013.pdf, accessed April 3, 2015.
Bureau of Labor Statistics (BLS)
2015 Washington – Baltimore Area Consumer Price Index, 2013-2014. Available online at: http://www.bls.gov/regions/mid-atlantic/news-release/consumerpriceindex_washingtondc.htm#CPI_TableAChart1.xlsx, accessed June 17, 2015.
Burke, Thomas
2015 Non-Tysons trip reduction goals. E-mailed from Thomas Burke to Mark Berger, Louis Berger, March 26, 2015.
Cambridge Systematics, Inc., HNTB Corporation, and Smithgroup/JJR
2008 Springfield Connectivity Study, submitted to Fairfax County Department of Planning. Submitted by: Cambridge Systematics Inc., HNTB Corporation, and Smithgroup/JJR. Available online at: http://www.fairfaxcounty.gov/dpz/springfield/, accessed February 5, 2015.
City of Alexandria
2014 E-mail from Megan Cummings, City of Alexandria, to David Miller, FourSquare, allowing use of the Washington Headquarters Services BRAC Transportation Management Plan report data. September 9, 2014.
2015 ‘HAWK’ pedestrian signal. Available online at: https://alexandriava.gov/HAWK, accessed April 28, 2015.
Commuter Connections
2015 Park & Ride Lots in the Metropolitan Washington/Baltimore Regions. Available online at: http://www.commuterconnections.org/commuters/transit/park-ride-locations/, accessed April 10, 2015.
District Department of Transportation (DDOT)
2010 Incorporation of Transportation Demand Management (TDM) into the Development Review Process: Final Report and Recommendations. Submitted to DDOT from Michael Baker, Jr., Inc., July 2010. Available online at: http://ddot.dc.gov/sites/default/files/dc/sites/ddot/publication/attachments/tdm-final-report.pdf, accessed June 25, 2015.
2012 Guidelines to Comprehensive Transportation Review Requirements, CTR Beta Version. Available online at: http://nacto.org/docs/usdg/comprehensive_transportation_review_ddot.pdf, accessed August 12, 2015.
FBI Headquarters Consolidation U.S. General Services Administration 7-2 Transportation Impact Analysis
Springfield
Enterprise CarShare
2015 Enterprise Carshare. Washington, D.C. Available online at: http://www.enterprisecarshare.com/car-sharing/program/dc, accessed June 22, 2015.
Fairfax County
2009 Loisdale Road Corridor Transportation Study (from the Fairfax County Department of Transportation’s website). September 30, 2009. Available online at: http://www.fairfaxcounty.gov/fcdot/pdf/brac/loisdale_road_corridor_transportation_study.pdf, accessed February 5, 2015.
2013 Fairfax County Comprehensive Plan, Franconia-Springfield Area and Fort Belvoir North Area (from the Fairfax County Department of Planning and Zoning webpage). Available online at: http://www.fairfaxcounty.gov/dpz/comprehensiveplan/area4/franconiaspring.pdf, accessed February 5, 2015.
2014a Fairfax County Bicycle Master Plan. Available online at: http://www.fairfaxcounty.gov/fcdot/pdf/bike/bicycle_master_plan_draft-final.pdf, accessed March 19, 2015.
2014b All Fairfax Connector Routes. Available online at: http://www.fairfaxcounty.gov/connector/nroutes/routes.htm, accessed December 22, 2014.
2014c Fairfax Connector Ridecheck Data, Fall of 2014. Received January 9, 2015.
2014d Fairfax County, Virginia: FY 2015 – FY 2019 Adopted Capital Improvement Program. Available online at: http://www.fairfaxcounty.gov/dmb/fy2015/adopted/cip/cip.pdf, accessed April 10, 2015.
2014e Fairfax County Title VI Program, July 2014. Received on March 4, 2015.
2015a Bike Fairfax Interactive Map. Available online at: http://www.fairfaxcounty.gov/fcdot/bike/bikemap/, accessed February 17, 2015.
2015b Fairfax County internet-based GIS tool. Available online at: http://icare.fairfaxcounty.gov/ffxcare/maps/mapadv.aspx, accessed May 21, 2015.
2015c Fairfax Connector Service Changes Effective May 16, 2015. Available online at: http://www.fairfaxcounty.gov/connector/news/2015/15_009.htm, accessed 8/13/15.
2015d Fairfax County Park and Rides. Available online at: http://www.fairfaxcounty.gov/connector/parkandrides/, accessed August 26, 2015.
Fairfax County Department of Transportation (FCDOT)
2012 Frontier Drive Extension Final Report 2012, downloaded from the FCDOT restricted FTP site on October 23, 2014.
2014 “Countywide Dialogue on Transportation: Board of Supervisors Approved Projects – January 28, 2014.” Available online at: http://www.fairfaxcounty.gov/fcdot/cdot/projects/approved.htm, accessed June 13, 2015.
FBI Headquarters Consolidation U.S. General Services Administration 7-3 Transportation Impact Analysis
Springfield
2015a Springfield Town Center Proffers Text and Springfield Town Center Proffers Graphics. Downloaded from the Fairfax County Department of Transportation’s secure FTP on January 21, 2015.
2015b Route1 Appendix E Additional Traffic Analysis for Future Land Use Scenarios 2015-01-29. Available online at: http://www.drpt.virginia.gov/media/1562/route_1_appendix_e_additional_traffic_analysis_for_future_land_use_scenarios_2015-01-29.pdf, accessed May 29, 2015.
Fairfax County Office of Community Revitalization (FC OCR)
2014a Presentation to Transportation Association of Greater Springfield (TAGS), August 6, 2014. Available online at: http://www.fcrevit.org/springfield/download/TAGS%20Springfield%20Presentation_20140809.pdf, accessed April 10, 2015.
2014b Springfield Revitalization Report, February 2014. Available online at: http://www.fcrevit.org/publications/download/SpringfieldAnnualReport.pdf, accessed April 10, 2015.
Federal Highway Administration (FHWA)
2012 Manual on Uniform Traffic Control Devices (MUTCD). 2009 Edition with Revision Numbers 1 and 2 incorporated, dated May 2012. Available online at: http://mutcd.fhwa.dot.gov/kno_2009r1r2.htm, accessed May 31, 2013.
2014 Designing Sidewalks and Trails for Access, February 2014, http://www.fhwa.dot.gov/environment/bicycle_pedestrian/publications/sidewalks/chap4a.cfm, accessed May 17, 2015.
General Services Administration (GSA)
2008 Final Environmental Impact Statement on St. Elizabeths Campus Master Plan for the Consolidated Headquarters of the Department of Homeland Security.
2015a Phase 1 Environmental Site Assessment, Springfield Alternative.
2015b Email correspondence with Vicki Absher, GSA, May 20, 2015.
General Services Administration (GSA) in cooperation with the National Capital Planning Commission (NCPC)
2013 Old Post Office Building Redevelopment Revised Transportation Study Appendix.
Gorove Slade (GS)
2008 Traffic Impact Study: Springfield Mall Town Center. Revised date: September 2008. Available at: http://landtrx.vdot.virginia.gov/, accessed February 25, 2014.
2013 Safford Automobile Dealership – November 1, 2013, downloaded from the FCDOT restricted FTP site on January 21, 2015.
FBI Headquarters Consolidation U.S. General Services Administration 7-4 Transportation Impact Analysis
Springfield
Greyhound
n.d. Greyhound Express Schedules, Springfield, Virginia. Available online at: https://www.greyhound.com/Express/Default.aspx, accessed January 27, 2015.
Institute of Transportation Engineers (ITE)
2010 Transportation Impact Analyses for Site Development, Washington, D.C.
2004 Trip Generation Handbook, Second Edition, Institute of Transportation Engineers, Washington, D.C., January 2004.
2012 Trip Generation Manual, Ninth Edition, Institute of Transportation Engineers, Washington, D.C., September 2012.
Kettler
n.d. Springfield Crossing Apartments. Available online at: http://www.springfieldcrossingapartments.com/area.html, accessed March 16, 2015.
Metropolitan Washington Council of Governments (MWCOG)
2011 State of the Commute. Available online at: http://www.mwcog.org/commuter2/pdf/publication/2010-StateOftheCommute-Final.pdf, accessed March 16, 2014.
2014 MWCOG Memoranda to Louis Berger including Travel Demand Model Data 01_09_14 & Data 07_16_14 in administrative record. Emailed from Meseret Seifu.
2015 Round 8.3 Regional Growth Rates by Mode, 2008-2025. Received on January 20, 2015.
National Capital Planning Commission (NCPC)
2004 The Comprehensive Plan for the National Capital. Available online at: http://www.ncpc.gov/ncpc/Main%28T2%29/Planning%28Tr2%29/ComprehensivePlan.html, accessed February 13, 2015.
2011 Federal Elements of the Comprehensive Plan for the National Capital - Draft Update to the Policies in the Transportation and Workplace Elements. Available online at: http://www.ncpc.gov/DocumentDepot/Actions_Recommendations/2011July/Comp_Plan_Update_Transportation_Workplace_Elements_CP01_Recommendation_July2011_.pdf, accessed March 21, 2014.
2012 Draft Update (June 2012) to the Policies in the Transportation and Workplace Elements, Comprehensive Plan for the National Capital, Federal Elements. Available online at: http://www.ncpc.gov/DocumentDepot/Actions_Recommendations/2011July/Comp_Plan_Update_Transportation_Workplace_Elements_CP01_Recommendation_July2011_.pdf, accessed March 16, 2014.
Parsons Brinckerhoff, prepared for Fairfax County Department of Transportation
2012 Frontier Drive Extension Traffic Operational Analysis. (Mark Berger received this file – not available online.)
FBI Headquarters Consolidation U.S. General Services Administration 7-5 Transportation Impact Analysis
Springfield
Potomac and Rappahannock Transportation Commission (PRTC)
n.d. OmniRide and Metrorail Direct Schedules. Available online at: http://www.prtctransit.org/commuter-bus/schedules/index.html, accessed December 22, 2014.
Renard Development Company
2014 Greenbelt WMATA Internal Traffic Flow Analysis, October 6, 2014, in administrative record handed to Louis Berger on October 27, 2014, by authors.
Transportation Association of Greater Springfield (TAGS)
2014 TAGS System Map. Available online at: http://www.tagsva.org/routes-schedules/system-map/, accessed August 13, 2015.
Transportation Research Board (TRB)
2000 Highway Capacity Manual (HCM), Transportation Research Board for the National Academies of Science. Washington, D.C.
2010 Highway Capacity Manual (HCM), Transportation Research Board for the National Academies of Science, Washington, D.C., December 2010.
2013 Transit Capacity and Quality of Service Manual, 3rd Edition. Transportation Research Board for the National Academies of Science. Available online at: http://www.trb.org/main/blurbs/169437.aspx, accessed December 19, 2014.
United States Census Bureau (U.S. Census Bureau)
2009-2013 American Community Survey Table B08006, Sex of Workers by Means of Transportation to Work; using American FactFinder. Available online at: http://factfinder.census.gov/faces/nav/jsf/pages/searchresults.xhtml?refresh=t, accessed March 31, 2015.
United States Department of Justice (USDOJ)
2007 Civil Rights Division, Standards for Accessibility Design - Chapter 6, Curb Ramps and Pedestrian Crossings, May 2007.
2010 2010 ADA Standards for Accessible Design, September 2010. Available online at: http://www.ada.gov/regs2010/2010ADAStandards/2010ADAstandards.htm#c4, accessed August 13, 2015.
Urban Land Institute (ULI)
2006 “Springfield Virginia.” May 26, 2006. Available online at: http://uli.org/wp-content/uploads/ULI-Documents/2007SpringfieldReport.pdf, accessed February 5, 2015.
Virginia Department of Transportation (VDOT)
2008 VDOT Access Management Design Standards for Entrances and Intersections. Available online at: http://www.extranet.vdot.state.va.us/locdes/Electronic_Pubs/2005%20RDM/RoadDesignCoverVol.1.pdf, accessed May 22, 2015.
FBI Headquarters Consolidation U.S. General Services Administration 7-6 Transportation Impact Analysis
Springfield
2011 Virginia Supplement to the MUTCD. Available online at: http://www.virginiadot.org/business/virginia_mutcd_supplement.asp, accessed January 7, 2015.
2012a Revised Environmental Assessment, Fairfax County Parkway Interchange Improvements. April 12, 2012. Available online at: http://www.virginiadot.org/projects/resources/NorthernVirginia/Ffx_Cty_Pkwy_Intch_Improvements_-_Revised_EA.pdf, accessed February 5, 2015.
2012b Traffic Impact Analysis Regulations. January 1, 2012. Available online at: http://www.vdot.virginia.gov/info/traffic_impact_analysis_regulations.asp, accessed October 17, 2013.
2013a Average Daily Traffic Volumes with Vehicle Classification Data on Interstate, Arterial and Primary Routes. Available online at: http://www.virginiadot.org/info/2013_traffic_data.asp, accessed January 21, 2015.
2013b 2013 Virginia Department of Transportation Daily Traffic Volume Estimates Including Vehicle Classification Estimates; Jurisdiction Report 29. Available online at: http://www.virginiadot.org/info/resources/Traffic_2013/AADT_029_Fairfax_2013.pdf, accessed May 6, 2015.
2015a VDOT Studies, Fairfax County Parkway Corridor Improvement Study, Accessed online at: http://www.virginiadot.org/projects/northernvirginia/fairfax_county_parkway.asp, accessed September 18, 2015
2015b Park and Ride in Virginia. Available online at: http://www.virginiadot.org/travel/parkride/home.asp, accessed August 26, 2015.
2015c VDOT crash data from years 2011-2013, received on February 12, 2015.
Virginia Geographic Information Network (VGIN)
2013 Virginia Base Mapping Program (VBMP) Road Centerline Program (RCL), downloaded from the Virginia Geographic Information Network (VGIN). Available online at: http://www.vita.virginia.gov/isp/default.aspx?id=12120, accessed March 19, 2015.
Virginia Railway Express (VRE)
2014 VRE Ridership by Station, FY2014. Received on July 18, 2014.
2015a Springfield VRE Station Details. Available online at: http://www.vre.org/service/stations/FNC.htm, accessed February 18, 2015.
2015b VRE Fredericksburg Line Schedule. Available online at: http://www.vre.org/service/schedule.htm, accessed January 27, 2015.
2015c VRE. 2015. Performance Measures. Available at: http://www.vre.org/about/company/performance-measures.pdf, accessed August 13, 2015.
FBI Headquarters Consolidation U.S. General Services Administration 7-7 Transportation Impact Analysis
Springfield
Washington Metropolitan Area Transportation Authority (WMATA)
2008a Franconia Springfield Station Vision Plan. Available online at: https://www.wmata.com/pdfs/planning/Station%20Access/F-S_Report090508.pdf, accessed February 5, 2015.
2008b WMATA Station Site and Access Planning Manual. Available online at: https://www.wmata.com/pdfs/planning/Station%20Access/SSAPM.pdf, accessed February 3, 2015.
2009 Guide for the Design and Placement of Transit Stops. Available online at: https://www.wmata.com/pdfs/planning/WMATA%20Guidelines-Design%20and%20Placement%20of%20Transit%20Stops.pdf, accessed April 7, 2015.
2013a WMATA 2012 Metrorail Passenger Survey. Received June 2, 2014.
2013b WMATA Asset Improvement Evaluation Study. Available online at: http://www.wmata.com/pdfs/planning/WMATABusShelterImprovementEvaluationStudyFinalReport062813.pdf, accessed February 2, 2015.
2013c WMATA Title VI Service Standards, Policies, and Definitions. Available online at: http://www.wmata.com/about_metro/board_of_directors/board_docs/091213_3BTitleVI.pdf, accessed February 14, 2015.
2014a WMATA Metrorail Frequency. Available online at: http://www.wmata.com/rail/frequency.cfm, accessed December 20, 2014.
2014b Franconia-Springfield Metro Station Faregate Data, October 2014. Received December 16, 2014.
2014c WMATA Virginia Metrobus schedules. Available online at: http://www.wmata.com/bus/timetables/timetables-state.cfm?State=VA, accessed December 19, 2014.
2014d WMATA Automatic Passenger Counter (APC) data, October 2014. Received November 19, 2014.
2014e Momentum Strategic Plan. Available online at: http://www.wmata.com/about_metro/news/Momentum_Strategic_Plan_2013-01-28-secure.pdf, accessed April 15, 2015.
2014f “Metro Plans to Increase Number of 8-car trains on Blue Line,” July 2, 2014. Available online at: http://www.wmata.com/about_metro/news/PressReleaseDetail.cfm?ReleaseID=5739, accessed March 9, 2014.
2015a WMATA Metrorail Station Inventory. Available online at: http://www.wmata.com/rail/stations.cfm, accessed January 8, 2015.
2015b Franconia-Springfield Station Bus Map. Available online at: http://www.wmata.com/rail/station_bus_maps/PDFs/Largo%20Town%20Center%20STation.pdf, accessed January 15, 2015.
2015c Metro Announces Partnership with Enterprise to Expand Car Sharing at Parking Facilities. Available from: http://www.wmata.com/about_metro/news/PressReleaseDetail.cfm?ReleaseID=5918, accessed August 13, 2015.
FBI Headquarters Consolidation U.S. General Services Administration 7-8 Transportation Impact Analysis
Springfield
2015d WMATA: Franconia-Springfield Parking. Available online at: http://www.wmata.com/rail/parking/parking_detail.cfm?station=95, accessed on March 19, 2015.
2015e Franconia-Springfield Station Bus Loop Improvement 60% Design Plans. Received from WMATA on April 15, 2015.
Wells & Associates Inc.
2008 Springfield Metro Center II - Phase I TIS (June 20 2008), downloaded from the FCDOT restricted FTP site on January 21, 2015.
2014 Springfield Metro Center II Phase II record, Available online at: http://landtrx.vdot.virginia.gov/, accessed February 25, 2014.
Zipcar
2015 Find Zipcar Car Sharing Locations in Washington, D.C. Available online at: http://www.zipcar.com/dc/find-cars, accessed June 22, 2015.
Site Visits
1. Site visit for sidewalks and parking check, Louis Berger, May 8, 2015.
2. Station Site Inventories, FourSquare, December 2014.
FBI Headquarters Consolidation U.S. General Services Administration 8-1 Transportation Impact Assessment
Springfield
Acronyms and Abbreviations A
AADT Annual average daily traffic
ADA Americans with Disabilities Act
ADT Average daily traffic
APTA American Public Transit Association
ATR Automated Traffic Recorder
B
BLS Bureau of Labor Statistics
C
CEQ Council on Environmental Quality
CFR Code of Federal Regulations
CUP Central Utility Plant
D
DDOT District Department of Transportation
DTA dynamic traffic assignment
E
ECF Entry Control Facility
EIS Environmental Impact Statement
F
FBI Federal Bureau of Investigation
FXC Fairfax Connector
FCDOT Fairfax County Department of Transportation
FHWA Federal Highway Administration
G
GIS Geographic Information Systems
FBI Headquarters Consolidation U.S. General Services Administration 8-2 Transportation Impact Assessment
Springfield
GSA General Services Administration
GSF Gross Square Feet
H
HAWK High Intensity Activated Crosswalk
HCM Highway Capacity Manual
HCS Highway Capacity Software
HQ Headquarters
HOV High Occupancy Vehicle
I
ISC Interagency Security Committee
ITE Institute of Transportation Engineers
J
JEH J. Edgar Hoover
L
LCT Loudoun County Transit
LOS Level of Service
M
MEV million entering vehicles
M-NCPPC Maryland National Capital Park and Planning Commission
mph miles per hour
MUTCD Manual on Uniform Traffic Control Devices
MWCOG Metropolitan Washington Council of Governments
N
NCPC National Capital Planning Commission
NCR National Capital Region
NEPA National Environmental Policy Act
NFPA National Fire Protection Association
FBI Headquarters Consolidation U.S. General Services Administration 8-3 Transportation Impact Assessment
Springfield
O
OPO Old Post Office
P
PHF peak hour factor
P-MD Prince William Metro Direct
PRTC Potomac and Rappahannock Transportation Commission
R
RDF Remote Delivery Facility
RFDS Reasonably Foreseeable Development Scenario
S
SDDCTEA Surface Deployment and Distribution Command Transportation Engineering Agency
SF Square Foot
SOV Single Occupant Vehicle
T
TAZ Transportation Analysis Zone
TDM Travel Demand Management
TIA Transportation Impact Assessment
TIP Transportation Improvement Program
TMP Transportation Management Plan
TRB Transportation Research Board
TWSC Two-way STOP-Controlled
U
U.S. United States
USDOJ U.S. Department of Justice
V
v/c volume-to-capacity ratio
VC Visitor Center
FBI Headquarters Consolidation U.S. General Services Administration 8-4 Transportation Impact Assessment
Springfield
VDOT Virginia Department of Transportation
VHT Vehicle hours of travel
vph vehicles-per-hour
VRE Virginia Railway Express
W
WMATA Washington Metropolitan Area Transit Authority
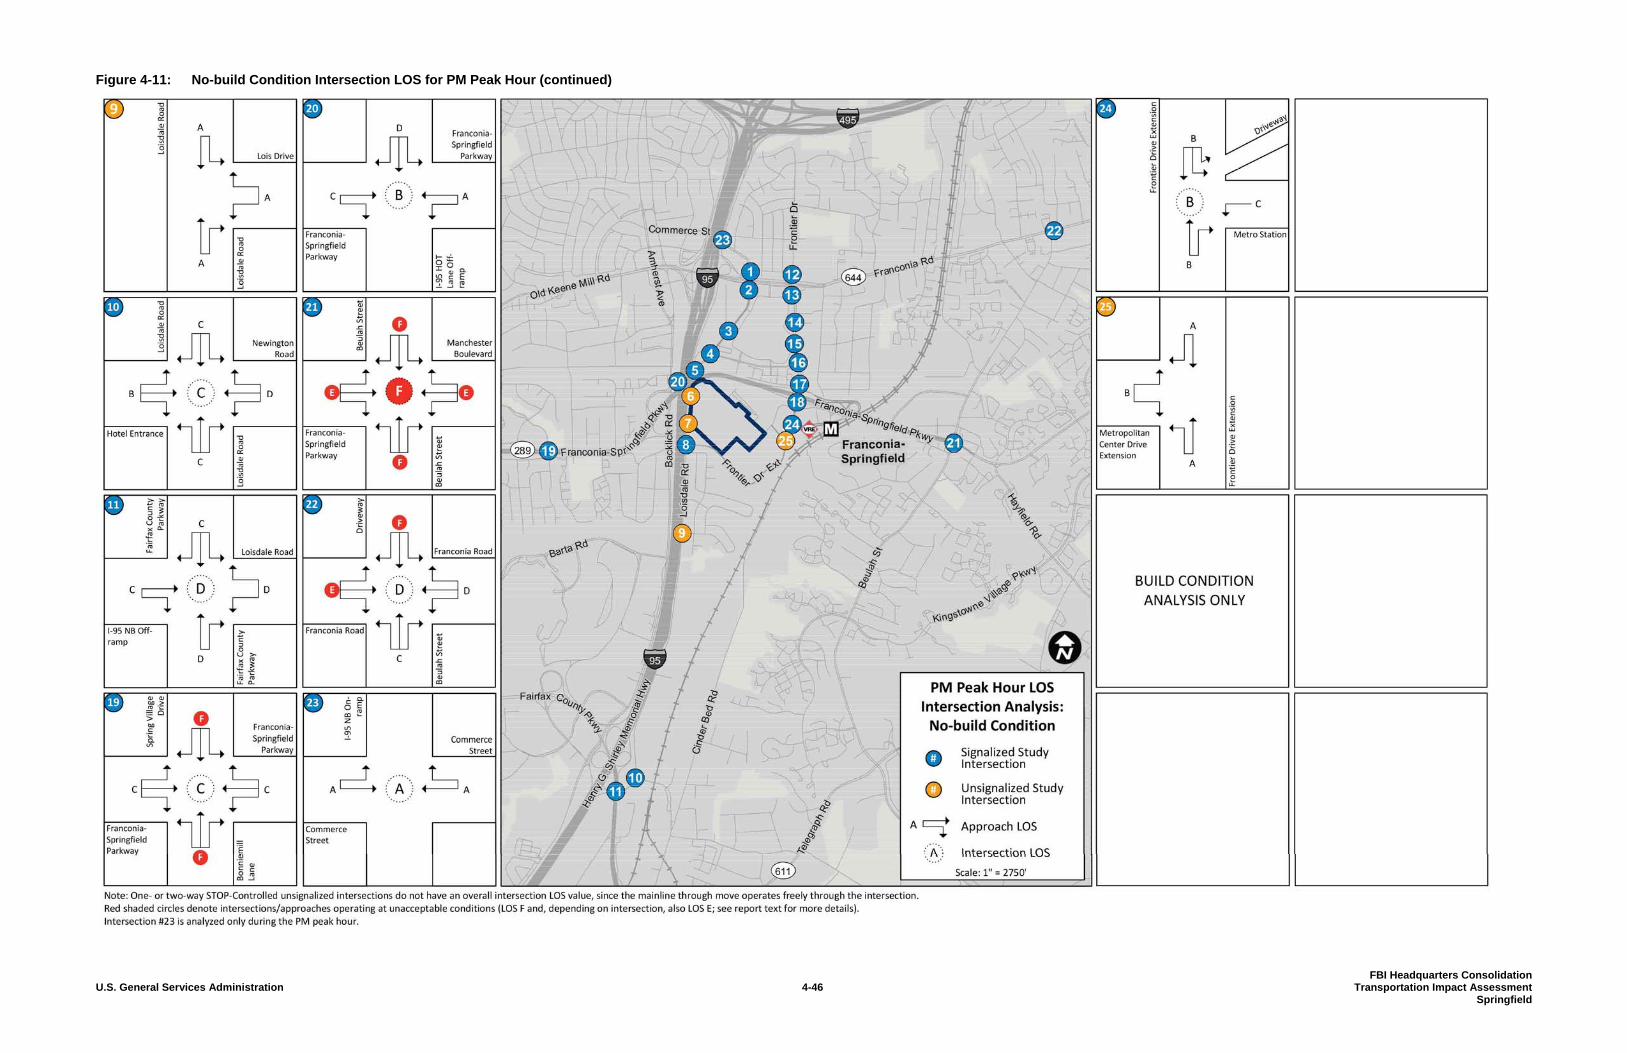


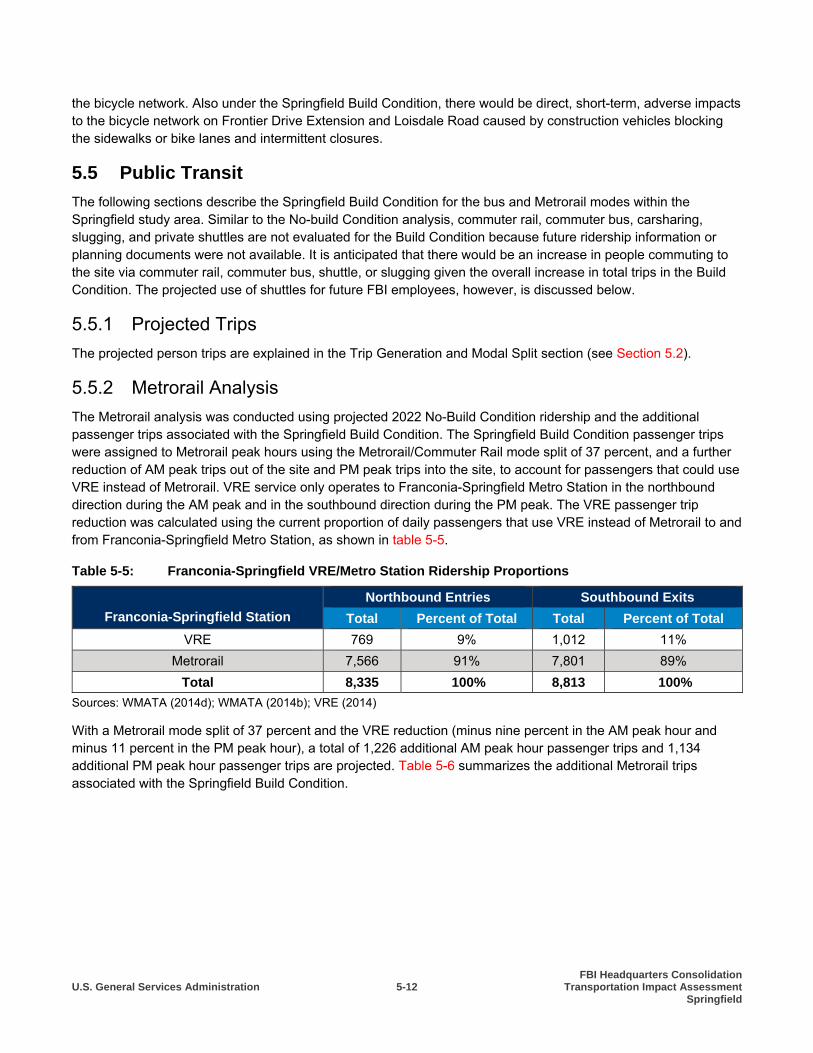


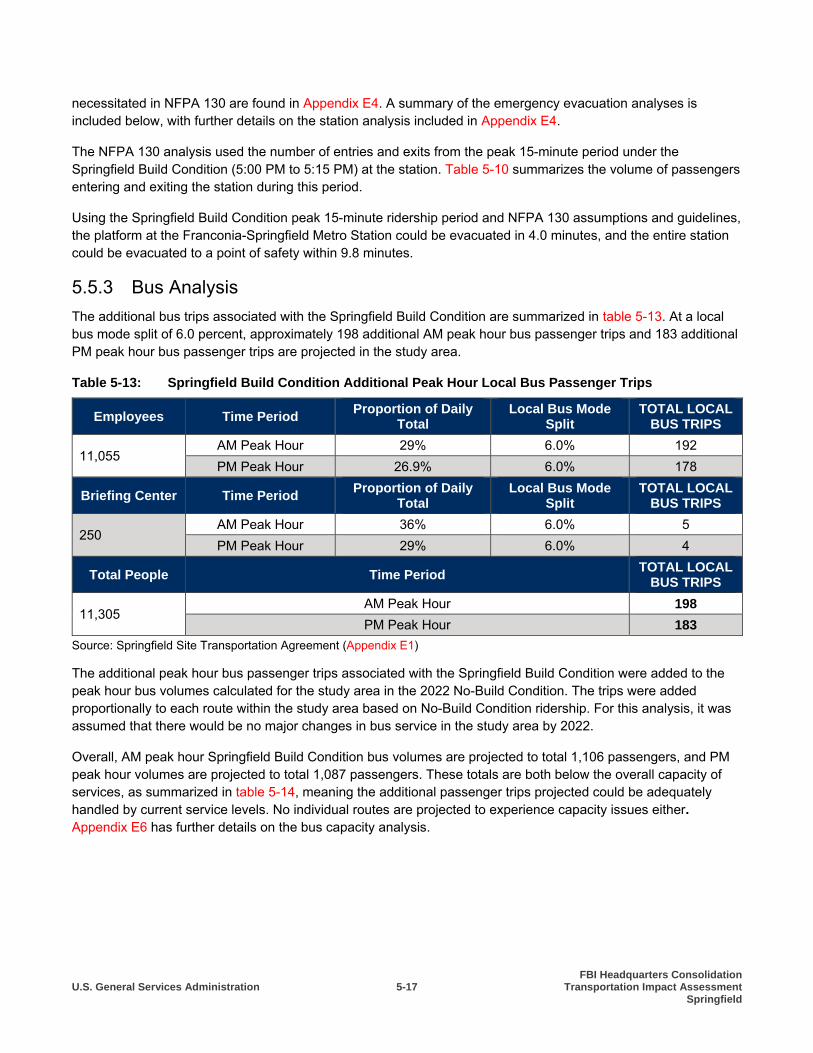


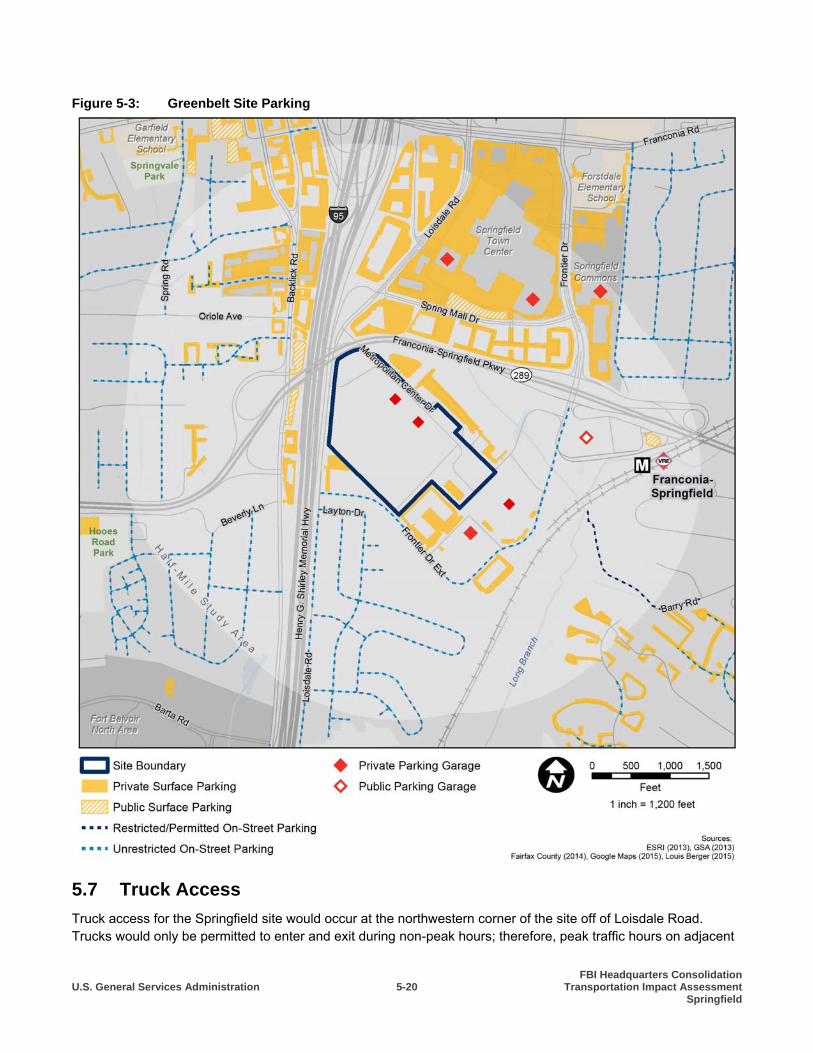


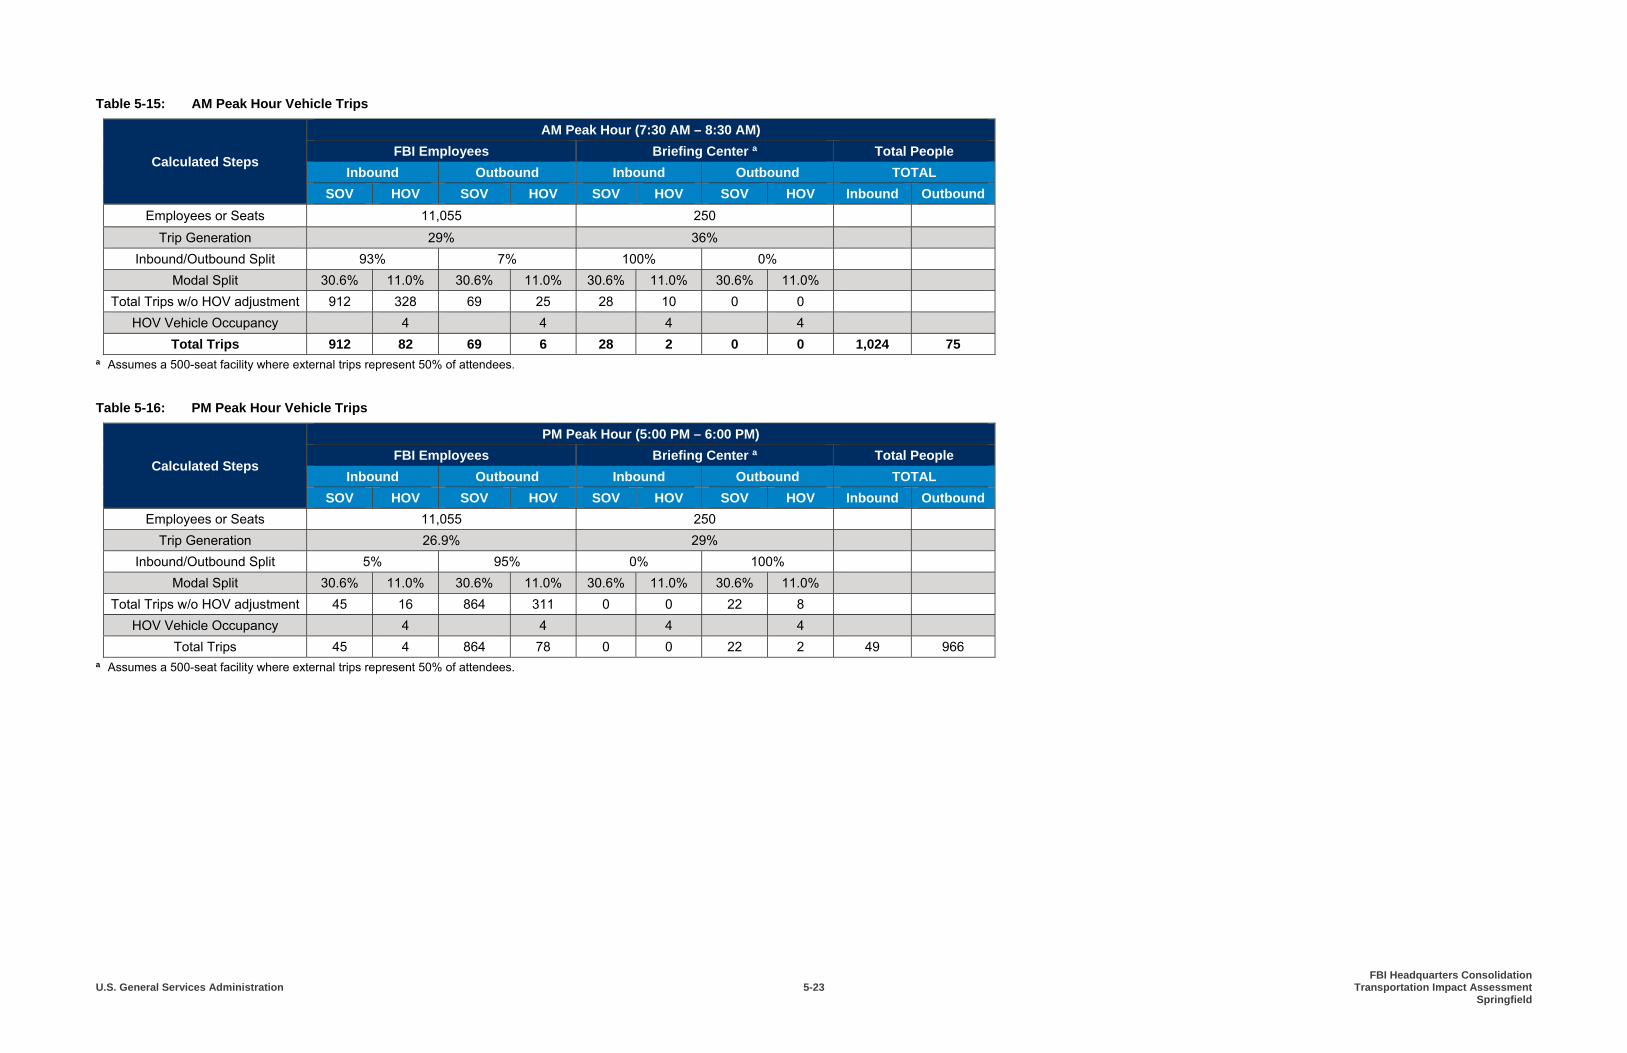
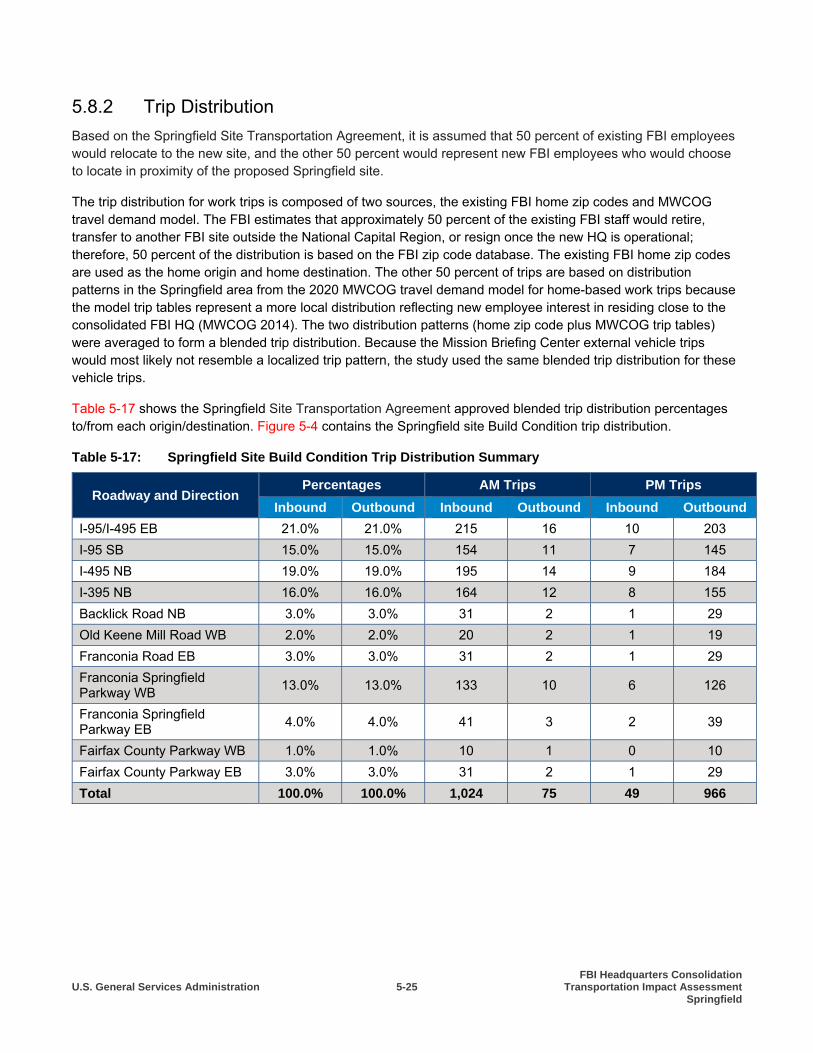


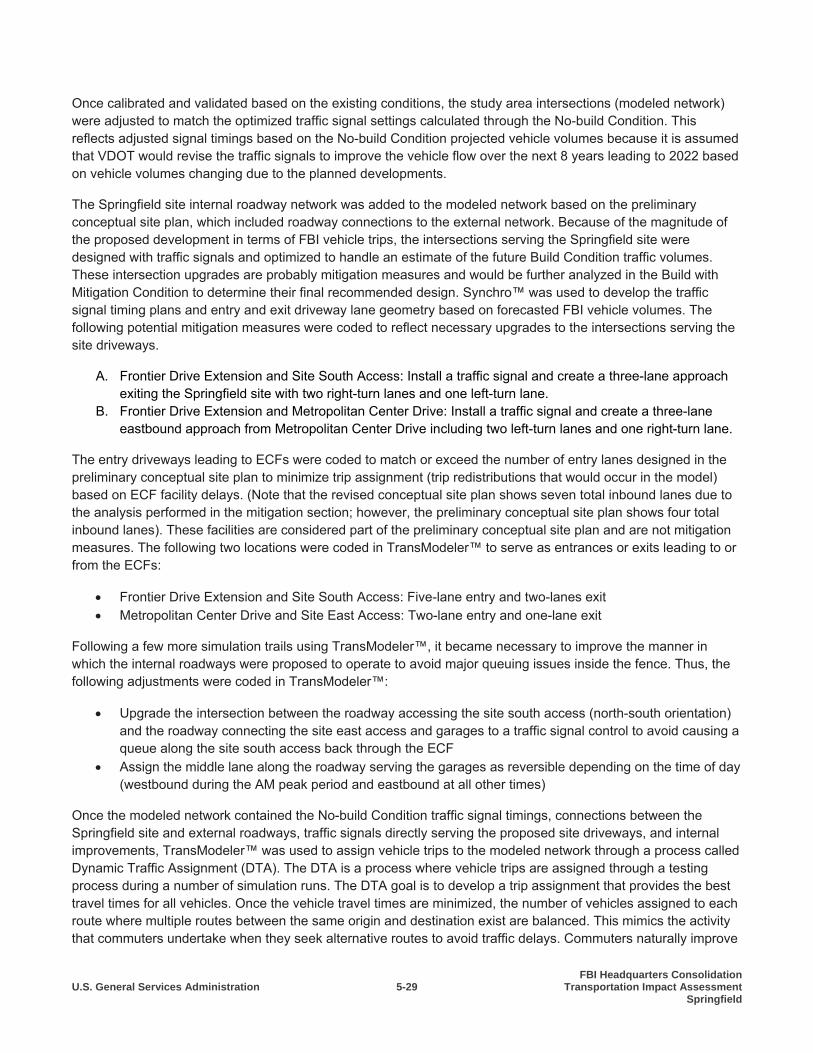


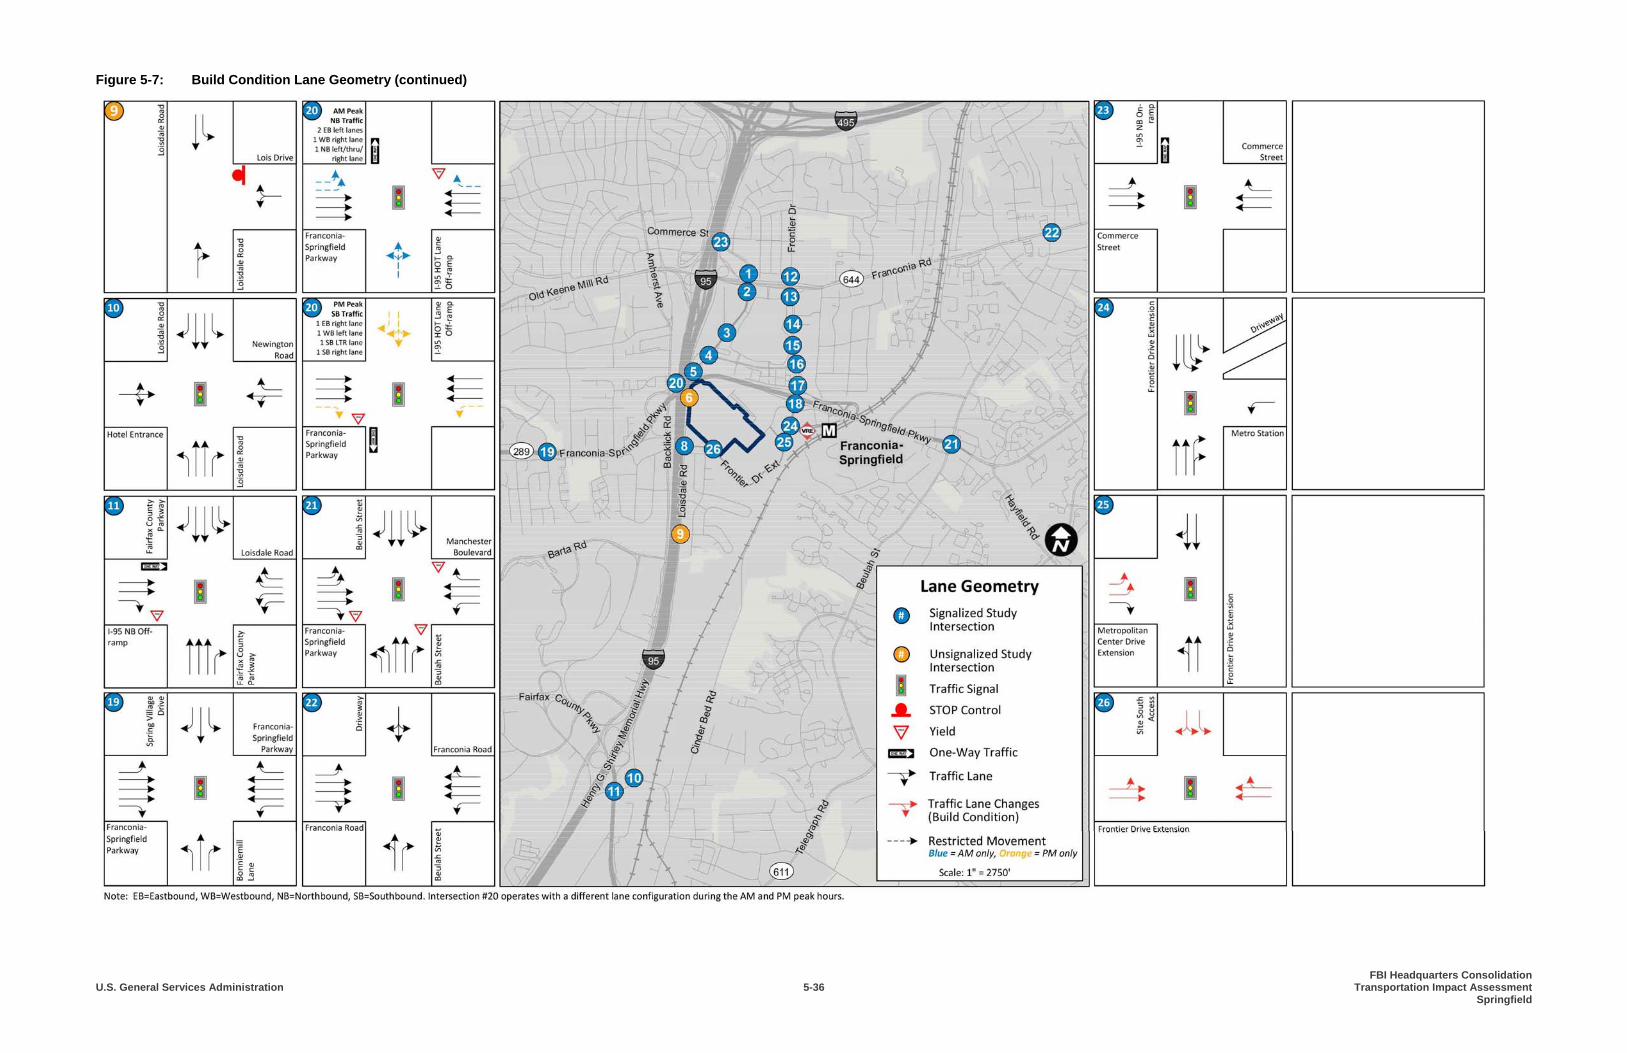


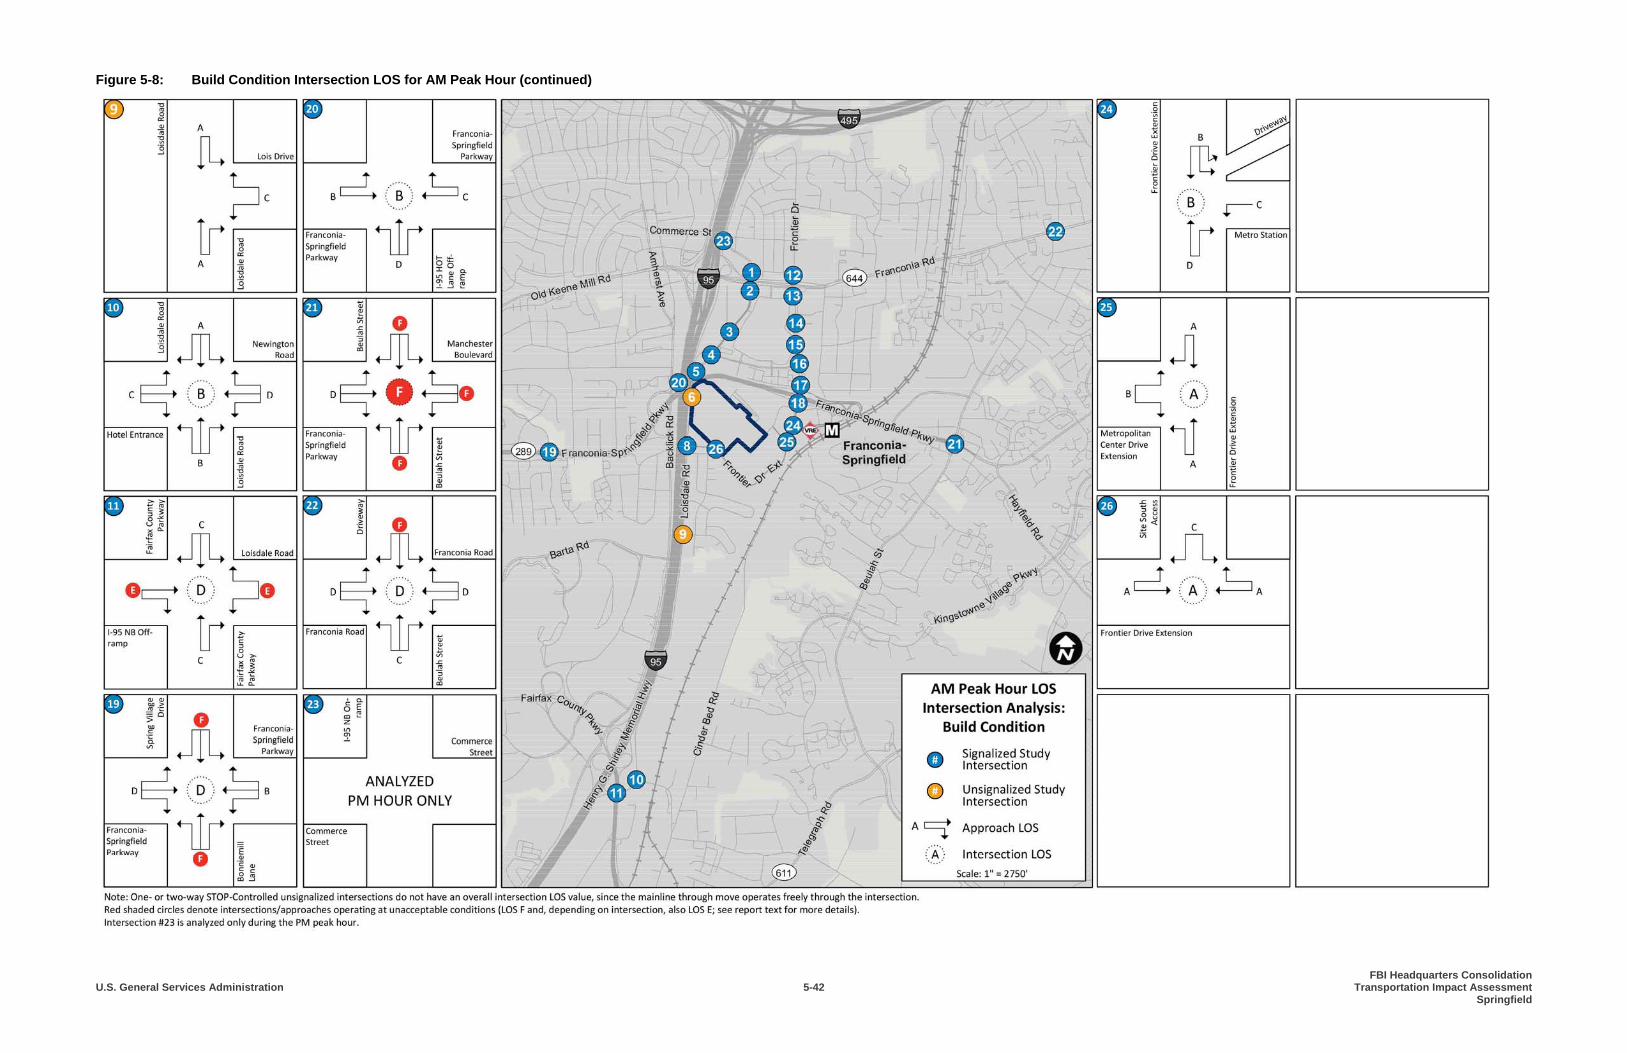
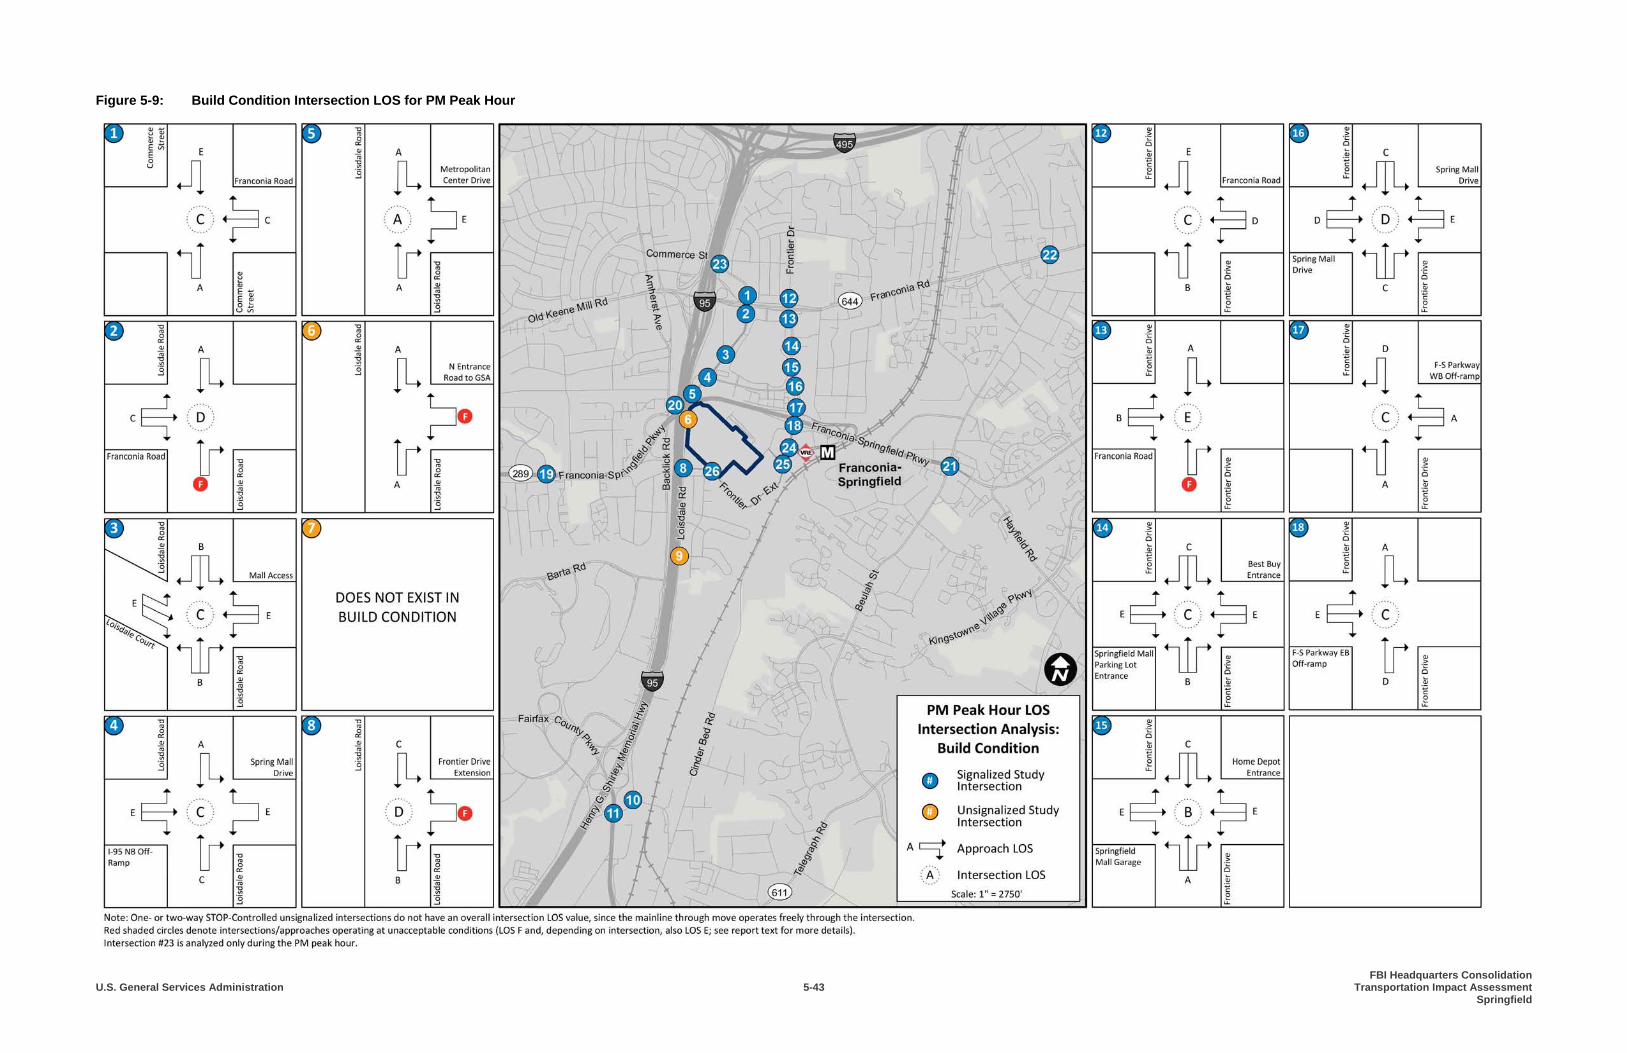


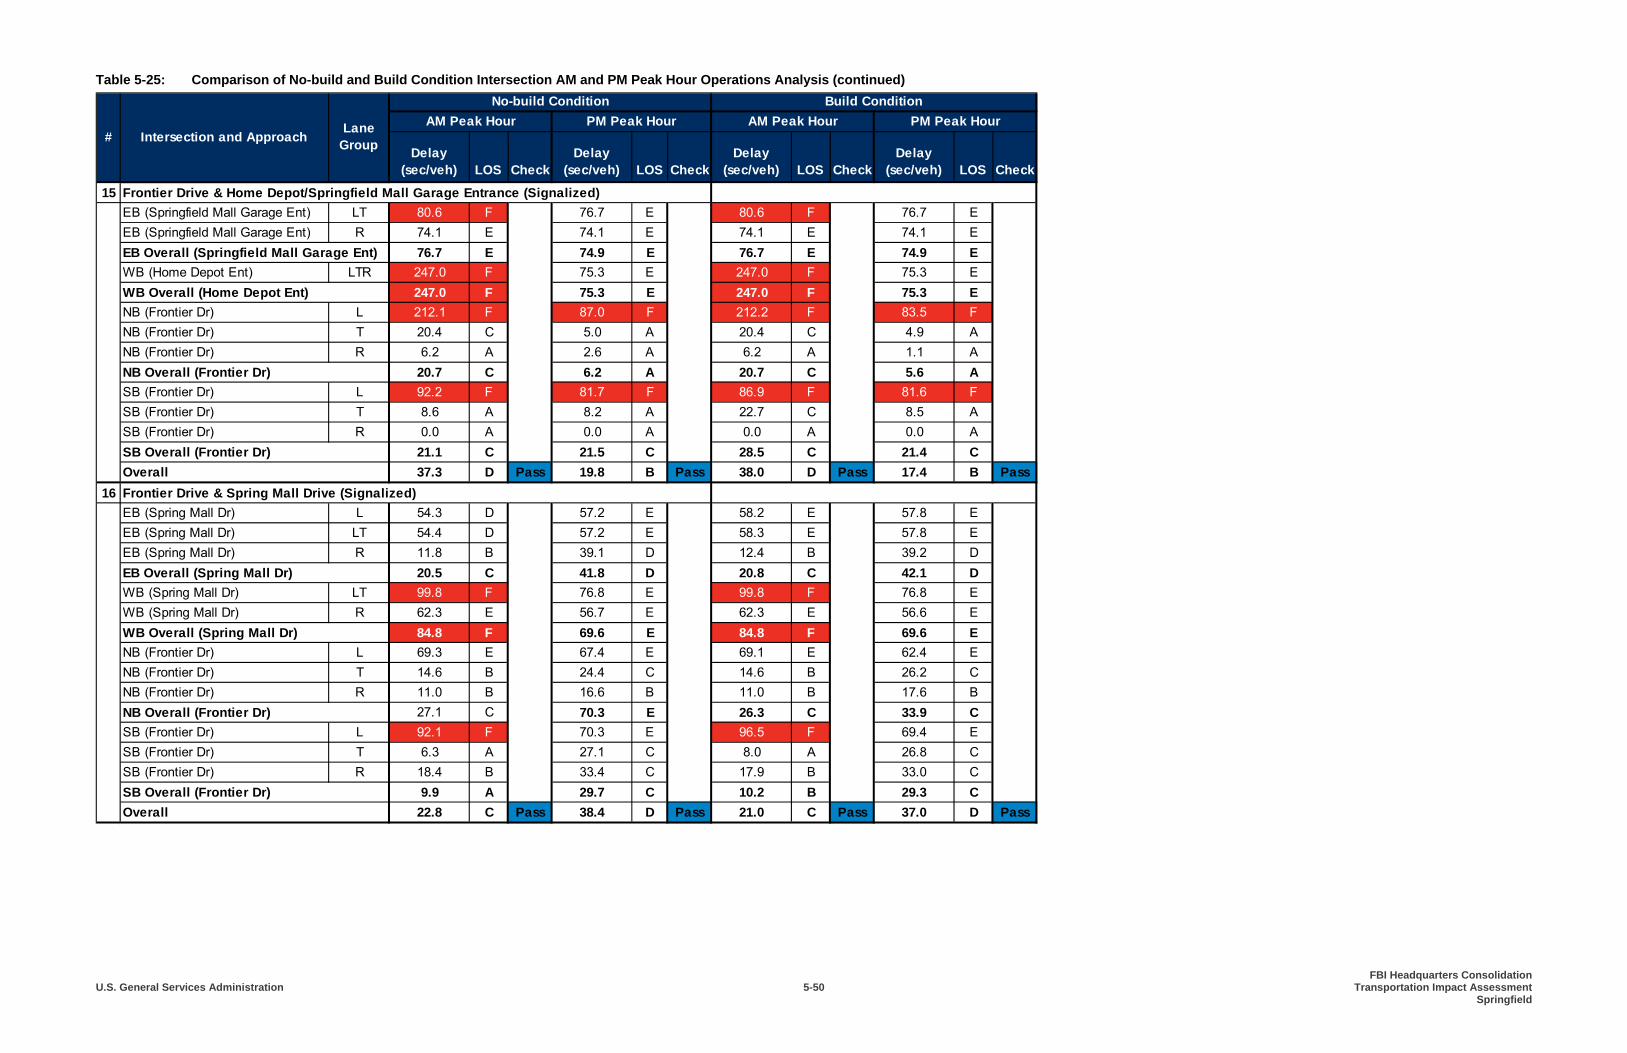
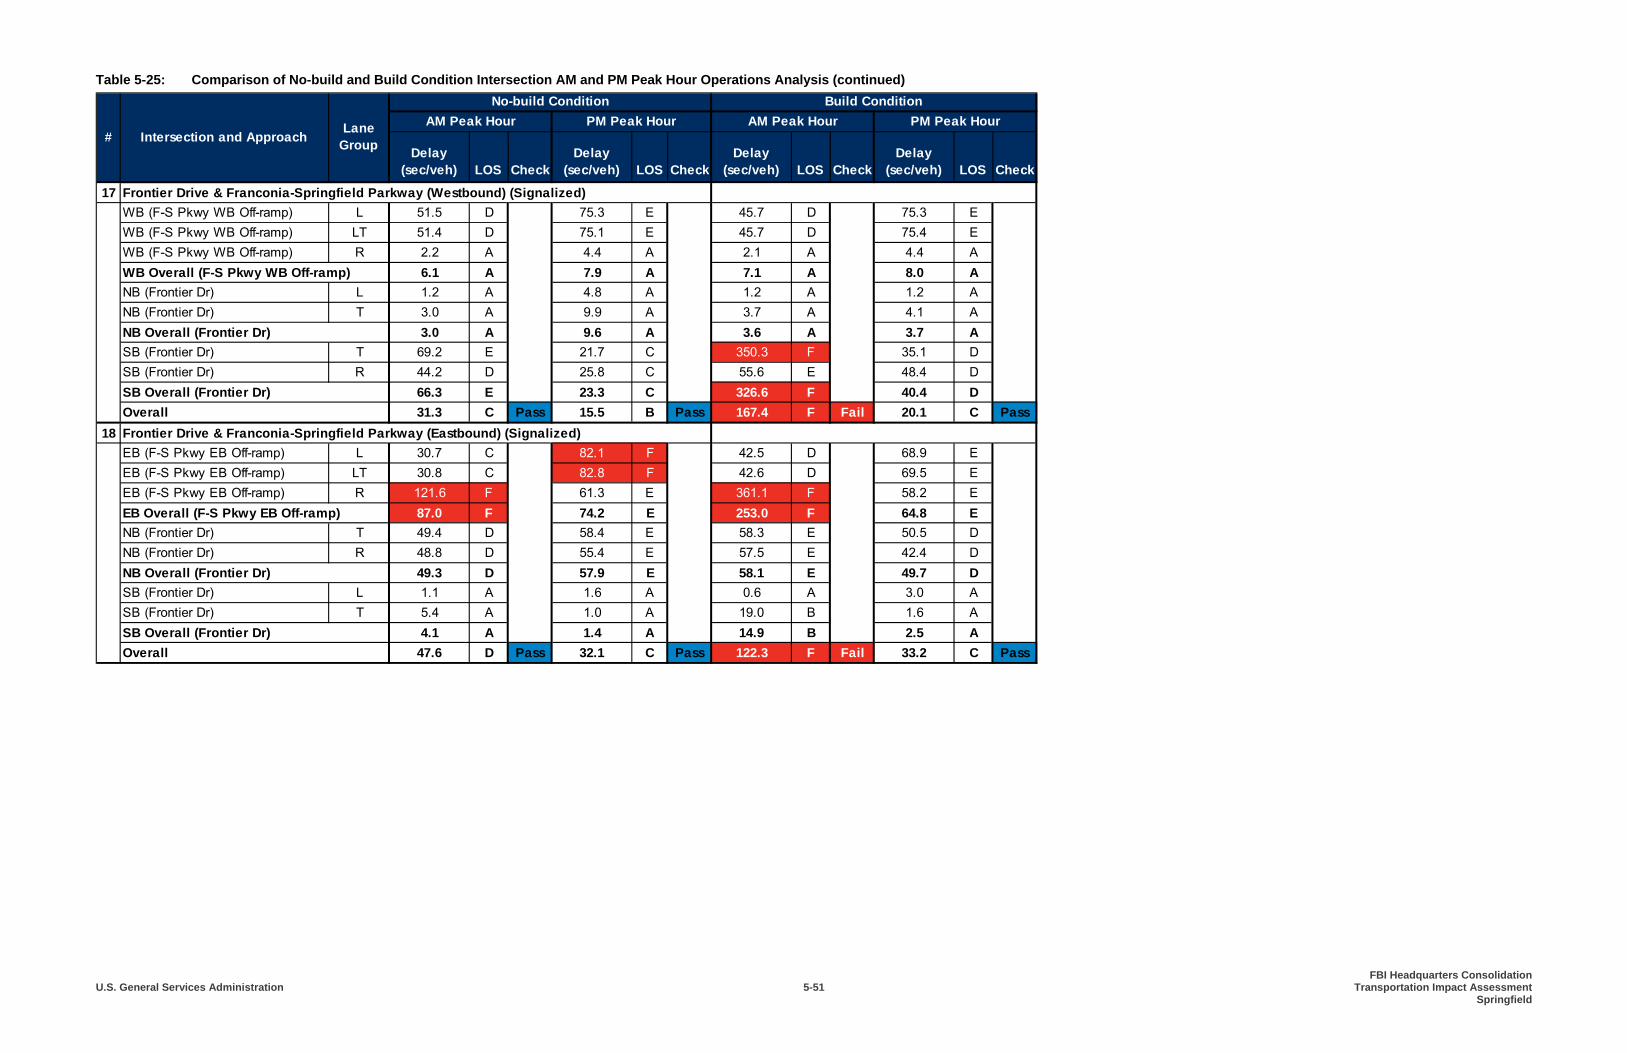


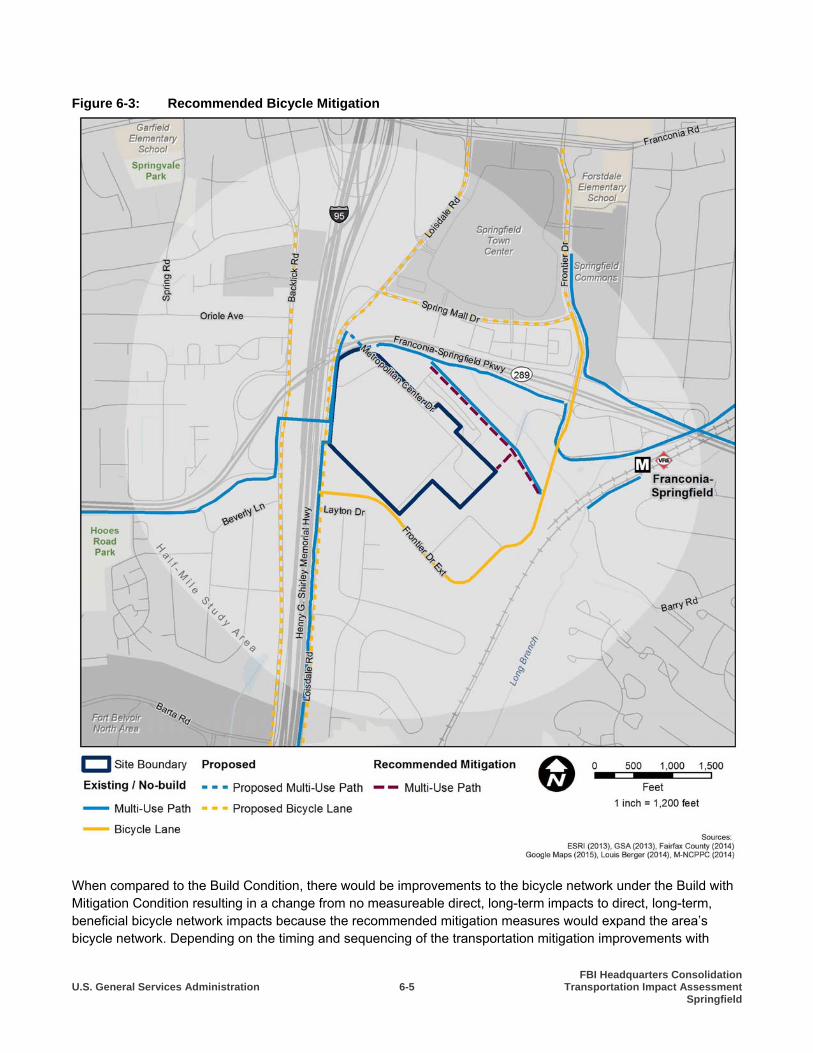


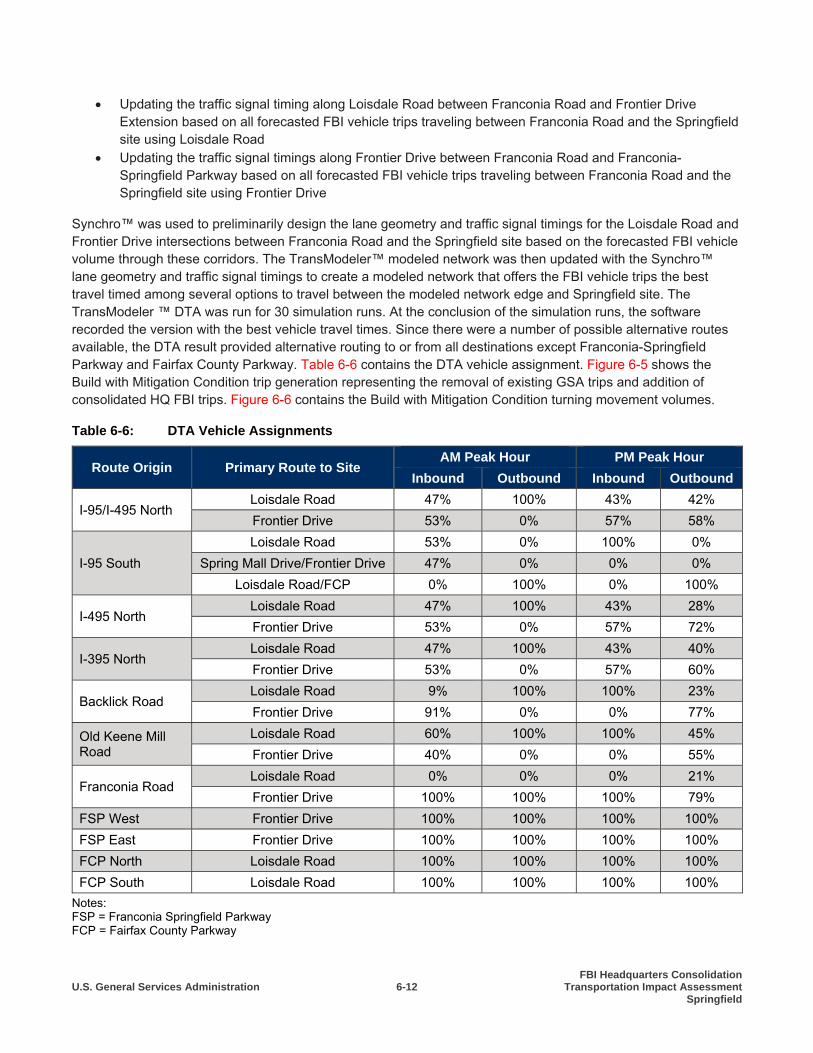


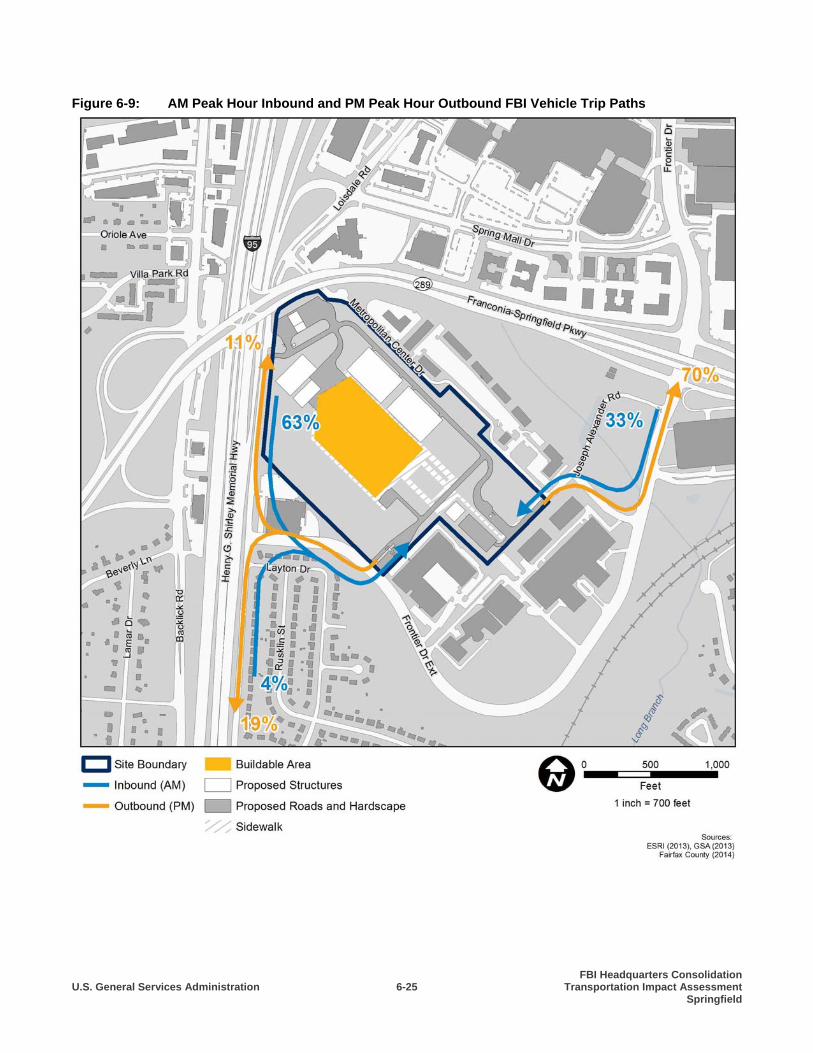


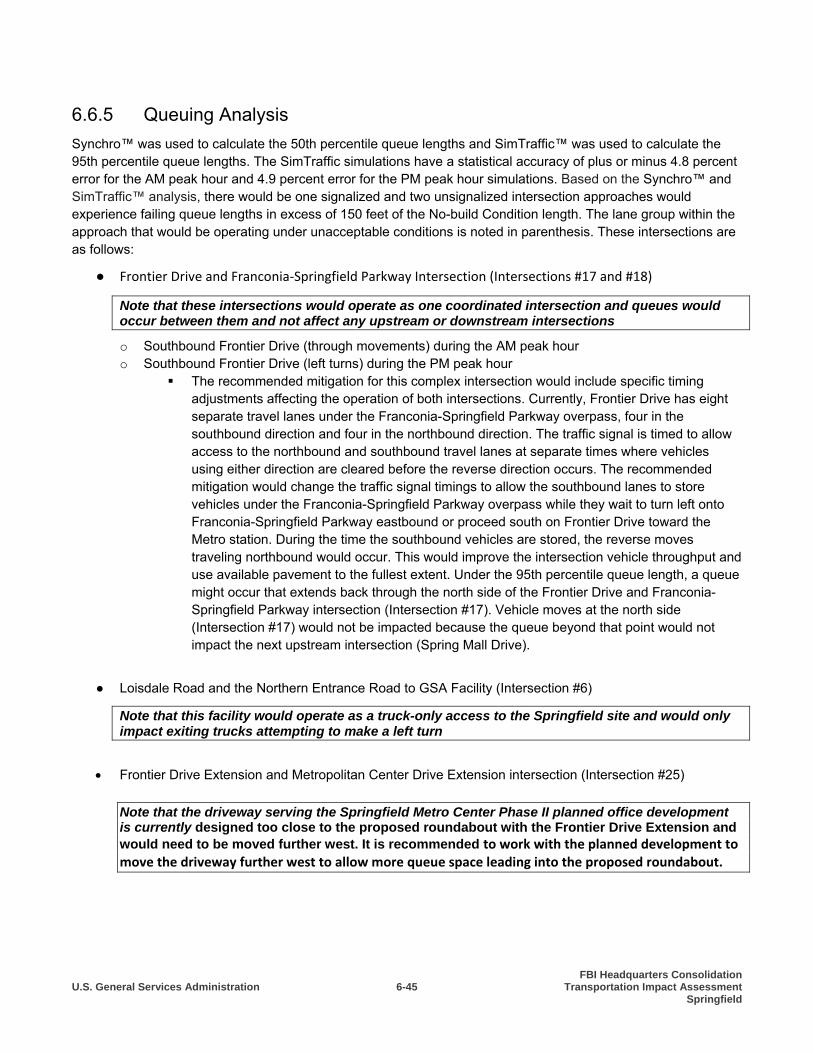
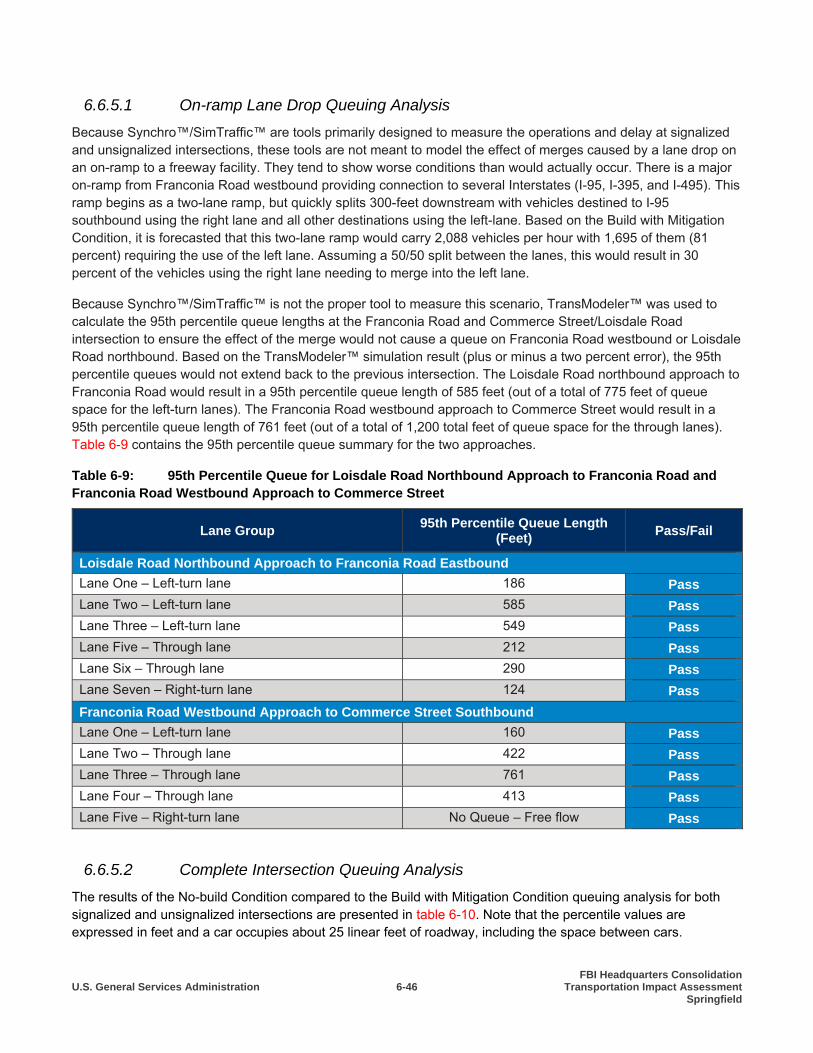
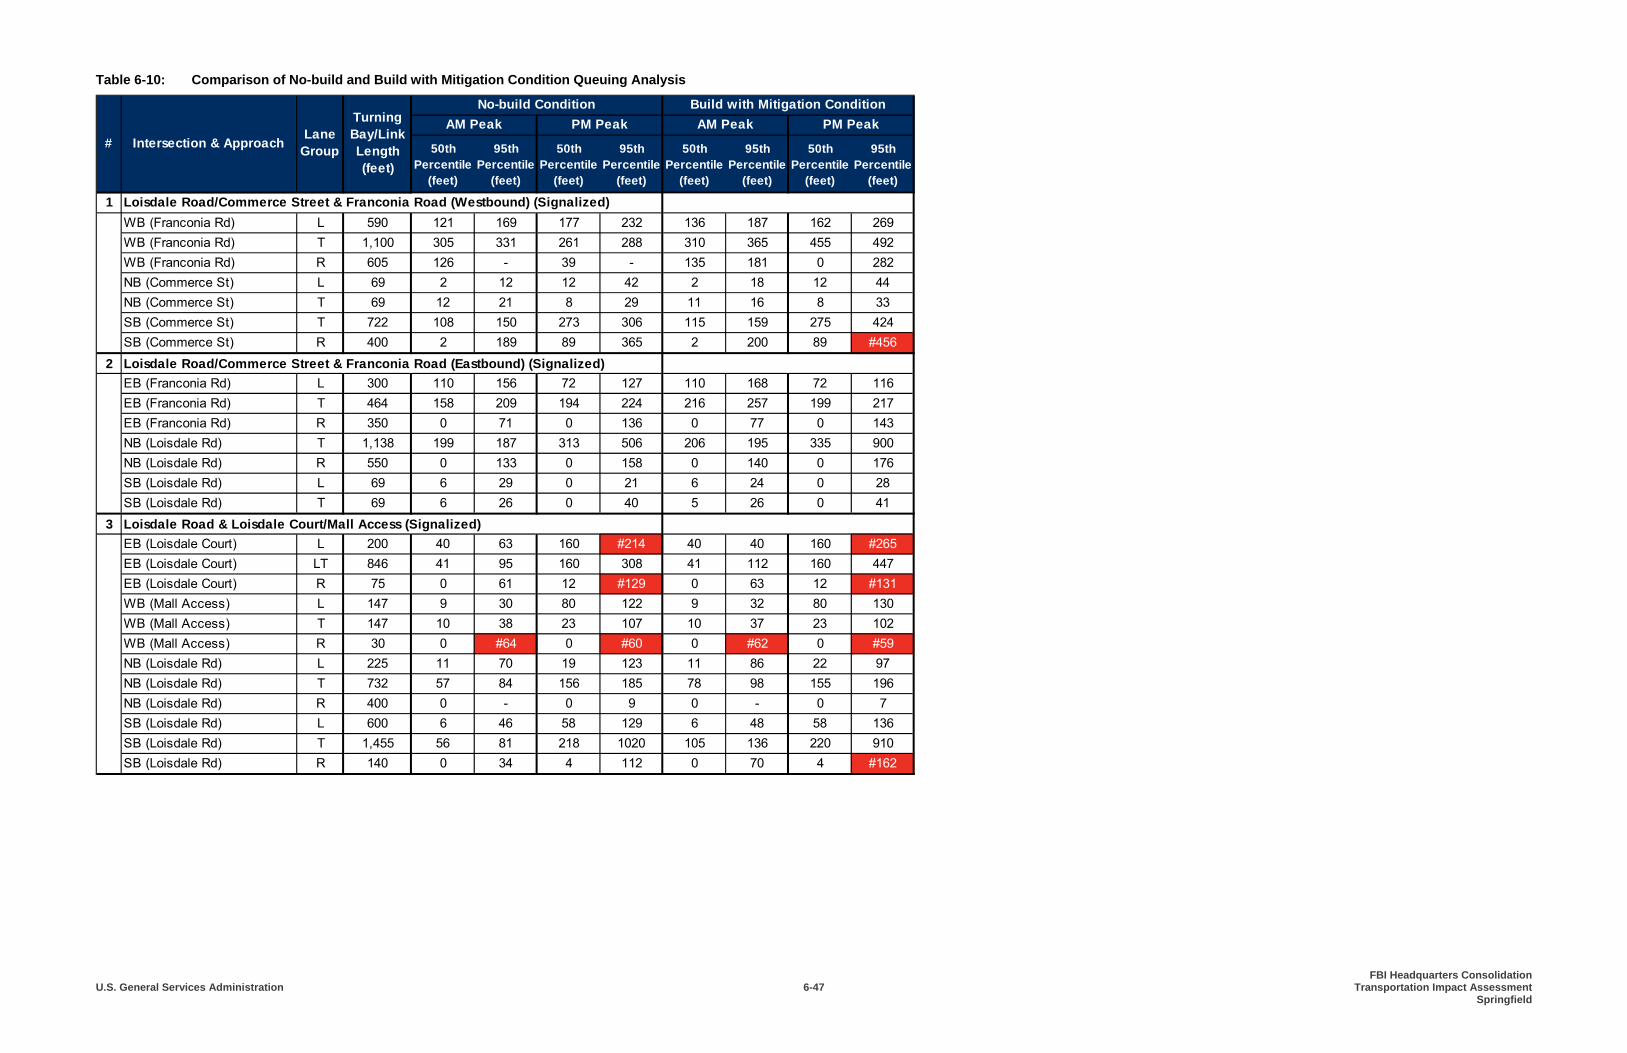


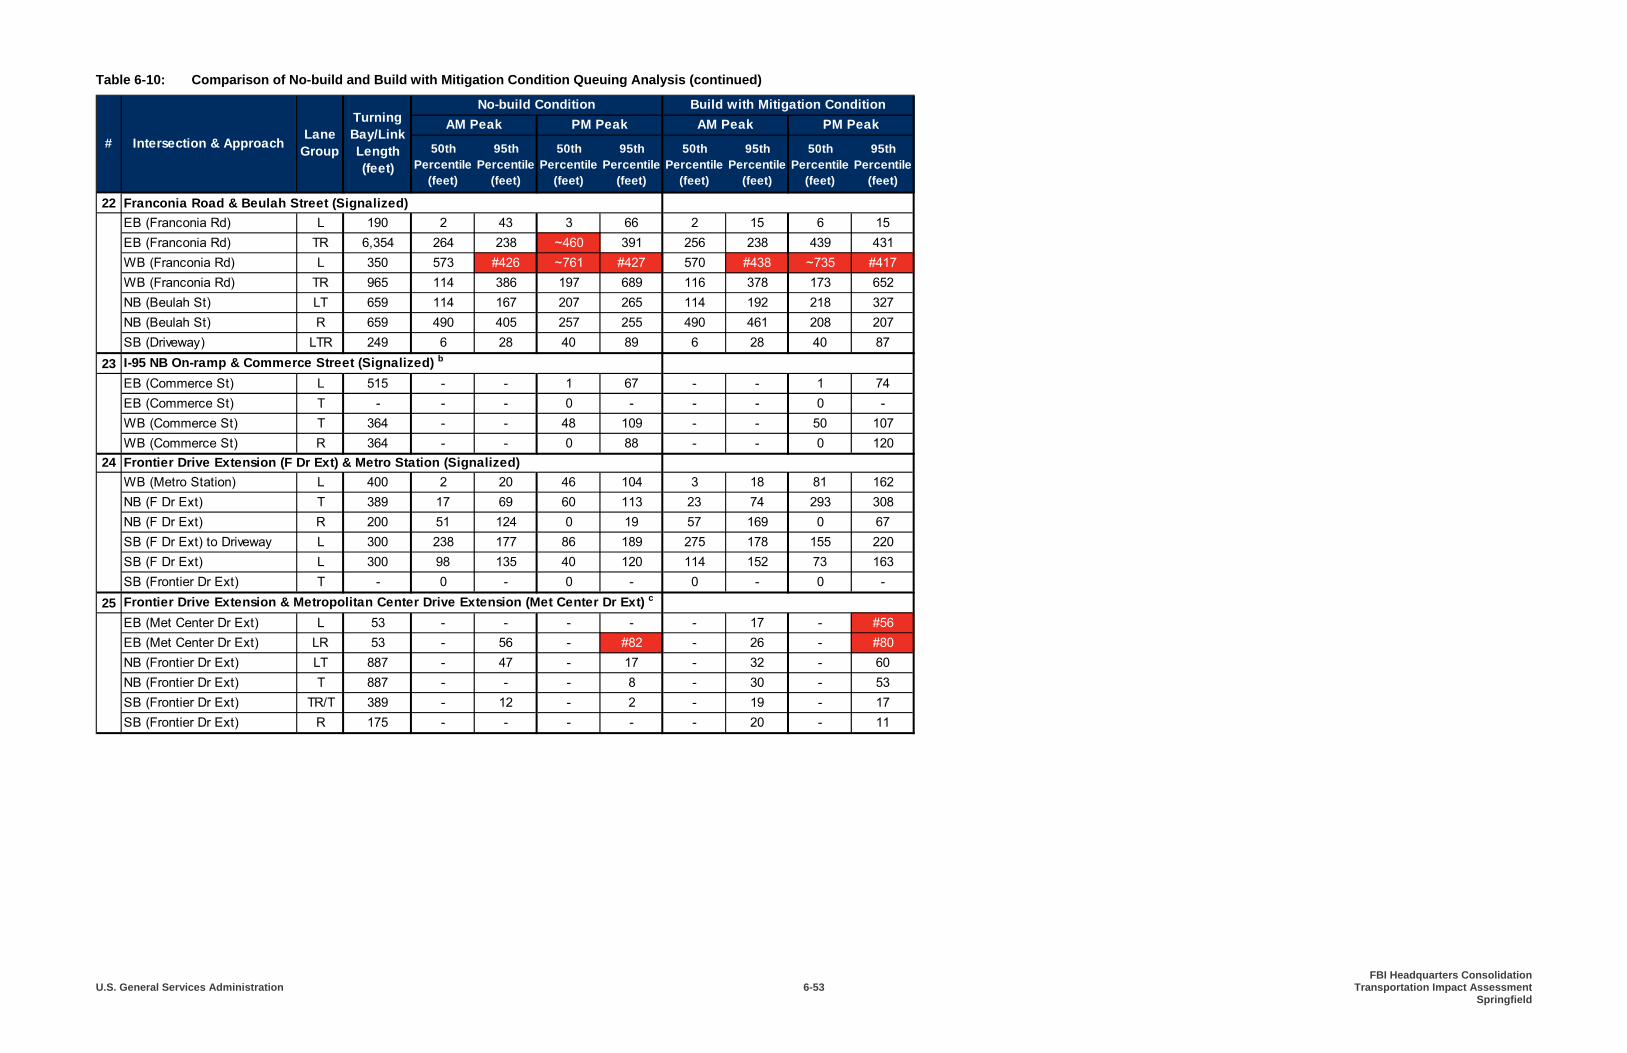


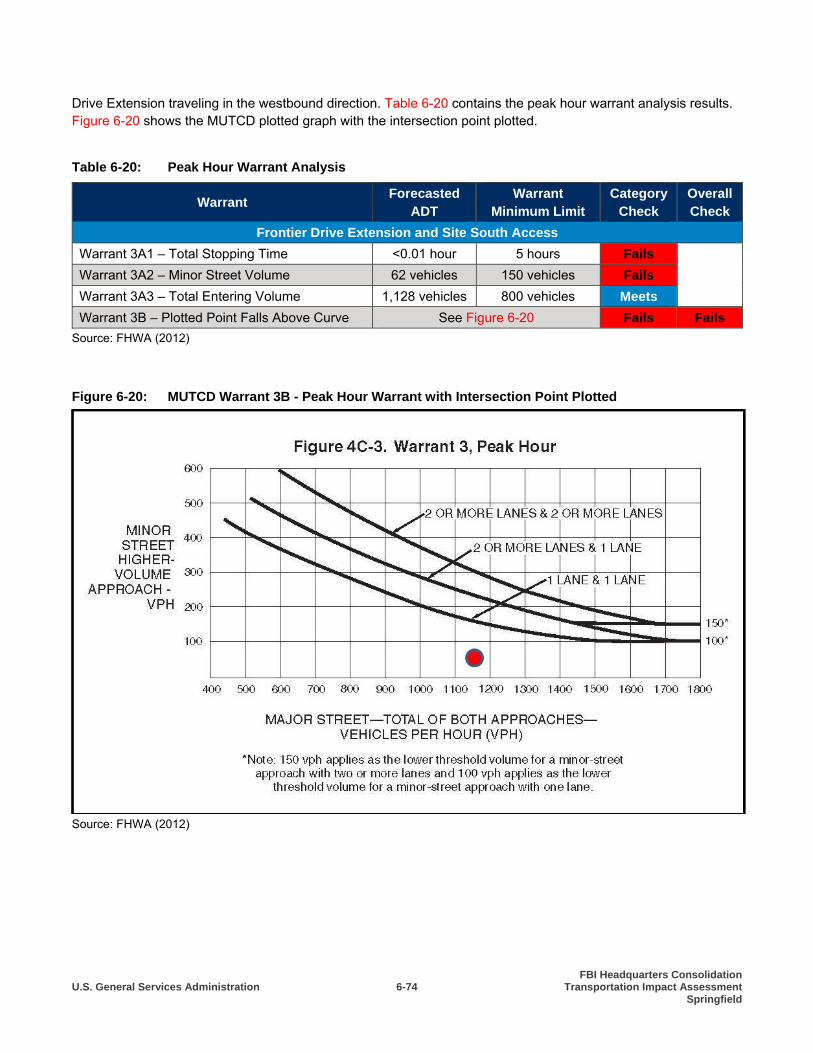


![Untitled-1 []€¦ · Potenzfunktionen mit negativen Exponenten Untitled-1.nb . 4 Untitled-1.nb. Untitled-1.nb 5](https://static.documents.pub/doc/80x56/605b197ad57d6d08187081fc/untitled-1-potenzfunktionen-mit-negativen-exponenten-untitled-1nb-4-untitled-1nb.jpg)


