126
FDA Briefing Document Joint Meeting of Psychopharmacologic Drugs Advisory Committee and Drug Safety and Risk Management Advisory Committee October 31, 2017

FDA Briefing Document
Joint Meeting of Psychopharmacologic Drugs Advisory Committee and Drug Safety and Risk Management Advisory Committee
October 31, 2017

DISCLAIMER STATEMENT
The attached package contains background information prepared by the Food and Drug Administration (FDA) for the panel members of the Advisory Committee. The FDA background package often contains assessments and/or conclusions and recommendations written by individual FDA reviewers. Such conclusions and recommendations do not necessarily represent the final position of the individual reviewers, nor do they necessarily represent the final position of the Review Division or Office. We have brought NDA 209819, buprenorphine controlled release injection submitted by Indivior Inc., to this Advisory Committee in order to gain the Committee’s insights and opinions, and the background package may not include all issues relevant to the final regulatory recommendation and instead is intended to focus on issues identified by the Agency for discussion by the advisory committee. The FDA will not issue a final determination on the issues at hand until input from the advisory committee process has been considered and all reviews have been finalized. The final determination may be affected by issues not discussed at the advisory committee meeting.


Food and Drug Administration CENTER FOR DRUG EVALUATION AND RESEARCH Division of Anesthesia, Analgesia, and Addiction Products
MEMORANDUM
DATE: October 3, 2017 FROM: Sharon Hertz, M.D., Division Director
Division of Anesthesia, Analgesia, and Addiction Products TO: Chair, Members, and Invited Guests, Psychopharmacologic Drugs
Advisory Committee (PDAC), and Drug Safety & Risk Management Advisory Committee (DSARM)
RE: Overview of the October 31, 2017 PDAC/DSARM Joint Meeting on
NDA 209819 for RBP-6000 (buprenorphine injectable) for treatment of opioid dependence
At this meeting of the Psychiatric Drugs Advisory Committee and Drug Safety & Risk Management Advisory Committee, we will be discussing a new drug application (NDA) 209819 for RBP-6000 (buprenorphine injectable) submitted by Indivior Pharmaceuticals, Inc., for the treatment of opioid dependence. During this meeting, representatives from the Agency and the Applicant will present:
• Data from the clinical trials performed to assess the safety and efficacy of RBP-6000 in the treatment of opioid-dependent patients. The data efficacy data derive from two studies:
o An inpatient behavioral pharmacology study intended to establish the ability of RBP-6000 to completely block the effects of an exogenous opioid.
o A randomized, placebo-controlled, parallel group study of 6-months duration.
• The Applicant’s proposed Risk Evaluation and Mitigation Strategy (REMS).
4
Following these presentations, you will be asked to assess these findings and to discuss the adequacy of the data to support approval of RBP-6000.
We will ask the committee to discuss whether the data from the clinical trial, taken together with the results of the blockade study, provide substantial evidence of effectiveness of RBP-6000 for the treatment of opioid use disorder in patients who had undergone induction with a transmucosal buprenorphine product.
The plasma exposures associated with RBP-6000 in the 300 mg monthly dose, after several months of dosing, exceed those associated with the highest labeled dose of the reference product, Subutex. We will ask the committee to discuss whether the provided safety data sufficiently support the use of the 300 mg/300 mg regimen, and to discuss the role of that regimen, given the similarity in efficacy results between the RBP-6000 300/300 mg and RBP- 6000 300/100 mg.
We will ask the committee to discuss whether the potential adverse consequences from intravenous self-administration require additional risk mitigation beyond labeling, and, if so, whether the Sponsor’s proposed risk evaluation and mitigation strategy (REMS) is sufficient. We will ask you to identify any concerns about the impact these proposals may have on patient access.
The Division and the Agency are grateful to the members of the committee and our invited guests for taking time from your busy schedules to participate in this important meeting. Thank you in advance for your advice, which will aid us in making the most informed and appropriate decision possible.
5

Summary of Efficacy and Safety
1 Executive Summary ............................................................................................................................. 11
Introduction and Background ............................................................................................................. 13 2
2.1 FDA-Approved Products for the Treatment of Opioid Dependence .......................................... 15
2.2 Rationale for Product Development ........................................................................................... 15
2.3 Clinical Development of RBP-6000 ............................................................................................. 17
2.4 Considerations from other injectable products used in outpatients ......................................... 19
Clinical Pharmacology ......................................................................................................................... 19 3
3.1 Single dose bioavailability ........................................................................................................... 20
3.2 Multiple-dose information .......................................................................................................... 22
3.3 Norbuprenorphine/buprenorphine exposure ratio .................................................................... 26
3.4 Hepatic and Renal Impairment ................................................................................................... 26
3.5 Drug-interactions ........................................................................................................................ 26
3.6 Exposure-Response Analyses ...................................................................................................... 27
3.7 Summary of clinical pharmacology findings: .............................................................................. 34
Non-Clinical Toxicity ............................................................................................................................ 35 4
Review of Efficacy ............................................................................................................................... 35 5
5.1 Blockade study (RB-US-13-0002) ................................................................................................ 35
5.1.1 Design and Endpoints.......................................................................................................... 35
5.1.2 Population ........................................................................................................................... 38
5.1.3 Statistical Methodologies.................................................................................................... 40
5.1.4 Results and Conclusions ...................................................................................................... 40
5.2 Efficacy Study ( RB-US-13-0001) ................................................................................................. 42
5.2.1 Study Design and Endpoints ............................................................................................... 42
6

5.2.2 Demographics and Disposition ........................................................................................... 43
5.2.3 Statistical Methodologies.................................................................................................... 45
5.2.4 Results and Conclusions ...................................................................................................... 45
5.3 Discussion .................................................................................................................................... 49
Review of Safety .................................................................................................................................. 50 6
6.1 Major Safety Results ................................................................................................................... 56
6.1.1 Deaths ................................................................................................................................. 56
6.1.2 Serious Adverse Events ....................................................................................................... 57
6.1.3 Adverse Events Leading to Discontinuation ....................................................................... 62
6.1.4 Common Adverse Events: ................................................................................................... 66
6.1.5 AEs of Special Interest ......................................................................................................... 68
6.2 Safety Summary .......................................................................................................................... 81
Risk Mitigation Strategy ...................................................................................................................... 83 7
7.1 REMS Background Information ................................................................................................... 83
7.2 Existing REMS for Similar Products ............................................................................................. 85
7.3 Risk Management Considerations .............................................................................................. 86
7.3.1 Applicant’s REMS Proposal ................................................................................................. 86
7.3.2 Agency REMS Proposal ....................................................................................................... 88
7.4 Discussion .................................................................................................................................... 89
Discussion and Points for Consideration ............................................................................................ 89 8
Appendix A: Legal and Regulatory Issues Constraining Buprenorphine Treatment ........................... 90 9
Appendix B: Common Adverse Events in buprenorphine studies from approved labeling ........... 91 10
7

Figures
Figure 1: Mean (±SD) Buprenorphine Plasma Concentrations versus Time Day 1 to Day 28 ................... 20
Figure 2: Mean Plasma Concentrations of Buprenorphine after a single dose of RBP-6000 300 mg ........ 21
Figure 3: Visual Predictive Check for the PK/PD Model Relating Whole-Brain Mu-Opioid ........................ 28
Figure 4: Observed and Model Predicted Changes in Agonist Effect Following Administration of 24 mg Hydromorphone, Observed and Model Predicted Mean Withdrawal Symptoms, and Observed and Model Predicted Buprenorphine Plasma Concentration in Relation to Mu-Opioid Receptor Availability 29
Figure 5: Observed Differences in Drug Liking from Placebo and Mean Predicted Mu-Opioid Receptor Occupancy as a Function of Buprenorphine Plasma Concentration After the 18 mg Hydromorphone Challenge..................................................................................................................................................... 30
Figure 6: Relationship Between the Proportion of Subjects with Negative Opioid Use and ..................... 31
Figure 7: Predicted Decrease in Buprenorphine Plasma Concentrations for the 300 mg/300 mg and 300 mg/100 mg Dosing Regimens of RBP-6000 after the Last SC Injection ...................................................... 32
Figure 8: Study Schematic for opioid blockade study ................................................................................. 37
Figure 9: Mean scores for 6 VAS assessments by hydromorphone challenge dose for Opioid Blockade Study ........................................................................................................................................................... 40
Figure 10: Cumulative Distribution Function of Percentage Abstinence.................................................... 45
Figure 11: Urine Opioid Screen Results for Individual Subjects .................................................................. 47
Figure 12: CDF of the Percentage Abstinence for Subjects by Tapering Status ......................................... 49
Figure 13: Buprenorphine Plasma concentration time profile in Subject 001-0210 ................................ 59
Tables
Table 1: Currently available treatments for opioid use disorder or opioid dependence ........................... 15
Table 2: Single dose 100 mg RBP-6000 pharmacokinetic parameters (Cohort 2: 100 mg) ...................... 20
Table 3: Dose proportionality assessment after 50, 100 and 200 mg RBP-6000 SC single dose injection 21
Table 4: Single-dose RBP-6000 300 mg pharmacokinetic parameters ....................................................... 22
Table 5: Observed steady-state buprenorphine concentrations from lead-in sublingual Subutex before first RBP-6000 injection of 100 and 300 mg dose ....................................................................................... 23
8

Table 6: Observed buprenorphine concentrations after first, fourth and sixth RBP-6000 subcutaneous injections for 100 and 300 mg doses .......................................................................................................... 23
Table 7: Buprenorphine Cavg comparison between 100 and 300 mg RBP-6000 SC injections and “lead-in” Subutex SL tablet daily administration .................................................................................................. 24
Table 8: Buprenorphine Cmax comparison between 100 and 300 mg RBP-6000 SC injections and “lead-in” Subutex SL tablet daily administration .................................................................................................. 24
Table 9: Buprenorphine Cmin comparison between 100 and 300 mg RBP-6000 SC injections and “lead-in” Subutex SL tablet daily administration .................................................................................................. 25
Table 10: Summary of Demographic (Safety population in Opioid blockade study Summary of Demographics (Safety Population) ............................................................................................................. 39
Table 11: Summary of Demographics and Baseline Characteristics ........................................................... 43
Table 12: Subject Disposition ...................................................................................................................... 44
Table 13: Cumulative Percentage Abstinence from Weeks 5 to 24 ........................................................... 46
Table 14: Urine results vs TLFB Week 5 to Week 24 (Excluding site 20) .................................................... 48
Table 15: Safety database for RBP-6000 (RBP-6000) ................................................................................. 51
Table 16: Injections received by treatment group in Phase 3 studies ........................................................ 51
Table 17: Cumulative treatment exposure by treatment group in Phase 3 studies .................................. 53
Table 18: Cumulative exposure by dose level in Phase 3 studies .............................................................. 53
Table 19: Baseline Demographic for Phase 3 DB study (13-0001) ............................................................ 54
Table 20: Baseline Demographic for Phase 3 open-label, long term safety study (13-0003) .................... 54
Table 21: Baseline medical history in Phase 3 studies ............................................................................... 56
Table 22: BMI Distribution at baseline in Phase 3 studies ........................................................................ 56
Table 23: SAEs summary in Phase I and II studies ..................................................................................... 58
Table 24: SAEs summary for Phase 3 studies.............................................................................................. 60
Table 25: SAEs summary for thromboembolic disorder ............................................................................. 62
Table 26: TEAEs leading to drug discontinuation in Phase 3 studies ......................................................... 64
Table 27: TEAEs leading to drug dose reduction in Phase 3 open-label study (13-0003) ......................... 65
9

Table 28: TEAEs at least overall 2% occurrence in Phase 3 DB, controlled study (13-0001) .................... 67
Table 29: Common TEAEs more than 2% occurrence in RBP-6000 treatment group in Phase 3 studies .. 67
Table 30: TEAEs related to injection site injuries in Phase 3 studies .......................................................... 70
Table 31: TEAEs related to injection site injuries by action on study treatment in Phase 3 studies .......... 71
Table 32: Reported hepatic injuries by action on study treatment in Phase 3 studies .............................. 74
Table 33: Reported hepatic injuries by severity in Phase 3 studies ............................................................ 75
Table 34: Subjects with LFT values greater than upper limit of normal in Phase 3 DB study (13-0001) .. 76
Table 35: Subjects with LFT values greater than upper limit of normal in Phase 3 open-label study (13-0003) ........................................................................................................................................................... 77
Table 36: TEAEs related to cardiac disorder in Phase 3 studies ................................................................ 79
Table 37: TEAEs related to pancreatitis topic in Phase 3 studies ............................................................. 81
Table 38: Common adverse events in Buprenorphine studies from approved labeling ............................ 92
10

Executive Summary 1RBP-6000 is a single entity drug-device combination product with 18% (weight/weight) buprenorphine base in the ATRIGEL Delivery System and is designed to be subcutaneously injected in the abdominal area once monthly. The ATRIGEL Delivery System has been used by other FDA approved products such as ELIGARD which is indicated for the palliative treatment of advanced cancer. RBP-6000 is intended for the treatment of moderate to severe opioid use disorder (OUD) in patients who have undergone induction to suppress opioid withdrawal signs and symptoms with a transmucosal buprenorphine-containing product. The product should be used as part of a complete treatment plan to include counselling and psychosocial support. RBP-6000 has a number of novel features. If approved, it would be the first once-monthly injectable buprenorphine product indicated for the treatment of opioid use disorder. Secondly, it would be the first buprenorphine product designed to achieve a target plasma concentration sufficient to occupy more than 70% of μ-opioid receptors and therefore block exogenous opioids which is believed to be important in effectively treating OUD1,2.
Indivior, the Applicant, has provided efficacy data from a single multiple-center, double-blind, placebo-controlled, 24-week efficacy and safety study. Subjects who completed this study could be enrolled into a long-term safety extension study. To determine the doses for the pivotal study, an inpatient blockade study was conducted to identify the dose regimen required to block exogenous opioids using hydromorphone challenge tests and the identified blocking doses subsequently were used for the pivotal efficacy study. Two dose regimens (RBP-6000 300 mg x 6 doses (300/300 mg) and RBP-6000 300 mg x 2 doses followed by 100 mg x 4 doses (300/100 mg) were tested in the pivotal study. The study population was treatment-seeking patients with moderate-to-severe opioid use disorder as defined by DSM-V diagnosis. After screening, eligible subjects underwent a 2 week, open-label run-in, including an induction phase with Suboxone SL film for 3 days and a 4- to 11-day dose-adjustment period to achieve doses ranging from 8 to 24 mg/day. Subjects who met randomization criteria were randomized into four groups to receive RBP-6000 (two doses) or placebo (two volume-matched doses) treatment for 24 weeks under double-blind conditions. The primary efficacy endpoint was the cumulative distribution function of the percentage weeks of abstinence measured by weekly UDS (Urine Drug Screen) negative for opioids and self-reports negative for illicit opioid from week 5 through 24. A key secondary endpoint was treatment success, where a responder was defined as any subject with ≥ 80% of urine samples negative for opioids combined with self-
1 Greenwald, M. K., Comer, S. D., & Fiellin, D. A. (2014). Buprenorphine maintenance and mu-opioid receptor availability in the treatment of opioid use disorder: implications for clinical use and policy. Drug and alcohol dependence, 144, 1-11. 2 Greenwald, M. K., Johanson, C. E., Moody, D. E., Woods, J. H., Kilbourn, M. R., Koeppe, R. A., ... & Zubieta, J. K. (2003). Effects of Buprenorphine Maintenance Dose on [mu]-Opioid Receptor Availability, Plasma Concentrations, and Antagonist Blockade in Heroin-Dependent Volunteers. Neuropsychopharmacology, 28(11), 2000
11

reports negative for illicit opioid use between Week 5 and Week 24. Self-reports of illicit opioid use were obtained from Timeline Follow back (TLFB) interviews.
The committee will be asked to consider whether the data from the clinical trial, taken together with the results of the blockade study, provide substantial evidence of effectiveness of RBP-6000 for the treatment of opioid use disorder in patients who had undergone induction with a transmucosal buprenorphine product and whether there is a significant difference in the effectiveness between the two dose regimens tested, RBP-6000 300/300 mg and RBP-6000 300/100 mg.
Safety data were collected from 848 subjects who received RBP-6000 300/300 mg or RBP-300/100 mg or RBP-6000 300/Flex mg SC injection in the Phase 3 double-blind, efficacy and safety study and the Phase 3 open-label, long-term safety study. The overall safety experience is consistent with the safety profile of transmucosal buprenorphine products indicated for the treatment of opioid use disorder. The local injection tolerability is consistent with other approved products using the ATRIGEL Delivery System. However, it appears that RBP-6000 300/300 mg was less tolerated as overall there were more discontinuations due to adverse events when compared to the RBP-6000 300/100 mg group. The most common drug related TEAEs leading to drug discontinuation included elevated liver enzymes, injection site reactions, sedation, constipation, somnolence, lethargy, and drug withdrawal syndrome. A total of 49 (7.3%) subjects required dose reduction from 300 mg to 100 mg due to TEAEs in the Phase 3 open-label study (13-0003). Most common TEAEs leading to drug dose reduction included abnormal liver function tests, sedation, constipation, nausea, fatigue and headache. The committee will be asked to consider whether the safety profiles were adequately characterized for both RBP-6000 300/300 mg and RBP-6000 300/100 mg regimens from the safety data provided by the Applicant.
The product was administered by a health care provider in a clinical setting during the clinical development period. There are no data involving self-administration of the product by the patient. If patients were to have access to the product, there is a risk they might improperly self-administer the product via IV route, which might cause life-threatening consequences. Therefore, the product is intended to be administered by a health care provider in a clinical setting. The Applicant has proposed a restricted distribution system to prevent the product from being in the hands of the patient prior to administration. The committee will be asked to address whether this concern, or any additional safety concerns, have been adequately addressed by the existing safety data, and can be adequately managed under the proposed risk evaluation and mitigation strategy (REMS).
12

Finally, the committee will be asked whether the efficacy data are sufficient to outweigh the risks associated with this novel product and if both treatment regimens (RBP-6000 300/300 mg and RBP-6000 300/100 mg) should be approved.
Introduction and Background 2Buprenorphine is a partial agonist at the mu-opiate receptor. A parenteral formulation of buprenorphine was approved in 1981 for the treatment of pain, and two sublingual tablet formulations were approved in 2002 for the treatment of opioid dependence. A sublingual film formulation was approved in 2010. Two other transmucosal formulations have subsequently been approved. Additionally, an implantable buprenorphine product delivering a low to moderate dose of buprenorphine was approved in 2015 for stable patients for whom the dose is adequate. Approximately 12.2 million prescriptions from outpatient retail pharmacies were dispensed and approximately 1.6 million patients received a dispensed prescription for buprenorphine tablets or film during 2016. Primary care physicians accounted for 39% of dispensed prescriptions, followed by psychiatrists (21%), osteopaths (14%), emergency physicians (4%) and anesthesiologists (4%). Recently, the authority to prescribe buprenorphine for office-based treatment of OUD was expanded to include Nurse Practitioners and Physician’s Assistants, so the distribution of specialties may be expected to change in the future.
Buprenorphine was developed as a treatment for opioid dependence because some of its pharmacological properties suggested it could serve as a safer alternative to methadone, a full agonist at the mu-receptor. Like methadone, buprenorphine’s activity at the mu-receptor was expected to relieve patients’ urge to use illicit opioids, and like methadone, the long duration of action would allow patients to achieve a steady state with daily dosing, without the alternating highs and lows associated with opioid abuse that impair daily functioning. At sufficiently high doses, buprenorphine blocks full opioid agonists from achieving their full effects, deterring abuse of these substances for buprenorphine-maintained patients. However, compared to methadone, buprenorphine is less likely to cause life-threatening respiratory depression and was therefore expected to be more suitable for take-home use.
Due to its partial agonist properties, the euphorigenic effects of buprenorphine are understood to reach a “ceiling” at moderate doses, beyond which increasing doses of the drug do not produce the increased effect that would result from full opioid agonists. This was expected to limit its attractiveness as a drug of abuse, an additional feature permitting take-home use.
In addition, when a partial agonist displaces a full agonist at the receptor, the relative reduction in receptor activation can produce withdrawal effects. Individuals dependent on full agonists may therefore experience sudden and severe symptoms of withdrawal if they use buprenorphine. This was predicted to serve as a further deterrent to abuse.
13

Unfortunately, despite these features, buprenorphine sublingual products have been increasingly identified in the illicit drug market, and it is known that they are diverted, abused, and misused. Additionally, they have been implicated in a number of cases of accidental poisonings in children (see Pediatric Buprenorphine Exposures and Outcomes ). Therefore, a depot injection or an implantable product which would be difficult to divert or abuse and less likely to be accidentally ingested by children, offers potential advantages. In addition, if a depot or implantable product provided a sufficient plasma level of buprenorphine to block the effects of exogenous opioids, the nature of the product would enforce compliance so that patients could not periodically discontinue use in order to allow the blocking effect to dissipate and experience the effects of their opioids of choice.
14

2.1 FDA-Approved Products for the Treatment of Opioid Dependence Table 1: Currently available treatments for opioid use disorder or opioid dependence
Daily Products Generic/Chemical Name Trade Name Sponsor Dosage form(s)
Buprenorphine/naloxone Suboxone tablet (generics only) Indivior Sublingual tablet
Suboxone film (also generics) Indivior Sublingual film
Bunavail (also generics) Biodelivery Sci Intl Buccal film
Zubsolv (also generics) Orexo AB Sublingual tablet
Buprenorphine Subutex (generics only ) Indivior Sublingual tablet
Methadone HCl Methadose (also generics) Mallinckrodt Oral solution
Bulk powder Tablet Dispersible tab
Methadone HCl Dolophine (also generics) Roxane Tablet
Oral concentrate Oral solution Naltrexone HCl ReVia (also generics) Duramed Tablet
Modified release Products
Naltrexone HCl Vivitrol Alkermes Injectable suspension
Buprenorphine Probuphine Braeburn (Previously Titan) Implant
Other approved products for the treatment of opioid dependence include buprenorphine oral transmucosal formulations; a buprenorphine implant; methadone and levomethadyl acetate (LAAM, no longer marketed), both of which are full agonist treatments; and naltrexone (oral and depot formulations), an opioid antagonist. Treatment of addiction with methadone is limited to closely-regulated Opioid Treatment Programs (OTP), which may limit access to treatment. Buprenorphine treatment may be prescribed by specially-qualified Health Care Providers in office practice settings. (See Appendix A.)
2.2 Rationale for Product Development
15

A number of factors have spurred the development of long-acting depot formulations of buprenorphine. These include
• Growing public health concern about abuse, misuse, and accidental pediatric exposure associated with transmucosal buprenorphine products
• Patient concerns about convenience, privacy, and security related to daily dosing with buprenorphine
• The desire for a formulation that provides enforced compliance with doses adequate to achieve blockade of exogenous opioids and to accomplish extinction of illicit drug use.
The underlying assumption for the development of this injectable depot was that the product will be administered by a health-care provider (HCP) and cannot be removed, and therefore will not be available for misuse or abuse, will not expose others, including children, in the household to accidental exposures and poisonings, and will address issues of deliberate or accidental non-adherence with the prescribed dose by the patient. However, these features are not inherent to the product itself. Many injectable medications are distributed directly to patients, either for self-administration or for them to bring to their HCP for injection. Certain injectable rheumatology drugs are routinely self-administered, and the development programs for such products include patient self-administration in the clinical trials. In some states, HCP offices and clinics are not permitted to store medication on-site and the usual procedure for HCP-administered products is for patients to pick up their medication at the hospital pharmacy or retail outlet and bring it to the HCP for administration. This includes medications such as long-acting injectable antipsychotics, and biologic agents which must be infused intravenously under supervision and which are not intended for self-administration at all.
Therefore, although it is clear that, once administered, a depot formulation of buprenorphine has a number of advantages, if the medication was dispensed or shipped to the patient there are opportunities for abuse, misuse, accidental poisonings, theft, and non-adherence to occur. All of these risks occur with the transmucosal products which are routinely dispensed for at-home self-administration. In addition, the injectable product has some additional risks. The packaging (a prefilled syringe with a needle) may invite misuse by injection, particularly in patients already accustomed to intravenous drug use. Because the pharmacokinetics of subcutaneous injection may not be optimally reinforcing, there is a risk that patients would administer the product intravenously. It is not known what the consequence of this route of misuse would be; it may be anticipated that the risks would include venous occlusion, emboli, and other adverse consequences.
16

2.3 Clinical Development of RBP-6000 This program was undertaken with advice from the Division. Indivior was advised to target a plasma buprenorphine level that completely blocked the effects of exogenous opioids at clinically-relevant doses. A study showing this effect, taken together with compelling results from a single outpatient controlled clinical trial showing the efficacy of the product in treating patients with opioid dependence could potentially be considered, taken together, as substantial evidence of efficacy.
Indivior performed initial studies of receptor occupancy to determine the doses to evaluate in the blockade study. Having demonstrated the blockade effect of the 300 mg dose, Indivior then undertook a clinical study comparing six monthly doses of 300 mg vs two monthly doses of 300 mg with subsequent reduction to 100 mg, vs placebo in patients initially titrated to a stable dose with sublingual buprenorphine. This initial stabilization on daily-dosed medication prior to depot treatment is a customary approach to use of depot medications in other therapeutic areas.
The design and analysis of the blockade study were agreed to with the Division and the Controlled Substances Staff prior to the study. This is a somewhat novel study but employs customary approaches used in evaluations of human abuse liability.
The design and analysis of the outpatient clinical trial was also discussed and agreed upon prior to conduct. There is currently no standard approach to clinical trials in this therapeutic area. Previously approved products were supported by a variety of studies with treatment as long as 40 weeks, and various analytic approaches were applied in evaluating the results.
The Division has taken the position that analyses focused on group means (such as mean percent negative urine tests), which have been used in prior studies, are not the most clinically meaningful approach because they do not reflect the experience of individual patients, who might range from complete responders to complete non-responders. In discussing how individual response should be assessed, there has been considerable debate over whether endpoints focused on patients attaining complete abstinence from illicit drug use are realistic, and whether they are necessary to ensure that the drug yields clinical benefit. As described below, the responder definition used in this study does not necessarily reflect complete abstinence.
Several other features were incorporated into this program to address the difficulties of retaining patients in treatment and to address the concern that patients may be clinically successful despite occasional lapses in abstinence. These include the following:
• Less frequent urine testing
17

Historically, studies of opioid dependence treatment have incorporated thrice-weekly urine sampling. This frequency was identified as providing the best balance between detecting all use and avoiding false-positive tests due to “carry-over” positives, based on the time window of detection for heroin, which was the most commonly-used opioid in populations being studied when this approach was established. Additionally, this approach was not considered unduly burdensome because the treatments being evaluated were agonists that were administered in-clinic on a daily basis.
In studies of treatments that are not administered under supervision daily, or treatments that are not inherently reinforcing, it has been challenging to ensure complete collection of thrice-weekly samples. There has been concern that a study design with frequent sampling, along with an analytic strategy of imputing positive results to missing samples, creates an unrealistic situation in which even some clinically successful patients would be adjudicated as unsuccessful.
Indivior’s clinical studies employed weekly urine testing. This infrequent sampling inherently allows patients who are not fully abstinent to be adjudicated as successful, even if the definition of response is 100% negative samples, because some use will not be detected. We accept this for reasons of feasibility.
• A responder definition that allows a few missing or positive samples
The use of a responder definition that does not require all samples to be present and negative, particularly during a study with an infrequent sampling schedule introduces additional flexibility. The number or percent of allowable missing or positive samples was chosen taking into consideration the total number of samples to be collected. For example, “80% of samples negative” would be more compelling in a six-month study with thrice-weekly samples (58 negative samples) than in a study with once-monthly samples (4 negative samples). Indivior’s studies employed weekly testing.
• The incorporation of a “grace period” (assessments at the beginning of treatment which are not considered in the analysis) because patients may not respond immediately. Indivior’s studies considered the first four weeks to be a grace period.
• The use of a “continuous responder” analysis.
One compromise approach that the Division has proposed is to perform an analysis that considers the full range of responder definitions, from complete abstinence to no abstinence, but to emphasize the effect of the drug on promoting abstinence or near-abstinence. This approach, the continuous responder curve, or the cumulative distribution function (CDF) of drug use assessments, was employed in this program. The
18

continuous responder curve gives an overall picture of the drug’s effect on drug use behavior. Augmenting this analysis with a responder rate comparison ensures that the effect is of a magnitude that has clinical meaningfulness.
In Indivior’s study, there are weekly, scheduled, samples collected over 24 weeks. However, the first month is considered a “grace period” because patients may not respond immediately. A CDF of patient responses was the primary endpoint, and the secondary endpoint was a responder analysis. The responder definition agreed to was 80% negative. Therefore, a responder is defined as a patient who provides self-report and laboratory evidence of absence of illicit opioid use on 16 of 20 scheduled weekly visits. Such patients may have a number of undetected occasions drug use; however the ability to attend study visits and provide negative urine samples over a 24-week period is nevertheless an indicator of some degree of clinical stability.
2.4 Considerations from other injectable products used in outpatients Many drug products are intended for use by injection. Of these, there are a number that are only intended for use in a hospital setting, such as those used in general anesthesia, but in current medical practice, even intravenous antibiotics may be administered to patients at home, and patients may even be expected to self-administer them.
A number of injectable products are routinely distributed to patients for self-administration by injection. These include insulin, coumarin, various anti-rheumatologic biologic products, among others. These products are distributed to patients at retail pharmacies. Some biologic products intended for infusion are subject to REMS that address infusion reactions. However, there is no restriction of distribution as a component of these REMS.
There are other products, however, which, as a matter of standard medical practice, are not customarily dispensed via retail pharmacies and provided to patients for self-administration. Examples include depot neuroleptics, depot contraceptives, depot naltrexone, and vaccines. (In some states, vaccines may be administered by a pharmacist in a retail setting, but vaccines are not typically provided to the patient for self-administration.) Some of these products are subject to REMS to address product-specific safety concerns (e.g., post-injection somnolence; injection site reactions). However, none of these products has a REMS intended to prevent dispensing to the patient.
Clinical Pharmacology 3 The Clinical Pharmacology summary mainly focuses on the 100 and 300 mg RBP-6000 doses as per the proposed usual adult dosage for RBP-6000.
19

3.1 Single dose bioavailability Study RB-US-11-0020 evaluated pharmacokinetics for single dose of 50 mg, 100 mg, 200 mg RBP-6000 subcutaneous (SC) injection, and for single dose of 100 mg SC injection after buprenorphine sublingual stabilization or “lead-in” phase in subjects with opioid use disorder. After a single dose RBP-6000 100 mg SC injection (without buprenorphine sublingual stabilization or “lead-in” phase prior to SC injection), the buprenorphine peak was observed approximately 24 h post administration. Observed buprenorphine levels declined to a plateau until the end of the dosing interval (Day 28; Figure 1; Cohort 2, open-triangle symbol), indicating that buprenorphine is consistently released from the RBP-6000 during the dosing interval. Buprenorphine pharmacokinetic parameters are presented in Table 2
Figure 1 Mean (±SD) Buprenorphine Plasma Concentrations versus Time Day 1 to Day 28
SD = standard deviation Cohort 1 = a single SC injection of RBP-6000 containing 50 mg buprenorphine. Cohort 2 = a single SC injection of RBP-6000 containing 100 mg buprenorphine. Cohort 3 = a single SC injection of RBP-6000 containing 200 mg buprenorphine. Cohort 4 = QD dosing with SUBOXONE SL, 8 mg (two 4 mg doses approximately 3 hours apart) on Day -7 and 12 mg on Days -6 through -1. Source: study-report-body.pdf; Figure 7; Figure 14.2.2.1.4 and Table 14.2.1.1
Table 2 Single dose 100 mg RBP-6000 pharmacokinetic parameters (Cohort 2: 100 mg)
Parameter Statistic RBP-6000 RBP-6000 + Suboxone SL
Cohort 1 50 mg Cohort 2 100 mg Cohort 3 200 mg Cohort 4 100 mg Cavg (ng/mL) n 12 12 12 10 Mean 0.370 0.663 1.138 0.951 %CV 27.4 16.6 25.7 32.5 Cmax (ng/mL) n 12 12 12 12 Mean 1.051 1.537 2.427 2.285 %CV 35.6 16.4 20.9 23.2 Cmin (ng/mL) n 12 12 12 12 Mean 0.059 0.089 0.148 0.275 %CV 56.1 44.3 67.8 64.3 Tmax (hr) n 12 12 12 12 Median 24.0 24.0 24.0 18.0 Min, Max 4.00, 24.03 24.0, 48.0 4.00, 144.0 4.00, 24.0 %CV = coefficient of variation; hr = hour; Max = maximum; Min = minimum; PK = pharmacokinetic; QD = once daily; SC = subcutaneous; SD = standard deviation; SL = sublingual Cohort 1 = a single SC injection of RBP-6000 containing 50 mg buprenorphine. Cohort 2 = a single SC injection of RBP-6000 containing 100 mg buprenorphine.
20

Cohort 3 = a single SC injection of RBP-6000 containing 200 mg buprenorphine. Cohort 4 = QD dosing with SUBOXONE SL, 8 mg (two 4 mg doses approximately 3 hours apart) on Day -7 and 12 mg on Days -6 through -1. Source: study-report-body.pdf; Table 11; Table 14.2.1.3, Listing 16.2.6.2.1, Listing 16.2.6.2.2, and Listing 16.2.6.2.3
The results of Study RB-US-11-0020 also indicate that after a single-dose RBP-6000 SC injection ranging from 50 to 200 mg, pharmacokinetic parameters increased at a rate that was less than proportional to dose (Table 3). Table 3 Dose proportionality assessment after 50, 100 and 200 mg RBP-6000 SC single dose injection Dose x-fold ratio
50 mg 100 mg 200 mg 50 mg 1-fold 100 mg 2-fold 200 mg 4-fold
Cmax (ng/mL) 1.05 1.54 2.43 1.00 1.46 2.31 AUCDay1-29 (hr.ng/mL) 248.48 425.13 764.92 1.00 1.71 3.08 AUCinf (hr.ng/mL) 866.19 1557.40 3007.82 1.00 1.80 3.47
Study RB-US-11-0006 evaluated the effect of different molecular weights (MW) of the PLGH polymer in the formulation on pharmacokinetics of single dose of 300 mg RBP-6000 after buprenorphine sublingual stabilization or “lead-in” phase in subjects with opioid use disorder. Buprenorphine peak levels were observed approximately 17 h post administration (Figure 2). Buprenorphine pharmacokinetic parameters are presented in Table 4. For the 300 mg dose, the observed mean buprenorphine plasma half-life was 908 h (SD 157 h; note: parameter was represented by only 2 values), corresponding to approximately 38 days. The long half-life is mainly determined by the continuous absorption from RBP-6000 and does not reflect the real elimination half-life of buprenorphine. Figure 2 Mean Plasma Concentrations of Buprenorphine after a single dose of RBP-6000 300 mg
PLGH A: RBP-6000 300 mg buprenorphine formulated with 9 kDa PLGH polymer (test treatment), subcutaneous (SC) injection PLGH B: RBP-6000 300 mg buprenorphine formulated with 17 kDa PLGH polymer (test treatment), SC injection PLGH C: RBP-6000 300 mg buprenorphine formulated with 14 kDa PLGH polymer (reference treatment), SC injection Source: rbus130006-body.pdf; Figure 11-1; End-of-Text Figure 14.2.1.3.
21

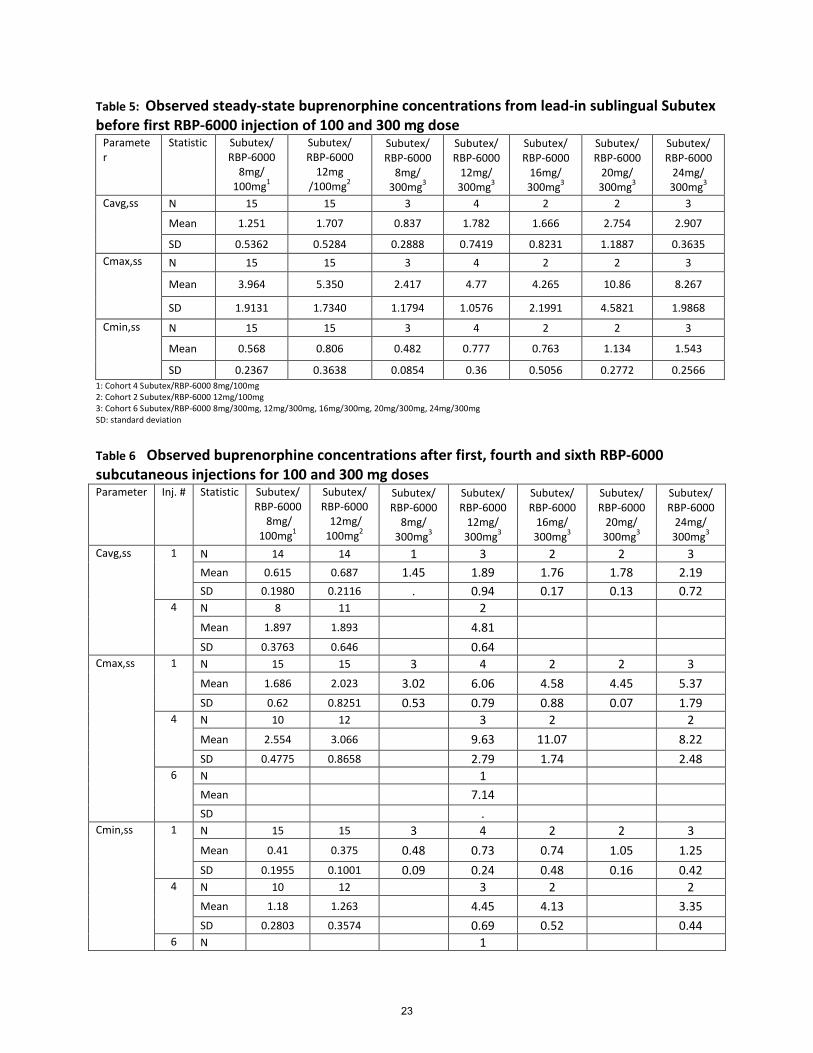
Table 5: Observed steady-state buprenorphine concentrations from lead-in sublingual Subutex before first RBP-6000 injection of 100 and 300 mg dose
Parameter
Statistic Subutex/ RBP-6000
8mg/ 100mg1
Subutex/ RBP-6000
12mg /100mg2
Subutex/ RBP-6000
8mg/ 300mg3
Subutex/ RBP-6000
12mg/ 300mg3
Subutex/ RBP-6000
16mg/ 300mg3
Subutex/ RBP-6000
20mg/ 300mg3
Subutex/ RBP-6000
24mg/ 300mg3
Cavg,ss N 15 15 3 4 2 2 3
Mean 1.251 1.707 0.837 1.782 1.666 2.754 2.907
SD 0.5362 0.5284 0.2888 0.7419 0.8231 1.1887 0.3635 Cmax,ss N 15 15 3 4 2 2 3
Mean 3.964 5.350 2.417 4.77 4.265 10.86 8.267
SD 1.9131 1.7340 1.1794 1.0576 2.1991 4.5821 1.9868
Cmin,ss N 15 15 3 4 2 2 3
Mean 0.568 0.806 0.482 0.777 0.763 1.134 1.543
SD 0.2367 0.3638 0.0854 0.36 0.5056 0.2772 0.2566 1: Cohort 4 Subutex/RBP-6000 8mg/100mg 2: Cohort 2 Subutex/RBP-6000 12mg/100mg 3: Cohort 6 Subutex/RBP-6000 8mg/300mg, 12mg/300mg, 16mg/300mg, 20mg/300mg, 24mg/300mg SD: standard deviation
Table 6 Observed buprenorphine concentrations after first, fourth and sixth RBP-6000 subcutaneous injections for 100 and 300 mg doses Parameter Inj. # Statistic Subutex/
RBP-6000 8mg/
100mg1
Subutex/ RBP-6000
12mg/ 100mg2
Subutex/ RBP-6000
8mg/ 300mg3
Subutex/ RBP-6000
12mg/ 300mg3
Subutex/ RBP-6000
16mg/ 300mg3
Subutex/ RBP-6000
20mg/ 300mg3
Subutex/ RBP-6000
24mg/ 300mg3
Cavg,ss 1 N 14 14 1 3 2 2 3 Mean 0.615 0.687 1.45 1.89 1.76 1.78 2.19 SD 0.1980 0.2116 . 0.94 0.17 0.13 0.72
4 N 8 11 2 Mean 1.897 1.893 4.81 SD 0.3763 0.646 0.64
Cmax,ss 1 N 15 15 3 4 2 2 3 Mean 1.686 2.023 3.02 6.06 4.58 4.45 5.37 SD 0.62 0.8251 0.53 0.79 0.88 0.07 1.79
4 N 10 12 3 2 2 Mean 2.554 3.066 9.63 11.07 8.22 SD 0.4775 0.8658 2.79 1.74 2.48
6 N 1 Mean 7.14 SD .
Cmin,ss 1 N 15 15 3 4 2 2 3 Mean 0.41 0.375 0.48 0.73 0.74 1.05 1.25 SD 0.1955 0.1001 0.09 0.24 0.48 0.16 0.42
4 N 10 12 3 2 2 Mean 1.18 1.263 4.45 4.13 3.35 SD 0.2803 0.3574 0.69 0.52 0.44
6 N 1
23


3.3 Norbuprenorphine/buprenorphine exposure ratio RBP-6000 is designed for SC depot administration, which avoids the first-pass effect compared to buprenorphine formulations for oral transmucosal administration. The fraction absorbed sublingually of a sublingual buprenorphine product (e.g., Suboxone) also avoids the first-pass effect, whereas the swallowed fraction still undergoes first-pass effect and is metabolized to norbuprenorphine, which will result in a higher exposure ratio of norbuprenorphine to buprenorphine. Buprenorphine and norbuprenorphine concentrations were measured for both RBP-6000 SC and sublingual Subutex administrations in Study RB-US-11-0005. The norbuprenorphine to buprenorphine ratio was much higher for Subutex sublingual lead-in phase compared to RBP-6000 SC 300 mg after the fourth injection. The AUCtau ratio of norbuprenorphine to buprenorphine approximately ranges from 0.23 to 0.39 for RBP-6000 after the fourth injection compared to 1.32 to 3.21 for Subutex sublingual at steady state (RB-US-12-0005). This observation confirms that RBP-6000 undergoes lesser metabolism compared to buprenorphine sublingual product due to lack of first-pass effect.
3.4 Hepatic and Renal Impairment No dedicated RBP-6000 pharmacokinetic studies were conducted in hepatically-impaired or renally-impaired patients. With respect to hepatic impairment, the effect on buprenorphine PK has been previously evaluated with Suboxone sublingual tablets (2 mg/0.5 mg buprenorphine/naloxone) in subjects with varied degrees of hepatic impairment as indicated by Child-Pugh criteria (see Suboxone Film Prescribing Information 2017). The labeling states that “While no clinically relevant changes were observed in subjects with mild hepatic impairment, buprenorphine plasma exposure was increased by 64% and 181% in subjects with moderate and severe hepatic impairment, respectively, compared to healthy subjects.” Due to the lack of first-pass effect, the effect of hepatic impairment on pharmacokinetics of RBP-6000 is expected to be less than the effect on Suboxone sublingual film. With respect to renal impairment, the information provided with Suboxone sublingual film was referenced, indicating that buprenorphine undergoes hepatic extraction and metabolism and that buprenorphine systemic clearance is not significantly related to renal function.
3.5 Drug-interactions No dedicated RBP-6000 pharmacokinetic studies were conducted to evaluate drug interactions. Buprenorphine is mainly metabolized via CYP3A4, so co-administration of other drugs which are inhibitors or inducers of CYP3A4 activity can affect the pharmacokinetics of RBP-6000. Due to the lack of first-pass effects for RBP-6000, the magnitude of drug interaction with a 3A4 inhibitor or inducer is expected to be less for RBP-6000 in comparison to SL buprenorphine
26

products (See Section 3.3 for discussion). With SL administration, a portion of the dose is typically swallowed.
3.6 Exposure-Response Analyses The Applicant conducted exposure-response analyses using clinical data and pharmacodynamic (PD) measures obtained from their Phase 2 and Phase 3 program.
Exposure-Response Analyses of Mu-opioid Receptor Occupancy
The Applicant conducted analyses to assess the relationship of buprenorphine concentrations with mu-opioid receptor occupancy, opioid withdrawal symptoms, and opioid agonist effects. Data were pooled from two published studies in which heroin-dependent patients received sublingual (SL) buprenorphine.
Study 1 (Greenwald 20033): Five heroin-dependent subjects received SL buprenorphine escalation from 4-16 mg/day through Days 1-7 then 32 mg/day for 12 days. On Day 8 a 24 mg IM hydromorphone challenge dose was administered and subjective withdrawal symptoms were assessed. Buprenorphine and norbuprenorphine PK samples were assessed on Day 9. Opioid withdrawal symptoms were assessed on Days 10 and 11 before and 1,2,3,6, and 12 hours after SL buprenorphine administration. On Day 12 a PET scan with [11C]-carfentanil was administered 4 hours after SL buprenorphine to assess mu-opioid receptor occupancy in the brain. Subjects were down-titrated from 16 mg/day for 12 days, 2 mg/day for 14 days, 0 mg/day for 12 days with PET scans, hydromorphone challenge, and withdrawal symptoms assessed at each dose level. Study 2 (Greenwald 20074): Ten heroin-dependent subjects received buprenorphine SL tablets 16 mg/day for ≥ 2 weeks. Buprenorphine plasma PK samples, opioid withdrawal symptoms, and 4 hydromorphone challenges (24 mg IM) or 4 PET brain scans with [11C]-carfentanil were conducted at 4, 28, 52, and 76 hours after the final buprenorphine dose. Both studies utilized an opioid symptom questionnaire with 16 agonist effect questions and 16 withdrawal scale questions. Each question can have a score of 0 (“not at all”) to 4 (“extremely”). Thus each set of 16 questions can yield a range of 0 to 64. Buprenorphine attenuation (blockade) of hydromorphone agonist effects was measured by VAS including “Any drug effect”, “High”, “Good Drug Effect”, “Bad Drug Effect”, “Stimulated”, “Sedated”, “Liking” or “Anxious.” From both trials, whole-brain imaging results were used to calculate mu-opioid receptor availability. The percentage of mu-opioid receptor occupancy was calculated as 100 minus mu-opioid receptor availability.
3 Greenwald MK, Johanson CE, Moody DE, Woods JH, Kilbourn MR, Koeppe RA, Schuster CR, Zubieta JK. Effects of Buprenorphine Maintenance Dose on [mu]-Opioid Receptor Availability, Plasma Concentrations, and Antagonist Blockade in Heroin-Dependent Volunteers. Neuropsychopharmacology. 2003 Nov 1;28(11):2000. 4 Greenwald M, Johanson CE, Bueller J, Chang Y, Moody DE, Kilbourn M, Koeppe R, Zubieta JK. Buprenorphine duration of action: mu-opioid receptor availability and pharmacokinetic and behavioral indices. Biological psychiatry. 2007 Jan 1;61(1):101-10
27

The Applicant pooled the data from Studies 1 and 2 (total of 59 PK/mu-opioid receptor occupancy measurements) and utilized an Emax model to fit the data. This approach requires an assumption of a direct exposure-occupancy relationship with negligible equilibration delay and negligible contribution of norbuprenorphine.
The muORO term is mu-opioid receptor occupancy, Cp is the buprenorphine plasma concentration, and EC50 is the buprenorphine plasma concentration achieving 50% of the maximal mu-opioid receptor occupancy (Emax). The Applicant provided the following graphical comparison (Figure 3) of observations with simulated predictions.
Figure 3 Visual Predictive Check for the PK/PD Model Relating Whole-Brain Mu-Opioid Receptor Occupancy to Buprenorphine Plasma Concentration
(source: summary-clin-pharm.pdf, page 67 of 148)
28

The final model estimates were an Emax of 91.4% mu-opioid receptor occupancy (residual squared error [RSE] 4.3%) and EC50 of 0.67 ng/mL (28% RSE). The model-predicted variability (shaded yellow area) appears to be overestimated at higher concentrations (e.g. > 3 ng/mL).
As a cross-study comparison, the Applicant superimposed the PK and mu-opioid receptor occupancy data from two subjects who underwent a PET scan sub-study in their Phase 2 multiple ascending dose study 12-0005. For the subject receiving 200 mg in the MAD study, brain mu-opioid receptor occupancy was 79% on the 7th day and 75% on the 28th day post-dose. For the subject receiving 300 mg, brain mu-opioid receptor occupancy was 92% on the 7th day and 81% on the 28th day post-dose. These data collected from study 12-0005 are consistent with the model predictions based on literature data from the two Greenwald studies.
Exposure-Response Analyses of Attenuation (i.e.. Blockade) of Hydromorphone Agonist Effects
The Applicant assessed the relationship of mu-opioid receptor availability with withdrawal symptom scores (red points in figure below) and hydromorphone-induced changes in agonist symptoms (blue points in figure below) using data from Greenwald Study 1 and Greenwald Study 2. The Applicant utilized a linear model to assess the relationship between mu-opioid receptor availability and these two measures (red line and blue line in Figure 4 below). The Applicant plotted the buprenorphine plasma concentration profile associated with various levels of mu-opioid receptor availability (green dots in plot below) and used a nonlinear model to describe the relationship between plasma concentration and mu-opioid receptor availability (green line in figure below). The Applicant states that mu-opioid receptor occupancy of ≥ 70% corresponds to mu-opioid receptor availability of ≤ 30% (tan shaded oval in figure below, Figure 4).
Figure 4 Observed and Model Predicted Changes in Agonist Effect Following Administration of 24 mg Hydromorphone, Observed and Model Predicted Mean Withdrawal Symptoms, and Observed and Model Predicted Buprenorphine Plasma Concentration in Relation to Mu-Opioid Receptor Availability
29

(source: summary-clin-pharm.pdf, page 68 of 148)
Exposure-Response Analyses of “Drug-Liking” Scores
In Study 13-0002, the Applicant applied the “Drug Liking” Visual Analogue Scale (VAS) survey to assess the ability of 2 SC injections of 300 mg RBP-6000 every 28 days to block the subjective effects of hydromorphone (6 mg or 18 mg IM hydromorphone). The Applicant utilized the PK / mu-opioid receptor occupancy model to predict brain mu-opioid receptor occupancy as a function of plasma buprenorphine concentration (red points, red line in Figure 5). The plot also includes the observed VAS scores with the associated observed plasma buprenorphine concentration (black dots in figure below). The model predicted relationship between VAS score and buprenorphine exposure obtained using a maximal inhibitor (Imax) model is displayed as the black curve in figure below (Figure 5).
Figure 5 Observed Differences in Drug Liking from Placebo and Mean Predicted Mu-Opioid Receptor Occupancy as a Function of Buprenorphine Plasma Concentration After the 18 mg Hydromorphone Challenge
30

(source: summary-clin-pharm.pdf, page 70 of 148)
Mean buprenorphine plasma concentrations ≥ 2 ng/mL produced drug-liking VAS score below 11 (Applicant’s non-inferiority boundary; lower black dashed line in figure above). Brain mu-opioid receptor occupancy levels were ≥ 70% for buprenorphine concentration ≥ 3 ng/mL and ≥ 60% for buprenorphine concentrations ≥ 2 ng/mL.
Graphical Analyses of Relationship Between Clinical Endpoints and Buprenorphine Exposure
The Applicant assembled plots to display the relationship between negative opioid use (based on patient self-reporting of opioid use) and buprenorphine plasma concentration in Study 13-0001. The observed data regarding negative opioid use and buprenorphine plasma exposure indicate a plateau of maximal response at approximately 2 ng/mL (see, Figure 6).
Figure 6 Relationship Between the Proportion of Subjects with Negative Opioid Use and Buprenorphine Plasma Concentration (Study 13-0001)
31

(source: summary-clin-pharm.pdf, page 76 of 148)
Exposure-response analyses for negative opioid use were conducted using an Emax model. The results indicate that subjects who used illicit opioids via the injectable route had a 3.6 times greater EC50 (4.3 ng/mL) than the EC50 for subjects who used illicit opioids via other routes (1.2 ng/mL). This suggests that patients who use illicit opioids via the injectable route require greater buprenorphine exposure to avoid illicit opioid use than patients who use illicit opioids by other routes.
Pharmacokinetic simulations were conducted to facilitate comparison of the exposures associated with the proposed doses in the context of the 2 ng/mL exposure level (Figure 7).
Figure 7 Predicted Decrease in Buprenorphine Plasma Concentrations for the 300 mg/300 mg and 300 mg/100 mg Dosing Regimens of RBP-6000 after the Last SC Injection
32

Overall, there is a consistent trend among the measures assessed in exposure-response analyses. Overall, for mu-receptor occupancy, change in mean VAS (Drug Liking) score (Figure 5)
33

and percentage of subjects with negative opioid use (Figure 6), there is an apparent increase in response with increasing exposure up to approximately 2 ng/mL. There is an apparent “plateau” of where these responses are at their maximum at a range above 2-3 ng/mL.
The Applicant’s analyses suggest that buprenorphine exposures achieved in the clinical trials were of sufficient range to characterize both the steep portion of the exposure-response curves (e.g. at exposures < 2 ng/mL) and the portion of the exposure-response curve where the plateau is apparent (e.g. > 2-3 ng/mL). According to PK simulations, both of the proposed dosing regimens (300 mg / 100 mg) and (300 mg / 300 mg) appear to be able to, on average, achieve exposures throughout the dosing interval that achieve the maximum effect.
3.7 Summary of clinical pharmacology findings: • After a single dose RBP-6000 100 mg SC injection (without buprenorphine sublingual
stabilization or “lead-in” phase prior to SC injection), buprenorphine peak was observed approximately 24 h post administration. After a single dose RBP-6000 SC injection ranging from 50 to 200 mg, pharmacokinetic parameters increased at a rate that was less than proportional to dose.
• After multiple dose injections, the observed steady state Cavg buprenorphine concentration after the fourth 300 mg RBP-6000 injection (4.81 ng/mL) was about 65% higher than that of 24 mg Subutex (2.907 ng/mL).
• For mu-receptor occupancy, change in mean VAS (Drug Liking) score (Figure 5) and
percentage of subjects with negative opioid use (Figure 6), there is an apparent increase in response with increasing exposure up to approximately 2 ng/mL. There is an apparent “plateau” of where these responses are at their maximum at a range above 2-3 ng/mL. According to PK simulations, both of the proposed dosing regimens (300 mg / 100 mg) and (300 mg / 300 mg) appear to be able to, on average, achieve exposures throughout the dosing interval that achieve the maximum effect.
• The norbuprenorphine to buprenorphine ratio was much higher for Subutex sublingual
lead-in phase compared to RBP-6000 SC 300 mg after the fourth injection. The AUCtau ratio of norbuprenorphine to buprenorphine approximately ranges from 0.23 to 0.39 for RBP-6000 after the fourth injection compared to 1.32 to 3.21 for Subutex sublingual at steady state. This observation confirms that RBP-6000 undergoes less first-pass effect compared to buprenorphine sublingual product.
• No dedicated RBP-6000 pharmacokinetic studies were conducted in hepatically- or
renally-impaired patients. Due to the lack of first-pass effect, the effect of hepatic impairment on pharmacokinetics of RBP-6000 is expected to be less than that of Suboxone sublingual film, for which a portion of the dose is typically swallowed. Buprenorphine undergoes hepatic extraction and metabolism and that buprenorphine systemic clearance is not significantly related to renal function.
34

• No dedicated RBP-6000 pharmacokinetic studies were conducted to evaluate drug interactions. Buprenorphine is mainly metabolized via CYP3A4, so co-administration of other drugs which are inhibitor or inducer of CYP3A4 activity can affect the pharmacokinetics of RBP-6000. Due to lack of first-pass effects for RBP-6000, the magnitude of drug interaction with a 3A4 inhibitor or inducer is expected to be less for RBP-6000 in comparison to SL buprenorphine products.
Non-Clinical Toxicity 4In the nonclinical toxicology studies, the local tissue effects of RBP-6000 were typical of a foreign body reaction to an injected polymeric material and consisted primarily of erythema, edema, and occasional scabbing. Histologically, local cellular damage and inflammatory infiltrates/granulomas were noted in and around the injection sites consistent with an expected foreign body reaction. The effects are likely due to both the vehicle and the local buprenorphine concentration. Given the slow rate of degradation of the polymeric vehicle, these local reactions are expected to take many months to completely resolve. Rotation of the injection sites should prevent cumulative local tissue toxicity. In the 6-month repeat-dose toxicology study in the rat, RBP-6000 increased the incidence of pancreatic acinar cell apoptosis. The Applicant attributed this to the stress induced by the chronic buprenorphine exposure and the local inflammatory reaction of the depot injection. Evidence of stress in these animals included urine stained fur, aggressive behavior, decreased activity, broken/cracked teeth, reduced body weight (males) and reduced food consumption. Reduced body weights/food intake has also been reported to increase pancreatic acinar cell apoptosis in the literature.
Review of Efficacy 5The review of efficacy of RB-6000 focused on the findings from a randomized, double-blind, placebo-control efficacy study (RB-US-13-001) and an inpatient opioid blockade study (RB-US-13-0002)
5.1 Blockade study (RB-US-13-0002)
5.1.1 Design and Endpoints Study RB-US-13-0002 was a double-blind, placebo-controlled, multiple-dose study in non-treatment-seeking subjects with moderate to severe opioid use disorder (OUD) to evaluate blockade of hydromorphone’s subjective effects by subcutaneous (SC) depot injections of buprenorphine (RBP-6000). Buprenorphine plasma levels and the safety of SC injections were also examined. The study was primarily intended to demonstrate, following 300 mg of RBP-6000, that “Drug Liking” scores measured after challenge with 6mg or 18mg of intramuscular (IM) hydromorphone (a C-II narcotic full mu-opioid agonist) were noninferior to those
35

measured after challenge with placebo. Subjects were also followed further for another 8 one-week intervals after a second 300mg dose of RBP-6000 on study day 29. “Drug Liking” was measured on a unipolar 100 mm visual analog (VAS) scale, (with the scale anchored by "none" and "extremely," taken at baseline, then 15, 30, 45, 60, 75, and 90 minutes after IM injection. Other subjective drug effects were also measured concurrently by VAS of “Any Drug Effect,” “Good Drug Effect,” “Bad Drug Effect,” Sedation,” and “High”. Additionally, the reinforcing effects of each day’s randomized IM challenge in each 3-day set of changing doses (0mg/day or 6mg/day or 18mg/day hydromorphone IM) were evaluated in a choice task (relative to money), each day during the weekly 3-day sets of doses, at least 5 hours after each challenge injection. For each day’s 12 choice trials, a subject chose between earning 1/12 of the total challenge dose they had received that morning, for another dose at the end of the day, OR, for $2.00/trial (for each of that day’s 12 trials, to a maximum total of $2.00 x 12 trials=$24.00/challenge day). To earn each of that day’s 12 choice portions, a number of repetitive mouse clicks, each choosing drug or money, were required. The number of clicks to earn the drug or money for each 12th of their eventual reward for that day increased across each trial. For each trial’s choice of that 12th of that day’s reward, the number of clicks required rose from 5 to 2160 clicks/trial, in 12 exponential increments (within every trial), creating a progressive ratio schedule of reinforcement. Number of clicks to earn that 12th of that day’s choice (for 1/12 of the $24.00) or 1/12th that morning’s drug dose (0mg, 0.5 mg, or 1.5 mg)) rose independently of each other until all of that day’s 12 portions were chosen for the favorite of the two, or, until the subject’s “Breakpoint” was reached to switch work for their 2nd choice, starting again at 5 clicks, increasing exponentially again until all 12 trials were completed for the day, with all 12 fractional choices earned (or until the subject gave up clicking for that day). The highest number of clicks “worked” to earn each 12th of that morning’s challenge dose for repeat at the end of the day was counted as that trial’s “Breakpoint,” with 12 breakpoints recorded for each of the 3 dosed days.
The safety of RBP-6000 was also evaluated, as a depot injection of 300 mg, in these OUD subjects who had been inducted and stabilized on sublingual (SL) buprenorphine (SUBOXONE® [buprenorphine/naloxone] sublingual film) with doses of 8-24 mg/day (prn). Stabilization was followed by randomized assignment of subjects to groups that would each receive a specified 12 week sequence of 12 weekly sets of 3-days in a row of hydromorphone challenges, with the assigned sequence’s changing (but initially randomized for each groups’ sequence) 3 dose sets of 0mg, 6mg or 18 mg of IM hydromorphone. One final baseline 3-day hydromorphone challenge set (Days -4 to -1) was followed by the treatment period (for all sequence groups) of 2 RBP-6000 injections, once per month for 2 months, starting on treatment day 1, followed with recurring weekly 3-day challenge sets ( 0mg, 6mg or 18mg IM hydromorphone) in changing order. The order of each set in each group’s 12-set sequence was initially randomized, but the 3-day sets were then grouped into 12-set sequences, one sequence of 12 3-day sets (over 12
36

weeks) for all subjects randomly assigned to that group. Randomization was just prior to the baseline set of challenge doses (days -4 to -1) prior to injection #1 on Treatment Day 1 (as shown in Figure 8, below).
Figure 8: Study Schematic for opioid blockade study
The study consisted of a Screening Phase, a Qualification Phase (Baseline Hydromorphone Challenge Phase), an Induction-Stabilization and Opioid Blockade Testing Phase, and a Treatment Phase ( See Figure 8 above) Eligible subjects were admitted to the clinical facility and established their final qualification by responding appropriately to IM hydromorphone and differentiating it from placebo (detailed below). Qualified subjects entered into the Induction-Stabilization Phase of the study were they received 8 to 24 mg SL buprenorphine. Once stabilized on the SL buprenorphine dose, subjects were randomized to receive either 6 mg or 18 mg of IM hydromorphone, or placebo, on daily basis, in random order and double-blind manner for 3 consecutive days in a week for the 12 weeks.
The treatment period (magnified Figure 8’s lower inset) was then initiated with each subject’s first injection of 300 mg of RBP-6000 on treatment day 1. Starting on day 5, each subject then received a daily injections of either placebo (Hydromorphone 0 mg) or an injection of 6mg or 18mg of HM in a double-blind and in random order during a 3 consecutive day set for four weeks starting 5 days after receiving the first treatment dose (Days 5, 12,19 and 26). At week 5, subjects received a second 300 mg RBP-6000 injection SQ on day 29, and five days later the subjects started receiving daily IM hydromorphone challenge sets (Placebo, Hydromorphone 6
37

mg and 18 mg) in their 12 week randomly assigned group sequence (of 12 sets of 3 consecutive days each week) for the final 8 weeks of the 12.
The primary outcome, opioid blockade by RBP-6000, would be established by failure to discriminate blinded doses of 6 or 18 mg IM hydromorphone from placebo, through the first 4 weeks following the first injection of RBP-6000. The purpose of doubling the duration of evaluation after the second injection to 8 more weeks was to determine if opioid blockade was extended beyond the dosing interval of 4 weeks and to see if the subjective effects VAS scores, and ability to discriminate hydromorphone from placebo, returned to baseline over the 5-8 weeks post 2nd injection.
The study enrolled 39 subjects with moderate to severe OUD to reach a goal of at least 24 completers of all the hydromorphone challenges during study Weeks 1-4. Subjects were admitted to the clinical facility for 3 consecutive days, starting the night before the first challenge day, for each of the 12 weeks of the study following the first RBP-6000 injection. (See Population Section)
As pictured in the upper inset (in Figure 8 ), from Day -35 to Day -19, subjects were screened and then admitted to the clinical facility on Day -18 for a baseline hydromorphone challenge (3 daily doses in random sequence), Day -18 to Day -16). Subjects with a qualifying response (defined as having a “Drug Liking” VAS score of at least 40 mm [out of 100 mm on a unipolar scale anchored by “none” and “extremely”) following administration of 18 mg hydromorphone were inducted and stabilized on SUBOXONE SL film from Day -14 (or Day -13 if the subject was not having withdrawal) through Day -1. Subjects had another hydromorphone challenge on Days -3 through -1. As magnified in the lower inset (Figure 8), on Day 1, subjects who still met all criteria discontinued SL buprenorphine and received their first Injection of RBP-6000. Following that, subjects were released from the clinical facility on Day 2. Subjects returned to the clinical facility for the 3 consecutive days of hydromorphone challenge on Days 4, 11, 18, and 25. Following a second injection of RBP-6000 on Day 29, subjects were released from the facility on Day 30. Subjects returned to the facility for the 3 consecutive days of hydromorphone challenge on Days 32, 39, 46, 53, 60, 67, 74, and 81.
5.1.2 Population Thirty-nine subjects (of the 342 males and nonpregnant females with moderate to severe OUD who consented) qualified with a peak “Drug Liking” VAS score of at least 40 mm [out of 100 mm on a unipolar scale anchored by “none” and “extremely”) after 18 mg hydromorphone IM and at least a 20-mm difference in “Drug Liking” between 18 mg hydromorphone and IM placebo were randomized into the different sequence groups. All 39 subjects were included in the safety analysis population. One of these did not complete and only 38 subjects were included
38

in the intent-to-treat (ITT) population. The 12 weeks of the treatment period were completed by 30 subjects (77%) and 9 subjects (23%) withdrew from the study. There were 3 subjects who withdrew as a result of physician decision or self-withdrawal (none due to AEs) and 3 subjects were lost to follow-up. Baseline demographics for the 39 subject Safety Population are shown in the table below.
Table 10: Summary of Demographic (Safety population in Opioid blockade study Summary of Demographics (Safety Population)
Category or Statistic
Overall
N=39 Gender - n (%) Male 35 (89.7)
Female 4 (10.3) Race - n (%) White 25 (64.1)
Black or African American 12 (30.8) Native Hawaiian or Other Pacific
Islander 0 (0.0)
Asian 2 (5.1) American Indian or Alaska Native 0 (0.0) Other 0 (0.0)
Ethnicity - n (%) Hispanic or Latino 1 (2.6) Not Hispanic or Latino 38 (97.4)
Age (yr) N 39 Mean 34.6 SD 8.93 Median 34.0 Min, Max 20, 55
Weight (kg) N 39 Mean 79.55 SD 11.178 Median 78.40 Min, Max 60.9, 102.5
Height (cm) N 39 Mean 176.99 SD 6.421 Median 176.50 Min, Max 165.5, 197.0
BMI (kg/m²) N 39 Mean 25.35 SD 3.017 Median 25.20 Min, Max 20.7, 31.5
Nicotine Use (yr) N 36 Mean 19.03 SD 8.962
39

Median 20.00 Min, Max 5.0, 44.0 N = number of subjects; n = number of subjects in a subset in a given category
5.1.3 Statistical Methodologies The primary endpoint used for analysis was the mean score of “Drug Liking” VAS. Secondary endpoints included “Any Drug Effect,” “Good Drug Effect,” “Bad Drug Effect,” “Sedation,” and “High”. The primary analysis is the (modified) intention-to-treat (mITT) analysis.
The Applicants’s analyses of the primary and secondary endpoints are in the process of being verified by the Office of Biostatistics. The Applicant has been asked to submit a sensitivity analysis, based on the Emax of the drug liking VAS to support the blocking effects of RBP-6000 for fully blocking the effects of 18mg hydromorphone by the 4th week following the first 300 mg depot Injection of the product.
5.1.4 Results and Conclusions Primary outcome analysis of the “Drug Liking” VAS demonstrated a full opioid blockade, based on the pre-selected non-inferiority margin of 11, for the 6 mg hydromorphone IM injections, across all 4 weeks of the primary treatment period of 28 days following the 300 mg SQ injection of RBP-6000. The VAS data are summarized in the figures below.
Full blockade of the 18 mg hydromorphone injections was observed for the first 3 of the 4 weeks following RBP-6000 injection #1. In the final, 4th week, blockade of the 18 mg hydromorphone treatment fell just outside of the predetermined upper bound of the 95% confidence interval (≤ 11) with a value of 11.418, exceeding the upper bound for full non inferiority of the opioid blockade. Secondary results from the next 4 weeks following injection #2 of RBP-6000 demonstrated partial opioid blockade against both the 6 mg and 18 mg hydromorphone injections from Week 5 to Week 8 of the Treatment Period, and are shown following the primary outcome data from the first 4 weeks in the Figure 9.
Figure 9: Mean scores for 6 VAS assessments by hydromorphone challenge dose for Opioid Blockade Study
40

[Mean scores for the 6 VAS assessments. A, Mean drug liking VAS scores by hydromorphone challenge dose, B, Mean "any drug effect" VAS scores by hydromorphone challenge dose. C, Mean "bad drug effect" VAS scores by hydromorphone challenge dose. D, Mean "drug high" VAS scores by hydromorphone challenge dose. E, Mean "good drug effect" VAS scores by hydromorphone challenge dose. F, Mean "sedation" VAS scores by hydromorphone challenge dose.]
Although not yet reviewed by the Office of Biostatistics, the Applicant’s Reinforcing Effects Tasks analysis for choice of hydromorphone vs. money showed that the reinforcing effects of hydromorphone, compared to placebo, diminished over the course of the study. The Reinforcing Effects Tasks scores were mostly stable for the placebo over the 12 week treatment
41

period. However, the reinforcement value of the 6 mg and 18 mg hydromorphone injections decreased consistently from baseline through Week 12. Observation continued in Week 9 to Week 12 (5 weeks to 8 weeks following the final injection (#2) of RBP-6000) to determine the status of the opioid blockade in the time period extending beyond the labeled 4-week dosing interval following injection #2. Observations during that period suggest that significant opioid blockade was maintained, as measured by “Drug liking” subjective effects VAS scores observed as the primary outcome variable.
5.2 Efficacy Study ( RB-US-13-0001)
5.2.1 Study Design and Endpoints Study RB-US-13-0001 was a randomized, double-blind, placebo-controlled, parallel group, multicenter study to assess the efficacy, safety and tolerability of multiple SC injections of RBP-6000 (100 mg and 300 mg) over 24 weeks in treatment-seeking subjects with opioid use disorder. The study consisted of a screening phase up to 2 weeks, an open-label run-in phase up to 2 weeks, a randomized, double-blind treatment phase of 24 weeks, and a follow-up period. The study randomized subjects from 33 sites in the United States. Subjects who completed this study were eligible to enter a long-term safety extension study (Study RB-US-13-0003).
All subjects who entered the open-label run-in induction phase were treated with SUBOXONE (buprenorphine/naloxone) sublingual film for 3 days followed by a dose-adjustment period of 4 to 11 days. Subjects who completed the open-label run-in phase and met randomization criteria were randomized on Day 1 of the double-blind treatment phase. Study drug was administered as a SC injection every 4 weeks for a total of 6 doses. Subjects also received manual-guided behavior counseling/individual drug counselling (IDC) at least once per week throughout the study. To be eligible for randomization, subjects should have had no significant opioid craving (≤ 20 mm on the Opioid Craving Visual Analog Scale) or withdrawal (a score of ≤ 12 on the Clinical Opiate Withdrawal Scale) after at least 7 days of SUBOXONE sublingual film therapy. Eligible subjects were randomized in a 4:4:1:1 ratio to receive the one of the following regimens:
• RBP-6000 regimen 1 (300 mg): RBP-6000 300 mg SC every 4 weeks for 6 doses+ IDC,
• RBP-6000 regimen 2 (100 mg): RBP-6000 300 mg SC every 4 weeks for 2 doses+ IDC, followed by RBP-6000 100 mg SC every 4 weeks for 4 doses + IDC
• placebo regimen 1: volume-matched to RBP-6000 regimen 1 + IDC
• placebo regimen 2: volume-matched to RBP-6000 regimen 2 + IDC
42

After the study had started, the protocol was amended to include a 5-day SUBOXONE sublingual film taper. The purpose of taper was to mitigate the potential for withdrawal signs and symptoms in placebo-treated subjects, which could contribute to early drop-out, and to facilitate preservation of the blind of the study. A total of 163 randomized subjects received a 5-day SUBOXONE sublingual film taper following the first injection of study treatment. After injection of study treatment, subjects were not permitted supplemental SUBOXONE sublingual film except for the 5-day taper that began on Day 1. Subjects who required additional supplemental SUBOXONE sublingual film or other sublingual buprenorphine pharmacotherapy after Day 1 were to be withdrawn for lack of efficacy and referred for appropriate treatment.
Following randomization, subjects were to return to the clinic weekly for urine drug screen (UDS), Timeline Follow Back (TLFB) interviews, assessments using Clinical Opiate Withdrawal Scale (COWS), Subjective Opiate Withdrawal Scale (SOWS), and Opioid Craving Visual Analog Scale (VAS). The TLFB interview asked subjects to retrospectively estimate their drug use in the 30 days prior to screen at the screening visit and since the last visit at all subsequent visits.
The primary efficacy endpoint was the cumulative distribution function (CDF) of the percentage of urine samples negative for opioids combined with self-reports negative for illicit opioid use (percentage abstinence) collected from Week 5 through Week 24. The purpose of analyzing efficacy starting from Week 5 instead of Week 1 was to allow subjects to stabilize in treatment. Percentage abstinence was computed for each subject as the number of weeks of abstinence divided by 20. For example, if a subject had 10 weeks of negative urine samples and TLFB self-report negative for opioids, the percentage abstinence of this subject was 50%. The key secondary endpoint was treatment success, defined as any subject with at least 80% of urine samples negative for opioids combined with self-reports negative for illicit opioid use from Week 5 through Week 24.
5.2.2 Demographics and Disposition A total of 504 subjects were randomized, 100 to placebo, 203 to RBP-6000 100 mg group, and 201 to RBP-6000 300 mg group. The demographic and baseline characteristics were comparable across treatment groups (Table 11). The majority of the subjects were male (66%) and white (71%). Overall, about 44% of the subjects had history of injectable opioids use.
Table 11: Summary of Demographics and Baseline Characteristics
RBP-6000 100 mg (N=203)
RBP-6000 300 mg (N=201)
Placebo (N=100)
Age (days) Mean (SD) 40 (11) 39 (11) 39 (11) Median 38 38 38 Min, Max 19, 64 19, 64 20, 63
43

Sex, n (%) Male 136 (67%) 135 (67%) 65 (65%) Female 67 (33%) 66 (33%) 35 (35%) Race, n (%) White 140 (69%) 144 (72%) 78 (78%) Black or African American 57 (28%) 55 (27%) 20 (20%) American Indian or Alaska Native 4 (2%) 1 (0%) 1 (1%) Asian 0 0 0 Multiple 2 (1%) 1 (0%) 1 (1%) Weight at screening (kg) Mean (SD) 77 (16) 80 (17) 76 (16) Median 75 78 73 Min, Max 46, 123 45, 128 48, 132 Baseline BMI (kg/m2) Mean (SD) 25 (4) 26 (4) 25 (4) Median 25 26 25 Min, Max 18, 35 18, 35 18, 35 Substance use at screening Opioid use –injectable route 90 (44%) 84 (42%) 50 (50%) Tobacco 187 (92%) 186 (93%) 93 (93%) Alcohol 160 (79%) 160 (80%) 81 (81%) Drug use history Cannabinoids 113 (56%) 95 (47%) 53 (53%) Cocaine 94 (46%) 80 (40%) 42 (42%) Amphetamine/Methamphetamine 53 (26%) 29 (14%) 19 (19%) Source: Reviewer and Clinical Study Report Table 14.1.2.3; SD: standard deviation;
Approximately 60% of the subjects in RBP-6000 groups completed the study compared with approximately 34% in the placebo group. The dispositions of the two active treatment groups were similar. The most common reasons for discontinuation in both active treatment groups were “lost to follow-up” and “subject withdrew consent”. The percentage of subjects that discontinued due to “lack of efficacy” or “subject withdrew consent” was higher in the placebo group than the active groups. Similar percentages of subjects in the three treatment groups discontinued due to “lost to follow-up”.
Table 12: Subject Disposition Population RBP-6000 100 mg RBP-6000 300 mg Placebo All randomized (ITT) N=203 N=201 N=100 Completed, n (%)* 125 (62%) 129 (64%) 34 (34%) Discontinued, n(%)* 78 (38%) 72 (36%) 66 (66%) Reason for discontinuation
44

Adverse event 6 (3%) 10 (5%) 2 (2%) Death 0 0 0 Withdrawal symptoms 1 (0.5%) 1 (0.5%) 3 (3%) Lost to follow-up 26 (13%) 23 (11%) 12 (12%) Noncompliance with study drug 2 (1%) 0 2 (2%) Physician decision 0 1 (0.5%) 1 (1%) Subject withdrew consent 20 (10%) 21 (10%) 18 (18%) Subject withdrawn by investigator 1 (0.5%) 0 3 (3%) Lack of efficacy 3 (1.5%) 5 (2.5%) 18 (18%) Protocol deviation 2 (1%) 5 (2.5%) 0 Other 17 (8%) 6 (3%) 7 (7%) Source: Reviewer and Clinical Study Report, Table 14.1.1.1 *: Percentages are based on the total number of randomized patients.
5.2.3 Statistical Methodologies The primary efficacy endpoint was analyzed using the Wilcoxon rank-sum test. Efficacy analyses were conducted for the full analysis population (FAS), defined as all randomized patients who received study treatment. The Applicant excluded subjects from site 20 due to compliance issues. A sensitivity analysis including the subjects from site 20 produced similar results and the same conclusion. The two randomized placebo groups were combined and analyzed as one placebo group. Missing UDS samples and self-reports were imputed as positive in the primary analysis. The two RBP-6000 dose regimens were each tested against placebo at the 0.025 level.
5.2.4 Results and Conclusions The Figure 10 below illustrates the CDF of percent negative urine samples for Weeks 5–24 with self-reported use incorporated as positive. The figures differ from the plot of a CDF which displays the percent of patients who had a given outcome or less. For this reason, a graph of a cumulative distribution function customarily rises from zero at the left to 100% at the right. In our presentations, the graphs show the percentage of patients who provided a given percentage of negative samples or better. The curves therefore fall from 100% at the left to 0% at the right. For example, in this study, approximately 35% of the patients in the active treatment groups had at least 70% of samples negative. The difference from placebo in the distribution function was statistically significant with p-value<0.0001 for each dose of the active treatment based on the Wilcoxon rank-sum test.
Figure 10: Cumulative Distribution Function of Percentage Abstinence
45
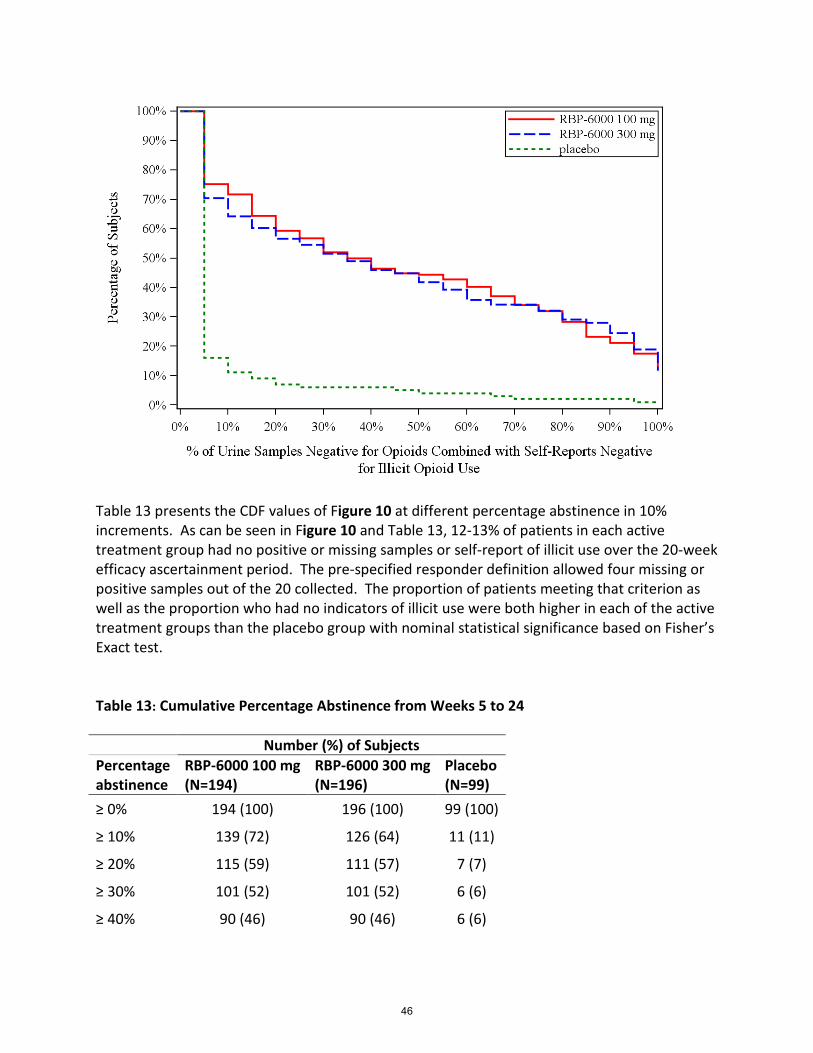
Table 13 presents the CDF values of Figure 10 at different percentage abstinence in 10% increments. As can be seen in Figure 10 and Table 13, 12-13% of patients in each active treatment group had no positive or missing samples or self-report of illicit use over the 20-week efficacy ascertainment period. The pre-specified responder definition allowed four missing or positive samples out of the 20 collected. The proportion of patients meeting that criterion as well as the proportion who had no indicators of illicit use were both higher in each of the active treatment groups than the placebo group with nominal statistical significance based on Fisher’s Exact test. Table 13: Cumulative Percentage Abstinence from Weeks 5 to 24 Number (%) of Subjects Percentage abstinence
RBP-6000 100 mg (N=194)
RBP-6000 300 mg (N=196)
Placebo (N=99)
≥ 0% 194 (100) 196 (100) 99 (100)
≥ 10% 139 (72) 126 (64) 11 (11)
≥ 20% 115 (59) 111 (57) 7 (7)
≥ 30% 101 (52) 101 (52) 6 (6)
≥ 40% 90 (46) 90 (46) 6 (6)
46

≥ 50% 86 (44) 82 (42) 4 (4)
≥ 60% 78 (40) 70 (36) 4 (4)
≥ 70% 66 (34) 67 (34) 2 (2)
≥ 80% 55 (28) 57 (29) 2 (2)
≥ 90% 41 (21) 48 (24) 2 (2)
100% 25 (13) 23 (12) 1 (1) The overall percent of negative tests does not differentiate between, for example, a patient who is abstinent for half the study and then relapses to daily illicit drug use, a patient who continues to use illicit drugs daily for half the study and then stops completely, and a patient who uses intermittently, half the days throughout the study. All of these patients might have 50% of their tests negative. To allow an appreciation of the temporal sequence of patients’ test results, the graphic depictions below show the results of each urine test for each patient. They also distinguish between tests that were imputed as positive in the analyses because they were intermittent missing, or because a patient self-reported drug use, and actual positive tests.
In these subject-level presentations, each individual subject is represented along the y-axis. On the x-axis are the time points during which urine samples were collected. (In this study, urine samples were collected weekly). Blue circular dots are used to represent submission of opioid- negative urine samples at any time point, while red triangular dots are used to represent opioid-positive urine submissions. Ideally, a patient achieving treatment success would have many more blue data points than red data points, particularly along the right-hand side of the x-axis which represents longer periods of time on treatment. The data points that appear black in these presentations are ‘+’ symbols and denote intermittent missing urine data. The red “x” dots indicate where urine samples were negative or missing but subjects self-reported opioids use.
Patients who did not complete the full study are shown at the top of each display and are sorted based on time in the study. Samples after the last dot in the row were missing and were imputed as positive for the purposes of analysis. Completers are shown in the bottom of each display, arranged by time to last positive sample.
Figure 11: Urine Opioid Screen Results for Individual Subjects
47

The Table 14 below illustrates the degree of concordance between urine test findings and self-report. This tabulation shows that the self-report of drug use was negative on over half the occasions on which the patient submitted a sample which was positive. Self-report contributed to detecting drug use in the presence of a negative urine sample in only about 5% of occasions.
Table 14: Urine results vs TLFB Week 5 to Week 24 (Excluding site 20) TLFB
Urine test Missing Negative Positive Total
Missing* 3216 (33%)
41 (0.4%)
18 (0.2%)
3275 (33%)
Negative 37 (0.4%)
3377 (35%)
223 (2%)
3637 (37%)
Positive 30 (0.3%)
1841 (19%)
997 (10%)
2868 (29%)
48

Total 3283 (34%)
5259 (54%)
1238 (13%)
9780 (100%)
Source: Reviewer;*: Missing includes those due to dropouts.
After the study was initiated, the protocol was amended to incorporate a taper at the end of the sublingual film run-in to mitigate the potential effects of abrupt discontinuation on patients blindly switched to placebo injections, which could increase the rate of discontinuations in the placebo arm and lead to a spurious conclusion about efficacy in that arm. A total of 163 (32%) subjects received a 5-day SUBOXONE sublingual film taper following the first injection of study treatment. The cumulative distribution functions of percentage abstinence are depicted by tapering status in Figure 12. The figures illustrate that there was no obvious difference in retention in the placebo group based on presence or absence of tapering.
Figure 12: CDF of the Percentage Abstinence for Subjects by Tapering Status
5.3 Discussion The evidence of efficacy provided includes a single placebo-controlled efficacy study taken together with pharmacodynamic data showing that RBP-6000 blocks the effects of exogenously administered opioids for the entire inter-dose period. We will ask the committee to address whether the available efficacy data from these sources are sufficient to conclude that the drug is effective for the intended use.
49

Review of Safety 6The safety evaluation of RBP-6000 centered on an assessment of the systemic effects of the active ingredient, buprenorphine, in this sustained release formulation. The other principal focus was on the local injection tolerability of RBP-6000 as it relates to injection site injuries.
The safety profile of the drug substance, buprenorphine, has been fairly well-characterized. Given that RBP-6000 provides higher levels of exposure to buprenorphine than the approved transmucosal formulations, on which the safety profile is based, an adequate safety database was needed to characterize effects of higher doses of RBP-6000 when it is indicated for chronic treatment of opioid use disorder. The Applicant was advised to provide a safety database meeting the recommendation of the International Conference on Harmonization (ICH) the size of safety data base to characterize the safety profiles for new drugs. Review of the RBP-6000 safety data did not identify major systemic safety concerns beyond those consistent with the established safety profile of buprenorphine. As such, a primary focus of this discussion will be on the formulation-specific safety findings and the local injection toxicity unique to this novel buprenorphine delivery system. The difference of the safety profiles between high dose regimen RBP-6000 300/300 mg and low dose regimen RBP-6000 300/100 mg will be discussed. Major safety results will be summarized.
RBP-6000 (RBP-6000) Safety Database
A total of 1083 subjects, ages 18-65 years, with opioid use disorder or opioid dependence received at least 1 SC injection of RBP-6000 across 7 studies over the clinical development program (Table 15). A total of 235 subjects in Phase I and II studies received RBP-6000 single dose or multiple doses ranging from 20 to 300 mg with 196 subjects at the 100 mg, 200 mg or 300 mg dose.
A total of 848 subjects received at least one dose of RBP-6000 300 mg in pooled Phase 3 studies (13-0001 and 13-0003). In the Phase 3 double-blind, placebo controlled study (13-0001), a total of 504 treatment-seeking patients with moderate-to-severe opioid use disorder (OUD) as defined by DSM-V diagnosis were randomized to receive either RBP-6000 (RBP-6000) or placebo SC injection for 24 weeks under double-blind conditions after 2 weeks open-label induction and dose adjustment phase with Suboxone film. 203 subjects were randomized into the RBP-6000 300/300 group to receive 6 planned doses of RBP-6000 300 mg and 201 subjects in the RBP-6000 300/100 group to receive 2 doses of 300 mg initially and 4 doses of 100 mg subsequently. A total of 669 subjects with OUD participated in the Phase 3 open-label, long term safety study (13-0003) and they were planned to receive an initial dose of 300 mg and doses were subject to reduction to 100 mg depending on tolerability. 257 subjects were Roll-over subjects from the Phase 3 DB study (13-0001) and were planned to receive an initial dose of 300 mg and followed by up to 5 additional injections with a total of 6 injections. 412 subjects
50

were de novo subjects and were planned to receive an initial dose of 300 mg and followed by up to 11 additional injections with a total of 12 injections.
Table 15: Safety database for RBP-6000 (RBP-6000)
The NDA Data cutoff date was Aug 12, 2016, and the Phase 3 open-label, long-term safety study (13-0003) is still ongoing and the Applicant provided a preliminary safety update regarding SAEs, TEAEs and TEAEs leading to drug discontinuation in the NDA submission. Upon Agency request, the Applicant provided an updated exposure summary by including safety data after the NDA data cutoff date.
Table 16: Injections received by treatment group in Phase 3 studies
Study ID Study design RBP-6000 Dose (mg) Injections (Planned) Sample size Conduction time Phase I RB-US-10-0011 FIH 20 SD 12 11/30/2010-05/31/2011
RB-US-10-0020 SAD 50 SD 12 07/10/2012-02/16/2013100 SD 12200 SD 12
RB-US-13-0060 MW 300 SD 16 09/22/2015-02/10/2016300(Low MW) SD 16300 (high MW) SD 16
Phase II RB-US-12-0005 MAD 50 4 injections 15 10/5/2012-05/04/2014100 4 injections 30200 4 injections 30300 4 injecttions 14
RB-US-13-0002 OB, MD 300 2 injections 39 11/19/2013-07/29/2014Phase III RB-US -13-0001 MC, DB,PC 300/300 6 injections 203 01/28/2015-04/29/2016
300/100 6 injections 201PBO 6 injections 100
RB-US-13-0003 OL, long term De novo 12 injections 412 7/27/2015-08/12/2016300/Flex (Ongoing ) Roll over 6 injections 257300/Flex
Table 6.1: Safety database for (RBP-6000)
51

52

Table 17: Cumulative treatment exposure by treatment group in Phase 3 studies
Table 18: Cumulative exposure by dose level in Phase 3 studies
As summarized in the updated table above provided by the Applicant on Sep 20, 2017 ( Table 16, Table 17, Table 18), 565 (66.6%) subjects received more than 6 injections (300 mg /100 mg) and 395 (43.3 %) subjects received 12 injections (300 mg /100 mg). Cumulatively, 542 subjects were exposed to RBP-6000 at doses of 300mg / 100 mg for more than 24 weeks and 320 subjects were exposed to RBP-6000 at doses of 300mg /100 mg for more than 48 weeks. 187 (22.1%) subjects cumulatively were exposed to RBP-6000 at doses of 300mg / 300 mg for more than 48 weeks. The safety database for both dose regimens (RBP 6000 300/100 mg and 300/300 mg) met ICH criteria for the treatment of chronic disease.
Demographic and Baseline Characteristics in Phase 3 studies
As shown in Table 19, the baseline characteristics (Age, Sex and Race) of the populations were evenly distributed across the RBP-6000 treatment arms (RBP-6000 300/100 mg and RBP-6000 300/300 mg) and placebo arms in the Phase 3 double-blind controlled study (13-0001). Most subjects in the study were white males with an average age of approximately 40 years old. In
53

the Phase 3 open-label, long term safety study, subjects in the Roll-over group were, on average, two years older than the average age.
Table 19: Baseline Demographic for Phase 3 DB study (13-0001)
Table 20: Baseline Demographic for Phase 3 open-label, long term safety study (13-0003)
Demographic ParametersRBP100 (N=203)
n(%)
RBP300 (N=201)
n(%)
PLB (N=100)
n(%)
Total(N=504)
n(%)
SEX Male 136 (67.0) 135 (67.2) 65 (65.0) 336 (66.7) Female 67 (33.0) 66 (32.8) 35 (35.0) 168 (33.3)AGE Mean years (SD) 39.9 (11.3) 39.2 (11.0) 39.1 (10.9) 39.5 (11.1) Median (years) 38 38 38 38 Min, Max (years) 19, 64 19, 64 20, 63 19, 64AGE GROUP < 30 44 (21.7) 45 (22.4) 23 (23.0) 112 (22.2) >=30 < 45 88 (43.3) 95 (47.3) 45 (45.0) 228 (45.2) >=45 < 60 64 (31.5) 53 (26.4) 30 (30.0) 147 (29.2) >=60 7 (3.4) 8 (4.0) 2 (2.0) 17 (3.4)RACE White 140 (69.0) 144 (71.6) 78 (78.0) 362 (71.8) Black 57 (28.1) 55 (27.4) 20 (20.0) 132 (26.2) Asian 0 (0.0) 0 (0.0) 0 (0.0) 0 (0.0) American Indian 4 (2.0) 1 (0.5) 1 (1.0) 6 (1.2) Native Hawaiian 0 (0.0) 0 (0.0) 0 (0.0) 0 (0.0) Other 2 (1.0) 1 (0.5) 1 (1.0) 4 (0.8) Missing Race 0 (0.0) 0 (0.0) 0 (0.0) 0 (0.0)ETHNICITY Hispanic 13 (6.4) 18 (9.0) 10 (10.0) 41 (8.1) Non-Hispanic 190 (93.6) 183 (91.0) 90 (90.0) 463 (91.9) Missing Ethnic 0 (0.0) 0 (0.0) 0 (0.0) 0 (0.0)
Table 6.2: Baseline Demographics for Phase III DB study (13-0001)
54

Baseline Medical history in Phase 3 studies
Demographic Parameters
RBP-6000 DENOVO
(N=412)n(%)
RBP-6000ROLL-OVER
(N=257)n(%)
Total(N=669)
n(%)
SEX Male 263 (63.8) 169 (65.8) 432 (64.6) Female 149 (36.2) 88 (34.2) 237 (35.4)AGE Mean years (SD) 38.4 (12.1) 41.6 (11.1) 39.6 (11.8) Median (years) 36 40 38 Min, Max (years) 19, 65 21, 64 19, 65AGE GROUP < 30 122 (29.6) 40 (15.6) 162 (24.2) >=30 < 45 157 (38.1) 114 (44.4) 271 (40.5) >=45 < 60 107 (26.0) 89 (34.6) 196 (29.3) >=60 26 (6.3) 14 (5.4) 40 (6.0)RACE White 295 (71.6) 168 (65.4) 463 (69.2) Black 107 (26.0) 85 (33.1) 192 (28.7) Asian 2 (0.5) 0 (0.0) 2 (0.3) American Indian 2 (0.5) 2 (0.8) 4 (0.6) Native Hawaiian 0 (0.0) 1 (0.4) 1 (0.1) Other 6 (1.5) 1 (0.4) 7 (1.0) Missing Race 0 (0.0) 0 (0.0) 0 (0.0)ETHNICITY Hispanic 43 (10.4) 16 (6.2) 59 (8.8) Non-Hispanic 369 (89.6) 241 (93.8) 610 (91.2) Missing Ethnic 0 (0.0) 0 (0.0) 0 (0.0)REGION United States 412 (100.0) 257 (100.0) 669 (100.0) Rest of the World 0 (0.0) 0 (0.0) 0 (0.0) Canada 0 (0.0) 0 (0.0) 0 (0.0) South America 0 (0.0) 0 (0.0) 0 (0.0) Europe 0 (0.0) 0 (0.0) 0 (0.0) Asia 0 (0.0) 0 (0.0) 0 (0.0) Africa 0 (0.0) 0 (0.0) 0 (0.0) Other 0 (0.0) 0 (0.0) 0 (0.0)
Table 6.3 Baseline Demographics for Phase III open label, long term safety study (13-0003)
55

Table 21 summarizes the top 10 reported medical histories in the study population at baseline. As summarized in Table 21, the most frequent reported baseline medical histories by preferred term in the study population included Drug abuse, Back pain, Hepatitis C, Hypertension, Depression, Drug dependence, Anxiety, Insomnia, Asthma and Seasonal allergy. More than 10% of subjects reported a history of hepatitis C at the baseline. It appears that a higher percentage subjects in the RBP-6000 treatment group reported a history of hepatitis C, hypertension and depression at baseline compared to the placebo group.
Table 21: Baseline medical history in Phase 3 studies
Table 22: BMI Distribution at baseline in Phase 3 studies
Baseline BMI distribution in Phase 3 studies
Table 22 displays the BMI distribution at baseline in the Phase 3 studies. Approximately 50% of subjects had normal BMI (18.5-25), 30% of subjects were overweight (BMI:25-30) and 20 % of subjects were obese (BMI ≥30) in Phase 3 studies. The RBP-6000 300/300 group had the highest percentage of obese subjects (28%) compared with other groups. Per the Applicant, the impact of BMI on drug absorption is minimal.
6.1 Major Safety Results
6.1.1 Deaths One death occurred in the RBP-6000 300/300 mg treatment arm in the Phase 3 double-blind, controlled study, attributed to gunshot (homicide). This is the only death reported in the
Body System Preferrred term N % N % N % N %Psychiatric disorders Drug abuse 59 59% 169 83% 162 81% 392 59%Musculoskeletal and connective tissue disordersBack pain 8 8% 31 15% 32 16% 45 7%Infections and infestations Hepatitis C 6 6% 32 16% 24 12% 64 10%Vascular disorders Hypertension 4 4% 32 16% 31 15% 57 9%Psychiatric disorders Depression 7 7% 28 14% 23 11% 67 10%Psychiatric disorders Drug dependence 8 8% 25 12% 31 15% 49 7%Psychiatric disorders Anxiety 6 6% 23 11% 22 11% 48 7%Psychiatric disorders Insomnia 4 4% 23 11% 27 13% 42 6%Respiratory, thoracic and mediastinal disorders Asthma 5 5% 12 6% 16 8% 36 5%Immune system disorders Seasonal allergy 7 7% 11 5% 17 8% 19 3%
Table 6.4: Baselinne medical history in Phase III studies
N=203 N=201 N=669RBP-6000 300/100 mg RBP-6000 300/300 mg PBO
N=100
Phase III DB study (13-0001) Phase III OL study (13-0001)RBP-6000 300/Flex
BMIGRP N % N % N % N %> 0 to < 18.5 2 3% 6 3% 2 1% 9 2%>= 18.5 to < 25 33 49% 99 49% 88 44% 220 50%>= 25 to < 30 22 32% 66 33% 55 27% 132 30%>= 30 11 16% 32 16% 56 28% 83 19%
N=100 N=203 N=201 N=669
Table 6.5: BMI distribution at baseline in Phase III studies Phase III DB study (13-0001) Phase III OL study (13-0001)
PBO RBP-6000 300/100 mg RBP-6000 300/300 mg RBP-6000 300/Flex mg
56

clinical development program. Accidental injuries are very typical in patient populations with opioid use disorder.
6.1.2 Serious Adverse Events A total of 75 non-fatal SAEs occurred among 65 subjects across 7 studies with 9 SAEs among 6 subjects in the Phase II MAD study, 15 SAEs among 13 subjects in the pooled Phase I SD studies and a total of 51 SAE cases among 42 subjects in the pooled Phase 3 studies. No Hy’s law cases were identified across the studies. No SAEs related to injection site reactions were reported.
Table 23 summarizes SAEs cases in the Phase I and II studies. Causality assessments revealed that the majority of SAEs were not drug related and most were due to pre-existing diseases. In the Phase 1 molecular weight study (13-0006), one subject developed severe hepatic injury 14 days after the exposure to a single dose of RBP-6000 300 mg PLGH A (Low MW) (Subject ID 0010210). The subject required hospitalization and surgical depot removal at day 15; however, hepatitis C was the confounding factor for this case. Upon Agency request, the Applicant submitted the plasma buprenorphine level profile and other relevant medical information. It appears that the plasma buprenorphine level for this subject was not unusually high compared with other subjects in the same cohort group as illustrated in the figure below. The red line and symbols refer to Subject 001-0210 (Figure 13). Open circles refer to observed plasma concentrations in other subjects of the low MW group. The Applicant also provided further information that the Subject was an IV drug user and was tested positive for hepatitis C at day 17 post exposure. The subject recovered after the RBP-6000 depot removal. It is likely that both drug and hepatitis C contributed to his severe abnormal liver function and newly-diagnosed hepatitis C played a major role. It is worth noting that this is the only case that required surgical removal of RBP-6000 in the clinical development program. Data for surgical removal of RBP-6000 in case of medical emergency is limited for the clinical development program. There were two SAEs of abnormal liver function tests reported in the Phase I single dose ascending study (11-0020). In these cases, peak ALT/AST level occurred 9-11 weeks post exposure when the plasma buprenorphine level was relatively low and therefore drug contribution was likely to be minimal. One subject (Subject ID 1328) had preexisting hepatitis B and C and another subject (Subject ID 1221) had an elevated alkaline phosphatase level.
57
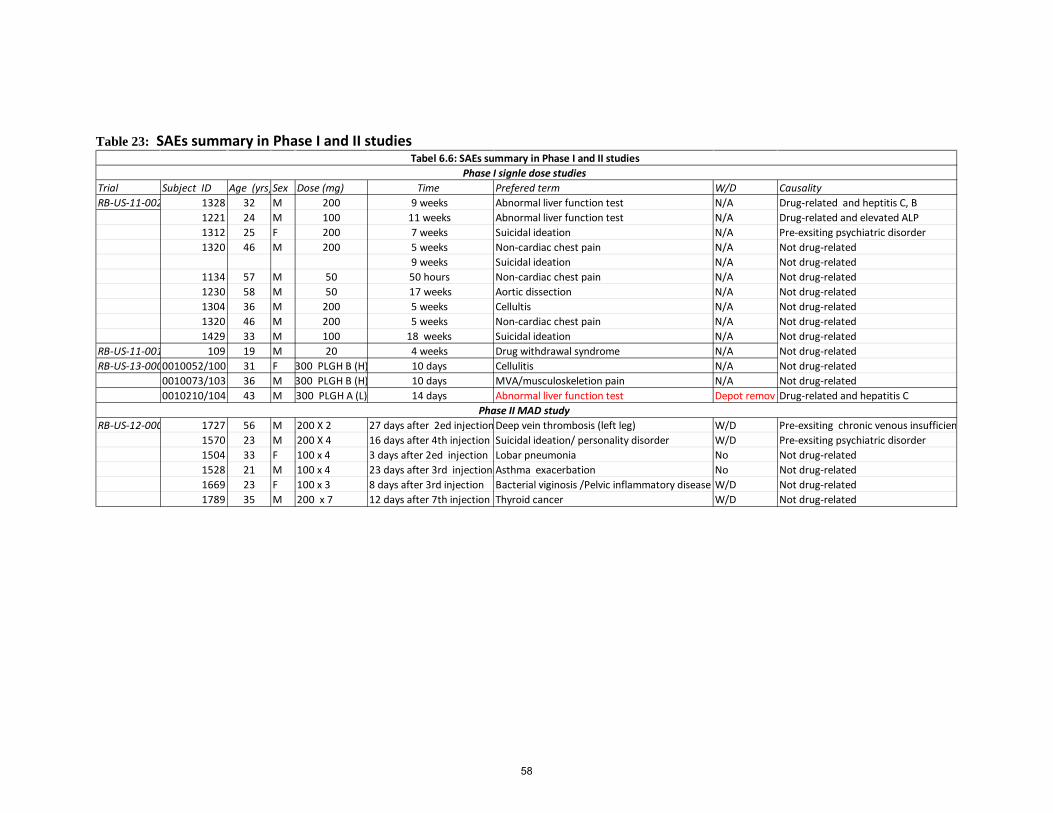
Table 23: SAEs summary in Phase I and II studies
Trial Subject ID Age (yrs)Sex Dose (mg) Time Prefered term W/D Causality RB-US-11-002 1328 32 M 200 9 weeks Abnormal liver function test N/A Drug-related and heptitis C, B
1221 24 M 100 11 weeks Abnormal liver function test N/A Drug-related and elevated ALP1312 25 F 200 7 weeks Suicidal ideation N/A Pre-exsiting psychiatric disorder 1320 46 M 200 5 weeks Non-cardiac chest pain N/A Not drug-related
9 weeks Suicidal ideation N/A Not drug-related 1134 57 M 50 50 hours Non-cardiac chest pain N/A Not drug-related 1230 58 M 50 17 weeks Aortic dissection N/A Not drug-related 1304 36 M 200 5 weeks Cellultis N/A Not drug-related 1320 46 M 200 5 weeks Non-cardiac chest pain N/A Not drug-related 1429 33 M 100 18 weeks Suicidal ideation N/A Not drug-related
RB-US-11-001 109 19 M 20 4 weeks Drug withdrawal syndrome N/A Not drug-related RB-US-13-0000010052/100 31 F 300 PLGH B (H) 10 days Cellulitis N/A Not drug-related
0010073/103 36 M 300 PLGH B (H) 10 days MVA/musculoskeletion pain N/A Not drug-related 0010210/104 43 M 300 PLGH A (L) 14 days Abnormal liver function test Depot remov Drug-related and hepatitis C
RB-US-12-000 1727 56 M 200 X 2 27 days after 2ed injection Deep vein thrombosis (left leg) W/D Pre-exsiting chronic venous insufficien 1570 23 M 200 X 4 16 days after 4th injection Suicidal ideation/ personality disorder W/D Pre-exsiting psychiatric disorder 1504 33 F 100 x 4 3 days after 2ed injection Lobar pneumonia No Not drug-related 1528 21 M 100 x 4 23 days after 3rd injection Asthma exacerbation No Not drug-related 1669 23 F 100 x 3 8 days after 3rd injection Bacterial viginosis /Pelvic inflammatory disease W/D Not drug-related 1789 35 M 200 x 7 12 days after 7th injection Thyroid cancer W/D Not drug-related
Phase I signle dose studies
Phase II MAD study
Tabel 6.6: SAEs summary in Phase I and II studies
58

Figure 13: Buprenorphine Plasma concentration time profile in Subject 001-0210
59

Table 24: SAEs summary for Phase 3 studies
Any SAEs 9 4.50% 5 5% 4 2% 18Body System or Organ Class Preferred term Count % Count % Count % TotalInjury, poisoning and procedural comGun shot wound 2 1.00% . . . . 2 Accidental overdose . . 1 1.00% . . 1Respiratory, thoracic and mediastin Asthma . . 1 1.00% 1 0.50% 2 Pulmonary embolism . . . . 1 0.50% 1General disorders and administratio Drug withdrawal syndrome . . 1 1.00% . . 1 Hernia 1 0.50% . . . . 1Infections and infestations Abscess limb 1 0.50% . . . . 1 Extradural abscess . . 1 1.00% . . 1Cardiac disorders Acute myocardial infarction . . . . 1 0.50% 1Gastrointestinal disorders Food poisoning 1 0.50% . . . . 1Hepatobiliary disorders Cholelithiasis 1 0.50% . . . . 1Neoplasms benign, malignant and u Neuroendocrine carcinoma . . . . 1 0.50% 1Nervous system disorders Myelomalacia 1 0.50% . . . . 1Psychiatric disorders Suicidal ideation . . 1 1.00% . . 1Renal and urinary disorders Renal impairment 1 0.50% . . . . 1Vascular disorders Hypotension 1 0.50% . . . . 1
Any SAEs 23 4.80% 10 4.00% 33Body System or Organ Class Preferred term Count % Count % Total
Any SAEs 23 4.80% 10 4.00%Infections and infestations Cellulitis 3 0.70% 1 0.40% 4 Abscess limb 1 0.20% 1 0.40% 2 Appendicitis . . 1 0.40% 1 Escherichia pyelonephritis . . 1 0.40% 1 Localised infection 1 0.20% . . 1 Pneumonia viral 1 0.20% . . 1 Prostatic abscess 1 0.20% . . 1 Staphylococcal bacteraemia 1 0.20% . . 1 Urinary tract infection 1 0.20% . . 1Injury, poisoning and procedural comAccidental overdose 2 0.50% . . 2 Arthropod bite 1 0.20% . . 1 Laceration 1 0.20% . . 1 Multiple fractures 1 0.20% . . 1 Road traffic accident 1 0.20% . . 1 Thermal burn . . 1 0.40% 1Psychiatric disorders Adjustment disorder with mixed . . 1 0.40% 1 Bipolar I disorder 1 0.20% . . 1 Major depression . . 1 0.40% 1Respiratory, thoracic and mediastin Asthma 1 0.20% 1 0.40% 2 Chronic obstructive pulmonary d 1 0.20% . . 1Nervous system disorders Dizziness 1 0.20% . . 1 Generalised tonic-clonic seizure . . 1 0.40% 1Cardiac disorders Myocardial infarction . . 1 0.40% 1Gastrointestinal disorders Abdominal pain 1 0.20% . . 1Hepatobiliary disorders Gallbladder perforation 1 0.20% . . 1Metabolism and nutrition disorders Hypokalaemia 1 0.20% . . 1Vascular disorders Thrombophlebitis superficial 1 0.20% . . 1
N=412 N=257
-6000 300/300 PBO -6000 300/100 N=203 N=100 N=201
Table 6.7: SAES summary for Phase III studies Phase III double blind, controlled study ( RB-US-13-0001)
Phase III, open label, long term safety study (RB-US-13-0003)BP-6000 DE NOVP-6000 ROLL OV
60
Table 24 summarizes SAEs in the Phase 3 studies. A total of 51 non-fatal SAEs occurred among 42 subjects in the pooled Phase 3 studies with 18 SAEs reported in the Phase 3 double-blind, controlled study and 33 SAEs reported in the Phase 3 open-label, uncontrolled study. In the Phase 3 controlled study (13-0001), SAEs were reported in 4.5% of the RBP-6000 300/300 mg group, 2.0% of the RBP-6000 300/100 group, and 5.0% of the placebo group. In the Phase 3 open-label, uncontrolled study, SAEs were reported in 4.8% of the RBP-6000 De novo group and in 4.0% of the RBP-6000 Roll over group. No pattern was observed in the SAEs distribution. No Hy’s law case was identified in the Phase 3 studies. No SAEs were related to injection site injury. Causality was assessed by reviewing CRF and narrative summaries provided by the Applicant. Most SAEs were not considered to be drug related. SAEs that caused drug discontinuation included gunshot wound, pulmonary embolism, and extradural abscess. The most frequently reported SAEs by body system were infections and infestations, followed by injury, poisoning, procedural complications and psychiatric disorders. Infections, accidental injuries and psychiatric disorder were the most reported medical history at baseline for the patient population (See table 6.4). The most frequently reported SAEs (≥2) by preferred term included cellulitis, abscess limb, asthma, accidental overdose and gunshot wound.
61

Over the course of the NDA review, the Applicant provided in vitro assay data showing that when the product was injected in a tube containing dog blood, an immediate clogging was observed (Report FC-FDV-014R). Based on the in vitro tube assay results, it is likely that an occlusion would form due to rapid solidification of the formulation when placed in aqueous fluid. This raised safety concerns about potential consequence if the product was injected improperly via the IV route. In the clinical development program, the product was administered by health care providers in clinical settings; the chance of improper injection is very low. There were no SAEs related to injection injury. To explore further, all SAEs related to thromboembolic disorder were clustered in a group for analyses. There were 5 SAEs related to thromboembolic disorder across studies as summarized in Table 25. These five cases included one case of deep vein thrombosis (DVT), one case of pulmonary embolism (PE), two cases of acute myocardial infarctions and one case of thrombophlebitis. All these five case occurred in the RBP-6000 treatment group; the DVT case was possibly due to chronic venous insufficiency and the two acute MI events occurred in two subjects who were 50-60 years old and carried pre-existing CVD risks such as hypertension, hyperlipidemia, diabetes mellitus, or smoking. Both acute MI events occurred after the first injection of RBP-6000 300 mg and both subjects remained in the study and received additional 5 SC injections of RBP-6000 without further events. The thrombophlebitis case was attributable to IV cocaine use. There were no other alternative explanations for the PE case and the subject was subsequently withdrawn from the study due to PE. This PE case is considered possibly drug related as there was no alternative explanation for his PE. However, the incidence rate of PE (1/1000) in the study population is not significantly higher than that in the general population. So a causal relationship between PE and RBP-6000 cannot be established at this time.
Table 25: SAEs summary for thromboembolic disorder
6.1.3 Adverse Events Leading to Discontinuation Table 26 displays TEAEs leading to drug discontinuation in the Phase 3 studies. In the Phase 3 double-blind, controlled study (13-0001), the percentage of TEAEs leading to drug discontinuation is higher in the RBP-6000 300/300 mg group (7%) than the RBP-6000 300/100 group (3%), the RBP-6000 300/Flex group (3-4%) and the placebo group (2%). The TEAEs distribution pattern is different between the RBP-6000 300/300 group and the other groups. The most common TEAEs leading to drug discontinuation in the RBP-6000 300/300 mg group by
Trial Subject IDAge Sex Dose (mg) Time Prefered term W/D Causality Alternative explanation RB-US-12-0005 1727 56 M 200 X 2 27 days after 2ed injection Deep vein thrombosis (left leg W/D Not drug related Hx of chronic venous insufficiency RB-US-13-0001 027-0019 52 M 300 x 2, 100 x4 11 days after 1st injection Acute myocardial infarction No Not drug related Hypertension, HLD
042-0019 51 M 300 x 2, 100 x3 21 days after 5th injection Pulmonary embolism W/D Possible drug related RB-US-13-0003 028-008 59 F 300 x 1, 100 x5 5 days after 1st injection Acute myocardial infarction No Not drug related Smoking. Hypertenstion, DM
040-9009 28 M 300 x 8 27 days after 3rd injection Cellulitis/ Thrombophlebitis su No Not drug related IV cocaine use
Table 6.8: SAEs summary for thromboembolic disorders
62
preferred term included elevated liver enzymes, sedation, somnolence, injection site ulcers, nausea which are considered drug related and dose dependent. The most common TEAEs leading to drug discontinuation in the RBP-6000 300/100 mg group by preferred term included drug withdrawal syndrome, constipation and rash. TEAEs leading to drug discontinuation in the RNP-6000 300/Flex group included drug withdrawal syndrome, injection site pain, injection site swelling, abnormal liver function tests, sedation, somnolence and constipation.
63

Table 26: TEAEs leading to drug discontinuation in Phase 3 studies
RBP300/100 m PBO Roll-over Preferred term Any TEAEs 2 2% 7 3% 14 7% 12 3% 1 3% 0 0% 4 4% 40 4.36%Drug withdrawal syndrome 1 1% 2 1% 0 0% 3 1% 0 0% 0 0% 0 0% 6 1%Aspartate aminotransferase increased 0 0% 0 0% 2 1% 1 0% 0 0% 0 0% 0 0% 3 0%Sedation 0 0% 1 0% 1 0% 0 0% 0 0% 0 0% 1 1% 3 0%Constipation 0 0% 1 0% 0 0% 1 0% 0 0% 0 0% 0 0% 2 0%Liver function test increased 0 0% 0 0% 1 0% 1 0% 0 0% 0 0% 0 0% 2 0%Nausea 0 0% 0 0% 1 0% 1 0% 0 0% 0 0% 0 0% 2 0%Somnolence 0 0% 0 0% 1 0% 1 0% 0 0% 0 0% 0 0% 2 0%Accidental overdose 0 0% 0 0% 0 0% 1 0% 0 0% 0 0% 0 0% 1 0%Alanine aminotransferase increased 0 0% 0 0% 1 0% 0 0% 0 0% 0 0% 0 0% 1 0%Diabetes mellitus 0 0% 0 0% 0 0% 1 0% 0 0% 0 0% 0 0% 1 0%Extradural abscess 1 1% 0 0% 0 0% 0 0% 0 0% 0 0% 0 0% 1 0%Formication 0 0% 0 0% 1 0% 0 0% 0 0% 0 0% 0 0% 1 0%Gallbladder perforation 0 0% 0 0% 0 0% 1 0% 0 0% 0 0% 0 0% 1 0%Gamma-glutamyltransferase increased 0 0% 0 0% 1 0% 0 0% 0 0% 0 0% 0 0% 1 0%Gun shot wound 0 0% 0 0% 1 0% 0 0% 0 0% 0 0% 0 0% 1 0%Hepatitis C 0 0% 0 0% 1 0% 0 0% 0 0% 0 0% 0 0% 1 0%Injection site pain 0 0% 0 0% 0 0% 0 0% 0 0% 0 0% 1 1% 1 0%Injection site reaction 0 0% 0 0% 0 0% 1 0% 0 0% 0 0% 0 0% 1 0%Injection site swelling 0 0% 0 0% 0 0% 0 0% 0 0% 0 0% 1 1% 1 0%Injection site ulcer 0 0% 0 0% 1 0% 0 0% 0 0% 0 0% 0 0% 1 0%Lymphadenitis 0 0% 1 0% 0 0% 0 0% 0 0% 0 0% 0 0% 1 0%Migraine 0 0% 0 0% 0 0% 0 0% 1 3% 0 0% 0 0% 1 0%Neutrophil count decreased 0 0% 0 0% 1 0% 0 0% 0 0% 0 0% 0 0% 1 0%Pulmonary embolism 0 0% 1 0% 0 0% 0 0% 0 0% 0 0% 0 0% 1 0%Rash 0 0% 1 0% 0 0% 0 0% 0 0% 0 0% 0 0% 1 0%Vomiting 0 0% 0 0% 1 0% 0 0% 0 0% 0 0% 0 0% 1 0%Weight decreased 0 0% 0 0% 0 0% 0 0% 0 0% 0 0% 1 1% 1 0%
RBP 300 Roll over N=113 N=916
Total
Table 6.9: TEAEs leading to drug discontinuations In Phase III studies
N=100 N=203 N=201 N=412 N=32 N=112
Phase III DB (13-0001) Phase III Open label (13-0003)PBO RBP 300/300 De novo 300/Flex RBP 100 Roll-over
64

Table 27: TEAEs leading to drug dose reduction in Phase 3 open-label study (13-0003)
PBO Roll-over
Preferred term N % N % N % N % N %Any TEAEs 38 9% 5 16% 7 7% 10 9% 61 9%Alanine aminotransferase increased 5 1% 0 0% 1 1% 1 1% 7 1%Sedation 2 0% 0 0% 2 2% 3 3% 7 1%Constipation 4 1% 0 0% 0 0% 1 1% 5 1%Fatigue 2 0% 1 3% 2 2% 0 0% 5 1%Aspartate aminotransferase increased 3 1% 0 0% 0 0% 1 1% 4 1%Nausea 3 1% 0 0% 0 0% 1 1% 4 1%Gamma-glutamyltransferase increased 1 0% 0 0% 2 2% 0 0% 3 0%Headache 3 1% 0 0% 0 0% 0 0% 3 0%Lethargy 2 0% 0 0% 0 0% 1 1% 3 0%Somnolence 3 1% 0 0% 0 0% 0 0% 3 0%Hepatic enzyme increased 1 0% 1 3% 0 0% 0 0% 2 0%Hepatic function abnormal 2 0% 0 0% 0 0% 0 0% 2 0%Injection site pain 1 0% 1 3% 0 0% 0 0% 2 0%Insomnia 2 0% 0 0% 0 0% 0 0% 2 0%Decreased appetite 0 0% 0 0% 1 1% 0 0% 1 0%Dizziness 0 0% 0 0% 0 0% 1 1% 1 0%Erectile dysfunction 0 0% 1 3% 0 0% 0 0% 1 0%Euphoric mood 1 0% 0 0% 0 0% 0 0% 1 0%Flushing 0 0% 0 0% 0 0% 1 1% 1 0%Hypersomnia 1 0% 0 0% 0 0% 0 0% 1 0%Migraine 1 0% 0 0% 0 0% 0 0% 1 0%Muscle twitching 0 0% 1 3% 0 0% 0 0% 1 0%Vomiting 1 0% 0 0% 0 0% 0 0% 1 0%
Total N=669N=412 N=112 N=113
De novo 300/Flex RBP 100 Roll-over RBP 300 Roll over N=32
Table 6.10: TEAEs leading to drug dose reduction in Phase III Open label study (13-0003)
65

Table 27 displays TEAEs leading to drug dose reduction in Phase 3 open-label study (13-0003). In the updated full study, 201 (30%) subjects required dose reduction from 300 mg to 100 mg. Among them, 49 (7.3%) subjects required dose reduction from 300 mg to 100 mg due to 61 TEAEs listed in the Table 27. As summarized in Table 27, the most common TEAEs leading to drug dose reductions included abnormal liver function tests, sedation, constipation, nausea, fatigue and headache . Upon Agency request, the Applicant clarified reasons for treatment dose reductions for other 152 (22.7%) subjects as listed below:
6.1.4 Common Adverse Events: The adverse event profile of sublingual buprenorphine has been previously characterized in the safety database for buprenorphine sublingual tablets and buprenorphine/naloxone sublingual tablets. The adverse event tables from the approved labeling are shown in Appendix B.
Table 28 illustrates the common adverse events by body system and preferred term (more than 2%) in the Phase 3 double-blind study (13-0001). Higher percentages of adverse events by the System Organ Class (SOC) including gastrointestinal disorder, general disorder and administration site conditions, infections, investigation and nervous system disorder were reported in the RBP-6000 treatment group than in the placebo group. Overall, common adverse events profiles were similar between the high-dose regimen RBP-6000 300/300 mg and the low-dose regimen RBP-300/100 mg treatment group. Table 29 displays common adverse events with more than 2 % occurrence in the RBP-6000 treatment group by preferred term in the pooled Phase 3 studies. The most common adverse drug reactions by preferred term included headache, insomnia, constipation, injection site pruritus, injection site pain, nausea, vomiting, fatigue, nasopharyngitis, and upper respiratory tract infection. None of these adverse drug reactions are unexpected.
66
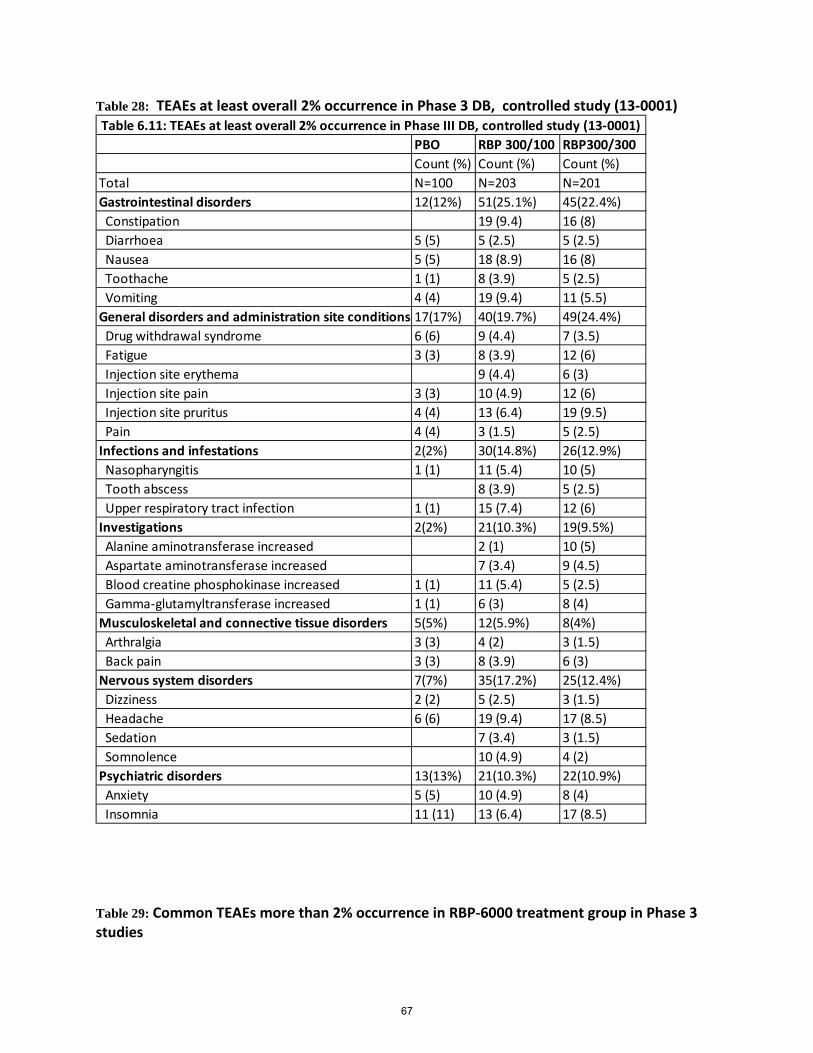
Table 28: TEAEs at least overall 2% occurrence in Phase 3 DB, controlled study (13-0001)
Table 29: Common TEAEs more than 2% occurrence in RBP-6000 treatment group in Phase 3 studies
PBO RBP 300/100 RBP300/300Count (%) Count (%) Count (%)
Total N=100 N=203 N=201Gastrointestinal disorders 12(12%) 51(25.1%) 45(22.4%) Constipation 19 (9.4) 16 (8) Diarrhoea 5 (5) 5 (2.5) 5 (2.5) Nausea 5 (5) 18 (8.9) 16 (8) Toothache 1 (1) 8 (3.9) 5 (2.5) Vomiting 4 (4) 19 (9.4) 11 (5.5)General disorders and administration site conditions 17(17%) 40(19.7%) 49(24.4%) Drug withdrawal syndrome 6 (6) 9 (4.4) 7 (3.5) Fatigue 3 (3) 8 (3.9) 12 (6) Injection site erythema 9 (4.4) 6 (3) Injection site pain 3 (3) 10 (4.9) 12 (6) Injection site pruritus 4 (4) 13 (6.4) 19 (9.5) Pain 4 (4) 3 (1.5) 5 (2.5)Infections and infestations 2(2%) 30(14.8%) 26(12.9%) Nasopharyngitis 1 (1) 11 (5.4) 10 (5) Tooth abscess 8 (3.9) 5 (2.5) Upper respiratory tract infection 1 (1) 15 (7.4) 12 (6)Investigations 2(2%) 21(10.3%) 19(9.5%) Alanine aminotransferase increased 2 (1) 10 (5) Aspartate aminotransferase increased 7 (3.4) 9 (4.5) Blood creatine phosphokinase increased 1 (1) 11 (5.4) 5 (2.5) Gamma-glutamyltransferase increased 1 (1) 6 (3) 8 (4)Musculoskeletal and connective tissue disorders 5(5%) 12(5.9%) 8(4%) Arthralgia 3 (3) 4 (2) 3 (1.5) Back pain 3 (3) 8 (3.9) 6 (3)Nervous system disorders 7(7%) 35(17.2%) 25(12.4%) Dizziness 2 (2) 5 (2.5) 3 (1.5) Headache 6 (6) 19 (9.4) 17 (8.5) Sedation 7 (3.4) 3 (1.5) Somnolence 10 (4.9) 4 (2)Psychiatric disorders 13(13%) 21(10.3%) 22(10.9%) Anxiety 5 (5) 10 (4.9) 8 (4) Insomnia 11 (11) 13 (6.4) 17 (8.5)
Table 6.11: TEAEs at least overall 2% occurrence in Phase III DB, controlled study (13-0001)
67
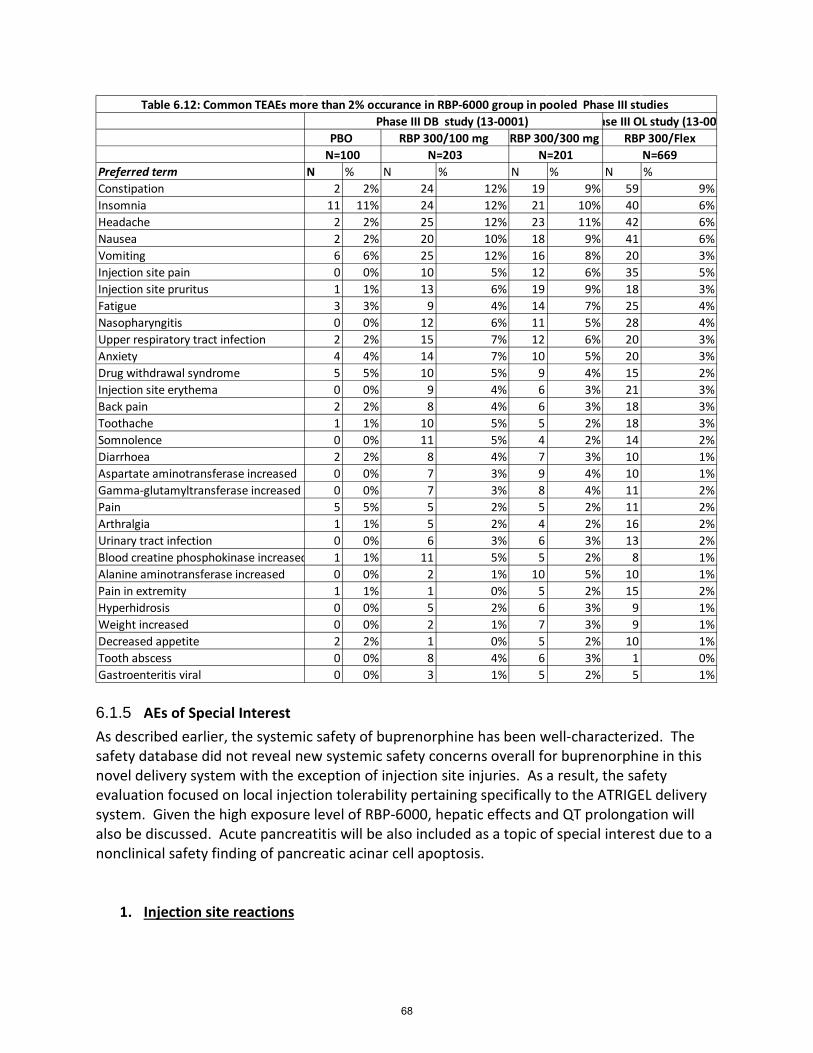
6.1.5 AEs of Special Interest As described earlier, the systemic safety of buprenorphine has been well-characterized. The safety database did not reveal new systemic safety concerns overall for buprenorphine in this novel delivery system with the exception of injection site injuries. As a result, the safety evaluation focused on local injection tolerability pertaining specifically to the ATRIGEL delivery system. Given the high exposure level of RBP-6000, hepatic effects and QT prolongation will also be discussed. Acute pancreatitis will be also included as a topic of special interest due to a nonclinical safety finding of pancreatic acinar cell apoptosis.
1. Injection site reactions
Preferred term N % N % N % N %Constipation 2 2% 24 12% 19 9% 59 9%Insomnia 11 11% 24 12% 21 10% 40 6%Headache 2 2% 25 12% 23 11% 42 6%Nausea 2 2% 20 10% 18 9% 41 6%Vomiting 6 6% 25 12% 16 8% 20 3%Injection site pain 0 0% 10 5% 12 6% 35 5%Injection site pruritus 1 1% 13 6% 19 9% 18 3%Fatigue 3 3% 9 4% 14 7% 25 4%Nasopharyngitis 0 0% 12 6% 11 5% 28 4%Upper respiratory tract infection 2 2% 15 7% 12 6% 20 3%Anxiety 4 4% 14 7% 10 5% 20 3%Drug withdrawal syndrome 5 5% 10 5% 9 4% 15 2%Injection site erythema 0 0% 9 4% 6 3% 21 3%Back pain 2 2% 8 4% 6 3% 18 3%Toothache 1 1% 10 5% 5 2% 18 3%Somnolence 0 0% 11 5% 4 2% 14 2%Diarrhoea 2 2% 8 4% 7 3% 10 1%Aspartate aminotransferase increased 0 0% 7 3% 9 4% 10 1%Gamma-glutamyltransferase increased 0 0% 7 3% 8 4% 11 2%Pain 5 5% 5 2% 5 2% 11 2%Arthralgia 1 1% 5 2% 4 2% 16 2%Urinary tract infection 0 0% 6 3% 6 3% 13 2%Blood creatine phosphokinase increased 1 1% 11 5% 5 2% 8 1%Alanine aminotransferase increased 0 0% 2 1% 10 5% 10 1%Pain in extremity 1 1% 1 0% 5 2% 15 2%Hyperhidrosis 0 0% 5 2% 6 3% 9 1%Weight increased 0 0% 2 1% 7 3% 9 1%Decreased appetite 2 2% 1 0% 5 2% 10 1%Tooth abscess 0 0% 8 4% 6 3% 1 0%Gastroenteritis viral 0 0% 3 1% 5 2% 5 1%
Table 6.12: Common TEAEs more than 2% occurance in RBP-6000 group in pooled Phase III studies
N=100 N=203 N=201 N=669
ase III OL study (13-00PBO RBP 300/100 mg RBP 300/300 mg RBP 300/Flex
Phase III DB study (13-0001)
68

To better understand local injection tolerability, TEAEs with injection site injuries in pooled Phase 3 studies were categorized by actions on the study treatment and AE severity separately. Table 30 shows that most of the injection site injuries were mild to moderate except one subject reported severe injection site pruritus in the RBP-6000 300/300 mg group. Overall, a higher percentage of TEAEs related to injection site injuries were reported in the RBP-6000 300/300 mg group (26%) than the RBP-6000 300/100 mg group (20%), RBP-6000 300/Flex group (9-21%) and placebo group (9%). Table 31 displays TEAEs with injection site injuries by actions on the study treatment. TEAEs related to injection site injuries leading to drug discontinuation included 1 injection site ulcer in the RBP-6000 300/300 mg group, and 1 injection site reaction in the RBP-6000 300/Flex group. A total of 2 subjects required drug dose reduction in the RBP-6000 300/Flex group due to injection site pain. The safety database of RBP-6000 reveals that local injection tolerability of RBP-6000 is acceptable. However, the safety database of RBP-6000 also reveals that the high dose regimen RBP-6000 300/300 mg was less tolerated compared with RBP-6000 300/Flex as evidenced by the higher percentage of TEAEs related to injection site injuries in RBP-6000 300/300 mg group.
69

Table 30: TEAEs related to injection site injuries in Phase 3 studies
RBP300/100 m PBO Roll-over
AE Severity Preferred term N % N % N % N % N % N % N %Any TEAEs 9 9% 42 21% 52 26% 92 22% 3 9% 18 16% 9 8%
MILD Injection site bruising 0 0% 2 1% 2 1% 1 0% 0 0% 0 0% 0 0%MILD Injection site discomfort 0 0% 1 0% 0 0% 3 1% 0 0% 0 0% 0 0%MILD Injection site erythema 0 0% 8 4% 5 2% 16 4% 0 0% 4 4% 1 1%MILD Injection site haematoma 0 0% 0 0% 0 0% 1 0% 0 0% 0 0% 0 0%MILD Injection site haemorrhage 0 0% 0 0% 1 0% 0 0% 0 0% 0 0% 0 0%MILD Injection site induration 0 0% 1 0% 1 0% 6 1% 0 0% 1 1% 0 0%MILD Injection site inflammation 1 1% 0 0% 0 0% 0 0% 0 0% 0 0% 0 0%MILD Injection site mass 0 0% 0 0% 1 0% 0 0% 0 0% 0 0% 0 0%MILD Injection site nodule 0 0% 0 0% 1 0% 0 0% 0 0% 0 0% 0 0%MILD Injection site pain 1 1% 7 3% 10 5% 26 6% 1 3% 2 2% 3 3%MILD Injection site pruritus 4 4% 10 5% 11 5% 14 3% 1 3% 6 5% 2 2%MILD Injection site reaction 0 0% 0 0% 1 0% 0 0% 0 0% 0 0% 0 0%MILD Injection site swelling 0 0% 1 0% 1 0% 1 0% 0 0% 1 1% 1 1%MILD Injection site warmth 0 0% 1 0% 0 0% 0 0% 0 0% 0 0% 0 0%MODERATE Injection site bruising 0 0% 0 0% 0 0% 1 0% 0 0% 0 0% 0 0%MODERATE Injection site dermatitis 0 0% 0 0% 0 0% 0 0% 0 0% 1 1% 0 0%MODERATE Injection site discomfort 0 0% 0 0% 1 0% 1 0% 0 0% 0 0% 0 0%MODERATE Injection site erythema 0 0% 2 1% 3 1% 5 1% 0 0% 0 0% 0 0%MODERATE Injection site induration 0 0% 1 0% 1 0% 1 0% 0 0% 0 0% 0 0%MODERATE Injection site oedema 0 0% 0 0% 1 0% 0 0% 0 0% 0 0% 0 0%MODERATE Injection site pain 2 2% 3 1% 2 1% 12 3% 1 3% 0 0% 2 2%MODERATE Injection site pruritus 1 1% 4 2% 7 3% 3 1% 0 0% 0 0% 0 0%MODERATE Injection site rash 0 0% 0 0% 1 0% 0 0% 0 0% 0 0% 0 0%MODERATE Injection site reaction 0 0% 0 0% 0 0% 1 0% 0 0% 3 3% 0 0%MODERATE Injection site swelling 0 0% 1 0% 0 0% 0 0% 0 0% 0 0% 0 0%MODERATE Injection site ulcer 0 0% 0 0% 1 0% 0 0% 0 0% 0 0% 0 0%SEVERE Injection site pruritus 0 0% 0 0% 1 0% 0 0% 0 0% 0 0% 0 0%
N=113N=100 N=203 N=201 N=412 N=32 N=112
Table 6.13: TEAEs related to injection site injuries Phase III DB (13-0001) Phase III Open label (13-0003)
PBO RBP 300/300 e novo 300/Fle 0 Roll-over 30 300 Roll over 300/F
70

Table 31: TEAEs related to injection site injuries by action on study treatment in Phase 3 studies
Actions on study treatment Preferred term N % N % N % N %DOSE REDUCED Injection site pain 0 0 0 0% 0 0% 2 0%DRUG WITHDRAWN Injection site reaction 0 0 0 0% 0 0% 1 0%DRUG WITHDRAWN Injection site ulcer 0 0 0 0% 1 0% 0 0%
N=100 N=203 N=201 N=669
Table 6.14: TEAEs with injection site injuries by action on study treatment in pooled phase III study Phase III DB study (13-0001) Phase III OL study (13-0003)
PBO RBP-6000 300/100 mg RBP-6000 300/300 mg RBP-6000 300/Flex
71

2. Hepatic effects
Buprenorphine has been associated with hepatitis and other hepatic events. The Warnings and Precautions section of current labeling for sublingual buprenorphine (as Suboxone) includes safety labeling regarding hepatitis and hepatic events as follows:
No Hy’s law case was identified in the clinical development program. As described in SAE Section 6.1.2, a total of 3 SAEs of hepatic injuries were reported in the pooled Phase 1 studies after single dose exposure at 100 mg, 200 mg and 300 mg (Low molecular weight). One subject had newly diagnosed hepatitis C after the drug exposure, one subject had preexisting hepatitis C and B, and one subject had elevated Alkaline Phosphatase level. Therefore, all these three cases do not meet the Hy’s law criteria. This is consistent with the baseline medical history as approximately 10% of patients reported a history of hepatitis C. Safety assessment focused on examining whether hepatic effects are dose-dependent as RBP-6000 has a higher exposure level (>2 ng /ml) compared with approved transmucosal Buprenorphine products. Table 32 displays reported hepatic injury by actions on study treatment in the Phase 3 studies. In the controlled study, a total of 5 (2.5%) TEAEs of hepatic injury resulted in drug discontinuation in the RBP 6000 300/300 mg group vs 0 TEAEs in the RBP-6000 300/100 mg group and the placebo group. A total of 15 (4%) TEAEs of hepatic injuries leading to drug reduction and drug discontinuation were reported in the de novo 300/Flex group.
72
Table 33 displays TEAEs of hepatic injuries by severity. Overall, a higher percentage of TEAEs of hepatic injuries were reported in the RBP-6000 300/300 mg group (13%) , de novo RBP-6000 300/300 mg group (11%) and RBP 300 mg Roll over to 300/flex group (11%) than in other groups. A total of 3 severe TEAEs of hepatic injuries were reported in the RBP-6000 300/300 mg group and 3 severe TEAEs of hepatic injuries were reported in the de novo 300/flex group. In summary, the safety database reveals that hepatic injuries were buprenorphine dose-dependent as evidenced by earlier drop outs due to hepatic injuries in the RBP-6000 300/300 mg group and more subjects requiring dose reduction in the de novo 300/300 group due to hepatic injuries.
73

Table 32: Reported hepatic injuries by action on study treatment in Phase 3 studies
RBP300/100 m PBO Roll-ove
Actions on study reaPreferred term N % N % N % N % N % N % N % Any TEAEs 0 0 0 0 5 2.50% 15 4% 1 3% 1 1% 2 2%
DOSE REDUCED Alanine aminotransferase increased 0 0% 0 0% 0 0% 5 1% 0 0% 1 1% 1 1%DOSE REDUCED Aspartate aminotransferase increased 0 0% 0 0% 0 0% 3 1% 0 0% 0 0% 1 1%DOSE REDUCED Gamma-glutamyltransferase increased 0 0% 0 0% 0 0% 1 0% 0 0% 2 2% 0 0%DOSE REDUCED Hepatic enzyme increased 0 0% 0 0% 0 0% 1 0% 1 3% 0 0% 0 0%DOSE REDUCED Hepatic function abnormal 0 0% 0 0% 0 0% 2 0% 0 0% 0 0% 0 0%DRUG WITHDRAWN Alanine aminotransferase increased 0 0% 0 0% 1 1% 0 0% 0 0% 0 0% 0 0%DRUG WITHDRAWN Aspartate aminotransferase increased 0 0% 0 0% 2 1% 1 0% 0 0% 0 0% 0 0%DRUG WITHDRAWN Gallbladder perforation 0 0% 0 0% 0 0% 1 0% 0 0% 0 0% 0 0%DRUG WITHDRAWN Gamma-glutamyltransferase increased 0 0% 0 0% 1 1% 0 0% 0 0% 0 0% 0 0%DRUG WITHDRAWN Liver function test increased 0 0% 0 0% 1 0% 1 0% 0 0% 0 0% 0 0%
N=113N=100 N=203 N=201 N=412 N=32 N=112
Table 6.15: Reported hepatic injury by actions on study treatment in Phase III studies Phase III DB (13-0001) Phase III Open label (13-0003)
PBO RBP 300/300 e novo 300/Fle 00 Roll-over 30 00 Roll over 30
74

Table 33 Reported hepatic injuries by severity in Phase 3 studies
RBP300/100 m PBO Roll-over
AE Severity Preferred term N % N % N % N % N % N % N %Any TEAEs 1 1% 15 7% 26 13% 44 11% 1 3% 8 7% 12 11%
MILD Alanine aminotransferase increased 0 0% 1 0% 5 2% 4 1% 0 0% 0 0% 3 3%MILD Aspartate aminotransferase increased 0 0% 4 2% 4 2% 3 1% 0 0% 1 1% 3 3%MILD Bilirubin conjugated increased 0 0% 0 0% 1 0% 0 0% 0 0% 0 0% 0 0%MILD Blood bilirubin increased 0 0% 1 0% 1 0% 3 1% 0 0% 0 0% 0 0%MILD Hepatic enzyme increased 0 0% 1 0% 0 0% 1 0% 0 0% 0 0% 0 0%MILD Hepatic function abnormal 0 0% 0 0% 0 0% 1 0% 0 0% 0 0% 0 0%MILD Liver function test increased 0 0% 0 0% 2 1% 4 1% 0 0% 0 0% 0 0%MODERATE Alanine aminotransferase increased 0 0% 1 0% 4 2% 7 2% 0 0% 2 2% 3 3%MODERATE Aspartate aminotransferase increased 0 0% 3 1% 4 2% 7 2% 0 0% 1 1% 3 3%MODERATE Biliary dilatation 0 0% 0 0% 1 0% 0 0% 0 0% 0 0% 0 0%MODERATE Bilirubin conjugated increased 0 0% 0 0% 0 0% 0 0% 0 0% 1 1% 0 0%MODERATE Blood alkaline phosphatase increased 1 1% 1 0% 0 0% 1 0% 0 0% 1 1% 0 0%MODERATE Blood bilirubin increased 0 0% 0 0% 0 0% 1 0% 0 0% 1 1% 0 0%MODERATE Cholelithiasis 0 0% 0 0% 1 0% 1 0% 0 0% 0 0% 0 0%MODERATE Hepatic function abnormal 0 0% 0 0% 0 0% 5 1% 0 0% 0 0% 0 0%MODERATE Liver function test increased 0 0% 3 1% 0 0% 2 0% 0 0% 1 1% 0 0%MODERATE Transaminases increased 0 0% 0 0% 0 0% 1 0% 0 0% 0 0% 0 0%SEVERE Alanine aminotransferase increased 0 0% 0 0% 1 0% 0 0% 0 0% 0 0% 0 0%SEVERE Aspartate aminotransferase increased 0 0% 0 0% 1 0% 0 0% 0 0% 0 0% 0 0%SEVERE Blood bilirubin increased 0 0% 0 0% 0 0% 1 0% 0 0% 0 0% 0 0%SEVERE Hepatic enzyme increased 0 0% 0 0% 0 0% 0 0% 1 3% 0 0% 0 0%SEVERE Hepatic function abnormal 0 0% 0 0% 0 0% 1 0% 0 0% 0 0% 0 0%SEVERE Jaundice 0 0% 0 0% 0 0% 1 0% 0 0% 0 0% 0 0%SEVERE Liver function test increased 0 0% 0 0% 1 0% 0 0% 0 0% 0 0% 0 0%
Table 6.16: Reported hepatic injury by severity in Phase III studies
N=113N=100 N=203 N=201 N=412 N=32 N=112
Phase III DB (13-0001) Phase III Open label (13-0003)PBO RBP 300/300 e novo 300/Fle 0 Roll-over 30 300 Roll over 300/
75

Table 34 and Table 35 displays subjects with liver function test values greater than the upper limit of normal post-baseline in the Phase 3 double-blind study (13-0001) and Phase 3 open-label study (13-0003), respectively. Overall, a higher percentage of subjects in the RBP-6000 treatment groups had LFT values greater than 2 X ULN post-baseline than in the placebo group. It is unclear if the percentage of abnormal LFT value in the RBP-6000 treatment group is higher than would be expected with Suboxone treatment.
Table 34: Subjects with LFT values greater than upper limit of normal in Phase 3 DB study (13-0001)
Liver Lab Test
ALT ≥ ULNEvent Count
Subject Count
% of Subjects
Event Count
Subject Count
% of Subjects
Event Count
Subject Count % of Subjects
2x ULN 20 12 12.00 100 35 17.24 151 36 17.913x ULN 8 4 4.00 34 11 5.42 72 25 12.445x ULN 5 2 2.00 17 5 2.46 19 7 3.48
10x ULN 2 1 1.00 8 2 0.99 9 3 1.4920x ULN 1 1 1.00 2 1 0.49 0 0 0.00
AST ≥ ULNEvent Count
Subject Count
% of Subjects
Event Count
Subject Count
% of Subjects
Event Count
Subject Count % of Subjects
2x ULN 8 6 6.00 108 25 12.32 155 33 16.423x ULN 3 1 1.00 50 16 7.88 56 23 11.445x ULN 3 1 1.00 13 6 2.96 17 8 3.98
10x ULN 2 1 1.00 2 1 0.49 5 4 1.9920x ULN 1 1 1.00 1 1 0.49 0 0 0.00
ALP ≥ ULNEvent Count
Subject Count
% of Subjects
Event Count
Subject Count
% of Subjects
Event Count
Subject Count % of Subjects
2x ULN 2 2 2.00 15 3 1.48 2 1 0.503x ULN 0 0 0.00 14 2 0.99 0 0 0.005x ULN 0 0 0.00 1 1 0.49 0 0 0.00
10x ULN 0 0 0.00 0 0 0.00 0 0 0.0020x ULN 0 0 0.00 0 0 0.00 0 0 0.00
TB ≥ ULNEvent Count
Subject Count
% of Subjects
Event Count
Subject Count
% of Subjects
Event Count
Subject Count % of Subjects
1.5x ULN 1 1 1.00 2 2 0.99 5 2 1.002x ULN 0 0 0.00 1 1 0.49 1 1 0.503x ULN 0 0 0.00 0 0 0.00 0 0 0.00
Table 6.18: Subjects with LFT values greater than Upper limit of Normal in Phase III DB study (13-0001)
RBP-6000 300 mgN = 201
Placebo RBP-6000 100 mgN = 100 N = 203
76

Table 35: Subjects with LFT values greater than upper limit of normal in Phase 3 open-label study (13-0003)
3. QT prolongation A signal for QT prolongation has been identified in a study of transdermal buprenorphine used for analgesia. The extent of prolongation noted was considered to meet the threshold for regulatory concern, a value which is used to determine whether or not the effect of a drug on the QT/QTc interval in target patient populations should be studied intensively during later stages of drug development. The potential for doses of buprenorphine used for the treatment of opioid dependence to prolong the QT interval has not yet been evaluated in formal QT studies. An EKG data base (over 11,900 EKG in over 1100 subjects with OUD), including time-matched buprenorphine samples was submitted in this NDA. The data are under review by the CDER QT-IRT team. A Customized MedDRA Query (CMQ) regarding cardiac disorder was performed in pooled Phase 3 studies and Table 36 displays TEAEs of cardiac disorder including cardiac arrhythmia and reported abnormal EKG findings in Phase 3 studies. Overall, TEAEs of cardiac disorder were rarely reported and evenly distributed across groups. As described earlier in SAE Section 6.1.2, one SAE of acute myocardial infarction was reported in the RBP-300/100
Liver Lab Test
ALT ≥ ULNEvent Count
Subject Count
% of Subjects
Event Count
Subject Count % of Subjects
2x ULN 336 84 20.39 169 48 18.683x ULN 173 51 12.38 70 21 8.175x ULN 70 29 7.04 26 9 3.50
10x ULN 20 12 2.91 6 1 0.3920x ULN 4 2 0.49 0 0 0.00
AST ≥ ULNEvent Count
Subject Count
% of Subjects
Event Count
Subject Count % of Subjects
2x ULN 297 84 20.39 181 44 17.123x ULN 136 45 10.92 94 25 9.735x ULN 59 21 5.10 39 13 5.06
10x ULN 19 11 2.67 5 2 0.7820x ULN 2 2 0.49 0 0 0.00
ALP ≥ ULNEvent Count
Subject Count
% of Subjects
Event Count
Subject Count % of Subjects
2x ULN 38 10 2.43 19 5 1.953x ULN 12 3 0.73 16 3 1.175x ULN 2 1 0.24 2 1 0.39
10x ULN 0 0 0.00 0 0 0.0020x ULN 0 0 0.00 0 0 0.00
TB ≥ ULNEvent Count
Subject Count
% of Subjects
Event Count
Subject Count % of Subjects
1.5x ULN 25 11 2.67 3 3 1.172x ULN 11 6 1.46 0 0 0.003x ULN 3 1 0.24 0 0 0.00
Table 6.19: Subjects with LFT values greater than Upper limit of Normal in Phase III OL study (13-0003)
RBP-6000 DE Novo RBP-6000 Roll-OverN = 412 N = 257
77
group at the early stage of the treatment, which was attributed to preexisting cardiac risks and the subject continued to receive the treatment after the event. The other SAE of acute myocardial infarction was reported in a subject who rolled over from the RBP-6000 group. After the event, the subject continued to receive drug treatment and completed the trial. Both SAEs of acute myocardial infarction were considered not drug related.
78

Table 36: TEAEs related to cardiac disorder in Phase 3 studies
RBP300/100 mg PBO Roll-over 300/Fl
AE Severity Preferred term N % N % N % N % N % N % N %Any TEAEs 5 5% 9 4% 9 4% 12 3% 0 0% 1 1% 4 4%
MILD Bradycardia 0 0% 0 0% 1 0% 2 0% 0 0% 0 0% 0 0%MILD Electrocardiogram QT prolonged 0 0% 2 1% 2 1% 2 0% 0 0% 1 1% 0 0%MILD Electrocardiogram ST-T change 0 0% 0 0% 0 0% 2 0% 0 0% 0 0% 1 1%MILD Heart rate increased 1 1% 0 0% 2 1% 2 0% 0 0% 0 0% 2 2%MILD Sinus arrhythmia 0 0% 1 0% 0 0% 0 0% 0 0% 0 0% 0 0%MILD Sinus bradycardia 0 0% 0 0% 0 0% 2 0% 0 0% 0 0% 0 0%MILD Sinus tachycardia 1 1% 0 0% 1 0% 0 0% 0 0% 0 0% 0 0%MILD Supraventricular extrasystoles 0 0% 0 0% 1 0% 1 0% 0 0% 0 0% 0 0%MILD Tachycardia 1 1% 1 0% 0 0% 0 0% 0 0% 0 0% 0 0%MILD Ventricular extrasystoles 0 0% 0 0% 1 0% 0 0% 0 0% 0 0% 0 0%MODERATE Bradycardia 0 0% 0 0% 0 0% 1 0% 0 0% 0 0% 0 0%MODERATE Bundle branch block right 0 0% 1 0% 0 0% 0 0% 0 0% 0 0% 0 0%MODERATE Electrocardiogram QT prolonged 0 0% 0 0% 1 0% 0 0% 0 0% 0 0% 0 0%MODERATE Electrocardiogram T wave abnorm 0 0% 1 0% 0 0% 0 0% 0 0% 0 0% 0 0%MODERATE Supraventricular tachycardia 0 0% 1 0% 0 0% 0 0% 0 0% 0 0% 0 0%MODERATE Tachycardia 1 1% 1 0% 0 0% 0 0% 0 0% 0 0% 0 0%MODERATE Wolff-Parkinson-White syndrome 1 1% 0 0% 0 0% 0 0% 0 0% 0 0% 0 0%SEVERE Acute myocardial infarction 0 0% 1 0% 0 0% 0 0% 0 0% 0 0% 0 0%SEVERE Myocardial infarction 0 0% 0 0% 0 0% 0 0% 0 0% 0 0% 1 1%
Table 6.17: TEAEs of cardiac disorders in Phase III studies Phase III DB (13-0001) Phase III Open label (13-0003)
PBO RBP 300/300 De novo 300/Flex RBP 100 Roll-over 300/Flex RBP 300 Roll over 300/Flex N=113N=100 N=203 N=201 N=412 N=32 N=112
79
4. Acute pancreatitis
A standardized MedDRA Query (SMQ) regarding pancreatitis disorder was performed in pooled Phase 3 studies and Table 37 displays TEAEs related to pancreatitis in Phase 3 studies. Although nonspecific symptoms such as nausea, vomiting were frequently reported in both placebo group and RBP-6000 treatment group, very few cases reported pancreatic enzymes increased (amylase, trypsin and lipase). TEAEs related to pancreatic enzymes increased were evenly distributed between placebo group and RBP-6000 treatment group. The safety database of RBP-6000 doesn’t reveal that acute pancreatitis is a new safety signal.
80

Table 37: TEAEs related to pancreatitis topic in Phase 3 studies
6.2 Safety Summary Major safety data were collected from 848 subjects who received RBP-6000 300/300 mg or RBP-300/100 mg or RBP-6000 300/Flex SC injection in the Phase 3 double-blind study and the Phase 3 open-label, long term safety study. Safety database for RBP-6000 met ICH criteria for the treatment of chronic disease as more than 500 patients were exposed to RBP-6000 for more than 6 month and more than 100 patients were exposed to RBP-6000 at 300 mg for more than one year cumulatively. The identified risks of RBP-6000 include Central Nervous System
Preferred Term N % N % N %Any TEAEs 23 23% 62 31% 18 9%Abdominal distension 0 0% 1 0% 0 0%Abdominal pain 3 3% 2 1% 2 1%Abdominal pain upper 1 1% 5 2% 3 1%Abdominal tenderness 0 0% 1 0% 0 0%Amylase increased 2 2% 2 1% 0 0%Blood bilirubin increased 0 0% 1 0% 1 0%Blood trypsin increased 0 0% 2 1% 0 0%Lipase increased 1 1% 3 1% 1 0%Nausea 7 7% 20 10% 19 9%Pancreatitis 0 0% 0 0% 1 0%Vomiting 9 9% 25 12% 18 9%
Preferred term N % N %Any TEAEs 80 19% 33 13%Abdominal distension 1 0% 1 0%Abdominal pain 6 1% 1 0%Abdominal pain upper 1 0% 2 1%Amylase increased 1 0% 2 1%Blood bilirubin increased 5 1% 1 0%Blood trypsin increased 0 0% 1 0%Jaundice 1 0% 0 0%Lipase increased 2 0% 2 1%Nausea 40 10% 14 5%Pancreatic enzymes incr 1 0% 0 0%Vomiting 22 5% 9 4%
De novo
N=203 N=201
Roll over N=412 N=257
TEAEs related to pancreatitis topic in Phase III open label study (13-0003)
N=100Placebo RBP 300/100 mg RBP 300/300 mg
TEAEs related to pancreatitis topic in Phase III double blind study (13-0001)
81

(CNS) effects, Gastrointestinal (GI) effects, hepatic effects and injection site reactions and all of these risks are expected. The overall safety experience of RBP-6000 is consistent with the safety profile of buprenorphine. The local injection tolerability is consistent with other approved products using the ATRIGEL Delivery System as most of injection site reactions were mild to moderate. However, it appears that the RBP-6000 300/300 mg regimen was less well tolerated compared to the RBP-6000 300/100 mg regimen and the RBP-6000 300/ Flex regimen, as evidenced by a higher percentage of TEAEs of injection site injuries and hepatic injuries reported in the RBP-6000 300/300 mg group, and more early drop outs occurring in the RBP-6000 300 /300 mg group due to TEAEs in the pooled Phase 3 studies. The most common TEAEs leading to drug discontinuation included elevated liver enzymes, injection site reactions, sedation, constipation, somnolence, lethargy, and drug withdrawal syndrome. A total of 201 (30%) subjects in the Phase 3 long term study required treatment dose reductions (from RBP-6000 300 mg to RBP-6000 100 mg). Among them, 49 (7.3%) subjects required dose reduction from 300 mg to 100 mg due TEAEs. Most common TEAEs leading to drug dose reduction included abnormal liver function tests, sedation, constipation, nausea, fatigue and headache.
Accidental Exposure via IV route
The product has been administered by a health care provider in a clinical setting during the clinical development period. There are no data on take-home use or self-administration of the product by patients. There is a risk that patients, many of whom have a history of intravenous drug abuse, could improperly self-administer the product via the IV route if they were to have access to the product, which might cause life-threatening consequences.
While some of the risks of RBP-6000 are similar to those of the approved transmucosal buprenorphine products, RBP-6000 has a higher potential for adverse consequences of IV misuse or abuse than existing transmucosal buprenorphine products for the following reasons.
• RBP-6000 may be less subject to abuse via snorting (the most common route of abuse of transmucosal buprenorphine products) due to the difficulty of converting it to powder.
• RBP-6000 contains a large dose of buprenorphine (100 mg or 300 mg) without naloxone in a prefilled syringe and could be appealing to IV drug users.
o More than 40%% of patients in clinical trials reported injection drug use in the past.
o
.
82

o RBP-6000 could also be injected IV as-is, from the pre-filled syringe.
No human and animal data for IV use of RBP-6000 were included in the NDA submission. However, the Applicant has demonstrated that injection of RBP-6000 into tubing containing dog blood leads to immediate clogging. It is likely that if RBP-6000 were injected IV, an occlusion would form due to rapid solidification of the formulation when placed in aqueous fluid. An occlusion can cause local tissue damage or necrosis, which could cause secondary embolism and may present a risk of pulmonary embolism if it migrates to the lung.
Based on the factors described, the product should be administered by a health care provider in a clinical setting and an appropriate REMS would be needed to prevent the product from being in the hands of the patient prior to administration.
Risk Mitigation Strategy 7
7.1 REMS Background Information Section 505-1 of the Food, Drug, and Cosmetic Act (FDCA), added to the law by the Food Drug Administration Amendments Act of 2007 (FDAAA), authorizes the FDA to require pharmaceutical Applicants to develop and comply with a risk evaluation and mitigation strategy (REMS) for a drug if FDA determines that a REMS is necessary to ensure that the benefits of the drug outweigh the risks. A REMS is a required risk management plan that uses risk minimization strategies beyond the professional labeling. The elements of a REMS can include: a Medication Guide or patient package insert (PPI), a communication plan to healthcare providers, elements to assure safe use (described below), and an implementation system. FDAAA also requires that all REMS approved for drugs or biologics under New Drug Applications (NDA) and Biologics License Applications (BLA) have a timetable for submission of assessments of the REMS. These assessments are prepared by the Applicant and reviewed by FDA.
A Medication Guide provides FDA approved patient-focused labeling and can be required as part of the approved labeling if FDA determines one or more of the following apply:
• Patient labeling could help prevent serious adverse events.
• The product has serious risks that could affect a patient’s decision to use or continue to use the drug.
• Patient adherence to directions is crucial to product effectiveness.
83
A communication plan consists of FDA approved materials used to aid an Applicant’s implementation of the REMS and/or inform healthcare providers about serious risk(s) of an approved product. This can include, for example, “Dear Healthcare Professional” letters, collaboration with professional societies, and education pieces (such as letters, drug fact sheets) to inform prescribers of the risks and the safe use practices for the drug.
Elements to assure safe use (ETASU) can include one or more of the following requirements:
• Healthcare providers who prescribe the drug have particular training or experience or special certifications
• Pharmacies, practitioners, or healthcare settings that dispense the drug are specially certified
• The drug may be dispensed only in certain healthcare settings
• The drug may be dispensed to patients with evidence of safe-use conditions
• Each patient must be subject to monitoring
• Patients must be enrolled in a registry
Since ETASU can impose significant burdens on the healthcare system and reduce patient access to treatment, ETASU are required only if FDA determines that the product could be approved only if, or would be withdrawn unless, ETASU are required to mitigate a specific serious risk listed in the labeling. Accordingly, the statute [FDCA 505-1(f)(2)] specifies that ETASU:
• Must be commensurate with specific serious risk(s) listed in the labeling.
• Cannot be unduly burdensome on patient access to the drug.
• To minimize the burden on the healthcare delivery system, must, to the extent practicable, conform with REMS elements for other drugs with similar serious risks and be designed for compatibility with established distribution, procurement, and dispensing systems for drugs.
Before a REMS is considered, standard strategies such as professional labeling and Medication Guides are used to minimize risks associated with drugs and therapeutic biologics. These strategies minimize risks in a number of ways. They can communicate specific risk information,
84

as well as information regarding optimal product use. In addition, they can provide guidance and/or encourage adherence to certain prescribing, dispensing, or monitoring requirements, and/or limit use of a product to only the most appropriate situations or patient populations.
7.2 Existing REMS for Similar Products
Currently, all buprenorphine products indicated for the medication-assistant treatment (MAT) of opioid dependence are approved with a REMS. This includes the Suboxone/Subutex REMS, the shared system Buprenorphine Transmucosal Products for Opioid Dependence (BTOD) REMS and the Probuphine REMS.
The Suboxone and /Subutex REMS, and BTOD REMS consist of a Medication Guide and ETASU (i.e., safe use conditions and monitoring). The REMS for these products are required to address an increase in accidental exposures in children, increased misuse and abuse, as well as to improve prescribing practices of these products. The goals of these REMS are to:
• Mitigate the risks of accidental overdose, misuse, and abuse
• Inform prescribers, pharmacists, and patients of the serious risks associated with buprenorphine-containing products
The safe use conditions covered under the ETASU specifies how the prescriber should verify that the patient meets criteria for opioid use dependence and counsel the patient on risks discussed in the Medication Guide counsel the patient about the safe storage of the medication, and prescribe a limited amount of medication at the first visit. Both REMS have educational brochures for prescribers and pharmacists. The REMS also includes an Appropriate Use Checklist for prescribers which describes the safe use conditions and monitoring requirements for prescribing buprenorphine-containing transmucosal products for opioid dependence. Prescribers should use the checklist, or some other method/system specific to their practice, to document safe use conditions and also to document that each patient has received the required clinical monitoring. The Suboxone/Subutex and BTOD REMS programs require the manufacturers of those products to make the REMS materials available to prescribers and pharmacists, however the REMS requirements are not linked to distribution; there are no requirements under the REMS that need to be met in order for the medication to be prescribed or dispensed.
Probuphine is an implantable formulation of buprenorphine. The goal of the Probuphine REMS is to mitigate the risk of complications of migration, protrusion, expulsion and nerve damage
85

associated with insertion and removal of Probuphine and the risks of accidental overdose, misuse and abuse by:
1. Ensuring that healthcare providers are educated on the following:
• proper insertion and removal of Probuphine
• risk of complications of migration, protrusion, expulsion and nerve damage associated with the insertion and removal of Probuphine
• risks of accidental overdose, misuse and abuse if an implant comes out or protrudes from the skin
2. Informing patients about the risks of complications of migration, protrusion, expulsion and nerve damage associated with insertion and removal, as well as the risks of accidental overdose, misuse and abuse if an implant comes out or protrudes from the skin.
This program contains a Medication Guide and the ETASU of healthcare provider (HCP) certification (i.e., HCP that prescribes and/or inserts Probuphine must be certified) and patient monitoring for removal of Probuphine. There are corresponding REMS materials for HCP education, enrollment, logging of insertion and removal procedures and patient education. The training with this REMS is linked to the ability to prescribe, insert and remove Probuphine.
7.3 Risk Management Considerations
7.3.1 Applicant’s REMS Proposal
In their NDA submission, the Applicant proposed a REMS with a Medication Guide, ETASU, implementation system and a timetable for submission of assessments. The Applicant’s rationale for their proposed REMS includes that the product contains high doses of medication (100 mg or 300 mg of buprenorphine) and the long acting formulation increases the risk for CNS depression if used concomitantly with other CNS depressants. The high doses and lack of naloxone may appeal to those who abuse opioids by injecting them. The Applicant also studied the extractability of RBP-6000. If the product was diverted and extraction was attempted, they found that the buprenorphine could be easily extracted with common household solvents. To limit the ability for RBP-6000 to be diverted, misused and abused, they proposed a REMS with a Medication Guide and ETASU. The proposed ETASU would use the existing federal requirements to limit the dispensing of the medication to certain healthcare settings that are DEA registrants or specially-qualified prescribers in office practice settings who are Drug Addiction Treatment Act of 2000 (DATA 2000)-waived (See Appendix A). Their distribution of the product would exclude dispensing in retail pharmacy settings, which they believe would
86

prevent dispensing directly to the patient for self-administration. Their proposed REMS goal is to:
• Mitigate the risks of accidental overdose, misuse and abuse
• Inform prescribers, pharmacists and patients of the serious risks of RBP-6000
• Inform prescribers, pharmacists and patients about the long acting nature of RBP-6000
The Applicant asserts that once injected as directed into the subcutaneous space, the product is not readily misused, abused and diverted. They propose to minimize misuse, abuse and diversion of RBP-6000 by requiring that it is dispensed only in certain healthcare settings and administered by an HCP. The Applicant is proposing that RBP-6000 only be dispensed or sold to prescribers who are DATA 2000-waived in an office-based setting and hospitals, integrated health system out-patient clinics, long-term care facilities, Department of Defense facilities, prisons, and inpatient psychiatric units that are DEA registrants. In addition, RBP-6000 could be administered in federally approved opioid treatment programs (OTPs) where a DATA 2000-waiver is not required. They propose to use already existing databases such as the DEA Registration Validation website or the Substance Abuse and Mental Health Services Administration (SAMHSA) Buprenorphine Practitioner Verification websites to verify the status of the facility and/or prescriber of their ability to prescribe, receive and store the product. The Applicant is also proposing to include ETASU that includes safe use and monitoring similar to that seen in the other programs for outpatient buprenorphine for MAT.
The Applicant has proposed the following materials relevant to their proposed REMS:
• HCP Brochure—this material summarizes important safety issues and messages needed to manage and counsel patients about safe use of this product for prescribers and pharmacists.
• Appropriate Use Checklist—a tool for prescribers to use with patients at the office visits.
• Patient Alert Card—a card for patients to carry that alerts HCPs that they have are on RBP-6000 therapy and some of the characteristics of this treatment that HCPs should be aware of.
• Letters to prescribers, pharmacists and professional societies informing them about the REMS
87

7.3.2 Agency REMS Proposal
The RBP-6000 risk profile differs from the other buprenorphine products indicated for MAT that are approved with REMS. The Agency is particularly concerned about the potential risks associated with this product, because it is an injectable form of buprenorphine and will be available in prefilled syringes with needles attached. It is ready to inject and also easier to inject than other formulations, and is in a final product configuration that is typically dispensed for outpatient use. As noted by the Applicant, there is inherently a potential high risk for abuse and misuse with this product since, given the proposed indication, many patients prescribed this medication will have a history of IV drug abuse. More than 40% of subjects in the clinical studies reported history of injection drug use. Importantly, as it is not the proposed route of administration, IV injection of RBP-6000 was not studied in the clinical program. The Agency is concerned about the potential downstream adverse events (AEs) that may result from IV injection of RBP-6000 (i.e. embolus, rapid dissolution resulting in high levels of opioid).
Because the RBP-6000 risk profile differs from the approved buprenorphine products indicated for MAT, the Agency is considering a REMS that focuses on the risks that are specific to RBP-6000.
The goal of the Agency’s proposed REMS is to mitigate potential adverse consequences due to intravenous self-administration by the patient by ensuring that RBP-6000 is only dispensed and administered in certain healthcare settings by a HCP. Accidental exposure is not included in the Agency’s proposed goals because the injectable formulation and administration in healthcare settings reduces this risk.
At the current time, the Agency is considering REMS that limits dispensing of RBP-6000 to certain settings that have a DATA-waived prescriber or are DEA registrants to prevent dispensing directly to the patient for home use. This approach is consistent with the Applicant’s proposal.
Additionally, the Agency is considering requiring healthcare settings that include both inpatient and outpatient services and integrated health care systems (e.g., Kaiser Permanente, Department of Defense) to become certified to dispense RBP-6000 if they wish to use this treatment. The Agency is currently evaluating how medications are stored and move through these types of healthcare systems to better understand and characterize how direct patient dispensing could be avoided. The Agency is concerned particularly with how the Applicant would ensure that the medication is not dispensed directly to patients. A one-time certification would include a requirement that those settings put policies and procedures in place to prevent RBP-6000 from being dispensed directly to the patient for self-administration at home. The addition of the one-time healthcare setting certification does add some burden to these
88

particular settings, but would ensure that they are aware and agree to institute policies and procedures to prevent dispensing of RBP-6000 directly to patients.
7.4 Discussion FDA has the authority to require a REMS if additional measures beyond the labeling are necessary to ensure the benefits of a drug outweigh the risks. In considering a risk management program for RBP-6000, FDA is considering that a REMS with restriction of dispensing to certain healthcare settings would support safe use of RBP-6000. The Agency’s proposed REMS does not require that prescribers certify, but utilizes existing laws and databases to help ensure safe use of the product and administration by HCPs thereby minimizing potential AEs that may result from misuse and abuse of the product. The FDA proposal also includes a potential requirement of certifying healthcare settings that include both inpatient and outpatient services and integrated healthcare settings to ensure that they are aware and agree to institute policies and procedures to prevent dispensing of RBP-6000 directly to patients for home use. The FDA would like the AC panel members to opine on this proposal.
Discussion and Points for Consideration 8
The safety database did not identify major new safety issues compared to the established safety profile of transmucosal buprenorphine and the injections seemed to be well-tolerated, with few patients discontinuing due to injection site issues or hepatic injuries. However, this formulation, which is supplied in a pre-filled syringe, may present specific safety issues. If patients obtain direct access to the product, there is a risk that they or others may choose to attempt to inject the product intravenously. Notably, the consequences of intravenous injection of the contents of the pre-filled syringe are not known, but based on in vitro evaluation, it is anticipated that there is a risk of occlusion, tissue damage, and emboli.
We will ask the committee to address whether the product-specific safety concerns have been adequately characterized by the existing safety data, and whether a REMS is necessary to ensure safe use of the product. We will also ask whether the proposed REMS is sufficient to mitigate the risks.
Conclusion
89

We agree with Indivior that the data provide convincing evidence that RBP-6000 is effective in blocking the effects of exogenously administered opioids at clinically-relevant doses. However, it is apparent that this blockade can be overcome, or that blockade is not a deterrent to continuing illicit opioid use in all patients. In the clinical trial, many patients on a full blocking dose submitted opioid-positive urine samples or reported ongoing use. However, 12-13% of patients in each active treatment group had no positive or missing samples or self-report of illicit use over the 20-week efficacy ascertainment period, as compared to a single patient in the placebo group. The pre-specified responder definition allowed four missing or positive samples out of the 20 collected. The proportion of patients meeting that criterion as well as the proportion who had no indicators of illicit use were both higher in each of the active treatment groups than the placebo group. We will ask the Committee whether they agree that the Applicant has provided substantial evidence of efficacy for RBP-6000 in the treatment of opioid dependence.
The expanded safety database (including updated safety data after the NDA data cutoff date) did not identify major new safety issues compared to the established safety profile of transmucosal buprenorphine, despite higher plasma exposures. We will ask the committee to address whether the product-specific safety concerns have been adequately characterized by the existing safety data, and whether a REMS is necessary to ensure safe use of the product. We will also ask whether the proposed REMS is sufficient to mitigate the risks.
Appendix A: Legal and Regulatory Issues Constraining Buprenorphine 9Treatment
Buprenorphine is a Schedule III Controlled Substance and physicians prescribing buprenorphine must comply with the relevant aspects of the Controlled Substances Act. In addition, the provision of agonist treatment of opioid addiction is governed by certain legal requirements. Unlike methadone, buprenorphine may be prescribed by physicians meeting certain requirements.
Methadone treatment of opioid addiction is delivered in a closed distribution system (opioid treatment programs, OTPs) that originally required special licensing by both Federal and State authorities, under the Narcotic Addict Treatment Act of 1974. The current regulatory system is accreditation-based, but OTPs must still comply with specific regulations that pertain to the way clinics are run, the credentials of staff, and the delivery of care. To receive methadone maintenance, patients are required to attend an OTP, usually on a daily basis, with the possibility of earning the privilege of taking home doses as their treatment stability increases. Buprenorphine may also be administered to patients at OTPs.
90
Buprenorphine treatment is covered Title XXXV of the Children’s Health Act of 2000 (P.L. 106-310), which provides a “Waiver Authority for Physicians Who Dispense or Prescribe Certain Narcotic Drugs for Maintenance Treatment or Detoxification Treatment of Opioid-Dependent Patients.” This part of the law is known as the Drug Addiction Treatment Act of 2000 (DATA 2000). Under the provisions of DATA 2000, qualifying physicians may obtain a waiver from the special registration requirements in the Narcotic Addict Treatment Act of 1974, and its enabling regulations, to treat opioid addiction with Schedule III, IV, and V opioid medications that have been specifically approved by FDA for that indication, and to prescribe and/or dispense these medications in treatment settings other than licensed OTPs, including in office-based settings. At present, the only products covered by DATA 2000 (i.e., Schedule III-IV, approved for the indication) are buprenorphine products
To qualify for a DATA 2000 waiver, physicians must have completed at least 8 hours of approved training in the treatment of opioid addiction or have certain other qualifications defined in the legislation (e.g., clinical research experience with the treatment medication, certification in addiction medicine) and must attest that they can provide or refer patients to necessary, concurrent psychosocial services. The 8 hour training courses are provided by various physician organizations (e.g. APA) and delivered in-person, in web-based formats, or through other mechanisms. Physicians who obtain DATA 2000 waivers may treat opioid addiction with products covered by the law in any appropriate clinical settings in which they are credentialed to practice medicine.
Comprehensive Addiction and Recovery Act (CARA) of 2016 (P.L. 114-198) extended the privilege of prescribing buprenorphine in office-based settings to qualifying nurse practitioners (NPs) and physician assistants (PAs) until Oct. 1, 2021. CARA requires that NPs and PAs complete 24 hours of training to be eligible for a prescribing waiver.
Appendix B: Common Adverse Events in buprenorphine studies from 10approved labeling
ADVERSE REACTIONS In a comparative study, adverse event profiles were similar for subjects treated with 16 mg buprenorphine and naloxone sublingual tablets or 16 mg buprenorphine HCl sublingual tablets. The following adverse events were reported to occur by at least 5% of patients in a 4-week study (Table 38).
91

Table 38: Common adverse events in Buprenorphine studies from approved labeling
Adverse Events (≥ 5%) by Body System and Treatment Group in a 4-week Study
N (%) N (%) N (%)
Body System /Adverse Event (COSTART
Terminology)
Buprenorphine and Naloxone Sublingual Tablets 16 mg/day
N=107
Buprenorphine HCl Sublingual Tablets
16 mg/day N=103
Placebo
N=107
Body As A Whole Asthenia 7 (6.5%) 5 (4.9%) 7 (6.5%) Chills 8 (7.5%) 8 (7.8%) 8 (7.5%) Headache 39 (36.4%) 30 (29.1%) 24 (22.4%) Infection 6 (5.6%) 12 (11.7%) 7 (6.5%) Pain 24 (22.4%) 19 (18.4%) 20 (18.7%) Pain Abdomen 12 (11.2%) 12 (11.7%) 7 (6.5%) Pain Back 4 (3.7%) 8 (7.8%) 12 (11.2%) Withdrawal Syndrome 27 (25.2%) 19 (18.4%) 40 (37.4%) Cardiovascular System Vasodilation 10 (9.3%) 4 (3.9%) 7 (6.5%) Digestive System Constipation 13 (12.1%) 8 (7.8%) 3 (2.8%) Diarrhea 4 (3.7%) 5 (4.9%) 16 (15%) Nausea 16 (15%) 14 (13.6%) 12 (11.2%) Vomiting 8 (7.5%) 8 (7.8%) 5 (4.7%) Nervous System Insomnia 15 (14%) 22 (21.4%) 17 (15.9%) Respiratory System
Rhinitis 5 (4.7%) 10 (9.7%) 14 (13.1%) Skin And Appendages Sweating 15 (14%) 13 (12.6%) 11 (10.3%) The adverse event profile of buprenorphine was also characterized in the dose-controlled study of buprenorphine solution, over a range of doses in four months of treatment. Table 4 shows adverse events reported by at least 5% of subjects in any dose group in the dose-controlled study.
92
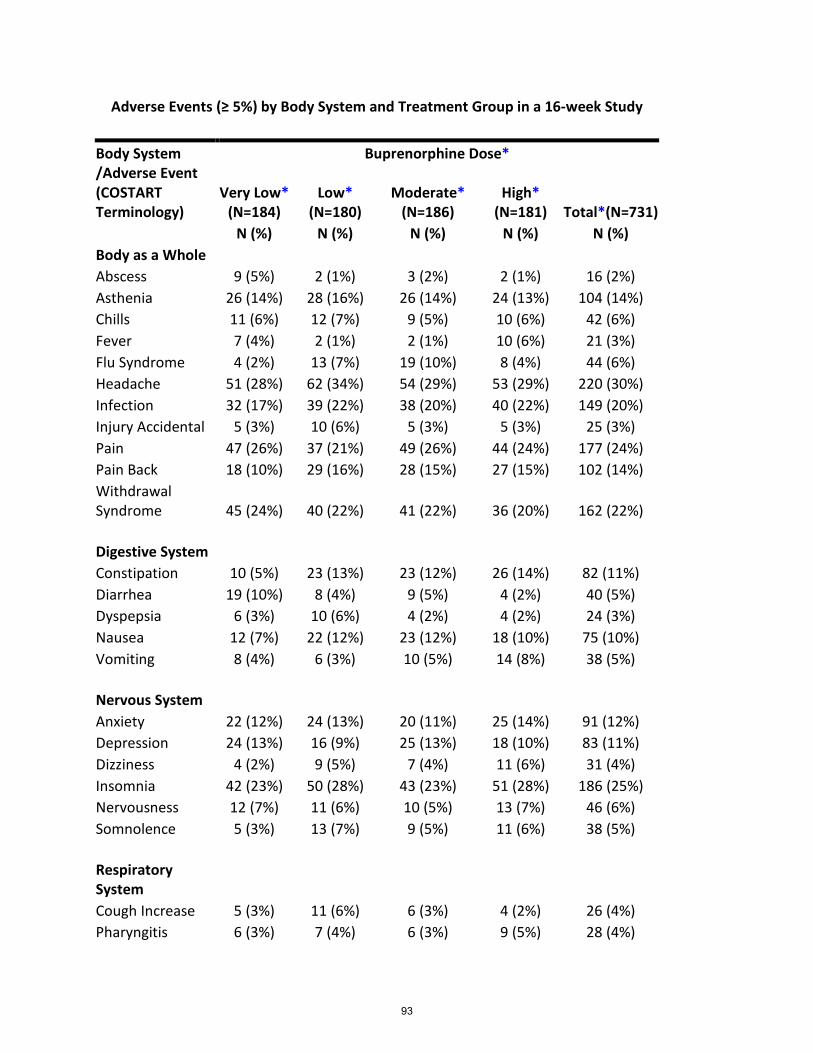
Adverse Events (≥ 5%) by Body System and Treatment Group in a 16-week Study
Body System /Adverse Event (COSTART Terminology)
Buprenorphine Dose*
Very Low* (N=184)
Low* (N=180)
Moderate* (N=186)
High* (N=181) Total*(N=731)
N (%) N (%) N (%) N (%) N (%) Body as a Whole Abscess 9 (5%) 2 (1%) 3 (2%) 2 (1%) 16 (2%) Asthenia 26 (14%) 28 (16%) 26 (14%) 24 (13%) 104 (14%) Chills 11 (6%) 12 (7%) 9 (5%) 10 (6%) 42 (6%) Fever 7 (4%) 2 (1%) 2 (1%) 10 (6%) 21 (3%) Flu Syndrome 4 (2%) 13 (7%) 19 (10%) 8 (4%) 44 (6%) Headache 51 (28%) 62 (34%) 54 (29%) 53 (29%) 220 (30%) Infection 32 (17%) 39 (22%) 38 (20%) 40 (22%) 149 (20%) Injury Accidental 5 (3%) 10 (6%) 5 (3%) 5 (3%) 25 (3%) Pain 47 (26%) 37 (21%) 49 (26%) 44 (24%) 177 (24%) Pain Back 18 (10%) 29 (16%) 28 (15%) 27 (15%) 102 (14%) Withdrawal Syndrome 45 (24%) 40 (22%) 41 (22%) 36 (20%) 162 (22%) Digestive System Constipation 10 (5%) 23 (13%) 23 (12%) 26 (14%) 82 (11%) Diarrhea 19 (10%) 8 (4%) 9 (5%) 4 (2%) 40 (5%) Dyspepsia 6 (3%) 10 (6%) 4 (2%) 4 (2%) 24 (3%) Nausea 12 (7%) 22 (12%) 23 (12%) 18 (10%) 75 (10%) Vomiting 8 (4%) 6 (3%) 10 (5%) 14 (8%) 38 (5%) Nervous System Anxiety 22 (12%) 24 (13%) 20 (11%) 25 (14%) 91 (12%) Depression 24 (13%) 16 (9%) 25 (13%) 18 (10%) 83 (11%) Dizziness 4 (2%) 9 (5%) 7 (4%) 11 (6%) 31 (4%) Insomnia 42 (23%) 50 (28%) 43 (23%) 51 (28%) 186 (25%) Nervousness 12 (7%) 11 (6%) 10 (5%) 13 (7%) 46 (6%) Somnolence 5 (3%) 13 (7%) 9 (5%) 11 (6%) 38 (5%) Respiratory System Cough Increase 5 (3%) 11 (6%) 6 (3%) 4 (2%) 26 (4%) Pharyngitis 6 (3%) 7 (4%) 6 (3%) 9 (5%) 28 (4%)
93

Rhinitis 27 (15%) 16 (9%) 15 (8%) 21 (12%) 79 (11%) Skin and Appendages Sweat 23 (13%) 21 (12%) 20 (11%) 23 (13%) 87 (12%) Special Senses Runny Eyes 13 (7%) 9 (5%) 6 (3%) 6 (3%) 34 (5%)
*Sublingual solution. Doses in this table cannot necessarily be delivered in tablet form, but for comparison purposes: “Very low” dose (1 mg solution) would be less than a tablet dose of 2 mg; “Low” dose (4 mg solution) approximates a 6 mg tablet dose; “Moderate” dose (8 mg solution) approximates a 12 mg tablet dose; “High” dose (16 mg solution) approximates a 24 mg tablet dose.
94

Department of Health and Human Services Public Health Service
Food and Drug Administration Center for Drug Evaluation and Research
Office of Surveillance and Epidemiology Review (OSE) Office of Pharmacovigilance and Epidemiology (OPE)
Epidemiology: Pediatric Buprenorphine Exposures and Outcomes
Date: October 4, 2017 Reviewer: James Phillip Trinidad, M.P.H., M.S. Division of Epidemiology II
Sara Karami, Ph.D., M.P.H. Division of Epidemiology I Team Leader Monique Falconer, M.D., M.S. Division of Epidemiology II Jacqueline Puigbo, Ph.D., M.S. Division of Epidemiology I Associate Director: Judy Staffa Ph.D., R.Ph. Public Health Initiatives Office of Surveillance and Epidemiology Drug Name: Buprenorphine Subject Pediatric buprenorphine exposures and outcomes Application Type/Number: NDA 209819 Applicant/sponsor: Indivior Inc. OSE RCM #: 2017-1467
**NEISS-CADES adverse drug event reports are obtained by FDA through an interagency agreement with the Centers for Disease Control and Prevention (CDC). The data/information cannot be released to the public/non-FDA personnel without CDC approval, obtained through the FDA/CDER Office of Surveillance and Epidemiology** **This document contains proprietary data from the American Association of Poison Control Centers obtained by FDA under contract. The poison control center data/information cannot be released to the public/non-FDA personnel without contractor approval obtained through the FDA/CDER Office of Surveillance and Epidemiology.**
95

TABLE OF ABBREVIATIONS
AAPCC American Association of Poison Control Centers
ADE Adverse drug event
CI Confidence interval
DAAAP Division of Anesthesia, Analgesia, and Addiction Products
DEPI Division of Epidemiology
DMAT Data Management and Analysis Team
ED Emergency department
FDA Food and Drug Administration
MedDRA Medical Dictionary for Regulatory Activities
NDA New drug application
NDF-RT National Drug File Reference Terminology
NEISS-CADES National Electronic Injury Surveillance System–Cooperative Adverse Drug Event Surveillance
NPDS National Poison Data Systems
NVSS-M National Vital Statistics System – Mortality
ODEII Office of Drug Evaluation II
OPE Office of Pharmacovigilance and Epidemiology
OSE Office of Surveillance and Epidemiology
PCCs Poison Control Centers
QA Quality Assurance
QC Quality Control
RADARS Researched Abuse, Diversion, and Addiction-Related Surveillance System
U.S. United States
96

TABLE OF CONTENTS
EXECUTIVE SUMMARY ............................................................................................................. 3 1 INTRODUCTION ................................................................................................................... 4 2 METHODS AND MATERIALS ............................................................................................ 5
2.1 Poison Control Center Exposure Calls – Data Source and Methods ............................... 5 2.2 Emergency Department Visits – Data Source and Methods ........................................... 6 2.3 Drug-Involved Mortality – Data Source and Methods .................................................... 7 2.4 RESULTS ........................................................................................................................ 7 2.5 Emergency Department Visits (NEISS-CADES) - Results............................................. 9 2.6 Drug-Involved Mortality - Results ................................................................................ 11
3 DISCUSSION of the Main Findings ..................................................................................... 11 4 CONCLUSION ..................................................................................................................... 12 5 REFERENCES ...................................................................................................................... 13 6 APPENDIX A: National Poison Data System Definition of Exposure Reasons for Unintentional Exposures ............................................................................................................... 15 7 APPENDIX B: National Poison Data System Definition of Medical Outcomes .................. 16 8 APPENDIX C: Supplemental Tables and Figures ................................................................ 17
97


1 INTRODUCTION
In August 2017, the Division of Anesthesia, Analgesia, and Addiction Products (DAAAP) requested assistance from the Division of Epidemiology I and II (DEPI-I and DEPI-II) to examine updated information on the number of accidental pediatric exposures to buprenorphine, alone or in combination with naloxone. This information will be used to provide context for the DAAAP reviews and preparation for Advisory Committee (AC) meeting (October 31, 2017) was scheduled to discuss the benefits and risks of the new drug application (NDA) for buprenorphine.
Indivior Pharmaceuticals, Inc. (the Sponsor) developed a new buprenorphine formulation for subcutaneous bolus injections as a substitute for oral buprenorphine (including formulations that contain naloxone) (NDA 209819). The Sponsor developed this product, in part, to respond to concerns about accidental pediatric exposures to transmucosal buprenorphine products. This argument was made for Probuphine®, a buprenorphine product subdermally administered in rod implants.1
Published analyses have examined accidental pediatric buprenorphine exposures and outcomes using the following United States (U.S.) data sources: the Researched Abuse, Diversion, and Addiction-Related Surveillance System (RADARS), the Poison Control Center (PCC) Program, and the National Electronic Injury Surveillance System–Cooperative Adverse Drug Event Surveillance (NEISS-CADES) project. Lavonas and colleagues conducted a cross-sectional study that characterized calls to PCCs participating in the RADARS Poison Center Program from October 2009 through March 2012.2 Children from 28 days to less than 6 years old were included in analyses, and formulations included products with buprenorphine only and products with buprenorphine in conjunction with naloxone. Cases were excluded if they were classified as “not followed, judged as nontoxic exposure (clinical effects not expected)” and “not followed, minimal clinical effects possible”, and cases classified as “unable to follow, judged as a potentially toxic exposure” were included if the case was admitted to the hospital. There were 2,380 total calls for unintentional buprenorphine exposures in young children, of which 2,271 (95.4%) calls were for exposures involving only buprenorphine products.
Budnitz and colleagues used NEISS-CADES data to conduct a cross-sectional analysis of estimated number of emergency department (ED) visits for unsupervised buprenorphine/naloxone ingestions by children <6 years of age during 2008–2015.3 During this study period, there were 8,136 ED visits (95% CI [4,892-11,380]) for buprenorphine/naloxone ingestions by young children. There were fewer ED visits per year during 2013-2015 (799 ED visits per year, 95% CI [324-1,274]) than during 2008-2010 (1,246 ED visits per year, 95% CI [662-1,830]). Most visits required hospitalization (61.6%, 95% CI [46.7%-76.5%]).
DAAAP specifically requested that DEPI characterize the magnitude of pediatric accidental exposure to buprenorphine products and describe any change that might have occurred over the last few years. To fulfill the request, DEPI provided updated data analyses from the two data sources above.
DEPI-I extended the study period for AAPCC-NPDS to 2015 to provide more updated information. For NEISS-CADES, the analysis was limited to years 2010-2015 rather than 2008-2015 because there was a change to unit-dose packaging3 for most buprenorphine products beginning in 2010 which might have affected the interpretation of the published results.
DEPI-II expanded the analysis of NEISS-CADES to include single-ingredient buprenorphine, rather than just buprenorphine-naloxone products. DEPI-II also reviewed drug-involved mortality data to further describe the magnitude of the issue with accidental pediatric exposure to buprenorphine and buprenorphine containing products.
In addition, the age range was increased up to 10 years old, because there were no published data confirming that less than 6 years old is the age group of most concern. The 10 year old upper limit seemed appropriate as the NEISS-CADES definition of unsupervised ingestions includes children up to 10 years old. These data will provide background and context for the AC meeting.
99

2 METHODS AND MATERIALS
The methods used to describe exposure calls and adverse outcomes involving buprenorphine are described below by data source. This review describes:
- unintentional general exposure calls to U.S. PCCs of the AAPCC-NPDS and involving buprenorphine among children <10 years of age from 2010 through 2015;
- national estimates of ED visits for unsupervised buprenorphine ingestions by children <10 years of age from 2010 through 2015, using NEISS-CADES data; and
- deaths involving buprenorphine among children <10 years of age from 2010 through 2014, according to the NVSS-M files linked with death certificate literal text.
2.1 POISON CONTROL CENTER EXPOSURE CALLS – DATA SOURCE AND METHODS
Data source
The NPDS, maintained by the AAPCC, captures data on calls to U.S. PCCs on a near real-time basis. Currently, AAPCC’s 55 PCCs serves the entire U.S. population, individuals across the 50 states as well as U.S. territories including, American Samoa, District of Columbia, Federated States of Micronesia, Guam, Puerto Rico, and the U.S. Virgin Islands. Over time the number of PCCs has varied; there were 60 participating centers in 2010 and 55 in 2015.4 PCCs receive calls for exposures to a variety of substances through the Poison Help Line 24 hours per day, offer medical advice, and document reported events in the database. Quality control (QC) measures are used to ensure the accuracy and completeness of the data collected. This report is a retrospective analysis of data obtained from the NPDS.
Case records in the database reflect information provided when the public or healthcare professionals call about an actual or potential exposure to a substance or request information or educational materials. Each year the database is locked to prevent inadvertent changes and ensure consistent, reproducible reports. The 2015 database was locked in July 2016. Exposures do not necessarily represent a poisoning or overdose, as the AAPCC does not completely verify the accuracy of every report made to member centers.
AAPCC-NPDS information on poisoning events throughout the U.S. are captured in near real-time,4 and is one of the few data sources that captures data on reasons for exposure.
Methods
Generic codes and product codes for pharmaceutical preparations with buprenorphine (N=1 generic code and N=246 product codes) were identified using Micromedex® Solutions.5 Information on all human “unintentional” buprenorphine exposure calls involving children <10 years of age during the period of January 1, 2010 through December 31, 2015 were extracted on August 18, 2017. NPDS describes unintentional exposures as exposures resulting from the wrong dose, incorrect route of administration, administration to the wrong person, or administration of the wrong substance.6 Unintentional exposure calls are further categorized by NPDS into unintentional general, environmental, occupational therapeutic error, and unknown. Definitions for these unintentional exposure reason categories can be found in Appendix A. The current review primarily focuses on calls for unintentional general buprenorphine exposures among children 0-10 years of age. Unintentional general exposures, according to NPDS, are the most common unintentional exposures in children and include scenarios where a toddler may get into and swallow medicine.6
Trends and patterns in buprenorphine exposure calls were analyzed separately for single-substance exposures (calls involving only one product), multiple-substance exposure (calls involving more than one product) and for total exposures (calls involving a single product or multiple products) by year. Trends and patterns in buprenorphine calls were further analyzed by select age groups (<6 years and 6-10 years). Age-specific annual unintentional general buprenorphine exposure call rates per million population were calculated using age-specific population estimates prepared by the Census Bureau in collaboration with the National Center for Health Statistics.7
100
This review describes the medical outcomes associated with unintentional general buprenorphine exposures, excluding clinical effects coded as “confirmed non-exposures” or “unrelated effect, the exposure was probably not responsible for the effect(s)”. The following medical outcome categories6 were examined: (1) no effect, (2) minor effect, (3) moderate effect, (4) major effect, (5) death/death indirect report, and (6) other1. Medical outcome tables generated in this report display counts classified as minor effects, moderate effects, major effects, or death/death indirect for exposures with a documented related clinical effect. Definitions for medical outcome categories can be found in Appendix B.
Analyses of AAPCC-NPDS data in this review included independent quality assurance (QA) / QC that was performed using the same criteria by a separate analyst. Results from the two independent analyses agreed.
2.2 EMERGENCY DEPARTMENT VISITS – DATA SOURCE AND METHODS
Data source
NEISS-CADES is a national stratified probability sample of approximately sixty hospitals with a minimum of six beds and a 24-hour ED in the United States and its territories. The NEISS-CADES project, which has been described in detail elsewhere,8-10 is a joint effort of the Centers for Disease Control and Prevention, the U.S. Consumer Product Safety Commission, and the U.S. Food and Drug Administration. In brief, trained coders located at each participating hospital review clinical records of every ED visit to identify clinician-diagnosed adverse drug events (ADE), to report up to two medications implicated in each adverse event, and to record narrative descriptions of the incident. NEISS-CADES codes the clinical description and circumstances surrounding the ADE (including medication errors) using the Medical Dictionary for Regulatory Activities (MedDRA) version 9.1. Medications were categorized into standardized generic drug names based on the Veterans Health Administration National Drug File Reference Terminology (NDF-RT).
The NEISS-CADES data has a high positive predictive value (PPV = 92%)9 for case identification, includes a nationally representative sample of EDs, has 93-100% completeness of patient demographics, and continuous operation since 2004.
Methods
Analyses projected national estimates ED visits for unsupervised ingestions (defined using MedDRA code 10064368, accidental drug intake by child) of buprenorphine or buprenorphine/naloxone by children <10 years old. Statistically stable estimates were attained for the whole study period and for two-year periods (2010-2011, 2012-2013, and 2014-2015). According to CDC, national estimates based on <20 cases in any given year, or a total estimate <1,200, or with a coeffıcient of variation greater than 30% are statistically unstable, and estimates for years 2011, 2012, 2013, and 2015 alone were considered statistically unstable based on these criteria. Trends in ED visits were described by age group (<6 years and 6-10 years) and by the number of medications involved in the ADE. The proportion of ED visits resulting in hospitalization (i.e., disposition of admitted, transferred, or observed) was also estimated for each two-year period and for the whole study period. Age-specific rates of ED visits per million population were calculated using age-specific population estimates prepared by the Census Bureau in collaboration with the National Center for Health Statistics.7
National estimates of ED visits from 2010 to 2015 and the corresponding 95% confidence intervals (CIs) were calculated using SAS, version 9.4 (SAS Institute), and accounted for the sample weights and complex sampling design.
1 The other medical outcome category includes the following sub-categories: not followed, judged as nontoxic exposure (clinical effects not expected); not followed, minimal clinical effects possible (no more than minor effect possible); unable to follow, judged as a potentially toxic exposure; and missing.
101

2.3 DRUG-INVOLVED MORTALITY – DATA SOURCE AND METHODS
Data source
National data on drug-involved mortality were made available to the Agency by the National Center for Health Statistics. Drug-involved mortality data combine the cause-of-death, demographic, and geographic information from the NVSS-M, with information extracted from the death certificate literal text. These data allow for a more granular analysis of specific drugs involved in deaths.11 The analytical dataset was constructed for analysis on October 6, 2016. The method used to extract information on drug-involved mortality has been described previously11 and is briefly described here. The literal text information had been processed to allow for the identification of cases of drug-involved mortality, i.e., mortality cases having at least one literal text mention of a drug, drug class, or exposure not otherwise specified, excluding mentions where information in the literal text suggests that the drug was not involved in the death. For example, the drug “METHICILLIN” in the phrase “METHICILLIN RESISTANT STAPHYLOCOCCUS AUREUS INFECTION” does not suggest drug involvement in mortality, but rather a type of bacterial infection. Similarly, the phrase “NOT DRUG RELATED” clearly indicates that a death did not involve drugs.
The main strength of the drug-involved mortality data is the high accuracy in identifying the drugs mentioned and involved in mortality, according to death certificate literal text.11
Methods
Analyses quantified the number of deaths from any cause and with buprenorphine involvement among children <10 years old who were U.S. residents, from 2010 through 2014. Mentions of buprenorphine were identified using previously defined search terms.11 Analyses examined whether deaths involved only buprenorphine (with or without naloxone involvement) or involved other drugs2 as well. Trends and patterns in deaths were further analyzed by select age groups (<6 years and 6-10 years). Reasons for buprenorphine exposure were examined indirectly by quantifying the number of deaths which were definitely not due to accidental pediatric exposures, i.e., deaths that were suicides (underlying cause-of-death codes X60-X84, Y87.0, or U03) or homicides (underlying cause-of-death codes X85-Y09, Y87.1, U01-U02).
2.4 RESULTS
2.4.1 Poison Control Center Exposure Calls - Results There were 6,819 unintentional buprenorphine exposures calls to AAPCC from 2010-2015 among children <10 years (Table 1). Of those unintentional buprenorphine exposures calls, 6,727 ( 98.7%) were classified as unintentional general exposures. The majority of unintentional buprenorphine exposures calls, 6,513 (95.5%), were single-substance exposures.
2 In determining involvement of drugs other than buprenorphine and naloxone, the following terms for drugs were not included: CHEMICAL, CNS DEPRESSANT, DRUG, MEDICINE, NARCOTIC, OPIATE, OPIOID, PHARMACEUTICAL, POLYPHARMACY, PSYCHOTROPIC, SEDATIVE, and SUBSTANCE. These terms were not included because they could have referred to buprenorphine. Drugs may have also included alcohol(s), such as ethanol and isopropyl alcohol.
102

Table 1: Proportion of Buprenorphine unintentional exposure calls by reason for exposure among children < 10 years old, AAPCC 2010-2015
Multi-substance: Multiple-substance exposure calls in which the caller reported more than one product being involved.
Of the 6,819 unintentional buprenorphine exposure calls for children <10 years (Table 1), 6,660 (97.7%) calls were for children <6 years (Table 2). Of those calls in < 6 year-olds, 6,607 (> 99%) were classified as unintentional general exposures, and 6,308 (94.7%) were single-substance unintentional general exposures.
Of the 6,727 unintentional general buprenorphine exposure calls for children <10 years (Table 1), 6,607 (98.2%) calls were for children <6 years (Table 2). Only 120 (1.8%) of those calls were in children 6-10 years (Table 2B of Appendix A).
Table 2: Proportion of Buprenorphine unintentional exposure calls by reason for exposure among children < 6 years old, AAPCC 2010-2015
Multi-substance: Multiple-substance exposure calls in which the caller reported more than one product being involved.
The population-specific annual call rates for single-substance, multiple-substance, and total (single- and multiple-substance) unintentional general buprenorphine exposure calls involving children <10 years from 2010 through 2015 are displayed in Figure 1. For single-substance unintentional general buprenorphine exposures in children <10 years, the call rate decreased steadily from 32.8 calls per million population in 2010 to 19.9 calls per million population in 2013. From 2013-2015, a subsequent uptick in the call rate was observed for single-substance unintentional general buprenorphine exposures. Among multiple-substance unintentional general buprenorphine exposures, steady call rates were observed for children <10 years from 2010-2015.
Similar trends and patterns were observed for the population-specific annual call rates for single-substance, multiple-substance and total unintentional general buprenorphine exposures involving children <6 years from 2010-2015, as displayed in Figure 1A of Appendix A.
Some variability in the patterns of buprenorphine unintentional general calls for children 6-10, from 2010-2015 was observed, but the annual call rates were fairly small (Figure 1B of Appendix A).
N % N % N %Unintentional General 6727 98.7% 6426 98.7% 301 98.4%Unintentional Misuse 21 0.3% 21 0.3% 0 0.0%Unintentional Therapeutic Error 61 0.9% 57 0.9% 4 1.3%Unintentional Environmental 5 0.1% 5 0.1% 0 0.0%Unintentional Unknown 5 0.1% 4 0.1% 1 0.3%Total 6819 6513 306
Total Exposures Single-Substance Exposures
Multi-Substance Exposures
Unintentional Reason for Exposure
N % N % N %Unintentional General 6607 99.2% 6308 99.2% 299 98.7%Unintentional Misuse 7 0.1% 7 0.1% 0 0.0%Unintentional Therapeutic Error 39 0.6% 36 0.6% 3 1.0%Unintentional Environmental 5 0.1% 5 0.1% 0 0.0%Unintentional Unknown 2 0.0% 1 0.0% 1 0.3%Total 6660 6357 303
Unintentional Reason for Exposure
Total ExposuresSingle-Substance
ExposuresMulti-Substance
Exposures
g g ,
103

Figure 1: Age-specific annual call rates involving buprenorphine unintentional general exposures among children < 10 years old, AAPCC 2010-2015
Medical outcomes for 6,289 buprenorphine unintentional general exposure calls among children <10 years from 2010-2015 are listed in Table 3A of Appendix C. The most common medical outcome associated with single-substance exposure calls and total unintentional general buprenorphine exposure calls was “minor effects”, followed by “no effects”, “moderate effects”, and “major effects”. Only two deaths were reported for unintentional general exposure to buprenorphine.
A similar pattern for medical outcome categories was observed for single-substance and total unintentional general buprenorphine exposure calls among children <6 years (Table 3B in Appendix C) and among children 6-10 years (Table 3C in Appendix C). Only 2 (0.03%) calls for unintentional general buprenorphine exposure resulted in death and both were children <6 years old. No major effects or deaths were observed for unintentional general buprenorphine exposures in children 6-10 years.
2.5 EMERGENCY DEPARTMENT VISITS (NEISS-CADES) - RESULTS
The DEPI-II analysis of NEISS-CADES data mainly differs from the previously published analysis by Budnitz et al., 2016 in that this analysis also includes single-ingredient buprenorphine and not just buprenorphine-naloxone products. However, the results did not change substantially between the two analyses.
Table 3 summarizes the projected national estimates of ED visits for unsupervised ingestions of buprenorphine (alone or in combination with naloxone) by children <10 years old from 2010 through 2015. During the study period, there were 156 unprojected ED visits for these unsupervised ingestions, for a national estimate of 7,374 ED visits, 95% confidence interval (CI) [4,492-10,256]. The projected number of ED visits decreased from roughly 3,100 visits during the 2010-2011 period to roughly 2,100 visits during both the 2012-2013 and 2014-2015 periods. Nearly all ED visits were for children less than 6 years old, and the majority of ED visits were for unsupervised ingestions of buprenorphine or buprenorphine-naloxone only. Approximately 61% of ED visits resulted in hospitalization during every two-year period.
104

Table 3: National estimates of unsupervised ingestions of buprenorphine by children ≤10 years old, NEISS-CADES, 2010-2015
Time period 2010- 2011 2012-2013 2014-2015 Total
Projected estimate (95% CI) of ED Visits
3,095 [1,887-4,304]
2,142 [1,115-3,170]
2,136 [958-3,314]
7,374 [4,492-10,256]
Children < 6 years old 2,998 [1,818-4,177]
2,142 [1,115-3,170]
2,128 [949-3,307]
7,268 [4,456-10,080]
Projected percentage (95% CI) of ED visits of unsupervised ingestions of buprenorphine resulting in hospitalization
61.4% [41.7%-81.0%]
60.6% [37.6%-83.6%]
60.8% [39.1%-82.4%]
61.0% [45.4%-76.5%]
Children < 6 years old 63.1% [44.9%-81.3%]
60.6% [37.6%-83.6%]
60.6% [38.9%-82.3%]
61.6% [46.9%-76.3%]
Projected percentage (95% CI) of ED visits of unsupervised ingestions involving buprenorphine or buprenorphine/naloxone only
93.1% [82.1%-100%]
100% [100%-100%]
95.3% [87.5%-100%]
95.7% [88.9%-100%]
National estimates were not projected for some planned analyses because there were less than 20 cases of ED visits, and any resulting national projections would be statistically unstable. There were only seven ED visits that met the selection criteria and involved a drug other than buprenorphine or buprenophrine-naloxone, and there were only three ED visits for children 6-10 years old (all involved 6 year olds).
From 2010 through 2015, the rate of ED visits for unsupervised ingestions of buprenorphine by children ≤10 years old was 27.6 ED visits per 1 million children, 95% CI [16.8, 38.4]. This rate decreased from 35 ED visits per 1 million children in 2010-2011 to 24 ED visits per 1 million children in 2012-2013, but then remained steady at 24 ED visits per 1 million children in 2014-2015, as displayed in Figure 2. There was much overlap among the confidence intervals of every two-year estimate.
Figure 2: Two-year rates of emergency department visits for unsupervised ingestions of buprenorphine by children <10 years old, NEISS-CADES, 2010-2015
105

2.6 DRUG-INVOLVED MORTALITY - RESULTS
Table 4 summarizes the number of deaths involving buprenorphine among children ≤10 years old from 2010 through 2014. There were 14 deaths identified, of which 13 (92.9%) were among children <6 years old. Eleven (78.6%) deaths only involved buprenorphine or buprenorphine/naloxone. Only three (21.4%) of the 14 deaths were not due to pediatric accidental exposures to buprenorphine because they were homicides; no suicides involving buprenorphine were identified. The annual number of deaths did not vary much during the study period, despite improvements in the reporting of specific drugs on death certificates12 and an overarching increase in total deaths13 during the study period.
Table 4: Deaths involving buprenorphine among children ≤10 years old, NVSS-M linked with death certificate literal text, 2010-2014
2010 2011 2012 2013 2014 Total
Total deaths 3 4 3 2 2 14
Children <6 years old 3 4 2 2 2 13
Children 6-10 years old 0 0 1 0 0 1
Involvement of other drug(s) 1 0 1 1 0 3
Children < 6 years old 1 0 0 1 0 2
Children 6-10 years old 0 0 1 0 0 1
3 DISCUSSION OF THE MAIN FINDINGS
Data from three data sources – AAPCC-NPDS, NEISS-CADES, and drug-involved mortality data (NVSS-M) – demonstrate the continuing public health burden of accidental pediatric buprenorphine exposures from 2010 through 2015.
Magnitude of pediatric accidental exposure to buprenorphine
Generally, the characteristics of the analyzed populations were consistent across the three data sources. Among children ≤10 years of age, the majority (98.2%) of unintentional buprenorphine exposure PCC calls are for unintentional general exposures to buprenorphine. Population rates of exposure calls to PCC for unintentional exposure to buprenorphine also indicate that children <6 years of age are disproportionately affected compared to children 6-10 years of age. However, NPDS PCC call data and referenced AAPCC data should not be construed to represent the complete incidence of national exposures to any substance. These data only capture events if the exposure resulted in a call to a PCC. There is the potential for recall bias or error; as information from calls are highly dependent on patient recall of events. PCC data are also known to underrepresent deaths that occur due to exposures.
The national estimates of ED visits from NEISS-CADES for unsupervised ingestions of buprenorphine (96.9%), and deaths from NVSS-M with buprenorphine involvement (92.9%) involved children <6 years of age. But, NEISS-CADES does not capture visits to ambulatory clinics, urgent care centers or private physician offices and also does not capture information on deaths. So, there could be an underestimation of the exposures in which medical care was sought in these settings or exposures leading to death.
The AAPCC-NPDS and the NEISS-CADES data suggest a high degree of morbidity among affected children. A high proportion (61.0%) of ED visits for unsupervised buprenorphine ingestions among children ≤10 years of age resulted in hospitalization. Furthermore, moderate (i.e., outcomes typically requiring some form of medical treatment) or major (i.e., outcomes that were life threatening or resulted in long-term disability) effects were recorded for nearly a quarter (1,420 among 6,289 calls) of exposure calls for unintentional general exposures to buprenorphine among this same age group.
106

Trends for of pediatric accidental exposure to buprenorphine
Although the number and population rate of exposure calls for unintentional general exposure to buprenorphine among children ≤10 years of age decreased from years 2010 through 2013, the increases in these PCC calls in years 2014 and 2015 reveal persistence in unintentional buprenorphine exposures. Furthermore, these increases occurred despite the number of AAPCC human exposure calls to PCCs decreasing over the last decade.4 So, call rates might be influenced by general changes in use of PCCs over time. AAPCC reported a decline in calls involving less serious exposures and an increase in calls involving more serious exposures since 2000.
Also, the estimated number and population rate of ED visits for unsupervised ingestions of buprenorphine in children of the same age persisted after a drop from the 2010-2011 period to the 2012-2013 period. But, the sensitivity for some drugs is low (33% overall based on chart reviews) in NEISS-CADES.9 So, there could be an underestimation of the ED visits for this exposure.
The number of deaths involving buprenorphine among children ≤10 years of age was steady, but low between 2010 through 2014. This review likely describes the minimum number of buprenorphine-involved deaths as there is a possibility of non-reporting of drugs on death certificates among deaths that involved buprenorphine, and prior analyses have found that some drug-involved deaths lack information on the specific drugs involved in the death.11
4 CONCLUSION
Data from three data sources – AAPCC-NPDS, NEISS-CADES, and drug-involved mortality data – demonstrate the public health burden of accidental pediatric buprenorphine exposures from 2010 through 2015. Despite some decreases observed in the data from AAPCC-NPDS and NEISS-CADES, the public health burden of accidental pediatric buprenorphine exposures appears to have persisted in recent years. The data also revealed that children <6 years of age were most affected, and involvement of drugs other than buprenorphine or buprenorphine in combination with naloxone was not common. Hospitalization and moderate or major effects were common events among affected children, while death was not a common outcome.
DAAAP should be aware of the continuing public health burden of accidental pediatric buprenorphine exposures in recent years.
107

5 REFERENCES
1) Braeburn Pharmaceuticals Inc. (2015). Briefing Document. Psychopharmacologic Drugs Advisory Committee (PDAC), held on January 12, 2016. Retrieved August 31, 2017, from https://www.fda.gov/downloads/AdvisoryCommittees/CommitteesMeetingMaterials/Drugs/PsychopharmacologicDrugsAdvisoryCommittee/UCM480733.pdf
2) Lavonas, E. J., Banner, W., Bradt, P., Bucher-Bartelson, B., Brown, K. R., Rajan, P., . . . Green, J. L. (2013). Root causes, clinical effects, and outcomes of unintentional exposures to buprenorphine by young children. J Pediatr, 163(5), 1377-1383 e1371-1373. doi: 10.1016/j.jpeds.2013.06.058
3) Budnitz, D. S., Lovegrove, M. C., Sapiano, M. R., Mathew, J., Kegler, S. R., Geller, A. I., & Hampp, C. (2016). Notes from the Field: Pediatric Emergency Department Visits for Buprenorphine/Naloxone Ingestion - United States, 2008-2015. MMWR Morb Mortal Wkly Rep, 65(41), 1148-1149. doi: 10.15585/mmwr.mm6541a5
4) Mowry, J. B., Spyker, D. A., Brooks, D. E., Zimmerman, A., & Schauben, J. L. (2016). 2015 Annual Report of the American Association of Poison Control Centers' National Poison Data System (NPDS): 33rd Annual Report. Clin Toxicol (Phila), 54(10), 924-1109. doi: 10.1080/15563650.2016.1245421
5) Truven Health Analytics LLC. (2017). Micromedex® Solutions Tox & Drug Product Lookup. from http://www.micromedexsolutions.com/micromedex2/librarian
6) American Association of Poison Control Centers. (2016). National Poison Data System (NPDS) Data Dictionary, Version 2016.07.11.
7) United States Department of Health and Human Services (US DHHS) / Centers for Disease Control and Prevention (CDC) / National Center for Health Statistics (NCHS). (2016). Bridged-Race Population Estimates, United States July 1st resident population by state, county, age, sex, bridged-race, and Hispanic origin. Compiled from 1990-1999 bridged-race intercensal population estimates (released by NCHS on 7/26/2004); revised bridged-race 2000-2009 intercensal population estimates (released by NCHS on 10/26/2012); and bridged-race Vintage 2015 (2010-2015) postcensal population estimates (released by NCHS on 6/28/2016). Available on CDC WONDER Online Database. Accessed at http://wonder.cdc.gov/bridged-race-v2015.html on Aug 31, 2017 11:43:09 AM.
8) Budnitz, D. S., Pollock, D. A., Weidenbach, K. N., Mendelsohn, A. B., Schroeder, T. J., & Annest, J. L. (2006). National surveillance of emergency department visits for outpatient adverse drug events. JAMA, 296(15), 1858-1866. doi: 10.1001/jama.296.15.1858
9) Jhung, M. A., Budnitz, D. S., Mendelsohn, A. B., Weidenbach, K. N., Nelson, T. D., & Pollock, D. A. (2007). Evaluation and overview of the National Electronic Injury Surveillance System-Cooperative Adverse Drug Event Surveillance Project (NEISS-CADES). Med Care, 45(10 Supl 2), S96-102. doi: 10.1097/MLR.0b013e318041f737
10) Schroeder, T., & Ault, K. (2001). National Electronic Injury Surveillance System (NEISS) sample design and implementation from 1997 to present. Retrieved August 31, 2017, from https://www.cpsc.gov/PageFiles/106617/2001d011-6b6.pdf
11) Trinidad, J. P., Warner, M., Bastian, B. A., Minino, A. M., & Hedegaard, H. (2016). Using Literal Text From the Death Certificate to Enhance Mortality Statistics: Characterizing Drug Involvement in Deaths. Natl Vital Stat Rep, 65(9), 1-15.
12) Warner, M., Trinidad, J. P., Bastian, B. A., Minino, A. M., & Hedegaard, H. (2016). Drugs Most Frequently Involved in Drug Overdose Deaths: United States, 2010-2014. Natl Vital Stat Rep, 65(10), 1-15.
108

13) Centers for Disease Control and Prevention / National Center for Health Statistics. (2016).
Multiple Cause of Death 1999-2015 on CDC WONDER Online Database, released December, 2016. Data are from the Multiple Cause of Death Files, 1999-2015, as compiled from data provided by the 57 vital statistics jurisdictions through the Vital Statistics Cooperative Program. Accessed at http://wonder.cdc.gov/mcd-icd10.html on May 4, 2017 11:46:14 AM.
109

6 APPENDIX A: NATIONAL POISON DATA SYSTEM DEFINITION OF EXPOSURE
REASONS FOR UNINTENTIONAL EXPOSURES
Unintentional Exposure Categories National Poison Data System Definition6
Unintentional Exposures Exposure that results from an unforeseen or unplanned event.
Unintentional Generala
All unintended exposures that are not specifically defined below. Most unintentional exposures in children should be coded here. May include scenario where a toddler got into (and swallowed) a grandparent's prescription medicine.
Unintentional - Environmental
Any passive, non-occupational exposure that results from contamination of air, water or soil.
Unintentional - Occupationalb
Any exposure that occurs as a direct result of the person being on the job or in the workplace.
Unintentional - Therapeutic Error
An unintentional deviation from a proper therapeutic regimen that results in the wrong dose, incorrect route of administration, administration to the wrong person, or administration of the wrong substance.
Unintentional - Misuse
Unintentional improper or incorrect use of a non-pharmaceutical substance.
Unintentional - Bite/Stingsb
All animal bites and stings, with or without envenomation.
Unintentional - Food Poisoningb
All suspected or confirmed food poisoning regardless of clinical manifestation.
Unintentional - Unknown
An exposure determined to be unintentional but the exact reason is unknown.
a The primary focus of this review involved unintentional general buprenorphine exposures in children <10 years b Unintentional exposure categories not observed for analysis of unintentional buprenorphine exposures in children <10 years
110

7 APPENDIX B: NATIONAL POISON DATA SYSTEM DEFINITION OF MEDICAL OUTCOMES
Medical Outcomes National Poison Data System Definition6
No effect No symptoms (clinical effects) as a result of the exposure.
Minor effecta Some symptoms as a result of the exposure... minimally bothersome…symptoms usually resolve rapidly.
Moderate effecta Symptoms as a result of the exposure which are more pronounced, more prolonged or more of a systemic…usually requiring treatment.
Major effecta Symptoms as a result of the exposure which were life-threatening or resulted in significant residual disability or disfigurement.
Death/Death, indirect reporta
The patient died as a result of the exposure or as a direct complication of the exposure.
“Other” b
Patient was not followed, per clinical judgment the exposure was likely to be nontoxic; the patient was not followed because per clinical judgment the exposure was likely to results in only minimal toxicity of a trivial nature; the patient was lost to follow-up (or the poison center neglected to provide follow-up) and per clinical judgment the exposure was significant and may have results in toxic manifestations.
Unrelated effectc Based on all available information, the exposure was probably not responsible for the effect(s).
Confirmed nonexposurec
Reliable and objective evidence that the exposure never occurred and that any symptoms exhibited by the patients were not related to the reported exposure.
a Analysis of medical outcomes included for exposures with a documented related clinical effect b “Other” category for analysis of medical outcomes includes: Not followed, judged as nontoxic exposure; Not followed, minimal clinical effects possible; Unable to follow, judged as a potentially toxic exposure c Categories excluded from analysis of medical outcomes
111
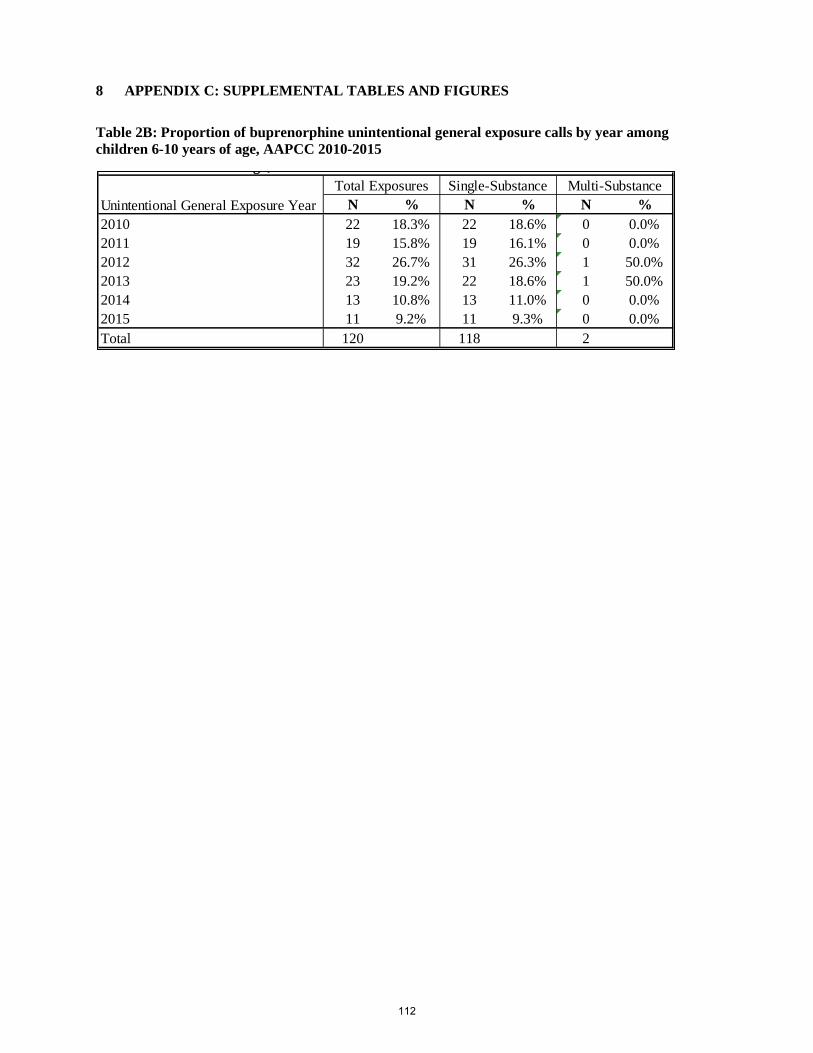
8 APPENDIX C: SUPPLEMENTAL TABLES AND FIGURES
Table 2B: Proportion of buprenorphine unintentional general exposure calls by year among children 6-10 years of age, AAPCC 2010-2015
N % N % N %2010 22 18.3% 22 18.6% 0 0.0%2011 19 15.8% 19 16.1% 0 0.0%2012 32 26.7% 31 26.3% 1 50.0%2013 23 19.2% 22 18.6% 1 50.0%2014 13 10.8% 13 11.0% 0 0.0%2015 11 9.2% 11 9.3% 0 0.0%Total 120 118 2
Unintentional General Exposure YearTotal Exposures Single-Substance Multi-Substance
g ,
112

Figure 1A: Age-specific annual call rates involving buprenorphine unintentional general exposures among children <6 years old, AAPCC 2010-2015
Figure 1A: Age-specific annual call rates involving buprenorphine unintentional general exposures among children 6-10 years old, AAPCC 2010-2015
113

Table 3A: Related medical outcomes involving buprenorphine unintentional general exposure calls by year among children < 10 years old. AAPCC 2010-2015
Table 3B: Related medical outcomes involving buprenorphine unintentional general exposure calls by year among children < 6 years old. AAPCC 2010-2015
No Effect
Minor Effect
Moderate Effect
Major Effect
Death/Death, indirect Report
Other* No Effect
Minor Effect
Moderate Effect
Major Effect
Death/Death, indirect Report
Other* No Effect
Minor Effect
Moderate Effect
Major Effect
Death/Death, indirect Report
Other*
2010 331 516 280 25 0 286 315 490 261 23 0 284 16 26 19 2 0 22011 262 400 206 23 1 206 255 381 195 22 1 204 7 19 11 1 0 22012 268 326 221 20 0 194 259 315 203 19 0 187 9 11 18 1 0 72013 213 279 168 17 1 151 207 266 155 16 1 148 6 13 13 1 0 32014 209 332 218 14 0 148 202 315 200 13 0 147 7 17 18 1 0 12015 234 358 206 22 0 154 225 341 191 19 0 151 9 17 15 3 0 3Total 1517 2211 1299 121 2 1139 1463 2108 1205 112 2 1121 54 103 94 9 0 18* Other includes: Not followed, judged as nontoxic exposure (clinical effects not expected); Not followed, minimal clinical effects possible (no more than minor effect possible); Unable to follow, judged as a potentially toxic exposureTable Excludes: Confirmed nonexposure (N=124) and Unrelated effect, the exposure was probably not responsible for the effect(s) (N=89); missing or unreleated exposures (N=225)
Total Exposures (N=6289)
Year
Single-Substance Exposures (N=6011) Multiple-Substance Exposures (N=278)
No Effect
Minor Effect
Moderate Effect
Major Effect
Death/Death, indirect Report
Other* No Effect
Minor Effect
Moderate Effect
Major Effect
Death/Death, indirect Report
Other* No Effect
Minor Effect
Moderate Effect
Major Effect
Death/Death, indirect Report
Other*
2010 328 506 279 25 0 278 312 480 260 23 0 276 16 26 19 2 0 22011 258 394 204 23 1 201 251 375 193 22 1 199 7 19 11 1 0 22012 255 323 216 20 0 183 247 312 198 19 0 176 8 11 18 1 0 72013 210 273 163 17 1 143 204 261 150 16 1 140 6 12 13 1 0 32014 205 329 216 14 0 145 198 312 198 13 0 144 7 17 18 1 0 12015 232 356 205 22 0 149 223 339 190 19 0 146 9 17 15 3 0 3Total 1488 2181 1283 121 2 1099 1435 2079 1189 112 2 1081 53 102 94 9 0 18* Other includes: Not followed, judged as nontoxic exposure (clinical effects not expected); Not followed, minimal clinical effects possible (no more than minor effect possible); Unable to follow, judged as a potentially toxic exposureTable Excludes: Confirmed nonexposure (N=122) and Unrelated effect, the exposure was probably not responsible for the effect(s) (N=86); missing or unreleated exposures (N=225)
Year
Total Exposures (N=6174) Single-Substance Exposures (N=5898) Multiple-Substance Exposures (N=276)
114

Table 3C: Related medical outcomes involving buprenorphine unintentional general exposure calls by year among children 6-10 years old, AAPCC 2010-2015
No Effect
Minor Effect
Moderate Effect
Major Effect
Death/Death, indirect Report
Other* No Effect
Minor Effect
Moderate Effect
Major Effect
Death/Death, indirect Report
Other* No Effect
Minor Effect
Moderate Effect
Major Effect
Death/Death, indirect Report
Other*
2010 3 10 1 0 0 8 3 10 1 0 0 8 0 0 0 0 0 02011 4 6 2 0 0 5 4 6 2 0 0 5 0 0 0 0 0 02012 13 3 5 0 0 11 12 3 5 0 0 11 1 0 0 0 0 02013 3 6 5 0 0 8 3 5 5 0 0 8 0 1 0 0 0 02014 4 3 2 0 0 3 4 3 2 0 0 3 0 0 0 0 0 02015 2 2 1 0 0 5 2 2 1 0 0 5 0 0 0 0 0 0Total 29 30 16 0 0 40 28 29 16 0 0 40 1 1 0 0 0 0* Other includes Not followed, judged as nontoxic exposure (clinical effects not expected); Not followed, minimal clinical effects possible (no more than minor effect possible); Unable to follow, judged as a potentially toxic exposure.Table Excludes Confirmed nonexposure (N=2) and Unrelated effect, the exposure was probably not responsible for the effect(s) (N=3)
Year
Total Exposures (N=115) Single-Substance Exposures (N=113) Multiple-Substance Exposures (N=2)
115

Department of Health and Human Services Public Health Service
Food and Drug Administration Center for Drug Evaluation and Research Office of Surveillance and Epidemiology
Drug Utilization Review
Date: September 25, 2017
Reviewer: Shekhar Mehta, PharmD., MS Drug Utilization Data Analyst Division of Epidemiology II
Team Leader: Rajdeep Gill, Pharm.D. Drug Utilization Data Analysis Team Leader
Division of Epidemiology II
Deputy Director: LCDR Grace P. Chai, Pharm.D. Deputy Director for Drug Utilization
Division of Epidemiology II
Associate Director: Judy Staffa, Ph.D., R.Ph. Associate Director for Public Health Initiatives Office of Surveillance and Epidemiology
Subject: Utilization trends of buprenorphine products labeled for the
treatment of opioid dependence Drug Name(s): multiple
Application Type/Number: NDA 209819
Applicant/sponsor: Indivior Inc.
OSE RCM #: 2017-1468
116

TABLE OF CONTENTS
EXECUTIVE SUMMARY ................................................................................................ 1 1 INTRODUCTION ...................................................................................................... 1
1.1 Background .......................................................................................................... 1
1.2 Product Information ............................................................................................. 1
2 METHODS and MATERIALS................................................................................... 2
2.1 Data Sources ......................................................................................................... 2
3 RESULTS ................................................................................................................... 3
3.1 Settings of care ..................................................................................................... 3
3.2 Prescription data ................................................................................................... 3
3.3 Prescriber Specialty Data ..................................................................................... 4
3.4 Patient data ........................................................................................................... 4
3.5 Diagnosis Data ..................................................................................................... 5
4 DISCUSSION ............................................................................................................. 5 5 CONCLUSIONS......................................................................................................... 6 6 APPENDICES ............................................................................................................ 7
6.1 Appendix 1: Tables and Figures........................................................................... 7
6.2 APPENDIX 2: Drug Use Database Descriptions ................................................ 9
117
EXECUTIVE SUMMARY
On October 31 2017, a joint meeting of the Anesthetic and Analgesic Drug Products Advisory Committee (AADPAC) and the Drug Safety and Risk Management Advisory Committee Advisory Committee (DSaRM) will be held to discuss new drug application for buprenorphine subcutaneous injection (NDA 209819), submitted by Indivior for the proposed indication to treat opioid dependence. To provide informational context and background information, this review summarizes U.S. outpatient retail pharmacy utilization trends of buprenorphine products (buprenorphine single-ingredient and combination buprenorphine/naloxone) currently marketed with labeling to treat opioid dependence from 2012 through 2016. Overall, the U.S. outpatient retail pharmacy utilization of buprenorphine products appears to have increased during the examined time period. The nationally estimated number of prescriptions dispensed for buprenorphine products increased 45% from 8.4 million in 2012 to 12.2 million prescriptions in 2016. Approximately 39% of the total buprenorphine prescriptions dispensed were written by primary care physicians in 2016. According to office-based physician survey data, the most common diagnoses reported in association with buprenorphine products were for opioid dependence and/or opioid abuse. The nationally estimated number of patients who received a dispensed prescription for buprenorphine products from U.S. outpatient retail pharmacies increased 60% from approximately 1 million in 2012 to 1.6 million patients in 2016.
1 INTRODUCTION On October 31, 2017, a joint meeting of the Anesthetic and Analgesic Drug Products Advisory Committee (AADPAC) and the Drug Safety and Risk Management Advisory Committee Advisory Committee (DSaRM) will be held to discuss new drug application for buprenorphine subcutaneous injection (NDA 209819), submitted by Indivior for the proposed indication to treat opioid dependence. To provide informational context and background information, this review summarizes outpatient retail utilization analyses of buprenorphine products (buprenorphine single-ingredient and combination buprenorphine/naloxone) indicated to treat opioid dependence from 2012 through 2016 in U.S. pharmacies.
1.1 BACKGROUND NDA 209819 was submitted by Indivior for an extended-release depot injection of single-ingredient buprenorphine with the proposed indication to treat opioid dependence. During the study period examined, there are two single-ingredient buprenorphine products and four buprenorphine/naloxone combination products with FDA-approved labeling indicated for the treatment of opioid dependence.1
1.2 PRODUCT INFORMATION2
1 U.S. Food and Drug Administration: Drugs@FDA. Buprenorphine and buprenorphine/naloxone Prescribing Information. Accessed August 2017. Available at: https://www.accessdata.fda.gov/scripts/cder/daf/index.cfm?event=BasicSearch.process 2 U.S. Food and Drug Administration: Drugs@FDA. Accessed August 8, 2017. Website: http://www.accessdata.fda.gov/scripts/cder/drugsatfda/
118


distribution to determine settings of care for 2016. The sales distribution data do not reflect what is being sold to or administered to patients directly; but these data do provide a national estimate of units sold from the manufacturer into the various channels of distribution. The QuintilesIMS, National Prescription Audit™ (NPA) database was used to obtain the nationally estimated number of prescriptions dispensed for buprenorphine products from 2012 through 2016, annually. In addition, the top prescriber specialties for buprenorphine products from U.S. outpatient retail pharmacies in 2016 were also obtained from this database. The QuintilesIMS, Total Patient Tracker™ (TPT) database was used to obtain the nationally estimated number of patients, stratified by patient age (0-16 years, and 17 years and older) who received a dispensed prescription for buprenorphine products from U.S. outpatient retail pharmacies, from 2012 through 2016, annually. inVentiv Health Research & Insights LLC., TreatmentAnswers™ with Pain Panel, a U.S. office-based physician survey database, was used to obtain top groups of diagnoses associated with the use of buprenorphine products in 2016. Diagnoses data by number of drug use mentions4 were captured based on International Classification of Diseases (ICD-10-CM) codes and 95% confidence were applied to the estimates.
3 RESULTS
3.1 SETTINGS OF CARE The QuintilesIMS, National Sales Perspectives™ (NSP) database was used to determine the various settings of care where buprenorphine products were distributed by the manufacturers. Sales data in 2016 showed that approximately 93% of buprenorphine products (bottles/packages) were sold to U.S. outpatient retail settings, 6% to non-retail pharmacies, and less than 1% to mail-order/specialty pharmacies.5 As a result, only outpatient retail pharmacy utilization patterns were examined for buprenorphine products. Mail-order/specialty pharmacy and non-retail pharmacy settings data were not included in this analysis.
3.2 PRESCRIPTION DATA Figure 1 below and Table 6.2.1 in Appendix 1 provide the nationally estimated number of prescriptions dispensed for total buprenorphine products (single-ingredient buprenorphine and combination buprenorphine/naloxone) from U.S. outpatient retail pharmacies, from 2012 through 2016, annually. The total number of prescription dispensed for buprenorphine products increased 40% from 8.4 million prescriptions in 2012 to 12.2 million prescriptions in 2016. Figure 1 Nationally Estimated Number of Dispensed Prescriptions for Buprenorphine Products* from U.S. Outpatient Retail Pharmacies, 2012-2016
4 A "drug use mention" refers to mentions of a drug in association with a diagnosis during a patient visit to an office-based physician. This term may be duplicated by the number of diagnoses for which the drug is mentioned. It is important to note that a "drug use" does not necessarily result in a prescription being generated. Rather, the term indicates that a given drug was mentioned during an office visit. 5 Source: QuintilesIMS, National Sales Perspective (NSP) January 2016 – December 2016. Source file: NSP channel 2017-1468 Buprenorphine AC 9-25-2017.xlsx
120


The prescription data analysis of buprenorphine products showed that primary care physicians were the top prescribers in 2016. According to the office-based physician survey data in 2016, reported drug use mentions of buprenorphine products were primarily associated with opioid dependence or abuse, although treatment of pain was also mentioned infrequently for these products. In general, survey data are best used to identify the typical uses for the products from an office-based physician setting and thus does not represent other settings where buprenorphine may be prescribed such as treatment clinics, pain clinics, and hospitals. Findings from this review should be interpreted in the context of the known limitations of the databases used. We estimated that buprenorphine products are distributed primarily to the outpatient retail pharmacy setting based on the IMS Health, IMS National Sales Perspectives™ in 2016. Probuphine is available only under a restricted distribution program called the Probuphine REMs program, therefor Probuphine was not included in this review as utilization is vastly underestimated in the proprietary drug utilization data sources used in these analyses. As a result, we focused our analysis on only the outpatient retail pharmacy settings; thus these estimates may not apply to other settings of care in which these products are used (i.e., mail-order pharmacies, clinics, non-federal hospitals, etc.)
5 CONCLUSIONS In preparation for the upcoming advisory committee on October 31, 2017 to discuss the new drug application for subcutaneous injection of buprenorphine, this review provides the drug utilization patterns of buprenorphine products currently marketed in the U.S. with labeled indications to treat opioid dependence.
The outpatient retail pharmacy utilization of buprenorphine products appears to have increased from 2012 through 2016. There were approximately 12.2 million buprenorphine prescriptions dispensed and 1.6 million patients who received a dispensed prescription for buprenorphine products in 2016.
123

6 APPENDICES
6.1 APPENDIX 1: TABLES AND FIGURES
Table 6.2.1. Nationally Estimated Number of Dispensed Prescriptions for Buprenorphine Products* from U.S. Outpatient Retail Pharmacies, 2012-2016
Source: QuintilesIMS, National Prescription Audit (NPA). January 2012 - December 2016. Data extracted August 2017. File NPA mole CY 2017 bup AC 9-25-2017.xlsx *Buprenorphine products refer to single-ingredient buprenorphine and combination buprenorphine/naloxone products indicated to treat opioid dependence.
Table 6.2.2 Nationally Estimated Number of Dispensed Prescriptions for Buprenorphine Products* from U.S. Outpatient Retail Pharmacies, by Provider Specialty, 2016
Source: QuintilesIMS, National Prescription Audit (NPA). Data Extracted September 2017. File: NPA Spec CY 2017-1468 bup AC 9-25-2017 FP/GP/IM: Family Practice, General Practice, Internal Medicine * Buprenorphine products refer to single-ingredient buprenorphine and combination buprenorphine/naloxone products indicated to treat opioid dependence. Table 6.2.3 Nationally Estimated Number of Patients* (0-16 years and 17 years and above) who Received a Dispensed Prescriptions for Buprenorphine Products** from U.S. Outpatient Retail Pharmacies, 2012-2016
Source: QuintilesIMS, Total Patient Tracker (TPT). January 2012 - December 2016. Data Extracted August 2017. File: TPT L 2017-1468 bup AC 9-22-2017.xlsx *Unique patient counts may not be added across time periods or across products due to the possibility of double counting those patients who are receiving treatment over multiple periods in the study. ** Total buprenorphine products refer to single-ingredient buprenorphine and combination buprenorphine/naloxone products indicated to treat opioid dependence. Table 6.2.4
2012 2013 2014 2015 2016Prescriptions
(N)Prescriptions
(N)Prescriptions
(N)Prescriptions
(N)Prescriptions
(N)Total Buprenorphine Products 8,409,961 9,488,546 10,634,561 11,409,824 12,206,485
Specialty Prescriptions (N) Share(%)Grand Total 12,206,485 100%FP/GP/IM 4,807,878 39.4%Psychiatry 2,509,621 20.6%Osteopathic Medicine 1,751,956 14.4%Emergency Medicine 449,242 3.7%Anesthesiology 441,617 3.6%All Other Specialties 2,246,171 18.4%
Patients (N) Share (%) Patients (N) Share (%) Patients (N) Share (%) Patients (N) Share (%) Patients (N) Share (%)1,003,842 100% 1,132,040 100% 1,297,310 100% 1,462,071 100% 1,618,552 100%
896 0.1% 916 0.1% 1,125 0.1% 911 0.1% 881 0.1%1,002,827 99.9% 1,131,017 99.9% 1,294,247 99.8% 1,448,799 99.1% 1,595,845 98.6%
64 <0.1% 390 <0.1% 15,271 1.2% 27,971 1.9% 39,927 2.5%
2012 2013 2015 2016
Unknown Age
2014
Grand Total0 - 1617+
Age
124

Nationally Estimated Number of Drug Use Mentions for Buprenorphine Products* Stratified by ICD-10 Diagnosis Categories, as Reported from Surveys of U.S. Office-Based Physicians, 2016.
Source: inVentiv Health Research & Insights LLC. Treatment Answers™ January 2016- December 2016. Data extracted August 2017. File: PDDA 2017-1468 dx by ICD-10 4 9-20-2017.xlsx Note: The term "drug use mentions" refers to mentions of a drug in association with a diagnosis during a patient visit to an office-based physician. This term may be duplicated by the number of diagnosis for which the drug is mentioned. It is important to note that a "drug use mention" does not necessarily result in a prescription being generated. Rather, the term indicates that a given drug was mentioned during an office visit. *Total buprenorphine products refer to single-ingredient buprenorphine and combination buprenorphine/naloxone products indicated to treat opioid dependence.
2016 Drug Use Mentions
(Thousands)
2016 Drug Use Mentions Share (%)
2016 95% Confidence
Interval (Thousands)
Total Market 4,581 100% 4,204-4,958 V Mental and behavioural disorders 4,283 93.5% 3,918-4,647 F112 Opioid dependence 3,928 91.7% 3,579-4,277 F111 Opioid abuse 205 4.8% 125-285 F192 Other psychoactive substance dependence 143 3.3% 76-209 All other mental and behavioural disorders 7 0.2% <0.5-23 XIII Diseases of the musculoskeletal system and connective tissue 190 4.1% 113-266 M545 Low back pain 147 77.3% 79-214 M549 Dorsalgia, unspecified 32 16.8% <0.5-63 M961 Postlaminectomy syndrome, not elsewhere classified 3 1.3% <0.5-11 All other diseases of the musculoskeletal system and connective tissue 9 4.6% <0.5-25 VI Diseases of the nervous system 61 1.3% 17-104 G894 Chronic pain syndrome 48 79.7% 10-87 G892 Chronic pain, not elsewhere classified 12 20.3% <0.5-32 XV Pregnancy, childbirth and the puerperium 31 0.7% <0.5-62 O993 Mental disord and dis of the nervous sys compl preg/chldbrth 31 100% <0.5-62 All others 17 0.4% <0.5-39
125

6.2 APPENDIX 2: DRUG USE DATABASE DESCRIPTIONS
QuintilesIMS, National Sales Perspectives™: Retail and Non-Retail The QuintilesIMS National Sales Perspectives™ measures the volume of drug products, both prescription and over-the-counter, and selected diagnostic products moving from manufacturers into various outlets within the retail and non-retail markets. Volume is expressed in terms of sales dollars, eaches, extended units, and share of market. These data are based on national projections. Outlets within the retail market include the following pharmacy settings: chain drug stores, independent drug stores, mass merchandisers, food stores, and mail service. Outlets within the non-retail market include clinics, non-federal hospitals, federal facilities, HMOs, long-term care facilities, home health care, and other miscellaneous settings.
QuintilesIMS National Prescription Audit™ The National Prescription Audit (NPATM) measures the “retail outflow” of prescriptions, or the rate at which drugs move out of retail pharmacies, mail service houses, or long-term care facilities into the hands of consumers via formal prescriptions in the U.S. The NPA audit measures what is dispensed by the pharmacist. Data for the NPA audit is a national level estimate of the drug activity from retail pharmacies. NPA receives over 3.5 billion prescription claims per year, captured from a sample of the universe of approximately 59,400 pharmacies throughout the U.S. The pharmacies in the database account for most retail pharmacies and represent nearly 88% of retail prescriptions dispensed nationwide. The type of pharmacies in the sample are a mix of independent, retail, chain, mass merchandisers, and food stores with pharmacies, and include prescriptions from cash, Medicaid, commercial third-party and Medicare Part-D prescriptions. Data is also collected from approximately 45 – 75% (varies by class and geography) of mail service pharmacies and approximately 70 – 85% of long-term care pharmacies. Data are available on-line for 72-rolling months with a lag of 1 month.
QuintilesIMS, Total Patient Tracker™ (TPT) Total Patient Tracker (TPT) is a national-level projected audit designed to estimate the total number of unique patients across all drugs and therapeutic classes in the retail outpatient setting over time. TPT derives its data from the Vector One® database which integrates prescription activity from a sample received from payers, switches, and other software systems that may arbitrage prescriptions at various points in the sales cycle. Vector One® receives over 2.1 billion prescription claims per year. Unique patient counts may not be added across time periods due to the possibility of double counting those patients who are receiving treatment over multiple periods in the study. Furthermore, patient age subtotals may not sum exactly due to patients aging during the study period, and may be counted more than once in the individual age categories. For this reason, summing across time periods or patient age bands is not advisable and will result in overestimates of patient counts.
inVentiv Health Research & Insights LLC., TreatmentAnswers™ inVentiv Health Research & Insights, LLC., TreatmentAnswers™ and TreatmentAnswers™ with Pain Panel is a monthly survey designed to provide descriptive information on the patterns and treatment of diseases encountered in office-based physician practices in the U.S. The survey consists of data collected from over 3,200 office-based physicians representing 30 specialties across the United States that report on all patient activity during one typical workday per month. These data may include profiles and trends of diagnoses, patients, drug products mentioned during the office visit and treatment patterns. The Pain Panel supplement surveys over 115 pain specialists physicians each month. With the inclusion of visits to pain specialists, this will allow additional insight into the pain market. The data are then projected nationally by physician specialty and region to reflect national prescribing patterns.
126


