91
FDF Economic contribution and growth opportunities June 2017
| Date post: | 13-Mar-2018 |
| Category: |
Documents |
| Upload: | nguyenkhuong |
| View: | 216 times |
| Download: | 1 times |

FDF Economic contribution and growth opportunities
June 2017
© 2017 Grant Thornton UK LLP. All rights reserved
FDF Economic contribution and growth opportunities | June 2017
Table of Contents
Section Page
Foreword 04
Key findings 06
Introduction 08
Approach 10
Economic contribution of the sector 12
Skills 30
Innovation 52
Trade 63
Conclusion 89
2

© 2017 Grant Thornton UK LLP. All rights reserved | Draft
Foreword
3
© 2017 Grant Thornton UK LLP. All rights reserved
FDF Economic contribution and growth opportunities | June 2017
Gavin Darby, Chief Executive of Premier Foods and Food and Drink Federation President
The food and drink industry is the UK’s largest manufacturing sector, contributing £28.2 billion to the economy annually and employing 400,000 people. We are a key part of the nation’s
£110 billion 'farm to fork' food chain.
Our industry is critical to national security and the prosperity of our wider economy. We have a well-earned global reputation for provenance, quality and innovation.
The challenges we face in the next few years are unparalleled. The market environment in which we operate remains uncertain. We are a resilient and adaptable industry - we know there
are huge opportunities available to our sector so we can sell more great British food. Therefore, it is key that we identify how best to harness our own growth potential and improve
productivity.
With this in mind, FDF commissioned Grant Thornton to undertake this independent research project identifying both the opportunities available to manufacturers and the barriers to
growth. This was done through the collation of the latest quantitative data and by speaking at length with FDF members to add a qualitative perspective.
This research focuses on three core areas: innovation, trade and skills. All are framed against the backdrop of the UK leaving the European Union. The findings highlight the diversity of
our industry, and in particular, how risks and opportunities can vary from business to business and across regions.
The findings also highlight the work we need to do to increase growth and how we can achieve this. The report makes a compelling case for Government to invest in the food and drink
industry, identifying clear actions and areas of support. Our sector has long been a manufacturing success story but it is clear there is still much untapped growth potential.
In partnership with Government, the food and drink industry will seize upon these opportunities, maximising growth and boosting productivity. We believe the food and drink industry
can be an engine for economic growth in the UK, while continuing to provide safe, innovative and nutritious food and drink to the nation.
Foreword
4

© 2017 Grant Thornton UK LLP. All rights reserved | Draft
Key findings
5
© 2017 Grant Thornton UK LLP. All rights reserved
FDF Economic contribution and growth opportunities | June 2017
Key findings
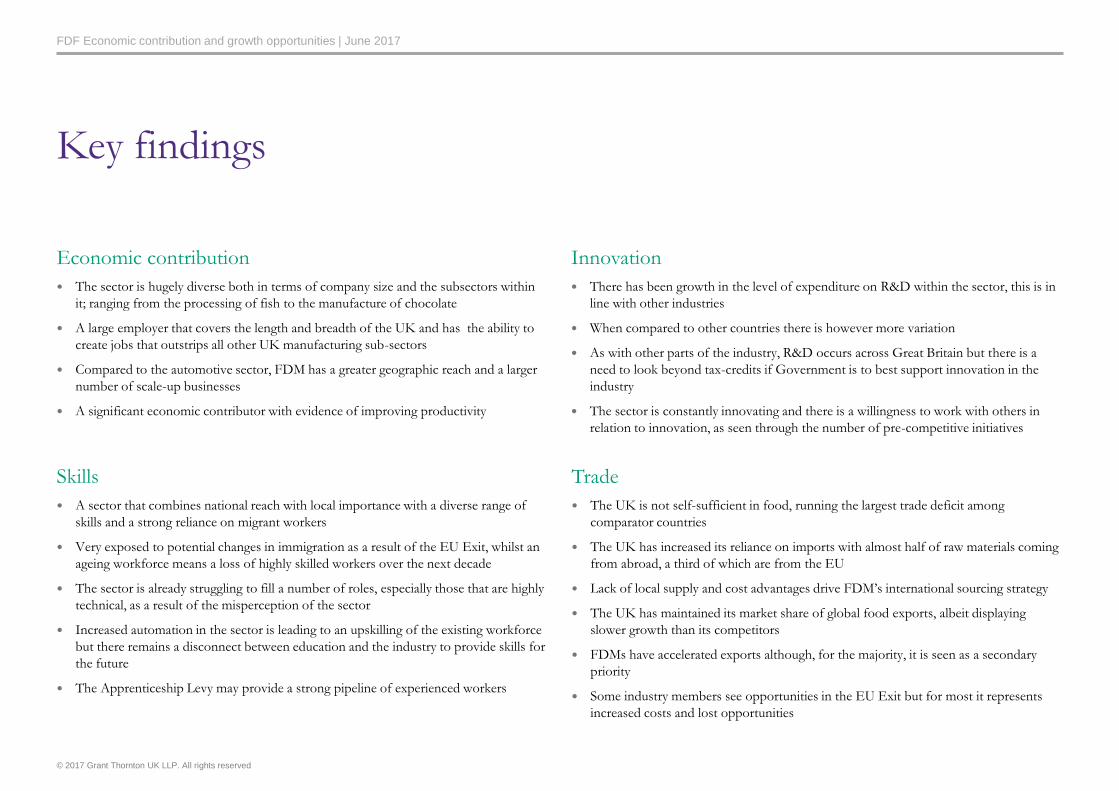
Economic contribution
The sector is hugely diverse both in terms of company size and the subsectors within
it; ranging from the processing of fish to the manufacture of chocolate
A large employer that covers the length and breadth of the UK and has the ability to
create jobs that outstrips all other UK manufacturing sub-sectors
Compared to the automotive sector, FDM has a greater geographic reach and a larger
number of scale-up businesses
A significant economic contributor with evidence of improving productivity
Skills
A sector that combines national reach with local importance with a diverse range of
skills and a strong reliance on migrant workers
Very exposed to potential changes in immigration as a result of the EU Exit, whilst an
ageing workforce means a loss of highly skilled workers over the next decade
The sector is already struggling to fill a number of roles, especially those that are highly
technical, as a result of the misperception of the sector
Increased automation in the sector is leading to an upskilling of the existing workforce
but there remains a disconnect between education and the industry to provide skills for
the future
The Apprenticeship Levy may provide a strong pipeline of experienced workers
Innovation
There has been growth in the level of expenditure on R&D within the sector, this is in
line with other industries
When compared to other countries there is however more variation
As with other parts of the industry, R&D occurs across Great Britain but there is a
need to look beyond tax-credits if Government is to best support innovation in the
industry
The sector is constantly innovating and there is a willingness to work with others in
relation to innovation, as seen through the number of pre-competitive initiatives
Trade
The UK is not self-sufficient in food, running the largest trade deficit among
comparator countries
The UK has increased its reliance on imports with almost half of raw materials coming
from abroad, a third of which are from the EU
Lack of local supply and cost advantages drive FDM’s international sourcing strategy
The UK has maintained its market share of global food exports, albeit displaying
slower growth than its competitors
FDMs have accelerated exports although, for the majority, it is seen as a secondary
priority
Some industry members see opportunities in the EU Exit but for most it represents
increased costs and lost opportunities

© 2017 Grant Thornton UK LLP. All rights reserved | Draft
Introduction
7
© 2017 Grant Thornton UK LLP. All rights reserved
FDF Economic contribution and growth opportunities | June 2017
The security of food supply is of critical importance to the UK and it cuts to the very
foundations of society. As such, the food and drink manufacturing (FDM) sector will
always have an important role to play in society, the economy and policy. However, to
simply view the FDM sector as one that underpins and facilitates others is a significant
misrepresentation of the sector. It underplays both the current positive economic
contribution that the sector makes and it ignores the potential it has to drive economic
growth both now and over the next decade and beyond.
In order to realise these growth opportunities there are however, a number of significant
external and internal factors that need to be worked through. These factors pose both
risks and opportunities for the sector – with the potential for risk or opportunity often
varying from business to business. Therefore, if the opportunities are to be maximised
and the risks mitigated there is the need for clear action both by the sector itself but also
by Government through the range of different policy, regulation and support levers that it
is able to pull.
The purpose of this report is simple. It is to provide a robust evidence base to support the
sector and Government in identifying these growth opportunities and the barriers that
need to be navigated if they are to be realised; not just for the benefit of the sector but for
the UK as a whole.
Structure of this report
This report looks at the range of evidence through four different lenses, each of which
form a stand alone section:
The economic contribution of the sector
Skills
Innovation
Trade
In looking through each of these lenses the report focuses on the key findings that emerge
through the evidence. Each section ends with a series of recommendations based on the
evidence.
Before looking in detail at the evidence, the next chapter of the report sets out the
approach that was taken to constructing the evidence base.
Introduction
8

© 2017 Grant Thornton UK LLP. All rights reserved | Draft
Approach
9

© 2017 Grant Thornton UK LLP. All rights reserved
FDF Economic contribution and growth opportunities | June 2017
Primary and secondary research approach
This report has been prepared based on extensive primary research supported by secondary research to build a robust picture of the FDM industry in the UK. The methodology
comprised three strand an Online Survey, Semi-structured interviews with industry leaders and Desk Based Research and Data Analysis.
Following consultations with FDF, Grant Thornton developed a questionnaire that was sent out to members of the UK FDM industry via an online survey. The questions asked were
directly linked to skills, innovation and trade
The survey was addressed primarily to executives and other senior members of FDM (SME’s and Corporates) in the UK. The survey was sent out to
– FDF members;
– The Regional Food Group Alliance members; and
– Grant Thornton’s FDM contacts
The online survey ran from March to May 2017
Parallel to the survey, Grant Thornton conducted 17 semi-structured telephone interviews with executives and senior staff of UK FDM businesses. The interviews were designed to
gain in-depth views around some of the topics addressed by the survey questionnaire and included some additional questions
The study was also supported by detailed desktop research and analysis drawing on a broad range of national statistics
There were some limitations in relation to the desktop research. Wherever food and soft drinks specific data was not available, it was substituted for food, beverage and tobacco data.
However, wherever this is the case, it has been clearly indicated
The key findings from the analysis were presented, discussed and tested with various FDM businesses and senior members of the FDF team
Methodology
10
© 2017 Grant Thornton UK LLP. All rights reserved
FDF Economic contribution and growth opportunities | June 2017
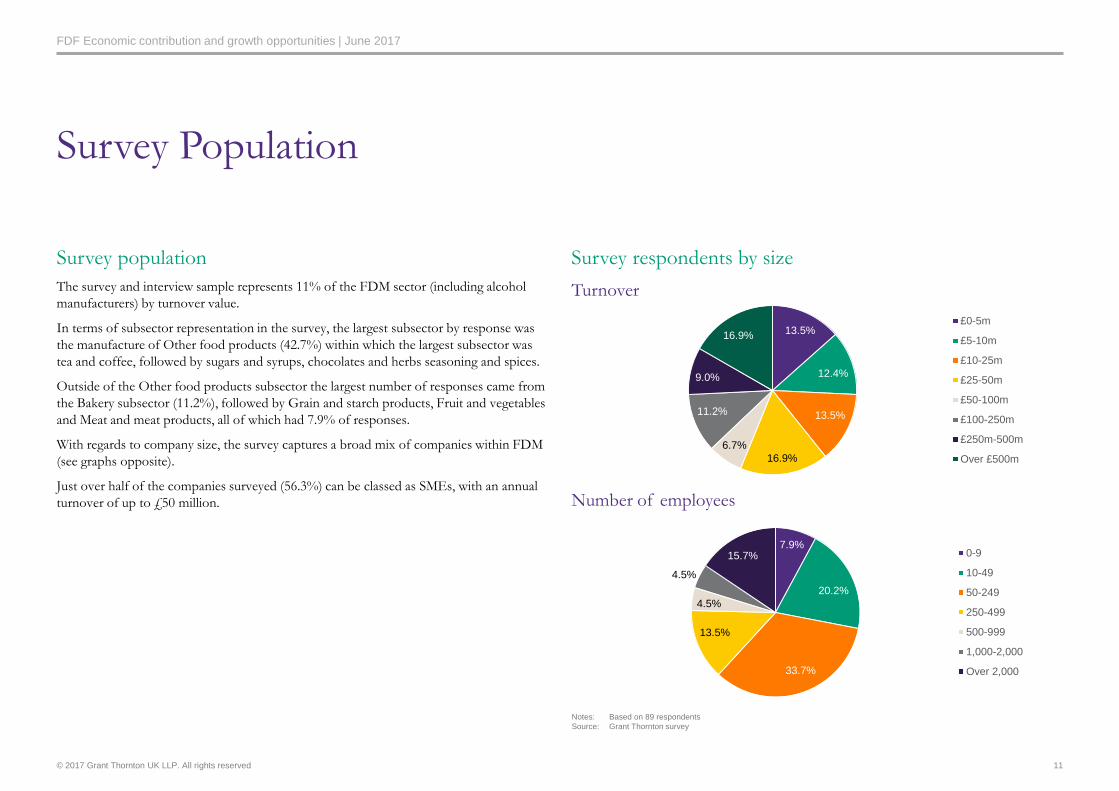
Survey population
The survey and interview sample represents 11% of the FDM sector (including alcohol
manufacturers) by turnover value.
In terms of subsector representation in the survey, the largest subsector by response was
the manufacture of Other food products (42.7%) within which the largest subsector was
tea and coffee, followed by sugars and syrups, chocolates and herbs seasoning and spices.
Outside of the Other food products subsector the largest number of responses came from
the Bakery subsector (11.2%), followed by Grain and starch products, Fruit and vegetables
and Meat and meat products, all of which had 7.9% of responses.
With regards to company size, the survey captures a broad mix of companies within FDM
(see graphs opposite).
Just over half of the companies surveyed (56.3%) can be classed as SMEs, with an annual
turnover of up to £50 million.
Survey Population
Survey respondents by size
11
13.5%
12.4%
13.5%
16.9%
6.7%
11.2%
9.0%
16.9%
£0-5m
£5-10m
£10-25m
£25-50m
£50-100m
£100-250m
£250m-500m
Over £500m
Turnover
Number of employees
7.9%
20.2%
33.7%
13.5%
4.5%
4.5%
15.7% 0-9
10-49
50-249
250-499
500-999
1,000-2,000
Over 2,000
Notes: Based on 89 respondents
Source: Grant Thornton survey

© 2017 Grant Thornton UK LLP. All rights reserved | Draft
Economic contribution of the sector
12
© 2017 Grant Thornton UK LLP. All rights reserved
FDF Economic contribution and growth opportunities | June 2017
This chapter looks at the economic contribution of the food and drink manufacturing sector, looking at the size and
diversity of the sector, from a financial, economic and geographic perspective, as well as highlighting its strengths against
other UK manufacturing sectors.
Chapter introduction
13
© 2017 Grant Thornton UK LLP. All rights reserved
FDF Economic contribution and growth opportunities | June 2017
96.40%
3.60%
% of business which are SMEs (between 1-249employees)
% of business which are large businesses (250 andabove employees)
The Business Base
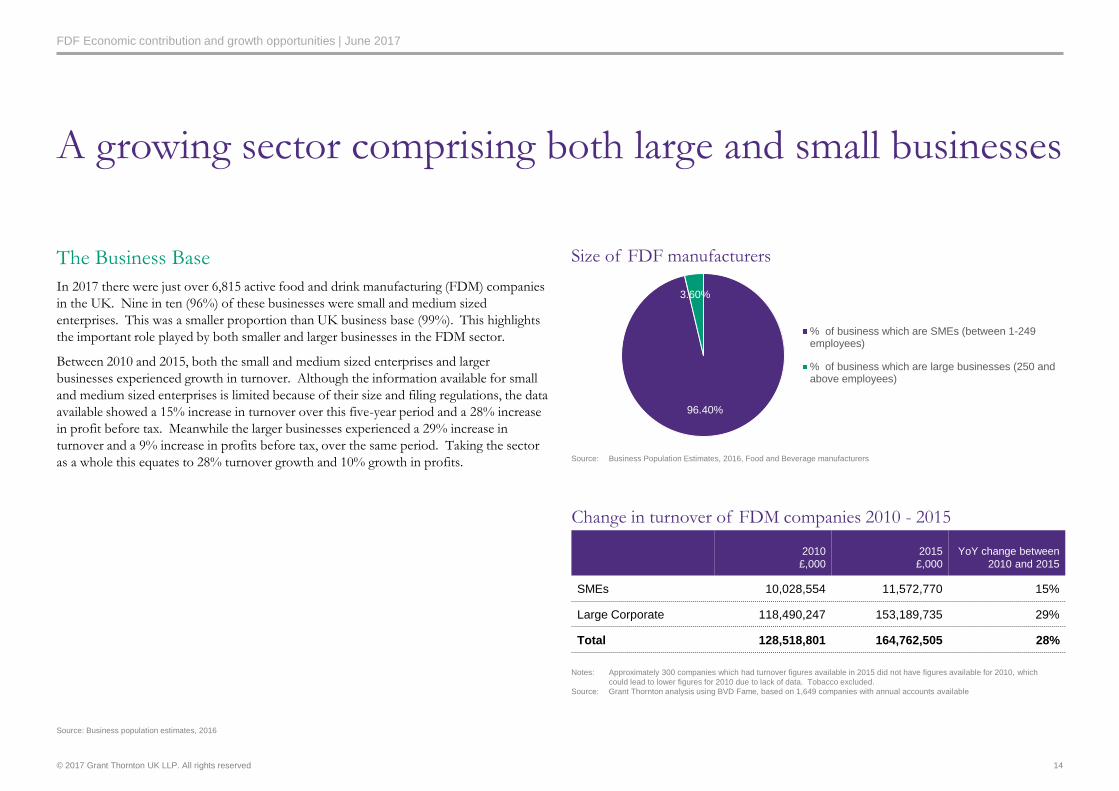
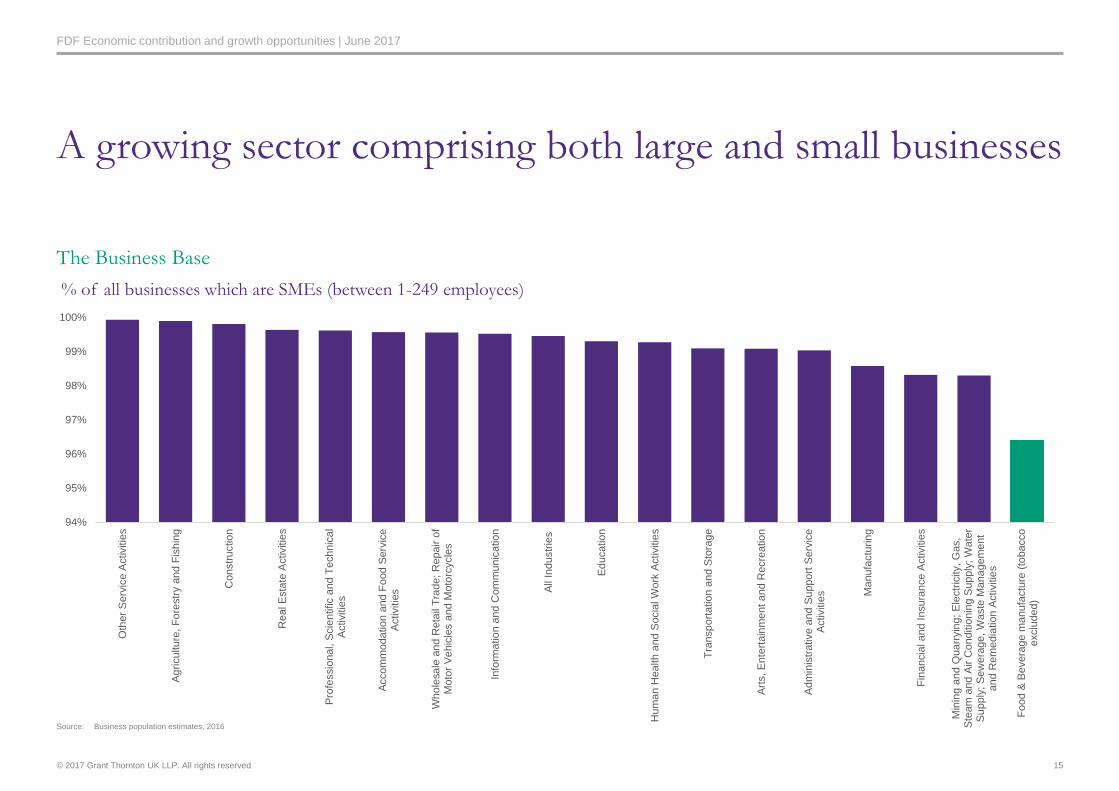
In 2017 there were just over 6,815 active food and drink manufacturing (FDM) companies
in the UK. Nine in ten (96%) of these businesses were small and medium sized
enterprises. This was a smaller proportion than UK business base (99%). This highlights
the important role played by both smaller and larger businesses in the FDM sector.
Between 2010 and 2015, both the small and medium sized enterprises and larger
businesses experienced growth in turnover. Although the information available for small
and medium sized enterprises is limited because of their size and filing regulations, the data
available showed a 15% increase in turnover over this five-year period and a 28% increase
in profit before tax. Meanwhile the larger businesses experienced a 29% increase in
turnover and a 9% increase in profits before tax, over the same period. Taking the sector
as a whole this equates to 28% turnover growth and 10% growth in profits.
A growing sector comprising both large and small businesses
Size of FDF manufacturers
14
2010
£,000
2015
£,000
YoY change between
2010 and 2015
SMEs 10,028,554 11,572,770 15%
Large Corporate 118,490,247 153,189,735 29%
Total 128,518,801 164,762,505 28%
Notes: Approximately 300 companies which had turnover figures available in 2015 did not have figures available for 2010, which
could lead to lower figures for 2010 due to lack of data. Tobacco excluded.
Source: Grant Thornton analysis using BVD Fame, based on 1,649 companies with annual accounts available
Source: Business population estimates, 2016
Source: Business Population Estimates, 2016, Food and Beverage manufacturers
Change in turnover of FDM companies 2010 - 2015
© 2017 Grant Thornton UK LLP. All rights reserved
FDF Economic contribution and growth opportunities | June 2017
The Business Base
% of all businesses which are SMEs (between 1-249 employees)
A growing sector comprising both large and small businesses
15
94%
95%
96%
97%
98%
99%
100%
Oth
er
Serv
ice A
ctivitie
s
Ag
riculture
, F
ore
str
y a
nd F
ish
ing
Constr
uctio
n
Real E
sta
te A
ctivitie
s
Pro
fessio
nal, S
cie
ntific a
nd
Te
chnic
al
Activitie
s
Accom
moda
tio
n a
nd F
ood S
erv
ice
Activitie
s
Whole
sale
and R
eta
il T
rade; R
epair o
fM
oto
r V
ehic
les a
nd M
oto
rcycle
s
Info
rma
tio
n a
nd C
om
munic
atio
n
All
Industr
ies
Ed
ucation
Hum
an H
ealth a
nd S
ocia
l W
ork
Activitie
s
Tra
nsp
ort
atio
n a
nd S
tora
ge
Art
s, E
nte
rtain
ment and
Recre
ation
Ad
min
istr
ative a
nd S
upport
Serv
ice
Activitie
s Ma
nufa
ctu
ring
Fin
ancia
l and
Insura
nce A
ctivitie
s
Min
ing a
nd Q
uarr
yin
g;
Ele
ctr
icity, G
as,
Ste
am
and
Air C
onditio
nin
g S
upply
; W
ate
rS
upply
; S
ew
era
ge, W
aste
Mana
gem
ent
and R
em
edia
tio
n A
ctivitie
s
Fo
od &
Bevera
ge m
anufa
ctu
re (
tobacco
exclu
ded)
Source: Business population estimates, 2016
© 2017 Grant Thornton UK LLP. All rights reserved
FDF Economic contribution and growth opportunities | June 2017
100 147 248382 387
537 563
948
17361890
2499
80%
82%
84%
86%
88%
90%
92%
94%
96%
98%
0
500
1000
1500
2000
2500
3000
Oils and fats Grain andstarch products
Fish andcrustaceans
Soft drinks Preparedanimal feeds
Fruit andvegetables
Dairy products Meat and meatproducts
Alcoholicbeverages
Bakery Other foodproducts
% o
f S
ME
busin
esses in
each
subsecto
r
To
tal num
ber
of
busin
ess
Number of companies % of the subsector which are SME companies
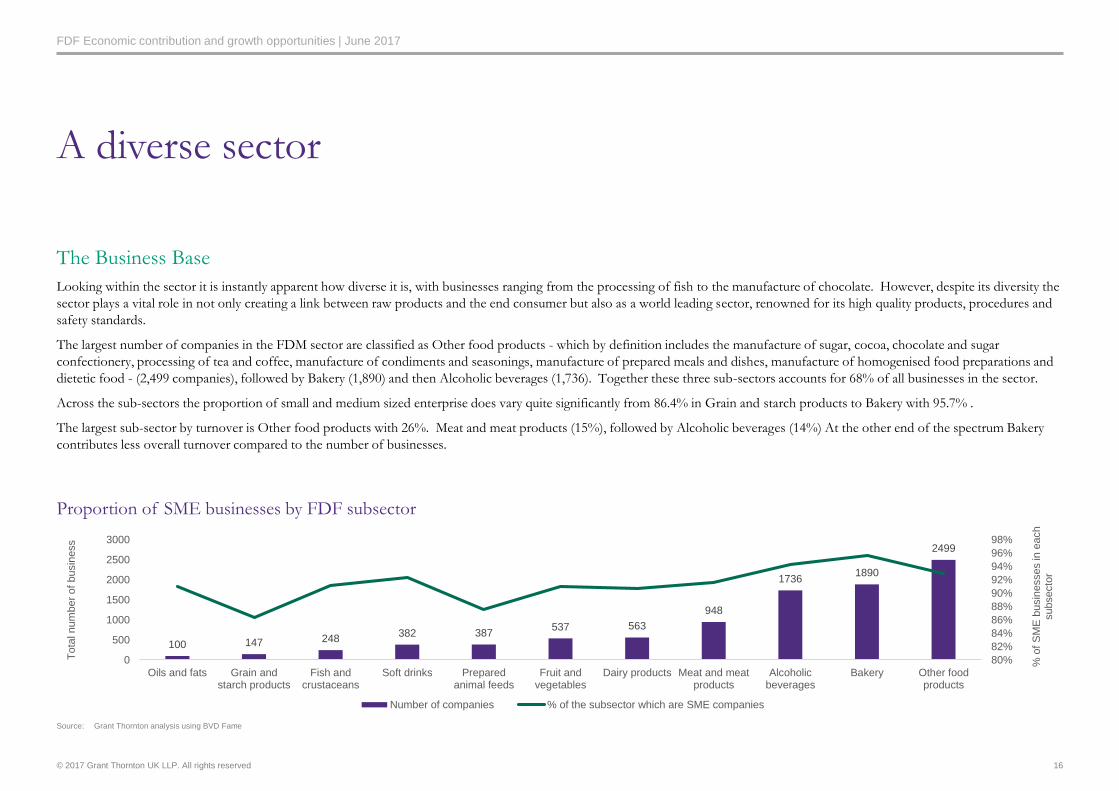
A diverse sector
The Business Base
Looking within the sector it is instantly apparent how diverse it is, with businesses ranging from the processing of fish to the manufacture of chocolate. However, despite its diversity the
sector plays a vital role in not only creating a link between raw products and the end consumer but also as a world leading sector, renowned for its high quality products, procedures and
safety standards.
The largest number of companies in the FDM sector are classified as Other food products - which by definition includes the manufacture of sugar, cocoa, chocolate and sugar
confectionery, processing of tea and coffee, manufacture of condiments and seasonings, manufacture of prepared meals and dishes, manufacture of homogenised food preparations and
dietetic food - (2,499 companies), followed by Bakery (1,890) and then Alcoholic beverages (1,736). Together these three sub-sectors accounts for 68% of all businesses in the sector.
Across the sub-sectors the proportion of small and medium sized enterprise does vary quite significantly from 86.4% in Grain and starch products to Bakery with 95.7% .
The largest sub-sector by turnover is Other food products with 26%. Meat and meat products (15%), followed by Alcoholic beverages (14%) At the other end of the spectrum Bakery
contributes less overall turnover compared to the number of businesses.
16
Proportion of SME businesses by FDF subsector
Source: Grant Thornton analysis using BVD Fame
© 2017 Grant Thornton UK LLP. All rights reserved
FDF Economic contribution and growth opportunities | June 2017
1%
3%
4%5%
7%8% 8%
10%11%
14%
27%
1%2% 2%
6%
9%10%
7% 7%
14%15%
26%
Oils and fats Grain and starchproducts
Fish andcrustaceans
Soft drinks Dairy products Fruit andvegetables
Prepared animalfeeds
Bakery Alcoholicbeverages
Meat and meatproducts
Other foodproducts
% of total count of businesses by subsector % of total turnover by subsector (2015)
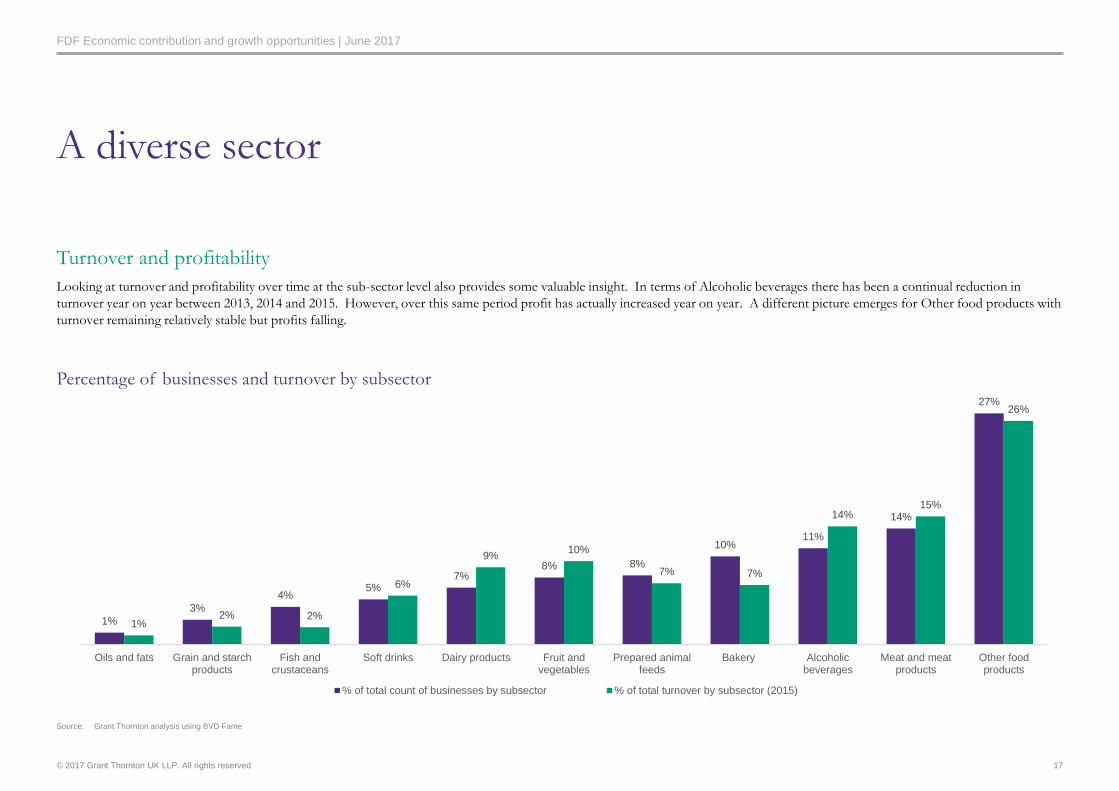
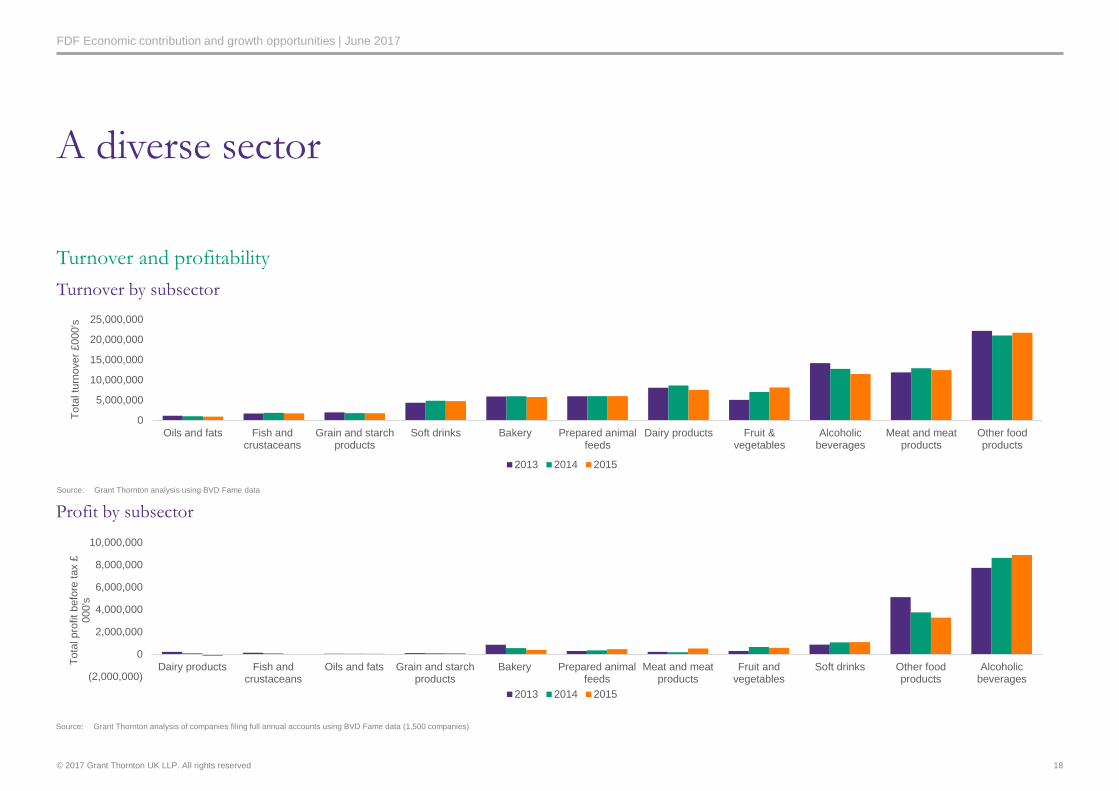
A diverse sector
Turnover and profitability
Looking at turnover and profitability over time at the sub-sector level also provides some valuable insight. In terms of Alcoholic beverages there has been a continual reduction in
turnover year on year between 2013, 2014 and 2015. However, over this same period profit has actually increased year on year. A different picture emerges for Other food products with
turnover remaining relatively stable but profits falling.
17
Percentage of businesses and turnover by subsector
Source: Grant Thornton analysis using BVD Fame
© 2017 Grant Thornton UK LLP. All rights reserved
FDF Economic contribution and growth opportunities | June 2017
A diverse sector
Turnover and profitability
Turnover by subsector
18
Profit by subsector
Source: Grant Thornton analysis using BVD Fame data
Source: Grant Thornton analysis of companies filing full annual accounts using BVD Fame data (1,500 companies)
0
5,000,000
10,000,000
15,000,000
20,000,000
25,000,000
Oils and fats Fish andcrustaceans
Grain and starchproducts
Soft drinks Bakery Prepared animalfeeds
Dairy products Fruit &vegetables
Alcoholicbeverages
Meat and meatproducts
Other foodproducts
To
tal tu
rnover
£000's
2013 2014 2015
(2,000,000)
0
2,000,000
4,000,000
6,000,000
8,000,000
10,000,000
Dairy products Fish andcrustaceans
Oils and fats Grain and starchproducts
Bakery Prepared animalfeeds
Meat and meatproducts
Fruit andvegetables
Soft drinks Other foodproducts
Alcoholicbeverages
To
tal pro
fit befo
re tax £
000's
2013 2014 2015
© 2017 Grant Thornton UK LLP. All rights reserved
FDF Economic contribution and growth opportunities | June 2017
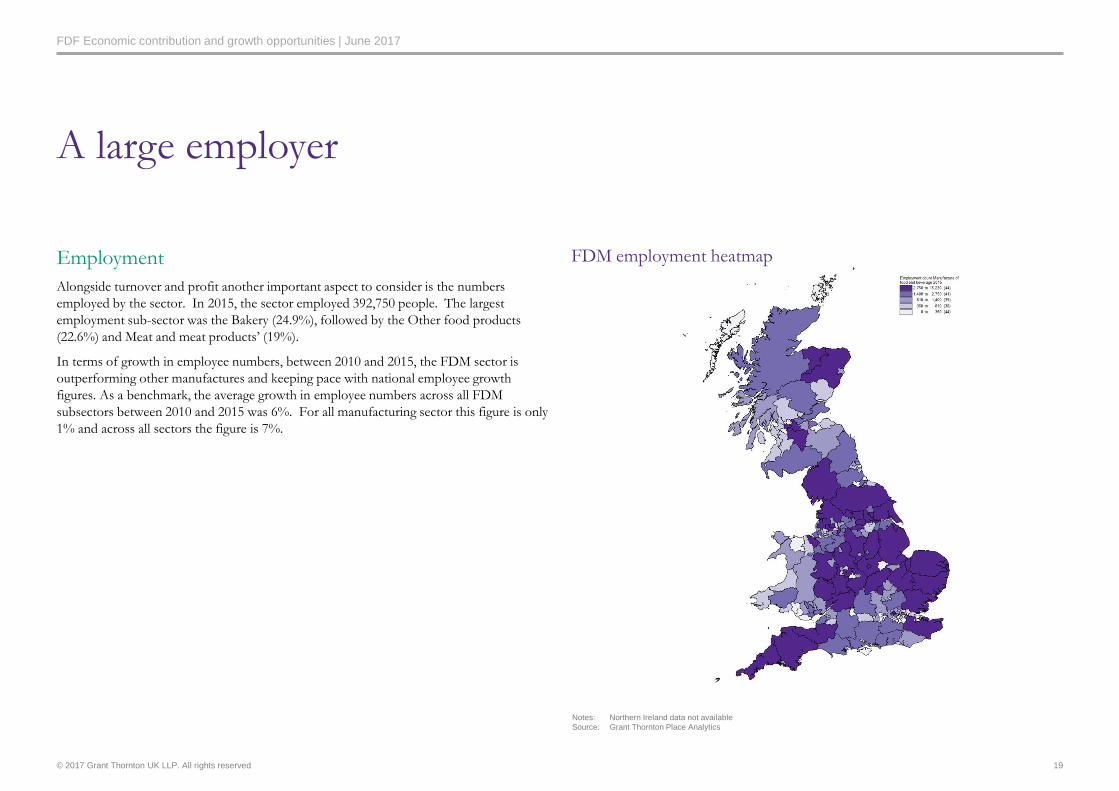
Employment
Alongside turnover and profit another important aspect to consider is the numbers
employed by the sector. In 2015, the sector employed 392,750 people. The largest
employment sub-sector was the Bakery (24.9%), followed by the Other food products
(22.6%) and Meat and meat products’ (19%).
In terms of growth in employee numbers, between 2010 and 2015, the FDM sector is
outperforming other manufactures and keeping pace with national employee growth
figures. As a benchmark, the average growth in employee numbers across all FDM
subsectors between 2010 and 2015 was 6%. For all manufacturing sector this figure is only
1% and across all sectors the figure is 7%.
A large employer
FDM employment heatmap
19
Notes: Northern Ireland data not available
Source: Grant Thornton Place Analytics

© 2017 Grant Thornton UK LLP. All rights reserved
FDF Economic contribution and growth opportunities | June 2017
17%
0%
11%
8%
0%
(4%)
5%
0%
9%
11%
5%
(10%)
(5%)
0%
5%
10%
15%
20%
0
20,000
40,000
60,000
80,000
100,000
120,000
Oils and fats Grain and starchproducts
Soft drinks Prepared animalfeeds
Fish andcrustaceans
Dairy products Alcoholicbeverages
Fruit andvegetables
Meat and meatproducts
Other foodproducts
Bakery
Num
ber
of em
plo
yees in
2015
total employed in subsector 2015 5 year change 2010 to 2015
A sector that is creating jobs
Employment
Within this overall context, there is variation between the FDM sub-sectors. For example, the largest growth, between 2010 and 2015, has been in the smallest employment sector: the
‘manufacture oils and fat’ (16.7%). Although given the small base, this can largely be considered as an outlier. In terms of the three largest employment sectors, Bakery saw employee
growth of 5.4%, Other food products saw growth of 11.3% and Meat and meat products saw growth of 8.7%.
5 year changes of employee numbers by subsector
20
Source: BRES data from ONS (N Ireland data not included)
© 2017 Grant Thornton UK LLP. All rights reserved
FDF Economic contribution and growth opportunities | June 2017
A sector that creates businesses and jobs across the United Kingdom
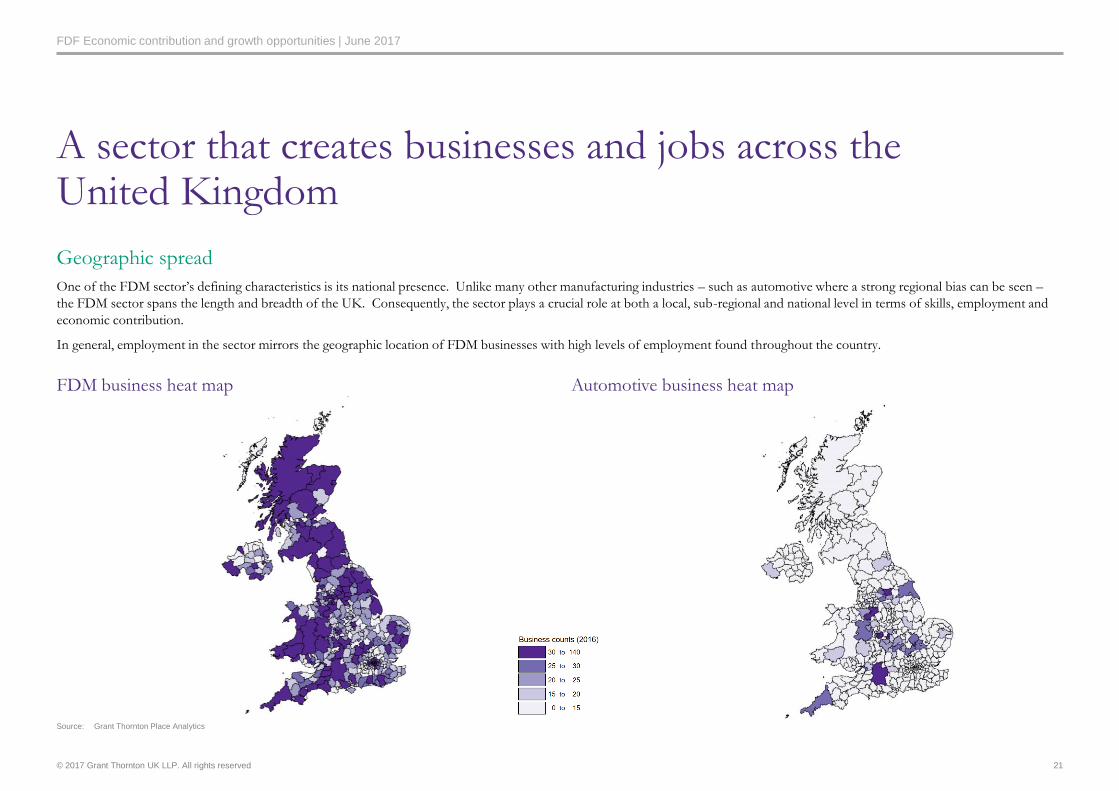
Geographic spread
One of the FDM sector’s defining characteristics is its national presence. Unlike many other manufacturing industries – such as automotive where a strong regional bias can be seen –
the FDM sector spans the length and breadth of the UK. Consequently, the sector plays a crucial role at both a local, sub-regional and national level in terms of skills, employment and
economic contribution.
In general, employment in the sector mirrors the geographic location of FDM businesses with high levels of employment found throughout the country.
21
UK FDM business heat map Automotive business heat mapFDM business heat map
Source: Grant Thornton Place Analytics
© 2017 Grant Thornton UK LLP. All rights reserved
FDF Economic contribution and growth opportunities | June 2017
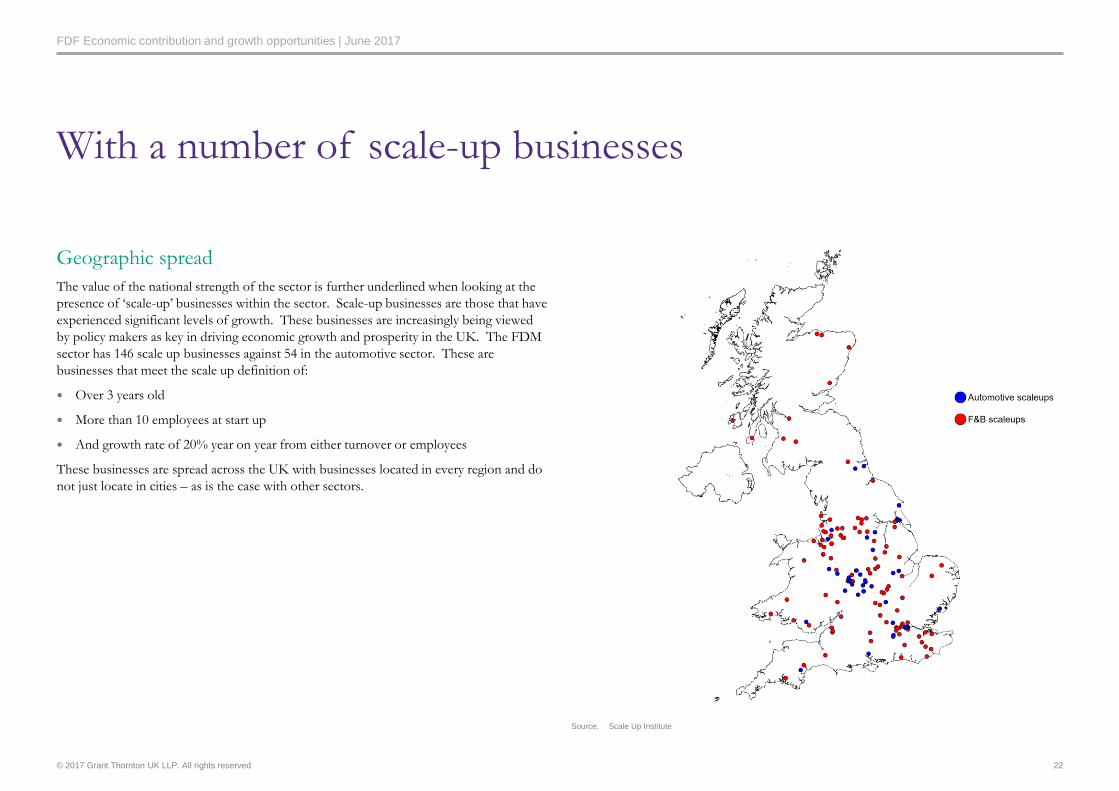
Geographic spread
The value of the national strength of the sector is further underlined when looking at the
presence of ‘scale-up’ businesses within the sector. Scale-up businesses are those that have
experienced significant levels of growth. These businesses are increasingly being viewed
by policy makers as key in driving economic growth and prosperity in the UK. The FDM
sector has 146 scale up businesses against 54 in the automotive sector. These are
businesses that meet the scale up definition of:
Over 3 years old
More than 10 employees at start up
And growth rate of 20% year on year from either turnover or employees
These businesses are spread across the UK with businesses located in every region and do
not just locate in cities – as is the case with other sectors.
With a number of scale-up businesses
22
Source: Scale Up Institute
© 2017 Grant Thornton UK LLP. All rights reserved
FDF Economic contribution and growth opportunities | June 2017
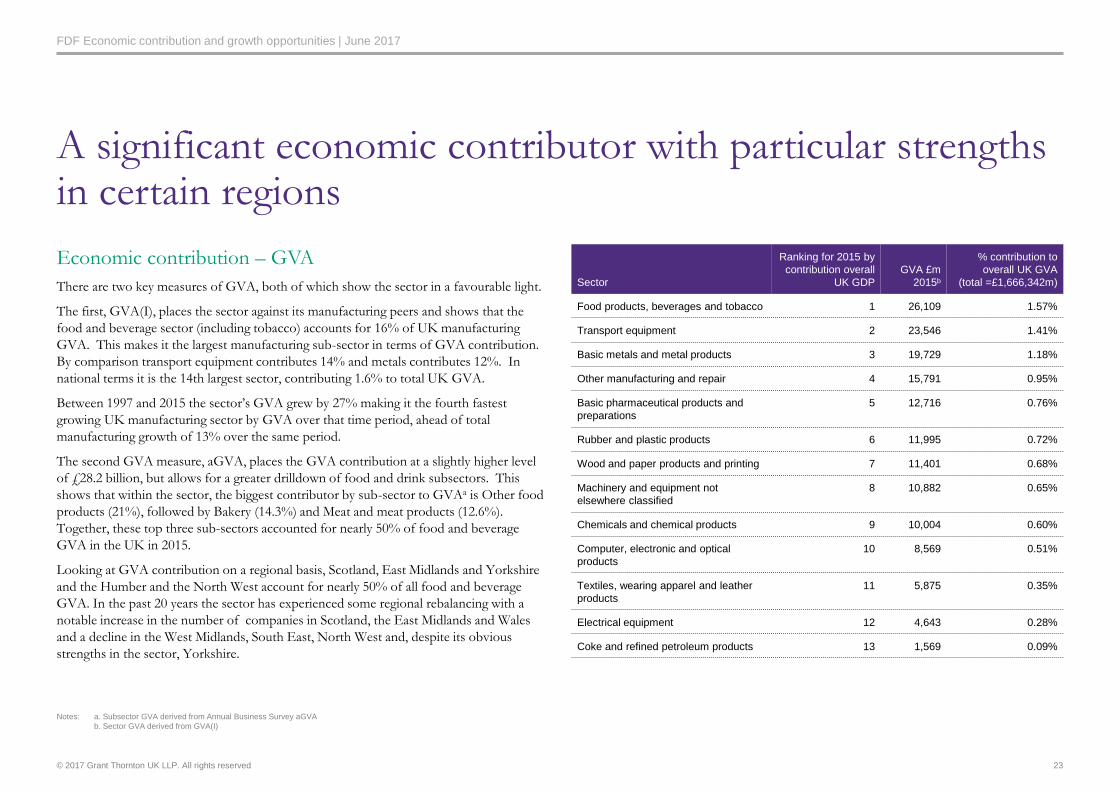
Economic contribution – GVA
There are two key measures of GVA, both of which show the sector in a favourable light.
The first, GVA(I), places the sector against its manufacturing peers and shows that the
food and beverage sector (including tobacco) accounts for 16% of UK manufacturing
GVA. This makes it the largest manufacturing sub-sector in terms of GVA contribution.
By comparison transport equipment contributes 14% and metals contributes 12%. In
national terms it is the 14th largest sector, contributing 1.6% to total UK GVA.
Between 1997 and 2015 the sector’s GVA grew by 27% making it the fourth fastest
growing UK manufacturing sector by GVA over that time period, ahead of total
manufacturing growth of 13% over the same period.
The second GVA measure, aGVA, places the GVA contribution at a slightly higher level
of £28.2 billion, but allows for a greater drilldown of food and drink subsectors. This
shows that within the sector, the biggest contributor by sub-sector to GVAa is Other food
products (21%), followed by Bakery (14.3%) and Meat and meat products (12.6%).
Together, these top three sub-sectors accounted for nearly 50% of food and beverage
GVA in the UK in 2015.
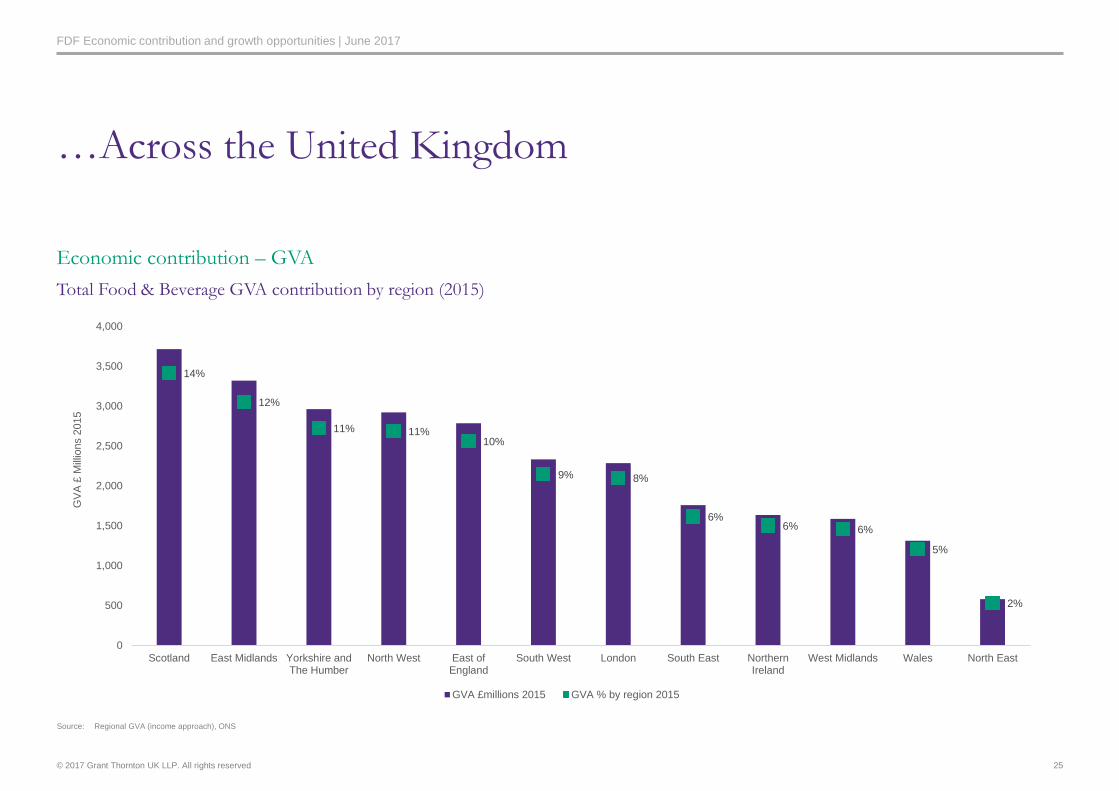
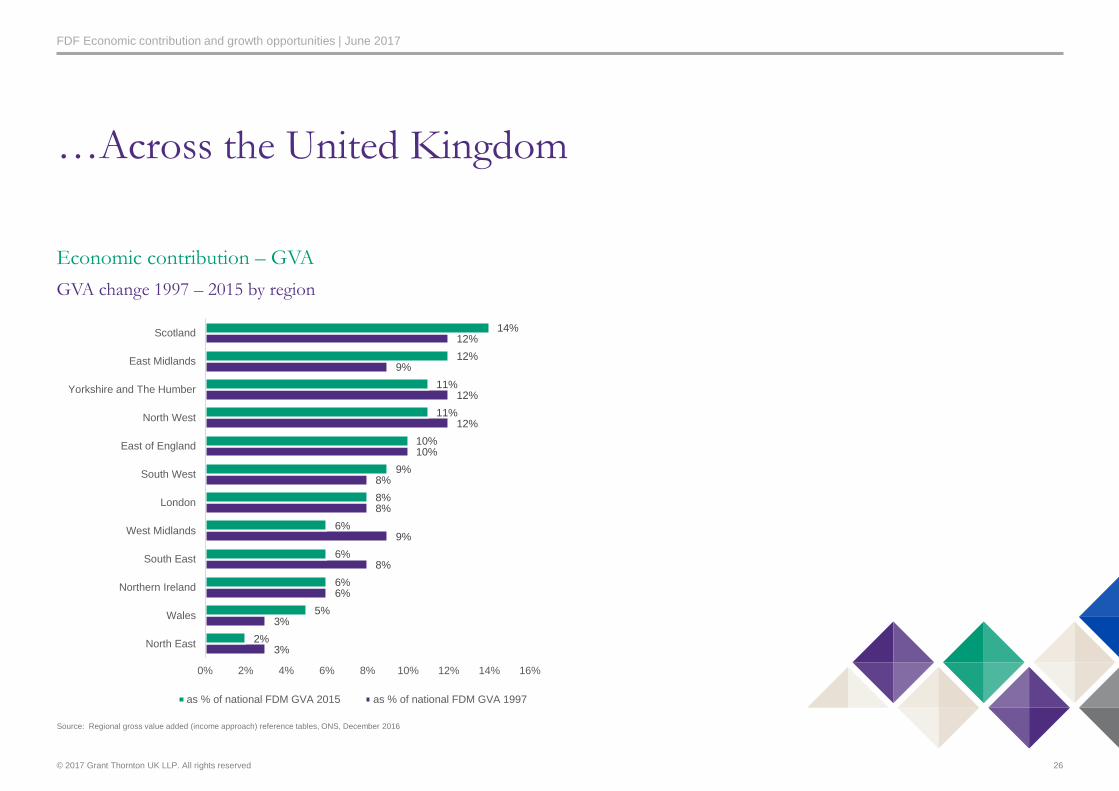
Looking at GVA contribution on a regional basis, Scotland, East Midlands and Yorkshire
and the Humber and the North West account for nearly 50% of all food and beverage
GVA. In the past 20 years the sector has experienced some regional rebalancing with a
notable increase in the number of companies in Scotland, the East Midlands and Wales
and a decline in the West Midlands, South East, North West and, despite its obvious
strengths in the sector, Yorkshire.
A significant economic contributor with particular strengths in certain regions
23
Sector
Ranking for 2015 by
contribution overall
UK GDP
GVA £m
2015b
% contribution to
overall UK GVA
(total =£1,666,342m)
Food products, beverages and tobacco 1 26,109 1.57%
Transport equipment 2 23,546 1.41%
Basic metals and metal products 3 19,729 1.18%
Other manufacturing and repair 4 15,791 0.95%
Basic pharmaceutical products and
preparations
5 12,716 0.76%
Rubber and plastic products 6 11,995 0.72%
Wood and paper products and printing 7 11,401 0.68%
Machinery and equipment not
elsewhere classified
8 10,882 0.65%
Chemicals and chemical products 9 10,004 0.60%
Computer, electronic and optical
products
10 8,569 0.51%
Textiles, wearing apparel and leather
products
11 5,875 0.35%
Electrical equipment 12 4,643 0.28%
Coke and refined petroleum products 13 1,569 0.09%
Notes: a. Subsector GVA derived from Annual Business Survey aGVA
b. Sector GVA derived from GVA(I)
© 2017 Grant Thornton UK LLP. All rights reserved
FDF Economic contribution and growth opportunities | June 2017
Economic contribution – GVA
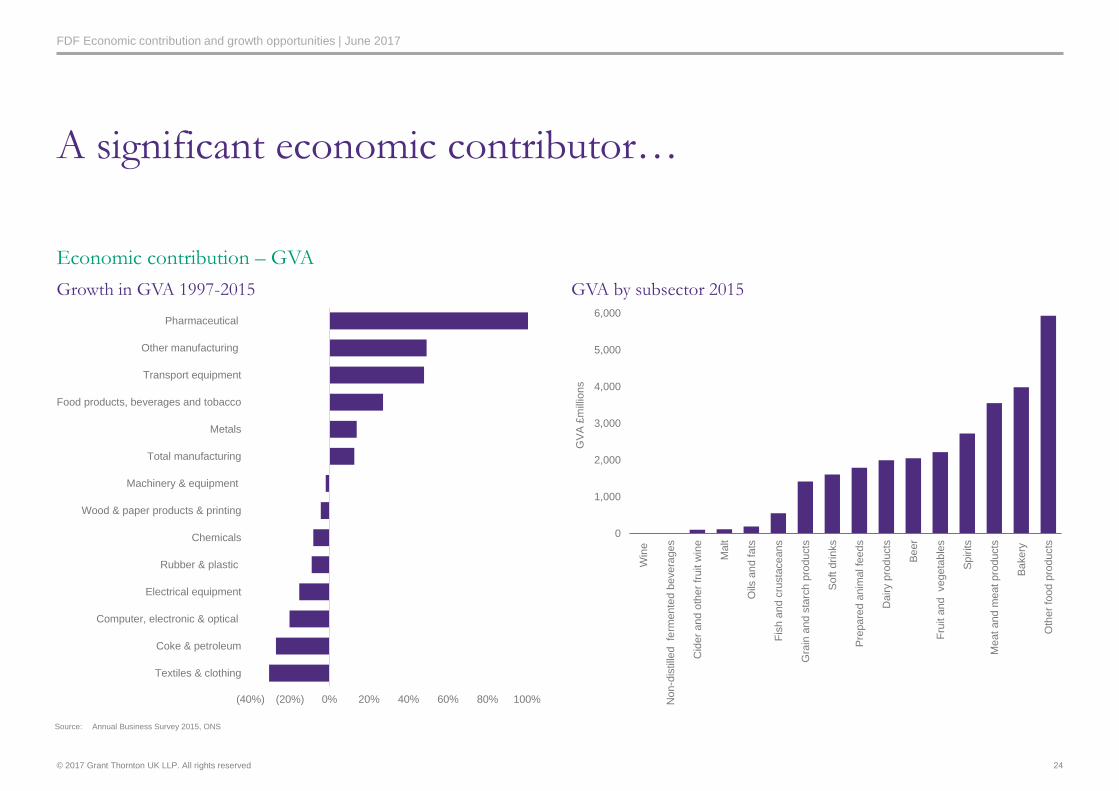
Growth in GVA 1997-2015
A significant economic contributor…
GVA by subsector 2015
24
0
1,000
2,000
3,000
4,000
5,000
6,000
Win
e
Non-d
istille
d fe
rmente
d b
evera
ges
Cid
er
and o
ther
fruit w
ine
Ma
lt
Oils
an
d fats
Fis
h a
nd c
rusta
ceans
Gra
in a
nd s
tarc
h p
roducts
So
ft d
rin
ks
Pre
pare
d a
nim
al fe
ed
s
Dairy p
rod
ucts
Be
er
Fru
it a
nd vegeta
ble
s
Sp
irits
Me
at and m
eat pro
ducts
Ba
kery
Oth
er
food p
roducts
GV
A £
mill
ions
Source: Annual Business Survey 2015, ONS
(40%) (20%) 0% 20% 40% 60% 80% 100%
Textiles & clothing
Coke & petroleum
Computer, electronic & optical
Electrical equipment
Rubber & plastic
Chemicals
Wood & paper products & printing
Machinery & equipment
Total manufacturing
Metals
Food products, beverages and tobacco
Transport equipment
Other manufacturing
Pharmaceutical
© 2017 Grant Thornton UK LLP. All rights reserved
FDF Economic contribution and growth opportunities | June 2017
…Across the United Kingdom
Economic contribution – GVA
Total Food & Beverage GVA contribution by region (2015)
25
Source: Regional GVA (income approach), ONS
14%
12%
11% 11%10%
9% 8%
6%6% 6%
5%
2%
0
500
1,000
1,500
2,000
2,500
3,000
3,500
4,000
Scotland East Midlands Yorkshire andThe Humber
North West East ofEngland
South West London South East NorthernIreland
West Midlands Wales North East
GV
A £
Mill
ions 2
015
GVA £millions 2015 GVA % by region 2015
© 2017 Grant Thornton UK LLP. All rights reserved
FDF Economic contribution and growth opportunities | June 2017
Economic contribution – GVA
GVA change 1997 – 2015 by region
…Across the United Kingdom
26
3%
3%
6%
8%
9%
8%
8%
10%
12%
12%
9%
12%
2%
5%
6%
6%
6%
8%
9%
10%
11%
11%
12%
14%
0% 2% 4% 6% 8% 10% 12% 14% 16%
North East
Wales
Northern Ireland
South East
West Midlands
London
South West
East of England
North West
Yorkshire and The Humber
East Midlands
Scotland
as % of national FDM GVA 2015 as % of national FDM GVA 1997
Source: Regional gross value added (income approach) reference tables, ONS, December 2016
© 2017 Grant Thornton UK LLP. All rights reserved
FDF Economic contribution and growth opportunities | June 2017
Economic contribution – productivity
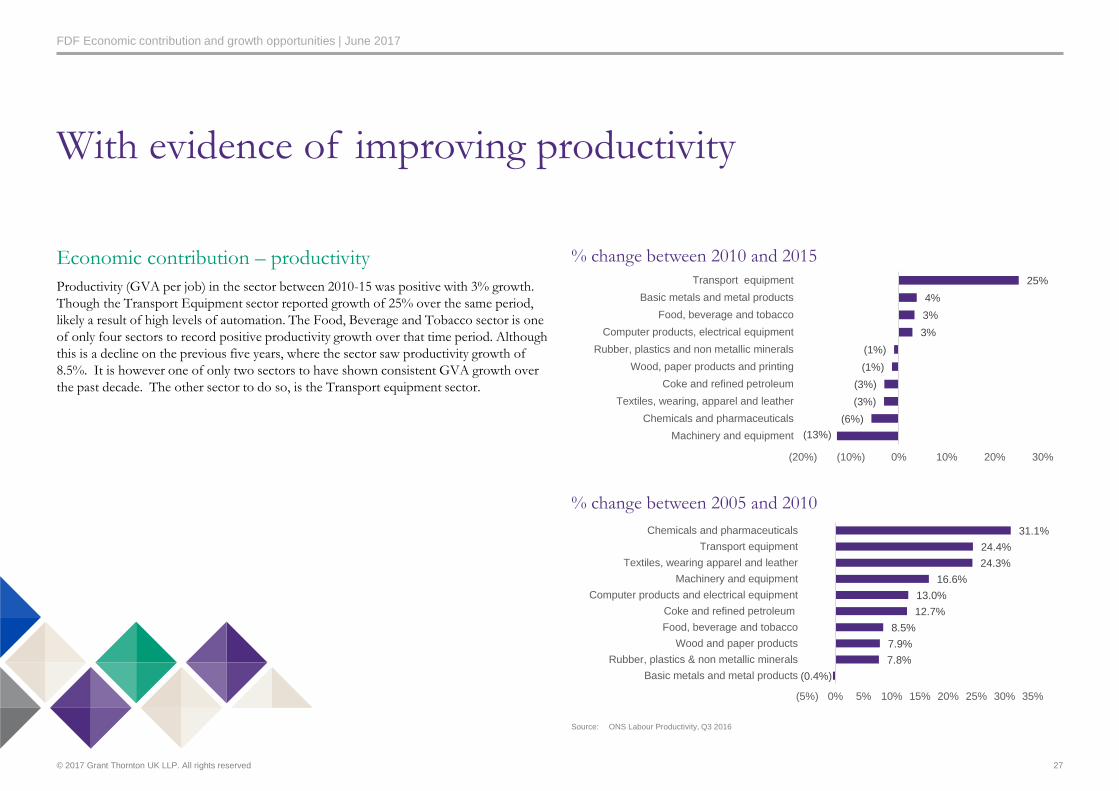
Productivity (GVA per job) in the sector between 2010-15 was positive with 3% growth.
Though the Transport Equipment sector reported growth of 25% over the same period,
likely a result of high levels of automation. The Food, Beverage and Tobacco sector is one
of only four sectors to record positive productivity growth over that time period. Although
this is a decline on the previous five years, where the sector saw productivity growth of
8.5%. It is however one of only two sectors to have shown consistent GVA growth over
the past decade. The other sector to do so, is the Transport equipment sector.
% change between 2010 and 2015
With evidence of improving productivity
27
(13%)
(6%)
(3%)
(3%)
(1%)
(1%)
3%
3%
4%
25%
(20%) (10%) 0% 10% 20% 30%
Machinery and equipment
Chemicals and pharmaceuticals
Textiles, wearing, apparel and leather
Coke and refined petroleum
Wood, paper products and printing
Rubber, plastics and non metallic minerals
Computer products, electrical equipment
Food, beverage and tobacco
Basic metals and metal products
Transport equipment
Source: ONS Labour Productivity, Q3 2016
(0.4%)
7.8%
7.9%
8.5%
12.7%
13.0%
16.6%
24.3%
24.4%
31.1%
(5%) 0% 5% 10% 15% 20% 25% 30% 35%
Basic metals and metal products
Rubber, plastics & non metallic minerals
Wood and paper products
Food, beverage and tobacco
Coke and refined petroleum
Computer products and electrical equipment
Machinery and equipment
Textiles, wearing apparel and leather
Transport equipment
Chemicals and pharmaceuticals
% change between 2005 and 2010
© 2017 Grant Thornton UK LLP. All rights reserved
FDF Economic contribution and growth opportunities | June 2017
32.1%
50.0%
28.6%
25.0%
21.4%
14.3%
0% 20% 40% 60%
Other (please specify)
UK food and drink manufacturing companies in my sub-sector
Other UK companies in the group
Other foreign companies in the group
UK food and drink manufacturing companies overall
Food and drink manufacturing companies in other countries
Notes: Based on 28 responses
Source: Grant Thornton survey
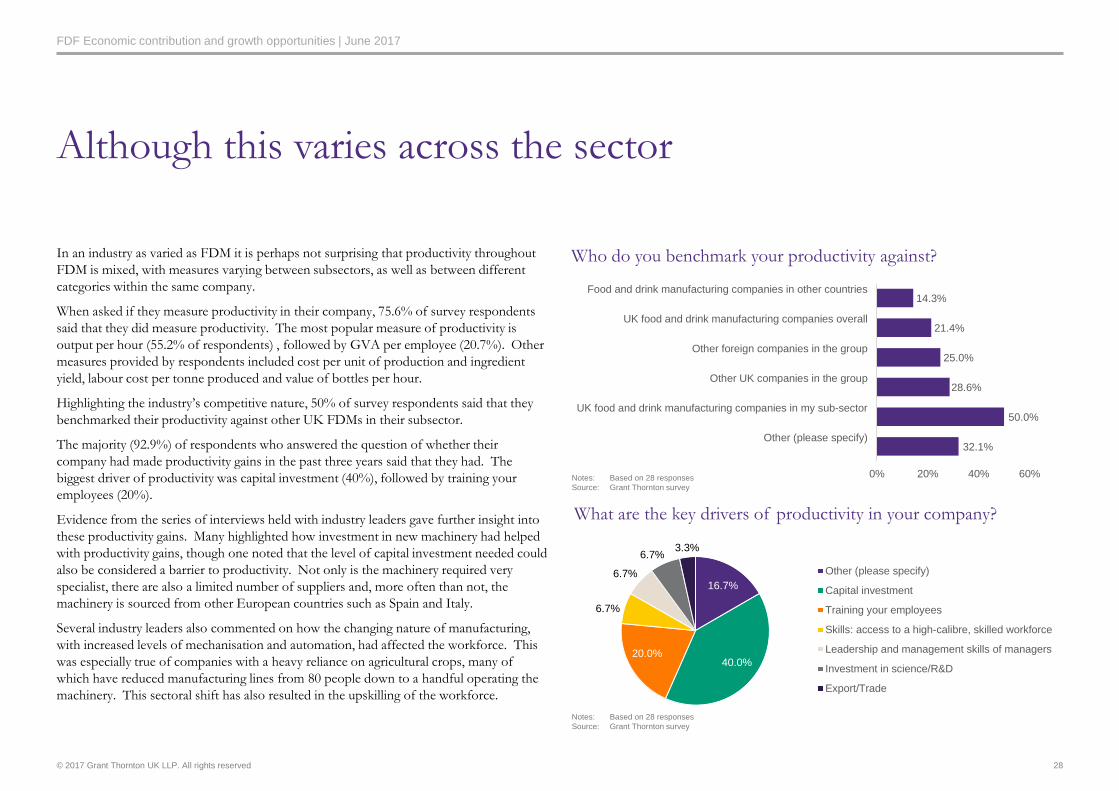
In an industry as varied as FDM it is perhaps not surprising that productivity throughout
FDM is mixed, with measures varying between subsectors, as well as between different
categories within the same company.
When asked if they measure productivity in their company, 75.6% of survey respondents
said that they did measure productivity. The most popular measure of productivity is
output per hour (55.2% of respondents) , followed by GVA per employee (20.7%). Other
measures provided by respondents included cost per unit of production and ingredient
yield, labour cost per tonne produced and value of bottles per hour.
Highlighting the industry’s competitive nature, 50% of survey respondents said that they
benchmarked their productivity against other UK FDMs in their subsector.
The majority (92.9%) of respondents who answered the question of whether their
company had made productivity gains in the past three years said that they had. The
biggest driver of productivity was capital investment (40%), followed by training your
employees (20%).
Evidence from the series of interviews held with industry leaders gave further insight into
these productivity gains. Many highlighted how investment in new machinery had helped
with productivity gains, though one noted that the level of capital investment needed could
also be considered a barrier to productivity. Not only is the machinery required very
specialist, there are also a limited number of suppliers and, more often than not, the
machinery is sourced from other European countries such as Spain and Italy.
Several industry leaders also commented on how the changing nature of manufacturing,
with increased levels of mechanisation and automation, had affected the workforce. This
was especially true of companies with a heavy reliance on agricultural crops, many of
which have reduced manufacturing lines from 80 people down to a handful operating the
machinery. This sectoral shift has also resulted in the upskilling of the workforce.
Although this varies across the sector
Who do you benchmark your productivity against?
28
What are the key drivers of productivity in your company?
16.7%
40.0%20.0%
6.7%
6.7%
6.7%3.3%
Other (please specify)
Capital investment
Training your employees
Skills: access to a high-calibre, skilled workforce
Leadership and management skills of managers
Investment in science/R&D
Export/Trade
Notes: Based on 28 responses
Source: Grant Thornton survey
© 2017 Grant Thornton UK LLP. All rights reserved
FDF Economic contribution and growth opportunities | June 2017
This section of the report has presented a range of evidence around the positive economic contribution that the sector
has made. In order to better understand how strong the levers and opportunities are for companies in the sector, the
remainder of this report will look in detail at three key drivers: skills, innovation and trade.
Chapter conclusion
29

© 2017 Grant Thornton UK LLP. All rights reserved | Draft
Skills
30
© 2017 Grant Thornton UK LLP. All rights reserved
FDF Economic contribution and growth opportunities | June 2017
The FDM sector is often characterised as being low-skilled and, consequently, low in pay but the reality is very different.
There is a broad range of opportunities available to build a career within the sector and, unlike other manufacturing
industries, these careers are not focused on a particular geographic area but can be found the length and breadth of
the country.
Nevertheless, the sector does face considerable challenges. An ageing workforce, coupled with the, as yet unknown,
implications for the EU Exit and the impact it may have on EU nationals working in the sector, alongside the increased
use of automation and robotics mean employment and skill levels in the sector are in a state of flux.
Chapter introduction
31
© 2017 Grant Thornton UK LLP. All rights reserved
FDF Economic contribution and growth opportunities | June 2017
Geographic spread
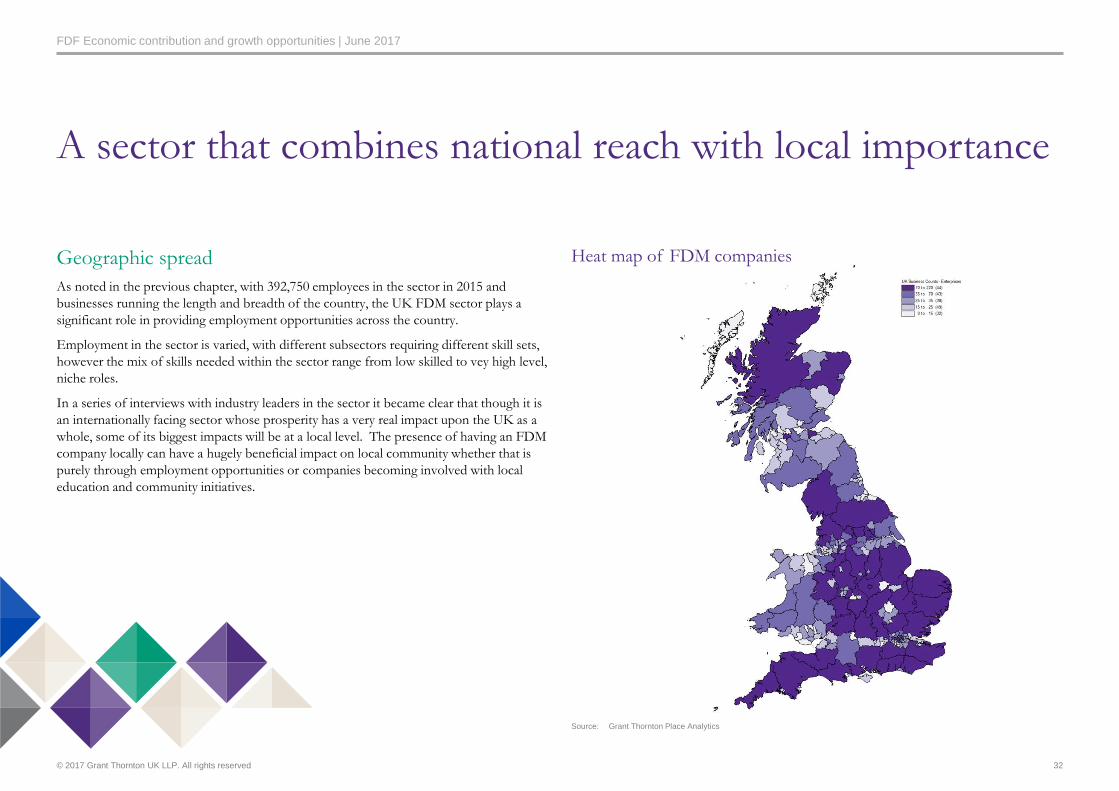
As noted in the previous chapter, with 392,750 employees in the sector in 2015 and
businesses running the length and breadth of the country, the UK FDM sector plays a
significant role in providing employment opportunities across the country.
Employment in the sector is varied, with different subsectors requiring different skill sets,
however the mix of skills needed within the sector range from low skilled to vey high level,
niche roles.
In a series of interviews with industry leaders in the sector it became clear that though it is
an internationally facing sector whose prosperity has a very real impact upon the UK as a
whole, some of its biggest impacts will be at a local level. The presence of having an FDM
company locally can have a hugely beneficial impact on local community whether that is
purely through employment opportunities or companies becoming involved with local
education and community initiatives.
Heat map of FDM companies
A sector that combines national reach with local importance
32
Source: Grant Thornton Place Analytics
© 2017 Grant Thornton UK LLP. All rights reserved
FDF Economic contribution and growth opportunities | June 2017
17%
0%
11%
8%
0%
(4%)
5%
0%
9%11%
5%
0
20,000
40,000
60,000
80,000
100,000
120,000
Oils and fats Grain and starchproducts
Soft drinks Prepared animalfeeds
Fish andcrustaceans
Dairy products Alcoholicbeverages
Fruit andvegetables
Meat and meatproducts
Other foodproducts
BakeryNum
ber
of em
plo
yees in
2015
Total employed in subsector 2015 5 year change 2010 to 2015
Workforce composition – skills
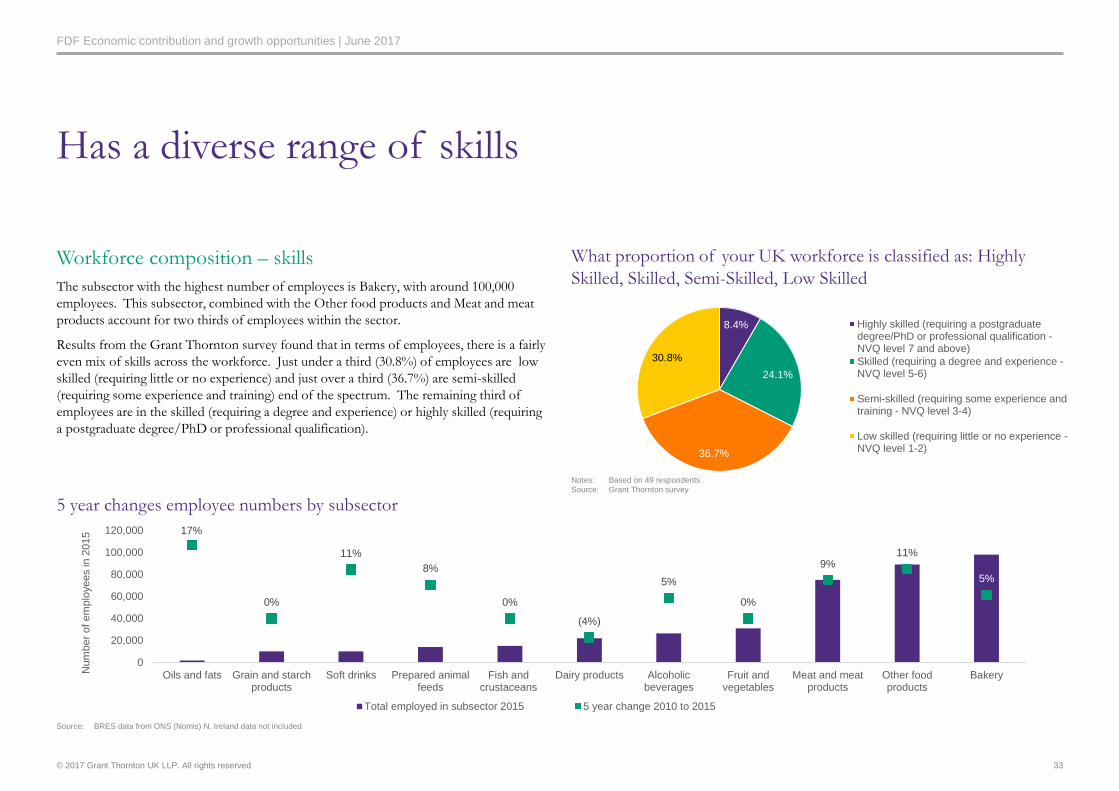
The subsector with the highest number of employees is Bakery, with around 100,000
employees. This subsector, combined with the Other food products and Meat and meat
products account for two thirds of employees within the sector.
Results from the Grant Thornton survey found that in terms of employees, there is a fairly
even mix of skills across the workforce. Just under a third (30.8%) of employees are low
skilled (requiring little or no experience) and just over a third (36.7%) are semi-skilled
(requiring some experience and training) end of the spectrum. The remaining third of
employees are in the skilled (requiring a degree and experience) or highly skilled (requiring
a postgraduate degree/PhD or professional qualification).
Has a diverse range of skills
What proportion of your UK workforce is classified as: Highly
Skilled, Skilled, Semi-Skilled, Low Skilled
33
8.4%
24.1%
36.7%
30.8%
Highly skilled (requiring a postgraduatedegree/PhD or professional qualification -NVQ level 7 and above)
Skilled (requiring a degree and experience -NVQ level 5-6)
Semi-skilled (requiring some experience andtraining - NVQ level 3-4)
Low skilled (requiring little or no experience -NVQ level 1-2)
Notes: Based on 49 respondents
Source: Grant Thornton survey
Source: BRES data from ONS (Nomis) N. Ireland data not included
5 year changes employee numbers by subsector
© 2017 Grant Thornton UK LLP. All rights reserved
FDF Economic contribution and growth opportunities | June 2017
Strong reliance on migrant workers
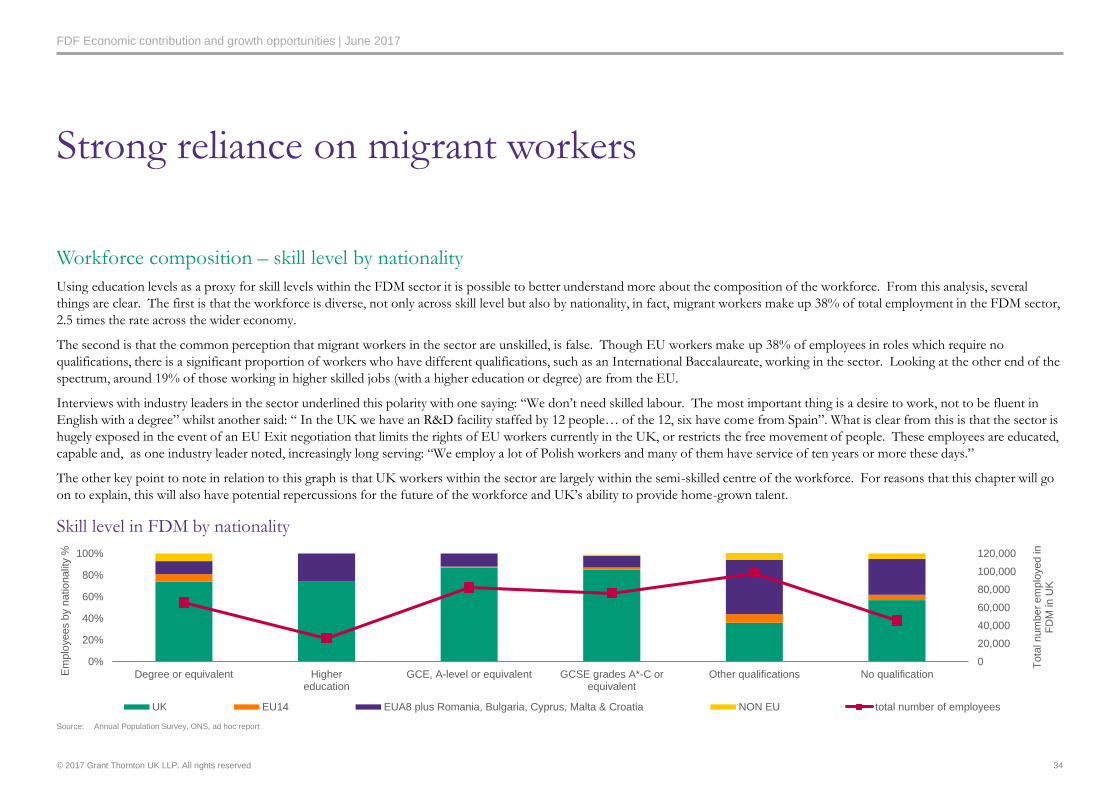
Workforce composition – skill level by nationality
Using education levels as a proxy for skill levels within the FDM sector it is possible to better understand more about the composition of the workforce. From this analysis, several
things are clear. The first is that the workforce is diverse, not only across skill level but also by nationality, in fact, migrant workers make up 38% of total employment in the FDM sector,
2.5 times the rate across the wider economy.
The second is that the common perception that migrant workers in the sector are unskilled, is false. Though EU workers make up 38% of employees in roles which require no
qualifications, there is a significant proportion of workers who have different qualifications, such as an International Baccalaureate, working in the sector. Looking at the other end of the
spectrum, around 19% of those working in higher skilled jobs (with a higher education or degree) are from the EU.
Interviews with industry leaders in the sector underlined this polarity with one saying: “We don’t need skilled labour. The most important thing is a desire to work, not to be fluent in
English with a degree” whilst another said: “ In the UK we have an R&D facility staffed by 12 people… of the 12, six have come from Spain”. What is clear from this is that the sector is
hugely exposed in the event of an EU Exit negotiation that limits the rights of EU workers currently in the UK, or restricts the free movement of people. These employees are educated,
capable and, as one industry leader noted, increasingly long serving: “We employ a lot of Polish workers and many of them have service of ten years or more these days.”
The other key point to note in relation to this graph is that UK workers within the sector are largely within the semi-skilled centre of the workforce. For reasons that this chapter will go
on to explain, this will also have potential repercussions for the future of the workforce and UK’s ability to provide home-grown talent.
34
Skill level in FDM by nationality
Source: Annual Population Survey, ONS, ad hoc report
0
20,000
40,000
60,000
80,000
100,000
120,000
0%
20%
40%
60%
80%
100%
Degree or equivalent Highereducation
GCE, A-level or equivalent GCSE grades A*-C orequivalent
Other qualifications No qualification
To
tal num
ber
em
plo
yed in
F
DM
in
UK
Em
plo
yees b
y n
atio
nalit
y %
UK EU14 EUA8 plus Romania, Bulgaria, Cyprus, Malta & Croatia NON EU total number of employees
© 2017 Grant Thornton UK LLP. All rights reserved
FDF Economic contribution and growth opportunities | June 2017
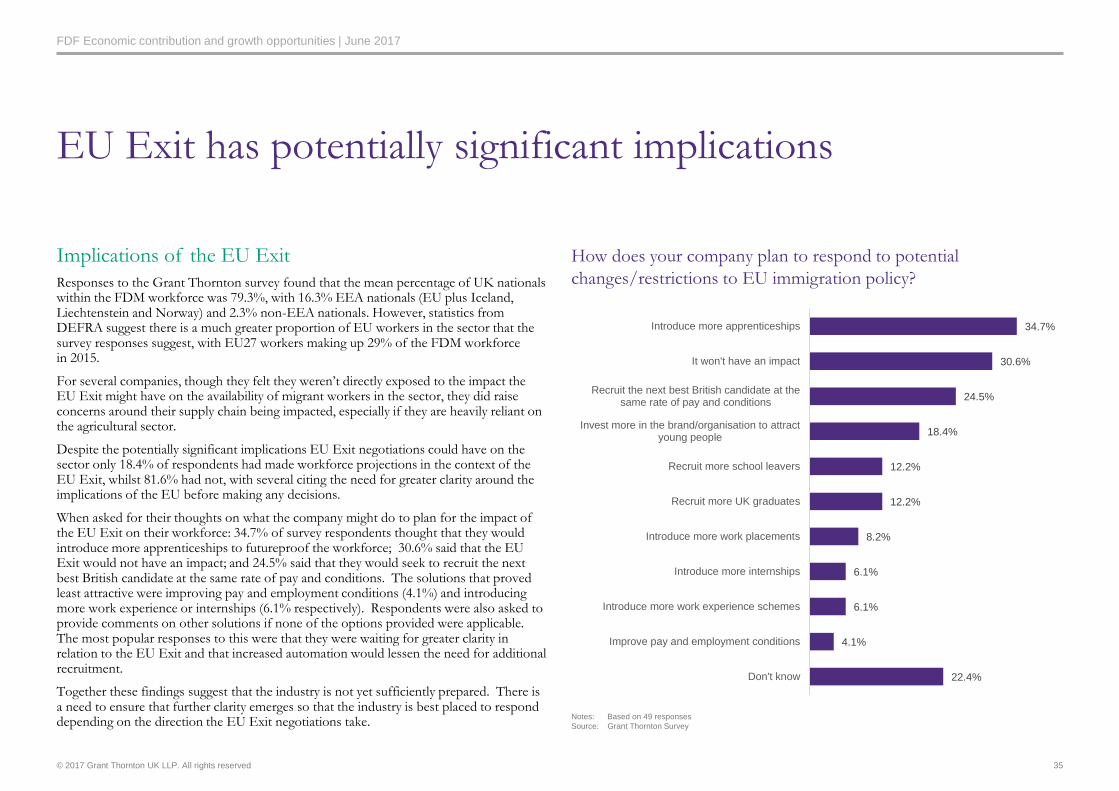
Implications of the EU Exit
Responses to the Grant Thornton survey found that the mean percentage of UK nationals within the FDM workforce was 79.3%, with 16.3% EEA nationals (EU plus Iceland, Liechtenstein and Norway) and 2.3% non-EEA nationals. However, statistics from DEFRA suggest there is a much greater proportion of EU workers in the sector that the survey responses suggest, with EU27 workers making up 29% of the FDM workforce in 2015.
For several companies, though they felt they weren’t directly exposed to the impact the EU Exit might have on the availability of migrant workers in the sector, they did raise concerns around their supply chain being impacted, especially if they are heavily reliant on the agricultural sector.
Despite the potentially significant implications EU Exit negotiations could have on the sector only 18.4% of respondents had made workforce projections in the context of the EU Exit, whilst 81.6% had not, with several citing the need for greater clarity around the implications of the EU before making any decisions.
When asked for their thoughts on what the company might do to plan for the impact of the EU Exit on their workforce: 34.7% of survey respondents thought that they would introduce more apprenticeships to futureproof the workforce; 30.6% said that the EU Exit would not have an impact; and 24.5% said that they would seek to recruit the next best British candidate at the same rate of pay and conditions. The solutions that proved least attractive were improving pay and employment conditions (4.1%) and introducing more work experience or internships (6.1% respectively). Respondents were also asked to provide comments on other solutions if none of the options provided were applicable. The most popular responses to this were that they were waiting for greater clarity in relation to the EU Exit and that increased automation would lessen the need for additional recruitment.
Together these findings suggest that the industry is not yet sufficiently prepared. There is a need to ensure that further clarity emerges so that the industry is best placed to respond depending on the direction the EU Exit negotiations take.
EU Exit has potentially significant implications
How does your company plan to respond to potential
changes/restrictions to EU immigration policy?
35
22.4%
4.1%
6.1%
6.1%
8.2%
12.2%
12.2%
18.4%
24.5%
30.6%
34.7%
Don't know
Improve pay and employment conditions
Introduce more work experience schemes
Introduce more internships
Introduce more work placements
Recruit more UK graduates
Recruit more school leavers
Invest more in the brand/organisation to attractyoung people
Recruit the next best British candidate at thesame rate of pay and conditions
It won't have an impact
Introduce more apprenticeships
Notes: Based on 49 responses
Source: Grant Thornton Survey
© 2017 Grant Thornton UK LLP. All rights reserved
FDF Economic contribution and growth opportunities | June 2017
Top 10: Nationally Top 10: Outside of London
Area Region Area Region
1 Corby East Midlands 1 Corby East Midlands
2 Boston East Midlands 2 Boston East Midlands
3 Haringey London 3 Breckland East of England
4 Newham London 4North East
Lincolnshire
Yorkshire and
Humber
5 Brent London 5 Leicester East Midlands
6 Ealing London 6 Slough South East
7Kensington and
ChelseaLondon 7 Peterborough East of England
8 Breckland East of England 8 Blackpool North West
9North East
Lincolnshire
Yorkshire and
Humber9
Blackburn with
DarwenNorth West
10 Merton London 10 Kingston upon HullYorkshire and
Humber
Implications of the EU Exit
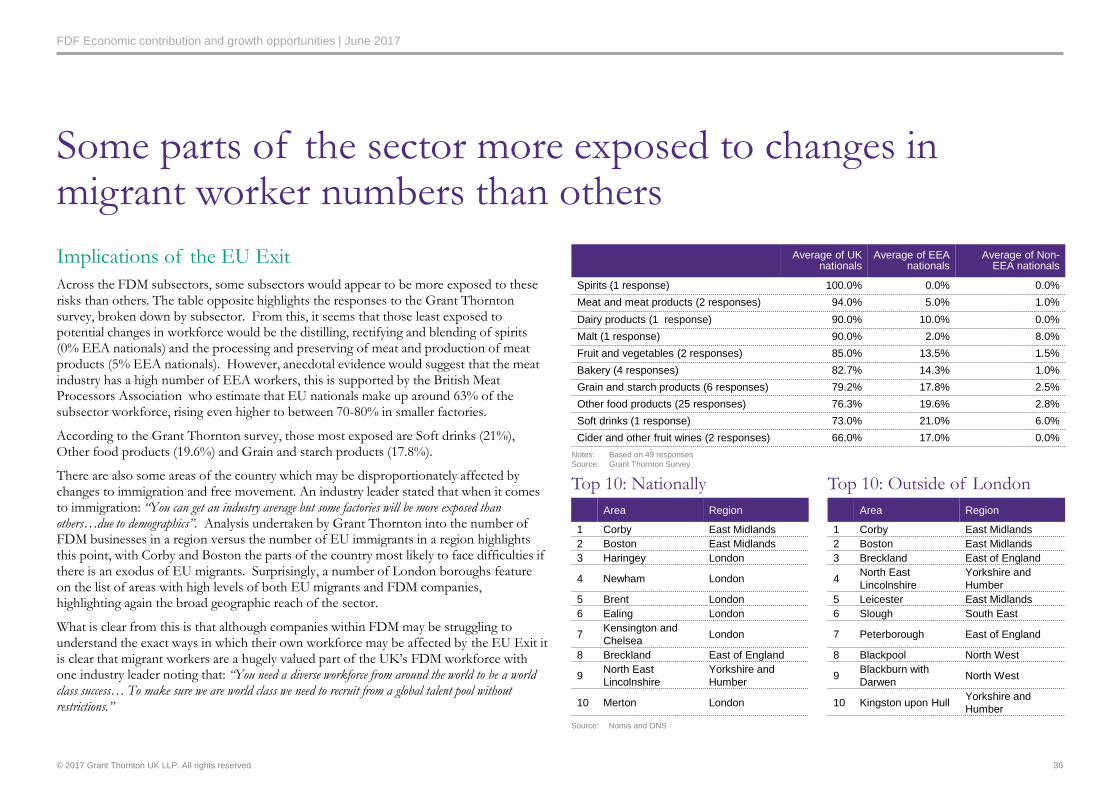
Across the FDM subsectors, some subsectors would appear to be more exposed to these risks than others. The table opposite highlights the responses to the Grant Thornton survey, broken down by subsector. From this, it seems that those least exposed to potential changes in workforce would be the distilling, rectifying and blending of spirits (0% EEA nationals) and the processing and preserving of meat and production of meat products (5% EEA nationals). However, anecdotal evidence would suggest that the meat industry has a high number of EEA workers, this is supported by the British Meat Processors Association who estimate that EU nationals make up around 63% of the subsector workforce, rising even higher to between 70-80% in smaller factories.
According to the Grant Thornton survey, those most exposed are Soft drinks (21%), Other food products (19.6%) and Grain and starch products (17.8%).
There are also some areas of the country which may be disproportionately affected by changes to immigration and free movement. An industry leader stated that when it comes to immigration: “You can get an industry average but some factories will be more exposed than others…due to demographics”. Analysis undertaken by Grant Thornton into the number of FDM businesses in a region versus the number of EU immigrants in a region highlights this point, with Corby and Boston the parts of the country most likely to face difficulties if there is an exodus of EU migrants. Surprisingly, a number of London boroughs feature on the list of areas with high levels of both EU migrants and FDM companies, highlighting again the broad geographic reach of the sector.
What is clear from this is that although companies within FDM may be struggling to understand the exact ways in which their own workforce may be affected by the EU Exit it is clear that migrant workers are a hugely valued part of the UK’s FDM workforce with one industry leader noting that: “You need a diverse workforce from around the world to be a world class success… To make sure we are world class we need to recruit from a global talent pool without restrictions.”
Some parts of the sector more exposed to changes in migrant worker numbers than others
36
Notes: Based on 49 responses
Source: Grant Thornton Survey
Source: Nomis and ONS
Average of UK nationals
Average of EEA nationals
Average of Non-EEA nationals
Spirits (1 response) 100.0% 0.0% 0.0%
Meat and meat products (2 responses) 94.0% 5.0% 1.0%
Dairy products (1 response) 90.0% 10.0% 0.0%
Malt (1 response) 90.0% 2.0% 8.0%
Fruit and vegetables (2 responses) 85.0% 13.5% 1.5%
Bakery (4 responses) 82.7% 14.3% 1.0%
Grain and starch products (6 responses) 79.2% 17.8% 2.5%
Other food products (25 responses) 76.3% 19.6% 2.8%
Soft drinks (1 response) 73.0% 21.0% 6.0%
Cider and other fruit wines (2 responses) 66.0% 17.0% 0.0%
© 2017 Grant Thornton UK LLP. All rights reserved
FDF Economic contribution and growth opportunities | June 2017
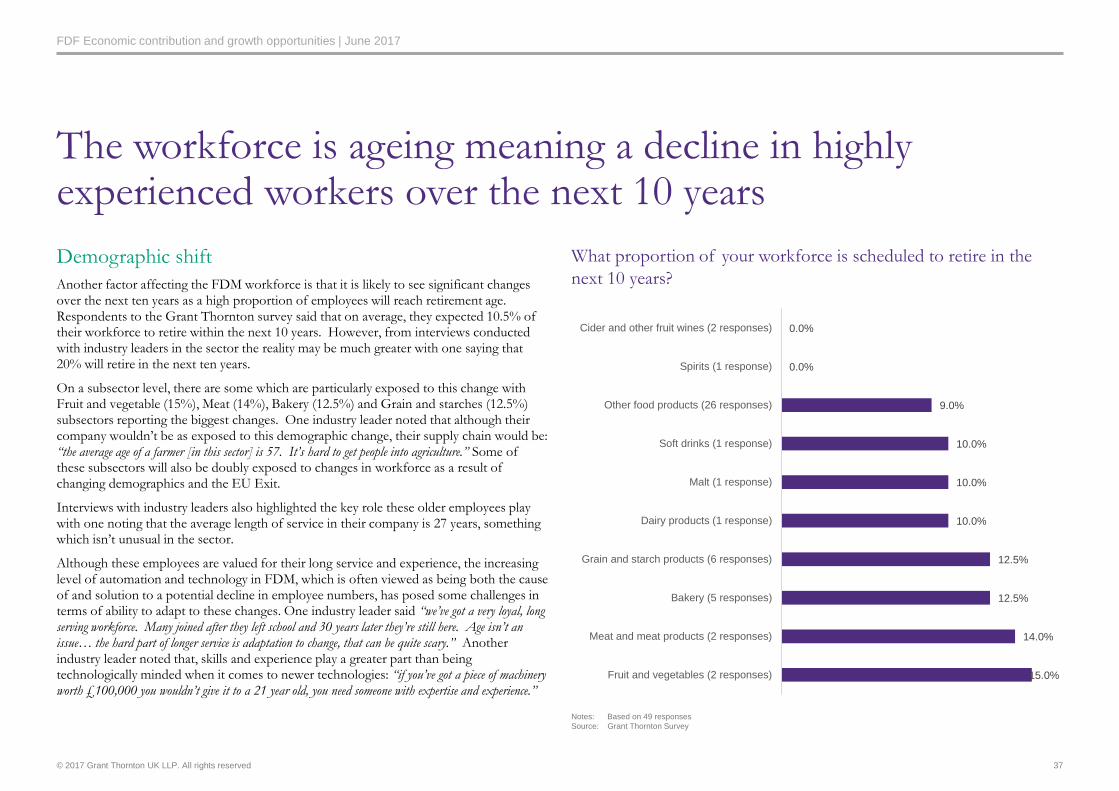
Demographic shift
Another factor affecting the FDM workforce is that it is likely to see significant changes over the next ten years as a high proportion of employees will reach retirement age. Respondents to the Grant Thornton survey said that on average, they expected 10.5% of their workforce to retire within the next 10 years. However, from interviews conducted with industry leaders in the sector the reality may be much greater with one saying that 20% will retire in the next ten years.
On a subsector level, there are some which are particularly exposed to this change with Fruit and vegetable (15%), Meat (14%), Bakery (12.5%) and Grain and starches (12.5%) subsectors reporting the biggest changes. One industry leader noted that although their company wouldn’t be as exposed to this demographic change, their supply chain would be: “the average age of a farmer [in this sector] is 57. It’s hard to get people into agriculture.” Some of these subsectors will also be doubly exposed to changes in workforce as a result of changing demographics and the EU Exit.
Interviews with industry leaders also highlighted the key role these older employees play with one noting that the average length of service in their company is 27 years, something which isn’t unusual in the sector.
Although these employees are valued for their long service and experience, the increasing level of automation and technology in FDM, which is often viewed as being both the cause of and solution to a potential decline in employee numbers, has posed some challenges in terms of ability to adapt to these changes. One industry leader said “we’ve got a very loyal, long serving workforce. Many joined after they left school and 30 years later they’re still here. Age isn’t an issue… the hard part of longer service is adaptation to change, that can be quite scary.” Another industry leader noted that, skills and experience play a greater part than being technologically minded when it comes to newer technologies: “if you’ve got a piece of machinery worth £100,000 you wouldn’t give it to a 21 year old, you need someone with expertise and experience.”
The workforce is ageing meaning a decline in highly experienced workers over the next 10 years
What proportion of your workforce is scheduled to retire in the
next 10 years?
37
15.0%
14.0%
12.5%
12.5%
10.0%
10.0%
10.0%
9.0%
0.0%
0.0%
Fruit and vegetables (2 responses)
Meat and meat products (2 responses)
Bakery (5 responses)
Grain and starch products (6 responses)
Dairy products (1 response)
Malt (1 response)
Soft drinks (1 response)
Other food products (26 responses)
Spirits (1 response)
Cider and other fruit wines (2 responses)
Notes: Based on 49 responses
Source: Grant Thornton Survey
© 2017 Grant Thornton UK LLP. All rights reserved
FDF Economic contribution and growth opportunities | June 2017
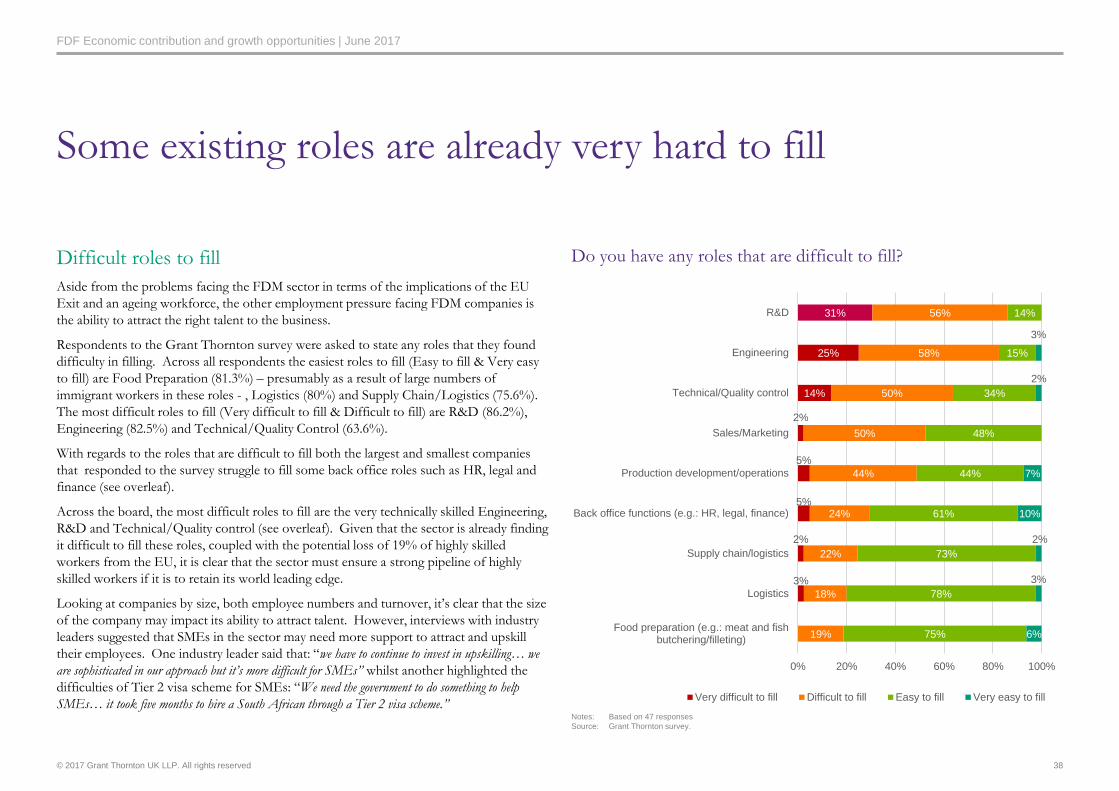
Difficult roles to fill
Aside from the problems facing the FDM sector in terms of the implications of the EU
Exit and an ageing workforce, the other employment pressure facing FDM companies is
the ability to attract the right talent to the business.
Respondents to the Grant Thornton survey were asked to state any roles that they found
difficulty in filling. Across all respondents the easiest roles to fill (Easy to fill & Very easy
to fill) are Food Preparation (81.3%) – presumably as a result of large numbers of
immigrant workers in these roles - , Logistics (80%) and Supply Chain/Logistics (75.6%).
The most difficult roles to fill (Very difficult to fill & Difficult to fill) are R&D (86.2%),
Engineering (82.5%) and Technical/Quality Control (63.6%).
With regards to the roles that are difficult to fill both the largest and smallest companies
that responded to the survey struggle to fill some back office roles such as HR, legal and
finance (see overleaf).
Across the board, the most difficult roles to fill are the very technically skilled Engineering,
R&D and Technical/Quality control (see overleaf). Given that the sector is already finding
it difficult to fill these roles, coupled with the potential loss of 19% of highly skilled
workers from the EU, it is clear that the sector must ensure a strong pipeline of highly
skilled workers if it is to retain its world leading edge.
Looking at companies by size, both employee numbers and turnover, it’s clear that the size
of the company may impact its ability to attract talent. However, interviews with industry
leaders suggested that SMEs in the sector may need more support to attract and upskill
their employees. One industry leader said that: “we have to continue to invest in upskilling… we
are sophisticated in our approach but it’s more difficult for SMEs” whilst another highlighted the
difficulties of Tier 2 visa scheme for SMEs: “We need the government to do something to help
SMEs… it took five months to hire a South African through a Tier 2 visa scheme.”
Some existing roles are already very hard to fill
Do you have any roles that are difficult to fill?
38
Notes: Based on 47 responses
Source: Grant Thornton survey.
3%
2%
5%
5%
2%
14%
25%
31%
19%
18%
22%
24%
44%
50%
50%
58%
56%
75%
78%
73%
61%
44%
48%
34%
15%
14%
6%
3%
2%
10%
7%
2%
3%
0% 20% 40% 60% 80% 100%
Food preparation (e.g.: meat and fishbutchering/filleting)
Logistics
Supply chain/logistics
Back office functions (e.g.: HR, legal, finance)
Production development/operations
Sales/Marketing
Technical/Quality control
Engineering
R&D
Very difficult to fill Difficult to fill Easy to fill Very easy to fill
© 2017 Grant Thornton UK LLP. All rights reserved
FDF Economic contribution and growth opportunities | June 2017
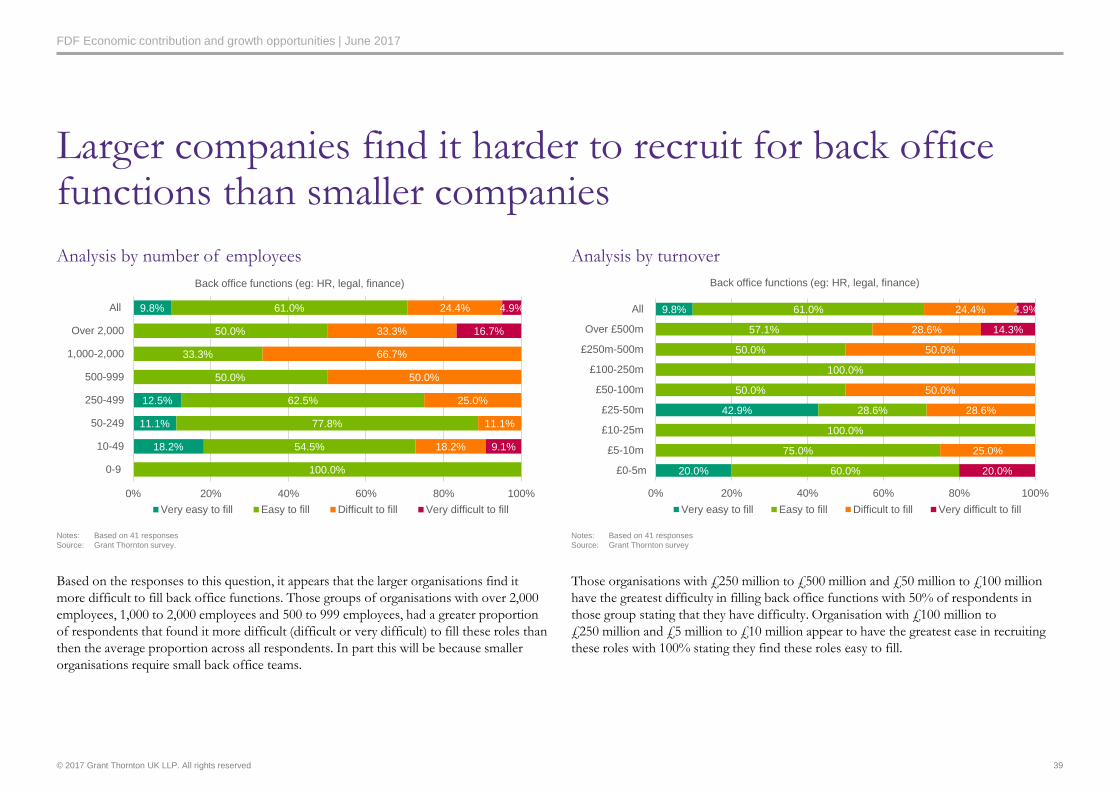
Analysis by number of employees
Based on the responses to this question, it appears that the larger organisations find it
more difficult to fill back office functions. Those groups of organisations with over 2,000
employees, 1,000 to 2,000 employees and 500 to 999 employees, had a greater proportion
of respondents that found it more difficult (difficult or very difficult) to fill these roles than
then the average proportion across all respondents. In part this will be because smaller
organisations require small back office teams.
Larger companies find it harder to recruit for back office functions than smaller companies
Analysis by turnover
Those organisations with £250 million to £500 million and £50 million to £100 million
have the greatest difficulty in filling back office functions with 50% of respondents in
those group stating that they have difficulty. Organisation with £100 million to
£250 million and £5 million to £10 million appear to have the greatest ease in recruiting
these roles with 100% stating they find these roles easy to fill.
39
Notes: Based on 41 responses
Source: Grant Thornton survey.
Notes: Based on 41 responses
Source: Grant Thornton survey
18.2%
11.1%
12.5%
9.8%
100.0%
54.5%
77.8%
62.5%
50.0%
33.3%
50.0%
61.0%
18.2%
11.1%
25.0%
50.0%
66.7%
33.3%
24.4%
9.1%
16.7%
4.9%
0% 20% 40% 60% 80% 100%
0-9
10-49
50-249
250-499
500-999
1,000-2,000
Over 2,000
All
Back office functions (eg: HR, legal, finance)
Very easy to fill Easy to fill Difficult to fill Very difficult to fill
20.0%
42.9%
9.8%
60.0%
75.0%
100.0%
28.6%
50.0%
100.0%
50.0%
57.1%
61.0%
25.0%
28.6%
50.0%
50.0%
28.6%
24.4%
20.0%
14.3%
4.9%
0% 20% 40% 60% 80% 100%
£0-5m
£5-10m
£10-25m
£25-50m
£50-100m
£100-250m
£250m-500m
Over £500m
All
Back office functions (eg: HR, legal, finance)
Very easy to fill Easy to fill Difficult to fill Very difficult to fill
© 2017 Grant Thornton UK LLP. All rights reserved
FDF Economic contribution and growth opportunities | June 2017
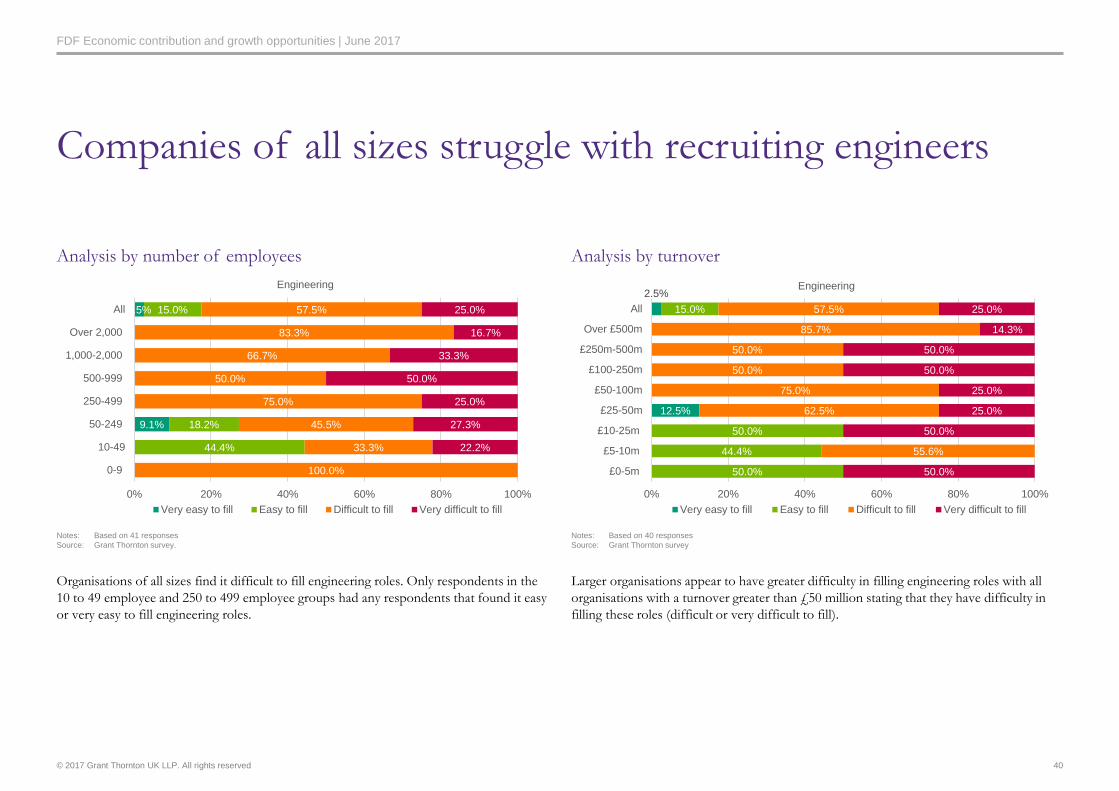
Analysis by number of employees
Organisations of all sizes find it difficult to fill engineering roles. Only respondents in the
10 to 49 employee and 250 to 499 employee groups had any respondents that found it easy
or very easy to fill engineering roles.
Companies of all sizes struggle with recruiting engineers
Analysis by turnover
Larger organisations appear to have greater difficulty in filling engineering roles with all
organisations with a turnover greater than £50 million stating that they have difficulty in
filling these roles (difficult or very difficult to fill).
40
Notes: Based on 41 responses
Source: Grant Thornton survey.
Notes: Based on 40 responses
Source: Grant Thornton survey
9.1%
2.5%
44.4%
18.2%
15.0%
100.0%
33.3%
45.5%
75.0%
50.0%
66.7%
83.3%
57.5%
22.2%
27.3%
25.0%
50.0%
33.3%
16.7%
25.0%
0% 20% 40% 60% 80% 100%
0-9
10-49
50-249
250-499
500-999
1,000-2,000
Over 2,000
All
Engineering
Very easy to fill Easy to fill Difficult to fill Very difficult to fill
12.5%
2.5%
50.0%
44.4%
50.0%
15.0%
55.6%
62.5%
75.0%
50.0%
50.0%
85.7%
57.5%
50.0%
50.0%
25.0%
25.0%
50.0%
50.0%
14.3%
25.0%
0% 20% 40% 60% 80% 100%
£0-5m
£5-10m
£10-25m
£25-50m
£50-100m
£100-250m
£250m-500m
Over £500m
All
Engineering
Very easy to fill Easy to fill Difficult to fill Very difficult to fill
© 2017 Grant Thornton UK LLP. All rights reserved
FDF Economic contribution and growth opportunities | June 2017
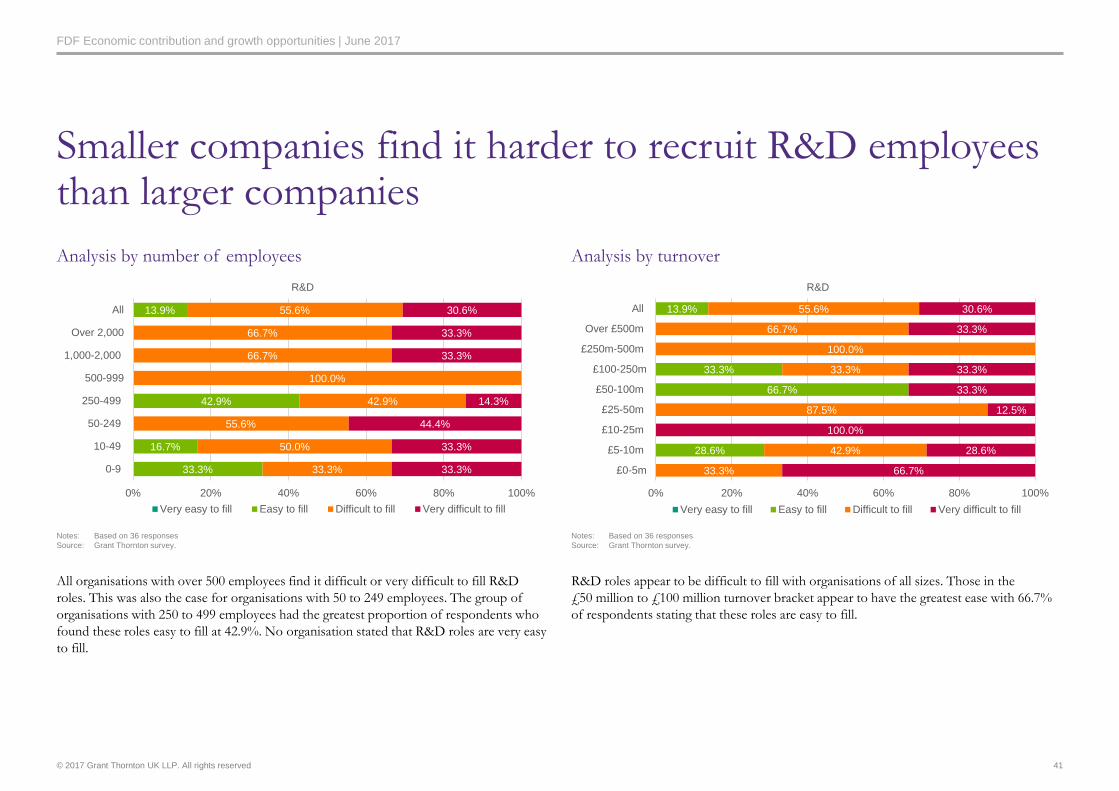
Analysis by number of employees
All organisations with over 500 employees find it difficult or very difficult to fill R&D
roles. This was also the case for organisations with 50 to 249 employees. The group of
organisations with 250 to 499 employees had the greatest proportion of respondents who
found these roles easy to fill at 42.9%. No organisation stated that R&D roles are very easy
to fill.
Smaller companies find it harder to recruit R&D employees than larger companies
Analysis by turnover
R&D roles appear to be difficult to fill with organisations of all sizes. Those in the
£50 million to £100 million turnover bracket appear to have the greatest ease with 66.7%
of respondents stating that these roles are easy to fill.
41
Notes: Based on 36 responses
Source: Grant Thornton survey.
Notes: Based on 36 responses
Source: Grant Thornton survey.
33.3%
16.7%
42.9%
13.9%
33.3%
50.0%
55.6%
42.9%
100.0%
66.7%
66.7%
55.6%
33.3%
33.3%
44.4%
14.3%
33.3%
33.3%
30.6%
0% 20% 40% 60% 80% 100%
0-9
10-49
50-249
250-499
500-999
1,000-2,000
Over 2,000
All
R&D
Very easy to fill Easy to fill Difficult to fill Very difficult to fill
28.6%
66.7%
33.3%
13.9%
33.3%
42.9%
87.5%
33.3%
100.0%
66.7%
55.6%
66.7%
28.6%
100.0%
12.5%
33.3%
33.3%
33.3%
30.6%
0% 20% 40% 60% 80% 100%
£0-5m
£5-10m
£10-25m
£25-50m
£50-100m
£100-250m
£250m-500m
Over £500m
All
R&D
Very easy to fill Easy to fill Difficult to fill Very difficult to fill
© 2017 Grant Thornton UK LLP. All rights reserved
FDF Economic contribution and growth opportunities | June 2017
Analysis by number of employees
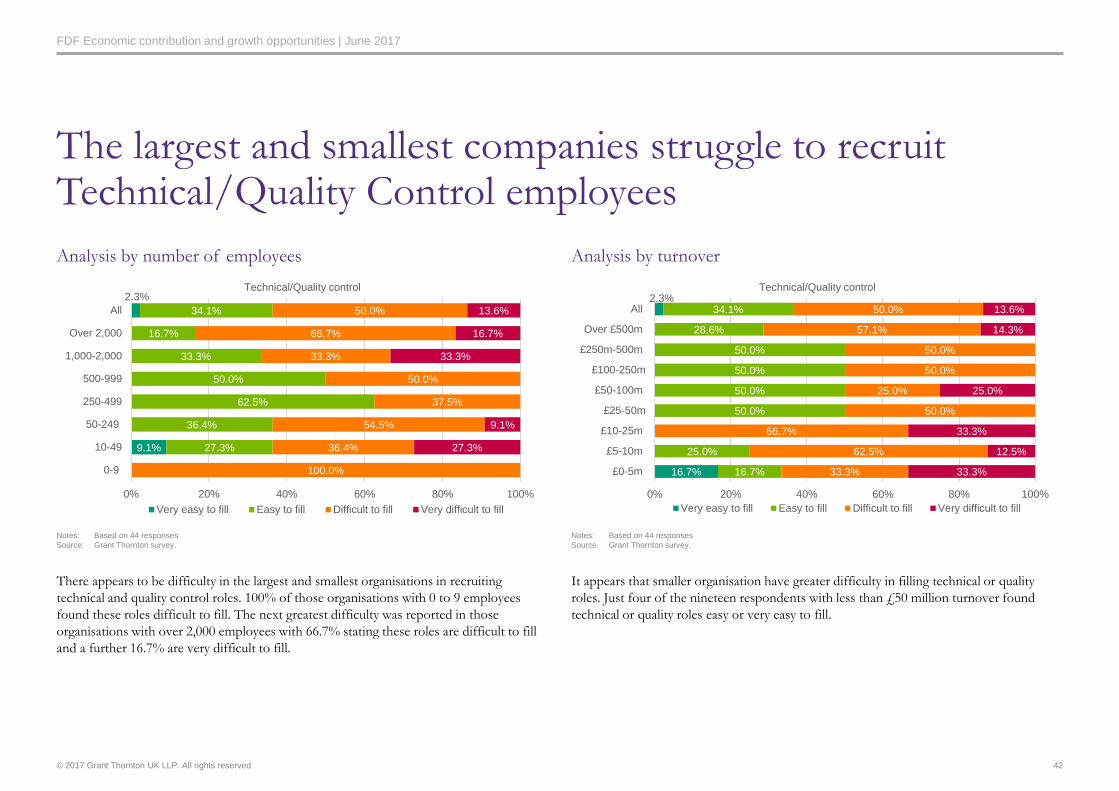
There appears to be difficulty in the largest and smallest organisations in recruiting
technical and quality control roles. 100% of those organisations with 0 to 9 employees
found these roles difficult to fill. The next greatest difficulty was reported in those
organisations with over 2,000 employees with 66.7% stating these roles are difficult to fill
and a further 16.7% are very difficult to fill.
The largest and smallest companies struggle to recruit Technical/Quality Control employees
Analysis by turnover
It appears that smaller organisation have greater difficulty in filling technical or quality
roles. Just four of the nineteen respondents with less than £50 million turnover found
technical or quality roles easy or very easy to fill.
42
Notes: Based on 44 responses
Source: Grant Thornton survey.
Notes: Based on 44 responses
Source Grant Thornton survey.
9.1%
2.3%
27.3%
36.4%
62.5%
50.0%
33.3%
16.7%
34.1%
100.0%
36.4%
54.5%
37.5%
50.0%
33.3%
66.7%
50.0%
27.3%
9.1%
33.3%
16.7%
13.6%
0% 20% 40% 60% 80% 100%
0-9
10-49
50-249
250-499
500-999
1,000-2,000
Over 2,000
All
Technical/Quality control
Very easy to fill Easy to fill Difficult to fill Very difficult to fill
16.7%
2.3%
16.7%
25.0%
50.0%
50.0%
50.0%
50.0%
28.6%
34.1%
33.3%
62.5%
66.7%
50.0%
25.0%
50.0%
50.0%
57.1%
50.0%
33.3%
12.5%
33.3%
25.0%
14.3%
13.6%
0% 20% 40% 60% 80% 100%
£0-5m
£5-10m
£10-25m
£25-50m
£50-100m
£100-250m
£250m-500m
Over £500m
All
Technical/Quality control
Very easy to fill Easy to fill Difficult to fill Very difficult to fill
© 2017 Grant Thornton UK LLP. All rights reserved
FDF Economic contribution and growth opportunities | June 2017
0.0%
2.7%
5.4%
8.1%
10.8%
13.5%
18.9%
18.9%
27.0%
29.7%
32.4%
35.1%
37.8%
40.5%
Cost to employer
Students/seasonal workers come and go
Unattractive conditions of employment
Staff don't want long term commitment
Impact of the benefits trap
Long/unsocial hours
Wages offered are lower than those offered byother organisations
Nature of work is too difficult/mentally andphysically tiring
Other (please specify)
Lack of career progression
Difficult to find experienced/skilled staff
Not enough people interested in doing this typeof work
Geographic location of site
Too much competition from other employers
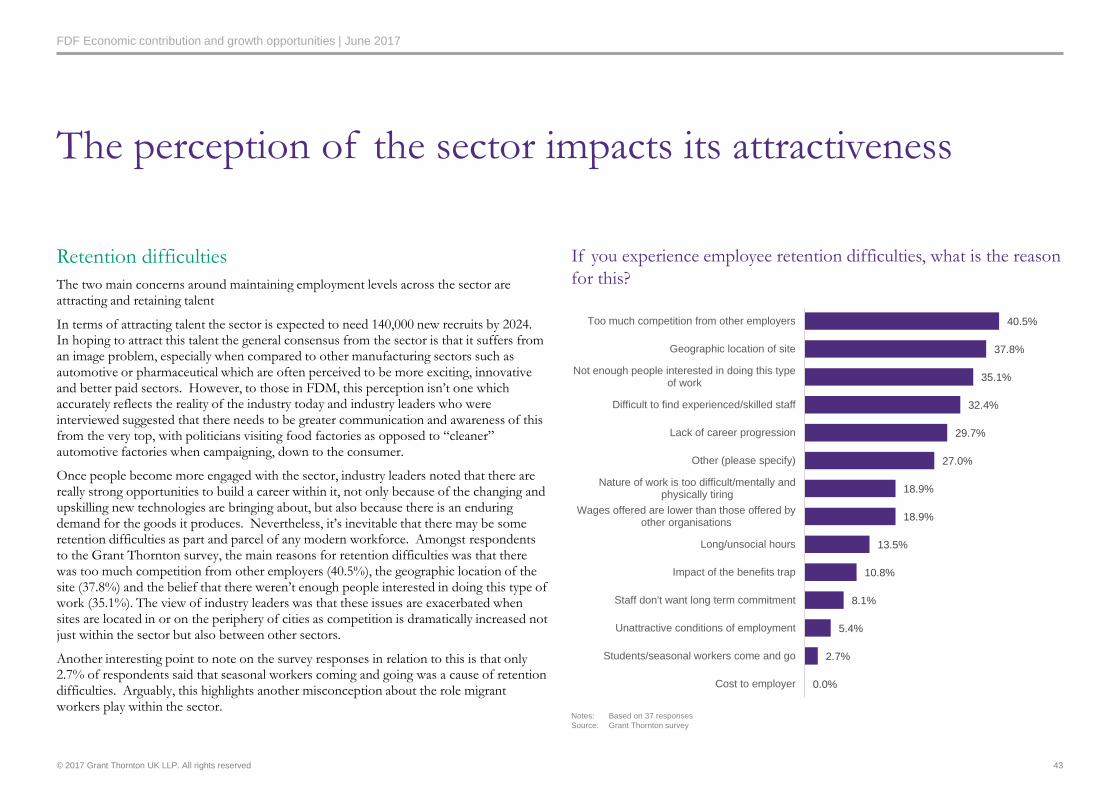
Retention difficulties
The two main concerns around maintaining employment levels across the sector are attracting and retaining talent
In terms of attracting talent the sector is expected to need 140,000 new recruits by 2024. In hoping to attract this talent the general consensus from the sector is that it suffers from an image problem, especially when compared to other manufacturing sectors such as automotive or pharmaceutical which are often perceived to be more exciting, innovative and better paid sectors. However, to those in FDM, this perception isn’t one which accurately reflects the reality of the industry today and industry leaders who were interviewed suggested that there needs to be greater communication and awareness of this from the very top, with politicians visiting food factories as opposed to “cleaner” automotive factories when campaigning, down to the consumer.
Once people become more engaged with the sector, industry leaders noted that there are really strong opportunities to build a career within it, not only because of the changing and upskilling new technologies are bringing about, but also because there is an enduring demand for the goods it produces. Nevertheless, it’s inevitable that there may be some retention difficulties as part and parcel of any modern workforce. Amongst respondents to the Grant Thornton survey, the main reasons for retention difficulties was that there was too much competition from other employers (40.5%), the geographic location of the site (37.8%) and the belief that there weren’t enough people interested in doing this type of work (35.1%). The view of industry leaders was that these issues are exacerbated when sites are located in or on the periphery of cities as competition is dramatically increased not just within the sector but also between other sectors.
Another interesting point to note on the survey responses in relation to this is that only 2.7% of respondents said that seasonal workers coming and going was a cause of retention difficulties. Arguably, this highlights another misconception about the role migrant workers play within the sector.
The perception of the sector impacts its attractiveness
If you experience employee retention difficulties, what is the reason
for this?
43
Notes: Based on 37 responses
Source: Grant Thornton survey
© 2017 Grant Thornton UK LLP. All rights reserved
FDF Economic contribution and growth opportunities | June 2017
Skills of the future
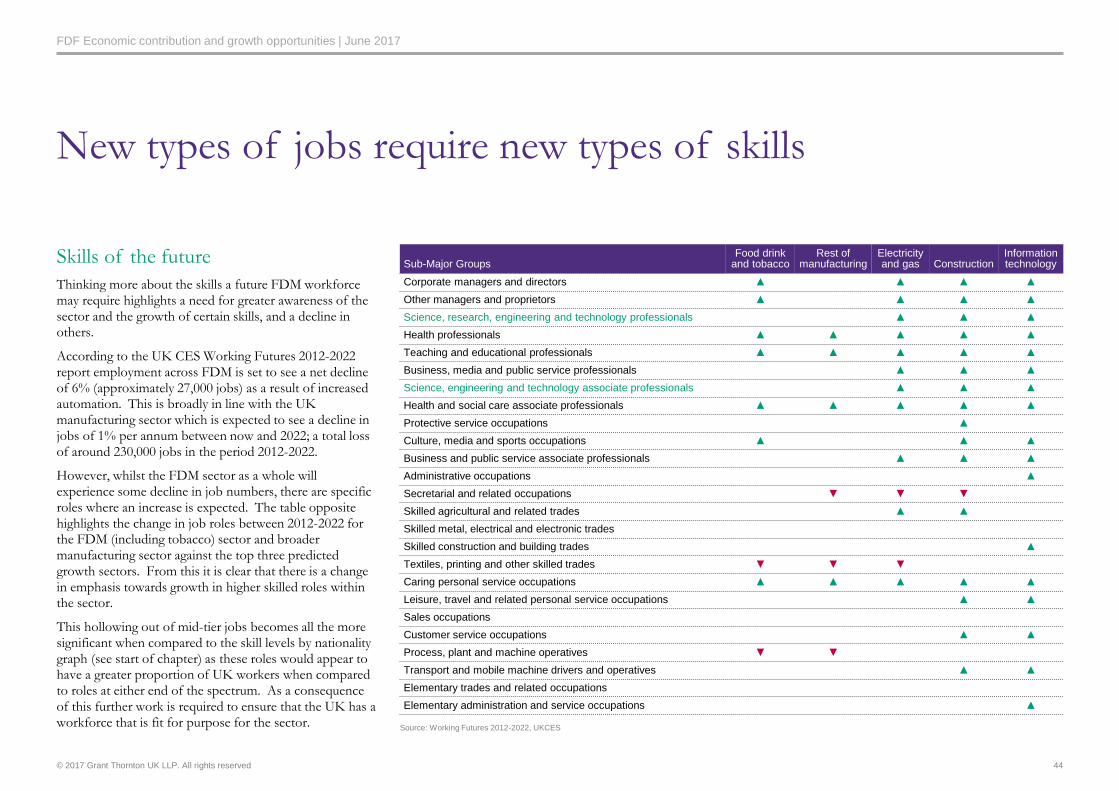
Thinking more about the skills a future FDM workforce may require highlights a need for greater awareness of the sector and the growth of certain skills, and a decline in others.
According to the UK CES Working Futures 2012-2022 report employment across FDM is set to see a net decline of 6% (approximately 27,000 jobs) as a result of increased automation. This is broadly in line with the UK manufacturing sector which is expected to see a decline in jobs of 1% per annum between now and 2022; a total loss of around 230,000 jobs in the period 2012-2022.
However, whilst the FDM sector as a whole will experience some decline in job numbers, there are specific roles where an increase is expected. The table opposite highlights the change in job roles between 2012-2022 for the FDM (including tobacco) sector and broader manufacturing sector against the top three predicted growth sectors. From this it is clear that there is a change in emphasis towards growth in higher skilled roles within the sector.
This hollowing out of mid-tier jobs becomes all the more significant when compared to the skill levels by nationality graph (see start of chapter) as these roles would appear to have a greater proportion of UK workers when compared to roles at either end of the spectrum. As a consequence of this further work is required to ensure that the UK has a workforce that is fit for purpose for the sector.
New types of jobs require new types of skills
44
Source: Working Futures 2012-2022, UKCES
Sub-Major GroupsFood drink
and tobacco Rest of
manufacturingElectricity and gas Construction
Information technology
Corporate managers and directors ▲ ▲ ▲ ▲
Other managers and proprietors ▲ ▲ ▲ ▲
Science, research, engineering and technology professionals ▲ ▲ ▲
Health professionals ▲ ▲ ▲ ▲ ▲
Teaching and educational professionals ▲ ▲ ▲ ▲ ▲
Business, media and public service professionals ▲ ▲ ▲
Science, engineering and technology associate professionals ▲ ▲ ▲
Health and social care associate professionals ▲ ▲ ▲ ▲ ▲
Protective service occupations ▲
Culture, media and sports occupations ▲ ▲ ▲
Business and public service associate professionals ▲ ▲ ▲
Administrative occupations ▲
Secretarial and related occupations ▼ ▼ ▼
Skilled agricultural and related trades ▲ ▲
Skilled metal, electrical and electronic trades
Skilled construction and building trades ▲
Textiles, printing and other skilled trades ▼ ▼ ▼
Caring personal service occupations ▲ ▲ ▲ ▲ ▲
Leisure, travel and related personal service occupations ▲ ▲
Sales occupations
Customer service occupations ▲ ▲
Process, plant and machine operatives ▼ ▼
Transport and mobile machine drivers and operatives ▲ ▲
Elementary trades and related occupations
Elementary administration and service occupations ▲
© 2017 Grant Thornton UK LLP. All rights reserved
FDF Economic contribution and growth opportunities | June 2017
Local education
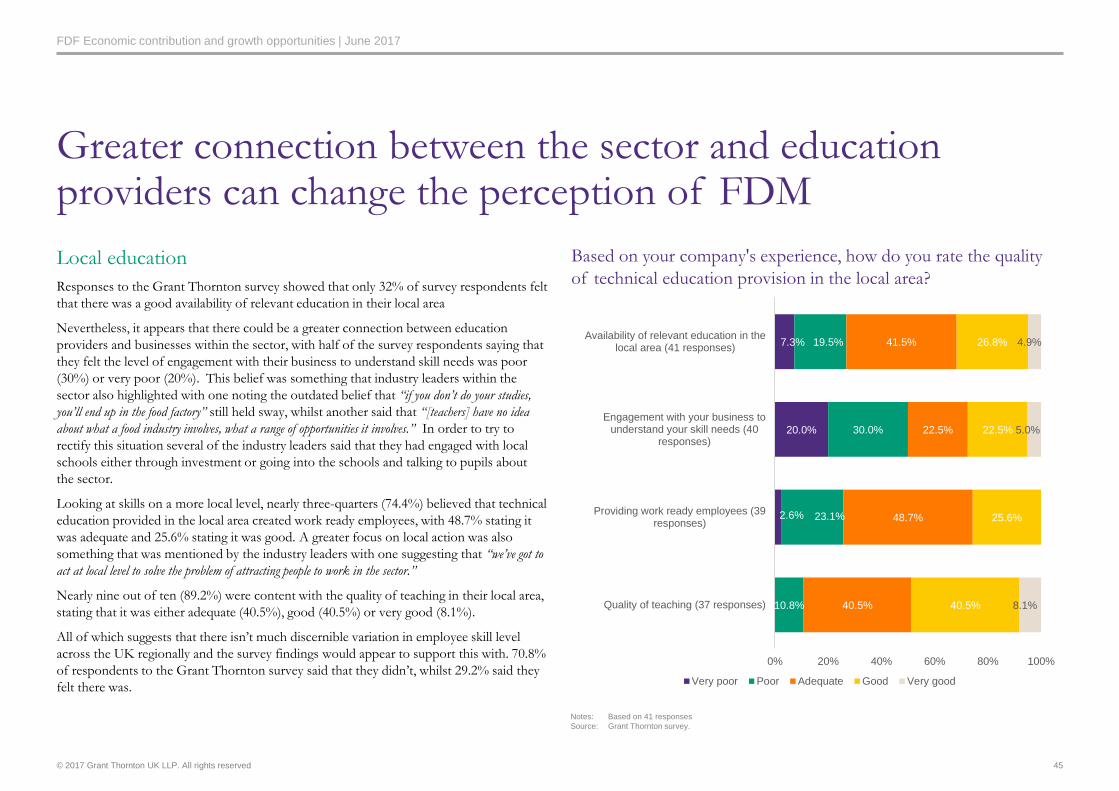
Responses to the Grant Thornton survey showed that only 32% of survey respondents felt
that there was a good availability of relevant education in their local area
Nevertheless, it appears that there could be a greater connection between education
providers and businesses within the sector, with half of the survey respondents saying that
they felt the level of engagement with their business to understand skill needs was poor
(30%) or very poor (20%). This belief was something that industry leaders within the
sector also highlighted with one noting the outdated belief that “if you don’t do your studies,
you’ll end up in the food factory” still held sway, whilst another said that “[teachers] have no idea
about what a food industry involves, what a range of opportunities it involves.” In order to try to
rectify this situation several of the industry leaders said that they had engaged with local
schools either through investment or going into the schools and talking to pupils about
the sector.
Looking at skills on a more local level, nearly three-quarters (74.4%) believed that technical
education provided in the local area created work ready employees, with 48.7% stating it
was adequate and 25.6% stating it was good. A greater focus on local action was also
something that was mentioned by the industry leaders with one suggesting that “we’ve got to
act at local level to solve the problem of attracting people to work in the sector.”
Nearly nine out of ten (89.2%) were content with the quality of teaching in their local area,
stating that it was either adequate (40.5%), good (40.5%) or very good (8.1%).
All of which suggests that there isn’t much discernible variation in employee skill level
across the UK regionally and the survey findings would appear to support this with. 70.8%
of respondents to the Grant Thornton survey said that they didn’t, whilst 29.2% said they
felt there was.
Greater connection between the sector and education providers can change the perception of FDM
Based on your company's experience, how do you rate the quality
of technical education provision in the local area?
45
Notes: Based on 41 responses
Source: Grant Thornton survey.
2.6%
20.0%
7.3%
10.8%
23.1%
30.0%
19.5%
40.5%
48.7%
22.5%
41.5%
40.5%
25.6%
22.5%
26.8%
8.1%
5.0%
4.9%
0% 20% 40% 60% 80% 100%
Quality of teaching (37 responses)
Providing work ready employees (39responses)
Engagement with your business tounderstand your skill needs (40
responses)
Availability of relevant education in thelocal area (41 responses)
Very poor Poor Adequate Good Very good
© 2017 Grant Thornton UK LLP. All rights reserved
FDF Economic contribution and growth opportunities | June 2017
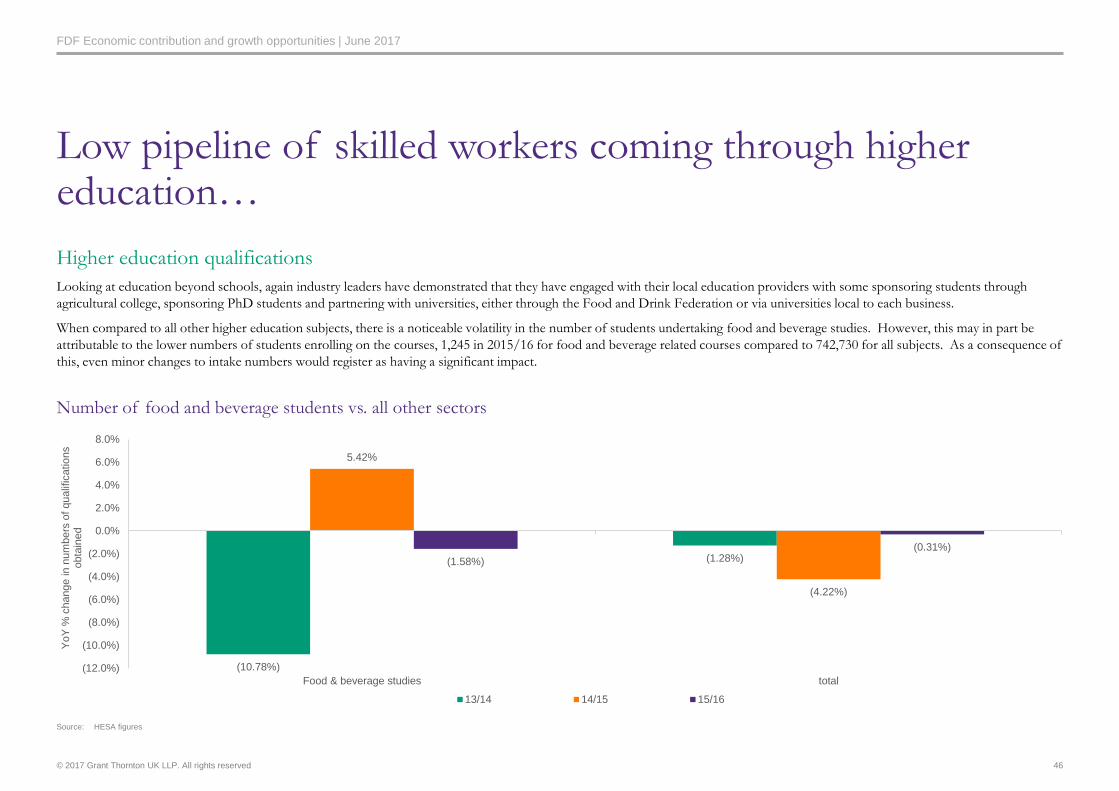
Low pipeline of skilled workers coming through higher education…
Higher education qualifications
Looking at education beyond schools, again industry leaders have demonstrated that they have engaged with their local education providers with some sponsoring students through
agricultural college, sponsoring PhD students and partnering with universities, either through the Food and Drink Federation or via universities local to each business.
When compared to all other higher education subjects, there is a noticeable volatility in the number of students undertaking food and beverage studies. However, this may in part be
attributable to the lower numbers of students enrolling on the courses, 1,245 in 2015/16 for food and beverage related courses compared to 742,730 for all subjects. As a consequence of
this, even minor changes to intake numbers would register as having a significant impact.
46
Number of food and beverage students vs. all other sectors
(10.78%)
(1.28%)
5.42%
(4.22%)
(1.58%)
(0.31%)
(12.0%)
(10.0%)
(8.0%)
(6.0%)
(4.0%)
(2.0%)
0.0%
2.0%
4.0%
6.0%
8.0%
Food & beverage studies total
YoY
% c
hange in
num
bers
of qualif
icatio
ns
obta
ined
13/14 14/15 15/16
Source: HESA figures
© 2017 Grant Thornton UK LLP. All rights reserved
FDF Economic contribution and growth opportunities | June 2017
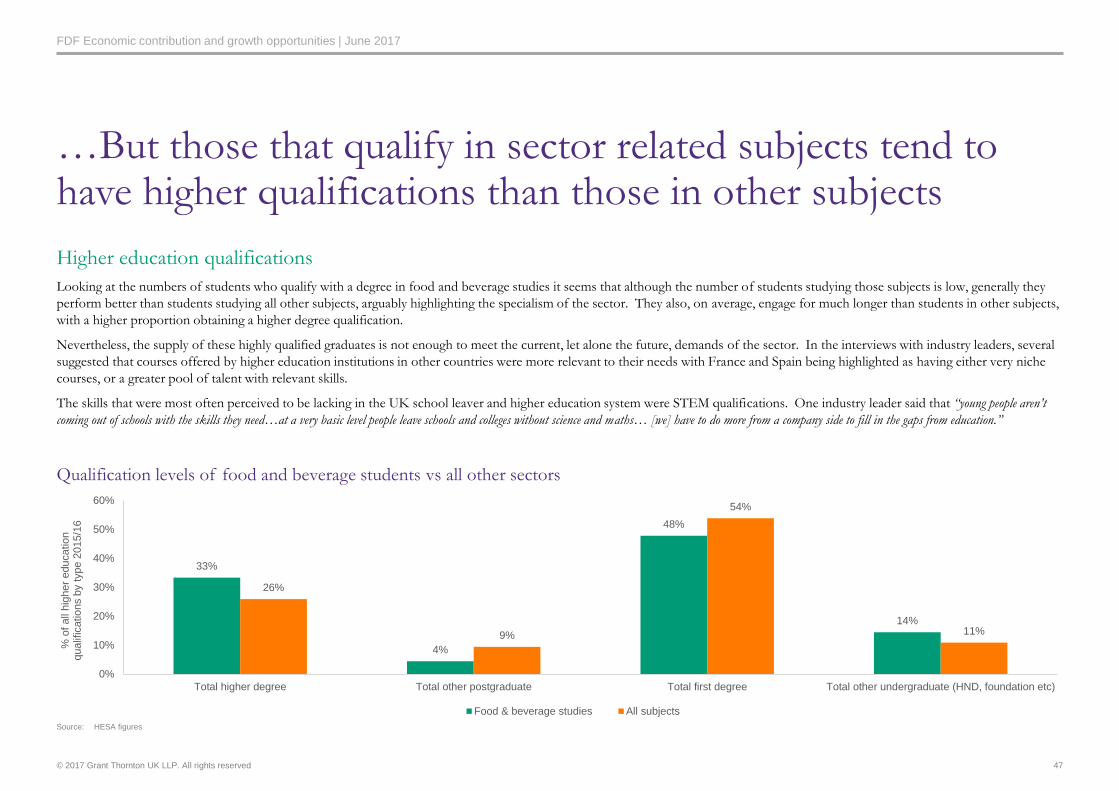
…But those that qualify in sector related subjects tend to have higher qualifications than those in other subjects
Higher education qualifications
Looking at the numbers of students who qualify with a degree in food and beverage studies it seems that although the number of students studying those subjects is low, generally they
perform better than students studying all other subjects, arguably highlighting the specialism of the sector. They also, on average, engage for much longer than students in other subjects,
with a higher proportion obtaining a higher degree qualification.
Nevertheless, the supply of these highly qualified graduates is not enough to meet the current, let alone the future, demands of the sector. In the interviews with industry leaders, several
suggested that courses offered by higher education institutions in other countries were more relevant to their needs with France and Spain being highlighted as having either very niche
courses, or a greater pool of talent with relevant skills.
The skills that were most often perceived to be lacking in the UK school leaver and higher education system were STEM qualifications. One industry leader said that “young people aren’t
coming out of schools with the skills they need…at a very basic level people leave schools and colleges without science and maths… [we] have to do more from a company side to fill in the gaps from education.”
47
Qualification levels of food and beverage students vs all other sectors
33%
4%
48%
14%
26%
9%
54%
11%
0%
10%
20%
30%
40%
50%
60%
Total higher degree Total other postgraduate Total first degree Total other undergraduate (HND, foundation etc)
% o
f all
hig
her
educatio
n
qualif
icatio
ns b
y t
ype 2
015/1
6
Food & beverage studies All subjects
Source: HESA figures
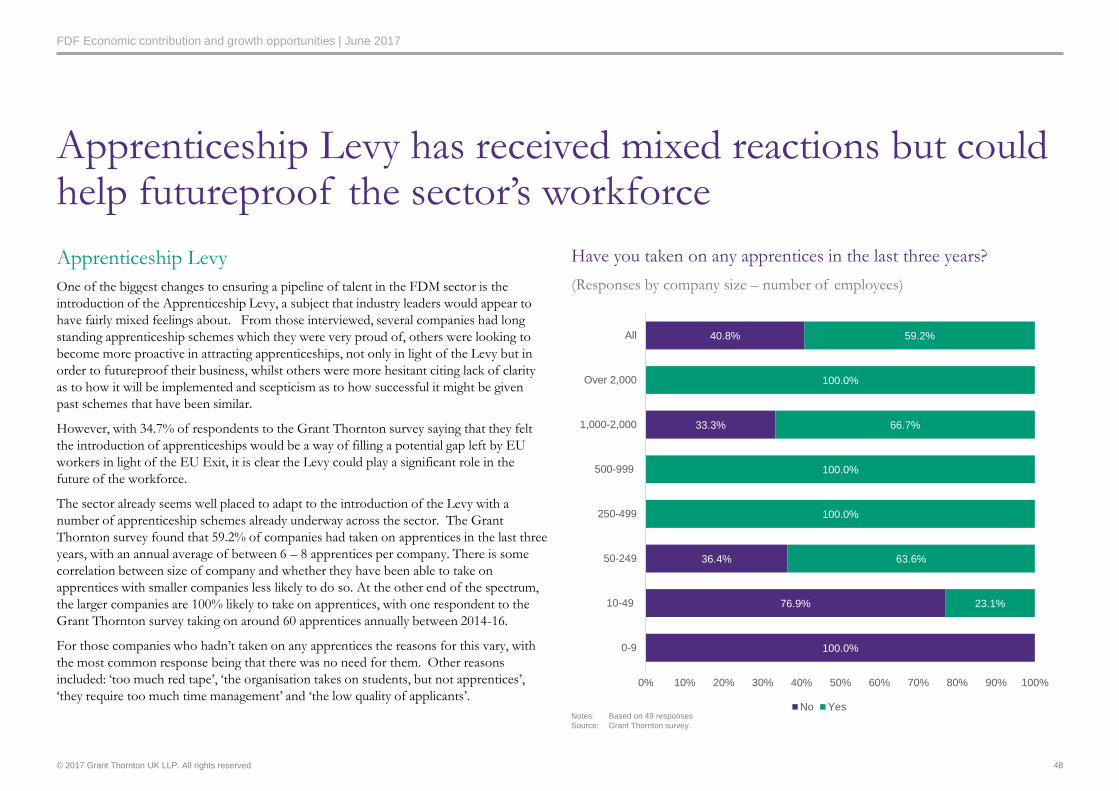
© 2017 Grant Thornton UK LLP. All rights reserved
FDF Economic contribution and growth opportunities | June 2017
Apprenticeship Levy
One of the biggest changes to ensuring a pipeline of talent in the FDM sector is the
introduction of the Apprenticeship Levy, a subject that industry leaders would appear to
have fairly mixed feelings about. From those interviewed, several companies had long
standing apprenticeship schemes which they were very proud of, others were looking to
become more proactive in attracting apprenticeships, not only in light of the Levy but in
order to futureproof their business, whilst others were more hesitant citing lack of clarity
as to how it will be implemented and scepticism as to how successful it might be given
past schemes that have been similar.
However, with 34.7% of respondents to the Grant Thornton survey saying that they felt
the introduction of apprenticeships would be a way of filling a potential gap left by EU
workers in light of the EU Exit, it is clear the Levy could play a significant role in the
future of the workforce.
The sector already seems well placed to adapt to the introduction of the Levy with a
number of apprenticeship schemes already underway across the sector. The Grant
Thornton survey found that 59.2% of companies had taken on apprentices in the last three
years, with an annual average of between 6 – 8 apprentices per company. There is some
correlation between size of company and whether they have been able to take on
apprentices with smaller companies less likely to do so. At the other end of the spectrum,
the larger companies are 100% likely to take on apprentices, with one respondent to the
Grant Thornton survey taking on around 60 apprentices annually between 2014-16.
For those companies who hadn’t taken on any apprentices the reasons for this vary, with
the most common response being that there was no need for them. Other reasons
included: ‘too much red tape’, ‘the organisation takes on students, but not apprentices’,
‘they require too much time management’ and ‘the low quality of applicants’.
Apprenticeship Levy has received mixed reactions but could help futureproof the sector’s workforce
Have you taken on any apprentices in the last three years?
(Responses by company size – number of employees)
48
Notes: Based on 49 responses
Source: Grant Thornton survey.
100.0%
76.9%
36.4%
33.3%
40.8%
23.1%
63.6%
100.0%
100.0%
66.7%
100.0%
59.2%
0% 10% 20% 30% 40% 50% 60% 70% 80% 90% 100%
0-9
10-49
50-249
250-499
500-999
1,000-2,000
Over 2,000
All
No Yes
© 2017 Grant Thornton UK LLP. All rights reserved
FDF Economic contribution and growth opportunities | June 2017
Apprentices already in the sector have more experience than those in other sectors
Apprenticeship Levy
Despite these perceptions, the sector would appear to have a stronger supply of experienced apprentices than other sectors. Statistics from the Department of Education show that in
the academic year 2015/16 the Food Manufacturing sector had a total of 3,500 apprentices, of which 67% (2,330) were aged 25+, compared to 44% of apprentices in all sectors.
As noted in this chapter, there are a wealth of roles available within FDM however, the statistics from the Department of Education suggests that apprenticeships in the sector tend to be
classed under Food Manufacturing, rather than more specific roles, such as Food and Drink Advanced Process Operator. Anecdotal evidence from the sector suggests that more
specialist food engineering qualifications are often classed in broader engineering figures.
Much like the education levels this shows that greater engagement in the sector at a later stage and perhaps highlights either a change of career or people joining the firm at a lower level
and then progressing. One industry leader noted that in his company they had run an apprentice scheme for a number of years and that some of the apprentices were now going to
university to further their studies.
49
© 2017 Grant Thornton UK LLP. All rights reserved
FDF Economic contribution and growth opportunities | June 2017
Impact of consumer behaviour and skills
One of the concerns to arise from the industry leader interviews was the lack of awareness
of UK consumers as to where their food came from and the impact that had on the sector.
One industry leader said: “there is a disconnect in people’s minds when they go to shop and buy food.
They don’t want to work in the industry, they just expect the food to be good quality but not pay much for
it.” This disconnect is potentially very harmful to the sector as, not only does it perpetuate
the misconceptions about work within the sector being of low value it also highlights a
broader educational need in society.
Recent political events in the UK have highlighted how polarised the country can be both
politically and economically. The recession in 2008 resulted in vast numbers of middle
class shoppers buying their groceries in the discount stores, Aldi and Lidl, as household
budgets got even tighter. For those lower down the socio-economic scale the impact on
household budgets has arguably been more keenly felt, whether as a result of wage
stagnation or the impact of benefit cuts. Though there is a change in the behaviour of
consumers with greater disposable income to shop for local produce and seek out
organically produced food, there will remain a significant proportion of the population for
which those options are, economically, out of reach. The consequence of this is that,
when it comes to the purchasing and consumption of food there is an emergence of a
nation of “haves” and “have nots.”
For the FDM sector the impact of this is threefold. Firstly, if, as shown in this chapter, the
existing UK workforce is at risk of even greater polarity then this will have a very real
impact on wages and household disposable income. Though the introduction of the
National Living Wage will go some way to ensuring workers receive a fair wage, and many
of those companies interviewed were already paying their employees above the National
Living Wage, the present state of food inflation will put real pressure on consumers and
their spending priorities.
The second is around education and making consumers aware that they can eat well for
less money. One industry leader suggested that: “[For the industry] there’s a huge piece on
education… Educating kids at school on diet and that a balanced diet is affordable…If people feel they’re
paid well, they make better choices in the supermarket. [Consumers] have an unhealthy relationship with
food.”
The third point is that consumer shopping behaviours have changed. Where ten years ago
a family may have done a large, weekly shop at one of the big four supermarkets, today
that shop may be replaced by a big online shop to get the basics, followed by top-up shops
throughout the week, either at a supermarket, discounter, local corner shop or a
combination of all three. For FDM companies, ensuring that you stay front of mind for
the consumer, across all of those touchpoints, in order to remain a relevant part of the
education process, is difficult as it may require different sizes or configurations of
products.
Household finances have far reaching consequences for consumer food purchases
50

© 2017 Grant Thornton UK LLP. All rights reserved
FDF Economic contribution and growth opportunities | June 2017
The food and drink industry needs talent. A looming skills gap left by an aging workforce means the sector needs to attract 140,000 new recruits by 2024. The ageing workforce and skills
gap facing the sector is not new, but the need to address this has never been more urgent. Perceptions of the industry mean the sector struggles to attract people and potential employees
fail to recognise the industry as high-tech and with a wide range of fulfilling careers on offer, instead choosing careers in other manufacturing industries. Simultaneously, there is
uncertainty regarding future access to EU workers, who are highly-valued and make up 30% of the industry’s skilled and high-skilled workforce.
The idea that jobs in food and drink manufacturing are low-skilled and poorly paid is untrue. As this section shows, there are a variety of different roles on offer in the industry at all skill
levels, with low skilled work making up only a small fraction of roles. In reality to ensure the industry remains competitive, the sector is moving towards greater automated production,
investing both in new technologies and its people to ensure they have the new skills required to support future growth.
With just 34.7% of respondents to the survey saying they felt apprenticeships would fill the gap left behind by EU workers, the sector need further support from Government to increase
the apprentice workforce in food and drink. Similarly, a new EU immigration policy is needed which prioritises food and drink as the UK’s largest manufacturing industry and allows new
workers from the EU to enter the sector.
The food and drink industry has developed a number of industry specific apprenticeships up to degree level in order to fill the skills gap. Due to the geographical spread of the industry, a
number of educational providers across the country are required and investment is needed to ensure these providers have the equipment and capacity to provide these specific skills.
Government must support industry in order to bridge this gap.
Conclusions and recommendations
51

© 2017 Grant Thornton UK LLP. All rights reserved | Draft
Innovation
52

© 2017 Grant Thornton UK LLP. All rights reserved
FDF Economic contribution and growth opportunities | June 2017
Innovation whether it be in products or processes is a significant growth opportunity for the FDM sector and one that
will also have an equally positive impact on improving productivity.
Through this study it is apparent that businesses in the sector are embracing innovation in a range of different ways and
doing so in partnership with different organisations. This evidence not only shows the positive contribution the sector is
making to the economy but it highlights some important lessons around how to better support and encourage innovation.
Chapter introduction
53
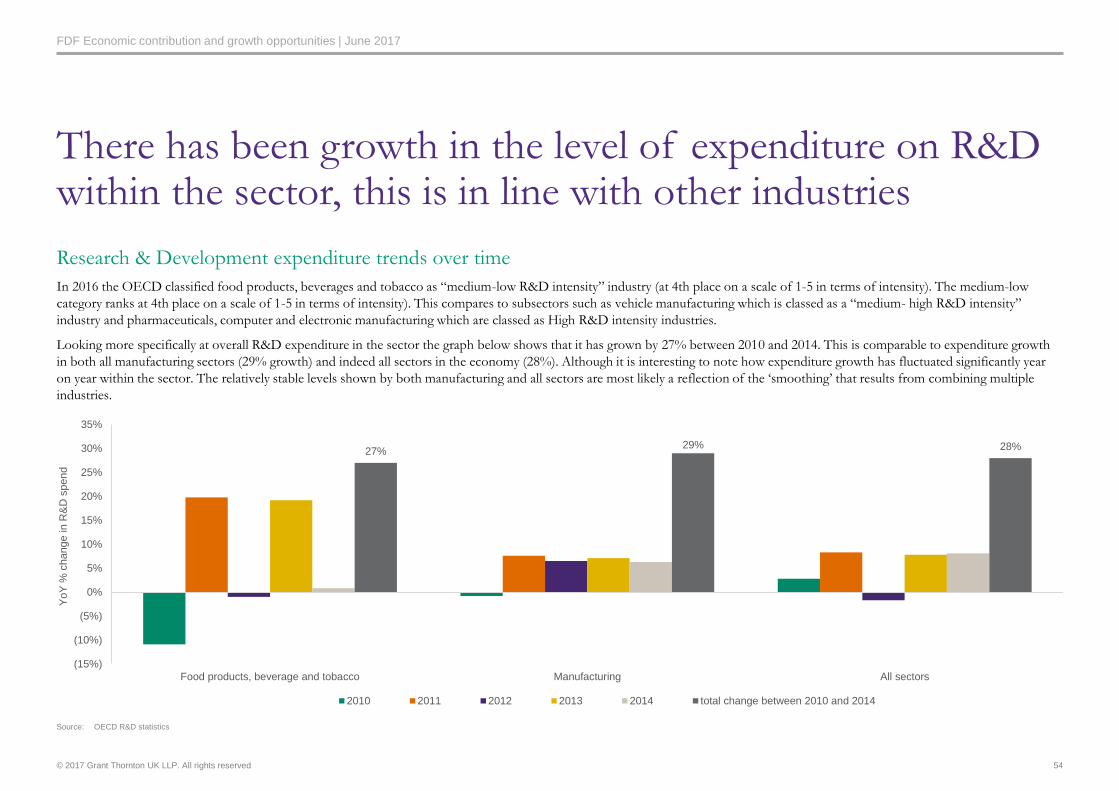
© 2017 Grant Thornton UK LLP. All rights reserved
FDF Economic contribution and growth opportunities | June 2017
Research & Development expenditure trends over time
In 2016 the OECD classified food products, beverages and tobacco as “medium-low R&D intensity” industry (at 4th place on a scale of 1-5 in terms of intensity). The medium-low
category ranks at 4th place on a scale of 1-5 in terms of intensity). This compares to subsectors such as vehicle manufacturing which is classed as a “medium- high R&D intensity”
industry and pharmaceuticals, computer and electronic manufacturing which are classed as High R&D intensity industries.
Looking more specifically at overall R&D expenditure in the sector the graph below shows that it has grown by 27% between 2010 and 2014. This is comparable to expenditure growth
in both all manufacturing sectors (29% growth) and indeed all sectors in the economy (28%). Although it is interesting to note how expenditure growth has fluctuated significantly year
on year within the sector. The relatively stable levels shown by both manufacturing and all sectors are most likely a reflection of the ‘smoothing’ that results from combining multiple
industries.
27%29% 28%
(15%)
(10%)
(5%)
0%
5%
10%
15%
20%
25%
30%
35%
Food products, beverage and tobacco Manufacturing All sectors
YoY
% c
hange in
R&
D s
pend
2010 2011 2012 2013 2014 total change between 2010 and 2014
There has been growth in the level of expenditure on R&D within the sector, this is in line with other industries
54
Source: OECD R&D statistics
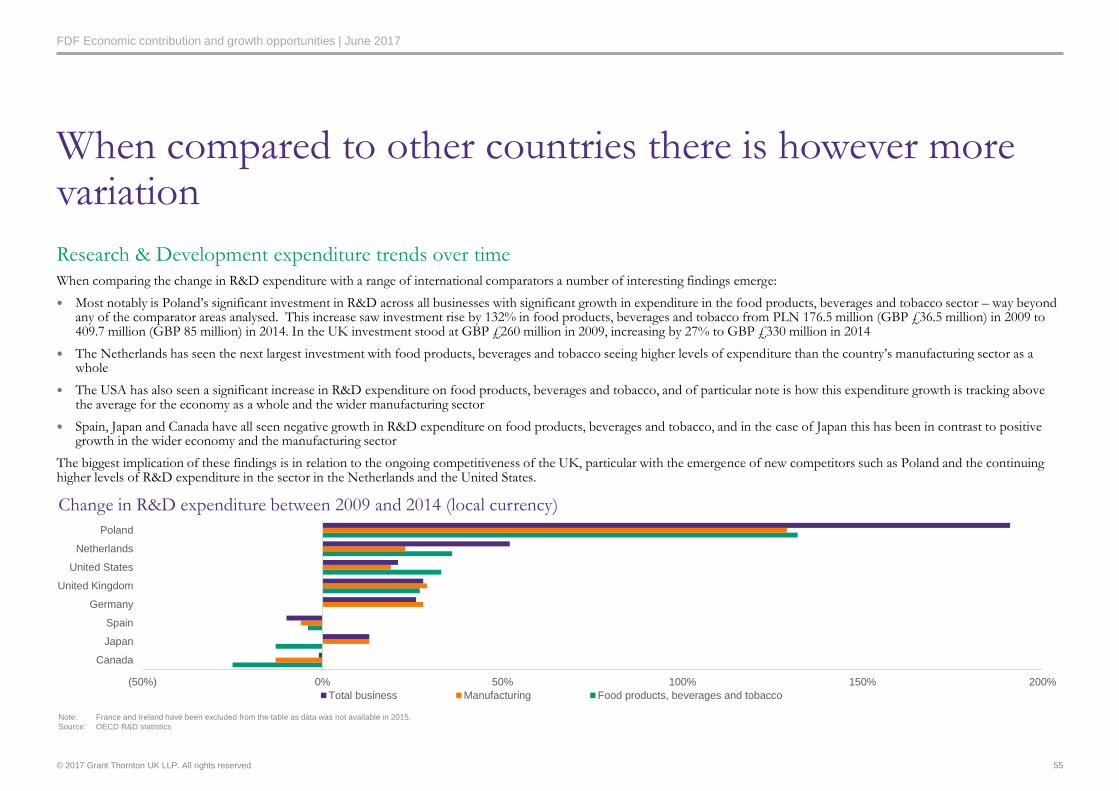
© 2017 Grant Thornton UK LLP. All rights reserved
FDF Economic contribution and growth opportunities | June 2017
When compared to other countries there is however more variation
Research & Development expenditure trends over time When comparing the change in R&D expenditure with a range of international comparators a number of interesting findings emerge:
Most notably is Poland’s significant investment in R&D across all businesses with significant growth in expenditure in the food products, beverages and tobacco sector – way beyond any of the comparator areas analysed. This increase saw investment rise by 132% in food products, beverages and tobacco from PLN 176.5 million (GBP £36.5 million) in 2009 to 409.7 million (GBP 85 million) in 2014. In the UK investment stood at GBP £260 million in 2009, increasing by 27% to GBP £330 million in 2014
The Netherlands has seen the next largest investment with food products, beverages and tobacco seeing higher levels of expenditure than the country’s manufacturing sector as a whole
The USA has also seen a significant increase in R&D expenditure on food products, beverages and tobacco, and of particular note is how this expenditure growth is tracking above the average for the economy as a whole and the wider manufacturing sector
Spain, Japan and Canada have all seen negative growth in R&D expenditure on food products, beverages and tobacco, and in the case of Japan this has been in contrast to positive growth in the wider economy and the manufacturing sector
The biggest implication of these findings is in relation to the ongoing competitiveness of the UK, particular with the emergence of new competitors such as Poland and the continuing higher levels of R&D expenditure in the sector in the Netherlands and the United States.
55
Change in R&D expenditure between 2009 and 2014 (local currency)
Note: France and Ireland have been excluded from the table as data was not available in 2015.
Source: OECD R&D statistics
(50%) 0% 50% 100% 150% 200%
Canada
Japan
Spain
Germany
United Kingdom
United States
Netherlands
Poland
Total business Manufacturing Food products, beverages and tobacco
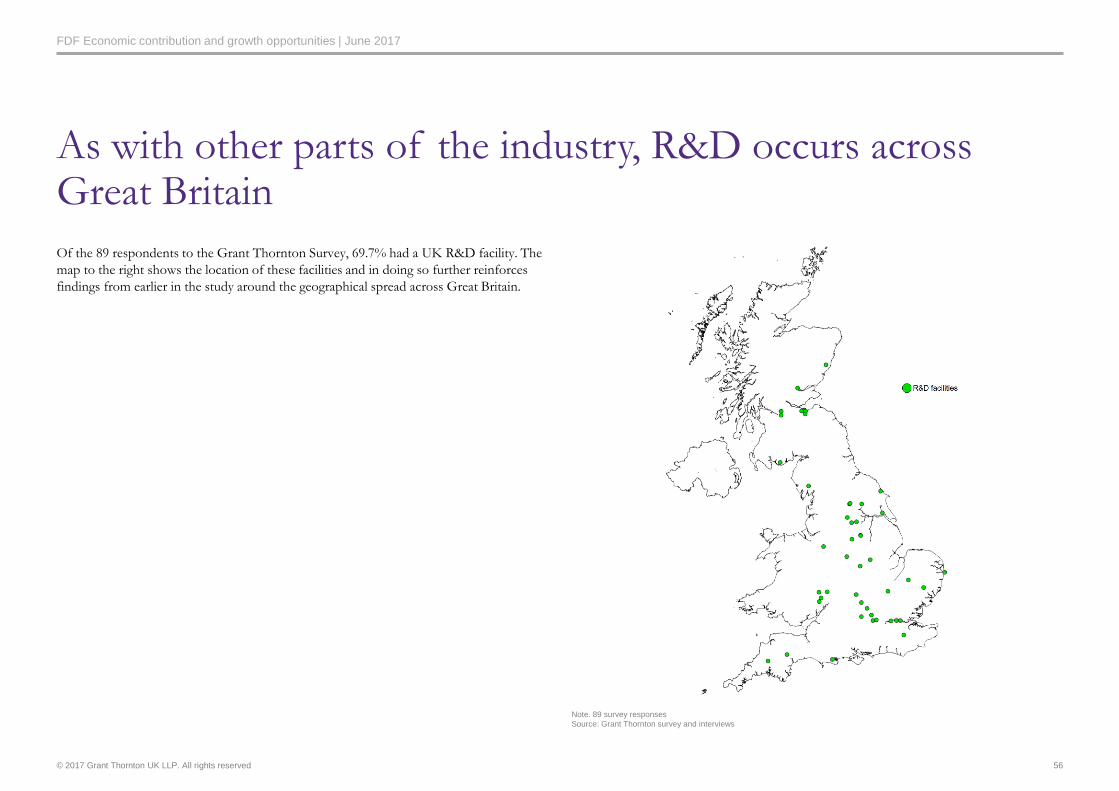
© 2017 Grant Thornton UK LLP. All rights reserved
FDF Economic contribution and growth opportunities | June 2017
Of the 89 respondents to the Grant Thornton Survey, 69.7% had a UK R&D facility. The
map to the right shows the location of these facilities and in doing so further reinforces
findings from earlier in the study around the geographical spread across Great Britain.
As with other parts of the industry, R&D occurs across Great Britain
56
Note. 89 survey responses
Source: Grant Thornton survey and interviews
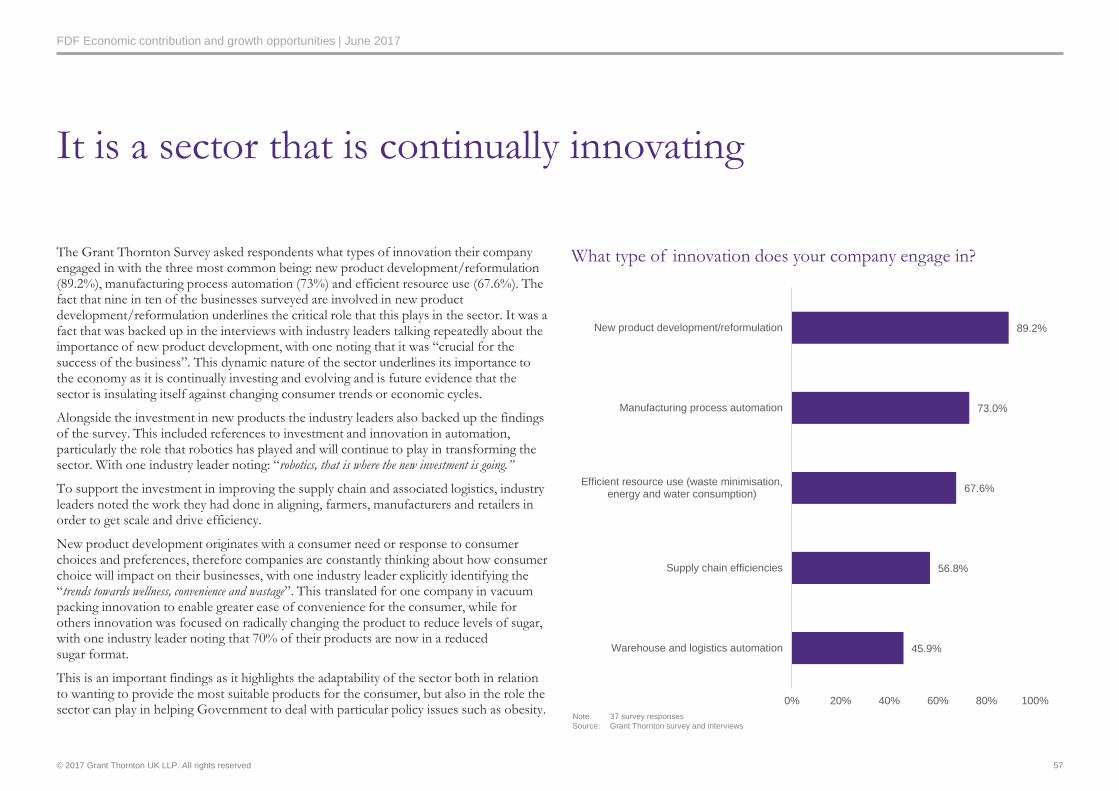
© 2017 Grant Thornton UK LLP. All rights reserved
FDF Economic contribution and growth opportunities | June 2017
The Grant Thornton Survey asked respondents what types of innovation their company engaged in with the three most common being: new product development/reformulation (89.2%), manufacturing process automation (73%) and efficient resource use (67.6%). The fact that nine in ten of the businesses surveyed are involved in new product development/reformulation underlines the critical role that this plays in the sector. It was a fact that was backed up in the interviews with industry leaders talking repeatedly about the importance of new product development, with one noting that it was “crucial for the success of the business”. This dynamic nature of the sector underlines its importance to the economy as it is continually investing and evolving and is future evidence that the sector is insulating itself against changing consumer trends or economic cycles.
Alongside the investment in new products the industry leaders also backed up the findings of the survey. This included references to investment and innovation in automation, particularly the role that robotics has played and will continue to play in transforming the sector. With one industry leader noting: “robotics, that is where the new investment is going.”
To support the investment in improving the supply chain and associated logistics, industry leaders noted the work they had done in aligning, farmers, manufacturers and retailers in order to get scale and drive efficiency.
New product development originates with a consumer need or response to consumer choices and preferences, therefore companies are constantly thinking about how consumer choice will impact on their businesses, with one industry leader explicitly identifying the “trends towards wellness, convenience and wastage”. This translated for one company in vacuum packing innovation to enable greater ease of convenience for the consumer, while for others innovation was focused on radically changing the product to reduce levels of sugar, with one industry leader noting that 70% of their products are now in a reduced sugar format.
This is an important findings as it highlights the adaptability of the sector both in relation to wanting to provide the most suitable products for the consumer, but also in the role the sector can play in helping Government to deal with particular policy issues such as obesity.
It is a sector that is continually innovating
What type of innovation does your company engage in?
Note. 37 survey responses
Source: Grant Thornton survey and interviews
45.9%
56.8%
67.6%
73.0%
89.2%
0% 20% 40% 60% 80% 100%
Warehouse and logistics automation
Supply chain efficiencies
Efficient resource use (waste minimisation,energy and water consumption)
Manufacturing process automation
New product development/reformulation
57
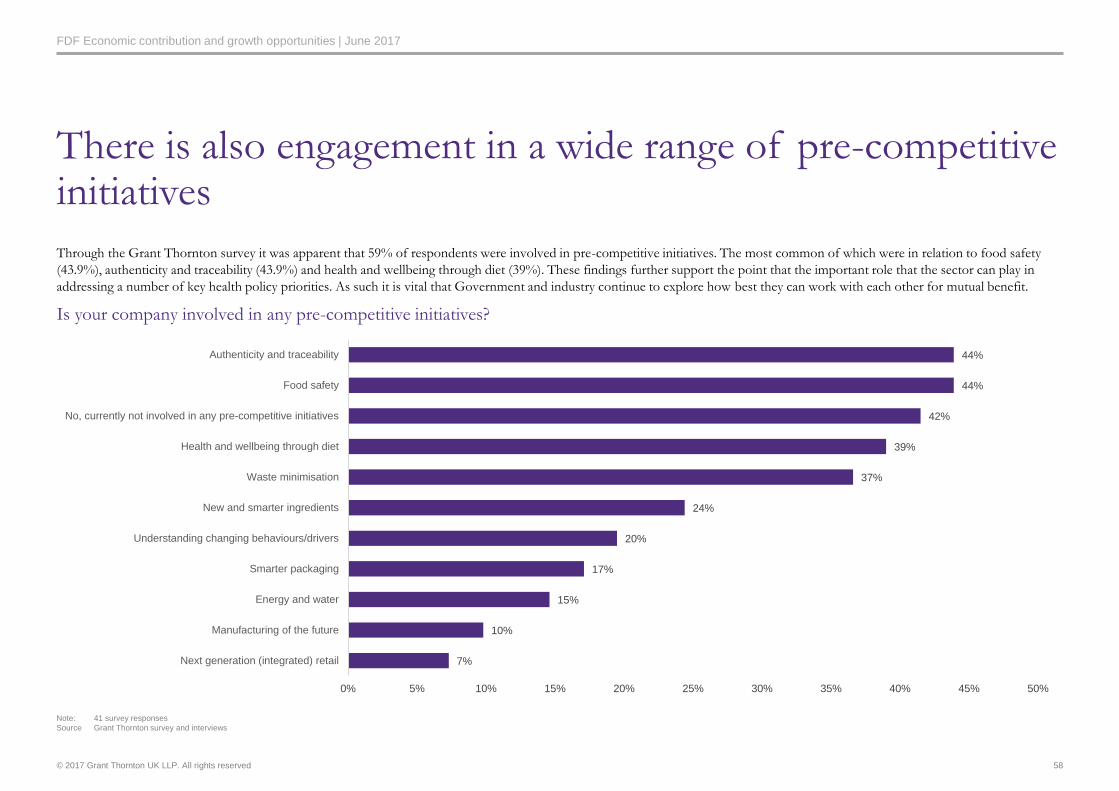
© 2017 Grant Thornton UK LLP. All rights reserved
FDF Economic contribution and growth opportunities | June 2017
There is also engagement in a wide range of pre-competitive initiatives
Through the Grant Thornton survey it was apparent that 59% of respondents were involved in pre-competitive initiatives. The most common of which were in relation to food safety
(43.9%), authenticity and traceability (43.9%) and health and wellbeing through diet (39%). These findings further support the point that the important role that the sector can play in
addressing a number of key health policy priorities. As such it is vital that Government and industry continue to explore how best they can work with each other for mutual benefit.
Is your company involved in any pre-competitive initiatives?
Note: 41 survey responses
Source Grant Thornton survey and interviews
7%
10%
15%
17%
20%
24%
37%
39%
42%
44%
44%
0% 5% 10% 15% 20% 25% 30% 35% 40% 45% 50%
Next generation (integrated) retail
Manufacturing of the future
Energy and water
Smarter packaging
Understanding changing behaviours/drivers
New and smarter ingredients
Waste minimisation
Health and wellbeing through diet
No, currently not involved in any pre-competitive initiatives
Food safety
Authenticity and traceability
58
© 2017 Grant Thornton UK LLP. All rights reserved
FDF Economic contribution and growth opportunities | June 2017
The Grant Thornton Survey found that just over half (54%) of respondents had accessed R&D tax credits in order to support innovation. The view from industry leaders was that while
these tax credits were a positive, they were not the whole answer in terms of how industry can be best supported to innovate. The perception was that Government needs to better
understand the range of factors that effect business investment decisions so that suitable support can be designed and implemented. This was felt to be particularly important because the
perception amongst some industry leaders was that other EU nations are better at supporting innovation in the sector – although limited examples were given – with clear national
strategies to guide activity.
There is however a need to look beyond tax-credits if Government is to best support innovation in the industry
59
Note: 41 survey responses
Source: Grant Thornton survey and interviews
© 2017 Grant Thornton UK LLP. All rights reserved
FDF Economic contribution and growth opportunities | June 2017
In seeking to innovate, the survey also found that nearly half (46%) of the respondents have an on-going collaboration with higher education or research initiatives. This is encouraging
although there remain some barriers to knowledge transfer between higher education and research institutes and industry with the following challenges citied: academic language and
misalignment of cultures; a lack of capacity in the business to absorb and implement the recommendations; intellectual property rights; a lack of knowledge about what research is being
undertaken; and a preference amongst research bodies to only work with large organisations. Given the importance of innovation to the sector and the general willingness to work
together there is an opportunity to support the industry in addressing these different barriers.
Thorough the interviews with the industry leaders it was also clear that collaboration does not just take place with higher education or research initiatives. A range of different examples
were cited of industry working with different organisations throughout the supply chain. This includes collaboration with those responsible for packaging; other industry bodies (eg Age
UK); closely working across the agri-supply chain to help better manage yields; technical companies looking at specific technical processes that don’t currently exist in the market; and
other FDM companies that can bring new flavours to existing products.
How best to support and facilitate this collaboration between the supply chain is another area that may warrant further investigation.
There is a willingness to work with others on innovation
Note: 41 survey responses
Source: Grant Thornton survey and interviews
60
© 2017 Grant Thornton UK LLP. All rights reserved
FDF Economic contribution and growth opportunities | June 2017
Consumers have rarely been more influential. Where once companies and Governments
set the agenda on consumption, across the consumer sector the rise of smartphones and
social media have meant that consumers have reclaimed a huge amount of power. These
days products can become overnight successes at the press of a “Like” button. This trend
is perpetuated by an increasing shift towards consumers demonstrating their lifestyle
choices, whether that’s a once-in-a-lifetime holiday or a meal the hottest new restaurant,
and what those choices say about them. This prioritisation of having less, but doing more
is an interesting new development in the age of fast food and fast fashion and
demonstrates a desire on behalf of consumers to not only regain their leisure time and
reassess their lifestyle priorities, but also to allow them to create a sense of individuality in
an increasingly globalised world.
For the FDM sector, this behaviour has several implications. The first is that they must
keep track of what’s hot, and what’s not. Recent years have seen massive surges in the
popularity of certain food types, such as kale and avocado, which has lead to some
innovations such as one leading supermarket now stocking peeled, frozen avocado halves.
Consumer perception and what buying a particular brand says about them is a growing
issue. For example, sustainability is a big issue across the consumer sector with many
fashion retailers now highlighting products which have been made using sustainable
fabrics. For the food and beverage sector there has long been an association with fair trade
but recent legislation, such as the Modern Slavery Act, as well as growing consumer
awareness of food miles, environmental sustainability and waste has forced the issue
even more.
Another implication is the growing market for out of home dining which places pressure
on the sector, not only from the perspective of trying to maintain its share of wallet for
customer spending, but also in ensuring that their products can compete with the out of
home dining experience.
Understanding consumer behaviour is vital when it comes to innovation
When consumers do eat at home, convenience and changing dietary habits have changed.
The palate of the British consumer has changed over the past century, with global
influences playing an increasingly fundamental role in modern British cuisine. This,
coupled with the need for the consumer to be able to cook their food quickly has forced
innovation onto FDMs. One senior industry leader highlighted how the changing of
consumer tastes was impacting the sector: “People have moved away from meat and two veg, its
more a question of ingredients now…Sunday roasts used to be traditional but that’s not a given any
more… how do we fit the modern lifestyle? [We] look at new cooking methods.”
Another said that; “It [innovation] starts with the customer and the product as that drives everything,
but as soon as you start innovation with customers that drives a need for innovation in the supply chain.”
This investment in the supply chain can be incredibly costly for FDMs, as one senior
influencer noted: “We will invest heavily in product innovation and customer, if that means we enter
more complex supply chains, for example, cafes and restaurants with smaller pack runs, if we have to have
more sophisticated warehousing and distribution we will. It is needed to enter more valuable markets.”
For the FDM sector, understanding consumer behaviour in a fast-moving consumer
world, is more vital than ever before.
Source: Grant Thornton research and analysis. Grant Thornton interviews
61
© 2017 Grant Thornton UK LLP. All rights reserved
FDF Economic contribution and growth opportunities | June 2017
The FDM industry possesses a global reputation for being at the forefront of product innovation. When surveyed about innovation type, 90% of respondents said they were engaged in
new product development, while more than 70% were engaged in manufacturing process automation and almost 70% engaged in efficient resource use, including the reduction of water
and energy use. Almost half of survey respondents are currently engaged in an on-going collaboration with higher education or research initiatives. There is close work being undertaken
with businesses in the agri-supply chain but further support on how to facilitate cross-supply chain working remains a priority for industry.
With consumer demand driving product innovation, the industry is dedicated to providing consumers with a wide range of quality, safe and nutritious products. The industry is
committed to reducing sugar levels and working with Government on key policy issues, such as obesity.
Food and drink manufacturers are identifying opportunities for precompetitive innovation, particularly around automation. In order to build best practise, businesses within the sector are
also looking to innovations in other industries.
With many manufacturers engaged in long-term calorie reduction programmes, the sector is looking to work with Government on a holistic calorie reduction programme alongside
manufacturers. The ask of Government is to help facilitate further innovation through support for fundamental and applied research, which could encourage understanding of how
healthier foods can become the foods of choice for consumers. Any further nutrient taxes on food will cause uncertainty for the sector.
Conclusions and recommendations
62

© 2017 Grant Thornton UK LLP. All rights reserved | Draft
Trade
63
© 2017 Grant Thornton UK LLP. All rights reserved
FDF Economic contribution and growth opportunities | June 2017
Trade, both imports and exports, plays a critical role in the success and economic contribution that the sector can make. It
is an area that is likely to change significantly over the next decade and as such it is critical that the industry understands its
current position and is clear on its priorities for the future. In this context, there is an important role for Government and
industry to work together.
Chapter introduction
64
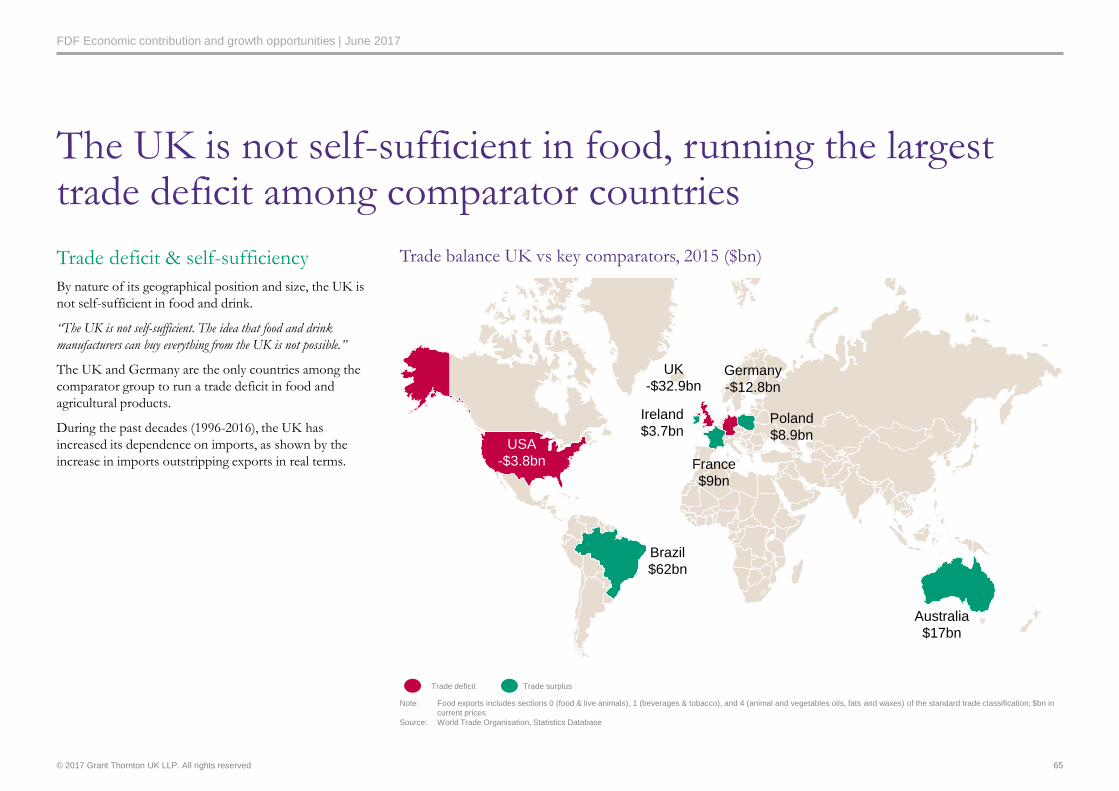
© 2017 Grant Thornton UK LLP. All rights reserved
FDF Economic contribution and growth opportunities | June 2017
Trade deficit & self-sufficiency
By nature of its geographical position and size, the UK is
not self-sufficient in food and drink.
“The UK is not self-sufficient. The idea that food and drink
manufacturers can buy everything from the UK is not possible.”
The UK and Germany are the only countries among the
comparator group to run a trade deficit in food and
agricultural products.
During the past decades (1996-2016), the UK has
increased its dependence on imports, as shown by the
increase in imports outstripping exports in real terms.
Trade balance UK vs key comparators, 2015 ($bn)
The UK is not self-sufficient in food, running the largest trade deficit among comparator countries
65
Note: Food exports includes sections 0 (food & live animals), 1 (beverages & tobacco), and 4 (animal and vegetables oils, fats and waxes) of the standard trade classification; $bn in
current prices
Source: World Trade Organisation, Statistics Database
Trade deficit Trade surplus
Germany
-$12.8bn
Poland
$8.9bn
France
$9bn
Australia
$17bn
Brazil
$62bn
USA
-$3.8bn
Ireland
$3.7bn
UK
-$32.9bn

© 2017 Grant Thornton UK LLP. All rights reserved
FDF Economic contribution and growth opportunities | June 2017
0
5
10
15
20
25
30
35
40
45
1997
1998
1999
2000
2001
2002
2003
2004
2005
2006
2007
2008
2009
2010
2011
2012
2013
2014
2015
2016
UK trade balance
Given the constraints of its size and geographic position, it
is expected the UK will run a trade deficit in food
products. The largest deficit is run in fruits and vegetables
(as the UK doesn’t have the climate to ensure plentiful
production) and in meat as consumption outstrips
domestic supply. The only food and drink category where
the UK has a trade surplus is alcoholic drinks, sustained in
particular by whisky exports.
However, in recent years, the UK has increased its
dependence on imports, as shown by the increase in
imports outstripping exports in real terms.
UK trade balance, £m
The UK has increased its dependence on imports…
66
Source: HMRC Trade Statistics
UK trade deficit by category, £m
CAGR
2012-2016
3.2%
2.5%
(8.8)
(4.7) (4.7)
(1.8) (1.7) (1.4) (1.3) (0.7) (0.6)
1.8
Fruit andvegetables
Meat andanimal
products
Other grocery Sugar,chocolate
andconfectionery
Cereals andbakery
Fish andseafood
Dairyproducts
Tea, coffee,cocoa
powder
Non-alcoholicdrink
Alcoholicdrinks
Imports
Exports
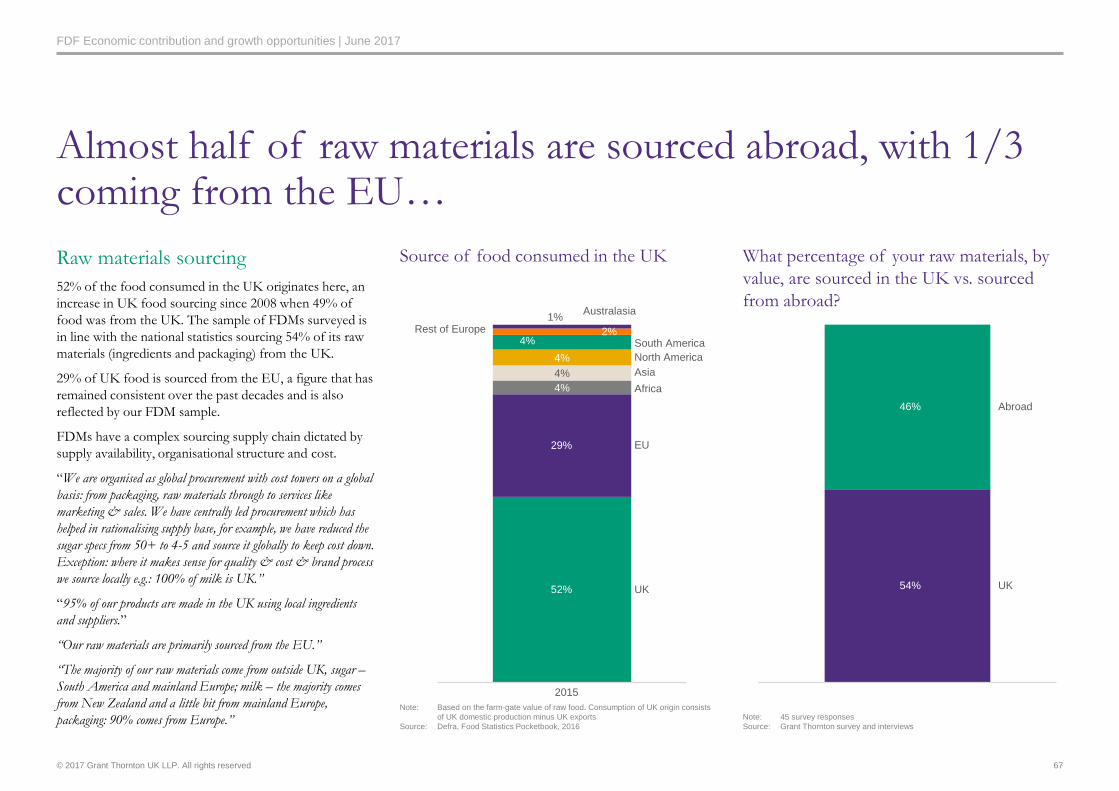
© 2017 Grant Thornton UK LLP. All rights reserved
FDF Economic contribution and growth opportunities | June 2017
Raw materials sourcing
52% of the food consumed in the UK originates here, an
increase in UK food sourcing since 2008 when 49% of
food was from the UK. The sample of FDMs surveyed is
in line with the national statistics sourcing 54% of its raw
materials (ingredients and packaging) from the UK.
29% of UK food is sourced from the EU, a figure that has
remained consistent over the past decades and is also
reflected by our FDM sample.
FDMs have a complex sourcing supply chain dictated by
supply availability, organisational structure and cost.
“We are organised as global procurement with cost towers on a global
basis: from packaging, raw materials through to services like
marketing & sales. We have centrally led procurement which has
helped in rationalising supply base, for example, we have reduced the
sugar specs from 50+ to 4-5 and source it globally to keep cost down.
Exception: where it makes sense for quality & cost & brand process
we source locally e.g.: 100% of milk is UK.”
“95% of our products are made in the UK using local ingredients
and suppliers.”
“Our raw materials are primarily sourced from the EU.”
“The majority of our raw materials come from outside UK, sugar –
South America and mainland Europe; milk – the majority comes
from New Zealand and a little bit from mainland Europe,
packaging: 90% comes from Europe.”
Almost half of raw materials are sourced abroad, with 1/3 coming from the EU…
Source of food consumed in the UK What percentage of your raw materials, by
value, are sourced in the UK vs. sourced
from abroad?
67
Abroad
UK54%
46%
Note: Based on the farm-gate value of raw food. Consumption of UK origin consists
of UK domestic production minus UK exports
Source: Defra, Food Statistics Pocketbook, 2016
Note: 45 survey responses
Source: Grant Thornton survey and interviews
4%
4%
4%
4%
29% EU
UK
Rest of Europe
South America
Asia
Africa
52%
Australasia
North America
2015
2%
1%
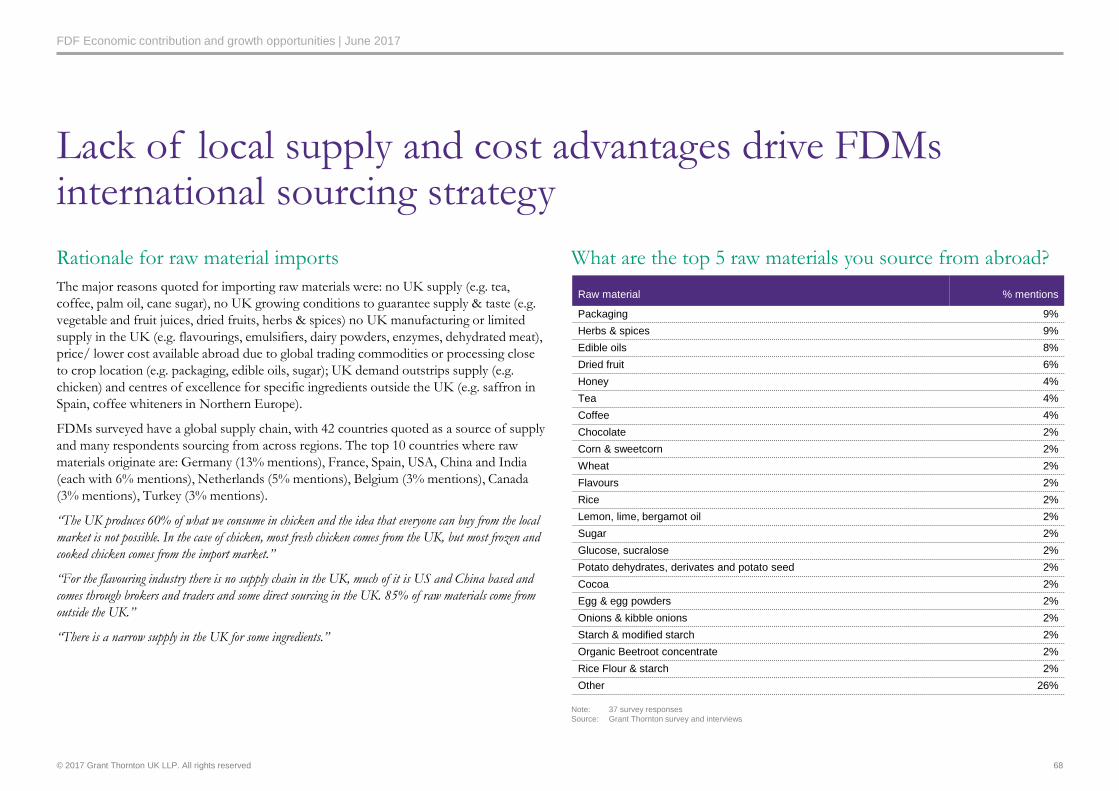
© 2017 Grant Thornton UK LLP. All rights reserved
FDF Economic contribution and growth opportunities | June 2017
Rationale for raw material imports
The major reasons quoted for importing raw materials were: no UK supply (e.g. tea,
coffee, palm oil, cane sugar), no UK growing conditions to guarantee supply & taste (e.g.
vegetable and fruit juices, dried fruits, herbs & spices) no UK manufacturing or limited
supply in the UK (e.g. flavourings, emulsifiers, dairy powders, enzymes, dehydrated meat),
price/ lower cost available abroad due to global trading commodities or processing close
to crop location (e.g. packaging, edible oils, sugar); UK demand outstrips supply (e.g.
chicken) and centres of excellence for specific ingredients outside the UK (e.g. saffron in
Spain, coffee whiteners in Northern Europe).
FDMs surveyed have a global supply chain, with 42 countries quoted as a source of supply
and many respondents sourcing from across regions. The top 10 countries where raw
materials originate are: Germany (13% mentions), France, Spain, USA, China and India
(each with 6% mentions), Netherlands (5% mentions), Belgium (3% mentions), Canada
(3% mentions), Turkey (3% mentions).
“The UK produces 60% of what we consume in chicken and the idea that everyone can buy from the local
market is not possible. In the case of chicken, most fresh chicken comes from the UK, but most frozen and
cooked chicken comes from the import market.”
“For the flavouring industry there is no supply chain in the UK, much of it is US and China based and
comes through brokers and traders and some direct sourcing in the UK. 85% of raw materials come from
outside the UK.”
“There is a narrow supply in the UK for some ingredients.”
Lack of local supply and cost advantages drive FDMs international sourcing strategy
What are the top 5 raw materials you source from abroad?
68
Note: 37 survey responses
Source: Grant Thornton survey and interviews
Raw material % mentions
Packaging 9%
Herbs & spices 9%
Edible oils 8%
Dried fruit 6%
Honey 4%
Tea 4%
Coffee 4%
Chocolate 2%
Corn & sweetcorn 2%
Wheat 2%
Flavours 2%
Rice 2%
Lemon, lime, bergamot oil 2%
Sugar 2%
Glucose, sucralose 2%
Potato dehydrates, derivates and potato seed 2%
Cocoa 2%
Egg & egg powders 2%
Onions & kibble onions 2%
Starch & modified starch 2%
Organic Beetroot concentrate 2%
Rice Flour & starch 2%
Other 26%
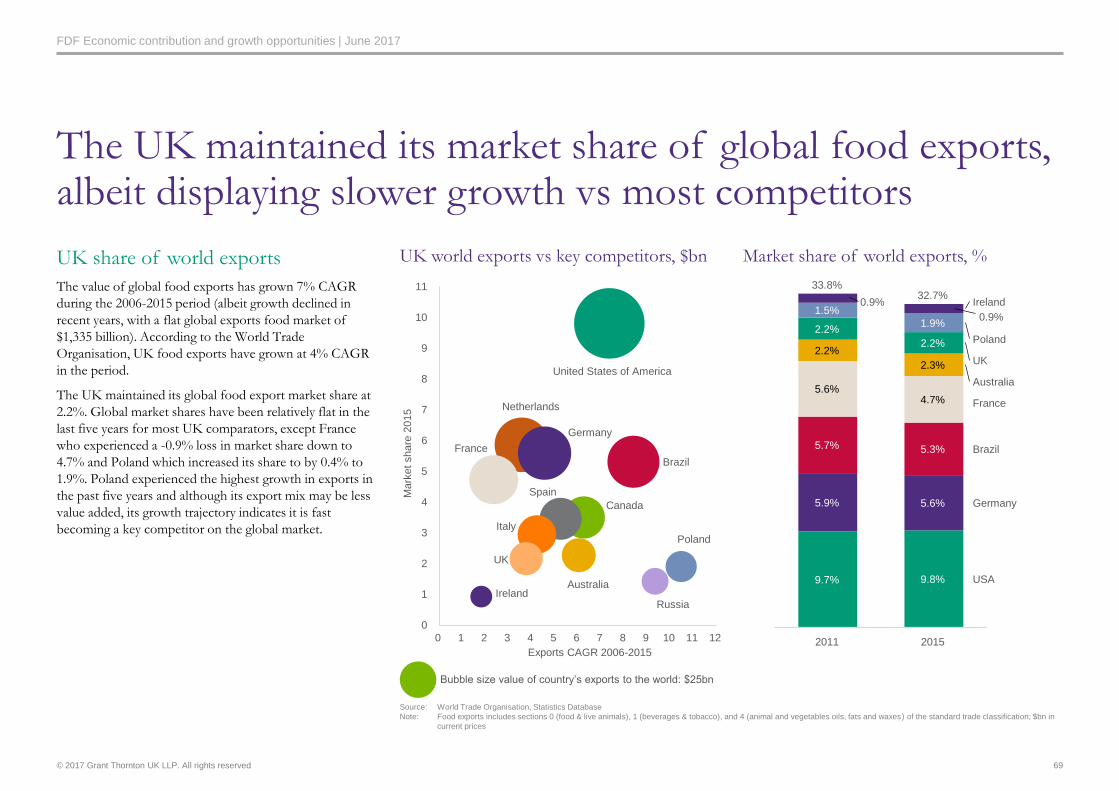
© 2017 Grant Thornton UK LLP. All rights reserved
FDF Economic contribution and growth opportunities | June 2017
UK share of world exports
The value of global food exports has grown 7% CAGR
during the 2006-2015 period (albeit growth declined in
recent years, with a flat global exports food market of
$1,335 billion). According to the World Trade
Organisation, UK food exports have grown at 4% CAGR
in the period.
The UK maintained its global food export market share at
2.2%. Global market shares have been relatively flat in the
last five years for most UK comparators, except France
who experienced a -0.9% loss in market share down to
4.7% and Poland which increased its share to by 0.4% to
1.9%. Poland experienced the highest growth in exports in
the past five years and although its export mix may be less
value added, its growth trajectory indicates it is fast
becoming a key competitor on the global market.
The UK maintained its market share of global food exports, albeit displaying slower growth vs most competitors
UK world exports vs key competitors, $bn Market share of world exports, %
69
Exports CAGR 2006-2015
Mark
et
share
2015
2.2%
5.7%
5.6%
0.9%1.5%
2.2%
Brazil
USA
Germany
France
Australia
UK
2.2%
0.9%
33.8%
9.7%
2015
2.3%
2011
5.9%
Poland
5.3%
9.8%
1.9%
Ireland32.7%
5.6%
4.7%
United States of America
UK
Brazil
Italy
Netherlands
Ireland
France
Canada
Russia
Poland
Spain
Australia
Germany
0
1
2
3
4
5
6
7
8
9
10
11
0 1 2 3 4 5 6 7 8 9 10 11 12
Source: World Trade Organisation, Statistics Database
Note: Food exports includes sections 0 (food & live animals), 1 (beverages & tobacco), and 4 (animal and vegetables oils, fats and waxes) of the standard trade classification; $bn in
current prices
Bubble size value of country’s exports to the world: $25bn
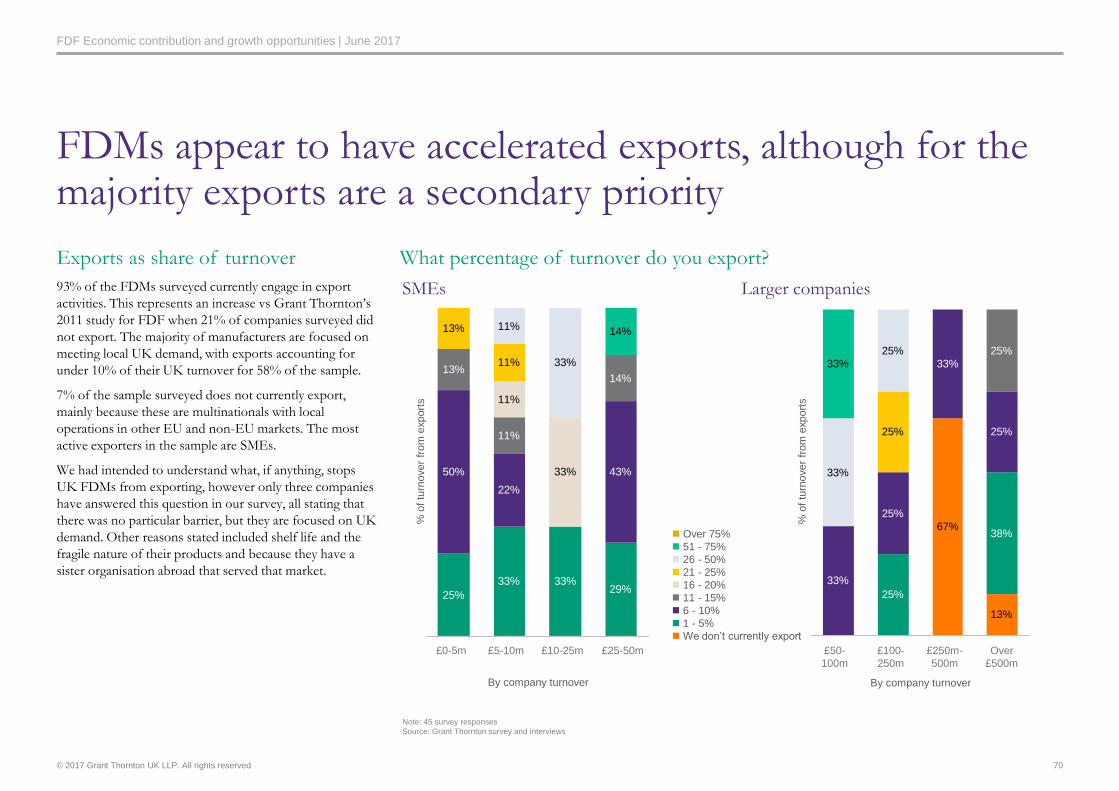
© 2017 Grant Thornton UK LLP. All rights reserved
FDF Economic contribution and growth opportunities | June 2017
Exports as share of turnover
93% of the FDMs surveyed currently engage in export
activities. This represents an increase vs Grant Thornton’s
2011 study for FDF when 21% of companies surveyed did
not export. The majority of manufacturers are focused on
meeting local UK demand, with exports accounting for
under 10% of their UK turnover for 58% of the sample.
7% of the sample surveyed does not currently export,
mainly because these are multinationals with local
operations in other EU and non-EU markets. The most
active exporters in the sample are SMEs.
We had intended to understand what, if anything, stops
UK FDMs from exporting, however only three companies
have answered this question in our survey, all stating that
there was no particular barrier, but they are focused on UK
demand. Other reasons stated included shelf life and the
fragile nature of their products and because they have a
sister organisation abroad that served that market.
What percentage of turnover do you export?
FDMs appear to have accelerated exports, although for the majority exports are a secondary priority
70
Note: 45 survey responses
Source: Grant Thornton survey and interviews
25%
33% 33%29%
50%
22%
43%
11%
14%
13%
11%13%
33%
11%
33%
11% 14%
% o
f tu
rnover
from
export
s
£25-50m£10-25m£0-5m £5-10m
67%
13%
25%
38%
25%
33%
25%
33%
25%
25%
33%
25%
33%
£50-
100m
£100-
250m
£250m-
500m
Over
£500m
SMEs Larger companies
Over 75%
51 - 75%
26 - 50%
21 - 25%
16 - 20%
11 - 15%
6 - 10%
1 - 5%
We don’t currently export
By company turnover By company turnover
% o
f tu
rnover
from
export
s
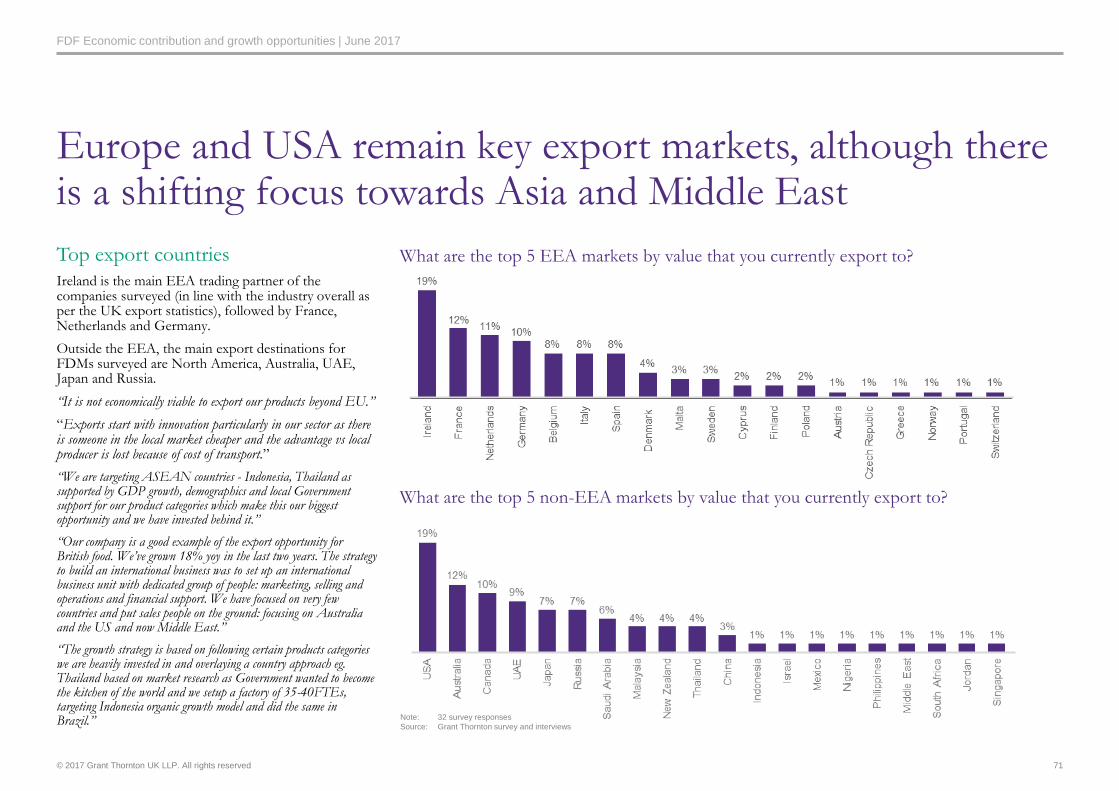
© 2017 Grant Thornton UK LLP. All rights reserved
FDF Economic contribution and growth opportunities | June 2017
Top export countries
Ireland is the main EEA trading partner of the companies surveyed (in line with the industry overall as per the UK export statistics), followed by France, Netherlands and Germany.
Outside the EEA, the main export destinations for FDMs surveyed are North America, Australia, UAE, Japan and Russia.
“It is not economically viable to export our products beyond EU.”
“Exports start with innovation particularly in our sector as there is someone in the local market cheaper and the advantage vs local producer is lost because of cost of transport.”
“We are targeting ASEAN countries - Indonesia, Thailand as supported by GDP growth, demographics and local Government support for our product categories which make this our biggest opportunity and we have invested behind it.”
“Our company is a good example of the export opportunity for British food. We’ve grown 18% yoy in the last two years. The strategy to build an international business was to set up an international business unit with dedicated group of people: marketing, selling and operations and financial support. We have focused on very few countries and put sales people on the ground: focusing on Australia and the US and now Middle East.”
“The growth strategy is based on following certain products categories we are heavily invested in and overlaying a country approach eg. Thailand based on market research as Government wanted to become the kitchen of the world and we setup a factory of 35-40FTEs, targeting Indonesia organic growth model and did the same in Brazil.”
What are the top 5 EEA markets by value that you currently export to?
Europe and USA remain key export markets, although there is a shifting focus towards Asia and Middle East
71
Note: 32 survey responses
Source: Grant Thornton survey and interviews
What are the top 5 non-EEA markets by value that you currently export to?
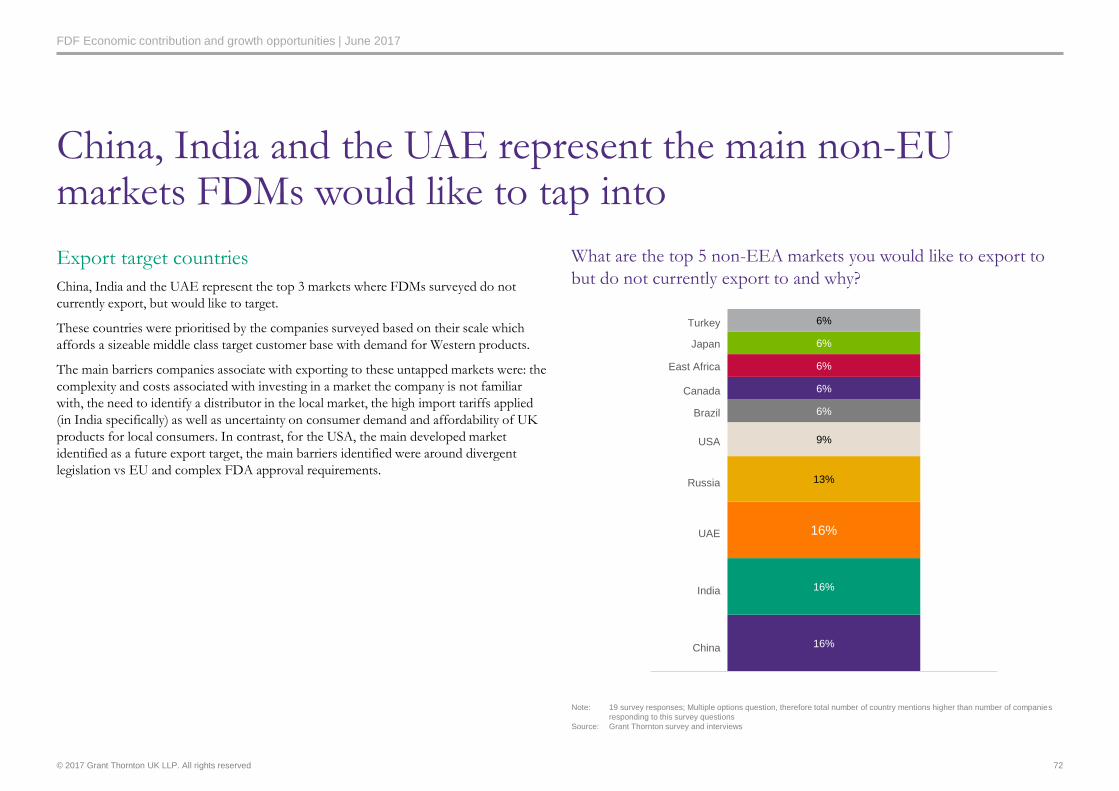
© 2017 Grant Thornton UK LLP. All rights reserved
FDF Economic contribution and growth opportunities | June 2017
Export target countries
China, India and the UAE represent the top 3 markets where FDMs surveyed do not
currently export, but would like to target.
These countries were prioritised by the companies surveyed based on their scale which
affords a sizeable middle class target customer base with demand for Western products.
The main barriers companies associate with exporting to these untapped markets were: the
complexity and costs associated with investing in a market the company is not familiar
with, the need to identify a distributor in the local market, the high import tariffs applied
(in India specifically) as well as uncertainty on consumer demand and affordability of UK
products for local consumers. In contrast, for the USA, the main developed market
identified as a future export target, the main barriers identified were around divergent
legislation vs EU and complex FDA approval requirements.
China, India and the UAE represent the main non-EU markets FDMs would like to tap into
What are the top 5 non-EEA markets you would like to export to
but do not currently export to and why?
72
Note: 19 survey responses; Multiple options question, therefore total number of country mentions higher than number of companies
responding to this survey questions
Source: Grant Thornton survey and interviews
16%
16%
16%
13%
9%
6%
6%
6%
6%
6%
India
China
Turkey
Japan
East Africa
USA
Russia
Canada
UAE
Brazil
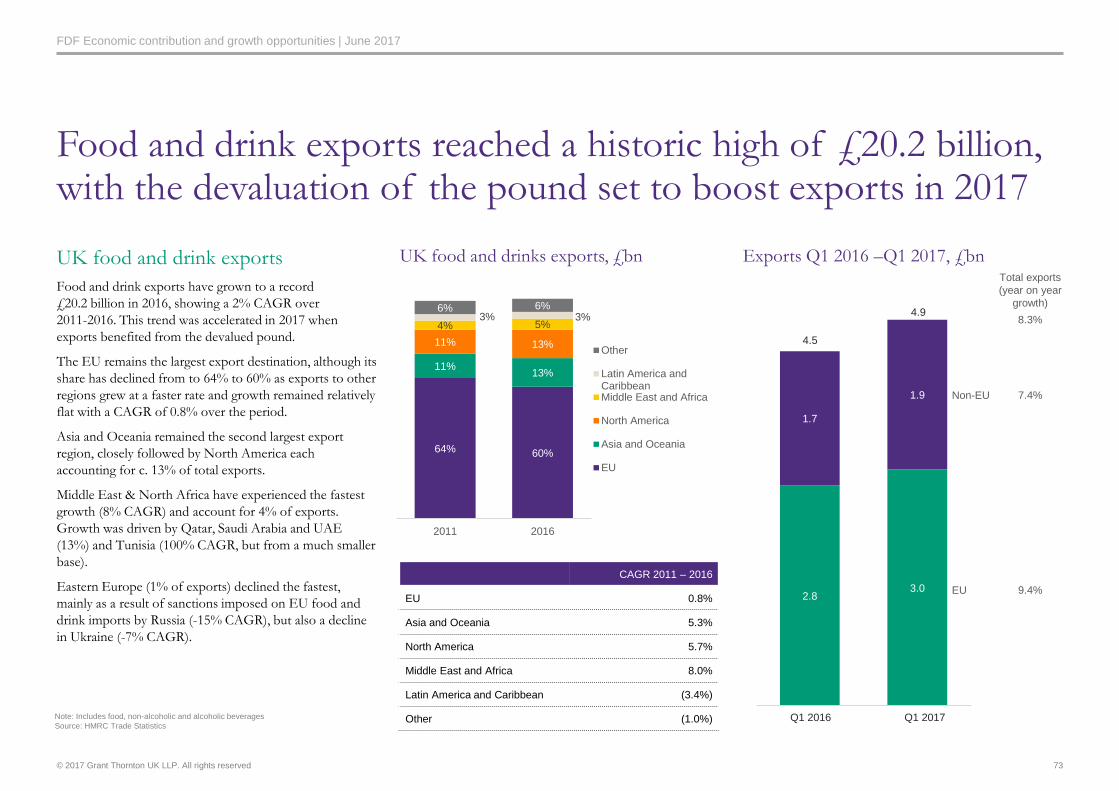
© 2017 Grant Thornton UK LLP. All rights reserved
FDF Economic contribution and growth opportunities | June 2017
UK food and drink exports
Food and drink exports have grown to a record
£20.2 billion in 2016, showing a 2% CAGR over
2011-2016. This trend was accelerated in 2017 when
exports benefited from the devalued pound.
The EU remains the largest export destination, although its
share has declined from to 64% to 60% as exports to other
regions grew at a faster rate and growth remained relatively
flat with a CAGR of 0.8% over the period.
Asia and Oceania remained the second largest export
region, closely followed by North America each
accounting for c. 13% of total exports.
Middle East & North Africa have experienced the fastest
growth (8% CAGR) and account for 4% of exports.
Growth was driven by Qatar, Saudi Arabia and UAE
(13%) and Tunisia (100% CAGR, but from a much smaller
base).
Eastern Europe (1% of exports) declined the fastest,
mainly as a result of sanctions imposed on EU food and
drink imports by Russia (-15% CAGR), but also a decline
in Ukraine (-7% CAGR).
Food and drink exports reached a historic high of £20.2 billion, with the devaluation of the pound set to boost exports in 2017
UK food and drinks exports, £bn Exports Q1 2016 –Q1 2017, £bn
73
Note: Includes food, non-alcoholic and alcoholic beverages
Source: HMRC Trade Statistics
2.83.0
1.7
1.9
EU
Non-EU
Q1 2016
4.5
4.9
Q1 2017
Total exports
(year on year
growth)
8.3%
7.4%
9.4%
64% 60%
11%13%
11% 13%
4% 5%3% 3%
6% 6%
2011 2016
Other
Latin America andCaribbeanMiddle East and Africa
North America
Asia and Oceania
EU
CAGR 2011 – 2016
EU 0.8%
Asia and Oceania 5.3%
North America 5.7%
Middle East and Africa 8.0%
Latin America and Caribbean (3.4%)
Other (1.0%)
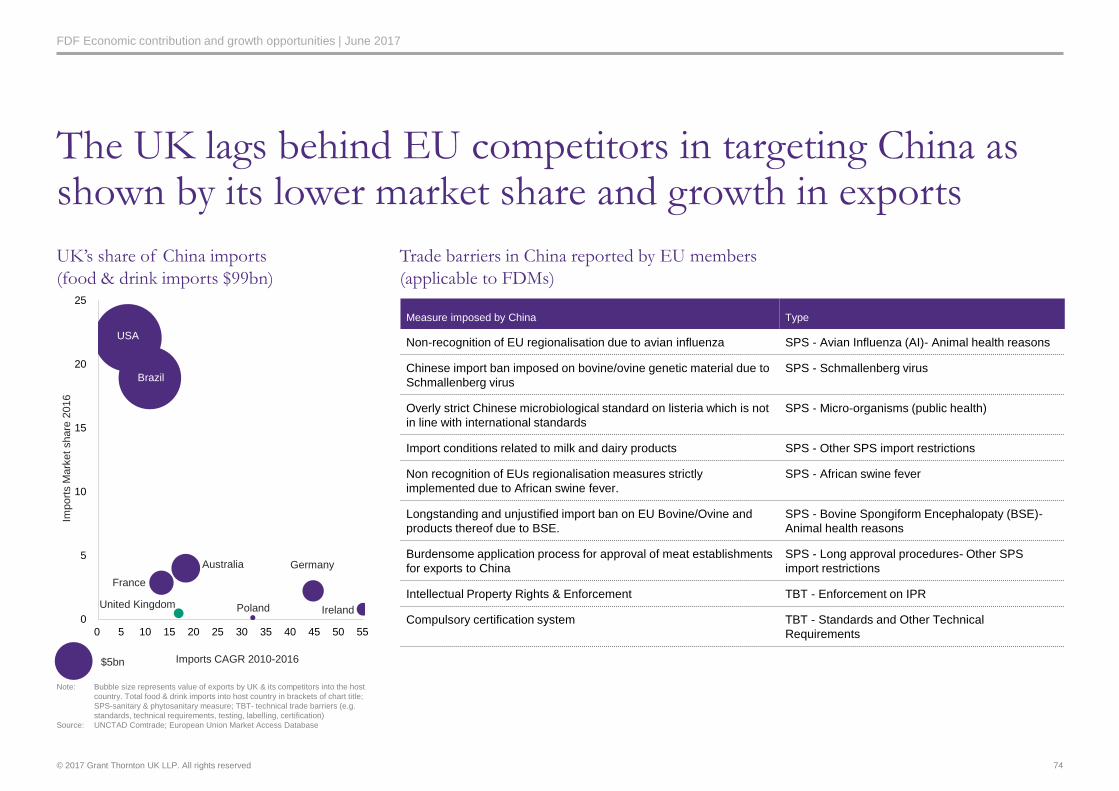
© 2017 Grant Thornton UK LLP. All rights reserved
FDF Economic contribution and growth opportunities | June 2017
UK’s share of China imports
(food & drink imports $99bn)
Trade barriers in China reported by EU members
(applicable to FDMs)
The UK lags behind EU competitors in targeting China as shown by its lower market share and growth in exports
74
0
5
10
15
20
25
0 5 10 15 20 25 30 35 40 45 50 55
Imports CAGR 2010-2016
Brazil
Australia
Poland
USA
United KingdomIreland
France
Germany
Import
s M
ark
et
share
2016
$5bn
Note: Bubble size represents value of exports by UK & its competitors into the host
country. Total food & drink imports into host country in brackets of chart title;
SPS-sanitary & phytosanitary measure; TBT- technical trade barriers (e.g.
standards, technical requirements, testing, labelling, certification)
Source: UNCTAD Comtrade; European Union Market Access Database
Measure imposed by China Type
Non-recognition of EU regionalisation due to avian influenza SPS - Avian Influenza (AI)- Animal health reasons
Chinese import ban imposed on bovine/ovine genetic material due to
Schmallenberg virus
SPS - Schmallenberg virus
Overly strict Chinese microbiological standard on listeria which is not
in line with international standards
SPS - Micro-organisms (public health)
Import conditions related to milk and dairy products SPS - Other SPS import restrictions
Non recognition of EUs regionalisation measures strictly
implemented due to African swine fever.
SPS - African swine fever
Longstanding and unjustified import ban on EU Bovine/Ovine and
products thereof due to BSE.
SPS - Bovine Spongiform Encephalopaty (BSE)-
Animal health reasons
Burdensome application process for approval of meat establishments
for exports to China
SPS - Long approval procedures- Other SPS
import restrictions
Intellectual Property Rights & Enforcement TBT - Enforcement on IPR
Compulsory certification system TBT - Standards and Other Technical
Requirements
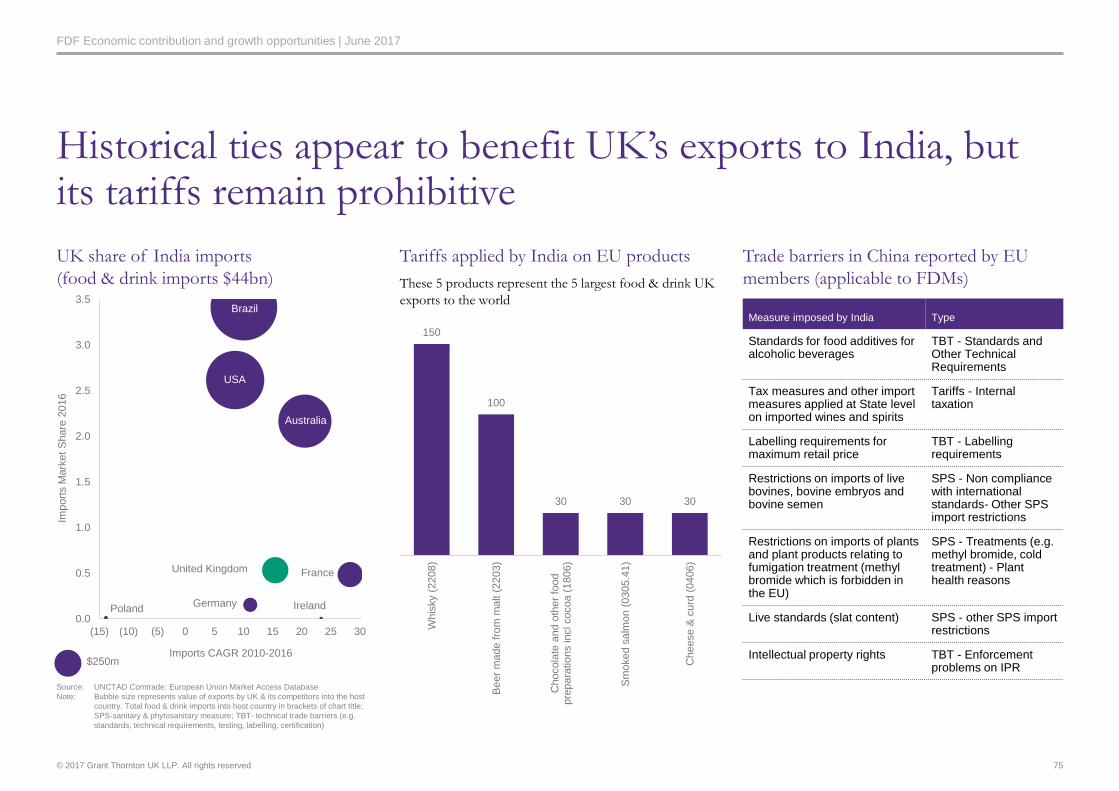
© 2017 Grant Thornton UK LLP. All rights reserved
FDF Economic contribution and growth opportunities | June 2017
UK share of India imports
(food & drink imports $44bn)
Historical ties appear to benefit UK’s exports to India, but its tariffs remain prohibitive
Tariffs applied by India on EU products
These 5 products represent the 5 largest food & drink UK
exports to the world
Trade barriers in China reported by EU
members (applicable to FDMs)
75
0.0
0.5
1.0
1.5
2.0
2.5
3.0
3.5
(15) (10) (5) 0 5 10 15 20 25 30
France
Australia
Germany
Brazil
Imports CAGR 2010-2016
Import
s M
ark
et
Share
2016
United Kingdom
Poland Ireland
USA
$250m
Source: UNCTAD Comtrade; European Union Market Access Database
Note: Bubble size represents value of exports by UK & its competitors into the host
country. Total food & drink imports into host country in brackets of chart title;
SPS-sanitary & phytosanitary measure; TBT- technical trade barriers (e.g.
standards, technical requirements, testing, labelling, certification)
150
100
30 30 30
Whis
ky (
2208)
Be
er
ma
de fro
m m
alt (
22
03)
Chocola
te a
nd o
ther
food
pre
pa
ratio
ns in
cl cocoa (
1806)
Sm
oke
d s
alm
on (
0305.4
1)
Cheese &
curd
(0406)
Measure imposed by India Type
Standards for food additives for alcoholic beverages
TBT - Standards and Other Technical Requirements
Tax measures and other import measures applied at State level on imported wines and spirits
Tariffs - Internal taxation
Labelling requirements for maximum retail price
TBT - Labelling requirements
Restrictions on imports of live bovines, bovine embryos and bovine semen
SPS - Non compliance with international standards- Other SPS import restrictions
Restrictions on imports of plants and plant products relating to fumigation treatment (methyl bromide which is forbidden in the EU)
SPS - Treatments (e.g. methyl bromide, cold treatment) - Plant health reasons
Live standards (slat content) SPS - other SPS import restrictions
Intellectual property rights TBT - Enforcement problems on IPR
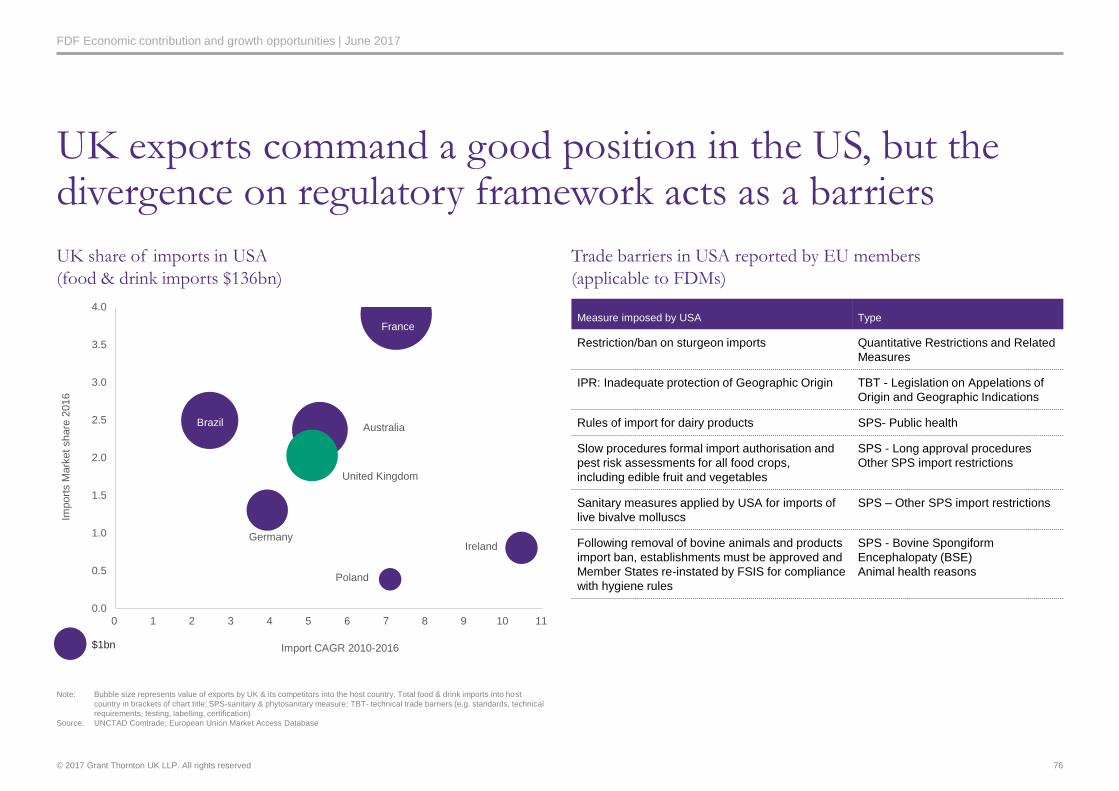
© 2017 Grant Thornton UK LLP. All rights reserved
FDF Economic contribution and growth opportunities | June 2017
UK share of imports in USA
(food & drink imports $136bn)
UK exports command a good position in the US, but the divergence on regulatory framework acts as a barriers
Trade barriers in USA reported by EU members
(applicable to FDMs)
76
0.0
0.5
1.0
1.5
2.0
2.5
3.0
3.5
4.0
0 1 2 3 4 5 6 7 8 9 10 11
Import
s M
ark
et
share
2016
Import CAGR 2010-2016
France
Ireland
Poland
Brazil Australia
United Kingdom
Germany
$1bn
Note: Bubble size represents value of exports by UK & its competitors into the host country. Total food & drink imports into host
country in brackets of chart title; SPS-sanitary & phytosanitary measure; TBT- technical trade barriers (e.g. standards, technical
requirements, testing, labelling, certification)
Source: UNCTAD Comtrade; European Union Market Access Database
Measure imposed by USA Type
Restriction/ban on sturgeon imports Quantitative Restrictions and Related
Measures
IPR: Inadequate protection of Geographic Origin TBT - Legislation on Appelations of
Origin and Geographic Indications
Rules of import for dairy products SPS- Public health
Slow procedures formal import authorisation and
pest risk assessments for all food crops,
including edible fruit and vegetables
SPS - Long approval procedures
Other SPS import restrictions
Sanitary measures applied by USA for imports of
live bivalve molluscs
SPS – Other SPS import restrictions
Following removal of bovine animals and products
import ban, establishments must be approved and
Member States re-instated by FSIS for compliance
with hygiene rules
SPS - Bovine Spongiform
Encephalopaty (BSE)
Animal health reasons
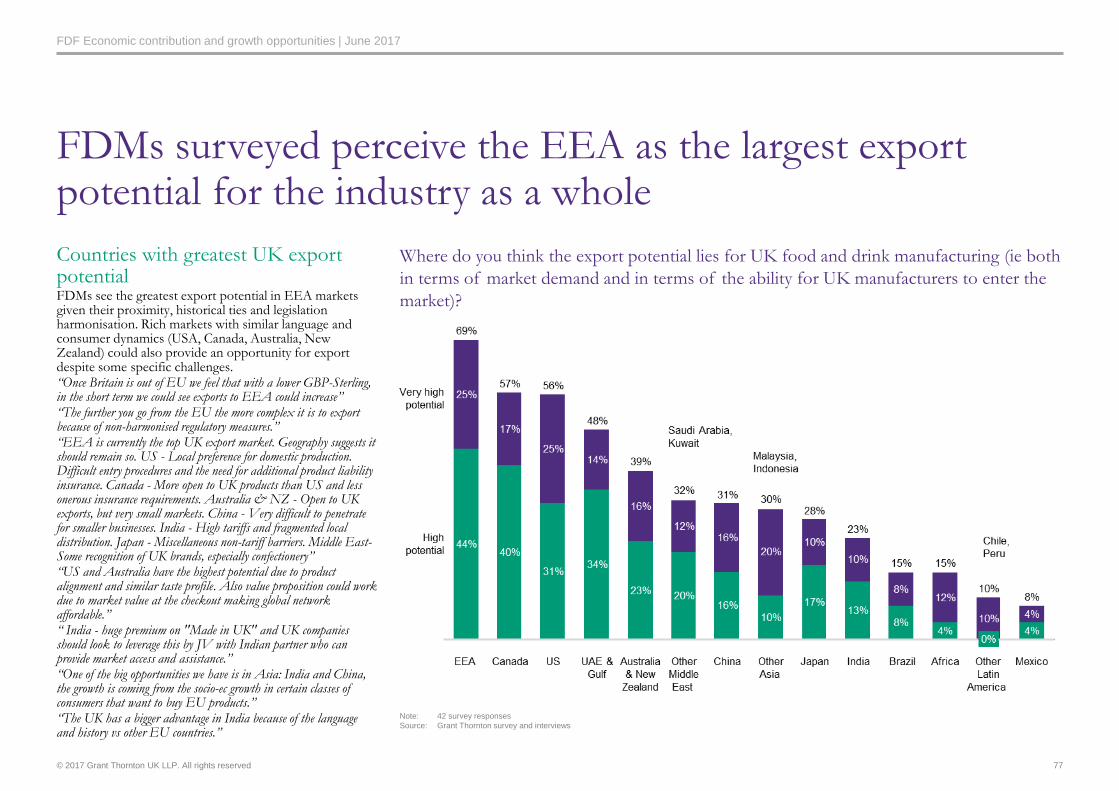
© 2017 Grant Thornton UK LLP. All rights reserved
FDF Economic contribution and growth opportunities | June 2017
Countries with greatest UK export potentialFDMs see the greatest export potential in EEA markets given their proximity, historical ties and legislation harmonisation. Rich markets with similar language and consumer dynamics (USA, Canada, Australia, New Zealand) could also provide an opportunity for export despite some specific challenges. “Once Britain is out of EU we feel that with a lower GBP-Sterling, in the short term we could see exports to EEA could increase”“The further you go from the EU the more complex it is to export because of non-harmonised regulatory measures.”“EEA is currently the top UK export market. Geography suggests it should remain so. US - Local preference for domestic production. Difficult entry procedures and the need for additional product liability insurance. Canada - More open to UK products than US and less onerous insurance requirements. Australia & NZ - Open to UK exports, but very small markets. China - Very difficult to penetrate for smaller businesses. India - High tariffs and fragmented local distribution. Japan - Miscellaneous non-tariff barriers. Middle East-Some recognition of UK brands, especially confectionery”“US and Australia have the highest potential due to product alignment and similar taste profile. Also value proposition could work due to market value at the checkout making global network affordable.”“ India - huge premium on "Made in UK" and UK companies should look to leverage this by JV with Indian partner who can provide market access and assistance.”“One of the big opportunities we have is in Asia: India and China, the growth is coming from the socio-ec growth in certain classes of consumers that want to buy EU products.”“The UK has a bigger advantage in India because of the language and history vs other EU countries.”
Where do you think the export potential lies for UK food and drink manufacturing (ie both
in terms of market demand and in terms of the ability for UK manufacturers to enter the
market)?
FDMs surveyed perceive the EEA as the largest export potential for the industry as a whole
77
4%
8%
4% 4%10%8%
12%
10%
10%16%
13%
20%
20%
10%
25%
25%
34%
12%
14%
16%
40%
16%
44%
17%
17%23%
31%
Note: 42 survey responses
Source: Grant Thornton survey and interviews
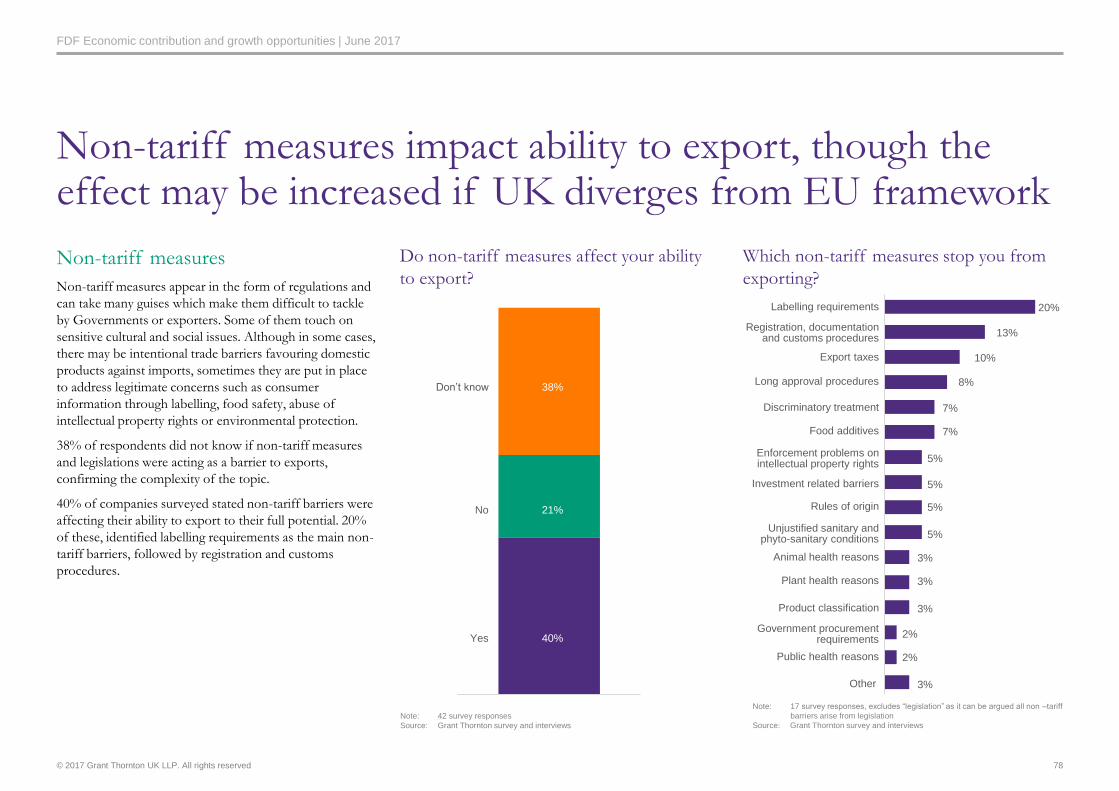
© 2017 Grant Thornton UK LLP. All rights reserved
FDF Economic contribution and growth opportunities | June 2017
Which non-tariff measures stop you from
exporting? Non-tariff measures
Non-tariff measures appear in the form of regulations and
can take many guises which make them difficult to tackle
by Governments or exporters. Some of them touch on
sensitive cultural and social issues. Although in some cases,
there may be intentional trade barriers favouring domestic
products against imports, sometimes they are put in place
to address legitimate concerns such as consumer
information through labelling, food safety, abuse of
intellectual property rights or environmental protection.
38% of respondents did not know if non-tariff measures
and legislations were acting as a barrier to exports,
confirming the complexity of the topic.
40% of companies surveyed stated non-tariff barriers were
affecting their ability to export to their full potential. 20%
of these, identified labelling requirements as the main non-
tariff barriers, followed by registration and customs
procedures.
Non-tariff measures impact ability to export, though the effect may be increased if UK diverges from EU framework
Do non-tariff measures affect your ability
to export?
78
Note: 42 survey responses
Source: Grant Thornton survey and interviews
40%
Don’t know
No
Yes
38%
21%
7%
Long approval procedures
10%
13%
Labelling requirements
Registration, documentation and customs procedures
20%
8%
3%
3%
Investment related barriers
7%
5%
Public health reasons
Unjustified sanitary and phyto-sanitary conditions
Export taxes
Plant health reasons
2%
Product classification
Animal health reasons
3%
5%
Rules of origin 5%
5%
Enforcement problems on intellectual property rights
Government procurement requirements
Food additives
2%
3%
Other
Discriminatory treatment
Note: 17 survey responses, excludes “legislation” as it can be argued all non –tariff
barriers arise from legislation
Source: Grant Thornton survey and interviews
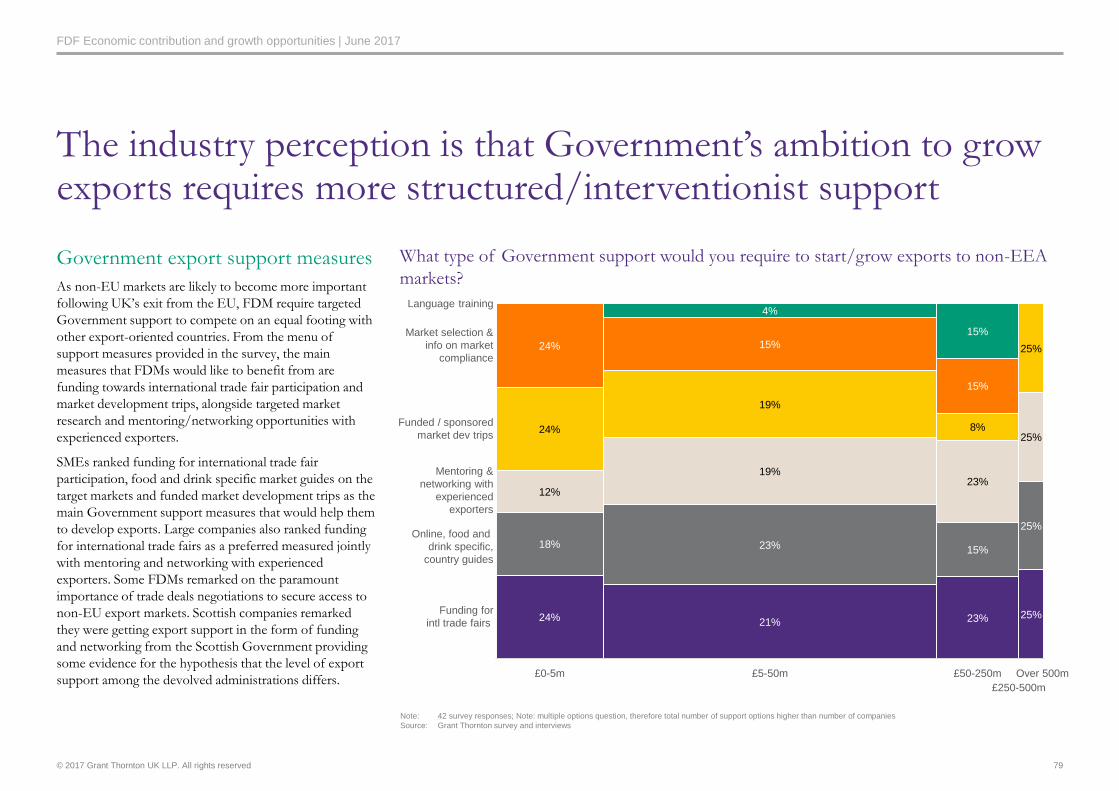
© 2017 Grant Thornton UK LLP. All rights reserved
FDF Economic contribution and growth opportunities | June 2017
Government export support measures
As non-EU markets are likely to become more important
following UK’s exit from the EU, FDM require targeted
Government support to compete on an equal footing with
other export-oriented countries. From the menu of
support measures provided in the survey, the main
measures that FDMs would like to benefit from are
funding towards international trade fair participation and
market development trips, alongside targeted market
research and mentoring/networking opportunities with
experienced exporters.
SMEs ranked funding for international trade fair
participation, food and drink specific market guides on the
target markets and funded market development trips as the
main Government support measures that would help them
to develop exports. Large companies also ranked funding
for international trade fairs as a preferred measured jointly
with mentoring and networking with experienced
exporters. Some FDMs remarked on the paramount
importance of trade deals negotiations to secure access to
non-EU export markets. Scottish companies remarked
they were getting export support in the form of funding
and networking from the Scottish Government providing
some evidence for the hypothesis that the level of export
support among the devolved administrations differs.
What type of Government support would you require to start/grow exports to non-EEA
markets?
The industry perception is that Government’s ambition to grow exports requires more structured/interventionist support
79
Note: 42 survey responses; Note: multiple options question, therefore total number of support options higher than number of companies
Source: Grant Thornton survey and interviews
19%
24%
19%
4%
£5-50m
Online, food and
drink specific,
country guides
Language training
21%
Market selection &
info on market
compliance
12%
23%
Over 500m
Mentoring &
networking with
experienced
exporters
24%
15%
Funding for
intl trade fairs
18%
24%
15%
£50-250m
Funded / sponsored
market dev trips
£0-5m
23%
£250-500m
15%
8%
25%
25%
25%
25%
15%
23%
© 2017 Grant Thornton UK LLP. All rights reserved
FDF Economic contribution and growth opportunities | June 2017
Government export support measures
“The Government has got this ambition to be an exporting nation – does is understand the resource this needs? It needs ministers to go and speak to foreign companies and regulators.”
“Embassy or consular staff need to be trained by exporters to help facilitate trade. The lack of food industry knowledge among officials across all elements of the supply chain hampers exporting.”
“One to one hand-holding introductions/relevant networking/just doing something more than drinks receptions.”
“Help in breaking down trade barriers and countering free trade deals secured by other countries eg. Australia.”
“We have access to the above through Scottish enterprise and SDI.”
“Look at exports from positive perspective. Good thing we spend on international aid to support global society. We should try and get similar agreed investment aimed at exporting companies. Government committed to
similar budget as international aid for export.”
“As an SME you need help to get started on exports. If you shake on a deal with Tesco, all is clear, while for exports you have to protect the trademark, understand the legislation on gluten free which may different in
that market, labelling rule, documentation to accompany the product.”
Government support for exports (continued)
80
Source: Grant Thornton survey and interviews
© 2017 Grant Thornton UK LLP. All rights reserved
FDF Economic contribution and growth opportunities | June 2017
Some industry members see opportunities in UK’s EU exit…
Impact on trade
For a minority of companies that have been negatively impacted by the EU’s import restrictions and tariffs on imports of raw materials for decades, leaving the EU represents an
opportunity to import raw materials from non-EU markets at a lower cost, thus improving margins.
“In the industry change is a threat, therefore companies would prefer to operate in an environment where the costs are artificially inflated by the EU because they are worried by disruption. For us status quo is a threat as
the majority of trade (imports of raw materials) we do is outside the EU and the EU limits the amount of trade you can do tariff-free with the rest of the world.”
The UK’s decision to leave the European Union is likely to have far reaching implications accessing EU and non-EU markets. In the short-term, with a devalued currency and full access
to the EU markets for the next two years (until the UK leaves the single market), food and drink manufacturers have an opportunity to maximise exports to the EU. Similarly, with a
devalued currency, the UK products can compete with EU products in accessing US and Asian markets.
Clearly after the referendum, although we were importing more inflation costs, those of us who are focusing on building international businesses based on export, has a like-for-like 15-20% advantage over the very same
plans.”
Leaving the EU affects not only the UK's trading relationship with it, but also the rest of the world, as at present all the UK's trade deals with third countries are EU agreements. The
countries the UK currently enjoys trade deals with and the terms of those deals will change. However, as the UK gains the ability to negotiate trade agreements independently of the EU,
there will be new markets for UK businesses to explore. Prior to the June 2017elections, the Government has already stated its eagerness to agree quick deals with China, Brazil, the Gulf
States, Australia, New Zealand, India and the United States, which are among the countries where food and drink manufacturers see the largest export opportunities.
The UK's decision to leave the EU and consequent pound devaluation has resurfaced calls for import substitution, as the cost of sourcing ingredients from overseas markets negatively
impacted margins. Although, the issue appears to be a divisive one for the industry, some of the industry leaders interviewed pointed out that the new world order after UK’s EU exit
could also spell out opportunity on the supply side on issues such as import substitution. The task of substituting imports for local produce is difficult and not a quick win, yet some
perceive it as a “low hanging fruit” vs increasing exports. Import substitution may offer some opportunity in the raw ingredients/crops area, as given limited arable land, there will at
some point be an inevitable choice to make between increasing cultivation of one at the expense of another. However, there may be more significant opportunities to widen the supply
for some specialist processed ingredients by investment in processing plants.
“There needs to be work by the FDF on import substitution opportunity as some import substitution is easier to do than exports. The industry needs to define areas of ingredients or input cost/materials that could be
substituted because there is a change in exchange rate of 15% vs the dollar.”
“The industry is mainly talking about exports, but the biggest opportunity for the company is in import substitution.”
81
Source: Grant Thornton survey and interviews
© 2017 Grant Thornton UK LLP. All rights reserved
FDF Economic contribution and growth opportunities | June 2017
However, for the majority UK’s EU exit represents increased costs and lost opportunities…
Impact on trade
However, for many of food and drink manufacturers we spoke to, the UK’s decision to leave the EU means a change to the status quo which brings volatility and uncertainty. Food and
drink manufacturers who are sourcing ingredients from abroad have already experienced a negative effect through the devaluation of the pound which resulted in increased raw materials
cost and, therefore, higher cost of goods, which have to be passed on to consumers. This negative impact was also felt by companies who import finished goods. As inflation returns,
food manufacturers are forced to think strategically to avoid the threat of retailers demanding price cuts (as retailers operate in a competitive environment and serve consumers who in
turn are anxious about the impact of UK leaving the EU on their finances).
“We are seeing some cost inflation this year which is putting pressure on system as our customers (retailers) don’t want to increase prices due to competition with discount stores.”
“Weakening in the £already had a negative effect on purchasing, which needs to be to offset through price increases, making for difficult negotiations with retail. We hedge currency and that covers us for the short-term. If
Brexit results in additional taxes and tariffs, the cost of importing will become significantly higher and needs to be reflected in the price paid by the end consumer. The alternative is looking at import substitution and for
how much of the raw materials we can we develop suppliers in the UK to neutralise the tax and tariffs effect.”
“When the currency started to drop last year we were hedged until November/December on euro and a bit longer on dollar, but we are facing significant impact. Overall exposure forecast is maximum15% increase on raw
materials and 7-8% increase on cost of the business and passing on the price increase.”
Although the shape of UK’s future relationship with the EU is not yet known, food and drink manufacturers acknowledge the risks and increased costs of leaving the single market
ranging from potential tariffs they may need to pay to access EU markets to the more complex non-tariff measures.
“Main issues: after Brexit tariffs issues and value of the£ will both impact the industry. If the pound goes down British produce becomes more attractive to other markets, more attractive to export, but that also means the
price of food in the UK may go up as the price will be set by the export market where you divert the product.”
“Brexit may make it more difficult to export to closest market if there is any form of tariffs and also the practicalities of bringing truck from Portugal, Spain, France, if there is added complexity of border controls because
of shelf-life of product.”
“Export opportunities are few and far between in our industry – some costs could be taken out of the system as a consequence of reducing European Regulations . Maybe some opportunities to go it alone with some
countries such as the emerging markets. Europe traditionally imposes tariffs and get nervous around these sort of opportunities, Mexico and Russia for example. But for every opportunity there are five problems.”
82
Source: Grant Thornton survey and interviews
© 2017 Grant Thornton UK LLP. All rights reserved
FDF Economic contribution and growth opportunities | June 2017
However, for the majority UK’s EU exit represents increased costs and lost opportunities (continued)…
Impact on trade
If the UK has to pay tariffs on trade with the EU, the costs associated represent a major risk on margins for food and drink manufacturers given that almost /3 of ingredients are sourced
from the EU and EU accounts for c. 49% of UK exports. This risk is exacerbated for those with a cross-country integrated supply chains in the industry, with some products crossing the
border into the EU several times before the finished product reaches the consumer are creating another potential risk in case the UK is not negotiating an all encompassing free trade
agreement with the EU. This is mainly the case with factories across the supply chain based in Northern Ireland and the Republic of Ireland, but also other EU countries, which may be
forced to pay tariffs or other import duties during the manufacturing process of transforming raw materials into intermediate and finished products.
“Integrated and harmonised supply chains are efficient as they allow for common standards to be applied and multilingual packaging in a single site serving a lot of Europe. If Brexit and subsequent regulation unravels
these efficiencies it will go against the Government’s desire to bring productivity to the UK.”
“The complication of our supply chain is that the raw material is purchased from Ireland, then it is sent to Northern Ireland to be turned in finished good and 2/3 shipped back into the Republic for consumption. After
Brexit we may face an import tax of some kind or restriction to bring the raw materials in Northern Ireland and then in Ireland import control to send the finished product back over the border. We need to run the
numbers to decide the best supply chain and manufacturing set-up in this context.”
““Balancing the carcass” – using the whole product for consumers – is an important consideration for the industry. Brexit has considerable impact on the sector as the meat industry is not a straightforward single
transaction to produce the end product. Ultimately there are many cross border transactions in the industry as the product is processed and then packed. What if we don’t have access to these markets directly? For example
there are lots of packing lines which are often done in the Republic of Ireland and then back to the UK via Northern Ireland. Currently this is a straightforward transfer within the process but could, following Brexit,
incur an import/export charge”
Divergence in regulatory framework (e.g. administrative approvals, compliance processes, rights of establishment and recognition of standards) is also a major risk for the industry.
“Food labelling control, public control of public procurement, health claims- getting a sensible approach to all these issue will be key. It is important we remain aligned on these issues to EU”
“Marketing regulation and particularly labelling: as we have traffic sign labelling in the UK. Uncertainty on labelling, traffic light is not a European legislation, but we think it is the direction of travel for the EU and if
the UK takes a different approach it adds uncertainty.”
“The real barriers are in regulatory framework. In the flavour industry we work with authorities 15years to develop a flavouring framework and come to terms with what we have to do, if it changes it becomes massive
issue for us, the debate about equivalency on regulation is the most important for flavouring businesses in the context of Brexit. If I want to ship outside the EU to Turkey or Egypt or other Muslim markets, the
regulatory barriers are incredibly high, halal authorising bodies charge money to approve individual product.”
83
Source: Grant Thornton survey and interviews
© 2017 Grant Thornton UK LLP. All rights reserved
FDF Economic contribution and growth opportunities | June 2017
Detailed policy development and a clear plan post 2019 could minimise negative impact on trade
Impact on trade
Some companies have engaged in detailed scenario planning, however within our sample this exercise was limited to a few companies, mainly multinationals. The majority of companies
interviewed mainly contemplated the uncertainty of the situation and complexity of the task.
“We’ve done the work on Brexit and if you take a hard Brexit scenario and break down potential impact, major risk around trade and tariffs, skills around people, financial risk on currency and further down the track
we have to look for other risks changes in taxation could be material in the future, regulatory change and agricultural subsidies”
Given the EU’s share of UK food and drink exports, continued full access to the EU market is paramount to the industry’s success. Therefore, industry leaders are calling for detailed
policy development and a clear Government plan, as lack of clarity on the structure of future regulatory framework and base from which the UK can trade with the world makes scenario
planning costly and prone to errors. However, for this to happen, the FDM industry also ahs to come together to define priorities and educate the Government on the impact that
particular scenarios would have on the industry post-UK leaving the EU.
“A clear plan is our ask from Government and a slower transition [following the two year exit negotiation] if possible.”
“The sector will have to live with uncertainty now, certainty around Brexit is a false hope. … With no idea as to the regulatory regime in place in the future it is hard to do scenario planning of trade barriers.”
“We need as an industry to engage with Government to influence the Brexit negotiations, we need to get below the very high level and obvious of continuation of free trade and as an industry we don’t have the policy skill
set you get to that level of detail, a high level set of asks will not move us very far.”
“A single market is very different to a Free Trade agreement – such an agreement would still involve import and an export arrangements and consequently costs.”
“Cut & paste EU regulations, tariffs into new law and then simplify from there, taking things our rather than adding complexity is a sensible approach.”
84
Source: Grant Thornton survey and interviews
© 2017 Grant Thornton UK LLP. All rights reserved
FDF Economic contribution and growth opportunities | June 2017
Made in Britain – on trend or outdated?
Made in Britain has long been seen as a marque of quality, in recent years however, there
appears to have been a resurgence and growing awareness of British manufactured goods,
there are numerous reasons for this.
From an international perspective Made in Britain represents quality and heritage, both of
which were buoyed by the summer of 2012 with the Queen’s Diamond Jubilee and the
London Olympics, events which demonstrated both the UK’s heritage and its modern
capabilities. British cultural exports, such as the huge international success of Downton
Abbey, have also had a significant impact on the international perception of British
manufactured products. From an economic perspective, a weaker sterling may have also
played a part, although that can have negative consequences for domestic consumers, as
one industry leader noted: “If the Pound goes down British produce becomes more attractive to other
markets, more attractive to export, but that also means the price of food in the UK may go up as the price
will be set by the export market where you divert the product.”
For the food and drink sector specifically, although certain crises like BSE continue to cast
shadows, Made in Britain represents a hallmark of safety to the international marketplace
both in terms of manufacturing processes and end product.
On a national level there are two contributing factors to the trend. The first is a greater
awareness of food miles and sustainability. Many consumers are seeking to lessen their
environmental impact and buying locally sourced and produced food is a key aspect of
that. Many of the UK’s leading supermarkets have generated positive PR stories in recent
years on account of drawing more awareness to their British-made products.
It’s hard to ignore the impact of politics on the sector. As the move towards greater
autonomy for devolved power starts to take shape it will have likely give consumers greater
awareness of their region and, arguably, will see a shift away from national to regional
politics.
85
UK’s EU exit will also play its part in shaping consumer engagement. With the 2016
referendum drawing attention to more nationalist thinking amongst a significant
proportion of consumers. As this chapter and the Skills chapter have highlighted, UK’s
EU exit presents the FDM sector with a number of challenges and opportunities but it’s
also a sector that can provide a steady supply of employment opportunities and, as we
have seen, it can, and does, make a huge impact to the UK on both a local and
regional level.
A survey of 2,000 UK consumers from Mintel in relation to food sourced and produced in
Britain (see graphs overleaf) found that when asked to agree or disagree with the statement
of : I try to buy British food whenever I can, older consumers were more likely to agree with 73%
of those aged 65+ either agreeing or strongly agreeing with the statement versus 55% of
20-24 year olds and 54% of 35-44 year olds. The regions where consumers were most
likely to buy British food correlates strongly with areas with the areas that contribute the
higher proportions of sector GVA; In the North West, 63% of consumers agreed or
strongly agreed that they bought British food wherever they could, in Yorkshire and
Humberside it was 62% and in the South East/East Anglia it was 61%. From an economic
perspective, though all household income brackets showed a willingness to buy British
food, there was a definite upswing in those willing to as household incomes rose with 64%
of consumers with a household income of between £25,000 and £49,999 agreeing or
strongly agreeing with the statement versus 50% of those with a household income of less
than £9,500.
Nevertheless, Made in Britain does have some limitations. One industry leader remarked
that; “The sector has rested on its laurels with Britishness and Made in Britain products… Consumers
want experiences, they don’t care so much if it is a British product.” He then went on to say that
although his company manufactures products that are often perceived as being
quintessentially British, they are actually made from 100% imported raw products.
Source: Grant Thornton research & analysis; Grant Thornton interviews
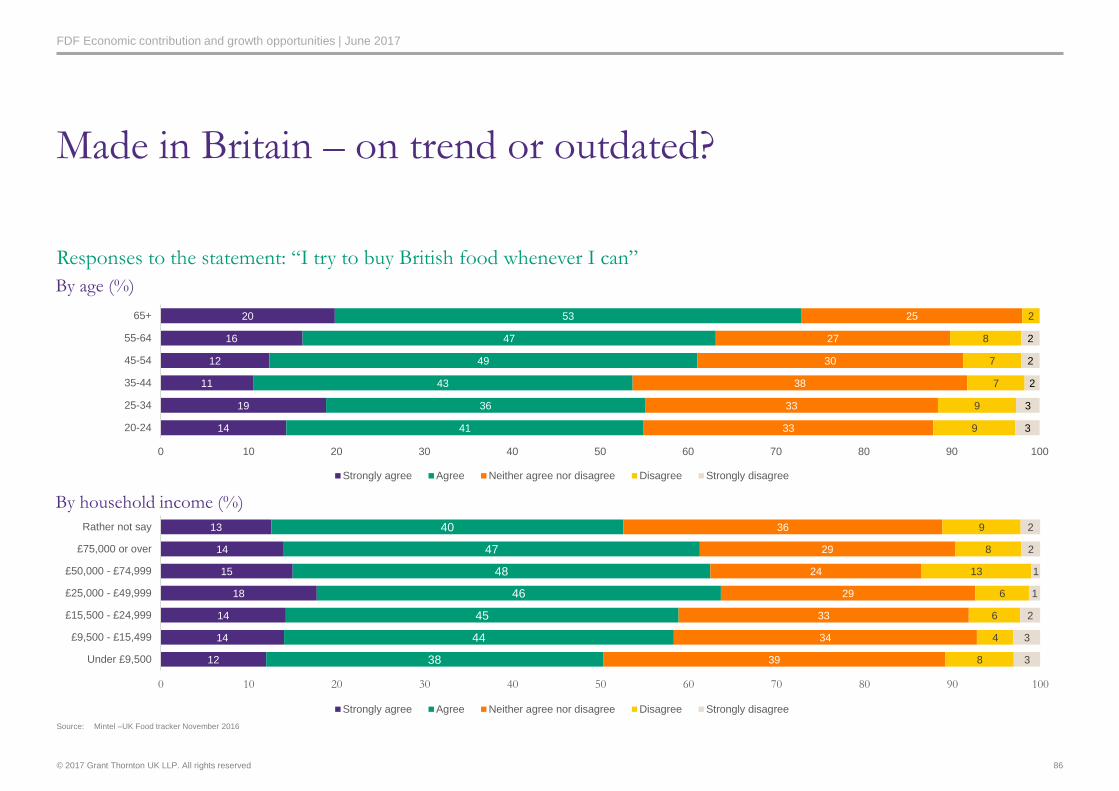
© 2017 Grant Thornton UK LLP. All rights reserved
FDF Economic contribution and growth opportunities | June 2017
12
14
14
18
15
14
13
38
44
45
46
48
47
40
39
34
33
29
24
29
36
8
4
6
6
13
8
9
3
3
2
1
1
2
2
0 10 20 30 40 50 60 70 80 90 100
Under £9,500
£9,500 - £15,499
£15,500 - £24,999
£25,000 - £49,999
£50,000 - £74,999
£75,000 or over
Rather not say
Strongly agree Agree Neither agree nor disagree Disagree Strongly disagree
Made in Britain – on trend or outdated?
Responses to the statement: “I try to buy British food whenever I can”
86
Source: Mintel –UK Food tracker November 2016
14
19
11
12
16
20
41
36
43
49
47
53
33
33
38
30
27
25
9
9
7
7
8
2
3
3
2
2
2
0 10 20 30 40 50 60 70 80 90 100
20-24
25-34
35-44
45-54
55-64
65+
Strongly agree Agree Neither agree nor disagree Disagree Strongly disagree
By age (%)
By household income (%)
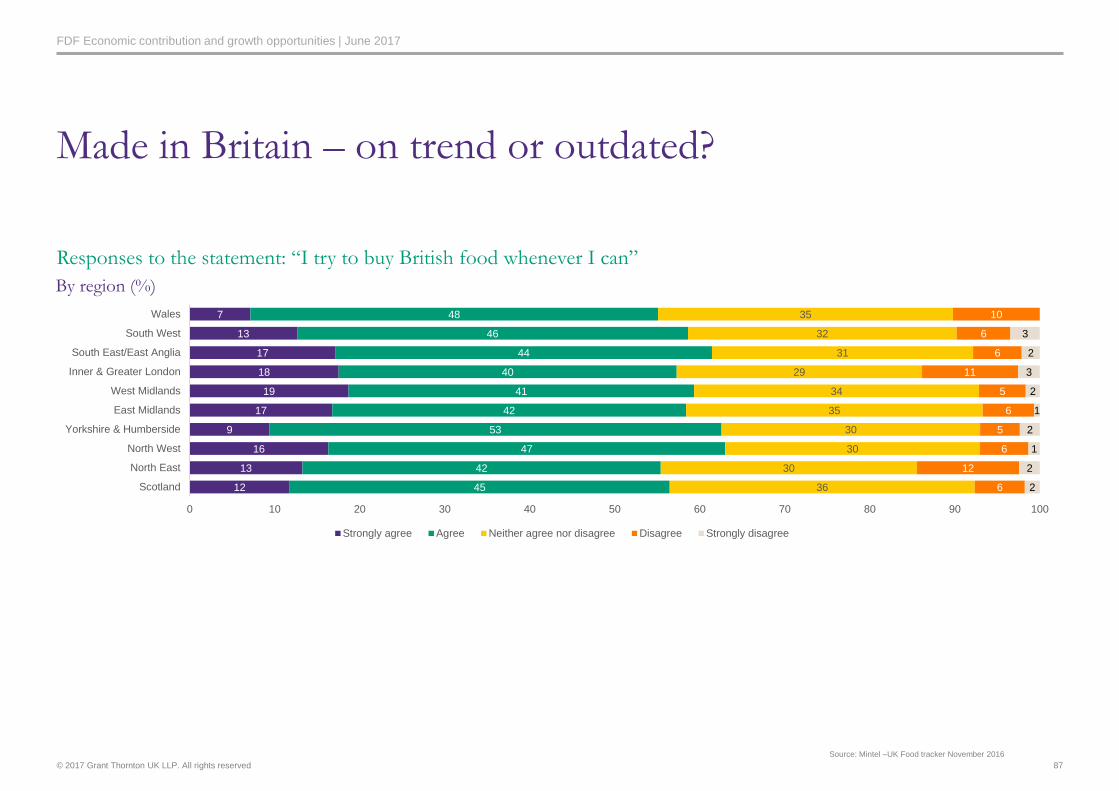
© 2017 Grant Thornton UK LLP. All rights reserved
FDF Economic contribution and growth opportunities | June 2017
Made in Britain – on trend or outdated?
Responses to the statement: “I try to buy British food whenever I can”
87
Source: Mintel –UK Food tracker November 2016
12
13
16
9
17
19
18
17
13
7
45
42
47
53
42
41
40
44
46
48
36
30
30
30
35
34
29
31
32
35
6
12
6
5
6
5
11
6
6
10
2
2
1
2
1
2
3
2
3
0 10 20 30 40 50 60 70 80 90 100
Scotland
North East
North West
Yorkshire & Humberside
East Midlands
West Midlands
Inner & Greater London
South East/East Anglia
South West
Wales
Strongly agree Agree Neither agree nor disagree Disagree Strongly disagree
By region (%)
© 2017 Grant Thornton UK LLP. All rights reserved
FDF Economic contribution and growth opportunities | June 2017
UK food and drink exports reached £20 billion for the first time in 2016. Food and drink exports are a UK success story and a sign of how highly UK products are thought of overseas,
but just one in five food and drink manufacturers currently export. The UK has 2.2% of the global food and drink export market but that share is considerably behind international rivals
such as France (4.7%) and Germany (5.6%). Currently, more than half of the UK’s exports head to EU nations, and the EEA remains the UK’s most important export market, but many
of those manufacturers surveyed are already identifying new markets. Manufacturers highlighted China, India and the UAE as the top three untapped markets they’re looking to prioritise
based on their scale, with all three nations possessing a sizeable middle class with an appetite for quality Western products.
One of the main obstacles highlighted by those manufacturers looking to export to untapped markets was the need to identify a distributor in the local market. This and other specialist
export support is more readily available to food and drink manufacturers in rival European nations, with Ireland’s Bord Bia a driving force in promoting and supporting Irish exports.
As the UK heads for a future outside the Common Agricultural Policy, it is clear from the evidence presented in this report that food and drink manufacturers are increasingly focused on
expanding into new markets. There is rising demand for UK food and drink in non-EU countries and now is the time for Government to work in partnership with industry to scale-up its
provision of specialist export support for food and drink. To take advantage of new opportunities created as the UK leaves the EU, Government should look to Bord Bia as inspiration
in creating a specialist export organisation that will turbocharge sales of UK food and drink globally and fulfil the industry’s export potential.
Conclusions and recommendations
88

© 2017 Grant Thornton UK LLP. All rights reserved | Draft
Conclusions
89
© 2017 Grant Thornton UK LLP. All rights reserved
FDF Economic contribution and growth opportunities | June 2017
Conclusion
The findings from this report provide a robust evidence base from which the FDM sector can build its economic contribution, helping the industry to identify growth opportunities for
UK food and drink manufacturing sector, as well as the obstacles that must be traversed in order to achieve this growth.
This report confirms that the food and drink industry is a truly national sector, spread throughout the country and providing jobs in every region. The sector produces a diverse range of
products, many of which are enshrined in the UK’s national identity. The result is that the UK is known throughout the world for producing delicious, high quality products. There is
huge diversity within the industry, not just in the food and drink it produces but also in terms of the skills and people required to deliver them.
The industry’s geographical spread is a key theme that runs through the report, highlighting the importance to every corner of the nation. Unlike other industries there’s no focal point
where larger manufacturers are clustered together and where educational institutes can align to the needs of a sector.
With the help of Government the sector can navigate this unique obstacle and ensure that there is the educational provisions needed to train the future workforce.
Although the industry is widely celebrated at a regional and global level, it is not an obvious destination for potential employees. The sector should look to work with Government to
enhance the image of the industry, raising awareness of the range of exciting careers on offer for all skills levels.
The proactive work industry is undertaking around innovation, particularly with regards to reformulation, is indicative of the sector’s willingness to work with Government. The industry
continues to act ahead of the curve when it comes to public health initiatives. This bodes well for future partnerships with Government, as it looks to harness the industry’s growth
potential.
With such a small proportion of food and drink manufacturers currently selling abroad, addressing the clear need for specialist export support for the industry is one of the most obvious
ways in which it can be supported to achieve growth in the short-term. This will help to drive productivity improvements in many SMEs, who represent 96 per cent of the food and drink
manufacturing sector, while developing trade relationships outside the EU in advance of leaving the EU.
Most importantly this report allows the sector to identify the huge opportunities available to it at a time of great economic uncertainty, allowing it to enhance the positive economic
contribution it makes to the UK economy. It outlines the external and internal factors to be considered and identifies the risks to growth facing the industry. The issues facing the food
and drink industry are complex but by working in partnership with Government, clear and simple solutions can be identified allowing the industry to achieve its full potential.
Harnessing the growth of the UK’s largest manufacturing sector has the capability to increase prosperity both now, over the next decade and beyond.
90

‘Grant Thornton’ refers to the brand under which the Grant Thornton member firms provide
assurance, tax and advisory services to their clients and/or refers to one or more member
firms, as the context requires.
Grant Thornton UK LLP is a member firm of Grant Thornton International Ltd (GTIL). GTIL
and the member firms are not a worldwide partnership. GTIL and each member firm is a
separate legal entity. Services are delivered by the member firms. GTIL does not provide
services to clients. GTIL and its member firms are not agents of, and do not obligate, one
another and are not liable for one another’s acts or omissions.
grantthornton.co.uk
© 2017 Grant Thornton UK LLP. All rights reserved | Draft


