1 FDI and Urban Inequality: Evidence from Chinese Cities Anders Johansson SCERI, Stockholm School of Economics Dan Liu Shanghai University of Finance and Economics & SCERI, Stockholm School of Economics Maosheng Zhen Shanghai University of Finance and Economics (Very preliminary, please don’t circulate) Abstract In this paper we examine the relationship between FDI and city-level income inequality. We calculate the measures of within-city income inequality for 227 Chinese cities. It is found that FDI penetration is positively and significantly correlated with within city inequality, which is mainly due to the strong and positive correlation between skill premium and FDI penetration. We identify the causal relationship between college premium and FDI penetration using foreign culture influence in the history as instrument variable. Furthermore, we provide individual-level and firm-level evidence to support our main findings. Also, we explore the potential channels through which FDI can affect skill premium, and find that both composition and agglomeration effects exist. Keywords: FDI; inequality; China JEL classification: F21; R12; O18
Transcript
1
FDI and Urban Inequality: Evidence from Chinese Cities
Anders Johansson
SCERI, Stockholm School of Economics
Dan Liu
Shanghai University of Finance and Economics & SCERI, Stockholm School of Economics
Maosheng Zhen
Shanghai University of Finance and Economics
(Very preliminary, please don’t circulate)
Abstract
In this paper we examine the relationship between FDI and city-level income
inequality. We calculate the measures of within-city income inequality for 227
Chinese cities. It is found that FDI penetration is positively and significantly
correlated with within city inequality, which is mainly due to the strong and positive
correlation between skill premium and FDI penetration. We identify the causal
relationship between college premium and FDI penetration using foreign culture
influence in the history as instrument variable. Furthermore, we provide
individual-level and firm-level evidence to support our main findings. Also, we
explore the potential channels through which FDI can affect skill premium, and find
that both composition and agglomeration effects exist.
Keywords: FDI; inequality; China
JEL classification: F21; R12; O18
2
1. Introduction
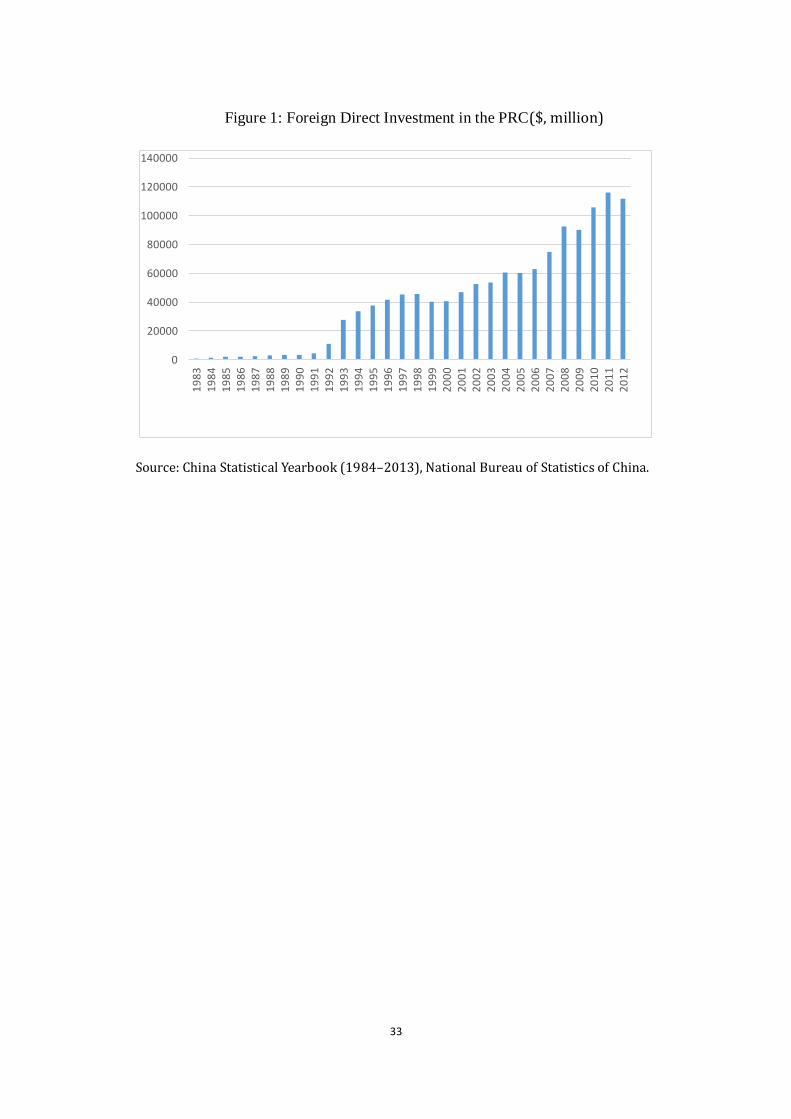
It has been over three decades since the People’s Republic of China (PRC)
implemented the reforms and opening-up policy. Figure 1 shows that there is a
strikingly increasing trend in FDI inflows since the 1980s. In 2012, China has
surpassed the United States for the first time since 2003 to be the world's largest
recipient of global foreign direct investment. Since the 1990s, foreign direct
investments have been playing a more and more important role in China’s economic
development.
Meanwhile, inequality is a serious problem and urgent to tackle in China’s
development. China was a fairly equal society at the beginning of the economic
reform in the early 1980s, when the Gini coefficient was less than 0.3 (Wan, Ye and
Zhuang, 2012). Although the recent 5 years see a slight decline in overall Gini, the
Gini coefficient reached a high level of 0.474 in 2012. The interregional convergence
of per capita income narrows the overall country inequality (Gustafsson, Li and
Sicular, 2008), while the inequality of urban people has kept rising significantly
(Ravallion and Chen, 2007; Lin et al., 2010). However, there is no literature to study
how within-city inequality is affected by FDI inflows in China, which is the gap this
paper fills. In particular, as the urbanization process is going deeper over time, the
policy relevance of analyzing within-city inequality should become increasingly
significant.
There have been a large number of studies on this issue in the literature, but most
of them examine country-level variation or cross-region inequality. Lessnann (2013)
3
finds that FDI increases regional inequality depending on economic development, and
expands regional inequality in poor countries, which has no significant effect in
high-income countries with higher mobility and better policies. Wei, Yao and Liu
(2009) argue that it is not FDI, but the uneven distribution of FDI that contributes to
the increase in regional inequality. Lin, Kim and Wu (2013) examine the distributional
effects of FDI using a cross-country panel data. It is found that there is a
non-monotonic impact of FDI on income inequality, depending on the level of human
capital. Basu and Guariglia (2007) find that FDI promotes both growth and inequality
using country-level data. Pica and Mora (2011) establish a theoretic model on FDI
and income. The model predicts that FDI benefits the high- and low-income workers,
but makes the middle-income workers worse off. This implies that the relationship
between FDI and total income inequality could be ambiguous or non-monotonic.
A number of studies have analyzed the relationship between FDI and
inter-provincial inequality in China. Sun and Chai (1998) investigate the effect of
FDI on growth in the eastern and western province from 1986 to 1992. They find a
growing effect of FDI in the east, but only weak effects in the west and conclude that
FDI has contributed to the rise of regional inequality in China. Wan, Lu and Chen
(2007) investigate the impacts of FDI on regional income inequality in China, and
find that FDI contributes to the rising of income inequality across regions. This paper
complements to these literature by investigating within-city inequality and FDI
penetration.
4
In this paper, we focus on the impacts of FDI on local income inequality at city
level. We first construct the measures of income inequality for each city using
individual information from 2005 min census and then investigate the relationship
between FDI penetration and within city inequality. The main difficulty is to establish
the causal impact of FDI due to the endogeneity issue. We adopt a novel instrumental
variable by exploiting the historical distribution pattern of converts in China. The fact
that the spread of church activities was not only determined by geographic or
economic reasons, but also exogenous natural disasters, such as floods, draughts or
diseases makes it an valid instrument variable for FDI. In addition to the IV approach,
we also provide evidence using individual level information to further support our
main findings.
After the causal impact of FDI on inequality is established, we explore the
potential mechanisms based on the existing literatures using both individual and firm
level information. First, consistent with Feenstra and Hanson (1997), which find that
growth in FDI is positively correlated with the relative demand for skilled labor in
Mexico, we find that FDI firms on average employ relative more skilled workers.
Also, our results show that FDI has wage spillover effects on both FDI firms and
domestic firms, and the impact on FDI firms is much higher than domestic firms.
Second, we find that the agglomeration effect of FDI on individual wages exists and
skilled workers benefit more from it. This is consistent with Hale and Long (2011),
which documents the presence of FDI in the same industry and region has an indirect
effect on wage of skilled workers in private firms.
5
In addition, this paper is also inspired by the recent literature on globalization and
local labor markets. Autor, Dorn and Hanson (2013) study the impact of import
competition from China exports on local employment in the U.S. Autor, Dorn,
Hanson and Song (2014) examine how workers adjust to trade from China. While this
line of researches focus on the impacts of international trade, little attention has been
paid to how FDI can affect local labor market outcomes. This paper focus on how FDI
penetration affects local inequality.
The following sections are organized as below: Section 2 describes the data sets
used in the paper and provides some preliminary patterns. Section 3 shows the main
empirical results. In the section 4, we explore the potential mechanisms. Section 5
concludes the paper.
2. Data and Measures of Inequality
2.1 Data
Our data comes from China's population survey in 2005 conducted by National
Bureau of Statistics (NBS),which is the largest Chinese dataset available with
individual income information. The survey is nationally representative, whose
respondents are randomly selected from each of China 2,861 counties using a
three-stage cluster sampling method (Zhang et al. 2005). Our sample is a subset of the
original survey, which contains 2,585,481 observations that is randomly drawn from
NBS dataset.
In this paper, we use cities in 2005 as our geographic units and Theil Index as the
main measure of inequality. For the whole paper, we focus on the observations older
6
than 15 and younger than retiring ages, 55 for women and 60 for men. Also, we
consider the persons who had a job at the time when he/she was interviewed.
Moreover, since our main interest is within city wage inequality, we conclude all local
people living in the city when calculating inequality measures. The Hukou or
household registration system is a system under which each Chinese got an identity
according to his/her birthplace.1 The very strict hukou system separates people into
two groups, those with urban hukou identity and those with rural hukou identity. Only
people with rural hukou have been assigned farmland. For people living in city with
rural hukou, it’s more likely that workers usually work in urban area since they are
separated from their farmland. However, another part of city population work in the
city has not local urban houkou, but other urban houkou. We call both these people as
migrants. In this paper, all the measures of within city wage inequality are calculated
using information of individuals with local urban hukou or migrants2 in each city.
There are 339 cities in the Census data, including four municipalities and 335
prefecture-level cities. The data of city size, measured by number of residents in the
city, comes from China City Statistical Yearbooks. There are 227 cities left after
merging census data with city data, as population size is missing for some small
cities3.
2.2 Measure of inequality
1 Please refer to Liu (2005), Chan and Buckingh (2008), Chan (2009), and Lu et al. (2013) for introduction of both
the history and the reform of the Hukou system. 2 We also constructed inequality measures only considering people with urban hukou, and the results are similar. 3 The cities with missing population size data are not 'real cities' in economic sense, as their population size are
too small. Instead, they are administrative units, which are named as Zizhizhou or Meng rather than cities in
Chinese. Based on 2005 census data, the average sample size of the cities with missing population size is 389,
while the average sample size of the cities with non-missing population size is 1299.
7
We use Theil Index as the measure of inequality mainly because it is a
commonly used measure in the literature, and it suits for decomposition. Theil index
is defined as
where is the mean income in the sample, represents individual’s income
and N is the number of people in the population. It is invariant with respect to scale,
which means that it would not change for a proportional increase in income for
everyone or a change in population. Additionally, it can be decomposed into
inequality within some subgroups and inequality across these subgroups. These
characteristics make it attractive for our main focus on city size and inequality.
Overall inequality can be decomposed into two aspects: between-group inequality
and within-group inequality. Between-group inequality describes the difference in
income between people with different characteristics, such as education, age, race and
gender, while within-group inequality describes the difference in income between
people with similar observable characteristics. Residual income inequality is
commonly used as a measure of within-group inequality in the literature. A Mincer
regression is always employed to calculate residual inequality. Specifically, residual
wage inequality is calculated from the residuals of a regression of log wages on a set
of age, squared age, education dummies, race dummy, sex dummy and marriage status
dummy. Mincer regression is run for each city, and then, city-level residual wage
inequality is calculated by taking the average of the square of residuals for all workers
within each city.
8
Regarding between-group inequality, we focus on the income difference arising
from education. There are three reasons for emphasizing education: first, education
accounts for a significant part in income inequality, around 18% of the variation in
income comes from human capital; second, it can be shown that the variation in
education compositions across cities is relatively bigger than other aspects; third,
human capital is more relevant in terms of policy implications.
2.3 Measures of FDI penetration
Two sources of FDI information are explored in this paper: one is City Statistics
Yearbooks, and the other is the Annual Surveys of Manufacturing. With both sources,
we combine foreign investment with Hong Kong, Macao and Taiwan (HKMT)
investment and use the sum of these two as our definition of FDI in this paper. In City
Statistics Yearbooks, there is information on the number of foreign/HKMT firms and
revenues from foreign/HKMT firms. We construct two measures of FDI penetration
from this: the share of the number of FDI firms in total number of firms and the share
of FDI revenues in total outputs. In addition, we calculate the share of FDI in total
capital and the share of FDI employment in total employment from Annual Surveys of
Manufacturing. We use the share of FDI in total capital as our main measure of FDI
penetration.
3. FDI and urban inequality
3.1 Empirical specification
The equation we estimate is straightforward:
9
where is the degree of income inequality in city i. We use Theil index as
the measure of overall inequality.4 FDI penetration is the degree of influence of
foreign capital in city economy. represents city-level control variables, such as city
size, average income and regional fixed effects.
Our goal is to identify the causal effect of FDI on city inequality and the main
concern is the endogeneity issue. There are three potential reasons for endogeneity
here: First, measurement errors in inequality that are correlated with city
characteristics, such as city size and per capita income, can lead to endogeneity. Our
main measures of inequality are calculated from census data. As in any other census,
there is an upper bound in income which could cause underestimation of inequality,
and the magnitude of this error could be bigger in larger or richer cities. The literature
has shown that market size is one of the main determinants of FDI location choice.
This would lead to an overestimate of the effect of FDI on inequality. Second, FDI
and inequality could be simultaneously determined by some underlying city
characteristics, such as geographic location, city size, human capital endowment and
so on. Third, inequality itself could affect FDI location.
To deal with these issues, we first control for city characteristics that can
determine FDI location choice. Cheng and Kwan (2000) study the location pattern of
FDI firms in China and find that market size, infrastructure, wage cost and education
are the main determinants of FDI inflows. Therefore, we control for city size, average
income, infrastructure and education. Furthermore, we also control for government
4 It can be shown that our basic results still exist if we use alternative measures of inequality.
10
policy, industry compositions and regional fixed effects. This will also help minimize
the possibility that these characteristics can affect FDI and some other aspects of the
economy at the same time and thus lead to a positive correlation between FDI and
inequality. One consideration here is that the effect of FDI and international trade
could be mixed together. Here, we could not separate the impact of FDI and
international trade completely since FDI could affect inequality through its role on
promoting international trade.
Moreover, we adopt an instrument-variable approach to further deal with the
endogeneity issue caused by measurement errors and reversed causality. Our
instrument variable is the degree of foreign culture influence in the history. This is
inspired by the literature on history and economic development as reviewed
thoroughly by Nunn (2009). We use the share of primary students from missionary
schools in total population in the 1920s as the exclusive instrument variable for FDI
penetration. The information comes from The Christian Occupation of China, which
contains detail county-level data on the numbers of Protestant converts, missionaries,
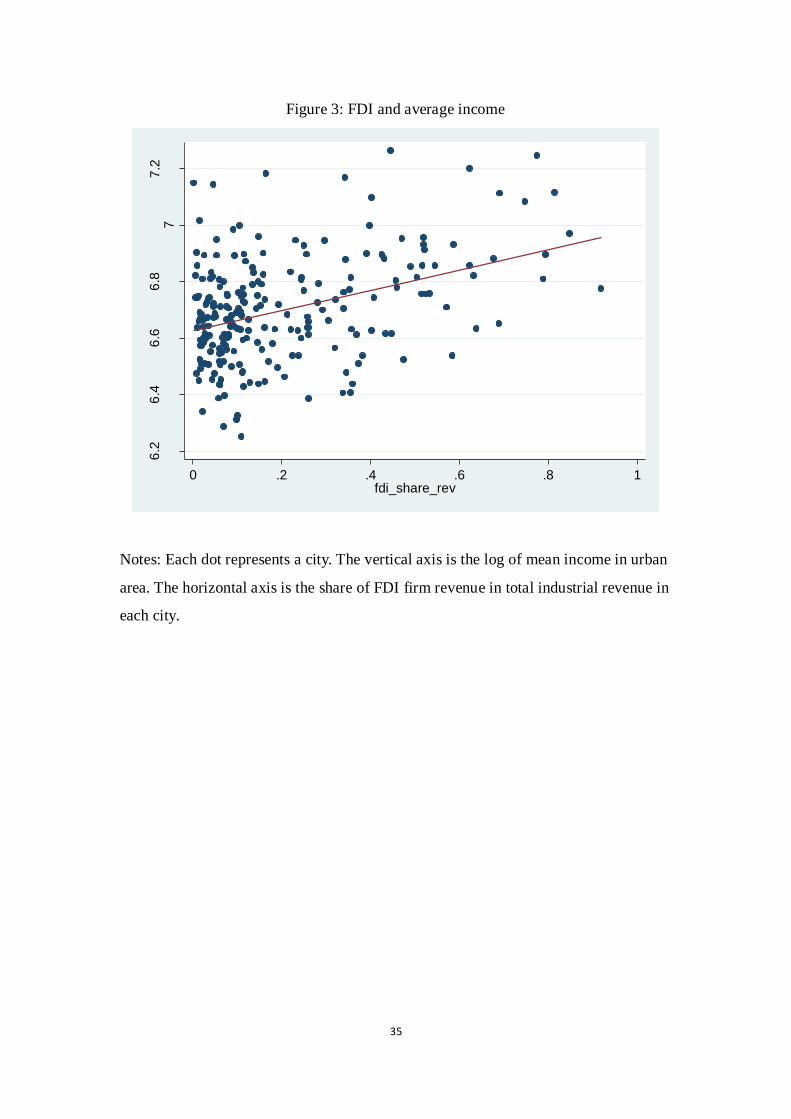
and churches in 1920s. We match these data with current city-level data. As can be
seen from Figure 3, missionary school penetration is significantly and positively
correlation with FDI penetration in 2005. The first stage regression in Table A.1
further confirms this correlation. Figure 4 shows the geographic pattern of missionary
school penetration. As expected the degree of Christian penetration is relatively high
along the coastal regions since these areas were more open to foreigners in the history
due to treaty ports and being occupied by foreign countries. However, some inland
11
regions also experienced very high level of Christian penetration because missionaries
targeted some regions on purpose to help local residents through natural disasters,
such as floods, draughts and pestilence. This pattern can work like exogenous shocks
and make this variable valid as an instrument variable. In addition, the Christian
distribution in 1920s, which is more than half a century prior to the beginning of
reform and openness, should not have any direct effects on the local income
inequality in the 2000s. One concern on its validation as IV is that foreign culture
influence can have long-run impacts on inequality through other aspects, such as
institution and migration. However, since we have controlled institution, city size and
average income. This issue could be minimized already.
3.2 OLS results
Table 1 reports the OLS results on overall inequality, within inequality and
between inequality. Regional fixed effects are controlled for in all regressions. The
first three columns show the results for overall inequality measured by Theil Index. In
column 1, it can be seen that the correlation between FDI and inequality is positive
and significant. Column 2 shows that when market size and average wage are
controlled for, the coefficient on FDI penetration decreases by almost a half but still
significant. In column 3, other city characteristics are further controlled for and FDI
penetration is still significant correlated with inequality. Column 4 shows that this
positive correlation is not due to the connection between within-group inequality,
measured by residual inequality, and FDI. In the last two columns, high-school
premium and college premium are examined. It can be seen that the correlation
12
between college premium and FDI is much stronger and significant than that between
high-school premium and FDI. This implies that FDI is more likely to affect overall
inequality through its impact on college premium. Therefore, in the following analysis,
we focus on establish the causal effect of FDI on college premium.
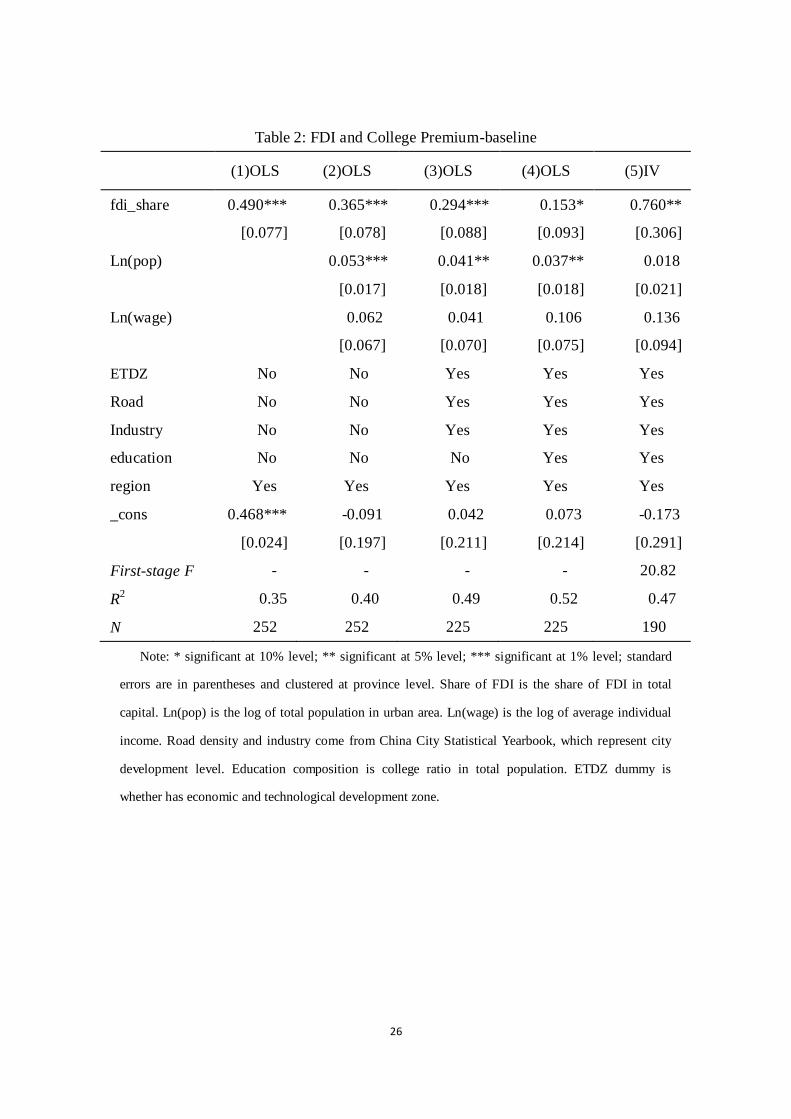
3.3 2SLS results on college premium
Table 2 reports the results on college premium and FDI. The first four columns
show the step-by-step results from OLS regressions. The purpose is to show how the
coefficient on FDI changes as more variables are controlled for. Column 2 shows that
when city size and wage are controlled for, the coefficient on FDI drops by about 25%.
This implies that our consideration that market size and wage level can determine
both college premium and FDI at the same time is reasonable. In column 3, it can be
seen that the coefficient further decreases by 20% when policy, infrastructure and
industrial compositions are controlled for. In column 4, education composition,
measured by the share of workers with some college education, is added into the
regression. The coefficient on FDI becomes only a half of that in column 3, but it is
still significant at 10% level. Since relative supply of skilled labor is one crucial
determinant of college premium, this result is not surprising. Especially, FDI can
affect skill premium by changing the relative demand of skilled labor. Therefore, the
result in column 4 actually underestimates the impact of FDI on skill premium.
In the last column, result from IV regression is reported. As expected, the
coefficient on FDI becomes bigger than in Column 4. This means that FDI penetration
does contribute to expanding college premium. The first-stage F-statistics is 20.82,
13
which indicates that weak instrument variable problem is not a big issue here. One
thing that should be noted that the historical date is only available for 190 cities,
which means that the very small cities are not included in the analysis. In Table 3,
three alternative measures of FDI penetration are used and the analysis in Table 2 is
repeated using each of these measures. Both OLS and IV results are provided. It can
be seen that the results are consistent with our earlier findings.
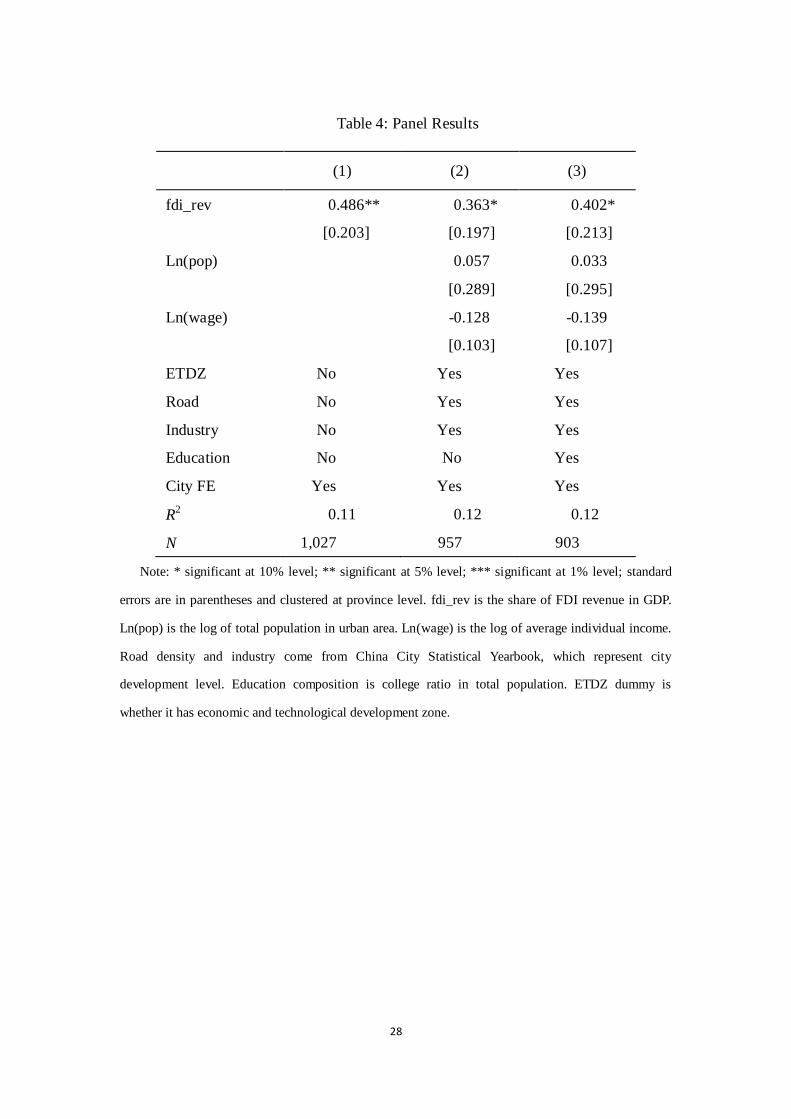
Moreover, we construct a panel data set and control for city fixed effects to avoid
the potential issues of simultaneity and missing variables caused by city
characteristics that don’t change over time, such as geographic location and so on. We
calculate city-level college premiums using information from Urban Household
Surveys for 16 provinces from 2000 to 2009. FDI penetration is measured by the ratio
of revenues from FDI firms to GDP from City Statistic Year Books. It can be seen that
the results are quite similar.
3.4 Micro-level evidence
The city-level evidence in the previous subsection suggests that overall income
inequality in areas with more FDI generally is higher, especially college premium. As
discussed above, one limitation of this analysis is the measurement error in inequality
and the exclusion of small cities in the analysis. To further establish our results, we
provide some more evidence in this section using both individual level and firm level
data.
The advantage of using individual level information is that we can control for
wage inequality caused by other individual characteristics better. Also, we could deal
14
with industry and occupation variation better. We explore the augmented Mincer wage
equation as below:
where is the log of wage income for individual i in city c. is an
indicator variable equal to 1 if worker has some college or above.
is measured by the share of workers of FDI firms in industrial firms in city c.5 is
a set of individual characteristics, including age, squared age, sex dummy and
marriage status dummy, is city fixed effect. Moreover, we control for industrial
dummies and occupation dummies. is the random error term.
The results from both the OLS and the 2SLS estimations are presented in Table 5.
Column 1 shows that income of workers with college education is about 41% higher
than those without any college education, after controlling for individual
characteristics and city fixed effects. After adding the FDI penetration and the
interaction term into the regression, the coefficient of the interaction term suggests,
given the same education level, FDI penetration in city significantly increases the
college premium. The results are robust after the city-level characteristics controlled
for and using instrumental strategy.
4. Discussion on Mechanisms
We focus on mainly three potential channels through which FDI can affect skill
premium: first, FDI can increase skill premium by simply offering relatively more
5 We first regress FDI share on other city level controls used in Table 2, and then use the residuals in the Mincer
regression to avoid simultaneity and missing variable issues.
15
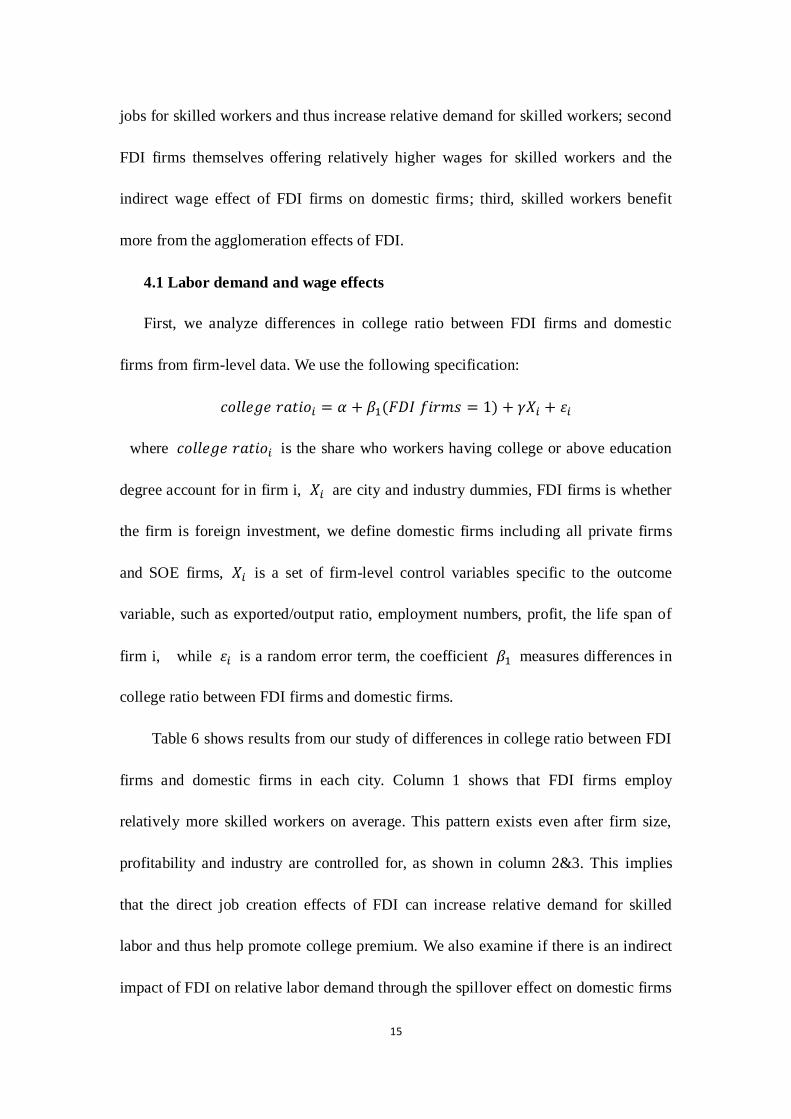
jobs for skilled workers and thus increase relative demand for skilled workers; second
FDI firms themselves offering relatively higher wages for skilled workers and the
indirect wage effect of FDI firms on domestic firms; third, skilled workers benefit
more from the agglomeration effects of FDI.
4.1 Labor demand and wage effects
First, we analyze differences in college ratio between FDI firms and domestic
firms from firm-level data. We use the following specification:
where is the share who workers having college or above education
degree account for in firm i, are city and industry dummies, FDI firms is whether
the firm is foreign investment, we define domestic firms including all private firms
and SOE firms, is a set of firm-level control variables specific to the outcome
variable, such as exported/output ratio, employment numbers, profit, the life span of
firm i, while is a random error term, the coefficient measures differences in
college ratio between FDI firms and domestic firms.
Table 6 shows results from our study of differences in college ratio between FDI
firms and domestic firms in each city. Column 1 shows that FDI firms employ
relatively more skilled workers on average. This pattern exists even after firm size,
profitability and industry are controlled for, as shown in column 2&3. This implies
that the direct job creation effects of FDI can increase relative demand for skilled
labor and thus help promote college premium. We also examine if there is an indirect
impact of FDI on relative labor demand through the spillover effect on domestic firms
16
and no significant spillover effect on labor employment is found.
Next, we investigate the wage effect of FDI penetration. Ideally, it would be
interesting to see how within-firm skill premium is related to FDI penetration.
Unfortunately, it’s not feasible with the available data. Here, we focus on the
connection of average firm wage is affected by FDI penetration and how it is related
to firm skill intensity. We employ the estimation model as follows:
where is average wage of firm j in the city c. is still
measured by the share of worker number of FDI firms in industrial firms in city c.
is an indicator variable for the ratio of workers with college degree
and above in firm j. We add the interaction term of and
. is a set of firm characteristics, including firm size and firm
profitability, which is the ratio of operating profit to total operating income of firm j ,
is city fixed effect controlling for the average effect of city characteristics on
income. We also control for industrial dummies.
The results are reported in Table 7. The first three columns show the results from
OLS for all firms, FDI firms and domestic firms respectively, and the last three
columns show the results from 2SLS estimations. It can be seen from column (1) that
FDI penetration has positive impact on average wage, and the impact is bigger for
more skill intensive firms. Column (2) and (3) show that, the influence of FDI
17
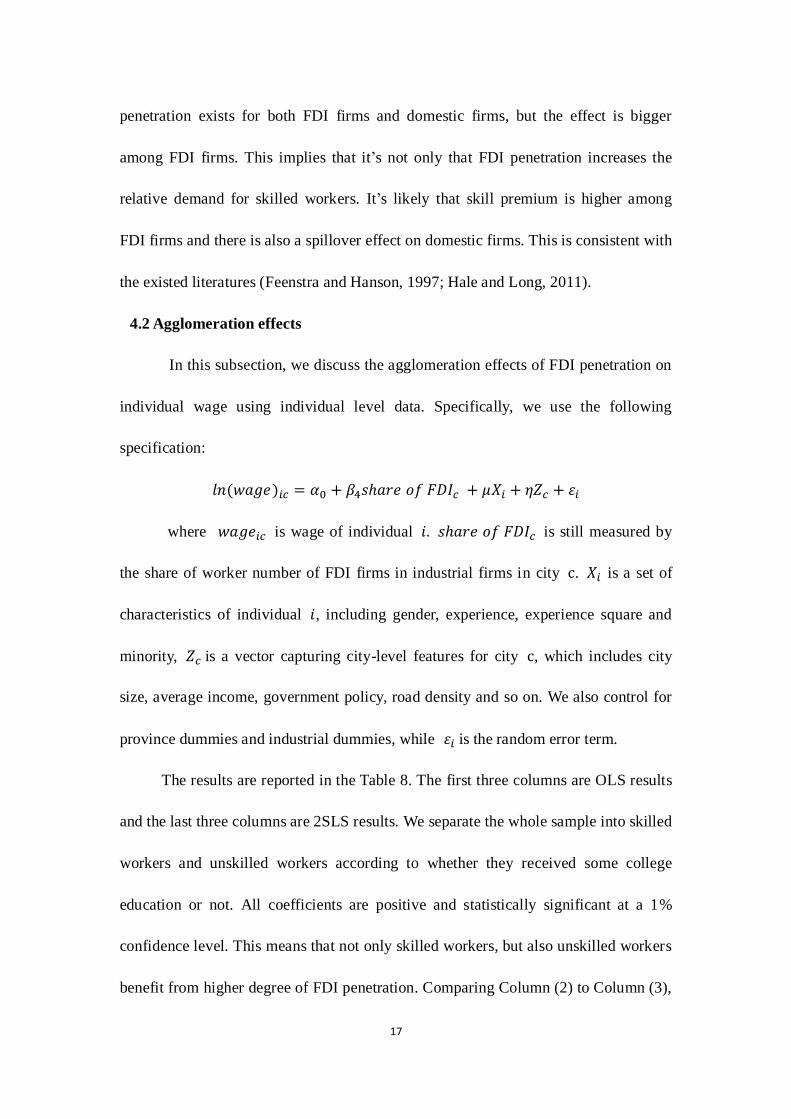
penetration exists for both FDI firms and domestic firms, but the effect is bigger
among FDI firms. This implies that it’s not only that FDI penetration increases the
relative demand for skilled workers. It’s likely that skill premium is higher among
FDI firms and there is also a spillover effect on domestic firms. This is consistent with
the existed literatures (Feenstra and Hanson, 1997; Hale and Long, 2011).
4.2 Agglomeration effects
In this subsection, we discuss the agglomeration effects of FDI penetration on
individual wage using individual level data. Specifically, we use the following
specification:
where is wage of individual is still measured by
the share of worker number of FDI firms in industrial firms in city . is a set of
characteristics of individual , including gender, experience, experience square and
minority, is a vector capturing city-level features for city , which includes city
size, average income, government policy, road density and so on. We also control for
province dummies and industrial dummies, while is the random error term.
The results are reported in the Table 8. The first three columns are OLS results
and the last three columns are 2SLS results. We separate the whole sample into skilled
workers and unskilled workers according to whether they received some college
education or not. All coefficients are positive and statistically significant at a 1%
confidence level. This means that not only skilled workers, but also unskilled workers
benefit from higher degree of FDI penetration. Comparing Column (2) to Column (3),
18
we find that, skilled workers benefit more from FDI penetration than unskilled
workers, which can cause higher skill premium within a city. The instrument variable
results further confirm this finding.
5. Concluding remarks
In this paper, we focus on the impacts of FDI on local income inequality on
city-level. First, we find that FDI penetration is positively and significantly correlated
with within city inequality after controlling for city characteristics. Also, the
connection between FDI penetration and skill premium is much stronger than that
with residual inequality. Second, we establish a causal relationship between FDI
penetration and college premium using a novel instrument variable approach. Finally,
we explore the potential mechanisms and find that not only the direct impact on job
creation matters. FDI actually has positive wage spillover effect on domestic firms
and agglomeration effect on both skilled workers and unskilled workers.
References (in complete)
Afridi, Farzana, Li, Sherry X., Ren, Yufei, 2010. Social Identity and Inequality: The Impact of China’s
hukou System. IZA DP No. 6417.
Au, Chun-Chung, Henderson, J. Vernon, 2006a. Are Chinese Cities Too Small? Review of Economic
Studies, 73(3), pp. 549-576.
Au, Chun-Chung, Henderson, J. Vernon, 2006b. How Migration Restrictions Limit Agglomeration and
Productivity in China, Journal of Development Economics, 80, pp. 350-388.
19
Autor, D., Katz, F., Kearney, M, 2008. Trends in U.S. Wage Inequality: Revising the Revisionists,
Review of Economics and Statistics, pp 300-323.
Baum-Snow, N., R. Pavan, 2013. Inequality and City Size, The Review of Economics and Statistics,
95(5), pp. 1535-1548
Basu, P., Chakraborty, C., & Reagle, D. (2003). Liberalization, FDI, and growth in developing
countries: A panel cointegration approach. Economic Inquiry, 41, 510–516.
Bernard, Andrew B., Jensen, Bradford J., 1999. Exceptional exporter performance: cause, effect, or
both? Journal of International Economics, 47(1), pp. 1-25.
Bengoa, M., & Sanchez-Robles, B. (2003). Foreign direct investment, economic freedom and growth:
New evidence from Latin America. European Journal of Political Economy, 19, 529–545.
Blonigen, B. A., & Figlio, D. N. (1998). Voting for protection: Does foreign direct investment influence
legislator behavior?. American Economic Review, 88, 1002–1014.
Cai, Hongbin, Chen, Yuyu, Zhou, Li-an, 2010. Income and consumption inequality in urban China:
1992–2003. Economic Development and Cultural Change, 58, pp. 385–413.
Chan, K. W., 2009. The Chinese Hukou system at 50. Eurasian Geography and Economics
50(2):197–221.
Chan, K. W., Buckingham, W., 2008. Is China abolishing the Hukou system? The China Quarterly
195(1):582-605.
Chan, Kam Wing, Zhang, Li, 1999. The Hukou System and Rural-urban Migration: Processes and
Changes, The China Quarterly, 160(1), pp. 818-855
Demurger, S., Gurgand, M., Li, S., & Yue, X. (2009). Migrants as second-class workers in urban China?