49

377
600
0
200
400
600
800
2011 2031
2011 2031
4
25
0
10
20
30
FY2012 FY2022
FY2012 FY2022
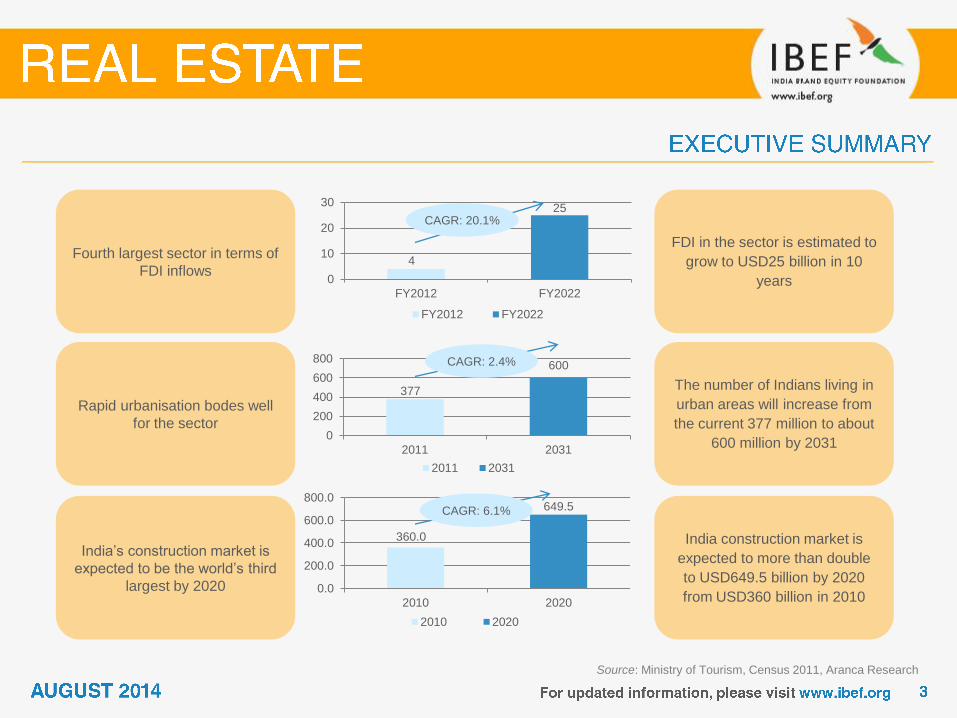
Source: Ministry of Tourism, Census 2011, Aranca Research
CAGR: 2.4%
360.0
649.5
0.0
200.0
400.0
600.0
800.0
2010 2020
2010 2020
CAGR: 6.1%
CAGR: 20.1%
Fourth largest sector in terms of
FDI inflows
Rapid urbanisation bodes well
for the sector
India’s construction market is
expected to be the world’s third
largest by 2020
FDI in the sector is estimated to
grow to USD25 billion in 10
years
The number of Indians living in
urban areas will increase from
the current 377 million to about
600 million by 2031
India construction market is
expected to more than double
to USD649.5 billion by 2020
from USD360 billion in 2010

Growing demand
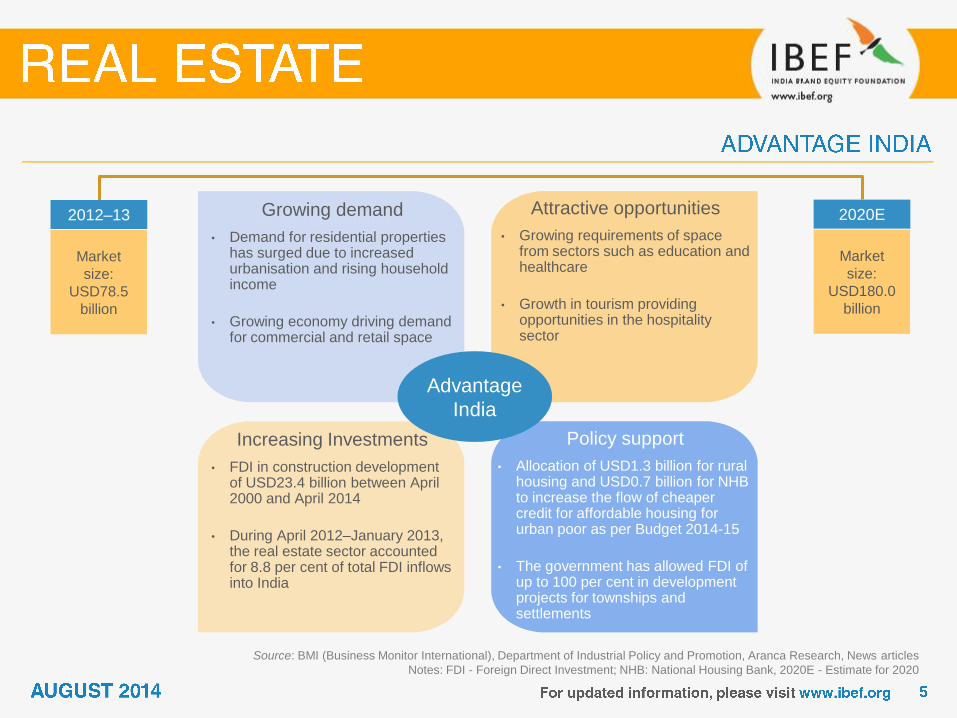
Source: BMI (Business Monitor International), Department of Industrial Policy and Promotion, Aranca Research, News articles
Notes: FDI - Foreign Direct Investment; NHB: National Housing Bank, 2020E - Estimate for 2020
Growing demand
• Demand for residential properties has surged due to increased urbanisation and rising household income
• Growing economy driving demand for commercial and retail space
Attractive opportunities
• Growing requirements of space from sectors such as education and healthcare
• Growth in tourism providing opportunities in the hospitality sector
Policy support
• Allocation of USD1.3 billion for rural housing and USD0.7 billion for NHB to increase the flow of cheaper credit for affordable housing for urban poor as per Budget 2014-15
• The government has allowed FDI of up to 100 per cent in development projects for townships and settlements
Increasing Investments
• FDI in construction development of USD23.4 billion between April 2000 and April 2014
• During April 2012–January 2013, the real estate sector accounted for 8.8 per cent of total FDI inflows into India
2012–13
Market
size:
USD78.5
billion
2020E
Market
size:
USD180.0
billion
Advantage
India

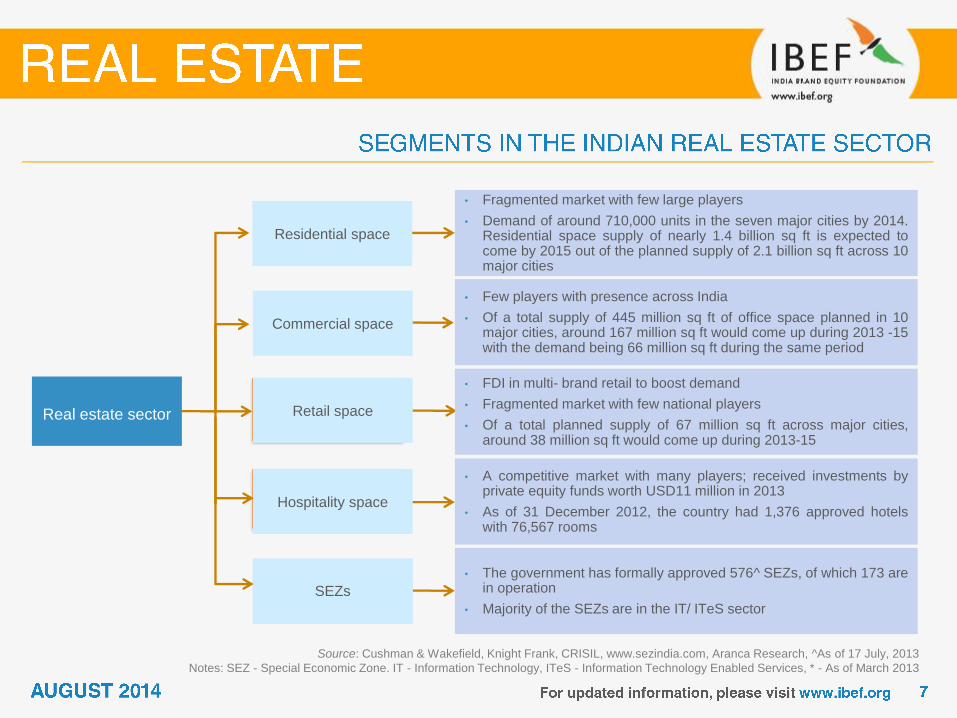
• Fragmented market with few large players
• Demand of around 710,000 units in the seven major cities by 2014. Residential space supply of nearly 1.4 billion sq ft is expected to come by 2015 out of the planned supply of 2.1 billion sq ft across 10 major cities
Real estate sector
Commercial space
Retail space
Hospitality space
SEZs
• Few players with presence across India
• Of a total supply of 445 million sq ft of office space planned in 10 major cities, around 167 million sq ft would come up during 2013 -15 with the demand being 66 million sq ft during the same period
• FDI in multi- brand retail to boost demand
• Fragmented market with few national players
• Of a total planned supply of 67 million sq ft across major cities, around 38 million sq ft would come up during 2013-15
• A competitive market with many players; received investments by private equity funds worth USD11 million in 2013
• As of 31 December 2012, the country had 1,376 approved hotels with 76,567 rooms
Residential space
Source: Cushman & Wakefield, Knight Frank, CRISIL, www.sezindia.com, Aranca Research, ^As of 17 July, 2013
Notes: SEZ - Special Economic Zone. IT - Information Technology, ITeS - Information Technology Enabled Services, * - As of March 2013
• The government has formally approved 576^ SEZs, of which 173 are in operation
• Majority of the SEZs are in the IT/ ITeS sector
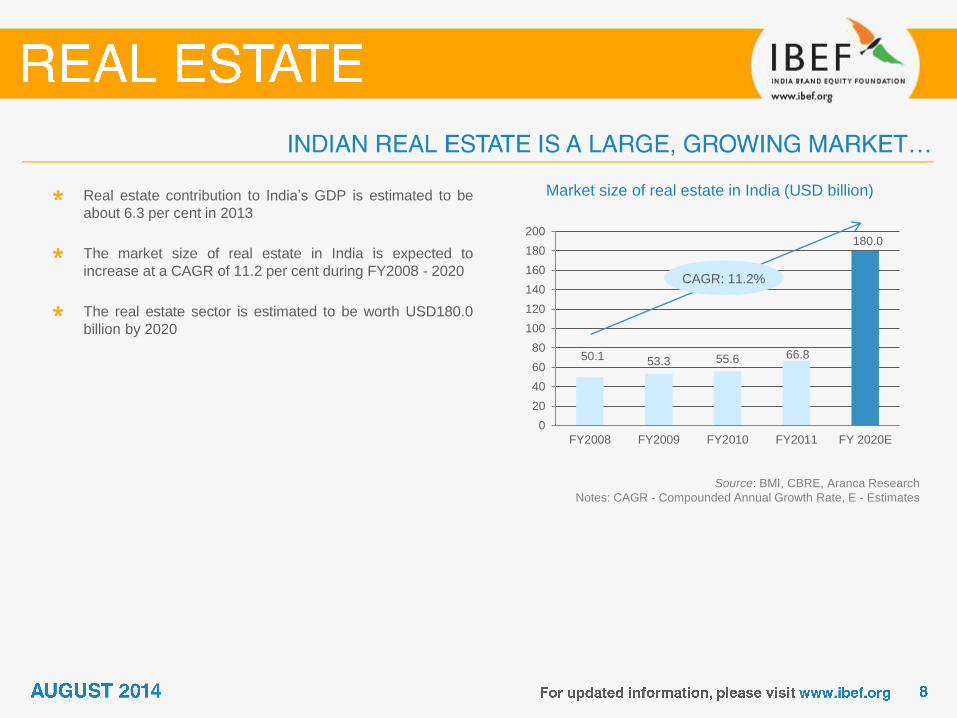
50.1 53.3 55.6 66.8
180.0
0
20
40
60
80
100
120
140
160
180
200
FY2008 FY2009 FY2010 FY2011 FY 2020E
Market size of real estate in India (USD billion) Real estate contribution to India’s GDP is estimated to be
about 6.3 per cent in 2013
The market size of real estate in India is expected to
increase at a CAGR of 11.2 per cent during FY2008 - 2020
The real estate sector is estimated to be worth USD180.0
billion by 2020
Source: BMI, CBRE, Aranca Research
Notes: CAGR - Compounded Annual Growth Rate, E - Estimates
CAGR: 11.2%

Source: Ministry of Housing and Urban Poverty Alleviation, RBI,
CRISIL, Aranca Research
Notes: E - Estimates, EWS - Economically Weaker Secrion,
LIG - Lower Income Group, BSUP - Basic Services to the urban poor,
IHSDF - Integrated Housing and slum development programme
Urban-rural housing shortage (million) The urban housing shortage is estimated at 18.8 million in
2012. Of this shortage, 95.5 per cent pertains to EWS and
LIG
By March 2012, 1.57 million houses were sanctioned under
BSUP and IHSDP, of which 0.65 million were completed
and 0.42 million have been occupied
Total rural housing shortage in India stood at 47.4 million as
of 2012 and is expected to grow to 48.8 million during XII
plan period (2012-2017)
Significant increase in real estate activity in cities like
Indore, Raipur, Ahmadabad, Jaipur and other two-tier cities;
this has opened new avenues of growth for the sector
15.1
18.4
24.7
19.3 20.5 18.8
34.0
30.1 26.5 26.7 26.0
47.4
0.0
5.0
10.0
15.0
20.0
25.0
30.0
35.0
40.0
45.0
50.0
2001 2005 2007 2008 2010 2012
Urban Rural

Scenario
Key drivers
A localised, fragmented market presents opportunities for consolidation Few large, pan-India players such as DLF and Unitech
Rapid urbanisation
Growth in population
Rise in the number of nuclear families
Easy availability of finance
Repatriation of NRIs and HNIs
Rise in disposable income
Demand to grow at a CAGR of 2.0 per cent over the period 2013-17 across top 8 cities in India NCR is expected to generate maximum demand in MIG and HIG category followed by Bengaluru
Developers now focussing on affordable and mid-range categories to meet the huge demand
Scenario
Key drivers
Notable
trends
Demand projections across top 8 cities (‘000 units)
Demand analysis of top 8 cities (‘000 units) 2013-17
(MIG+HIG)
Source: Cushman & Wakefield, Aranca Research
Notes: MIG: Middle Income Group HIG: High Income Group
480
490
500
510
520
460
470
480
490
500
510
520
530
2013 2014 2015 2016 2017
315 270 245
105
775
400 165 230
0
250
500
750
1,000
Ch
enn
ai
Hyde
raba
d
Mu
mba
i
Ko
lka
ta
NC
R
Be
ng
alu
ru
Pu
ne
Ah
me
dab
ad
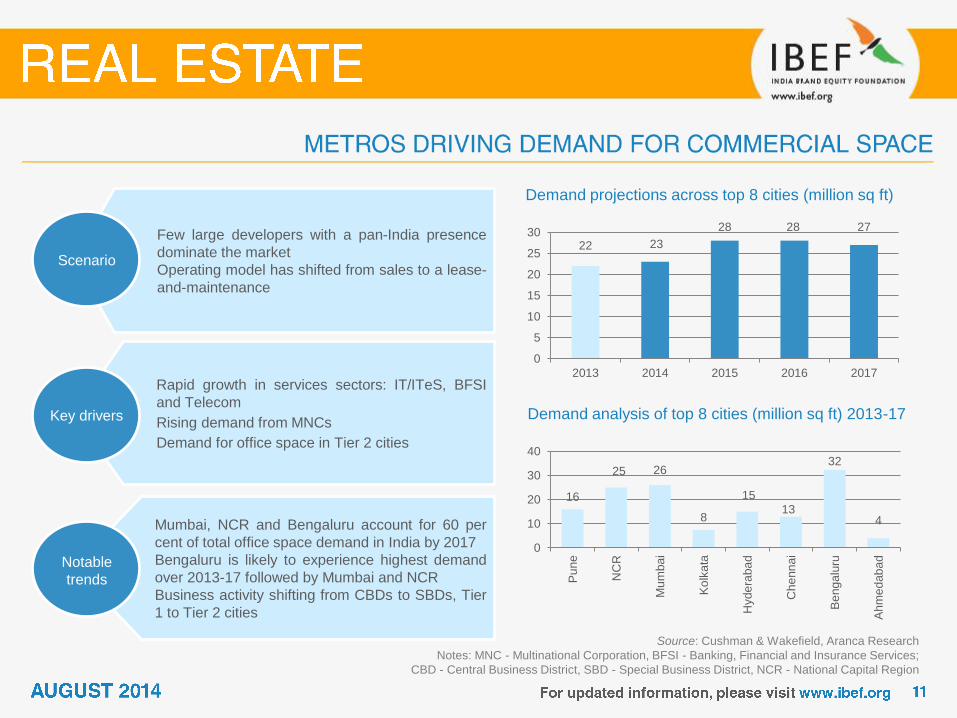
Demand projections across top 8 cities (million sq ft)
Source: Cushman & Wakefield, Aranca Research
Notes: MNC - Multinational Corporation, BFSI - Banking, Financial and Insurance Services;
CBD - Central Business District, SBD - Special Business District, NCR - National Capital Region
Scenario
Key drivers
Few large developers with a pan-India presence
dominate the market
Operating model has shifted from sales to a lease-
and-maintenance
Rapid growth in services sectors: IT/ITeS, BFSI
and Telecom
Rising demand from MNCs
Demand for office space in Tier 2 cities
Mumbai, NCR and Bengaluru account for 60 per
cent of total office space demand in India by 2017
Bengaluru is likely to experience highest demand
over 2013-17 followed by Mumbai and NCR
Business activity shifting from CBDs to SBDs, Tier
1 to Tier 2 cities
Scenario
Key drivers
Notable
trends
Demand analysis of top 8 cities (million sq ft) 2013-17
22 23
28 28 27
0
5
10
15
20
25
30
2013 2014 2015 2016 2017
16
25 26
8
15
13
32
4
0
10
20
30
40
Pu
ne
NC
R
Mu
mba
i
Ko
lka
ta
Hyde
raba
d
Ch
enn
ai
Be
ng
alu
ru
Ah
me
dab
ad
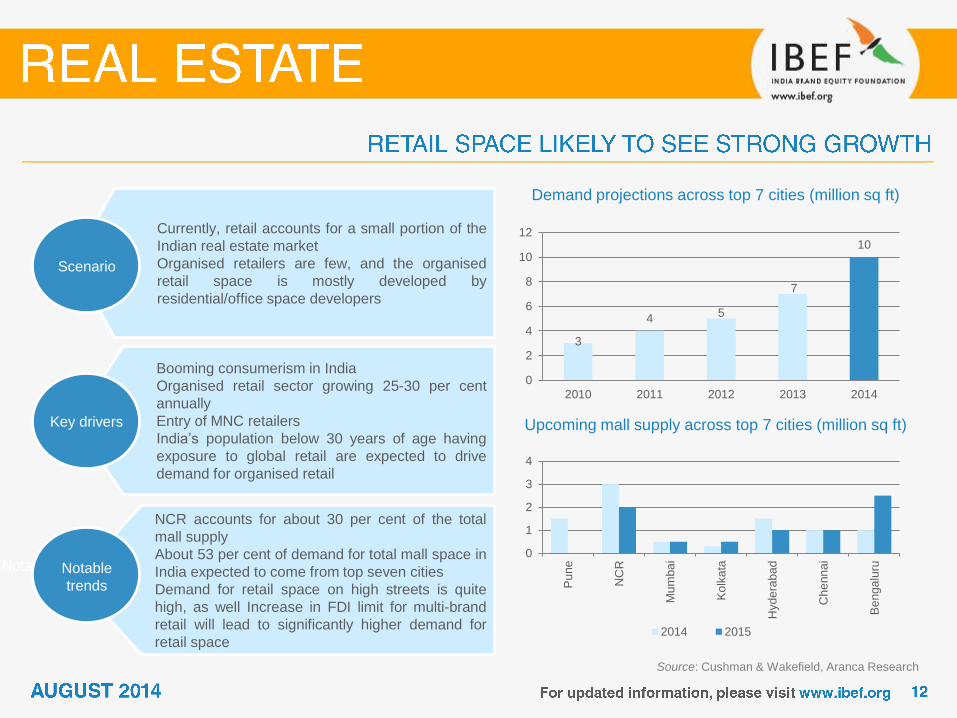
Demand projections across top 7 cities (million sq ft)
Source: Cushman & Wakefield, Aranca Research
Notable Trends
Currently, retail accounts for a small portion of the
Indian real estate market
Organised retailers are few, and the organised
retail space is mostly developed by
residential/office space developers
Booming consumerism in India
Organised retail sector growing 25-30 per cent
annually
Entry of MNC retailers
India’s population below 30 years of age having
exposure to global retail are expected to drive
demand for organised retail
NCR accounts for about 30 per cent of the total
mall supply
About 53 per cent of demand for total mall space in
India expected to come from top seven cities
Demand for retail space on high streets is quite
high, as well Increase in FDI limit for multi-brand
retail will lead to significantly higher demand for
retail space
Scenario
Key drivers
Scenario
Key drivers
Notable
trends
3
4 5
7
10
0
2
4
6
8
10
12
2010 2011 2012 2013 2014
Upcoming mall supply across top 7 cities (million sq ft)
0
1
2
3
4
Pu
ne
NC
R
Mu
mba
i
Ko
lka
ta
Hyde
raba
d
Che
nn
ai
Be
ng
alu
ru
2014 2015

Source: Cushman & Wakefield, Aranca Research
Note: FSI - Floor Space Index
NCR and Mumbai are by far the biggest hospitality
markets in India, followed by Bengaluru,
Hyderabad and Chennai
Besides hotels, the hospitality market comprises
serviced apartments and convention centres
A robust domestic tourism industry
The increasingly global nature of Indian
businesses boosting business travel
Tax incentives for hotels and higher FSI
Expansion of physical infrastructure during the 12th
Five Year Plan
Serviced apartments appear particularly attractive
within the hospitality space
Government initiatives to promote tourism in Tier 2
and Tier 3 cities is generating significant demand
for hotels in such cities, especially for budget
hotels
Scenario
Key drivers
Scenario
Key drivers
Notable
trends
Trend analysis (stock - no of rooms) (‘000)
Occupancy Vs. Stock (Est. 2017)
82
100
114 118 120
0
20
40
60
80
100
120
140
2013 2014 2015 2016 2017
0
10
20
30
40
60%
62%
64%
66%
68%
70%
Be
ng
alu
ru
Che
nn
ai
NC
R
Ko
lka
ta
Hyde
raba
d
Pu
ne
Mu
mba
i
Ah
me
dab
ad
Stock (RHS) AOR (%) (LHS)


Source: PricewaterhouseCoopers, Techopak, Aranca Research
Competitive Rivalry
• Strong rivalry due to large number of players operating in India
• Limits a seller’s ability to set the prices for goods and services
• An absence of competitive neutrality due to unequal provisioning of policy
concessions
Threat of New Entrants Substitute Products
Bargaining Power of Suppliers Bargaining Power of Customers
• Uncertain investment timeline due
to long gestation period
• High cost of land and land use
restrictions act as a natural barrier
• Brand value of the incumbent
player for the consumers
• Large real estate firms have good
bargaining power against
customers
• Unregulated and badly managed
land banks make land acquisition
difficult for realty companies
• Due to a large variety of quality
players, the customers have many
options to choose from
• They are also becoming more
discerning and demanding better
quality
• No specific substitutes available
• Substitutes are mainly government-
provided housing, mostly limited to
the economically backward class
Competitive
Rivalry
(High)
Threat of New
Entrants
(Medium)
Substitute
Products
(Low)
Bargaining
Power of
Customers
(Medium)
Bargaining
Power of
Suppliers
(Medium)

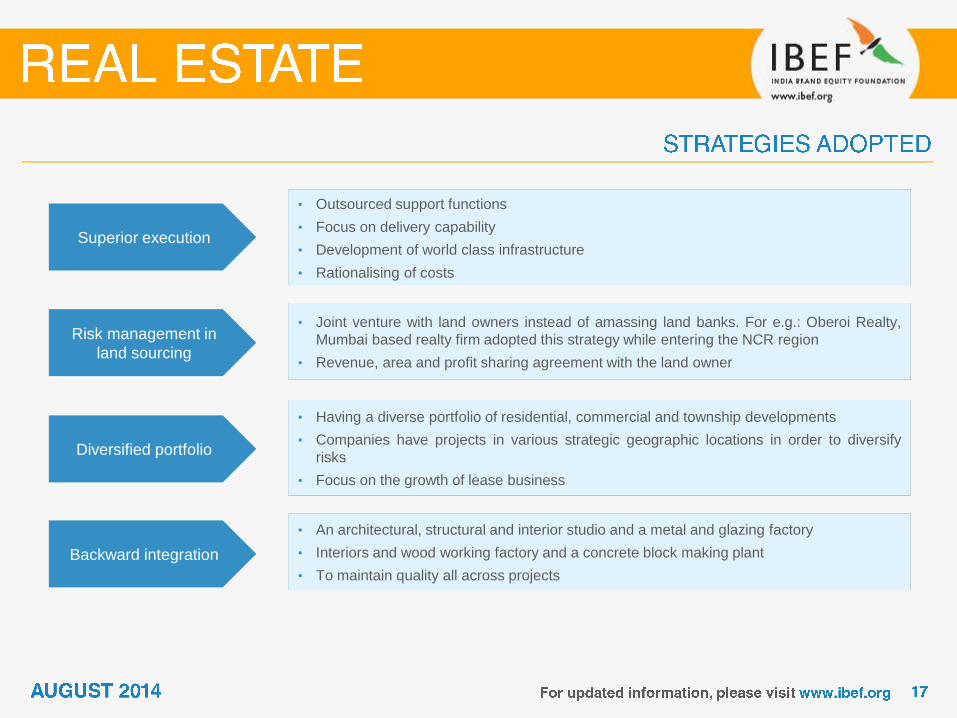
• Outsourced support functions
• Focus on delivery capability
• Development of world class infrastructure
• Rationalising of costs
• Joint venture with land owners instead of amassing land banks. For e.g.: Oberoi Realty,
Mumbai based realty firm adopted this strategy while entering the NCR region
• Revenue, area and profit sharing agreement with the land owner
• Having a diverse portfolio of residential, commercial and township developments
• Companies have projects in various strategic geographic locations in order to diversify
risks
• Focus on the growth of lease business
• An architectural, structural and interior studio and a metal and glazing factory
• Interiors and wood working factory and a concrete block making plant
• To maintain quality all across projects
Superior execution
Risk management in
land sourcing
Diversified portfolio
Backward integration

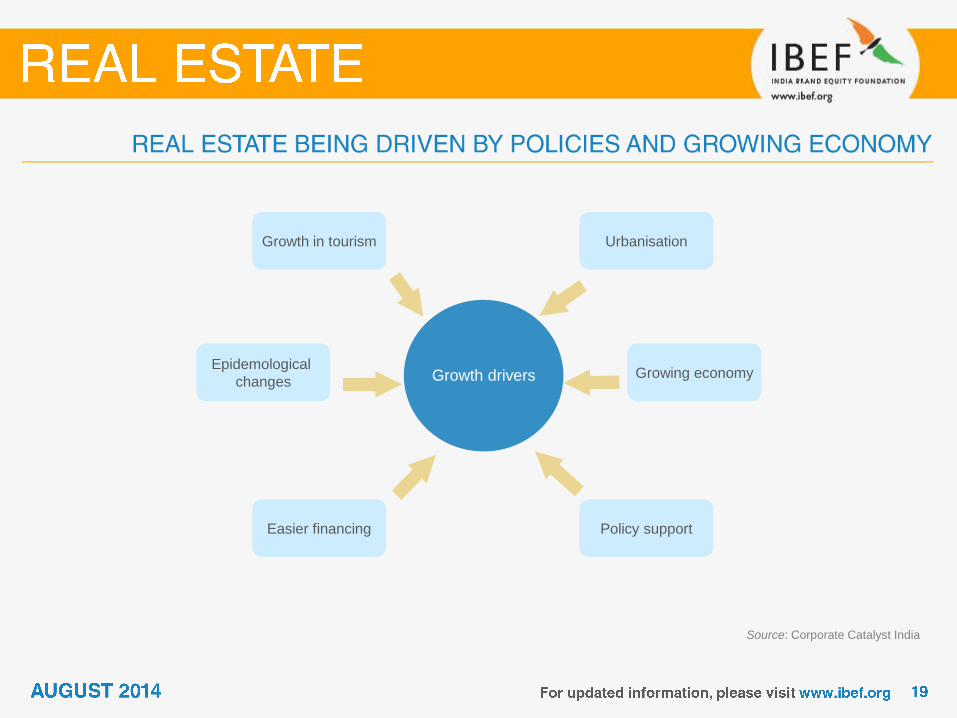
Growth drivers
Growth in tourism
Epidemological
changes
Policy support Easier financing
Growing economy
Urbanisation
Source: Corporate Catalyst India
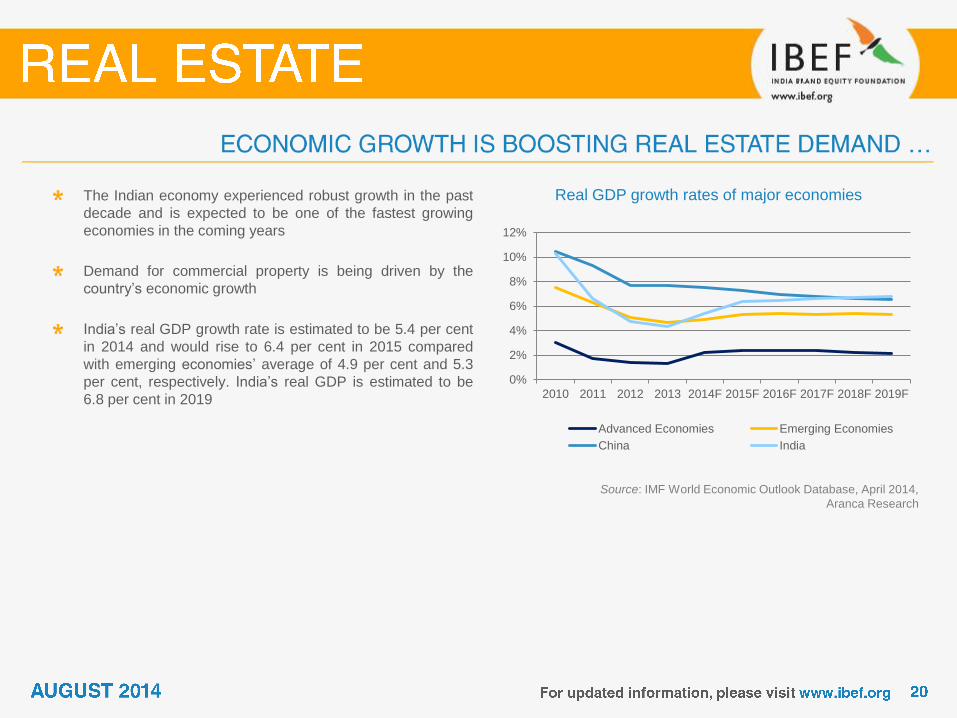
Real GDP growth rates of major economies The Indian economy experienced robust growth in the past
decade and is expected to be one of the fastest growing
economies in the coming years
Demand for commercial property is being driven by the
country’s economic growth
India’s real GDP growth rate is estimated to be 5.4 per cent
in 2014 and would rise to 6.4 per cent in 2015 compared
with emerging economies’ average of 4.9 per cent and 5.3
per cent, respectively. India’s real GDP is estimated to be
6.8 per cent in 2019
Source: IMF World Economic Outlook Database, April 2014,
Aranca Research
0%
2%
4%
6%
8%
10%
12%
2010 2011 2012 2013 2014F 2015F 2016F 2017F 2018F 2019F
Advanced Economies Emerging Economies
China India
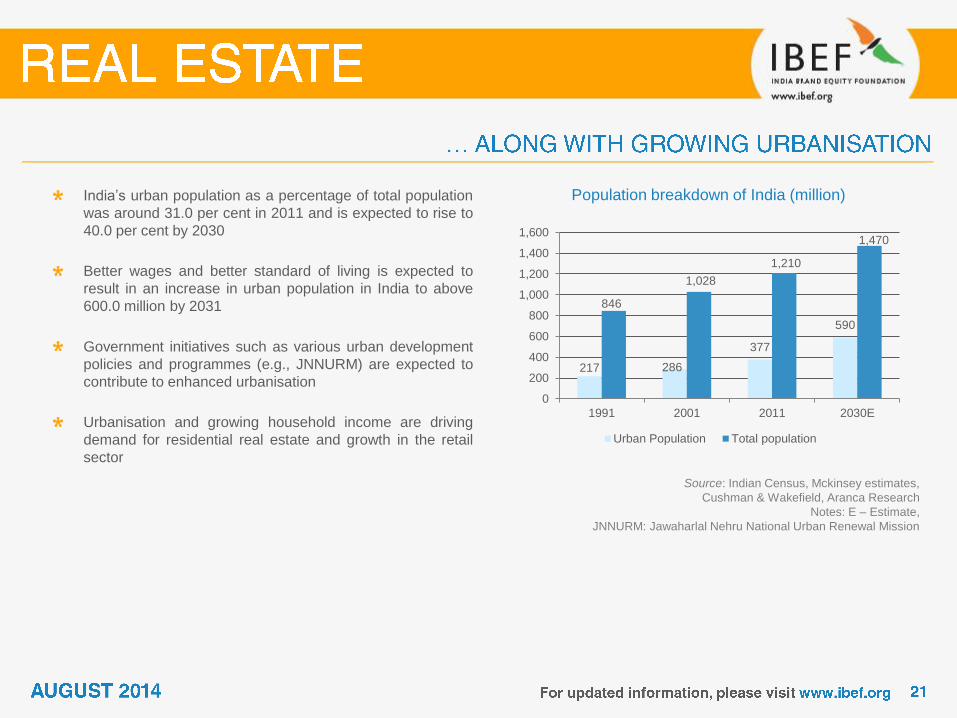
Population breakdown of India (million) India’s urban population as a percentage of total population
was around 31.0 per cent in 2011 and is expected to rise to
40.0 per cent by 2030
Better wages and better standard of living is expected to
result in an increase in urban population in India to above
600.0 million by 2031
Government initiatives such as various urban development
policies and programmes (e.g., JNNURM) are expected to
contribute to enhanced urbanisation
Urbanisation and growing household income are driving
demand for residential real estate and growth in the retail
sector
Source: Indian Census, Mckinsey estimates,
Cushman & Wakefield, Aranca Research
Notes: E – Estimate,
JNNURM: Jawaharlal Nehru National Urban Renewal Mission
217 286
377
590
846
1,028
1,210
1,470
0
200
400
600
800
1,000
1,200
1,400
1,600
1991 2001 2011 2030E
Urban Population Total population
5.1 5.3 5.2
5.8 6.3
6.6 6.8
3.1
0.0
1.0
2.0
3.0
4.0
5.0
6.0
7.0
8.0
2007 2008 2009 2010 2011 2012 2013 2014*
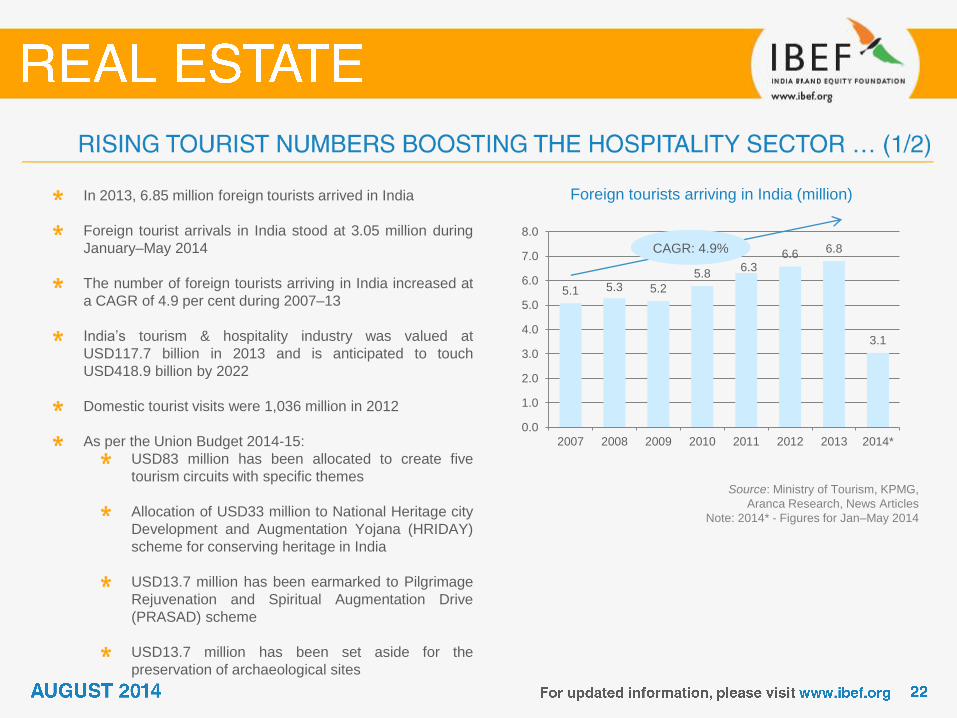
Foreign tourists arriving in India (million) In 2013, 6.85 million foreign tourists arrived in India
Foreign tourist arrivals in India stood at 3.05 million during
January–May 2014
The number of foreign tourists arriving in India increased at
a CAGR of 4.9 per cent during 2007–13
India’s tourism & hospitality industry was valued at
USD117.7 billion in 2013 and is anticipated to touch
USD418.9 billion by 2022
Domestic tourist visits were 1,036 million in 2012
As per the Union Budget 2014-15:
USD83 million has been allocated to create five
tourism circuits with specific themes
Allocation of USD33 million to National Heritage city
Development and Augmentation Yojana (HRIDAY)
scheme for conserving heritage in India
USD13.7 million has been earmarked to Pilgrimage
Rejuvenation and Spiritual Augmentation Drive
(PRASAD) scheme
USD13.7 million has been set aside for the
preservation of archaeological sites
Source: Ministry of Tourism, KPMG,
Aranca Research, News Articles
Note: 2014* - Figures for Jan–May 2014
CAGR: 4.9%
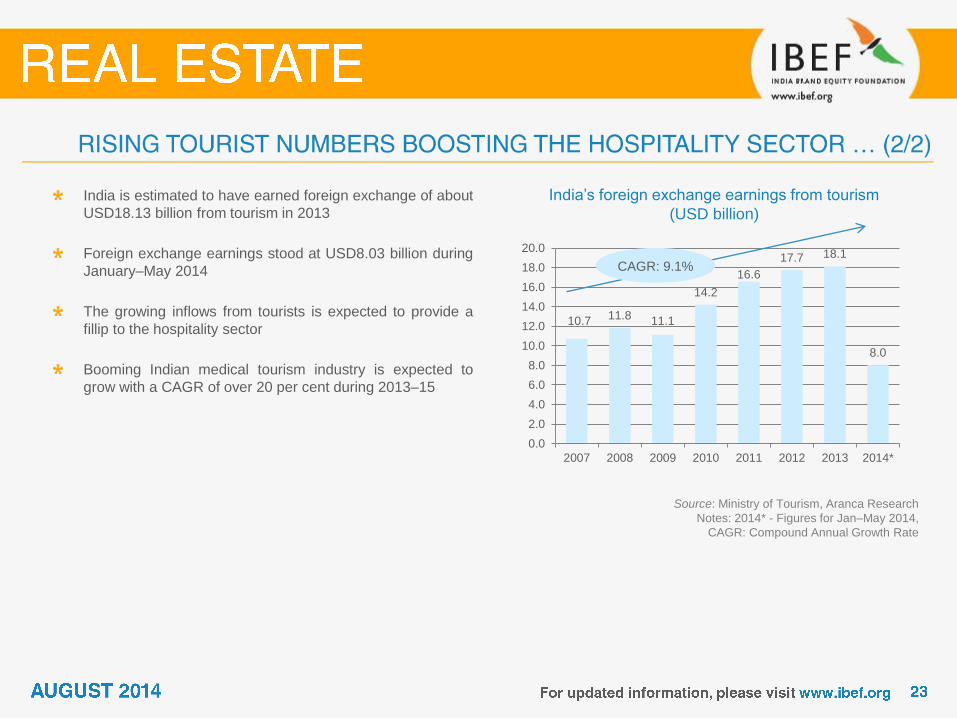
10.7 11.8 11.1
14.2
16.6
17.7 18.1
8.0
0.0
2.0
4.0
6.0
8.0
10.0
12.0
14.0
16.0
18.0
20.0
2007 2008 2009 2010 2011 2012 2013 2014*
India’s foreign exchange earnings from tourism
(USD billion)
India is estimated to have earned foreign exchange of about
USD18.13 billion from tourism in 2013
Foreign exchange earnings stood at USD8.03 billion during
January–May 2014
The growing inflows from tourists is expected to provide a
fillip to the hospitality sector
Booming Indian medical tourism industry is expected to
grow with a CAGR of over 20 per cent during 2013–15
Source: Ministry of Tourism, Aranca Research
Notes: 2014* - Figures for Jan–May 2014,
CAGR: Compound Annual Growth Rate
CAGR: 9.1%
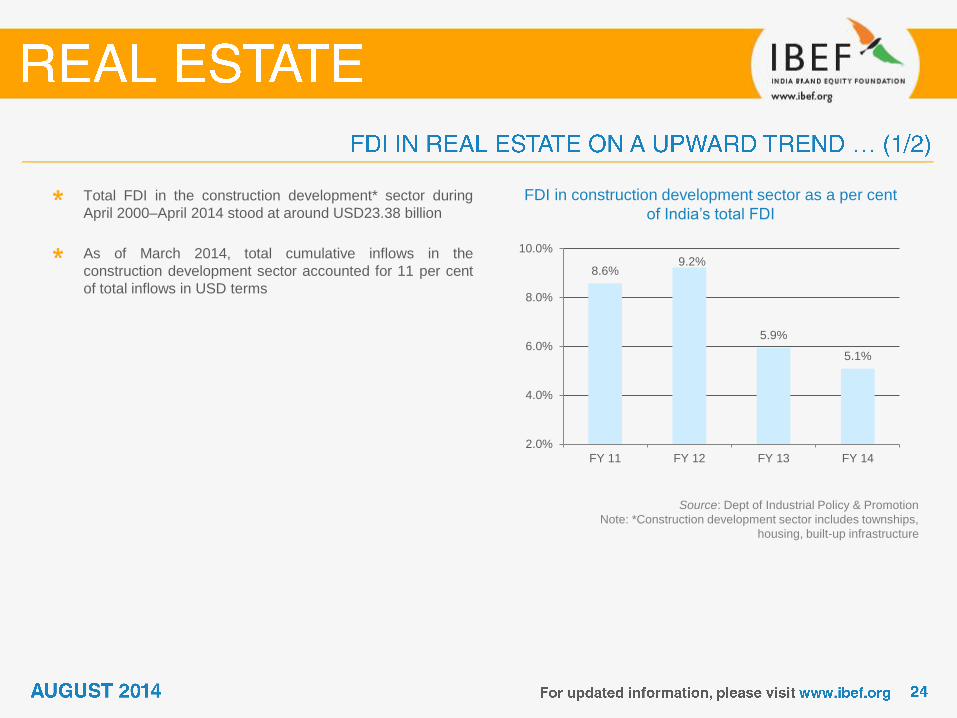
FDI in construction development sector as a per cent
of India’s total FDI
Total FDI in the construction development* sector during
April 2000–April 2014 stood at around USD23.38 billion
As of March 2014, total cumulative inflows in the
construction development sector accounted for 11 per cent
of total inflows in USD terms
Source: Dept of Industrial Policy & Promotion
Note: *Construction development sector includes townships,
housing, built-up infrastructure
8.6% 9.2%
5.9%
5.1%
2.0%
4.0%
6.0%
8.0%
10.0%
FY 11 FY 12 FY 13 FY 14

Source: Cushman & Wakefield, Venture Intelligence, Aranca Research
Major acquisitions in real estate sector in India In August 2013, Indiabulls Real Estate Limited (IBREL)
bought US investment fund Farallon Capital for nearly
USD187 million. IBREL acquired complete stake in a series
of Indian joint ventures by Farallon across Sonepat,
Chennai and Gurgaon
Canada-based real estate giant Brookfield Asset
Management Inc announced the acquisition of Unitech
Corporate Parks Plc (UCP) for approximately USD337.4
million in June 2014. Brookfield would acquire Candor
Investments Inc, the holding company for UCP
Target Acquirer Value
(USD million) Year
Caraf Builders DLF Assets ltd 696.5 2009
Cowtown Land Dvlp
Pvt Ltd Lodha Group 513.6 2011
Compact Disc Film
City Jeff Morgan 320 2011
Oceanus Real Estate Warburg Pincus 318 2011
Indiabulls Properties
Pvt Ltd Indiabulls Property
Invest Trust 223.1 2012
Embassy Property Blackstone 200 2012
Farallon Capital Indiabulls Real
Estate Ltd 187 2013
Candor Investments
Inc Brookfield Asset
Management Inc 337.4 2014
Source: Reuters, Business Standard
Source: Grant Thornton, Cushman & Wakefield,
Venture Intelligence, Aranca Research
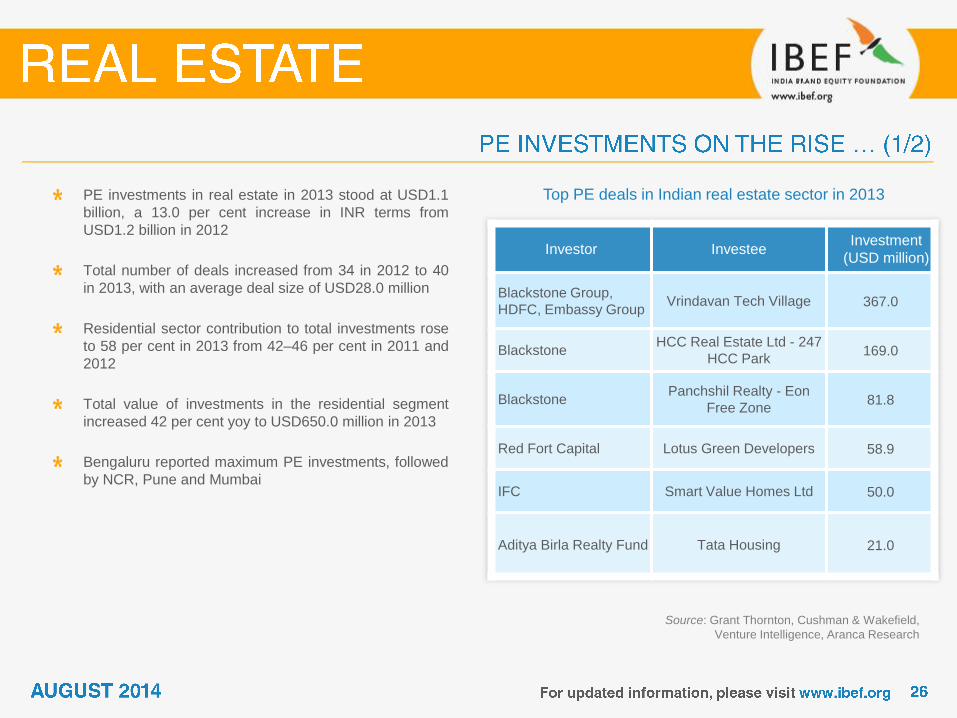
Top PE deals in Indian real estate sector in 2013
PE investments in real estate in 2013 stood at USD1.1
billion, a 13.0 per cent increase in INR terms from
USD1.2 billion in 2012
Total number of deals increased from 34 in 2012 to 40
in 2013, with an average deal size of USD28.0 million
Residential sector contribution to total investments rose
to 58 per cent in 2013 from 42–46 per cent in 2011 and
2012
Total value of investments in the residential segment
increased 42 per cent yoy to USD650.0 million in 2013
Bengaluru reported maximum PE investments, followed
by NCR, Pune and Mumbai
Investor Investee Investment
(USD million)
Blackstone Group,
HDFC, Embassy Group Vrindavan Tech Village 367.0
Blackstone HCC Real Estate Ltd - 247
HCC Park 169.0
Blackstone Panchshil Realty - Eon
Free Zone 81.8
Red Fort Capital Lotus Green Developers 58.9
IFC Smart Value Homes Ltd 50.0
Aditya Birla Realty Fund Tata Housing 21.0
Source: Cushman & Wakefield,
Aranca Research
Note: *In INR terms
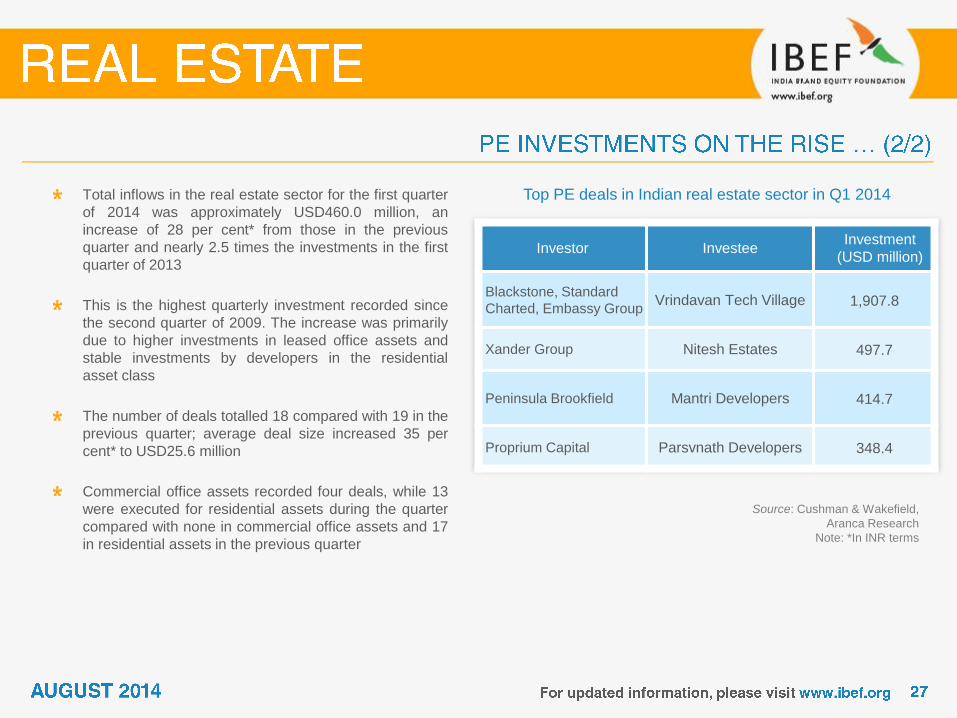
Top PE deals in Indian real estate sector in Q1 2014
Total inflows in the real estate sector for the first quarter
of 2014 was approximately USD460.0 million, an
increase of 28 per cent* from those in the previous
quarter and nearly 2.5 times the investments in the first
quarter of 2013
This is the highest quarterly investment recorded since
the second quarter of 2009. The increase was primarily
due to higher investments in leased office assets and
stable investments by developers in the residential
asset class
The number of deals totalled 18 compared with 19 in the
previous quarter; average deal size increased 35 per
cent* to USD25.6 million
Commercial office assets recorded four deals, while 13
were executed for residential assets during the quarter
compared with none in commercial office assets and 17
in residential assets in the previous quarter
Investor Investee Investment
(USD million)
Blackstone, Standard
Charted, Embassy Group Vrindavan Tech Village 1,907.8
Xander Group Nitesh Estates 497.7
Peninsula Brookfield Mantri Developers 414.7
Proprium Capital Parsvnath Developers 348.4
For updated information, please visit www.ibef.org
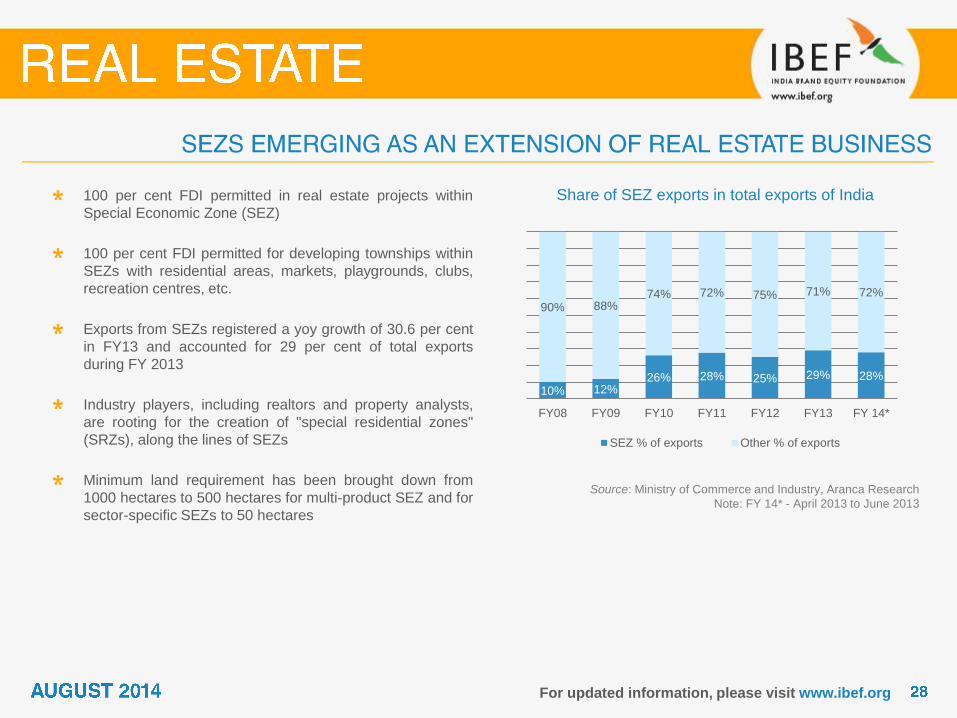
Share of SEZ exports in total exports of India 100 per cent FDI permitted in real estate projects within
Special Economic Zone (SEZ)
100 per cent FDI permitted for developing townships within
SEZs with residential areas, markets, playgrounds, clubs,
recreation centres, etc.
Exports from SEZs registered a yoy growth of 30.6 per cent
in FY13 and accounted for 29 per cent of total exports
during FY 2013
Industry players, including realtors and property analysts,
are rooting for the creation of "special residential zones"
(SRZs), along the lines of SEZs
Minimum land requirement has been brought down from
1000 hectares to 500 hectares for multi-product SEZ and for
sector-specific SEZs to 50 hectares
Source: Ministry of Commerce and Industry, Aranca Research
Note: FY 14* - April 2013 to June 2013
10% 12% 26% 28% 25% 29% 28%
90% 88% 74% 72% 75% 71% 72%
FY08 FY09 FY10 FY11 FY12 FY13 FY 14*
SEZ % of exports Other % of exports

For updated information, please visit www.ibef.org
Ease in housing
finances
• Additional deduction of up to USD1,841 on interests payable on home loans of up to
USD46,032 announced in the Union Budget 2013–14
• To liberalise scheme of interest subversion of 1 per cent on home loan by including loans
of up to USD31,250 for houses that cost up to USD52,080
Housing for
economically weaker
sections
• Allocation of USD1.3 billion for Rural Housing Fund in Budget 2014-15
• Allocation of another USD0.7 billion for National Housing Bank (NHB) to increase the flow
of cheaper credit for affordable housing for urban poor in Budget 2014-15
FDI
• The government has allowed FDI of up to 100 per cent in development projects for
townships and settlements
• FDI of up to 100 per cent is allowed in the hotel and tourism sector through the automatic
route
Widening the scope of
real estate market
• SEBI released draft guidelines for investments by Real Estate Investment Trusts (REITs)
in non-residential segment
• Upon implementation, this would widen the real estate market and boost funds entering
the organised real estate sector


Real estate demand in education sector
(seven top cities)
The entry of major private players in the education sector
has created vast opportunities for the real estate sector
The top seven cities i.e. Hyderabad, Bengaluru, Mumbai,
Delhi, Pune, Chennai and Kolkata are likely to account for
70 per cent of total demand for real estate in the education
sector
Source: Cushman & Wakefield, Aranca Research
14
14.5
15
15.5
16
2010
2011F
2012F
2013F
2014F
Area (million square feet)
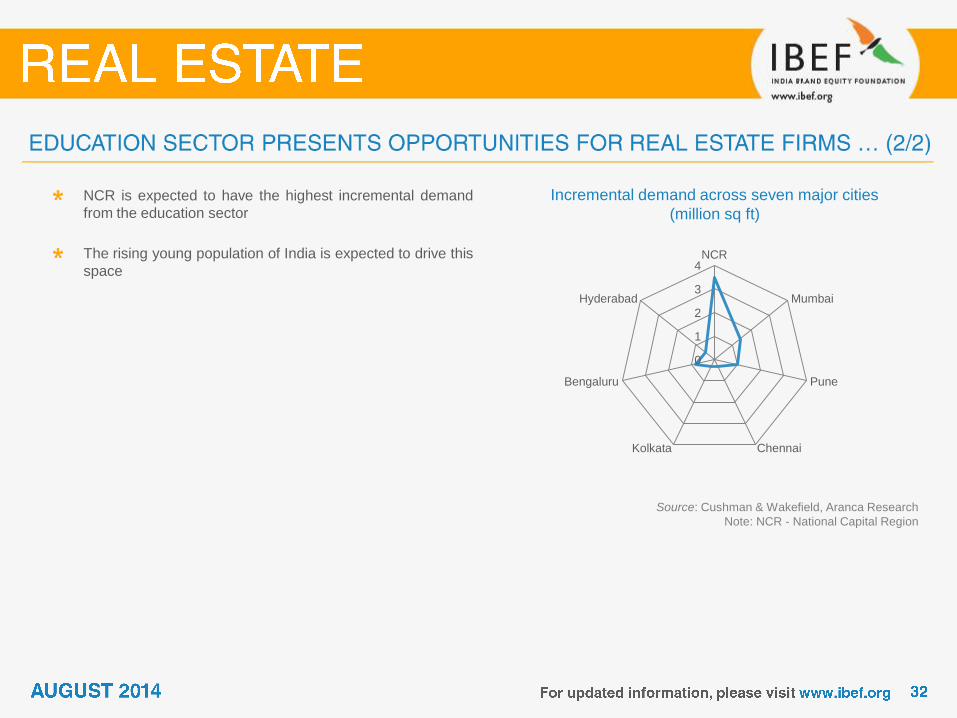
Incremental demand across seven major cities
(million sq ft)
NCR is expected to have the highest incremental demand
from the education sector
The rising young population of India is expected to drive this
space
Source: Cushman & Wakefield, Aranca Research
Note: NCR - National Capital Region
0
1
2
3
4NCR
Mumbai
Pune
ChennaiKolkata
Bengaluru
Hyderabad
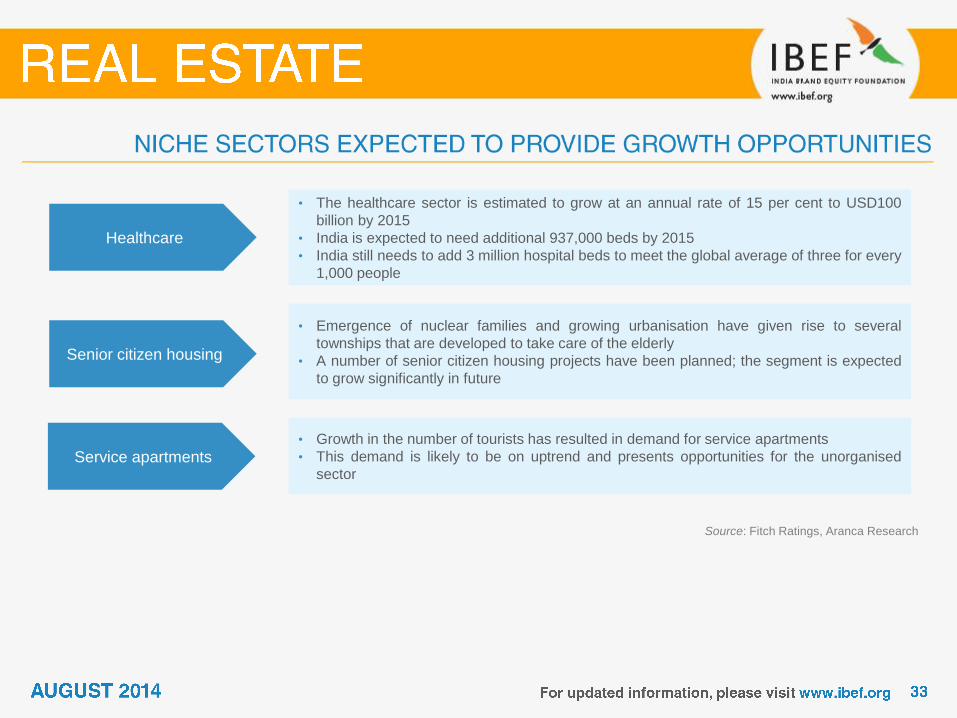
Healthcare
• The healthcare sector is estimated to grow at an annual rate of 15 per cent to USD100
billion by 2015
• India is expected to need additional 937,000 beds by 2015
• India still needs to add 3 million hospital beds to meet the global average of three for every
1,000 people
Senior citizen housing
• Emergence of nuclear families and growing urbanisation have given rise to several
townships that are developed to take care of the elderly
• A number of senior citizen housing projects have been planned; the segment is expected
to grow significantly in future
Service apartments • Growth in the number of tourists has resulted in demand for service apartments
• This demand is likely to be on uptrend and presents opportunities for the unorganised
sector
Source: Fitch Ratings, Aranca Research
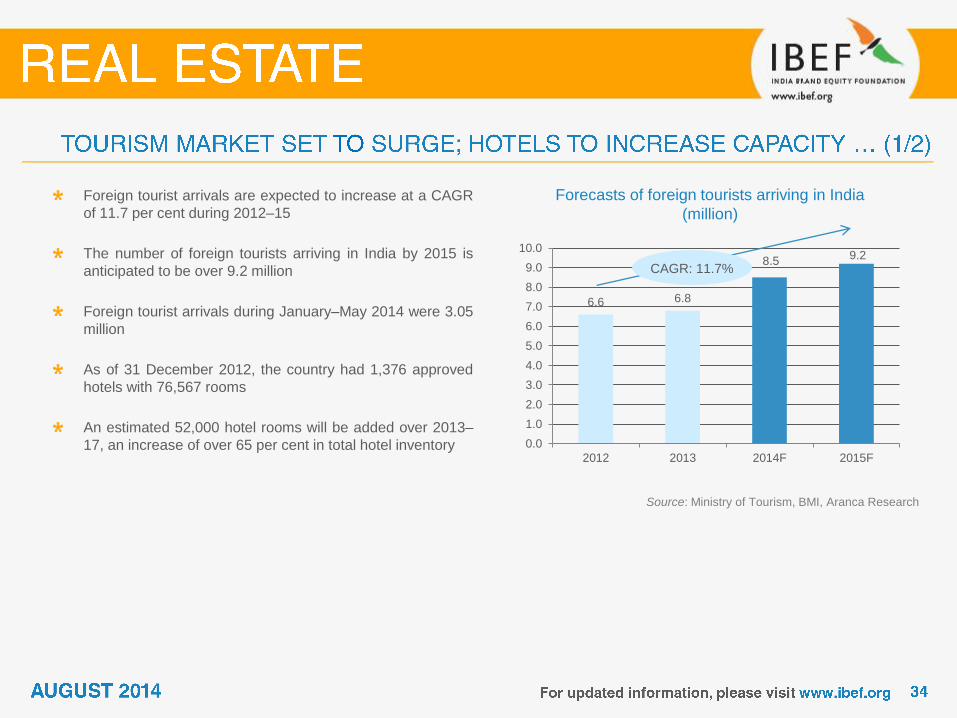
6.6 6.8
8.5 9.2
0.0
1.0
2.0
3.0
4.0
5.0
6.0
7.0
8.0
9.0
10.0
2012 2013 2014F 2015F
Source: Ministry of Tourism, BMI, Aranca Research
Forecasts of foreign tourists arriving in India
(million)
Foreign tourist arrivals are expected to increase at a CAGR
of 11.7 per cent during 2012–15
The number of foreign tourists arriving in India by 2015 is
anticipated to be over 9.2 million
Foreign tourist arrivals during January–May 2014 were 3.05
million
As of 31 December 2012, the country had 1,376 approved
hotels with 76,567 rooms
An estimated 52,000 hotel rooms will be added over 2013–
17, an increase of over 65 per cent in total hotel inventory
CAGR: 11.7%
Source: Cushman & Wakefield, Aranca Research
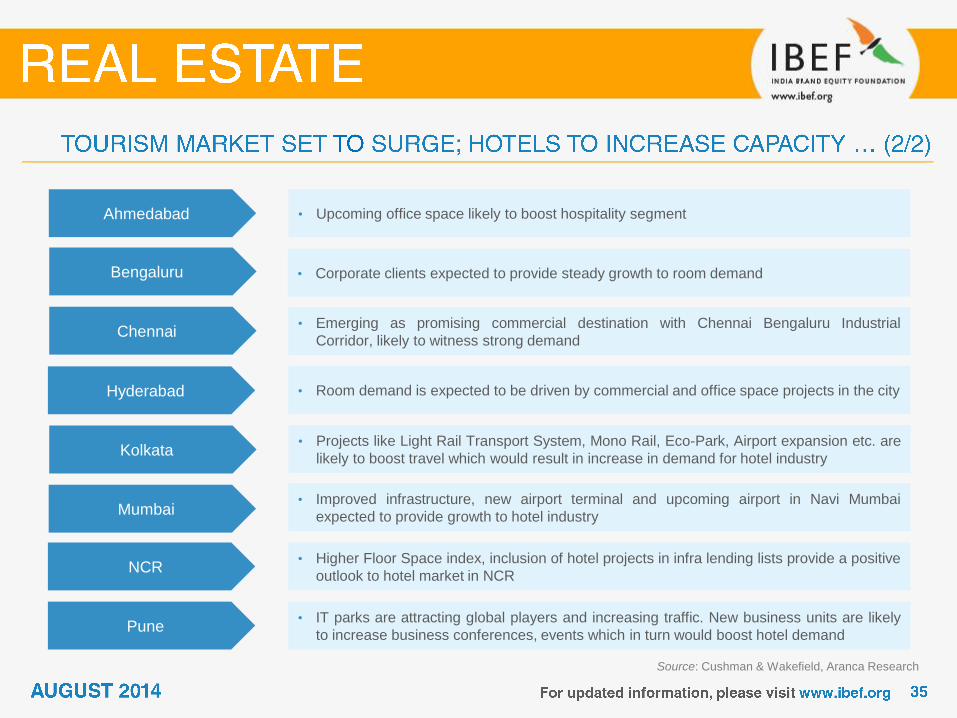
• Corporate clients expected to provide steady growth to room demand
• Emerging as promising commercial destination with Chennai Bengaluru Industrial
Corridor, likely to witness strong demand
• Room demand is expected to be driven by commercial and office space projects in the city
Kolkata • Projects like Light Rail Transport System, Mono Rail, Eco-Park, Airport expansion etc. are
likely to boost travel which would result in increase in demand for hotel industry
• Improved infrastructure, new airport terminal and upcoming airport in Navi Mumbai
expected to provide growth to hotel industry
Bengaluru
Chennai
Hyderabad
• Higher Floor Space index, inclusion of hotel projects in infra lending lists provide a positive
outlook to hotel market in NCR NCR
Ahmedabad • Upcoming office space likely to boost hospitality segment
Mumbai
• IT parks are attracting global players and increasing traffic. New business units are likely
to increase business conferences, events which in turn would boost hotel demand Pune
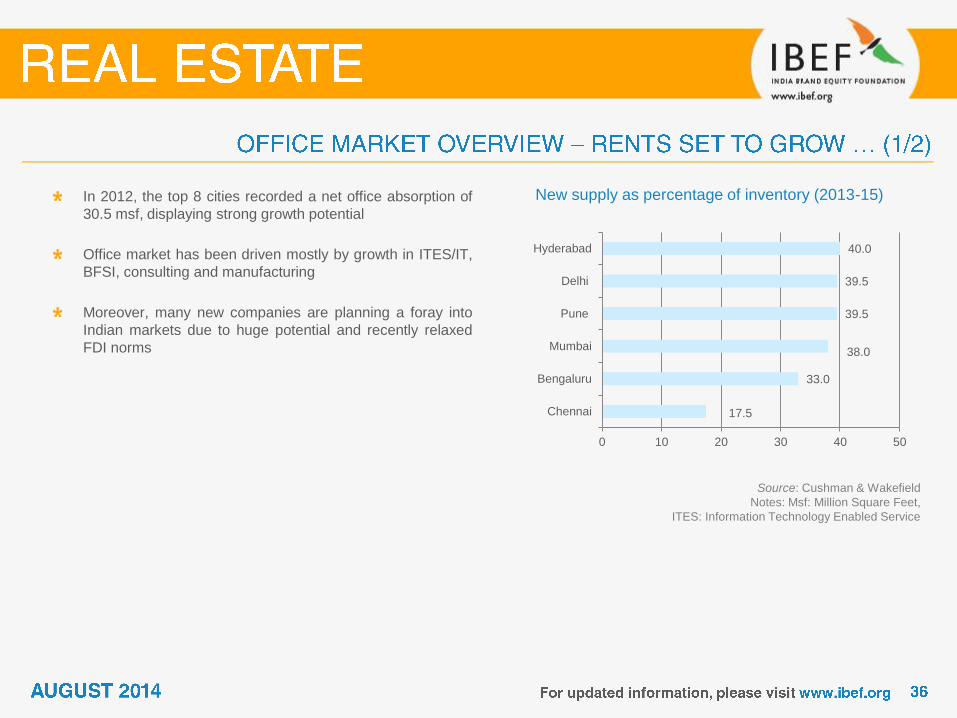
In 2012, the top 8 cities recorded a net office absorption of
30.5 msf, displaying strong growth potential
Office market has been driven mostly by growth in ITES/IT,
BFSI, consulting and manufacturing
Moreover, many new companies are planning a foray into
Indian markets due to huge potential and recently relaxed
FDI norms
Source: Cushman & Wakefield
Notes: Msf: Million Square Feet,
ITES: Information Technology Enabled Service
New supply as percentage of inventory (2013-15)
17.5
33.0
38.0
39.5
39.5
40.0
0 10 20 30 40 50
Chennai
Bengaluru
Mumbai
Pune
Delhi
Hyderabad
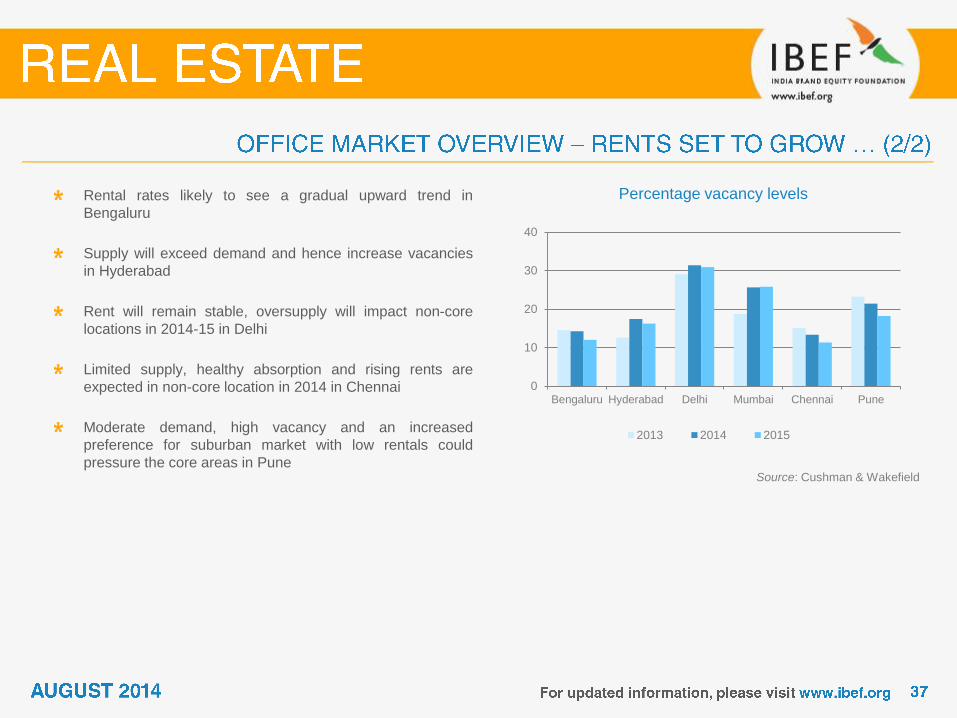
Rental rates likely to see a gradual upward trend in
Bengaluru
Supply will exceed demand and hence increase vacancies
in Hyderabad
Rent will remain stable, oversupply will impact non-core
locations in 2014-15 in Delhi
Limited supply, healthy absorption and rising rents are
expected in non-core location in 2014 in Chennai
Moderate demand, high vacancy and an increased
preference for suburban market with low rentals could
pressure the core areas in Pune Source: Cushman & Wakefield
Percentage vacancy levels
0
10
20
30
40
Bengaluru Hyderabad Delhi Mumbai Chennai Pune
2013 2014 2015
Source: Jones Lang LaSalle, Aranca Research
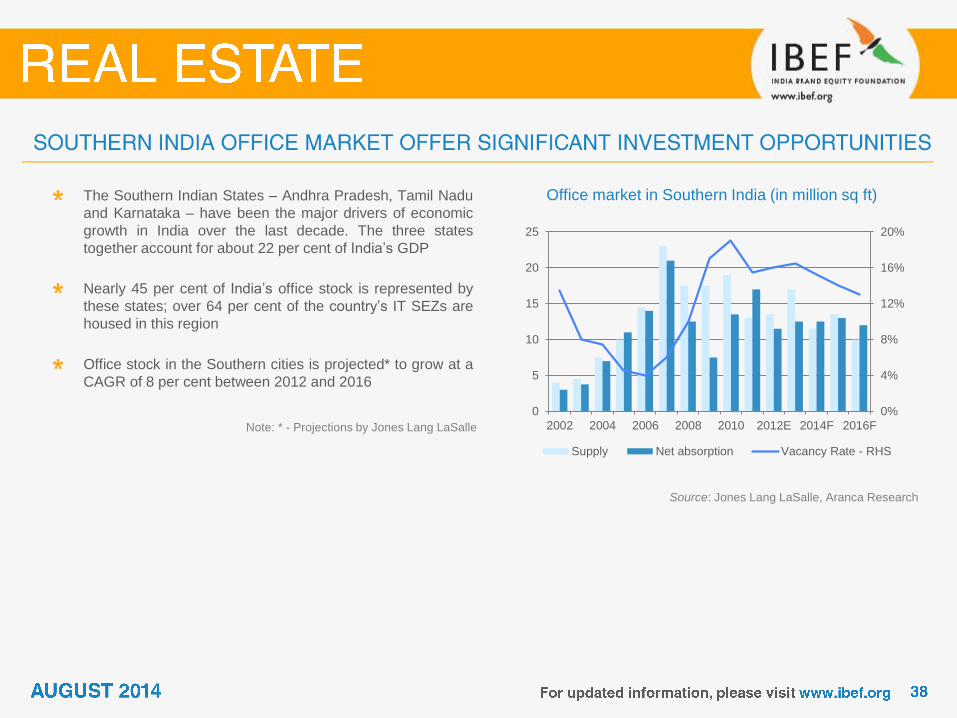
Office market in Southern India (in million sq ft) The Southern Indian States – Andhra Pradesh, Tamil Nadu
and Karnataka – have been the major drivers of economic
growth in India over the last decade. The three states
together account for about 22 per cent of India’s GDP
Nearly 45 per cent of India’s office stock is represented by
these states; over 64 per cent of the country’s IT SEZs are
housed in this region
Office stock in the Southern cities is projected* to grow at a
CAGR of 8 per cent between 2012 and 2016
0%
4%
8%
12%
16%
20%
0
5
10
15
20
25
2002 2004 2006 2008 2010 2012E 2014F 2016F
Supply Net absorption Vacancy Rate - RHS
Note: * - Projections by Jones Lang LaSalle

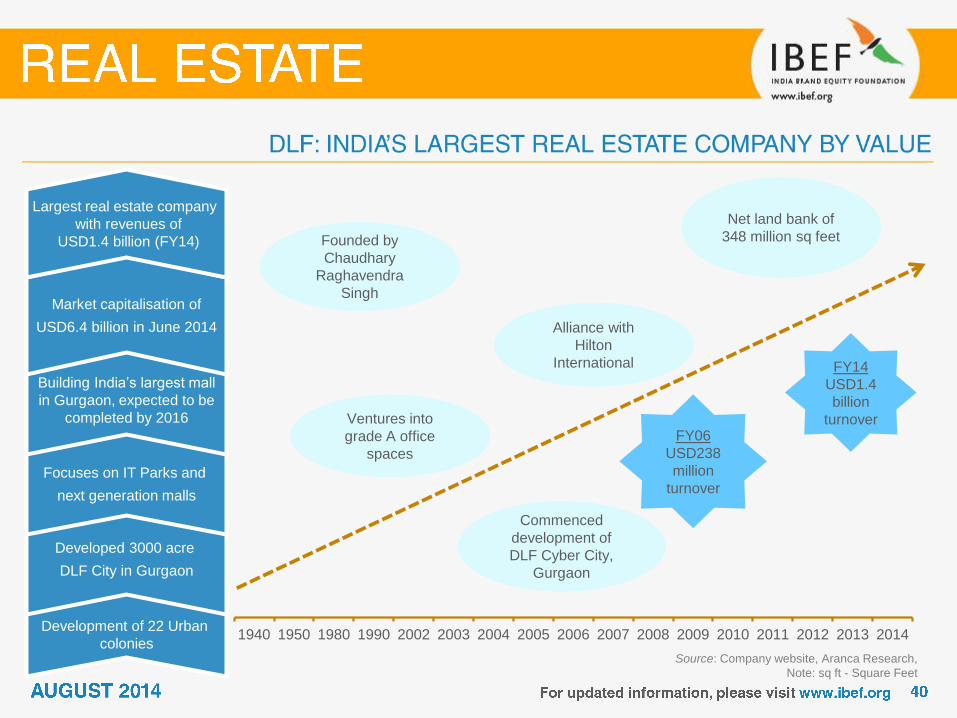
Source: Company website, Aranca Research,
Note: sq ft - Square Feet
1940 1950 1980 1990 2002 2003 2004 2005 2006 2007 2008 2009 2010 2011 2012 2013 2014
Development of 22 Urban
colonies
Developed 3000 acre
DLF City in Gurgaon
Focuses on IT Parks and
next generation malls
Building India’s largest mall
in Gurgaon, expected to be
completed by 2016
Market capitalisation of
USD6.4 billion in June 2014
Largest real estate company
with revenues of
USD1.4 billion (FY14)
Ventures into
grade A office
spaces
Alliance with
Hilton
International
Commenced
development of
DLF Cyber City,
Gurgaon
FY14
USD1.4
billion
turnover
Net land bank of
348 million sq feet
FY06
USD238
million
turnover
Founded by
Chaudhary
Raghavendra
Singh

Distribution of ongoing and forthcoming
projects by area (at the end of Q4 FY14) Key Facts
Started its first project in Mumbai in 1991
National real estate developer with presence across
12 cities
Differentiated joint development business model
resulted in a debt-equity ratio of less than one
The current potential developable area stands at
100.0* million sq ft
Ranked second most trusted Indian brand in the
2013 Brand Trust Report and received 28 awards in
FY14
Added 16 projects with about 20.9 million sq ft
saleable area in the last eight quarters**
Added eight new projects with 13.42 million sq ft of
saleable area in FY14
Source: Company website, Result Presentation Q4 FY14
Notes: *At the end of FY14,
**Going back beginning Q4 FY14
84.7%
15.3%
Residential
Commercial
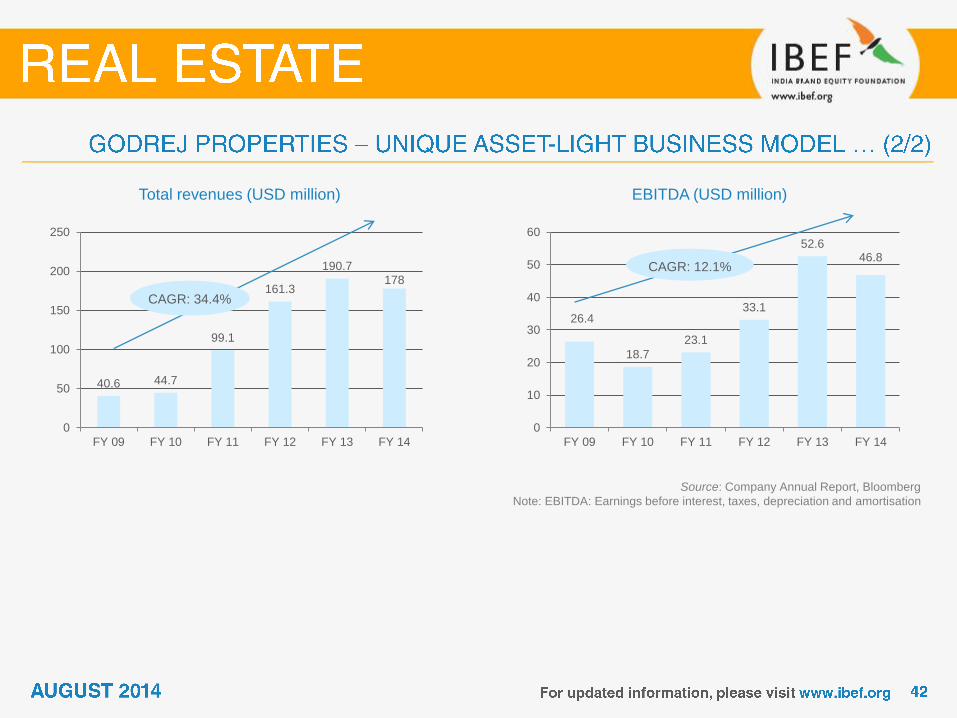
26.4
18.7
23.1
33.1
52.6 46.8
0
10
20
30
40
50
60
FY 09 FY 10 FY 11 FY 12 FY 13 FY 14
40.6 44.7
99.1
161.3
190.7 178
0
50
100
150
200
250
FY 09 FY 10 FY 11 FY 12 FY 13 FY 14
EBITDA (USD million) Total revenues (USD million)
Source: Company Annual Report, Bloomberg
Note: EBITDA: Earnings before interest, taxes, depreciation and amortisation
CAGR: 34.4%
CAGR: 12.1%
Source: Company website, Aranca Research,
Note: sq ft - Square Feet
UNITECH
Established in 1972 by a group of technocrats
So far Unitech has built more than 100 residential projects
4.5 million sq ft of retail space is already under construction
ANSAL API
Established in 1967 as a family business
Developed and delivered more than 190 million sq ft
Currently has a land reserve of 9,335 acres
SOBHA DEVELOPERS*
The Company was founded in 1995
It has completed 47 residential, 13 commercial and 166 contractual projects
Currently has a land reserve of 4,300 acres


The Confederation of Real Estate Developers’ Associations of India (CREDAI) National Secretariat, 703, Ansal Bhawan,
16, Kasturba Gandhi Marg, New Delhi – 110 001
Tel: (011) 43126262/43126200
Fax: 91 11 43126211
E-mail: [email protected]
Website: www.credai.org
Builders' Association of India (BAI) G-1/G-20, Commerce Centre, J. Dadajee Road,
Tardeo, Mumbai – 400034
Tel: 91 22 23514134, 23514802, 23520507
Fax: 91 22 23521328
E-mail: [email protected], [email protected]
Website: www.baionline.in

BFSI: Banking, Financial Services and Insurance
CAGR: Compound Annual Growth Rate
CBD: Central Business District
FDI: Foreign Direct Investment
FSI: Floor Space Index
HNI: High Net-worth Individual
GOI: Government of India
INR: Indian Rupee
IT/ITeS: Information Technology/Information Technology enabled Services
MNC: Multinational Corporation
NRI: Non Resident Indian
SBD: Special Business District

SEZ: Special Economic Zone
USD: US Dollar
Wherever applicable, numbers have been rounded off to the nearest whole number
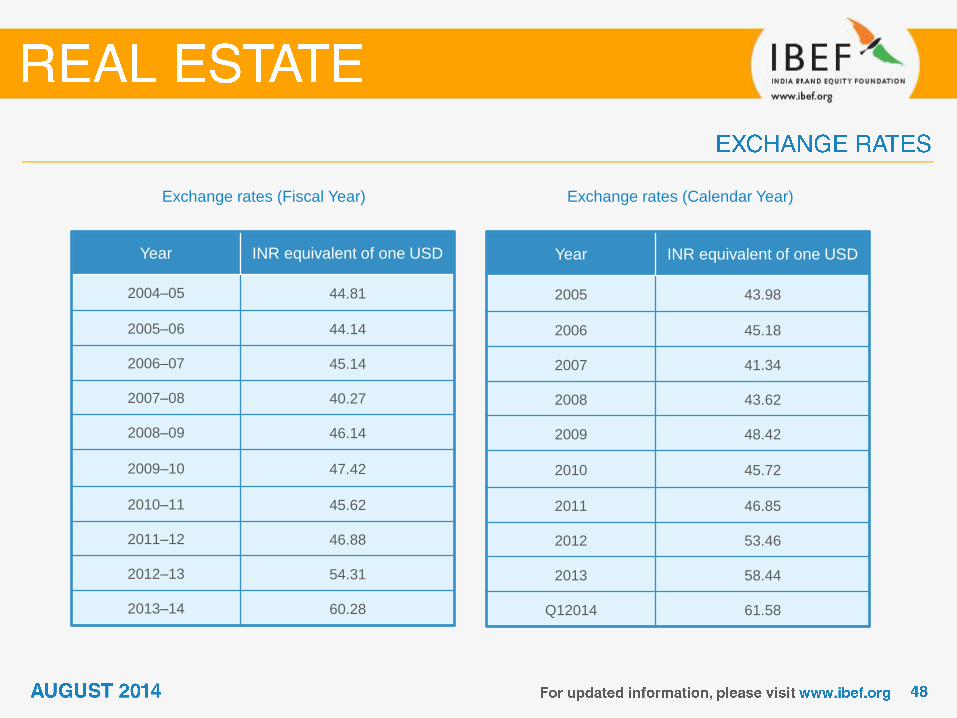
Year INR equivalent of one USD
2004–05 44.81
2005–06 44.14
2006–07 45.14
2007–08 40.27
2008–09 46.14
2009–10 47.42
2010–11 45.62
2011–12 46.88
2012–13 54.31
2013–14 60.28
Exchange rates (Fiscal Year)
Year INR equivalent of one USD
2005 43.98
2006 45.18
2007 41.34
2008 43.62
2009 48.42
2010 45.72
2011 46.85
2012 53.46
2013 58.44
Q12014 61.58
Exchange rates (Calendar Year)

India Brand Equity Foundation (“IBEF”) engaged Aranca to prepare this presentation and the same has been prepared
by Aranca in consultation with IBEF.
All rights reserved. All copyright in this presentation and related works is solely and exclusively owned by IBEF. The
same may not be reproduced, wholly or in part in any material form (including photocopying or storing it in any medium
by electronic means and whether or not transiently or incidentally to some other use of this presentation), modified or in
any manner communicated to any third party except with the written approval of IBEF.
This presentation is for information purposes only. While due care has been taken during the compilation of this
presentation to ensure that the information is accurate to the best of Aranca and IBEF’s knowledge and belief, the
content is not to be construed in any manner whatsoever as a substitute for professional advice.
Aranca and IBEF neither recommend nor endorse any specific products or services that may have been mentioned in
this presentation and nor do they assume any liability or responsibility for the outcome of decisions taken as a result of
any reliance placed on this presentation.
Neither Aranca nor IBEF shall be liable for any direct or indirect damages that may arise due to any act or omission on
the part of the user due to any reliance placed or guidance taken from any portion of this presentation.


