Page 1
5/10/2018 FDI - slidepdf.com
http://slidepdf.com/reader/full/fdi5571fc8b4979599169977641 1/117
Wesleyan University The Honors College
Foreign Direct Investment and ExportPerformance in Thailand
by
Sutida Tambunlertchai
Class of 2009
A thesis submitted to the
faculty of Wesleyan University
in partial fulfillment of the requirements for the
Degree of Bachelor of Arts
with Departmental Honors in the Mathematics-Economics Program
Middletown, Connecticut April, 2009
Page 2
5/10/2018 FDI - slidepdf.com
http://slidepdf.com/reader/full/fdi5571fc8b4979599169977641 2/117
Abstract
This research project aims to further shed light on the influences of FDI onfirm-level export outcomes in Thailand. The goals of this paper are to identify thefactors, particularly those related to FDI, that determine firms’ export orientation,and to make policy recommendations with regard to facilitating MNCs exportspillovers. Findings from this research indicate that firms’ decisions to export areheavily influenced by the governments’ export promotion policies and the presenceof foreign direct investors. Secondary findings further suggest that the intensityof a firm’s exports is increasing in the percentage of foreign ownership in the
domestic firms.
Page 3
5/10/2018 FDI - slidepdf.com
http://slidepdf.com/reader/full/fdi5571fc8b4979599169977641 3/117
Acknowledgments
I would like to thank my advisor, Professor Christiaan Hogendorn, for thekindness, the support, and the guidance he has shown, not only throughout theprocess of conducting this research, but also throughout my past 4 years at Wes-leyan.
I would also like to thank my family for being a great source of encourage-ment and advice. I especially thank my father and my two older sisters—Suchananand Kanittha—for their patience in answering my impossible questions and alsofor their many hours spent on proofreading and commenting on my work.
Thank you.
Page 4
5/10/2018 FDI - slidepdf.com
http://slidepdf.com/reader/full/fdi5571fc8b4979599169977641 4/117
Contents
1 Introduction 1
1.1 The Scope of Study . . . . . . . . . . . . . . . . . . . . . . . . . . 6
1.2 Structure of this Research Paper . . . . . . . . . . . . . . . . . . . 8
2 Motives and Effects of Foreign Direct Investment 9
2.1 Definitions and Types of Foreign Direct Investment . . . . . . . . 102.1.1 Types of FDI . . . . . . . . . . . . . . . . . . . . . . . . . 11
2.2 Motives for Foreign Direct Investment . . . . . . . . . . . . . . . 172.3 Effects of Foreign Direct Investment . . . . . . . . . . . . . . . . . 222.4 Foreign Direct Investment and Export Expansion in LDCs . . . . 27
3 Thailand’s Experience: Growth Records, Industrialization Expe-
rience, Trade, and Exports 30
3.1 Thailand’s Past Growth Records . . . . . . . . . . . . . . . . . . . 323.2 Thailand’s Trade and Export Structures . . . . . . . . . . . . . . 34
3.2.1 Trade Structure . . . . . . . . . . . . . . . . . . . . . . . . 353.2.2 Export Structure . . . . . . . . . . . . . . . . . . . . . . . 36
3.3 Thailand’s Foreign Direct Investment Experience . . . . . . . . . 383.3.1 International Trade Development . . . . . . . . . . . . . . 393.3.2 Patterns of FDI in Thailand . . . . . . . . . . . . . . . . . 423.3.3 Policies on FDI in Thailand . . . . . . . . . . . . . . . . . 44
3.4 Thailand’s Industrial Sector Overview and the Multinational Cor-porations . . . . . . . . . . . . . . . . . . . . . . . . . . . . . . . 453.4.1 The Food Industry . . . . . . . . . . . . . . . . . . . . . . 463.4.2 The Textile and Clothing Industries . . . . . . . . . . . . . 473.4.3 The Electrical Appliances and Electronics Industries . . . 48
4 Conceptual Framework and Data Description 50
4.1 Conceptual Framework . . . . . . . . . . . . . . . . . . . . . . . . 514.2 The Models . . . . . . . . . . . . . . . . . . . . . . . . . . . . . . 54
iii
Page 5
5/10/2018 FDI - slidepdf.com
http://slidepdf.com/reader/full/fdi5571fc8b4979599169977641 5/117
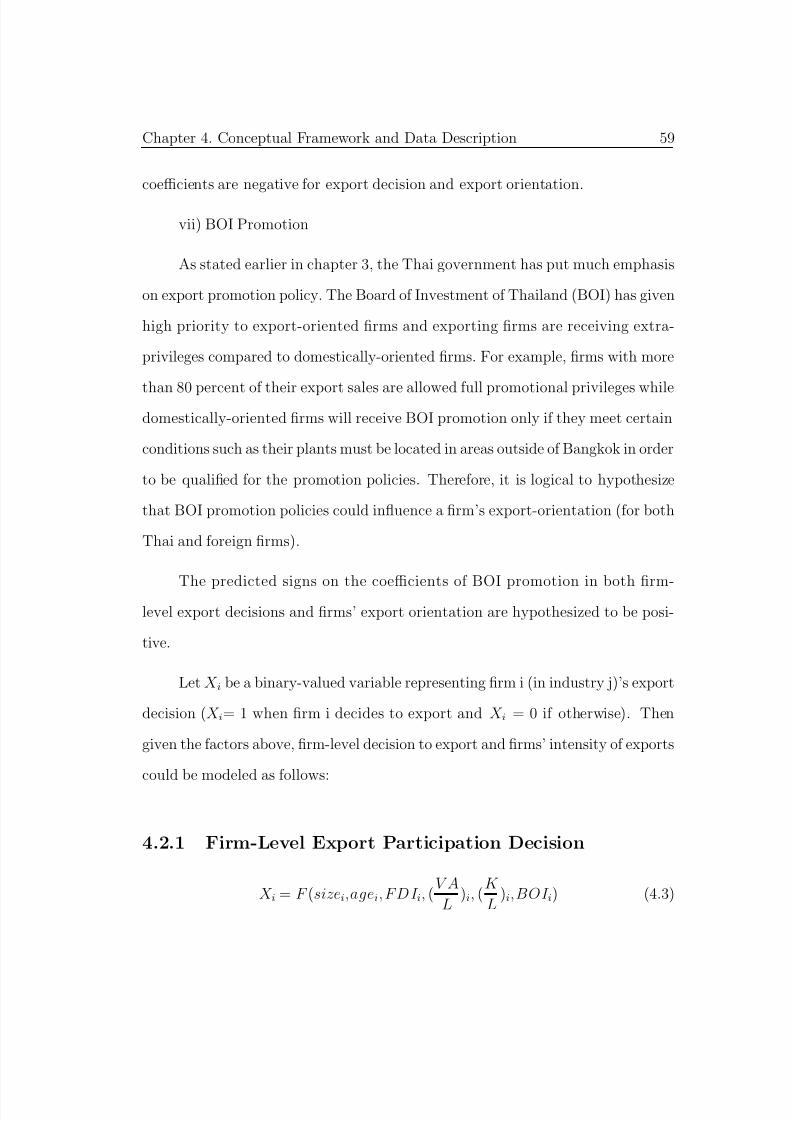
4.2.1 Firm-Level Export Participation Decision . . . . . . . . . . 594.2.2 Firm’s Level of Export Orientation . . . . . . . . . . . . . 61
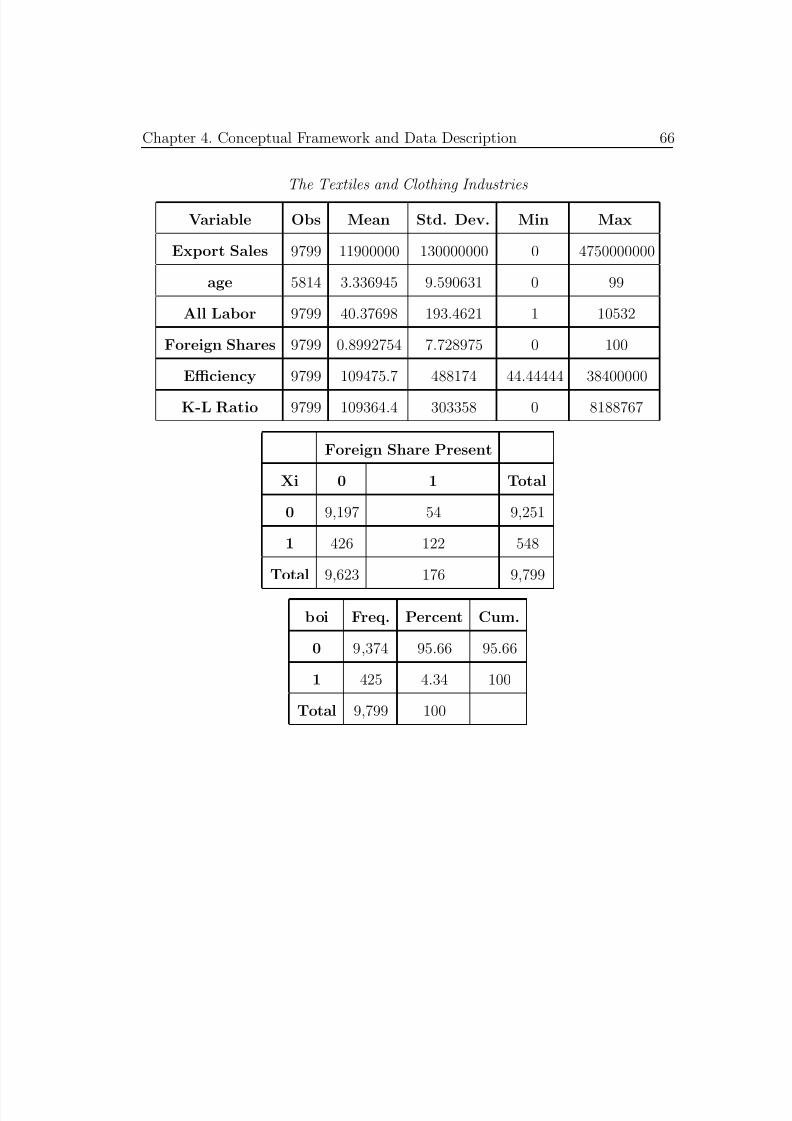
4.3 Data Description . . . . . . . . . . . . . . . . . . . . . . . . . . . 62
5 Econometric Procedures, Results, and Discussion 71
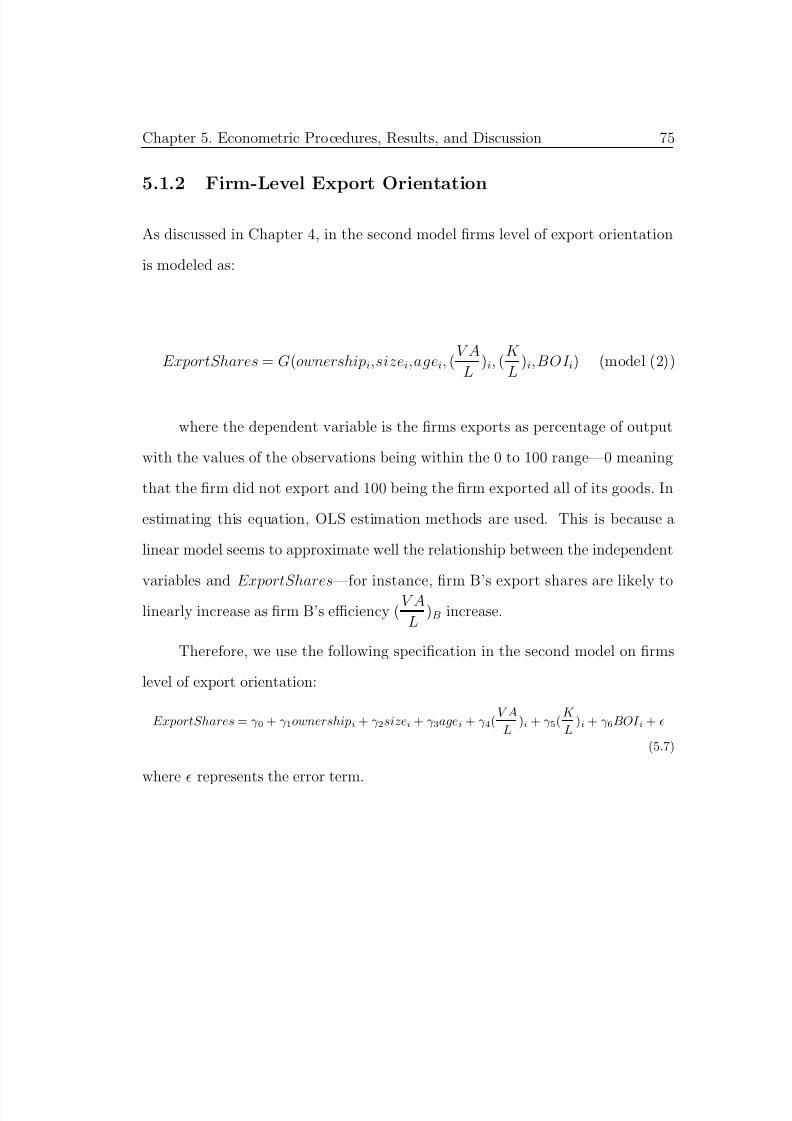
5.1 Econometric Procedures . . . . . . . . . . . . . . . . . . . . . . . 725.1.1 Firm-Level Export Decision . . . . . . . . . . . . . . . . . 725.1.2 Firm-Level Export Orientation . . . . . . . . . . . . . . . 75
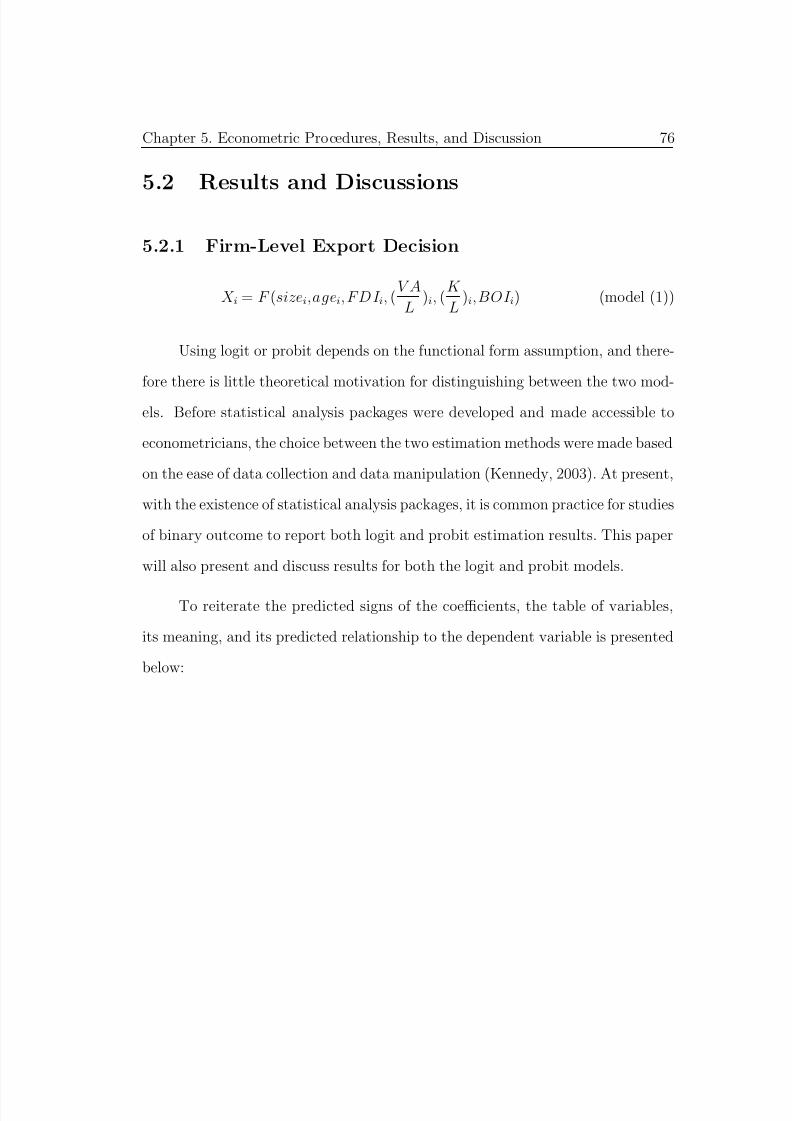
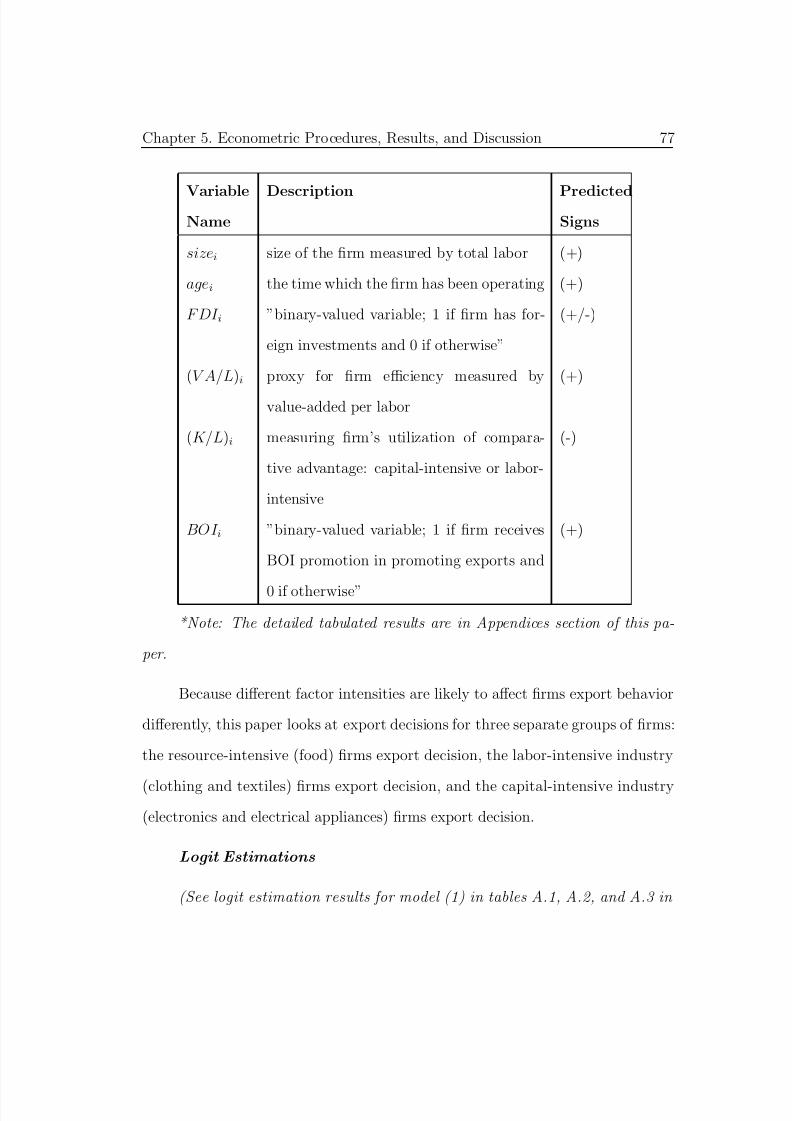
5.2 Results and Discussions . . . . . . . . . . . . . . . . . . . . . . . 765.2.1 Firm-Level Export Decision . . . . . . . . . . . . . . . . . 765.2.2 Firm-Level Export Orientation . . . . . . . . . . . . . . . 85
6 Conclusion 93
A Appendix A 102
B Appendix B 106
C 107
Page 6
5/10/2018 FDI - slidepdf.com
http://slidepdf.com/reader/full/fdi5571fc8b4979599169977641 6/117
Chapter 1
Introduction
Foreign direct investment (FDI) is the process whereby residents of one country
(the source country) acquire ownership of assets for the purpose of controlling the
production, distribution, and other activities of a firm in another country (the
host country); (Moosa, 2002). Foreign direct investment is an investment which
involves a long-term relationship and reflects a lasting interest and control of a
resident entity in one economy (foreign direct investor of foreign enterprise) in an
enterprise resident in an economy other than that of the foreign direct investor
(FDI enterprise, affiliate enterprise, or foreign affiliate); (UNCTAD, 1999). In
general, three criteria characterize FDI (Caves, 1996):
i) The multinational enterprises (MNEs) show a long-term controlling inter-
est over their subsidiaries’ production and distribution process
ii) There are movements of productive factors other than capital—such as
transfers of (skilled) labor to the host country, movements of knowledge and man-
1
Page 7
5/10/2018 FDI - slidepdf.com
http://slidepdf.com/reader/full/fdi5571fc8b4979599169977641 7/117
Chapter 1. Introduction 2
agement techniques, etc.
iii) There is evidence of the non-rate of return motive to invest—which may
include conducting FDI in order to expand profits and sales, to seek cheaper raw
materials, labor, and market, etc.
Past literature on FDI and the host country suggests that FDI brings both
positive and negative externalities to the host countries. Positive externalities
include technology and knowledge spillovers, income and employment generation,
export spillovers, etc., whereas negative externalities include adverse environmen-
tal impact, crowding out of domestic investments and financial resources, intro-
duction to inappropriate consumption patterns, etc.
Existing literature also suggests that FDI influences the host countries’ in-
dustrialization process by acting as a catalytic factor in the host economies’ shift
from being agricultural-based to being manufacturing-based. Thailand is an ex-
ample where FDI has played an important role in shifting the country’s mainexport bulk from resource-based products in the agricultural sector (in the 1950s
and 1960s) to labor-intensive products which employ more advanced technologies
and imported raw materials in the production process.
Besides FDI, export orientation has also been hailed as an engine of growth.
The Newly Industrialized Economies’ (NIEs: Singapore, Hong Kong, and Tai-
wan) successful economic development has been attributed to these economies’success in pursuing an export-led growth strategy (Kohpaiboon, 2007). Such
success stories have prompted other developing economies to look to exports—
especially manufactured exports—as a potential driving force for their economic
Page 8
5/10/2018 FDI - slidepdf.com
http://slidepdf.com/reader/full/fdi5571fc8b4979599169977641 8/117
Chapter 1. Introduction 3
development. A well-planned export-led growth strategy can stimulate economic
activities and induce more efficient resource allocation, generating income and
employment and thus better quality of life outcomes for the country.
There is a strong and natural link between FDI and export-driven economic
growth. Multinational corporations (MNCs, or multinational enterprises: MNEs)
that engage in FDI have a key role in channeling products from host countries
to the international markets through their global distribution networks. Multina-
tional corporations, therefore, are considered amongst the important ingredients
in an economy’s exporting success. Aside from providing the export channels,
MNCs also bring technologies and human capital to the host countries. Because
of the global competition they face, MNCs generally emphasize research and de-
velopment (R&D) in order to improve the quality of their products as well as
the efficiency of their production process. Many MNCs, therefore, are owners of
advanced production technologies, some of which are transferred to factories and
plants in the host countries where they invest.
It is straightforward to see that the entrance of export-oriented MNCs helps
generate export growth as well as induce local firms in the host country to make
use of the technology spillovers and market linkages to export their own products.
FDI inflows contribute to host countries’ export expansion. In particular, owing
to the MNCs superior technology, existing marketing channels, etc. the foreign
firms create positive externalities on domestic producers’ exporting decision—they
induce local firms to export. This positive externality on local firms’ exporting
status is known as MNCs export spillover. Such spillovers, however, are not au-
Page 9
5/10/2018 FDI - slidepdf.com
http://slidepdf.com/reader/full/fdi5571fc8b4979599169977641 9/117
Chapter 1. Introduction 4
tomatic, and will take place under suitable policy environments. In other words,
effective spillovers are contingent upon appropriate strategies of the foreign in-
vestors and conducive trade policies of the host country. For example, lack of
intellectual property laws may cause foreign investors to be more reluctant to
share certain firm-specific assets such as production techniques, analytical tools,
or ideas with partnering local firms.
As we can see, policies not only affect FDI by MNCs, but also determine
the transmission of technology and knowledge from the MNCs to local firms and
workers. Such spillover is important for the creation and sustainability of lo-
cal export capacity, which in turn, is vital for long-term economic growth and
competitiveness. A clear understanding of MNCs export spillovers—the channels
through which FDI affects firm-level export capacity—will have direct implica-
tions on a country’s trade and investment policies. Despite the importance of this
understanding, however, the topic has not been widely explored and relatively
little is known about factors that affect MNCs export spillovers (Kohpaiboon,
2007).
Among the few studies on the FDI and exports which exist, Aitken et al.
(1997) and Kokko et al. (2001) present case studies of MNCs and exports in
developing economies. Aitken et al. (1997) discuss the case of Mexico while
Kokko et al. (2001) look at the case of Uruguay. These studies, although very
informative, pertain to cases that are difficult to generalize to other developing
economies. MNCs export spillovers in Mexico, for instance, are influenced by
many country-specific factors. Mexico’s special economic relationship with, as
Page 10
5/10/2018 FDI - slidepdf.com
http://slidepdf.com/reader/full/fdi5571fc8b4979599169977641 10/117
Chapter 1. Introduction 5
well as its proximity to, the U.S. means that American MNCs account for much
of the total FDI inflows to the country. This makes Mexico’s circumstances more
suitable for studying the role of American MNCs rather than the role of general
MNCs export spillovers. On the other hand, Kokko et al.’s (2001) case study
of Uruguay is difficult to generalize because the level of openness in trade and
investment of Uruguay is relatively low compared to other developing countries like
China, Hong Kong, Bangladesh, Thailand, etc. This coupled with the smallness
of Uruguay mean that foreign investors’ presence in the country is limited andonly covers a few selected industries.
Studies of FDI and exports in the past five years have mainly focused on
the causality of FDI on exports and firm efficiency, but not on how FDI impacts
firms’ export decisions (Clerides, Lach, and Tybout, 1998; Bernard and Jensen,
1999; Aw, Chung, and Roberts, 2000; Hahn, 2004). And while many studies
in the International Marketing field (Toni and Nassimbeni, 2001) have focused
on exports, they appear to not take FDI into consideration. In studying export
growths in East and Southeast Asian countries, however, FDI cannot be ignored.
Lipsey (1999) finds a clear evidence of the importance of MNCs on the export-led
growth in these regions.
For these reasons, I hope that my work will contribute to a better under-
standing of the roles of FDI and MNCs on firms’ export capabilities and thus their
influences on a country’s export performance. This paper uses Thailand as a case
study for developing economies. I make use of firm-level cross-sectional data to
empirically test for the presence of MNCs export spillover effects and to identify
Page 11
5/10/2018 FDI - slidepdf.com
http://slidepdf.com/reader/full/fdi5571fc8b4979599169977641 11/117
Chapter 1. Introduction 6
the factors that promote such spillovers.
1.1 The Scope of Study
This research project aims to further shed light on the influences of FDI on firm-
level export outcomes in Thailand. The goals of this paper are to identify the
factors, particularly those related to FDI, that determine firms’ export orientation,
and to make policy recommendations with regard to facilitating MNCs export
spillovers.
Thailand has always been referred to as a developing country which has been
successful in pursuing an export-led growth strategy (World Bank, 1993; Krueger,
1995; Hahn, 2004; Brimble, 2002). Attracted to invest in Thailand by its invest-
ment promotion policies that encourage continuous, long-term investments from
foreign investors, MNCs have had a crucial role in this country’s industrialization
experience over the past 50 years.
Thailand’s trade policies over the past five decades have encouraged long-
term foreign engagements in FDI, equity investments, and investment loans. Fur-
thermore, the country’s relative political stability, abundant resources, as well as
low-cost skilled and unskilled labor make Thailand an ideal FDI location. FDI,
therefore, exists in almost every economic sector in the country. Because of the
continuity of FDI presence, Thailand provides an interesting case study for the
topic of FDI and export spillovers.
Since the 1960s, Thailand has opened its economy to foreign investors—
Page 12
5/10/2018 FDI - slidepdf.com
http://slidepdf.com/reader/full/fdi5571fc8b4979599169977641 12/117
Chapter 1. Introduction 7
first by adopting an import-substitution (IS) trade regime, then by transitioning
to an export-promotion (EP) regime in the 1980s, after passing the Investment
Promotion Law in 1977. The main sources of FDI to Thailand throughout the
past five decades are Japan, the U.S., Hong Kong, and Taiwan. The economies
which have been the main recipients of Thai exports are: the U.S., Japan, the
European Union (EU) countries like Germany, the Netherlands, and the U.K., the
newly industrialized economies (NIEs) such as China, Hong Kong, Taiwan, and
ASEAN countries like Singapore.
In this research paper, I will conduct a literature survey and an empirical
analysis of FDI and export spillovers in the manufacturing sector in Thailand.
I will use firm-level cross-sectional data from the 2007 Industrial Census from
the National Statistical Office of Thailand (NSO). Analyses will focus on the
three main industries in Thailand—the food industry, the textiles and clothing
industries, and the electronics and electrical appliances industries. These three
industries are chosen to represent the three groups of industries categorized by fac-
tor intensity—labor-intensive, capital-intensive, and resource-intensive industries.
The food industry is representative of a resource-intensive or a resource-based
industry where there is heavy use of local resources, in this case, of agricultural
goods. The textiles and clothing industries is representative of a labor-intensive
industry, where there is low capital-labor (K/L) ratio when compared to other
industries. Finally, the electronics and electrical appliances industries is repre-
sentative of a capital-intensive industry where there is high capital-labor ratio.
The division of industries is based on the 4-digit International Standard Indus-
trial Classification’s (ISIC) third revision grouping, with the food industry’s first
Page 13
5/10/2018 FDI - slidepdf.com
http://slidepdf.com/reader/full/fdi5571fc8b4979599169977641 13/117
Chapter 1. Introduction 8
two digits starting with 15, the textiles and clothing industries’ first two digits
starting with 17 and 18, and the electronics and electrical appliances industries
first two digits starting from 30 up until 32.
1.2 Structure of this Research Paper
I will proceed with this research paper in the following manner. Chapter two
will give a review of literature on the motives of FDI and its effects on the host
economy with an emphasis on effects of FDI and export expansion. Chapter three
provides a chronological background on Thailand’s industrialization experience,
growth records, from import substitution to export promotion, the food, textile,
and electronics and electrical appliances industries, and finally the importance of
foreign trade and investment in Thailand. This third chapter’s discussion will
also encompass FDI in Thailand—presenting the patterns of FDI in Thailand,government policies which have been implemented since the 1960s, as well as
the trend in policies and FDI in Thailand. Facts and figures on the economic
growth, FDI situation, and exports in Thailand will also be presented in this
section. Chapter four will focus on the conceptual framework, the hypotheses,
the dataset and the models studied in this research paper. Chapter five will be
on the empirical analysis of my hypotheses. The empirical techniques, results,
significance, implications, and estimation evaluations will be explained in this
chapter. Finally, chapter six concludes the research project with the summary of
the findings as well as the policy implications from the results.
Page 14
5/10/2018 FDI - slidepdf.com
http://slidepdf.com/reader/full/fdi5571fc8b4979599169977641 14/117
Chapter 2
Motives and Effects of Foreign
Direct Investment
This chapter provides a brief summary of existing theories on foreign direct in-
vestment (FDI). Section 2.1 presents a brief definition and an overview of the
classifications of FDI. Section 2.2 is on the motives for FDI—this section will
present theories which could be used to explain why FDI, multinational corpo-
rations (MNCs) and transnational corporations (TNCs) exist. In section 2.3, a
summary of existing literature on the effects of FDI on the host economy is pro-
vided. Finally, in section 2.4, the topic of FDI and export expansion will be
covered. As this research focuses on the case of Thailand—a developing economy
in Southeast Asia, the discussion in section 2.4 will emphasize on FDI and ex-
port expansion in the case of developing countries and/or less-developed countries
(LDCs). This is so that the discussion on FDI and exports in section 2.4 can be
9
Page 15
5/10/2018 FDI - slidepdf.com
http://slidepdf.com/reader/full/fdi5571fc8b4979599169977641 15/117
Chapter 2. Motives and Effects of Foreign Direct Investment 10
more relevant to explaining the situation in Thailand—a discussion which will be
covered in the next chapter.
2.1 Definitions and Types of Foreign Direct In-
vestment
Foreign direct investment (FDI), as stated earlier in chapter 1 is an investment
that is made to acquire a lasting interest in an enterprise operating in an economy
other than that of the investor; the investor’s purpose being to have an effective
voice in the management of the enterprise (International Monetary Fund’s Balance
of Payments Manual ). FDI occurs when a firm invests directly in production or
other facilities, over which it has effective control, in a foreign country. It involves
the direct control of the capital invested and, more importantly, a movement
of factors of production other than capital such as skilled labor, technological
knowledge and management.
The distinguishing feature of FDI, in comparison with other forms of in-
ternational investment, is the element of control over management policy and
decisions. The term ‘control’ in FDI, as Moosa (2002) defines it, implies that
some degree of discretionary decision-making by the investor is present in man-
agement policies and strategy. FDI differs from portfolio investment in the sense
that portfolio investors do not have direct control over their investments like for-
eign direct investors do. Moreover, portfolio investors do not portray a long-term
investment interest; investing decisions are largely based on risk-return factors,
Page 16
5/10/2018 FDI - slidepdf.com
http://slidepdf.com/reader/full/fdi5571fc8b4979599169977641 16/117
Chapter 2. Motives and Effects of Foreign Direct Investment 11
and thus, portfolio investors have a high turnover of their securities. FDI also dif-
fers from domestic investment in that a firm investing in a foreign country has to
face environmental factors that are different from those in its own country.
2.1.1 Types of FDI
There are many categories which can be used to classify FDI. It can be classi-
fied from the host country’s perspective, from the foreign investor’s (the source
country) perspective, from the intention of the investing firms, from the type of
industries in which the investing firms setup production facilities, etc. For the
purpose of this study, I use the following categorizations of FDI—from the host
country’s perspective, from the investor’s perspective, from the intention of the
investing firm, and from the modes of operation.
From the perspective of the host country, FDI can be divided into three
groups: i) import-substituting FDI; ii) export-increasing FDI; and iii) government-
initiated FDI. Moosa(2002) provides a good explanation for each group as fol-
lows:
i) Import-substituting FDI
Import-substitution refers to the process whereby domestic production replaces
imports. Therefore, import-substituting FDI generally refers to situations in
which an economy takes up the production of goods and services which were
previously imported. Barriers to entry such as tariffs and quotas play an impor-
tant part in bringing about this type of FDI—with high barriers to entry, foreign
firms have the incentives to directly invest and to set up production plants in the
Page 17
5/10/2018 FDI - slidepdf.com
http://slidepdf.com/reader/full/fdi5571fc8b4979599169977641 17/117
Chapter 2. Motives and Effects of Foreign Direct Investment 12
host country.
This type of FDI necessarily implies that imports by the host country and
exports by the investing country will decline. Import-substituting (IS) FDI is
likely to be determined by the size of the host country’s market, transportation
costs, and trade barriers (Moosa, 2002).
ii) Export-increasing FDI
Export-increasing or export-promoting FDI is motivated by the investing firms’
desire to seek new sources of inputs such as raw materials or intermediate goods.
Another motivation for this type of FDI could also be from the MNCs’ intention
of using the host country as a base to export their products to the host country’s
neighboring countries. This type of FDI is export-increasing in the sense that the
host country’s exports of raw materials and intermediate products to the investing
country—as well as to other countries where the subsidiaries of the MNCs are
located—generally increase as a result of such investments.
iii) Government-initiated FDI
Government-initiated FDI is triggered when a government offers incentives to
foreign investors in an attempt to eliminate a balance of payments deficit.
The classification of FDI based on the investors’ perspective is presented in
Caves (1971). He categorizes FDI into three groups: i) horizontal FDI; ii) vertical
FDI; and iii) conglomerate FDI. The explanation for each group is as follows:
i) Horizontal FDI
Horizontal FDI is undertaken for the purpose of horizontal expansion—to produce
similar kinds of goods abroad as in the source country. This type of investment
Page 18
5/10/2018 FDI - slidepdf.com
http://slidepdf.com/reader/full/fdi5571fc8b4979599169977641 18/117
Chapter 2. Motives and Effects of Foreign Direct Investment 13
is usually motivated by the drive for expansion of the firm and/or is influenced
by protective tariffs in foreign markets. More generally, horizontal FDI is under-
taken to exploit more fully certain monopolistic or oligopolistic advantages such
as patents or differentiated products, particularly if expansion at home violate
anti-trust laws. As horizontal FDI is normally conducted so as to exploit monop-
olistic and/or oligopolistic advantages, product differentiation is a critical element
of this type of FDI.
ii) Vertical FDI
There are two subcategories within vertical FDI: backward vertical FDI and for-
ward vertical FDI. Backward vertical FDI is the case where investors engage in
FDI in order to exploit raw materials in the host country. Forward vertical FDI,
on the other hand, is undertaken so that the investors could be nearer to the
consumers through the acquisition of distribution outlets.
iii) Conglomerate FDI
Conglomerate FDI involves both horizontal and vertical FDI. A conglomerate
MNC is a diversified company whose plants’ outputs have traits of both vertically
and horizontally integrated investments. This type of FDI brings about what is
called diversified MNCs.
Chen and Ku (2000), on the other hand, categorize FDI using the investors’
intention as a basis. Their two groups of FDI are: expansionary and defen-
sive.
i) Expansionary FDI
The authors suggest that expansionary FDI seeks to exploit firm-specific advan-
Page 19
5/10/2018 FDI - slidepdf.com
http://slidepdf.com/reader/full/fdi5571fc8b4979599169977641 19/117
Chapter 2. Motives and Effects of Foreign Direct Investment 14
tages in the host country. Such firm-specific advantages include: scale, research
and development (R& D) intensity, profitability, and motives for technology ac-
quisition. This type of FDI has the additional benefit of contributing to sales
growth of the investing firm at home and abroad.
ii) Defensive FDI
In the case of defensive FDI, Chen and Ku (2000) suggest that this type of FDI
seeks cheap labor in the host country with the objective of reducing the cost of
production—somewhat similar to the case of backward vertical FDI. In Chen and
Yang (1999) on the case of Taiwan, empirical evidence suggests that this type of
FDI is motivated by cost reduction and production networks.
By using the modes of operation to classify FDI, Saggi (2000) proposes that
FDI be divided into three groups: i) licensing FDI; ii) joint venture FDI; and iii)
wholly owned subsidiary FDI. Saggi’s division of FDI is beneficial for studying the
role of FDI in knowledge and technological transfers as well as for understanding
the motives of MNCs in choosing their modes of operation (Tambunlertchai, 2004).
Markusen and Markus (1999) calls this type of FDI classification the Knowledge-
Capital Model which sees factors of production and MNCs’ proprietary assets
as transferable and can be used in many locations at the same time. Saggi (2000)
suggests that an MNC’s decision to enter a foreign market through each mode
of operation is determined by the MNC’s incentives to protect their proprietary
assets.
i) Licensing FDI
Licensing FDI is generally conducted when there is significant information asym-
Page 20
5/10/2018 FDI - slidepdf.com
http://slidepdf.com/reader/full/fdi5571fc8b4979599169977641 20/117
Chapter 2. Motives and Effects of Foreign Direct Investment 15
metry between the source economy and the host economy—for instance, foreign
investors may not know the supply-demand conditions of factors of production,
the level of political stability, etc. and thus, would choose to reduce the risk of
operation by licensing their businesses to local producers at first. This licensing
mode of operation is pursued not only to reduce the risk in operation but also to
collect information on the host country’s market.
Through licensing, local firms which are licensees of the MNCs will bene-
fit from their foreign affiliates’ more advanced technology and knowledge. The
spillover of knowledge and technologies as well as having the tools will put local
licensees at an advantage when competing with other local firms without foreign
counterparts.
However, in the long-run, foreign investing firms would generally not con-
tinue the licensing contract. This is because given firms’ profit-maximizing and
cost-reducing behavior, continuing to pay for the cost of licensing after having
learned enough information about the market to start an operation on its own is
not optimal. However, even though the contract is usually short-term, licensees
stand to benefit greatly from the technology and/or knowledge transfer from their
foreign counterparts. In most cases, they retain their advantage over other local
firms even after the foreign affiliation expires. Thus, it can be said that licensing
is beneficial for both the investing firm and the licensees.
ii) Joint venture FDI
Other than information asymmetry, MNCs can also be faced with the risk of
having to pay a higher fixed cost of operation as well as the risk of incorrectly
Page 21
5/10/2018 FDI - slidepdf.com
http://slidepdf.com/reader/full/fdi5571fc8b4979599169977641 21/117
Chapter 2. Motives and Effects of Foreign Direct Investment 16
predicting the host country’s demands for its products. Under such circumstances,
MNCs usually opt to engage in FDI through the form of joint ventures.
Joint venture FDI is beneficial to both the MNCs and its affiliates. The
investing MNCs benefit from their affiliates’ knowledge of the industry, the con-
sumer networks, and the distribution channels in the host market. On the other
hand, the MNCs’ domestic affiliates also benefit from the source firm in the sense
that they could learn managerial skills and marketing techniques, which would
make the firm’s operations more efficient, giving it an advantage over local firms
in the same industry.
iii) Wholly owned subsidiary FDI
When MNCs fear that their proprietary assets might spillover and get adopted by
their domestic affiliates in the foreign market, they would opt to enter the foreign
market through creating a wholly owned subsidiary FDI. This is done so that the
source firm can have full control over all operations and so that the values of the
source firms’ proprietary assets will not leak out.
MNCs which choose to setup wholly owned subsidiaries are generally protec-
tive of their proprietary assets. This is because the value of the MNCs’ proprietary
assets may depreciate if other firms adopt similar and/or the same assets. For ex-
ample, Coca-Cola is an MNC which has the recipe for its beverage as a proprietary
asset. Should another beverage firm get a hold of this recipe and produce similar
drinks, Coca-Cola will have a competitor and lose its market share. Therefore,
wholly owned subsidiary FDI are generally setup when there is need to protect the
firms’ proprietary assets as the firm would have full control over the operations of
Page 22
5/10/2018 FDI - slidepdf.com
http://slidepdf.com/reader/full/fdi5571fc8b4979599169977641 22/117
Chapter 2. Motives and Effects of Foreign Direct Investment 17
its subsidiaries.
When categorizing FDI in terms of modes of operation (Saggi, 2000), we
should keep in mind that there are constant changes to the modes of operations
which an MNC may choose. For example, when a licensing MNC has gained
enough information to startup a plant in the host country, it would generally opt
out of continuing the license contract. Dynamics in modes of FDI operation exist
and have yet to be clearly determined and developed.
2.2 Motives for Foreign Direct Investment
The surge of FDI in the late 20th century drew significant interest to the study of
foreign investments—particularly to the study of what motivates the creation of
MNCs and transnational corporations (TNCs). Owing to the fact that investing
firms which engage in FDI must face additional costs due to operating at a distance
as well as costs of uncertainty (as discussed earlier in section 2.1), many economists
during the period were interested in questions about the main factors influencing
decisions to invest in a foreign country, or why direct investment is preferred to
portfolio investment, etc. Motives for FDI were the central topic of discussion in
much of trade literature in the late 20th century.
At the early stages of FDI boom, many economists were interested in pro-
viding a satisfactory answer to the questions of why MNCs exist at all—why
markets are not served by exports from foreign firms or by production by locally
owned firms. The vast literature on MNCs arrives at a consensus on only a few
Page 23
5/10/2018 FDI - slidepdf.com
http://slidepdf.com/reader/full/fdi5571fc8b4979599169977641 23/117
Chapter 2. Motives and Effects of Foreign Direct Investment 18
issues. Markusen (1995) states that: there is some—but not unanimous—support
for John Dunning’s (1977, 1981) eclectic view as to the necessary conditions un-
der which a firm will undertake FDI. This theory is also known as the Eclectic
Theory of Foreign Direct Investment. It states that FDI will occur only if
the investing firm has the following three advantages: i) ownership advantage;
ii) internalization advantage; and iii) location advantage. Possession of the three
advantages will enable the foreign investing firm to out-compete other potential
suppliers in the domestic market.
i) Ownership advantage
The theory on ownership advantage in Dunning’s Eclectic Theory was highlighted
in Hymer (1976). The theory suggests that the investing firm must have compar-
ative advantage over other firms when conducting FDI because it is faced with
competition from local producers who are more familiar with the market, the
demand conditions, and the consumer group. Therefore, MNCs must have an
advantage arising from their ownership of some proprietary assets or rights which
can help them operate successfully in the host economy. This ownership of propri-
etary assets are called ownership advantages, which include things like the right
to a particular technology, monopoly power and size, access to raw materials, and
access to cheap financing.
ii) Internalization advantage
The foreign investing firm must also have an internalization advantage that leads
the MNC to buy or create a foreign subsidiary rather than license production
and/or distribution of a product to a firm in the host country. In other words,
Page 24
5/10/2018 FDI - slidepdf.com
http://slidepdf.com/reader/full/fdi5571fc8b4979599169977641 24/117
Chapter 2. Motives and Effects of Foreign Direct Investment 19
it must be more beneficial for the firm to use the advantages which they have
rather than sell or lease them. Such are internalization advantages that refer to
the choice between accomplishing expansion within the firm and selling the rights
to the means of expansion to other firms.
iii) Location advantage
The host country in which foreign investors are to engage in FDI must have a
location advantage for production, such as low tariff or transport cost barriers to
imports or low factor prices, which provide incentives for the MNC to produce
in the host country rather than to service it via exports. In particular, it must
be more profitable for the investing firm to use its ownership and internalization
advantages in combination with at least some factor inputs located abroad in the
host country. If this is not the case, then exports would suffice—there is no need
to conduct FDI.
Another well-accepted theory of FDI is one developed by Hymer (1976). The
theory emphasizes the monopolistic elements of FDI. It recognizes that operating
in a foreign country entails additional costs due to operating at a distance as well
as costs of uncertainty and misunderstanding. Therefore, for a firm to engage in
FDI in a foreign country, it must possess some sort of advantages over existing
or potential competitors in the host country. These advantages will allow the
foreign investing firms to gain a higher stream of income from a given amount
of capital when compared to that of the domestic firms’. This higher stream
of income which foreign direct investors receive will compensate the investors
for the additional costs. The advantages of foreign direct investors often lie in
Page 25
5/10/2018 FDI - slidepdf.com
http://slidepdf.com/reader/full/fdi5571fc8b4979599169977641 25/117
Chapter 2. Motives and Effects of Foreign Direct Investment 20
the form of departures from perfect competition in goods and factor markets—
including product differentiation, special marketing skills, superior technology,
and economies of scale.
Kindleberger (1970) adds to Hymer (1976) that firms will be more likely to
engage in FDI over exports if they are already operating at minimum costs at
home — additional production for exports would move them into a segment of
rising costs. Moreover, lower production costs abroad may be achieved because
of the procurement of cheap raw materials, an efficient transportation network,
superior managerial skills, non-marketable technology, and substantial investment
in R & D in the host country.
Vernon (1966), on the other hand, puts forward his Product Cycle Theory
which emphasizes the scientific advantage, product innovation, and the demand
conditions abroad, all of which lead to the setting up of overseas producing ca-
pacity of MNCs. He explains that product innovations are likely to be made in a
country with high income and large domestic market—such as the U.S. Once the
product is developed and there is demand for the product in the overseas market,
such demand will lead to export. Furthermore, if the product has a high income
elasticity of demand, the demand will expand rapidly in the growing overseas mar-
kets. Once the market expands, the source country’s entrepreneurs will be more
likely to take the risk of setting up a local producing facility in a foreign country
if cost conditions are favorable.
In the case of developing countries and LDCs, the Product Cycle Theory
suggests that FDI is more likely to occur in industries with standardized products
Page 26
5/10/2018 FDI - slidepdf.com
http://slidepdf.com/reader/full/fdi5571fc8b4979599169977641 26/117
Chapter 2. Motives and Effects of Foreign Direct Investment 21
that require significant inputs of labor. Such standardized products are usually
goods with high price elasticity of demand and do not rely heavily upon external
economies.
An alternative explanation for the motivation of FDI is the general quest
for growth of the firm. Balassa, as cited in Melo and Sapir (1991), contends
that the motives for FDI can be considered as part of the firm’s market strategy
in an attempt to improve or defend its position in both foreign and domestic
markets. An oligopolistic firm will be motivated to invest in a foreign country
if the effort of expansion in the domestic market tends to incite retaliation from
other oligopolists. Despite all the additional costs the investing firm has to pay
in order to conduct FDI, expansion into a foreign market may turn out to be a
less costly means of satisfying the growth motive of the firm (Tambunlertchai,
1975).
In spite of all the theories which are developed to explain the motives for
FDI, Caves (1971) points out that the motives for an MNC to engage in FDI
may be different for different forms of direct investments. For example, horizontal
FDI is motivated by the drive to expand the firm whereas vertical FDI is moti-
vated by the desire for raw materials and control over input sources. It can be
generally concluded, however, that the main motives for FDI and MNCs are the
quest for new distribution channels and the ability to draw upon resources and
market conditions in the host country such as availability of low cost inputs and
existence of trade barriers. Successful FDI endeavors allow MNCs to achieve its
objectives of increasing sales, protecting market shares, increasing profits, and
Page 27
5/10/2018 FDI - slidepdf.com
http://slidepdf.com/reader/full/fdi5571fc8b4979599169977641 27/117
Chapter 2. Motives and Effects of Foreign Direct Investment 22
reducing costs.
2.3 Effects of Foreign Direct Investment
The effects of FDI on both the source and the host countries are wide-ranged—FDI
impacts the economy, the industrial and trade structures, and export performances
of the countries involved. A full discussion of all the effects of FDI is beyond the
scope of this research paper. I will, however, focus on expositing the effects of
FDI on export performance. This section discusses how FDI impacts the host
country, confining its attention to economic rather than socio-political impacts of
FDI.
In the economic sphere, FDI can affect the pattern of production, consump-
tion and distribution in the host economy. In fact, it is difficult to make an
undisputable classification of what qualifies as an economic effect of FDI and
what does not. For example, the setting up of plants by foreign firms in the host
country may cause pollution in that country. Pollution created by the foreign
firm, in a way, can be considered an economic effect as it represents an adverse
welfare effect to the people in the host country. The same argument also applies
to the influence of the foreigners’ way of life and the products they introduce in
changing the consumption habits of the people in the host country. The discus-
sion in this section, however, will concentrate on certain aspects of FDI that are
generally considered to be economic effects in economic literature.
The discussion of economic effects of FDI to the host country in this section
Page 28
5/10/2018 FDI - slidepdf.com
http://slidepdf.com/reader/full/fdi5571fc8b4979599169977641 28/117
Chapter 2. Motives and Effects of Foreign Direct Investment 23
pertains to the following topics:
i) Effects on income and employment
FDI helps generate employment and income in the host economy. More invest-
ments bring about more production of goods and services which would lead to
a higher demand for labor. In response to the higher demand for labor, wages
will increase, which in turn leads to higher spending power. Increased spending
is beneficial to the host economy in the sense that it stimulates other economic
activities, and contributes to other economic linkages such as the production of
raw materials, improved logistics.
However, foreign investments do not always have positive effects on income
and employment in the host economy. For instance, the entrance of MNCs may
cause local firms to go out of business due to their inability to compete with the
MNCs. This would decrease employment and income amongst certain groups in
the host economy.
ii) Capital accumulation
Foreign direct investments lead to capital accumulation in the host economy. FDI
inflows not only bring in foreign currencies, but also help the host economy accu-
mulate physical capital from movement of factors of production such as capital,
machinery, and (skilled) labor from the source country. This will contribute to
the increase in the capital stock of the host economy.
iii) Efficient utilization of resource
With the MNCs’ advanced technology and superior knowledge, the entrance of
the firms to the host country could promote a more efficient utilization of re-
Page 29
5/10/2018 FDI - slidepdf.com
http://slidepdf.com/reader/full/fdi5571fc8b4979599169977641 29/117
Chapter 2. Motives and Effects of Foreign Direct Investment 24
sources. Furthermore, MNCs could bring about new goods and services, which
could introduce new uses of the host country’s resources. More efficient resource
extraction, lower levels of waste, and more ways to employ resources are amongst
the benefits of FDI.
iv) Technology and knowledge spillovers
Despite the MNCs’ reluctance to explicitly share their technologies and knowledge
with their local affiliates, technology and knowledge transfers could still take place
when there is FDI. Technology and knowledge spillovers can take place through
direct and indirect training as well as through other channels such as: a) the
demonstration effect; b) labor turnover; and c) backward linkages.
The demonstration effect occurs when the local affiliates try to emulate
their foreign affiliates’ techniques of operation. If the local affiliate has learned
enough about the operations, they may be able to setup their own firm in the
industry.
Spillovers through labor turnover takes place when workers in an MNC sub-
sidiary transfer to a domestic firm or start their own business after having learned
the technology, skills, and techniques from their former MNC employer.
Finally, knowledge spillovers through backward linkages generally take place
in industries outside that of the investing foreign firm. The technology and knowl-
edge transfer happens in industries upstream and downstream to the foreign firms’
industries. This is because foreign direct investors depend on the host country’s
raw materials in production, and therefore, must control for the quality of their
inputs. In doing so, the MNCs have to help firms in the upstream and downstream
Page 30
5/10/2018 FDI - slidepdf.com
http://slidepdf.com/reader/full/fdi5571fc8b4979599169977641 30/117
Chapter 2. Motives and Effects of Foreign Direct Investment 25
industries generate quality inputs which result in technology and knowledge trans-
fers.
v) Balance of trade and balance of payments effects
When MNCs set up plants in a host country and bring with them large amounts
of capital, they have a positive effect on the host country’s balance of payments.
Over time, foreign investors may remit their profits and the effects of FDI on
the country’s balance of payments will subside. However, there are many other
ways in which FDI can affect—both positively and negatively—the host country’s
balance of payments through the country’s trade and service balance such as
through imports, import-substitution, and exports.
When MNCs setup production plants in a foreign country, they have to
import machinery and raw materials from other countries into the host country.
This increase in imports from the entrance of the MNCs will lead to the host
economy’s loss of foreign currency. Import-substitution, on the other hand, helps
the host economy save on foreign currency—which is beneficial for the country’s
balance of payments. Similarly, through the entrance of MNCs, local industries
which were producing and exporting raw materials can produce and export more
finished goods with the help of MNCs. The host economy’s GDP per capital will,
thus, increase.
As we can see, the effect which FDI has on the host country’s balance of
trade and balance of payments could be both positive and negative, depending on
the situation and the behavior of the investing MNCs.
vi) Effects on the industrial structure
Page 31
5/10/2018 FDI - slidepdf.com
http://slidepdf.com/reader/full/fdi5571fc8b4979599169977641 31/117
Chapter 2. Motives and Effects of Foreign Direct Investment 26
The effects which FDI has on the host economy’s industrial structure include the
introduction of new goods and services, new industrial clusters, structural changes
in production and exports, and effects on an industry’s competitive edge. In the
case of an industry’s competitive edge, the effects of MNCs vary—it may create
positive or negative effects on the host country. Even though FDI could help
generate income, employment, and better resource utilization, it could also force
local firms to go out of business. For instance, if prior to the MNC’s entrance, the
existing firm in the industry is a monopoly, then the MNC will create competitionupon entering the host country. If the MNC possesses superior technology and
managerial skills, the entrance of the foreign firm may force the local firm out of
business. Under such a circumstance, in the long run, the MNC will make the in-
dustry it is in less competitive. Therefore, the effects of FDI on the host economy’s
industrial structure could be good or bad, depending on the situation.
vii) Consumption pattern effects
With the MNCs’ investments, more goods and services are introduced to the
host economy. Although this may provide consumers with more choices—better
quality at cheaper prices, it can, at the same time, bring in inappropriate spending
habits. For instance, the entrance of fast food chains into the host country or the
introduction of luxury goods to developing host countries may generate unsuitable
dietary habits or overspending amongst the people.
Page 32
5/10/2018 FDI - slidepdf.com
http://slidepdf.com/reader/full/fdi5571fc8b4979599169977641 32/117
Chapter 2. Motives and Effects of Foreign Direct Investment 27
2.4 Foreign Direct Investment and Export Ex-
pansion in LDCs
There is a widely shared view that FDI promotes exports by i) augmenting do-
mestic capital for exports; ii) helping transfer of technology and new products for
exports; iii) facilitating access to new and large foreign markets; and iv) providing
training for the local workforce and upgrading technical and management skills.
However, there is also a widely shared view that FDI may sometimes i) lower or
replace domestic savings and investment; ii) transfer in technologies which are low
level and/or inappropriate for the host country’s factor proportions; iii) target pri-
marily the host country’s domestic market and in fact does not increase exports;
iv) inhibit the expansion of indigenous firms that might become exporters; and v)
not help develop the host country’s dynamic comparative advantages by focusing
solely on local cheap labor and raw materials (Zhang, 2006).
Zhang (2006) puts forward in his study of FDI and China’s export perfor-
mance that one of FDI’s major potential growth-contribution is to promote host
countries’ exports. The United Nations Conference on Trade and Development
(UNCTAD), similarly, points out that theoretically, the stimulative effects of FDI
on exports of the host country derive from the additional capital, technology, and
managerial know-how which the MNCs bring with them, along with access to
global, regional, and especially home-country markets. Such resources which FDI
brings allow the host country to build new export activities as well as improve
their performance on existing ones. Zhang (2006) further suggests that FDI helps
Page 33
5/10/2018 FDI - slidepdf.com
http://slidepdf.com/reader/full/fdi5571fc8b4979599169977641 33/117
Chapter 2. Motives and Effects of Foreign Direct Investment 28
exports by investing capital in the exploitation of the host country’s compara-
tive advantage. In the case of China, MNCs invest their capital in utilizing and
improving the country’s low-cost labor.
A host country may expand its exports by hosting FDI since MNCs are
thought to carry advantages in entering world markets, such as established global
marketing networks. MNCs also bring in new technologies that may be diffused
among host country firms, making them more competitive abroad. In general,
one may distinguish between direct and indirect effects of FDI on host exports.
Direct effects refer to exports by foreign affiliates themselves (Zhang and Song
2000). The impact of FDI on export activities of local firms, on the other hand,
makes up the indirect effects (Zhang, 2006; Caves, 1996; Helleiner, 1989).
In the discussion of the direct effects of FDI on host country exports, it
is convenient to divide export activities of foreign affiliates into three categories
according to production characteristics: i) local raw materials processing; ii) new
labor-intensive final product exports; iii) labor-intensive processes and compo-
nent specialization within vertically integrated international industries (Zhang
and Song, 2000). MNCs may help developing country exporters to enter the world
markets through special arrangements to provide links to final buyers.
As for the indirect effects of FDI on host country exports, it involves the
influence of FDI on the competitiveness of host country firms and the diffusion of
new technologies. With the MNCs firm-specific assets, MNCs may increase com-
petition in host country markets and force existing firms to adopt more efficient
methods. FDI thus may improve the efficiency of host country firms through the
Page 34
5/10/2018 FDI - slidepdf.com
http://slidepdf.com/reader/full/fdi5571fc8b4979599169977641 34/117
Chapter 2. Motives and Effects of Foreign Direct Investment 29
diffusion of new technologies and management practices in host countries. The
third indirect effect is related to the linkage structure between foreign and local
firms.
Zhang and Song (2000) found that FDI is an important factor affecting
export performance in the case of China. FDI can help channel capital into in-
dustries that have the potential to compete internationally, and the global linkages
of MNCs can facilitate their access to foreign markets. FDI can also promote ex-
ports through the teaching of proper marketing strategies, methods, procedures,
and channels of distribution.
While FDI has the potential to help host countries’ exports, the benefits
do not accrue automatically or uniformly across countries. National policies and
host government bargaining powers relative to MNCs matter for attracting export-
oriented FDI and for reaping its full benefits for exports.
Page 35
5/10/2018 FDI - slidepdf.com
http://slidepdf.com/reader/full/fdi5571fc8b4979599169977641 35/117
Chapter 3
Thailand’s Experience: Growth
Records, Industrialization
Experience, Trade, and
Exports
Thailand’s industrialization process took off around 1961 with the first Economic
Development Plan. The 5-year Plan was issued by the Thai government and was
aimed at initiating an import-substituting industrialization process with private
investments taking the leading role. During this time, Thailands main exportswere agricultural products, which accounted for almost 80 percent of total exports.
Manufactures were mainly directed to local consumers. In the 1970s to 1980s, the
Thai government shifted its focus from pursuing an import-substituting regime to
30
Page 36
5/10/2018 FDI - slidepdf.com
http://slidepdf.com/reader/full/fdi5571fc8b4979599169977641 36/117
Chapter 3. Thailand’s Experience: Growth Records, IndustrializationExperience, Trade, and Exports 31
emphasizing and encouraging export-promoting FDI inflows to Thailand. FDI,
and manufactured products have been rapidly growing since. In terms of shares
of GDP, manufactures’ share has grown from merely 12 percent in 1960 to 40
percent today, while agriculture’s share has declined from 40 percent in 1960 to
approximately 10 percent. Today, manufactured products account for more than
80 percent of Thailands export values while agricultural products contribution
has decreased to only around 10 percent.
Thailand’s change in export structure has been strongly attributed to for-
eign investments—particularly the expansion of FDI inflows to the country. The
purpose of this chapter is to provide readers with a brief background of Thailand’s
economic development—particularly Thailand’s industrialization experience, for-
eign trade and investment patterns, and policies, as well as an overview of the
three industries studied in this research (food, textile, and electronics). This is
done so that readers could understand the significance of foreign trade and in-
vestments on Thailand’s economic development process. Discussions on the three
industries will give an overview of their characteristics as well as their access to
and dependence on the export markets, all of which will lend context to the en-
suing chapter on empirical analysis. As the reader shall see, this chapter will
illustrate why FDI has been credited for Thailand’s economic development and
export growth.
This chapter is organized as follows: section 3.1 will be about Thailand’s
growth records from the 1960s until present. The discussion will cover the coun-
try’s economic timeline focusing on the trade, investment, and export trends over
Page 37
5/10/2018 FDI - slidepdf.com
http://slidepdf.com/reader/full/fdi5571fc8b4979599169977641 37/117
Chapter 3. Thailand’s Experience: Growth Records, IndustrializationExperience, Trade, and Exports 32
time. Section 3.2 gives a brief summary of Thailand’s trade and export struc-
tures. In section 3.3, a summary of Thailand’s experience with foreign trade and
investments will be provided. The patterns and policies concerning trade and for-
eign direct investments (FDI) will be the central issue of this section. Finally, in
section 3.4 a brief explanation of the roles of MNCs in Thailand’s manufacturing
sector is discussed and the characteristics of the three industries—food, textiles,
and electronics will be included.
3.1 Thailand’s Past Growth Records
From 1960 to 1990, annual economic growth in Thailand averaged nearly 8 per-
cent. During the decade from 1986 to 1996, Thailand was one of the fastest
growing economies in the world, with annual growth averaging around 9.5 per-
cent.
In 1996, export growth from Thailand started to decline sharply, and contin-
ued into 1997. Also, between 1995 and 1996, the country’s current-account deficits
had increased to more than 8 percent of the GDP. As a result of the country’s
falling exports and increasing deficits in current-account balances, businessmen—
both domestic and foreign—speculated that the baht would soon be devalued.
Speculative attacks to the currency ensued; and finally, on July 2nd, 1997, the
Thai government decided to abandon the basket currency system and adopted the
managed-float system. The Thai baht, which was pegged to the US dollar at 25
baht to a dollar at the time, consequently fell to 40 baht to a dollar (and at one
Page 38
5/10/2018 FDI - slidepdf.com
http://slidepdf.com/reader/full/fdi5571fc8b4979599169977641 38/117
Chapter 3. Thailand’s Experience: Growth Records, IndustrializationExperience, Trade, and Exports 33
time, to 56 baht per dollar). An immediate impact of the devaluation of the baht
was that the amount of foreign debts in each company almost doubled in size.
This led to many cases of bankruptcy and foreclosures.
Worries about the instability of financial institutions—especially in commer-
cial banks—worsened the country’s economic situation. The fear led to massive
withdrawals of capital from financial institutions, further weakening them. This,
combined with the fall in the Thai baht, triggered a collapse of the economy.
In August, 1997, the Thai government applied for a bailout package from the
International Monetary Fund (IMF).
The financial crash in 1997 was followed by an economic recession the like
of which the country had not experienced in decades (Tambunlertchai, 2002).
Thailand’s GDP declined for 2 consecutive years, by 1.4 percent in 1997 and by
a further 10.5 percent in 1998. Although the depreciation of the baht was ex-
pected to benefit Thailand’s export sector—as their products become more price-
competitive, the devaluation of the baht also triggered other countries’ currencies’
devaluation and economic slowdown throughout the region. Thus, demands for
Thai exports were weak and exporters did not benefit much from the deprecia-
tion of the baht as the government had expected. Moreover, as Thai industrial
exporters generally have high import contents, the depreciation of the baht had
an adverse effect on their costs of production and the exporters faced a liquidity
crunch following the crash (Tambunlertchai, 2002).
From 1999 to 2001, the Thai economy slowly recovered. The country, once
again, saw positive growth rates with 11.5 percent growth in 1999, 5.9 percent
Page 39
5/10/2018 FDI - slidepdf.com
http://slidepdf.com/reader/full/fdi5571fc8b4979599169977641 39/117
Chapter 3. Thailand’s Experience: Growth Records, IndustrializationExperience, Trade, and Exports 34
in 2000, and 1.5 percent in 2001. However, growth in the manufacturing sector
remained weak compared to the pre-crisis years.
3.2 Thailand’s Trade and Export Structures
Thailand’s economic development process throughout the three decades prior to
the 1997 crisis is considered to be very successful when compared to other de-
veloping countries (Kohpaiboon, 2005). The country’s real GDP from 1960-1996
was growing at an average rate of 7.7 percent annually and GDP per capita
was increasing steadily throughout the period. The growth spurt in the Thai
economy during such period can be attributed to the country’s successful pur-
suit of an export-led growth strategy (Tambunlertchai, 2002; Kohpaiboon, 2007;
Piamphongsant, 2007).
The rapid increase in exports from Thailand after the 1960s can be partially
attributed to the movement of production facilities of MNCs to Southeast Asian
countries. Owing to the depreciation of currencies from the Plaza Accord in 1985
(US dollar, yen, Deutsche mark), many export-oriented foreign investors decided
to move their production base to Thailand.
Overall, favorable economic conditions and a focus on long-term economic
goals have helped Thailand in its growth. In the following subsections, I shall
discuss more specifically the different phases of Thailand’s trade policies, patterns
of FDI in the country, as well as FDI-specific policies.
Page 40
5/10/2018 FDI - slidepdf.com
http://slidepdf.com/reader/full/fdi5571fc8b4979599169977641 40/117
Chapter 3. Thailand’s Experience: Growth Records, IndustrializationExperience, Trade, and Exports 35
3.2.1 Trade Structure
In the early 1950s to late 1960s, agricultural products as well as outputs from
other resource-intensive industries such as those from the food, beverage, to-
bacco, and textiles industries accounted for the bulk of Thailand’s exports (Tam-
bunlertchai, 2002; Piamphongsant, 2007). Manufactured products in this period
were mostly directed to local consumers and exports from the manufacturing sec-
tor were modest. As Thailand is a resource-abundant country, exports from the
resource-intensive countries had low import contents and the raw materials needed
in the production process could be found domestically.
Since the 1970s, however, the manufacturing sector in Thailand has clearly
become more export-oriented and has been contributing high shares to the coun-
try’s exports. With the help of FDI through MNCs setting up plants in Thailand
as well as through the spillovers, linkages, and exports which have taken place inthe process, at present, manufactured exports account for more than 80 percent
of the nation’s total export value (Tambunlertchai, 2002).
The Thai manufacturing sector relies heavily on imported materials. Prod-
ucts serving the domestic and the exporting markets both have high import con-
tents. Manufactured goods that are aimed at serving the domestic market which
has high import contents are breweries and dairy products, animal and vegetableoil, animal feed, tobacco, pharmaceuticals, iron, steel, and metal products. Ex-
porting goods which rely on imported raw materials are mainly science-based
products such as computer parts, integrated circuits, electrical appliances and
electronics, and transport equipment. Only a few groups of exports from the
Page 41
5/10/2018 FDI - slidepdf.com
http://slidepdf.com/reader/full/fdi5571fc8b4979599169977641 41/117
Chapter 3. Thailand’s Experience: Growth Records, IndustrializationExperience, Trade, and Exports 36
resource-intensive industries such as the canned foods, milled rice, and rubber
industries have low import-contents.
The structure of Thailand’s merchandise imports has also changed over the
past five decades. The share of manufacturing imports have decreased—owing to
the country’s import-substitution policies—while intermediate and capital goods’
shares of imports have been increasing visibly. Capital goods such as machin-
ery and parts (electrical and non-electrical equipment) comprise almost half of
Thailand’s merchandise imports. Consumer goods, on the other hand, have seen
declining import shares, although their values have been increasing. This might
be because more luxury goods are being imported to the country. Sources of Thai-
land’s imports are Japan, the US, ASEAN, the EU, and the Middle East.
3.2.2 Export Structure
As stated earlier in this chapter, the main recipients of Thailand’s exports are
the United States, Japan, the European Union, ASEAN countries, China, Hong
Kong, and Taiwan. In the 1960s, exports from Thailand to these countries were
dominated by agricultural products. It was also during that period that the Thai
government initiated import-substituting industrialization policies. Foreign cur-
rencies which agricultural exports had generated were spent on importing capital
goods which were used to help stimulate import-substituting industrialization ac-
tivities.
The structure of Thai exports is different for each region the country exports
to. Thai exports to the US are dominated by a mix of labor-intensive, resource-
Page 42
5/10/2018 FDI - slidepdf.com
http://slidepdf.com/reader/full/fdi5571fc8b4979599169977641 42/117
Chapter 3. Thailand’s Experience: Growth Records, IndustrializationExperience, Trade, and Exports 37
intensive, and electronics products. The leading products to the US from Thailand
are garments, televisions, integrated circuits, rubber, and seafood (canned and
frozen).
Thai exports to the EU have changed significantly during the last decade
(Piamphongsant, 2007). In the early 1990s, Thai exports to the EU were led by
labor-intensive and resource-intensive products such as footwear, precious stones
and jewelry, tapioca products, and canned seafood. However, shares of the prod-
ucts from these industries have been falling while scale-intensive and science-based
products such as computer and integrated circuits exports have been expanding
from the mid-1990s onwards.
Thai exports to Japan have also shifted towards scale-intensive and science-
based products. In the early 1990s, Thai exports to Japan were dominated by
labor-intensive and resource-intensive products. From the mid-1990s onwards,
shares of products from these industries began to fall while the share of scale-
intensive and science-based products began to rise. At present, share of com-
puter, semiconductor devices, and motor vehicles exports to Japan are rising
rapidly.
Exports from Thailand to the ASEAN markets are different from those to
other countries. As ASEAN countries have similar factors of production and
resources to Thailand, Thai exports to ASEAN markets have been dominated
by electronics products. Besides electronics exports, leading exports from Thai-
land to other ASEAN countries include agricultural products or resource-intensive
products such as rice and sugar.
Page 43
5/10/2018 FDI - slidepdf.com
http://slidepdf.com/reader/full/fdi5571fc8b4979599169977641 43/117
Chapter 3. Thailand’s Experience: Growth Records, IndustrializationExperience, Trade, and Exports 38
Finally, the rise of science-based products and capital-intensive products
in resource and scale-intensive industries (especially electronics, petroleum, and
chemicals) can be seen in other regions such as China, South Korea, and Hong
Kong. Motor vehicles, plastics in primary forms, and chemical products have also
been dominating exports from Thailand to regions such as South Asia, the Middle
East, Australia, Africa, and South America.
In short, export structure in the early stages of the country’s international
trade (1960s) was dominated by agricultural goods. Later in the 1970s to 1980s,
the country’s trade and export structures shifted from relying on resource-intensive
products from the agricultural sector to manufactured goods which are intensive
in both resource and labor. As Thailand’s comparative advantage in cheap la-
bor gets eroded, its leading exports have changed to the more science-based and
scale-intensive products such as electronics, electrical appliances.
3.3 Thailand’s Foreign Direct Investment Expe-
rience
The value of FDI inflows to Thailand (less the cases of mergers and acquisitions)
have been significantly increasing since 1986, especially inflows to the manufac-
turing sector. In addition to the devaluation of foreign currencies from the Plaza
Accord, factors that contributed to the rapid increase in FDI inflows to Thailand
are: i) investment promotion policies which the Thai government had implemented
through the Board of Investment of Thailand (BOI) ; ii) the cheaper labor wages
Page 44
5/10/2018 FDI - slidepdf.com
http://slidepdf.com/reader/full/fdi5571fc8b4979599169977641 44/117
Chapter 3. Thailand’s Experience: Growth Records, IndustrializationExperience, Trade, and Exports 39
when compared to other developing countries (for example, Latin American coun-
tries); iii) the baht devaluation that occurred twice in the 1980s which resulted
in more competitive prices of factors of production and labor wages; iv) favorable
economic condition in Thailand, e.g, low and steady inflation rates relative to
other developing countries during the few years prior to the Plaza Accord; and
v) the tax exemption on the imports of capital and intermediate goods for MNCs
imposed by the BOI.
Overall, favorable economic conditions and a focus on long-term economic
goals have helped Thailand in its growth. In the following subsections, I shall
discuss more specifically the different phases of Thailand’s trade policies, patterns
of FDI in the country, as well as FDI-specific policies.
3.3.1 International Trade Development
The history of Thailand’s economic development is intricately linked to the trade
policies the country has pursued. This is evident in the prominence of trade
policies in the National Economic Development Plans. The trade history of the
country comprises four main phases, each corresponding to the dominant trade
policy at the time.
1950s-1960s: Import Substitution Trade Regime In the late 1950s, the Thai
government started implementing policies which were aimed at preparing the
country for the first Economic Development Plan in the 1960s. The first Economic
Development Plan followed a traditional import-substitution strategy, imposing
tariffs on imports, especially on finished products. Attention was given to nur-
Page 45
5/10/2018 FDI - slidepdf.com
http://slidepdf.com/reader/full/fdi5571fc8b4979599169977641 45/117
Chapter 3. Thailand’s Experience: Growth Records, IndustrializationExperience, Trade, and Exports 40
turing the institutional systems which were necessary for industrial development
(Brimble, 2002). Furthermore, to prepare domestic producers for opening the
country in 1960, the government gradually reduced the role of state-owned en-
terprises while promoting the private sector’s operations. Therefore, investments
which fuelled economic growth in this decade were mainly the government’s in-
vestments in infrastructure and the private investments in import substitution
industries.
In the 1960s, investments in the manufacturing sector expanded rapidly,
especially in the import-substitution industries. This trend was so strong that
despite the energy crisis in the 1970s, the Thai economy continued on a strong
expansion path.
1970s-1980s: Export-Promotion At the beginning of the 1970s, Thailand
started seeing balance of payments problems which were attributed to the import
substitution policy (Brimble, 2002). In response to the problems, the Thai gov-
ernment started looking into export promotion policies. The Thai government
passed a new Investment Promotion Law which allowed the Board of Investment
of Thailand (BOI) to have more power to provide investment incentives to foreign
investors.
There were large foreign investment inflows along with other forms of capital
to Thailand in the second half of the 1980s. Thailand saw substantial surpluses in
the country’s balance of payments while also experiencing an expansion in exports
and foreign-exchange receipts from tourism.
By the late 1980s, Thailand was amongst the fastest growing economies
Page 46
5/10/2018 FDI - slidepdf.com
http://slidepdf.com/reader/full/fdi5571fc8b4979599169977641 46/117
Chapter 3. Thailand’s Experience: Growth Records, IndustrializationExperience, Trade, and Exports 41
in the world. Between 1988 and 1990, Thailand’s economic growth accelerated
to double-digit levels. It was also during this period that newly industrialized
economies (NIEs) started to outsource their productions to Southeast Asia. A
large number of Japanese and NIEs-based firms relocated their operations to Thai-
land owing to the appreciation of the source countries’ currency. There were large
inflows of export-oriented and manufacturing related industries. At the same time,
domestic investments in manufacturing, real-estate, and stock markets expanded
to unprecedented levels (Tambunlertchai, 2002).
1990s: Financial System’s Liberalization The inefficiencies of high protec-
tion were realized by the policy makers during the 1970s; and in the late 1980s
and early 1990s, there were attempts to promote more openness and competitive-
ness. These attempts came at a time of a global trend in financial liberalization,
and policies during this time were strongly shaped by this trend. Policies dur-
ing this period were focused on facilitating capital flows and making the Thai
markets more internationally accessible. In 1990, the Thai government accepted
the International Monetary Fund’s Article 8 of the IMF Articles of Agreement
1. The acceptance of this Article resulted in the liberalization of the country’s
current-account transactions. Furthermore, within the next following years, the
Thai government proceeded further to liberalize capital movements, foreign ex-
change controls, and other financial measures. There were constitutive capitalinflows in terms of short-term loans and portfolio investment after the capital
liberalization.
The Thai government during this decade continued to encourage export
1http://www.imf.org/external/pubs/ft/aa/aa.pdf
Page 47
5/10/2018 FDI - slidepdf.com
http://slidepdf.com/reader/full/fdi5571fc8b4979599169977641 47/117
Chapter 3. Thailand’s Experience: Growth Records, IndustrializationExperience, Trade, and Exports 42
expansion. The Thai economy grew and exports from Thailand grew rapidly
during this period. In 1997, Thailand experienced a severe financial crisis and the
Thai currency depreciated much after 1997.
2000s Until Present The Thai economy has been gradually recovering from
the 1997 economic crisis. Average growth rates of the Thai economy, although
positive, are still lower than that in the pre-crisis years. The Thai government is
still pursuing export-promotion policies. However, Thailand is faced with intense
competition in the world market as other emerging economies like China and Viet-
nam which have lower wage rates are also keen on promoting their manufactured
exports.
3.3.2 Patterns of FDI in Thailand
As discussed in the previous subsection on Thailand’s trade policies, import sub-
stitution strategy in the 1960s and 1970s attracted FDI inflows which were mainly
channeled to import-competing industries. FDI inflows, however, began in earnest
in the 1980s in export-oriented industries. This increase was mainly due to policy
shifts in the mid-1970s towards export promotion and FDI promotion in export-
oriented industries. These shifts also coincided with the realignment of major
world currencies, particularly the rapid appreciation of the Japanese yen.
Thailand benefited greatly from the rapid appreciation of the yen as the
appreciation brought about a massive relocation of industries from Japan to the
Southeast Asian countries including Thailand. Much of these inflows were chan-
neled to export industries, and to intermediate and capital goods industries such
Page 48
5/10/2018 FDI - slidepdf.com
http://slidepdf.com/reader/full/fdi5571fc8b4979599169977641 48/117
Chapter 3. Thailand’s Experience: Growth Records, IndustrializationExperience, Trade, and Exports 43
as automotive and electronic parts and components. These kinds of FDI have
been the main drivers of the rapid growth in manufactured exports as well as the
deepening of the industrial structure in Thailand (Tambunlertchai, 2002).
FDI trends in the 1990s were influenced by financial liberalization policies
and punctuated by the economic crisis of 1997. In Thailand’s balance of payments
statistics, FDI includes equity investment and direct investment loans or loans
by foreign companies which have investments in Thailand. Historically, equity
investment accounted for a significant proportion of FDI inflows to Thailand.
However, after the financial liberalization in 1990, the share of investment loans
in the country’s balance of payments increased. It was also during the 1990s that
the share of FDI in Thailand’s capital and financial accounts—a portion of the
balance of payments—decreased, despite the continual growth in value of FDI
inflows and significant increases in other forms of capital flows.
Following the depreciation of the baht in 1997, FDI inflows increased dra-
matically in both baht and dollar terms (Brimble, 2002)—FDI inflows in 1997
increased to over 3.6 billion USD from approximately 2 billion USD in previous
years. This high level of FDI maintained throughout the next decade.
The growth of FDI in the post-crisis period was characterized by a dramatic
increase in mergers and acquisitions (M& A) as foreign firms took over Thai
companies that faced severe debt and liquidity problems (Brimble, 2002). Other
factors which contributed to the rise in FDI subsequent to the crisis are: i) the
Thai government’s policy to encourage foreign investments in the financial and
banking sector by loosening conditions and regulations; ii) the recapitalization in
Page 49
5/10/2018 FDI - slidepdf.com
http://slidepdf.com/reader/full/fdi5571fc8b4979599169977641 49/117
Chapter 3. Thailand’s Experience: Growth Records, IndustrializationExperience, Trade, and Exports 44
joint ventures by foreign partners; iii) the takeover by foreign firms or the selling
of local businesses to MNCs (Tambunlertchai, 2002).
In terms of source countries of FDI that have historically been important, the
countries which have contributed the most to Thailand’s FDI inflows are Japan,
the US, Hong Kong, and Taiwan respectively. Other important source countries
include EU members like the UK, Germany, and the Netherlands; while the most
important ASEAN source country is Singapore. In these past few years, however,
FDI inflows to Thailand from South Korea and China have also been increasing
in value and importance.
3.3.3 Policies on FDI in Thailand
The Thai government has been pursuing private-sector-led industrialization and
FDI-friendly policies for the past six decades. Attention on private investment
began in the late 1950s, resulting in the establishment of the Board of Investment
(BOI) of Thailand in 1959 to overlook investment promotion programs under the
government’s investment promotion law. In 1960, the investment law was promul-
gated. Since then, it has been revised many times and is still in use today.
The BOI’s main responsibilities are to attract and facilitate foreign investors
while ensuring their confidence in Thailand’s economic and political situation. So
far, the investment promotion programs issued by the BOI have included strate-
gies like tax incentives, reduction of restrictive trade measures, liberal terms on
the remittance of profits and other foreign exchange payments, and assurance to
foreign investors that there will be no nationalization of private businesses.
Page 50
5/10/2018 FDI - slidepdf.com
http://slidepdf.com/reader/full/fdi5571fc8b4979599169977641 50/117
Chapter 3. Thailand’s Experience: Growth Records, IndustrializationExperience, Trade, and Exports 45
After the financial crisis, the BOI provided some short-term measures to
encourage new investment and to expand existing investments. Over the last
decade, the BOI revised Thailand’s investment incentives to be more in line with
WTO regulations (Tambunlertchai, 2002).
3.4 Thailand’s Industrial Sector Overview and
the Multinational Corporations
Studies (Akira, 1989; Kohpaiboon, 2006b; Kohpaiboon, 2007) indicate that the
increase of FDI inflows to Thailand is consistent with the degree of openness to
international trade policies in Thailand. The Thai government has been imple-
menting tax incentive policies to encourage foreign investors since the 1980s; and
as a result, investing MNCs have shifted their focus of production from import-substitution to being more export-oriented in accordance with the government’s
policies. From existing literature (see, for example, Balasubramanyam et al.,
1996; Kohpaiboon, 2003, 2006a, 2006b) on MNCs and developing countries, it is
proposed that in the case of developing countries, export-oriented FDI are more
beneficial for the host country than import-substituting FDI.
Thailand’s 1997 industrial census (information on 1996) exhibit the signifi-
cance of MNCs in Thailand’s industrial sector in terms of production and exports.
Particularly, MNCs contributed to almost 50 percent of the total value of exports
and value-added in Thailand’s manufacturing sector in 1996. Furthermore, when
considering Thailand’s export-output ratio in 1996, it can be seen that MNCs’
Page 51
5/10/2018 FDI - slidepdf.com
http://slidepdf.com/reader/full/fdi5571fc8b4979599169977641 51/117
Chapter 3. Thailand’s Experience: Growth Records, IndustrializationExperience, Trade, and Exports 46
export-output ratio was as high as 60 percent. This indicates that MNCs in Thai-
land are more likely to export than local firms with no foreign affiliates.
3.4.1 The Food Industry
The 2-digit level ISIC code—a coding system used for classifying industry types
created by the United Nations Industrial Development Organization (UNIDO)—
for the food industry is 15. At the 4-digit level ISIC, the food industry runs from
1511-1549; covering products such as meat products, fisheries, fruits, vegetables,
processed meat, processed fruits, grains, dairy products, sugar products, etc.
Owing to Thailand’s abundant natural resources, cheap labor, and geograph-
ical conditions suitable for agriculture, the food industry is one of the biggest in-
dustries in the country. Firms within this industry in Thailand vary in size. The
industry consists of both large business conglomerates like the Charoen Pokphand
group as well as small and medium enterprises (SMEs) that are dispersed all over
the country.
The food industry is an extremely important source of employment and
income in the Thai economy. The industry is also interconnected with many
other industries and sectors such as the agricultural sector, the packaging industry,
the transportation industry, etc. Importantly, this industry produces enough to
satisfy domestic consumption as well as supply to export markets.
The food industry in Thailand has been continually growing over the past
ten years. The industry has seen a significant amount of FDI as many MNCs
Page 52
5/10/2018 FDI - slidepdf.com
http://slidepdf.com/reader/full/fdi5571fc8b4979599169977641 52/117
Chapter 3. Thailand’s Experience: Growth Records, IndustrializationExperience, Trade, and Exports 47
have come in and setup production plants in order to make use of Thailand’s
abundant resources. Exports from this industry have also been steadily growing.
In 2008, the value of food industry exports from Thailand was as high as 21 billion
USD.
3.4.2 The Textile and Clothing Industries
The 2-digit ISIC codes for the textile and clothing industries are 17 and 18 re-
spectively. The products in these two industries include textile fibers, finishing of
textiles, carpets and rugs, knitted and crocheted articles, dressing and dyeing of
fur, rope, twine, wearing apparel (except fur), etc.
The textile and clothing industries, like the food industry, have historically
been important for the Thai economy. The two industries are labor-intensive
and are interconnected with many other supporting industries. Furthermore, the
textile and clothing industries have been major contributors to the high growth
rate of Thai exports since the 1960s; and at present, both industries rank among
Thailand’s top five leading export industries (Piamphongsant, 2007).
FDI has played an important role in the development of the textile indus-
try in Thailand since the 1960s. Foreign firms provided capital, technology, and
management. At the early stages of Thailand’s export-oriented era (1980s-1990s),
many MNCs established their plants in the textile and clothing industries in Thai-
land. It was also during this period that Thailand saw its textile and clothing
industries gain competitiveness and an expansion in exports (Piamphongsant,
2007). The textile and clothing industry saw a prolonged spell of growth, even
Page 53
5/10/2018 FDI - slidepdf.com
http://slidepdf.com/reader/full/fdi5571fc8b4979599169977641 53/117
Chapter 3. Thailand’s Experience: Growth Records, IndustrializationExperience, Trade, and Exports 48
after the 1997 economic crisis since the depreciation of the baht made for fa-
vorable export conditions. In the past decade, however, the expansion of both
industries has been very limited. The textile and clothing industries in Thailand
have been losing their competitiveness as a result of increasing labor wages due
to the appreciation of the Thai baht and the intensified competition from emerg-
ing countries like China, Pakistan, and Bangladesh. Moreover, WTO Agreements
have conditioned Thailand to open up many industries including the textiles and
clothing industries. As a result, producers and exporters in the industries have
been adversely affected with higher price competition.
But despite the slowdown, these two industries remain important for Thai-
land. Outputs in the textile and clothing industries are intended for both domes-
tic consumers and the international market. The main recipients of textiles and
clothing exports from Thailand are: the US, Japan, and the UK.
3.4.3 The Electrical Appliances and Electronics Industries
The electrical appliances and electronics industries comprise both capital-intensive
and labor-intensive sectors. This is because the two industries have high-technology
components as well as a large degree of manual checks and machine operation.
The industry’s ISIC codes are 30, 31, and 32; and the products range from con-
sumer appliances and computer equipment to electronic components and indus-
trial equipments.
The electrical appliances and electronics industries have contributed greatly
to Thailand’s manufactured exports expansion since the mid-1980s. In 2005, the
Page 54
5/10/2018 FDI - slidepdf.com
http://slidepdf.com/reader/full/fdi5571fc8b4979599169977641 54/117
Chapter 3. Thailand’s Experience: Growth Records, IndustrializationExperience, Trade, and Exports 49
value of exports from the two industries altogether accounted for more than 40 per-
cent of total manufactured exports from Thailand (Piamphongsant, 2007).
The electrical appliances and electronics industries grew rapidly in the late
1980s owing to the Plaza Accord—which resulted in the rapid appreciation of
the Japanese Yen after 1985. Furthermore, the devaluation of the Thai baht
twice in the 1980s made labor and land costs in Thailand even cheaper. The
influx of Japanese firms during this period brought in many new technologies
and production plants. These two industries therefore have had a big role in the
technology and knowledge transfer in Thailand.
Although the electrical appliances and electronics industries in Thailand
have high exporting rates, most of the exporting firms are those with foreign
affiliates or are MNCs themselves. Local firms in the industries have the capacity
to compete domestically, but they still lack the kind of technology and capital
needed to produce high-quality goods to compete in the international markets
(Tambunlertchai et al., 1998).
The main recipients of exports from Thailand’s electronics appliances and
electronics industries are: the US, Japan, and China.
Page 55
5/10/2018 FDI - slidepdf.com
http://slidepdf.com/reader/full/fdi5571fc8b4979599169977641 55/117
Chapter 4
Conceptual Framework and Data
Description
In this chapter, I will elaborate on the conceptual and empirical frameworks for the
analyses of firm-level export decision and export orientation. Formulation of the
models, hypotheses, and the data used in support of the empirical findings in the
next chapter are discussed here. The chapter proceeds in the following manner:
section 4.1 discusses the conceptual framework of the (possible) determinants of
firm-level export decision and the characterization of firms’ export orientation.
Section 4.2 illustrates the formulation of the models to be studied in chapter 5.
Finally, section 4.3 provides information on the dataset used in this research. This
last section includes the description of the dataset, data source, and the criteria
used in the data cleaning process in this research paper.
50
Page 56
5/10/2018 FDI - slidepdf.com
http://slidepdf.com/reader/full/fdi5571fc8b4979599169977641 56/117
Chapter 4. Conceptual Framework and Data Description 51
4.1 Conceptual Framework
Exports are believed to be a driving force for a country’s economic growth and
industrialization process (Kohpaiboon, 2007; Lipsey, 1999; Krueger, 1995; World
Bank, 1993). Although classical trade theories on comparative advantage and
factor abundance can be used to explain nation-level export decisions (Feenstra,
2004), studies of factors which characterize firm-level export participation and
export orientation have been inconclusive (Bernard and Jensen, 1995, 1997, 1999,
2004; Aitken et al., 1997; Roberts and Tybout, 1997; Kokko et al., 1997; Kneller
and Pisu, 2007).
Existing literatures on the topic of firm-level export participation and export
orientation agree on the existence of sunk costs associated with export market en-
try (Baldwin, 1988; Dixit, 1989; Baldwin and Krugman, 1989; Kneller and Pisu,
2007). Such costs include the establishment of distribution and logistics chan-
nels, product compliance and regulations, market research to acquire information
about consumers’ tastes and market structure in foreign countries. However, there
are still mixed views on what characterizes a firm’s decision to export and what
determines the share of a firm’s exports to total sales.
Kneller and Pisu (2007) propose that firm-level variables which significantly
influence domestic firms’ export market participation decision are the size of the
firm and the quality of workers in the firm. They further suggest that MNCs, espe-
cially export-oriented ones, appear to generate positive export spillovers—export-
oriented MNCs significantly increase the probability of exporting for domestically-
owned firms operating in the same industry. However, when taking foreign owner-
Page 57
5/10/2018 FDI - slidepdf.com
http://slidepdf.com/reader/full/fdi5571fc8b4979599169977641 57/117
Chapter 4. Conceptual Framework and Data Description 52
ship into account in their empirical analysis, Kneller and Pisu (2007) discover that
the export decision of domestic firms does not seem to be significantly affected by
contacts they may have with MNCs. Furthermore, Kneller and Pisu (2007), from
their empirical analysis, also find that for the share of exports (to total sales), the
size variable is (now) insignificant while firm-level characteristics such as efficiency
remain positive and significant.
Bernard and Jensen (2004), on the other hand, conclude in their research
that large, productive plants, plants which are owned—partially or wholly—by
US MNCs, and/or plants with high labor quality all have higher probabilities
of exporting and a higher propensity to export. The two authors’ findings are
consistent with Aitken et al. (1997), and Roberts and Tybout’s (1997) works.
In particular, Roberts and Tybout (1997) propose that plant characteristics such
as plant size, plant age, and the structure of ownership are positively related to
the propensity to export of local firms. Similarly, in Aitken et al. (1997), the
study’s findings put forward that the presence of export-oriented MNCs in the
same industry increases the probability of exporting by Mexican firms. Further-
more, in Aitken et al. (1997), empirical results also show that plant size, wages,
and especially foreign ownership are all positively related to local firms’ decision
to export.
Literatures on what constitutes a firm’s propensity to export and/or export
orientation, similarly, present mixed views on the topic. As quoted in Kneller
and Pisu (2007), Bleaney and Wakelin (1999), for the case of the UK and Wagner
(2004), for the case of Germany, report evidence of significant relationship between
Page 58
5/10/2018 FDI - slidepdf.com
http://slidepdf.com/reader/full/fdi5571fc8b4979599169977641 58/117
Chapter 4. Conceptual Framework and Data Description 53
size and export shares. Greenaway et al. (2004), in the same way, used the UK as
a sample to study factors which characterize UK firms’ export decision and export
orientation. The outcomes of the study, although not very statistically significant,
suggest that the likelihood of firm’s export shares is increasing in foreign presence.
Greenaway and Kneller (2004) provide evidence supporting Greenaway (2004).
The work puts forth that for domestic firms, the probability of export and the
export intensity have been found to be increasing in the size and productivity of
firm.
Barrios et al. (2003) studied the case of Spain. However, contrary to Green-
away et al.’s (2004) findings, Barrios et al. (2003) found no evidence of export
spillovers to local firms from the existence of MNCs. Ruane and Sutherland’s
(2004) findings through using the case of Ireland agrees with Barrios et al.’s find-
ings that there appears to be no evidence of export spillovers from MNCs to local
firms in Ireland.
Other industry-level factors such as the industry’s comparative advantage in
labor or capital (capital-labor ratio) and BOI promotion are also considered to be
influential to a domestic firm’s export decision and orientation (Kneller and Pisu,
2007; Kohpaiboon, 2007). For a firm to be successful in exporting to a foreign
market, there are many other procedures involved other than firms being able to
sell their products at world market prices—especially in the case of manufactured
goods such as processed foods from developing countries to developed countries.
Exporting producers must also know the international market demands, which
may be very different from that of their domestic markets, the legal procedures,
Page 59
5/10/2018 FDI - slidepdf.com
http://slidepdf.com/reader/full/fdi5571fc8b4979599169977641 59/117
Chapter 4. Conceptual Framework and Data Description 54
and the recipient countries’ regulations on trade and imports (Aitken et al., 1997).
Additionally, exporting firms are faced with higher risks of operation if the firms’
exports are products which have little to no demand for in the domestic market
(Roberts and Tybout, 1997; Kohpaiboon, 2007).
In short, given the existence of sunk costs associated with all firms’ export
participation and other procedures involved in successfully exporting to foreign
markets, it is logical to hypothesize that firms which are more capable of taking on
the necessary sunk costs and additional risks are firms that will be more inclined to
export. Owing to the contradicting views presented and the lack of literatures on
the case of developing economies, this research paper seeks to provide information
on the topic of firm-level export status by focusing on Thailand—a developing
economy.
4.2 The Models
The models studied in this research are extensions of Roberts and Tybout’s (1997)
model which was used to explain a Colombian chemical firms’ export decision. In
Roberts and Tybout (1997), the authors present that sunk entry costs for plants
breaking into foreign markets are substantial; and consequently, producers will
not initiate exports unless the present value of their expected future export profit
stream is large.
In other words, if we let RX
iand RD
ibe firm i’s expected returns on producing
for the domestic market and the export market respectively, firm i will only opt
Page 60
5/10/2018 FDI - slidepdf.com
http://slidepdf.com/reader/full/fdi5571fc8b4979599169977641 60/117
Chapter 4. Conceptual Framework and Data Description 55
to export their products and take on the sunk costs and additional risks if and
only if
RX
i−RD
i> 0 (4.1)
If we let X i be the binary-value variable representing firm i’s export decision (X i=
1 when firm i decides to export and X i = 0 if otherwise), we can then say:
X i =
1, if RX
i−RD
i> 0
0, otherwise
(4.2)
Entering the export market is a means for firms to increase their sales and
expand their profits. However, owing to the existence of sunk costs and additional
risks associated with such procedures, the net gain of exporting their goods is not
necessarily positive for all firms.
Once a firm decides to export, the question of how much should the firm
export arises. Past studies on what constitutes a firm’s export decision and export
orientation (Athukorala et al., 1995; Roberts and Tybout, 1997; Bernard and
Jensen, 1997; Kohpaiboon, 2007), conclude that influential factors include:
i) Firm size
Owing to the existence of sunk costs and additional risks which are asso-
ciated with export market participation, it is hypothesized that bigger firms are
Page 61
5/10/2018 FDI - slidepdf.com
http://slidepdf.com/reader/full/fdi5571fc8b4979599169977641 61/117
Chapter 4. Conceptual Framework and Data Description 56
more likely to be more prepared to take on the prerequisites of entering the for-
eign markets (Bernard and Jensen, 1995, 1997, 1999; Roberts and Tybout, 1997;
Aitken et al., 1997; Kohpaiboon, 2007; Kneller and Pisu, 2007). Furthermore,
because bigger firms are more capable of producing at bigger scales, it is also
theorized that bigger firms are more likely to export more of its output (Bernard
and Jensen, 2004; Kneller and Pisu, 2007).
In this research paper, my hypothesis is that firm size is positively related
to the firm’s decision to export and to the firm’s export-orientation. Therefore,
the coefficients on firms’ size variables in the two models will be positive.
ii) Firm age
Firm age is considered a relevant factor to firms’ export decision and export
status. This is because firms which have been in the industry for a long time
usually have more experience and better knowledge which allow them to take upthe additional risk of producing for the export market. Studies and surveys which
mention the importance of firm age in firms’ decision to export include Roberts
and Tybout (1997), Berndt (1991). Furthermore, it is also believed that firms
which have been around for longer have a broader distribution network—locally
and/or internationally. Therefore, the age variable will be included in both firm-
level export decision and firm-level export orientation models. The relationships
between the firm’s age and the firm’s export decision and export orientation are
hypothesized to be positive; therefore, the coefficients on age are expected to be
positive.
iii) Firm efficiency
Page 62
5/10/2018 FDI - slidepdf.com
http://slidepdf.com/reader/full/fdi5571fc8b4979599169977641 62/117
Chapter 4. Conceptual Framework and Data Description 57
The issue of whether or not firm efficiency influences firms’ decision to ex-
port is still debatable, especially in the direction of causality-efficient firms export
more (self-selection hypothesis) or export participation makes firms more efficient
(learning process hypothesis). However, for the purpose of this research, the effi-
ciency of the firm should also be accounted for because efficiency is a factor which
may influence firms’ export decisions as well. The coefficients on the efficiency
variables, which will be presented in chapter 5, may be able to provide further ev-
idence on the causality debate—whether or not the self-selection hypothesis could
be rejected.
In this research, value added per worker or labor productivity will be used
as an indicator of efficiency. I will hypothesize that firms with higher efficiencies
are more likely to export than firms with low efficiency in production—thus, the
predicted signs for the coefficients of efficiency variables on export decision and
export orientation are positive. For this purpose, value-added per labor will be
used as a proxy for efficiency.
iv) Firm ownership
As stated earlier in section 4.1, much of the literature on the topic of export
participation decision suggests that firm ownership significantly impacts firms’
decision to export (Aitken et al., 1997; Kokko et al., 1997; Roberts and Tybout,
1997; Bernard and Jensen, 2004). This is because foreign affiliates have access to
the source firms’ global distribution networks as well as the advanced technology
which the source firm possesses. However, this may not necessarily be the case.
The relationship between a firm’s decision to export and the structure of ownership
Page 63
5/10/2018 FDI - slidepdf.com
http://slidepdf.com/reader/full/fdi5571fc8b4979599169977641 63/117
Chapter 4. Conceptual Framework and Data Description 58
of the firm also depends on the foreign affiliate’s intention when entering the host
economy—for import-substituting or for export-expanding purposes. Therefore, it
is difficult to specify ex ante whether the relationship between the firm’s ownership
structure and its decision to export will be positive or negative.
v) Research and development expenditure
Past studies on the topic of firm-level export decision and export orientation—
such as Barrios et al. (2003), Greenaway et al. (2004)—suggest that research and
development expenditure should be included into firms’ export decision models
as well. However, in the developing countries’ framework, such as in the case
of Thailand, R&D expenditure in developing countries is usually spent on mak-
ing the production process more efficient rather than for innovation purposes. In
other words, for developing countries, R&D expenditure will result in increased
firm efficiency (Kohpaiboon, 2007). As the efficiency variable already captures
the effects of firm efficiency on export decisions and export orientation, adding
R&D expenditure into the model will be of excess. Therefore, the variable on
R&D expenditure will not be included into the models.
vi) Capital-labor ratio
The capital-labor ratio reflects the industry’s intensity of capital and/or
labor usage. In the case of Thailand—as well as other developing countries—thecountry’s comparative advantage lies within the abundant labor at relatively cheap
wages. Therefore, it is hypothesized that firms in industries with low capital-
labor ratio are more likely to export than firms with high capital-labor ratio in
developing countries with cheap labor—predicted signs on the capital-labor ratio’s
Page 64
5/10/2018 FDI - slidepdf.com
http://slidepdf.com/reader/full/fdi5571fc8b4979599169977641 64/117
Chapter 4. Conceptual Framework and Data Description 59
coefficients are negative for export decision and export orientation.
vii) BOI Promotion
As stated earlier in chapter 3, the Thai government has put much emphasis
on export promotion policy. The Board of Investment of Thailand (BOI) has given
high priority to export-oriented firms and exporting firms are receiving extra-
privileges compared to domestically-oriented firms. For example, firms with more
than 80 percent of their export sales are allowed full promotional privileges while
domestically-oriented firms will receive BOI promotion only if they meet certain
conditions such as their plants must be located in areas outside of Bangkok in order
to be qualified for the promotion policies. Therefore, it is logical to hypothesize
that BOI promotion policies could influence a firm’s export-orientation (for both
Thai and foreign firms).
The predicted signs on the coefficients of BOI promotion in both firm-level export decisions and firms’ export orientation are hypothesized to be posi-
tive.
Let X i be a binary-valued variable representing firm i (in industry j)’s export
decision (X i= 1 when firm i decides to export and X i = 0 if otherwise). Then
given the factors above, firm-level decision to export and firms’ intensity of exports
could be modeled as follows:
4.2.1 Firm-Level Export Participation Decision
X i = F (sizei,agei,FDI i, (V A
L)i, (
K
L)i,BOI i) (4.3)
Page 65
5/10/2018 FDI - slidepdf.com
http://slidepdf.com/reader/full/fdi5571fc8b4979599169977641 65/117
Chapter 4. Conceptual Framework and Data Description 60
As discussed above, a firm’s decision to export is hypothesized to be influ-
enced by firm-level characteristics—sizei, agei, FDI i, (V A
L)i, (
K
L)i, BOI i. Bigger
firms which have more experience and higher efficiencies are theorized to be more
likely to export. It is also hypothesized that Thai firms which receive FDI, BOI
promotion, and firms that leverage on Thailand’s comparative advantage of cheap
labor, have higher tendencies to export.
In summary, the predicted coefficients on the independent variables are as
follows:
Page 66
5/10/2018 FDI - slidepdf.com
http://slidepdf.com/reader/full/fdi5571fc8b4979599169977641 66/117
Chapter 4. Conceptual Framework and Data Description 61
Variable
Name
Description Predicted
Signs
X i binary-valued variable on firms’ decision to export;
1 being the firm decides to export, and 0 in other
cases
sizei size of firm i; measured by the number of employ-
ees in the firm
(+)
agei period of firm i’s operation (in years) (+)
F DI i binary-valued variable; 1 if firm has foreign invest-
ments, and 0 if otherwise
(+/-)
(V A/L)i firm i’s efficiency; measured by the firm’s value-
added per unit labor
(+)
(K/L)i capital-labor ratio of firm i measuring the firm’s
comparative advantage—hypothesized to be nega-
tive because of Thailand’s comparative advantage
in low cost labor; capital is measured by the value
of the firm’s fixed assets, while labor is the total
amount of workers in the firm
(-)
BOI i binary-valued variable; 1 if firm receives BOI pro-
motion in promoting exports, and 0 if otherwise
binary-valued variable measuring BOI promotion
in export-promotion—taking on the value 1 if
there is government help in the industry; and zero
if otherwise
(+)
4.2.2 Firm’s Level of Export Orientation
ExportShares = G(ownershipi,sizei,agei, (V A
L)i, (
K
L)i,BOI i) (4.4)
Page 67
5/10/2018 FDI - slidepdf.com
http://slidepdf.com/reader/full/fdi5571fc8b4979599169977641 67/117
Chapter 4. Conceptual Framework and Data Description 62
Besides firms’ decision to export, this research further studies the effects of the
same set of independent variables on firm-level export-orientation. In other words,
the study of how ownershipi,sizei, agei,(V A
L)i, (
K
L)i,BOI i influences the firms’
percentage of exports is included in this research as well.
Different firms have different capabilities and tendencies to export. There-
fore, empirical tests are conducted to see how firms’ export orientation (ex-
port/total sales ratio) could be influenced by ownershipi, sizei, agei, (V A
L
)i,
(K
L)i, BOI i. In this equation, however, the percentage of foreign ownership shares
(ownershipi) is used instead of the binary-valued variable for FDI (FDI i). The
hypothesis is that firms with a higher percentage of foreign ownership shares are
likely to export a higher proportion of their outputs owing to the MNCs’ global
distribution network. However, as stated earlier, the existence of MNCs’ may not
have such an effect on firms’ export orientation if they are not export-oriented
MNCs. Therefore, the predicted sign of the coefficient on foreign shares in this
model is still unclear.
Note: The signs in the parentheses are the expected signs on the coefficients.
Note: information on how some variables are calculated is in Appendix B.
4.3 Data Description
This research’s empirical analysis uses data from the 2007 Industrial Census which
is gathered by the National Statistical Office of Thailand (NSO). The Industrial
Census is a survey which is conducted every 10 years to gather information on
Page 68
5/10/2018 FDI - slidepdf.com
http://slidepdf.com/reader/full/fdi5571fc8b4979599169977641 68/117
Chapter 4. Conceptual Framework and Data Description 63
Variable
Name
Description Predicted
Signs
exportsharesi
exports from firm i as percentage of its totaloutputsizei size of firm i; measured by the number of em-
ployees in the firm(+)
agei period of firm i’s operation (in years) (+)ownershipi the percentage of the share of foreign ownership (+/-)(V A/L)i firm i’s efficiency; measured by the firm’s value-
added per unit labor(+)
(K/L)i capital-labor ratio of firm i measuring the firm’scomparative advantage—hypothesized to benegative because of Thailand’s comparative ad-
vantage in low cost labor; capital is measuredby the value of the firm’s fixed assets, whilelabor is the total amount of workers in the firm
(-)
BOI i binary-valued variable; 1 if firm receives BOIpromotion in promoting exports, and 0 if oth-erwise binary-valued variable measuring BOIpromotion in export-promotion—taking on thevalue 1 if there is government help in the indus-try; and zero if otherwise
(+)
Page 69
5/10/2018 FDI - slidepdf.com
http://slidepdf.com/reader/full/fdi5571fc8b4979599169977641 69/117
Chapter 4. Conceptual Framework and Data Description 64
distribution and performance of the manufacturing establishments in Thailand
during a given year. The newest industrial census is the 2007 Industrial Census
which is the third in the series—the first one was conducted in 1964 and the second
one in 1997. This 2007 census surveyed 34,625 establishments in 2006 (January
1st – December 31st). The information obtained in the 2007 NSO census is the
newest and most extensive set of industrial census data available in Thailand so
far.
The main reason for using the 2007 Industrial Census is the comprehensive-
ness and the firm-level nature of the information. Moreover, the industrial census
has been used in many studies on Thailand’s industries throughout the past two
decades—for example, Ramstetter (2004) in the Journal of Asian Economics, Ito
(2004) in the Journal of Asian Economics, and in Kohpaiboon (2006a) in the
World Bank’s World Development Report.
Below is a tabulated summary statistics of the three industries which will
be used in this research:
Page 70
5/10/2018 FDI - slidepdf.com
http://slidepdf.com/reader/full/fdi5571fc8b4979599169977641 70/117
Chapter 4. Conceptual Framework and Data Description 65
The Food Industry
Variable Obs Mean Std. Dev. Min MaxExport Sales 9799 11900000 130000000 0 4750000000
age 5814 3 10 0 99All Labor 9799 40 193 1 10532
Foreign Shares 9799 1 8 0 100Efficiency 9799 109476 488174 44 38400000K-L Ratio 9799 109364 303358 0 8188767
Foreign
Share
Present
Xi 0 1 Total
0 9,197 54 9,251
1 426 122 548
Total 9,623 176 9,799
boi Freq. Percent Cum.
0 9,374 95.66 95.66
1 425 4.34 100
Total 9,799 100
Page 71
5/10/2018 FDI - slidepdf.com
http://slidepdf.com/reader/full/fdi5571fc8b4979599169977641 71/117
Chapter 4. Conceptual Framework and Data Description 66
The Textiles and Clothing Industries
Variable Obs Mean Std. Dev. Min Max
Export Sales 9799 11900000 130000000 0 4750000000
age 5814 3.336945 9.590631 0 99
All Labor 9799 40.37698 193.4621 1 10532
Foreign Shares 9799 0.8992754 7.728975 0 100
Efficiency 9799 109475.7 488174 44.44444 38400000
K-L Ratio 9799 109364.4 303358 0 8188767
Foreign Share Present
Xi 0 1 Total
0 9,197 54 9,251
1 426 122 548
Total 9,623 176 9,799
boi Freq. Percent Cum.
0 9,374 95.66 95.66
1 425 4.34 100
Total 9,799 100
Page 72
5/10/2018 FDI - slidepdf.com
http://slidepdf.com/reader/full/fdi5571fc8b4979599169977641 72/117
Chapter 4. Conceptual Framework and Data Description 67
The Electronics and Electrical Appliances Industries
Variable Obs Mean Std. Dev. Min Max
Export Sales 933 493000000 3420000000 0 82800000000
Age 656 11 19 0 94
All Labor 933 281 827 1 9643
Foreign Shares 933 22 38 0 100
Efficiency 933 683503 2092360 1500 37800000K-L Ratio 933 366694 933660 0 14800000
Foreign
Share
Present
Xi 0 1 Total
0 599 75 674
1 64 195 259
Total 663 270 933
boi Freq. Percent Cum.
0 681 72.99 72.99
1 252 27.01 100
Total 933 100
Generally, in the case of primary data, there is a high chance of coming across
observations which are improbable and/or duplicated—for instance, firms with
Page 73
5/10/2018 FDI - slidepdf.com
http://slidepdf.com/reader/full/fdi5571fc8b4979599169977641 73/117
Chapter 4. Conceptual Framework and Data Description 68
negative value-added or firms with unlikely fixed assets values. These improbable
values are results of errors and miscalculations in the survey procedures, and
thus, must be rectified before using such dataset. The 2007 Industrial Census is
a primary dataset obtained through the NSO; therefore, before using this dataset
for empirical analysis purposes, a few data cleaning procedures were performed.
Improbable and duplicated observations were eliminated from the dataset.
The following criteria are used to clean the dataset:
i) Remove duplicates
The 2007 Industrial Census is a plant-level dataset. As this research pa-
per sets out to examine factors which characterize firm-level export decision and
export orientation, data cleaning procedures to remove duplicated observations
which suggest that the observations are collected from the establishments of the
same multi-plant firm were performed.
Observations belonging to the same 4-digit ISIC group which had the same
values of sales and registered capital were flagged. The overlap in the three cat-
egories means the observations likely come from the same firm. Duplicates are
then removed, leaving on one observation to be used in the analysis.
ii) Recalculation of fixed assets values 1
If the value of the firm’s fixed asset per worker have unlikely values—e.g.,
implausibly low (less than 100 baht—equivalent to 2.82 USD) or implausibly high
1The NSO census, fixed assets value are recorded as book value and many firms which havealready written off their fixed asset depreciation value would record the fixed asset value as zero.Some of these firms may hire thousands of workers so the fixed assets for these firms are highlyunderestimated and need imputation.
Page 74
5/10/2018 FDI - slidepdf.com
http://slidepdf.com/reader/full/fdi5571fc8b4979599169977641 74/117
Chapter 4. Conceptual Framework and Data Description 69
(more than 10 billion baht—equivalent to 282 million USD), an imputation of
a new value of the fixed assets will be provided and will replace the unlikely
values:
a. Add up the fixed asset value of all firms in the same 4-digit ISIC code
b. Add up the number of all workers in the same 4-digit ISIC code
c. Divide the obtained total fixed asset (a) by the obtained total number of
workers (b)
d. For firms with fixed asset values more than 282 million USD or less than
2.82 USD, multiply the amount obtained in (c) by the number of workers in the
firm. This will yield the imputed firm’s fixed asset value used in the analysis.
iii) Remove firms with negative value-added
If the firm’s production value is less than the value of the raw materials used
in production—which is likely to be impossible—these firms with negative value
added will be deleted.
iv) Remove firms with improbable values of production per unit labor
Firms with unlikely values of production per unit labor (VP/L) were re-
moved. In particular, unlikely (VP/L) values are firms with more than 1 bil-
lion baht (28.22 million USD) or firms with (VP/L) less than 100 baht (2.28
USD).
After eliminating the duplicates in the three industries studied in this research—
food, textiles and clothing, and electronics and electrical appliances—we are left
Page 75
5/10/2018 FDI - slidepdf.com
http://slidepdf.com/reader/full/fdi5571fc8b4979599169977641 75/117
Chapter 4. Conceptual Framework and Data Description 70
with 24,631firms; 13,899 of which were of the food industry (2,502 plants in the
industry were removed), 9799 of which were of the textiles and clothing industries
(3636 plants in the industries were removed), and 933 of which were in the elec-
tronics and electrical appliances industries (564 plants in the two industries were
removed).
The next chapter proceeds to report the empirical findings of the above
model specification.
Page 76
5/10/2018 FDI - slidepdf.com
http://slidepdf.com/reader/full/fdi5571fc8b4979599169977641 76/117
Chapter 5
Econometric Procedures, Results,
and Discussion
In the previous chapter, hypotheses and models for firm-level export decision
and export orientation were discussed. Recall that in the first model on firm-
level export decision, the dependent variable is binary-valued; therefore, in testing
the hypotheses for the first model, logit and probit econometric techniques are
employed. In the second model on firms export orientation, the export percentage
of outputs is the dependent variable and is assumed to be linearly related with
the independent variables; therefore, ordinary least squares (OLS) techniques are
used to test the hypotheses associated with this second model.
This chapter discusses the econometric procedures employed and the results
obtained from the empirical analysis. The organization of the chapter is as follows:
section 5.1 gives the overview of the econometric procedures used to test the
71
Page 77
5/10/2018 FDI - slidepdf.com
http://slidepdf.com/reader/full/fdi5571fc8b4979599169977641 77/117
Chapter 5. Econometric Procedures, Results, and Discussion 72
hypotheses on the two models specified in chapter 4; and section 5.2 discusses the
results obtained from the empirical analyses.
5.1 Econometric Procedures
5.1.1 Firm-Level Export Decision
X i = F (sizei,agei,FDI i, (V AL
)i, (K L
)i,BOI i) (model (1))
The null hypothesis is that characteristics [such as: sizei, agei, FDI i, (V A
L)i,
(K
L)i, BOI i] do not affect firms export decision—H 0: β i=0, where β i is a vector
of coefficients on the above characteristics.
The model representing firms export decision has a binary-valued dependent
variable (X i); therefore, using ordinary least squares methods (OLS) to estimate
the equation will not be fitting. This is because when estimating the equation
using OLS estimation methods, the predicted dependent variables values will often
be fractions, or lie below 0 or above 1, which are not the possible values for X i--
possible values for X i are 0 and 1.
Another issue which may occur from using OLS estimation methods to es-
timate equations with binary-valued dependent variables is that OLS estimation
methods will assume a linear relationship between the dependent (X i ) and inde-
pendent variables [sizei, agei, FDI i, (V A
L)i, (
K
L)i, BOI i ]. Such an assumption,
in the case of estimating the export decision model, appears to be illogical. For
Page 78
5/10/2018 FDI - slidepdf.com
http://slidepdf.com/reader/full/fdi5571fc8b4979599169977641 78/117
Chapter 5. Econometric Procedures, Results, and Discussion 73
instance, it seems unreasonable, under the OLS assumption, that an increase in
firm As labor (an increase in the size of firm A) from 10 to 100 will have the same
impact on As export decision as when there is an increase in labor from 10,000 to
100,000. Instead, it should be the case that firm A will export only when its size
is big enough to undertake the sunk costs and risks of entering foreign markets—
provided that firm size does have significant influence on firms export decision. In
other words, an arbitrary increase in firm size should not always linearly increase
the probability of a firms export decision.
To accommodate the two issues stated above, the empirical analysis of the
first model on firms export decision will make use of the logit and probit models,
which allow for binary outcomes. However, as reference, the results obtained from
OLS estimations will also be presented in the results table in the appendix.
Logit and probit estimation methods are different from OLS estimation
methods in that logit and probit methods do not assume a linear relationship
between the dependent and independent variables. Instead, the dependent vari-
ables in the logit and probit models are assumed to be an increasing, possibly
nonlinear, function F(.) of the independent variables, which take on values be-
tween 0 and 1 (0 ≤ F (.) ≤ 1).
For the logit model, F(.) is assumed to be the logistic cumulative distribution
function :
F (.) =ez
1 + ez(5.1)
Page 79
5/10/2018 FDI - slidepdf.com
http://slidepdf.com/reader/full/fdi5571fc8b4979599169977641 79/117
Chapter 5. Econometric Procedures, Results, and Discussion 74
while the probit model assumes F(.) to be the standard normal cumulative
distribution function which is expressed as an integral:
F (.) = Φ(Z ) =
Z
−∞
φ(v)dv. (5.2)
where φ(z) is the standard normal density:
φ(z) = (2π)−
12exp(−
z2
2) (5.3)
Therefore, the model can now be rewritten as:
X i = F (Z ); (5.4)
F (Z ) =
Z, → OLS
ez
1 + ez, → Probit
Φ(Z ) = Z
−∞φ(v)dv, → Logit
(5.5)
where:
Z i = β 0 + β 1sizei + β 2agei + β 3FDI i + β 4(V A
L)i + β 5(
K
L)i + β 6BOI i (5.6)
Page 80
5/10/2018 FDI - slidepdf.com
http://slidepdf.com/reader/full/fdi5571fc8b4979599169977641 80/117
Chapter 5. Econometric Procedures, Results, and Discussion 75
5.1.2 Firm-Level Export Orientation
As discussed in Chapter 4, in the second model firms level of export orientation
is modeled as:
ExportShares = G(ownershipi,sizei,agei, (V A
L)i, (
K
L)i,BOI i) (model (2))
where the dependent variable is the firms exports as percentage of output
with the values of the observations being within the 0 to 100 range—0 meaning
that the firm did not export and 100 being the firm exported all of its goods. In
estimating this equation, OLS estimation methods are used. This is because a
linear model seems to approximate well the relationship between the independent
variables and ExportShares—for instance, firm B’s export shares are likely tolinearly increase as firm B’s efficiency (
V A
L)B increase.
Therefore, we use the following specification in the second model on firms
level of export orientation:
ExportShares = γ 0 + γ 1ownershipi + γ 2sizei + γ 3agei + γ 4(V A
L)i + γ 5(
K
L)i + γ 6BOI i +
(5.7)
where represents the error term.
Page 81
5/10/2018 FDI - slidepdf.com
http://slidepdf.com/reader/full/fdi5571fc8b4979599169977641 81/117
Chapter 5. Econometric Procedures, Results, and Discussion 76
5.2 Results and Discussions
5.2.1 Firm-Level Export Decision
X i = F (sizei,agei,FDI i, (V A
L)i, (
K
L)i,BOI i) (model (1))
Using logit or probit depends on the functional form assumption, and there-
fore there is little theoretical motivation for distinguishing between the two mod-
els. Before statistical analysis packages were developed and made accessible to
econometricians, the choice between the two estimation methods were made based
on the ease of data collection and data manipulation (Kennedy, 2003). At present,
with the existence of statistical analysis packages, it is common practice for studies
of binary outcome to report both logit and probit estimation results. This paper
will also present and discuss results for both the logit and probit models.
To reiterate the predicted signs of the coefficients, the table of variables,
its meaning, and its predicted relationship to the dependent variable is presented
below:
Page 82
5/10/2018 FDI - slidepdf.com
http://slidepdf.com/reader/full/fdi5571fc8b4979599169977641 82/117
Chapter 5. Econometric Procedures, Results, and Discussion 77
Variable
Name
Description Predicted
Signs
sizei size of the firm measured by total labor (+)
agei the time which the firm has been operating (+)
FDI i ”binary-valued variable; 1 if firm has for-
eign investments and 0 if otherwise”
(+/-)
(V A/L)i proxy for firm efficiency measured by
value-added per labor
(+)
(K/L)i measuring firm’s utilization of compara-
tive advantage: capital-intensive or labor-
intensive
(-)
BOI i ”binary-valued variable; 1 if firm receives
BOI promotion in promoting exports and
0 if otherwise”
(+)
*Note: The detailed tabulated results are in Appendices section of this pa-
per.
Because different factor intensities are likely to affect firms export behavior
differently, this paper looks at export decisions for three separate groups of firms:
the resource-intensive (food) firms export decision, the labor-intensive industry
(clothing and textiles) firms export decision, and the capital-intensive industry
(electronics and electrical appliances) firms export decision.
Logit Estimations
(See logit estimation results for model (1) in tables A.1, A.2, and A.3 in
Page 83
5/10/2018 FDI - slidepdf.com
http://slidepdf.com/reader/full/fdi5571fc8b4979599169977641 83/117
Chapter 5. Econometric Procedures, Results, and Discussion 78
Appendix C)
(See marginal effects for logit estimates in tables B.1, B.2, and B.3 in Ap-
pendix C)
The Food Industry
The logit estimation of model (1) for the food industry shows that the signs
on the independent variables coefficients are consistent with the predicted signs
shown in Table 5.1 above. The estimated model also suggests that, for the food
industry, firms probability of export is significantly increasing in firm age, firm
efficiency, and the reception of BOI promotion (1 percent significance level). The
binary-valued variable for FDI in the food industry positively impacts firms export
decision at a 10 percent significance level. The pseudo R-squared for the logit
estimation using data from the food industry is 0.843.
The variable on firm size, from the logit estimation, is not significant. This
is not consistent with past studies (Kneller and Pisu, 2007; Kohpaiboon, 2007)
that firms probability to export should be increasing in firm size. However, in the
case of Thailand, there exist many firms in the food industry which are small in
size, but are still able to export such as small firms which produce confectionery,
preserved fruits and vegetables, fish sauce, etc. Furthermore, many of the firms in
the food industry in Thailand are family-owned and a portion of the firms labormay be from family members who are not reported in the Census. Therefore,
the result on the firm size variable may not be significant as a result of these
characteristics of Thailands food industry.
The coefficient on the K/L ratio variable is with the right sign, but the
Page 84
5/10/2018 FDI - slidepdf.com
http://slidepdf.com/reader/full/fdi5571fc8b4979599169977641 84/117
Chapter 5. Econometric Procedures, Results, and Discussion 79
coefficient is not statistically significant. This could be explained by the fact that
the food industrys firms are small. Although there are labor intensive activities,
but as the number of workers is small, the K/L ratio for some firms could be quite
high.
The estimation of the marginal effects (dy/dx) of the logit equation is then
conducted so as to see the change in the probability for an infinitesimal change
in each independent, continuous variable. The marginal effects of the statistically
significant variables suggest the following: i) an increase in one year of the firms
age (ceteris paribus) will result in a 0.083 percent increase in the firms probabil-
ity of export; ii) a unit increase in firms efficiency (V A/L), ceteris paribus, will
increase the probability of firms export participation by 0.14 percent; iii) if the
domestic firm receives FDI, the chances of the firm participating in the export
market increases by 3.4 percent; and finally, iv) if the firm receives BOI promo-
tion in export promotion, the probability of the firm exporting will increase by
97.78 percent.
The Textiles and Clothing Industries
The logit estimations for model (1) of the textiles and clothing industries
also yield results which are consistent with the predicted signs of the coefficients
on the independent variables. The estimated model (1) in the textiles and cloth-
ing industries indicate that the firms probability of export is increasing in firm
age, firm efficiency, firms reception of FDI, and BOI promotion—all the variables
positively impact firms export decision and are significant at the 1 percent level.
The pseudo R-squared for the logit estimation of model (1) in the textiles and
Page 85
5/10/2018 FDI - slidepdf.com
http://slidepdf.com/reader/full/fdi5571fc8b4979599169977641 85/117
Chapter 5. Econometric Procedures, Results, and Discussion 80
clothing industries is 0.713.
The marginal effects estimates on the significant independent variables, ce-
teris paribus could be interpreted as follows: i) an increase in the firms period of
operation by one year increases the probability of the firms export participation
by 0.16 percent; ii) if the domestic firm receives FDI, the probability that the firm
will export will increase by 19.63 percent; iii) an increase in the firms efficiency
will lead to an increase the probability of the firm exporting by 4.35 percent; and
iv) if the firm receives BOI promotion, the probability of the firm switching to
exporting its goods will be 96.4 percent.
The Electronics and Electrical Appliances Industries
Finally, the results for the logit estimation of model (1) in the electronics and
electrical appliances industries are different from what we have predicted. The
logit estimated coefficients on firm age and firm efficiency are negative, while thecoefficient on the capital-labor ratio is positive. The only significant coefficient on
the independent variable is the binary-valued variable for BOI promotion (BOI i)
which is positive and significant at the 1 percent level. All other estimated co-
efficients in this equation are not statistically significant. The pseudo R-squared
measuring of the estimation is 0.885.
This deviation from the predicted signs on the coefficients may be explainedby the limited number of observations on the dataset, and/or by the unique trait of
the electronics and electrical appliances industries. And although the signs of the
coefficients on age, firm efficiency, and firms capital-labor ratio appear to be con-
trary to the predicted signs, the coefficients are not statistically significant.
Page 86
5/10/2018 FDI - slidepdf.com
http://slidepdf.com/reader/full/fdi5571fc8b4979599169977641 86/117
Chapter 5. Econometric Procedures, Results, and Discussion 81
The results of the marginal effects estimation for the electronics and electrical
appliances industries suggest that when the firm receives BOI promotion (BOI i
= 1), the probability of firms exporting their products will increase by 96.62
percent.
In summary, from the logit estimation results of the three industries, BOI
promotion appears to be statistically significant in all three industries. When firms
receive BOI promotion, the firms probability of exporting will increase on average
by 95 percent. Furthermore, in the food and textiles and clothing industries,
firm age, firm efficiency, and firm reception of FDI are significant and positively
influence firms export decision.
Probit Estimations
(See probit estimation results for model (1) in tables A.1, A.2, and A.3 in
Appendix C)
(See marginal effects after probit estimates in tables C.1, C.2, and C.3 in
Appendix C)
The Food Industry
Probit estimation of model (1) for the food industry shows that the signs of
the coefficients on the independent variables are consistent with our prediction.
The estimation also indicates that the firms probability of export is increasing in
firm age and BOI promotion at a 1 percent significance level, and is increasing in
firm efficiency at a 10 percent significance level. The pseudo R-squared for the
probit estimation of model (1) in the food industry is 0.844, similar to that of the
Page 87
5/10/2018 FDI - slidepdf.com
http://slidepdf.com/reader/full/fdi5571fc8b4979599169977641 87/117
Chapter 5. Econometric Procedures, Results, and Discussion 82
logit estimation.
When looking at the marginal effects after probit of each significant indepen-
dent variable, ceteris paribus, we can conclude that: i) if the firms age increases
by 1 year, the probability of the firm exporting its products will also increase by
0.131 percent; ii) with the existence of BOI promotion, a firms probability to ex-
port will increase by 97.56 percent; and iii) with a unit increase in firm efficiency,
the firms probability to export will increase by 0.24 percent.
The Textiles and Clothing Industries
The sign of the coefficients on the probit-estimated model (1) of the textiles
and clothing industries are consistent with the predicted signs. The estimation
suggests that firms probability of export is increasing firm age, firm efficiency,
firm reception of FDI, and BOI promotion—all at a 1 percent significance level.
Furthermore, the estimated model also indicate that the textiles and clothingindustries utilize Thailands comparative advantage of (relatively) cheap labor—
the coefficient on the capital-labor ratio has a negative sign and is statistically
significant at the 5 percent level. Exporting firms tend to be those that have
lower capital-labor ratios. The pseudo R-squared for this model is 0.717.
Estimating the marginal effects of the statistically significant variables in
model (1) of the textiles and clothing industries, we see that: i) an increase infirm age by 1 year results in an increase in the probability of the firms exports
by 0.2 percent, ceteris paribus ; ii) a change from not receiving FDI to receiving
FDI will increase a firms chances in exporting its products by 19.71 percent; iii)
a unit increase in firm efficiency will bring the probability of the firms export
Page 88
5/10/2018 FDI - slidepdf.com
http://slidepdf.com/reader/full/fdi5571fc8b4979599169977641 88/117
Chapter 5. Econometric Procedures, Results, and Discussion 83
participation up by 4.7 percent; iv) the reception of BOI promotion will increase
the firms probability to export by 95.82 percent; and finally, an additional unit of
labor added to the production process will increase the firms probability to export
by 1.6 percent.
The Electronics and Electrical Appliances Industries
In the case of the electronics and electrical appliances industries, the probit
estimation coefficients have signs which are inconsistent with the predicted val-
ues. In the probit-estimated model (1) of the electronics and electrical appliances
industries, the relationship between firm age, firm efficiency, and firm utilization
of the countrys comparative advantage in cheap labor appears to have opposite
signs from what was predicted. However, this departure from the predicted signs
is not statistically significant and can be explained by the limited amount of ob-
servations and/or by the industry-specific characteristics of the electronics and
electrical appliances industries in Thailand. The only significant coefficient on
the independent variable in this estimated model is BOI promotion—significant
at the 1 percent level.
When looking at the marginal effects estimation, we see that once the firm
receives BOI promotion (BOI i =1), the firms probability to export will increase
by 96.54 percent.
Comparing Logit and Probit Estimation Results
(Tabulated comparative statistics are in tables D.1, D.2, D.3, and E.1, E.2,
E.3)
Page 89
5/10/2018 FDI - slidepdf.com
http://slidepdf.com/reader/full/fdi5571fc8b4979599169977641 89/117
Chapter 5. Econometric Procedures, Results, and Discussion 84
The Food Industry
For the logit and probit estimations of model (1) in the food industry, when
comparing the McFaddens R-squared and the Counted R-squared of the two mod-
els (these two statistics could be found in tables D.1 and E.1 for the logit and
probit estimations respectively), we find that the probit estimation has a higher
McFaddens R-squared value than the logit-estimated model—0.844 and 0.843 cor-
respondingly. On the other hand, when we look at the Counted R-squared value
of the two estimated equations, we will see that the Counted R-squared for logit
estimation (0.993) is higher than that of the probit estimation (0.992). However,
the difference in values for the two estimation techniques is miniscule (0.001) and
therefore the two methods of estimation appear to fit the equation in model (1)
equally well.
The Textiles and Clothing Industries
In the case of the textiles and clothing industries, the McFaddens and
Counted R-squared values for the logit estimation are 0.713 and 0.976 respec-
tively. For probit, on the other hand, the values of the McFaddens R-squared is
0.717 and the Counted R-squared is 0.977. The higher values in the McFaddens
R-squared and the Counted R-squared for the probit method suggest that probit
estimation methods better fit the textiles and clothing industries model (1). Note,
however, that the magnitude of the difference is small and estimation results do
not seem to suggest major differences between the logit and probit methods.
The Electronics and Electrical Appliances Industries
As for the electronics and electrical appliances industries, the McFaddens
Page 90
5/10/2018 FDI - slidepdf.com
http://slidepdf.com/reader/full/fdi5571fc8b4979599169977641 90/117
Chapter 5. Econometric Procedures, Results, and Discussion 85
R-squared is 0.884 and the Counted R-squared is 0.985. In the case of the probit-
estimated model, the McFaddens R-squared is 0.885 and the Counted R-squared
value is the same as the Counted R-squared value of the logit estimation. There-
fore, for the electronics and electrical appliances industries, both logit and probit
models fit the model well.
5.2.2 Firm-Level Export Orientation
Recall that in model (2) will use OLS to estimate firm-level export orienta-
tion:
ExportSharesi = G(ownershipi,sizei,agei, (V A
L)i, (
K
L)i,BOI i) (5.8)
Page 91
5/10/2018 FDI - slidepdf.com
http://slidepdf.com/reader/full/fdi5571fc8b4979599169977641 91/117
Chapter 5. Econometric Procedures, Results, and Discussion 86
Variable
Name
Description Predicted
Signs
sizei size of the firm measured by total labor (+)
agei the time which the firm has been operating (+)
FDI i ”binary-valued variable; 1 if firm has for-
eign investments and 0 if otherwise”
(+/-)
(V A/L)i proxy for firm efficiency measured by
value-added per labor
(+)
(K/L)i measuring firm’s utilization of compara-
tive advantage: capital-intensive or labor-
intensive
(-)
BOI i ”binary-valued variable; 1 if firm receives
BOI promotion in promoting exports and
0 if otherwise”
(+)
As stated in chapter 4, the possible problem of reverse causality between
firms exports and firm-level efficiency is still debatable—whether there is self-
selection or a learning process. This causality problem may create an endogeneity
bias in the OLS coefficient. To address this problem, the method of instrumen-
tal variable (IV) can be employed. Candidate instrumental variables are those
that are correlated to the potentially endogenous regressor—the efficiency vari-able (V A/L)i in our model—but not correlated to the error term of the OLS
specification. Among the available variables in the dataset, waste management
expenditure per worker may be a reasonable candidate instrument. This variable
is likely to be (inversely) correlated to efficiency of the firm since more efficient
Page 92
5/10/2018 FDI - slidepdf.com
http://slidepdf.com/reader/full/fdi5571fc8b4979599169977641 92/117
Chapter 5. Econometric Procedures, Results, and Discussion 87
firms should have less waste. The variable is also unlikely to be correlated to be
correlated to the error term, i.e., the variable is likely to be exogenous.
Because of this potential endogeneity problem, the empirical analysis of this
model is divided into two stages: the first stage is checking for endogeneity in
the firm-efficiency variable ((V A/L)i); and in the second stage, estimated model
(2) by using OLS estimation methods—and fixing the endogeneity problem if
necessary.
In the first stage, I checked for endogeneity by regressing the potentially en-
dogenous variable, (V A/L)i, on all exogenous variables including the instrumental
variable—(reg.1). Then, to test for endogeneity of (V A/L)i, I include the pre-
dicted error from this regression in the original OLS model specification—(reg.2).
If the coefficient on the predicted error in (reg.2) is statistically significant, then
there are endogeneity problems and the IV estimation method must be introduced
to fix the problem. However, after testing for endogeneity, the results in (reg.2)
appear to indicate that the coefficient on the predicted error (from reg.1) is not
statistically significant. Therefore, this model is unlikely to suffer from endo-
geneity problems and will not need to be instrumented (Table IV in Appendix C
reports the results obtained from reg.2).
To further verify that endogeneity is not a problem, I also performed the
Hausman test using the Stata statistical package to compare the OLS model and
the IV model. The test shows no statistical difference between the two methods.
This, along with the test for endogeneity above, gives us confidence to proceed
with the OLS specification.
Page 93
5/10/2018 FDI - slidepdf.com
http://slidepdf.com/reader/full/fdi5571fc8b4979599169977641 93/117
Chapter 5. Econometric Procedures, Results, and Discussion 88
It should also be noted that, the error terms on the independent variables
in this model—model (2)—are heteroskedastic. Although heteroskedasticity does
not make the OLS estimators biased, it still affects the standard error of the
coefficients estimated—giving incorrect values of the standard errors. Therefore,
to correct for heteroskedasticity in model (2), robust-OLS estimation methods are
used for model (2).
After having verified that endogeneity is unlikely to be a problem, we, then,
proceed to the next stage of the analysis—using OLS to estimate firms export
intensity. The analysis in this section, similar to that for model (1), divides
firms into the three industry groups—the food industry, the textiles and clothing
industries, and the electronics and electrical appliances industries.
The food industry
(Food industry robust OLS results can be found in Table F, column 1, in Appendix C)
The adjusted R-squared from the OLS (Robust) estimation of model (2) is
0.6591. The signs of the coefficients on agei, ownershipi, (V A/L)i, and (K/L)i
are consistent with predictions (Table 5.2)—agei, ownershipi, and (V A/L)i have
positive coefficients, and (K/L)i has a negative one. However, the coefficient on
the size variable sizei
is the reverse of our prediction.
We predicted that firms export orientation should be increasing in firm size,
and therefore, the coefficient on firm size should be positive. However, in the case
of the food industry, the coefficient on firm size is negative and is statistically
significant at the 1 percent level. This implies that more workers in firms in
Page 94
5/10/2018 FDI - slidepdf.com
http://slidepdf.com/reader/full/fdi5571fc8b4979599169977641 94/117
Chapter 5. Econometric Procedures, Results, and Discussion 89
the food industry decrease the intensity of export of the firms. This negative
coefficient on firm size in model (2) for the food industry may be explained by
the fact that firms in the food industry in Thailand are resource-intensive rather
than size-intensive. Moreover, the negative coefficient could be due to diminishing
returns to labor. In other words, in a resource-intensive industry such as the food
industry, more labor in the firm could bring about diminishing returns to labor
productivity, resulting in the negative relationship between number of workers and
export intensity. This is consistent with previous discussion in chapter 3 (section
3.4), which stated that firms in this industry are generally small and medium-sized
enterprises (SMEs).
Additionally, as the size variable is with an unexpected sign, but the K/L
ratio is significant with an expected sign and is significant. It is probable that for
increasing export intensity, the comparative advantage in labor input is signifi-
cant.
Other statistically significant variables in the OLS estimation of model (2) in
the food industry are: ownershipi, agei, (K/L)i, and BOI i. The estimated coeffi-
cients on all four variables are positive and significant at the 1 percent level.
In sum, results for firms in the food industry shows that firms export intensity—
or firms level of export orientation—are increasing in foreign shares in the firm,
firm age, firm utilization of labor, and BOI promotion. Furthermore, in the case
of the food industry, firm-level export intensity seems to be decreasing in firm
size.
The textiles and clothing industries
Page 95
5/10/2018 FDI - slidepdf.com
http://slidepdf.com/reader/full/fdi5571fc8b4979599169977641 95/117
Chapter 5. Econometric Procedures, Results, and Discussion 90
(Textiles and clothing industries Robust OLS results can be found in Table
F, column 2 in Appendix C)
Results of the robust OLS estimation of model (2) in the textiles and cloth-
ing industries show that the signs of the estimated coefficients are consistent with
predictions. The factors which appear to be statistically significant in firm-level
export intensity for the textiles and clothing industries are percentage of foreign
ownership (ownershipi), firm age (agei), firm efficiency ((V A/L)i), BOI promo-
tion (BOI i), and firm utilization of [cheap] labor ((K/L)i). The adjusted R-
squared of the estimated model (2) for this industry is 0.5787
Firm-level export intensity is increasing in the percentage of foreign owner-
ship in the firm (ownershipi), the firm age (agei), the level of the firms efficiency
((V A/L)i), and BOI promotion (BOI i). The coefficients on ownershipi, agei,
(K/L)i, and BOI i are significant at the 1 percent level, while the coefficient on
(V A/L)i is significant at the 5 percent level. In the case of the textile and cloth-
ing industry, the null hypotheses that percentage of foreign ownership, firm age,
firm efficiency, BOI promotion, and firm utilization of [cheap] labor do not affect
firms level of export orientation can all be rejected at a 95 percent confidence
interval.
The results obtained from the robust OLS estimation of model (2) for the
textiles and clothing industries are consistent with the industries labor-intensive
characteristic. In other words, the negative and statistically significant coefficient
on (K/L)i is consistent with the fact that the textiles and clothing industries are
labor-intensive.
Page 96
5/10/2018 FDI - slidepdf.com
http://slidepdf.com/reader/full/fdi5571fc8b4979599169977641 96/117
Chapter 5. Econometric Procedures, Results, and Discussion 91
The electronics and electrical appliances industries
(Electronics and electrical appliances industries robust results can be found
in Table F, column 3 in Appendix C)
Looking at the results on the estimated coefficients which are significant
in the model, we find that firm-level export orientation is increasing in firm size
(sizei), firm age (agei), percentage of foreign share in the firm (ownershipi),
and BOI promotion (BOI i). In particular, the robust OLS estimated model (2)
indicates that firm size and BOI promotion positively influence firms level of
export intensity at a 1 percent significance level; and that the percentage of foreign
ownership shares (ownershipi) and firm age (agei) positively impacts the firms
level of export orientation at a 5 percent significance level. Therefore, the null
hypotheses that firm size, firm age, firm ownership, and BOI promotion do not
affect the level of firms export intensity can be rejected at a 95 percent confidence
interval.
The adjusted R-squared for the estimated robust OLS model (2) in the elec-
tronics and electrical appliances industries is 0.6385. The signs on the coefficients
of the independent variables are mostly consistent with the predicted signs; only
firm efficiency ((V A/L)i) in the estimated equation appears to have a reverse sign
from what was predicted—the estimated coefficient on (V A/L)i is negative. This
reversal of sign on the coefficient could be due to the fact that the stages of pro-
duction in these two industries in Thailand do not use very advanced technologies
and still rely much on imported raw materials (Tambunlertchai, 2002). Therefore,
the value added produced is not high.
Page 97
5/10/2018 FDI - slidepdf.com
http://slidepdf.com/reader/full/fdi5571fc8b4979599169977641 97/117
Chapter 5. Econometric Procedures, Results, and Discussion 92
We had also predicted the coefficient on the capital-labor ratio variable to be
negative—owing to Thailands abundant and cheap labor. The estimated results,
however, yields a positive coefficient on the capital-labor ratio for the electronics
and electrical appliances industries. Despite the sign reversal, a positive coefficient
on the capital-labor ratio in two industries is consistent with the industries capital-
intensive characteristic. In particular, in the electronics and electrical appliances
industries in Thailand, even though the stages of production do not employ much
advanced technology, the investment in capital equipment for firms with a high
percentage of export sales could still be quite heavy. Nonetheless, the coefficient
on capital-labor ratio in this estimated equation is not significant.
In conclusion, it can be said that in the case of firm-level export intensity—or
export orientation—the percentage of foreign ownership in the firm (ownershipi)
and BOI promotion (BOI i) are important factors which positively contributes to
firms level orientation. For the food industry and the textiles and clothing in-
dustries, firm age (agei) and firm-level capital-labor ratio ((K/L)i) also positively
impact firms export intensity; whereas in for the electronics and electrical appli-
ances industries, firm size (sizei) and BOI promotion (BOI i) play more important
roles in contributing to firms exports than the share of foreign ownership of the
firm.
In the following chapter, I will conclude this research with a summary of the
results obtained as well as with the policy implications which can be drawn from
the study.
Page 98
5/10/2018 FDI - slidepdf.com
http://slidepdf.com/reader/full/fdi5571fc8b4979599169977641 98/117
Chapter 6
Conclusion
The Thai government, like many other developing economies’ government in the
world, has been pursuing an export-led growth policy. For this reason, the study
of what determines firms’ exports is important for understanding the kinds of
policies needed to promote export growth. This thesis studies the influences of
foreign direct investment (FDI) on firm-level export outcomes in Thailand. In
particular, the goals of this thesis are to identify factors along with FDI that
determine firms’ export orientation, and to make policy recommendations with
regard to facilitating MNCs export spillovers. With such goals in mind, I con-
ducted empirical studies in an attempt to determine factors which contribute to
firms’ export participation and to identify the elements which influence firms’
export intensity.
Because different factor intensities are likely to affect firms’ export behavior
differently, this paper looks at export decisions for three separate groups of firms:
93
Page 99
5/10/2018 FDI - slidepdf.com
http://slidepdf.com/reader/full/fdi5571fc8b4979599169977641 99/117
Chapter 6. Conclusion 94
the resource-intensive (food) firms’ export decision, the labor-intensive industry
(clothing and textiles) firms’ export decision, and the capital-intensive industry
(electronics and electrical appliances) firms’ export decision.
Findings from this study show that BOI promotion (BOI i), the existence
of FDI in a firm (FDI i), and firm experience (agei) are all significant factors
which positively influence firms decision to export. Model (1)’s estimations re-
veal that BOI promotion, on average, increases the probability of a firm’s export
participation by as much as 95 percent across all three industries studied. This
shows that the government has had a big role in the promotion of firms’ export
in Thailand. The existence of FDI in a firm, usually hypothesized to have a
key role in firms’ export participation, appears to only (positively) impact the
resource-intensive (food) and labor-intensive (textiles and clothing) firms’ export
decision. This result may be explained by Thailand’s comparative advantage in
being resource-abundant and having relatively cheap labor wages. These advan-
tages in the country not only enable the manufacturing sector to prosper, but
also attracts foreign direct investors in these industries to choose Thailand as a
production base.
The results obtained from estimating model (1) firm-level export decision-
suggest that firm size is not a significant element in determining firms’ decision to
export across all three industries. Such results are inconsistent with past studies
(Bernard and Jensen, 1995, 1997, 1999; Roberts and Tybout, 1997; Aitken et al.,
1997; Kohpaiboon, 2007; Kneller and Pisu, 2007) that suggest that firms which
are bigger will be more likely to participate in the export market; this divergence
Page 100
5/10/2018 FDI - slidepdf.com
http://slidepdf.com/reader/full/fdi5571fc8b4979599169977641 100/117
Chapter 6. Conclusion 95
from previous results can be explained by differences in data and the Thai govern-
ment’s more recent policies on export. In the past decade, the Thai government
has been implementing export-promotion policies on firms of all sizesbig, small,
and medium-sized enterprises (SMEs). As a result of such policies, small firms
in Thailand have been able to export their products as well. This study uses
more recent data from the 2007 Industrial Census, which reflect the outcome of
these policies. Therefore, in the case of Thailand today, it can be concluded that
firm size may not be a significant element which contributes to firms’ decision to
export.
Secondary findings from this study on the characterization of firms’ export
intensity (model (2)) suggest that the intensity of foreign ownership within a firm,
firm age, and BOI promotion all influence the level of the firm’s export orientation.
Results indicate that across all three industries, the higher the shares of foreign
ownership in a firm, the higher the share of exports to output from the firm.
BOI promotion is also statistically significant across all industries in this second
modelindicating its importance for both the firms’ likelihood of export as well as
their export intensity.
This thesis’ findings provide a strong support that BOI promotion is a key
determinant of firm-level export decision as well as the level of export orientation
in Thailand. Although foreign direct investment within the firm contributes pos-
itively to firms’ likelihood of export, its effects are not very significant and occurs
only in some industries. The effect of foreign ownership shares in the firm, on the
other hand, has a noteworthy positive impact on firms’ export intensity across all
Page 101
5/10/2018 FDI - slidepdf.com
http://slidepdf.com/reader/full/fdi5571fc8b4979599169977641 101/117
Chapter 6. Conclusion 96
industries. This seems to suggest that while firms may not need FDI to enter the
export market, the presence of FDI in exporting firms does contribute to their
success in the export market. This study has shown that the Thai government
has been quite successful in its export promotion effort. To continue to promote
exports in Thai firms, the government may look into expanding BOI promotion
to non-exporting firms looking to enter the export market in addition to purs-
ing policies which encourage foreign direct investors to choose Thailand as a host
country for their investments.
Page 102
5/10/2018 FDI - slidepdf.com
http://slidepdf.com/reader/full/fdi5571fc8b4979599169977641 102/117
Bibliography
• Aitken, B., H.G Hanson and A.E. Harrison (1997), “Spillovers, Foreign Invest-ment, and Export Behavior”, Journal of International Economics, 43, 1, 103-32
• Akira, S. (1989), “Capital Accumulation in Thailand 1855-1985”, Bangkok:Silkworn Books
• Athukorala, P., S. Jayasuriya and E. Oczkowski (1995), “MultinationalFirms and Export Performance in Developing Countries: Some Analytical Is-sues in New Empirical Evidence”, Journal of Development Economics, 46, 109-
122
• Balassa, B. (1993), Policy Choices for the 1990s, New York, NY
• Balasubramanyam, V.N., M.A. Salisu, and D. Sapsford (1996), “ForeignDirect Investment and Growth in EP and IS Countries”, Economic Journal , 106,434, 92-105
• Baldwin, R.E. (1988), “Hysteresis in Import Prices: The Beachhead Ef-fect”, American Economic Review , 78, 4, 773-785
• Baldwin, R.E. and P.R. Krugman (1989), “Persistent Trade Effects of Large Exchange Rate Shocks”, Quarterly Journal of Economics, 104, 4, 635-654
• Barrios, S., H. Gorg and E. Strobl (2003), “Explaining Firms” ExportBehaviour: R&D, Spillovers and the Destination Market”, Oxford Bulletin of Economics and Statistics, 65, 4, 475-96
• Bernard, A. and J.B. Jensen (1995), “Exporters, Jobs and Wages inU.S. Manufacturing, 1976-87”, Brookings Papers on Economic Activity: Microe-
97
Page 103
5/10/2018 FDI - slidepdf.com
http://slidepdf.com/reader/full/fdi5571fc8b4979599169977641 103/117
Chapter 6. Conclusion 98
conomics, 67-119
• Bernard, A. and J.B. Jensen (1997), “Why Some Firms Export: Experi-ence, Entry Costs, Spillovers, and Subsidies”, Yale mineo
• Bernard, A. and J.B. Jensen (1999), “Exceptional Exporter Performance:Cause, Effect, or Both”, Journal of International Economics, 47, 1-25
• Bernard, A. and J.B. Jensen (2004), “Why Some Firms Export”, TheReview of Economics and Statistics, 86, 2, 561-569
• Berndt, E. (1991), The Practice of Econometrics, Addison-Wesley, MA
• Caves, Richard E. (1971), “Industrial Corporations: The Industrial Eco-nomics of Foreign Investment,” Economica 38, 1 27 .
• Caves, Richard E. (1996), Multinational Enterprise and Economic Analy-sis. Second Edition. Cambridge: Cambridge University Press.
• Chen T.J. and Y.H. Ku (2000), “The Effect of Foreign Direct Investmenton Firm Growth: The Case of Taiwan”s Manufacturers”, Japan and the World Economy , 12, 2, 153-172
• Dixit, A. (1989), “Entry and Exit Decisions Under Uncertainty”, Journal of Political Economy , 97, 3, 620-638
• Dunning, J. (1977), “Trade, Location of Economic Activity, and the Multi-national Enterprise: A Search for an Eclectic Approach”, The International Allo-cation of Economic Activity , ed. B. Ohlin, P.O. Hesselborn, and P.M. Wijkman.New York: Holmes and Meier
• Dunning, J. (1981), International Production and the Multinational En-terprise, London: George Allen and Unwin
• Feenstra, R. (2004), Advanced International Trade: Theory and Evidence,Princeton University Press, Princeton
• Glass, A.J. and K. Saggi (2000), “Exporting versus Direct Investment
Under Local Sourcing”, Review of World Journal Economics, 141, 4, 627-647• Greenaway, D. and R. Kneller (2004), “Exporting and Productivity in the
UK”, Oxford Review of Economic Policy , 20, 3, 358-371
• Greenaway, D. N. Sousa, and K. Wakelin (2004), “Do Domestic FirmsLearn to Export from Multinationals?”, European Journal of Political Economy ,20, 1027-1043
Page 104
5/10/2018 FDI - slidepdf.com
http://slidepdf.com/reader/full/fdi5571fc8b4979599169977641 104/117
Chapter 6. Conclusion 99
• Greenaway, D., N. Sousa and K. Wakelin (2004), “Do Domestic FirmsLearn to Export From Multinationals?”, European Journal of Political Economy ,20, 4, 1027-43
• Hahn, C.H. (2004), “Exporting and Performance of Plants: Evidence fromKorean Manufacturing”, NBER Working Paper 10208, National Bureau of Eco-nomic Research (NBER), Cambridge
• Helleiner, G.K. (1988), “Direct Foreign Investment and Manufacturing forExport in Developing Countries: A Review of Issues, in S. Dell (ed.)”, Policies
for Development , Macmillan, London
• Hymer, S.H. (1976), The International Operations of National Firms: AStudy of Direct Foreign Investment , Cambridge, MA
• Ito, K. (2004), “Foreign Ownership and Plant Productivity in the ThaiAutomobile Industry in 1996 and 1998: A Conditional Quantile Analysis”, Journal of Asian Economics, 15, 2, 321-353
• Kennedy, P. (2003), A Guide to Econometrics, Oxford, Blackwell ScientificPublications
• Kindleberger, C.P. (1970), The International Corporation , Cambridge,MA
• Kneller, R. and M. Pisu (2007), “Industrial Linkages and Export Spilloversfrom FDI”, The World Economy , 105-134
• Kohpaiboon, A (2007), “Multinational Corporations and Export Perfor-mance: Analysis of Thai Manufacturing”, Faculty of Economics, Thammasat Uni-versity
• Kohpaiboon, A. (2003), “Foreign Trade Regime and FDI-Growth Nexus: ACase Study of Thailand”, Journal of Development Studies, December, 55-69
•Kohpaiboon, A. (2006a), “Foreign Direct Investment and Technology Spillover:A Cross- Industry Analysis of Thai Manufacturing”, World Development , March,
541-556• Kohpaiboon, A. (2006b), Multinational Enterprises and Industrial Trans-
formation: Evidence from Thailand , Edward Elgar, Cheltenham
• Kokko, A. and M. Blomstrom (1997), Regional Integration and Foreign Direct Investment , CEPR DP 1659 (London)
• Kokko, A., M. Zejan and R. Tansini (2001), “Trade Regimes and Spillover
Page 105
5/10/2018 FDI - slidepdf.com
http://slidepdf.com/reader/full/fdi5571fc8b4979599169977641 105/117
Chapter 6. Conclusion 100
Effects of FDI: Evidence from Uruguay”, Weltwirtschaftliches Archiv , 137, 124-149
• Lipsey, R.E. (1999), “Affiliates of US and Japanese Multinationals in EastAsian Production and Trade”, NBER Working Paper 7292, National Bureau of Economic Research (NBER), Cambridge
• Markusen, J.R. (1995), “The Boundaries of Multinational Enterprises andthe Theory of International Trade”, Journal of Economic Perspectives, 9, 2, 169-189
• Markusen, J.R. and K.E. Markus (1999), “Estimating the Knowledge-Capital Model of the Multinational Enterprise” NBER Working Paper 6773, Na-tional Bureau of Economic Research (NBER), Cambridge
• Melo, J.D. and A. Sapir (1991), “Trade Theory and Economic Reform:North, South and East: Essays in Honor of Bela Balassa”, 1990, 82-98
• Moosa, I. A. (2002), Foreign Direct Investment: Theory, Evidence andPractice, Palgrave Macmillan
• Piamphongsant, T. (2007), “Thai Manufactured Exports: Performanceand Technological Change Since the 1997 Crisis”, Ph.D. Thesis, University of London
• Ramstetter, E D. Direct Foreign Investment in Developing Economies andStructural Change in the Asia-Pacific Region, Westview: Boulder (1992).
• Ramstetter, E.D. (2004), “Labor Productivity, Wages, Nationality, andForeign Ownership Shares in Thai Manufacturing 1996-2000”, Journal of Asian Economics, 14, 6, 861-884
•Roberts, M.J. and J.R. Tybout (1997), “The Decision to Export in Columbia:An Empirical Model of Entry with Sunk Costs”, American Economic Review , 87,4, 545-564
• Tambunlertchai, S. (1975) “Foreign Direct Investment in Thailand’s Man-
ufacturing Industries”. Ph.D. thesis, unpublished, Duke University.• Tambunlertchai, S. (1993) “Manufacturing” in Warr, P. (ed.), The Thai
Economy in Transition, Cambridge: Cambridge University Press.
• Tambunlertchai, S. et al. (1998) Kan Suk Sa Krong Srang Pajjai KanPalit Pur Perm Keed Kwam Samart Nai Karn Khang Khan Khong UttasahakamKrueng Chai Fai Fa [The Structure of Production Factors for Enhancing Com-petiveness of Electrical Appliances Industry]. Thammasat University.
Page 106
5/10/2018 FDI - slidepdf.com
http://slidepdf.com/reader/full/fdi5571fc8b4979599169977641 106/117
Chapter 6. Conclusion 101
• Tambunlertchai, S. et al. (2002) “Tracking Manufacturing Performance:A Review of the Industrial Sector in Thailand”, UNIDO Integrated Program forThailand
• Tambunlertchai, S. et al. (2004) Kroeng karn vikraw lae phuek obrom karn chai kor moon tee dai jak karn samruaj rongngan [Project for analysis andtraining for industrial survey]. Thammasat University, cited in Economic Researchand Training Center, Krong Karn Jad Tum Baab Jamlong Vijai Chueng Nayobai Uttasahakarm . Thammasat University.
• Toni, A.D. and G. Nassimbeni (2001), “The Export Propensity of SmallFirms: A Comparison of Organizational and Operational Management Levers in
Exporting and Non-exporting Units”, International Journal of Entrepreneurial Behavior and Research , 7, 4, 132-147
• UNCTAD (1999), World Investment Report
• Vernon, R, (1966), “International Investment and International Trade inthe Product Cycle”, Quarterly Journal of Economics, 80, 190-207
• World Bank (1993), The East Asian Miracle: Economic Growth and PublicPolicy , Oxford University Press for the World Bank, Washington DC
• Zhang, K.H. (2006), “How Does FDI Affect a Host Country”s ExportPerformance? The Case of China”, Department of Economics, Illinois State Uni-
versity
• Zhang, K.H. and S. Song (2000), “Promoting Exports: The Role of InwardFDI in China”, China Economic Review , 11, 4, 385-396
Page 107
5/10/2018 FDI - slidepdf.com
http://slidepdf.com/reader/full/fdi5571fc8b4979599169977641 107/117
Appendix A
Appendix A
102
Page 108
5/10/2018 FDI - slidepdf.com
http://slidepdf.com/reader/full/fdi5571fc8b4979599169977641 108/117
Appendix A. Appendix A 103
Table A.1: Net Flow of Foreign Direct Investment to Thailand Classified by Country2008 p 2007 p 2006 2005 2004 2003 2002 2001
Japan 2555.49 3135.72 2576.42 2926.51 2749.93 2297.67 1892.41 1955.12USA 1162.72 570.06 165.78 750.48 540.42 336.23 182.34 395.01
EU (15) 4/ 685.26 1561.89 955.41 335.02 697.31 607.55 -216.12 282.91EU 5/ 717 1581.21 960.11 334.95 700.8 609.62 -215.13 281.84
Austria 20.04 -13.76 53.14 25 12.26 0.75 18.21 9.27Belgium 45.27 70.76 51.78 111.84 93.34 -1.94 55.65 -34.17
Germany -269.9 90.76 331.21 314.62 275.58 210.09 70.58 97.94Denmark 80.6 58.18 32.06 13.97 22.17 13.41 10.14 9.61
Spain 43.36 59.68 40.83 -30.55 0.89 0.71 0.79 2.45Finland 19.38 9.81 -72.91 -54.16 39.4 8.82 45.58 0.58France 116.36 109.67 24.54 41.08 -180.15 9.53 9.23 108.81
UK 313.22 303.59 212.91 -90.87 264.88 8.49 259.12 288.99Greece 6.43 1.03 -0.04 -0.01 0.09 0.67 0.09 0.18Ireland 26.08 -26.13 11.39 62.78 -42.15 6.95 52.59 49.79
Italy 13.06 12.41 -0.56 1.9 18.38 7.56 7.82 6.02Luxembourg 31.19 12.82 -3.97 24.71 5.16 10.91 -14.16 -18.43
Table A.2: Net Flow of Foreign Direct Investment to Thailand Classified by Country2008 2007 2006 2005 2004 2003 2002 2001
Netherlands 227.06 758.08 262.25 -94.72 166.52 284.7 -757.2 -308.58Portugal 0.37 0.28 0 -0.05 0.26 0.3 0.19 0.19Sweden 12.68 114.69 12.77 9.47 20.63 46.52 25.21 70.21Cyprus 12.77 7.64 0.08 -0.06 0.55 0.19 0 0.06
Czech Republic 2.12 0.25 0 0 0.92 0.48 0.35 -1.49Estonia 2.01 1.32 0 0 0.05 0.08 0.15 -0.01
Hungary 0.97 1.83 0.01 0 0.28 0.05 0.27 0.08Latvia 8.68 5.22 0 0 0.85 0.76 0.09 0
Lithuania 1.42 2.25 0 0 0.01 0 0 0Malta 0.29 -1.51 4.2 0 0.72 0.14 0.1 0.08
Slovakia 0.7 0.36 -0.12 0 0.04 0.08 0 0Poland 0.67 1.27 0.53 0 0 0.26 0 0.18
Slovenia 0.66 0.14 0 0 0.02 0 0 0Bulgaria 0.02 0 0 0 0.04 0 0 0Romania 1.36 0.51 -0.01 0 0 0 0 0
ASEAN (5) 6/ 2545.86 2560.17 4597.15 1107.34 683.37 1053.86 1403.52 1709.95
Page 109
5/10/2018 FDI - slidepdf.com
http://slidepdf.com/reader/full/fdi5571fc8b4979599169977641 109/117
Appendix A. Appendix A 104
Table A.3: Net Flow of Foreign Direct Investment to Thailand Classified by Country2008 2007 2006 2005 2004 2003 2002 2001
ASEAN 7/ 2537.36 2566.92 4626.5 1101.32 688.68 1060.44 1408.29 1710.68Brunei -3.55 -3.92 2.2 4.71 2.09 0.07 0.1 0
Indonesia 7.89 6.1 -6.35 1.06 5.87 6.72 7.43 2.81Malaysia 63.85 21.3 321.82 38.36 147.31 41.24 -32.55 10.66
Philippines 25.86 7.1 -0.46 -5.54 182.96 5.43 -0.41 2.88Singapore 2451.79 2529.58 4279.94 1068.74 345.12 1000.38 1428.95 1693.59Cambodia 1.1 1.32 0.03 0.02 3.41 5.54 1.44 0.65
Laos 0.1 -0.06 38.68 -6.06 0 0.07 0 0.05Myanmar 1.07 1 0.08 -0.07 0.39 0.61 1.2 -0.01Vietnam -10.79 4.47 -9.44 0.09 1.5 0.34 2.12 0.03
Hong Kong 273.65 390.37 -77.84 7.16 141.4 613.08 86.25 150.58Taiwan 93.04 91.5 -94.55 29.24 124.2 75.25 103.7 156.83
South Korea 142.03 75.33 79.48 29.51 93.53 23.83 93.22 50.64China 69.04 73.71 49.87 11.55 -3.82 23.83 20.9 -2.5
Canada 26.77 25.52 7.06 -11.22 28.53 21.17 15.04 5.9Australia 96.06 69.36 11.18 -1.09 99.85 32.47 -0.42 0.56
Switzerland 523.61 172.37 153.9 99.81 167.3 124.12 48.07 55.34Others 1614.58 1446.98 2021.78 1224.89 -374.87 -52.75 -223.71 287.94Total 9811.39 10199.09 10479.74 6503.16 4956 5165 3411 5048
Table A.4: Exports Classified by Product Group (Millions of USD2008 p 2007 p 2006 2005 2004 2003 2002 2001
Industry 4477.65 3651.17 4068.87 3429.86 3785.98 2408.58 1844.53 2960.26Food sugar 239.56 120.62 118.13 -24.76 337.32 265.14 21.28 155.06Textiles 60.18 71.18 -7.88 77.87 37.95 64.46 43.29 105.56Metal & non metal-lic
514.46 507.51 354.65 221.43 480.07 255.75 259.82 378.35
Electrical appli-ances
401.20 380.53 1080.91 908.29 797.01 327.44 214.93 981.29
Machinery& trans-port equipment
1274.13 1236.34 1402.81 1369.98 1280.34 653.10 644.45 578.81
Chemicals 417.25 -141.95 173.95 472.39 387.34 295.90 334.09 167.77Petroleum prod-ucts
632.37 378.58 332.18 -72.60 22.49 95.25 -50.16 179.93
Construction mate-rials
17.55 31.42 7.85 21.66 45.05 -7.89 31.37 0.18
Others 920.93 1066.92 606.25 455.58 398.36 459.39 345.42 413.27Financial institu-
tions
2002.89 1882.23 2490.21 1550.89 221.65 -24.52 67.34 -186.17
Trade 1001.23 602.79 787.97 295.19 182.91 817.88 682.21 1069.13Construction -22.81 46.33 -86.00 29.89 70.67 42.98 19.32 4.53Mining & quarry-ing
715.27 808.43 206.05 -110.99 192.29 270.62 146.61 759.32
Agriculture 8.83 3.19 -1.94 12.60 5.72 28.22 3.20 -4.22Services 782.71 1055.78 711.19 330.94 303.27 362.23 740.64 155.90Investment -820.98 321.81 2133.33 173.64 -236.66 374.70 -655.97 -33.69Real estate 1342.26 1207.13 262.64 43.34 -343.96 126.40 67.58 70.88Others 425.23 620.19 -92.60 747.77 774.10 757.88 495.50 252.04Total 9912.32 1 0199.09 1 0479.74 6503.16 4 956.00 5 165.00 3411.00 5 048.00
Page 110
5/10/2018 FDI - slidepdf.com
http://slidepdf.com/reader/full/fdi5571fc8b4979599169977641 110/117
Appendix A. Appendix A 105
Table A.5: Net Flow of Foreign Direct Investment Classified by Sector (Millions of USD)
2008 p 2007 p 2006 2005 2004 2003 2002 2001Industry 4477.65 3651.17 4068.87 3429.86 3785.98 2408.58 1844.53 2960.26Food sugar 239.56 120.62 118.13 -24.76 337.32 265.14 21.28 155.06Textiles 60.18 71.18 -7.88 77.87 37.95 64.46 43.29 105.56Metal/non metallic 514.46 507.51 354.65 221.43 480.07 255.75 259.82 378.35Electrical appli-ances
401.2 380.53 1080.91 908.29 797.01 327.44 214.93 981.29
Machinery trans-portation
1274.13 1236.34 1402.81 1369.98 1280.34 653.1 644.45 578.81
Chemicals 417.25 -141.95 173.95 472.39 387.34 295.9 334.09 167.77Petroleum prod-ucts
632.37 378.58 332.18 -72.6 22.49 95.25 -50.16 179.93
Construction mate-rials
17.55 31.42 7.85 21.66 45.05 -7.89 31.37 0.18
Others 920.93 1066.92 606.25 455.58 398.36 459.39 345.42 413.27Financial institu-tions
2002.89 1882.23 2490.21 1550.89 221.65 -24.52 67.34 -186.17
Trade 1001.23 602.79 787.97 295.19 182.91 817.88 682.21 1069.13Construction -22.81 46.33 -86 29.89 70.67 42.98 19.32 4.53Mining quarrying 715.27 808.43 206.05 -110.99 192.29 270.62 146.61 759.32Agriculture 8.83 3.19 -1.94 12.6 5.72 28.22 3.2 -4.22Services 782.71 1055.78 711.19 330.94 303.27 362.23 740.64 155.9Investment -820.98 321.81 2133.33 173.64 -236.66 374.7 -655.97 -33.69Real estate 1342.26 1207.13 262.64 43.34 -343.96 126.4 67.58 70.88Others 425.23 620.19 -92.6 747.77 774.1 757.88 495.5 252.04Total 9912.32 10199.09 10479.74 6503.16 4956 5165 3411 5048
Page 111
5/10/2018 FDI - slidepdf.com
http://slidepdf.com/reader/full/fdi5571fc8b4979599169977641 111/117
Appendix B
Appendix B
Value Added per Labor (V A/L)i
VA = Value of production (VP) Value of Raw materials (VR
VP = Sales of goods producedWorking in progress*Finished goods*+Working inProgress**+Finished Goods**
VR = Cost of materials and components+ Materials and components*Materialsand components**
* In inventory at the beginning of 2006
**In inventory at the end of 2006
Capital-Labor Ratio (K/L)i
K = Total Fixed Asset ValueLand Value
106
Page 112
5/10/2018 FDI - slidepdf.com
http://slidepdf.com/reader/full/fdi5571fc8b4979599169977641 112/117
Appendix C
107
Page 113
5/10/2018 FDI - slidepdf.com
http://slidepdf.com/reader/full/fdi5571fc8b4979599169977641 113/117
Appendix C. 108
A1 logit probit OLSb/se b/se b/se
age 0.067*** 0.033*** 0.001**[0.02] [0.01] [0.00]
size 0 0 0[0.00] [0.00] [0.00]
FDI 1.340* 0.457 0.018[0.76] [0.35] [0.01]
val 0.110* 0.059* 0.002**[0.06] [0.03] [0.00]
kl -0.018 -0.01 0
[0.11] [0.05] [0.00]boi 9.120*** 4.565*** 0.964***
[0.53] [0.20] [0.01]Constant -5.100*** -2.531*** 0.006***
[0.16] [0.06] [0.00]Obs 6749 6749 6749
R-sqr 0.843 0.844 0.8937
A2 logit probit OLSb/se b/se b/se
age 0.048*** 0.025*** 0.003***[0.01] [0.01] [0.00]
size 0.077 0.049 0.001[0.06] [0.03] [0.00]
FDI 2.205*** 1.081*** 0.081**[0.34] [0.18] [0.03]
val 1.345*** 0.583*** 0.075***[0.22] [0.08] [0.02]
kl -0.409 -0.206 -0.018**[0.31] [0.14] [0.01]
boi 7.999*** 4.075*** 0.876***[0.60] [0.22] [0.01]
Constant -4.361*** -2.282*** 0.009***[0.12] [0.05] [0.00]
Obs 5814 5814 5814R-sqr 0.713 0.717 0.7594
Page 114
5/10/2018 FDI - slidepdf.com
http://slidepdf.com/reader/full/fdi5571fc8b4979599169977641 114/117
Appendix C. 109
A3 logit probit OLSb/se b/se b/se
age -0.003 -0.001 0[0.03] [0.01] [0.00]
size 0.03 0.013 0[0.09] [0.04] [0.00]
FDI 0.653 0.263 0.012[0.74] [0.30] [0.02]
val -0.01 -0.004 0[0.15] [0.07] [0.00]
kl 0.08 0.039 0.001[0.40] [0.17] [0.00]
boi 8.278*** 4.278*** 0.964***
[0.88] [0.34] [0.01]Constant -4.103*** -2.140*** 0.017**
[0.43] [0.17] [0.01]Obs 656 656 656
R-sqr 0.885 0.885 0.9368
B.1. variable dy/dx Std. Err. z P>z 95% C.I. Xage 0.0008626 0.00025 3.41 0.001 0.000366 0.001359 1.68203size -2.46E-06 0.00001 -0.28 0.776 -0.000019 0.000014 50.375
FDI* 0.0341909 0.03344 1.02 0.307 -0.031351 0.099732 0.019855val 0.00142 0.00084 1.69 0.091 -0.000226 0.003066 0.291007
kl -0.0002267 0.00136 -0.17 0.867 -0.002883 0.00243 0.282777boi* 0.9778093 0.0077 127.05 0 0.962725 0.992894 0.067862
B.2 variable dy/dx Std. Err. z P>z 95% C.I. Xage 0.0015692 0.00037 4.21 0 0.000839 0.002299 3.33695size 0.0024925 0.00183 1.36 0.172 -0.001088 0.006073 0.651679
FDI* 0.1963196 0.05805 3.38 0.001 0.082553 0.310086 0.028552val 0.0435479 0.0075 5.81 0 0.028856 0.05824 0.145026kl -0.0132554 0.01011 -1.31 0.19 -0.033064 0.006554 0.10342
boi* 0.9639427 0.00997 96.67 0 0.944398 0.983487 0 .071379
B.3 variable dy/dx Std. Err. z P>z 95% C.I. Xage -0.0007451 0.00673 -0.11 0.912 -0.013934 0.012443 11.375size 0.0067281 0.02104 0.32 0.749 -0.034509 0.047965 3.94837
FDI* 0.1496662 0.17141 0.87 0.383 -0.186289 0.485622 0.397866val -0.0022955 0.03397 -0.07 0.946 -0.068875 0.064284 0.77213kl 0.0182241 0.09071 0.2 0.841 -0.15956 0.196008 0 .411311
boi* 0.9661868 0.0125 77.28 0 0.941683 0.99069 0.375
Page 115
5/10/2018 FDI - slidepdf.com
http://slidepdf.com/reader/full/fdi5571fc8b4979599169977641 115/117
Appendix C. 110
C.1 variable dy/dx Std. Err. z P>z 95% C.I. X
age 0.0013107 0.00035 3.76 0 0.000628 0.001994 1.68203size -9.49E-07 0.00001 -0.09 0.93 -0.000022 0.00002 50.375
FDI* 0.0292453 0.03322 0.88 0.379 -0.035868 0.094359 0.019855val 0.0023684 0.00136 1.75 0.081 -0.00029 0.005027 0 .291007kl -0.0003961 0.00191 -0.21 0.835 -0.004131 0.003339 0.282777
boi* 0.9755615 0.00835 116.77 0 0.959187 0.991936 0.067862
C.2 variable dy/dx Std. Err. z P>z 95% C.I. Xage 0.0020191 0.0005 4.06 0 0.001045 0.002993 3.33695size 0.0039868 0.00246 1.62 0.105 -0.000837 0.008811 0.651679
FDI* 0.1971745 0.05459 3.61 0 0.090183 0.304166 0.028552val 0.0474889 0.00686 6.93 0 0.034049 0.060928 0.145026
kl -0.0167654 0.01132 -1.48 0.139 -0.038953 0.005423 0.10342boi* 0.9582725 0.0118 81.19 0 0.93514 0.981405 0.071379
C.3 variable dy/dx Std. Err. z P>z 95% C.I. Xage -0.0002565 0.00453 -0.06 0.955 -0.009138 0.008625 11.375size 0.0046787 0.01428 0.33 0.743 -0.023317 0.032675 3.94837
FDI* 0.0984212 0.114 0.86 0.388 -0.125023 0.321865 0.397866val -0.0013696 0.02416 -0.06 0.955 -0.048726 0.045987 0.77213kl 0.0143842 0.06421 0.22 0.823 -0.111469 0.140238 0.411311
boi* 0.9653782 0.01292 74.72 0 0.940056 0.9907 0.375
D.1Log-Lik Intercept Only: -1782.274 Log-Lik Full Model: -279.61D(6742): 559.22 LR(6): 3005.329
Prob > LR: 0McFadden’s R2: 0.843 McFadden’s Adj R2: 0.839Maximum Likelihood R2: 0.359 Cragg & Uhler’s R2: 0.876McKelvey and Zavoina’s R2: 0.676 Efron’s R2: 0.894Variance of y*: 10.147 Variance of error: 3.29Count R2: 0.993 Adj Count R2: 0.9AIC: 0.085 AIC*n: 573.22BIC: -58886.003 BIC’: -2952.426
D.2Log-Lik Intercept Only: -1790.548 Log-Lik Full Model: -513.762
D(5807): 1027.523 LR(6): 2553.572Prob > LR: 0
McFadden’s R2: 0.713 McFadden’s Adj R2: 0.709Maximum Likelihood R2: 0.355 Cragg & Uhler’s R2: 0.773McKelvey and Zavoina’s R2: 0.69 Efron’s R2: 0.761Variance of y*: 10.628 Variance of error: 3.29Count R2: 0.976 Adj Count R2: 0.745AIC: 0.179 AIC*n: 1041.523BIC: -49307.693 BIC’: -2501.564
Page 116
5/10/2018 FDI - slidepdf.com
http://slidepdf.com/reader/full/fdi5571fc8b4979599169977641 116/117
Appendix C. 111
D.3
Log-Lik Intercept Only: -436.934 Log-Lik Full Model: -50.479D(649): 100.959 LR(6): 772.909
Prob > LR: 0McFadden’s R2: 0.884 McFadden’s Adj R2: 0.868Maximum Likelihood R2: 0.692 Cragg & Uhler’s R2: 0.94McKelvey and Zavoina’s R2: 0.85 Efron’s R2: 0.937Variance of y*: 21.865 Variance of error: 3.29Count R2: 0.985 Adj Count R2: 0.96AIC: 0.175 AIC*n: 114.959BIC: -4108.56 BIC’: -733.992
E.1
Log-Lik Intercept Only: -1782.274 Log-Lik Full Model: -277.607D(6742): 555.214 LR(6): 3009.335Prob > LR: 0
McFadden’s R2: 0.844 McFadden’s Adj R2: 0.84Maximum Likelihood R2: 0.36 Cragg & Uhler’s R2: 0.877McKelvey and Zavoina’s R2: 0.63 Efron’s R2: 0.893Variance of y*: 2.701 Variance of error: 1Count R2: 0.992 Adj Count R2: 0.896AIC: 0.084 AIC*n: 569.214BIC: -58890.009 BIC’: -2956.432
E.2Log-Lik Intercept Only: -1782.274 Log-Lik Full Model: -277.607
D(6742): 555.214 LR(6): 3009.335Prob > LR: 0
McFadden’s R2: 0.844 McFadden’s Adj R2: 0.84Maximum Likelihood R2: 0.36 Cragg & Uhler’s R2: 0.877McKelvey and Zavoina’s R2: 0.63 Efron’s R2: 0.893Variance of y*: 2.701 Variance of error: 1Count R2: 0.992 Adj Count R2: 0.896AIC: 0.084 AIC*n: 569.214BIC: -58890.009 BIC’: -2956.432
E.3Log-Lik Intercept Only: -1790.548 Log-Lik Full Model: -506.541
D(5807): 1013.083 LR(6): 2568.012Prob > LR: 0McFadden’s R2: 0.717 McFadden’s Adj R2: 0.713Maximum Likelihood R2: 0.357 Cragg & Uhler’s R2: 0.776McKelvey and Zavoina’s R2: 0.654 Efron’s R2: 0.762Variance of y*: 2.894 Variance of error: 1Count R2: 0.977 Adj Count R2: 0.747AIC: 0.177 AIC*n: 1027.083BIC: -49322.133 BIC’: -2516.004
Page 117
5/10/2018 FDI - slidepdf.com
http://slidepdf.com/reader/full/fdi5571fc8b4979599169977641 117/117
Appendix C. 112
IV b/seforshare 0.123***
[0.02]labor100 -0.005***
[0.00]yr 0.444***
[0.02]kl adjust -0.589***
[0.13]boi 48.929***
[0.56]
instr -0.164[0.13]
Constant 0.174[0.13]
Obs 6749R-sqr 0.6591
F: 1 2 3OLS OLS OLSb/se b/se b/se
ownership 0.125*** 0.184*** 0.080**[0.02] [0.02] [0.03]
size -0.005*** 0.133 0.657***[0] [0.10] [0.10]
age 0.443*** 0.301*** 0.148**[0.02] [0.03] [0.05]
val -0.164 1.944** -0.484[0.13] [0.64] [0.43]
kl -0.510*** -2.693*** 0.262[0.15] [0.56] [0.95]
boi 49.007*** 50.669*** 43.281***[0.57] [0.82] [2.23]
constant 0.193 0.529** -1.15[0.13] [0.20] [1.13]
obs. 6749 5814 656R-squared 0.6591 0.5787 0.6385