+ All Categories
Home > Documents > FDMine: a graph mining approach to predict and evaluate ...

FDMine: a graph mining approach to predict and evaluate ...

Date post: 18-Mar-2022
Category:
Upload: others
View: 3 times
Download: 0 times
Share this document with a friend
37
FDMine: a graph mining approach to predict and evaluate food-drug interactions Md Mostaヲzur Rahman StFX: Saint Francis Xavier University https://orcid.org/0000-0002-1636-7793 Srinivas Mukund Vadrev StFX: Saint Francis Xavier University https://orcid.org/0000-0001-9403-9528 Arturo Magana-Mora Saudi Aramco: Saudi Arabian Oil Co https://orcid.org/0000-0001-8696-7068 Jacob Levman StFX: Saint Francis Xavier University https://orcid.org/0000-0002-9604-3157 Othman Soufan ( [email protected] ) St. Francis Xavier University https://orcid.org/0000-0002-4410-1853 Research article Keywords: Food-Drug Interaction, Link Prediction, Graph Mining, Adverse Effect, Structure Similarity Proヲle Posted Date: June 16th, 2021 DOI: https://doi.org/10.21203/rs.3.rs-613772/v1 License: This work is licensed under a Creative Commons Attribution 4.0 International License. Read Full License
Transcript

FDMine: a graph mining approach to predict andevaluate food-drug interactionsMd Mosta�zur Rahman 

StFX: Saint Francis Xavier University https://orcid.org/0000-0002-1636-7793Srinivas Mukund Vadrev 

StFX: Saint Francis Xavier University https://orcid.org/0000-0001-9403-9528Arturo Magana-Mora 

Saudi Aramco: Saudi Arabian Oil Co https://orcid.org/0000-0001-8696-7068Jacob Levman 

StFX: Saint Francis Xavier University https://orcid.org/0000-0002-9604-3157Othman Soufan  ( [email protected] )

St. Francis Xavier University https://orcid.org/0000-0002-4410-1853

Research article

Keywords: Food-Drug Interaction, Link Prediction, Graph Mining, Adverse Effect, Structure SimilarityPro�le

Posted Date: June 16th, 2021

DOI: https://doi.org/10.21203/rs.3.rs-613772/v1

License: This work is licensed under a Creative Commons Attribution 4.0 International License.  Read Full License

FDMine: a graph mining approach to predict and evaluate food-1

drug interactions 2

3

Md. Mostafizur Rahman1, Srinivas Mukund Vadrev1, Arturo Magana-Mora2, Jacob Levman1 and 4

Othman Soufan1 5

6

1Department of Computer Science, St. Francis Xavier University, Nova Scotia, Canada 7

2Saudi Aramco, EXPEC Advanced Research Center, Drilling Technology Team, Dhahran, 31311, 8

Saudi Arabia. 9

10

Corresponding author 11

Correspondence to Jacob Levman ([email protected]) or Othman Soufan ([email protected]) 12

Abstract 13

Food-drug interactions (FDIs) arise when nutritional dietary consumption regulates biochemical mecha-14

nisms involved in drug metabolism. These interactions can create unexpected adverse pharmacological 15

effects. By contrast, particular foods can aid in the recovery process of a patient. Towards characterizing 16

the nature of food’s influence on pharmacological treatment, it is essential to detect all possible FDIs. In 17

this study, we propose FDMine, a novel systematic framework that models the FDI problem as a homoge-18

nous graph. In this graph, all nodes representing drug, food and food composition are referenced as chemical 19

structures. This homogenous representation enables us to take advantage of reported drug-drug interactions 20

for accuracy evaluation, especially when accessible ground truth for FDIs is lacking. Our dataset consists 21

of 788 unique approved small molecule drugs with metabolism-related drug-drug interactions (DDIs) and 22

320 unique food items, composed of 563 unique compounds with 179 health effects. The potential number 23

of interactions is 87,192 and 92,143 when two different versions of the graph referred to as disjoint and 24

joint graphs are considered, respectively. We defined several similarity subnetworks comprising food-drug 25

similarity (FDS), drug-drug similarity (DDS), and food-food similarity (FFS) networks, based on similarity 26

profiles. A unique part of the graph is the encoding of the food composition as a set of nodes and calculating 27

a content contribution score to re-weight the similarity links. To predict new FDI links, we applied the path 28

category-based (path length 2 and 3) and neighborhood-based similarity-based link prediction algorithms. 29

We calculated the precision@top (top 1%, 2%, and 5%) of the newly predicted links, the area under the 30

2 of 35

receiver operating characteristic curve, and precision-recall curve. We have performed three types of eval-31

uations to benchmark results using different types of interactions. The shortest path-based method has 32

achieved a precision 84%, 60% and 40% for the top 1%, 2% and 5% of FDIs identified, respectively. We 33

validated the top FDIs predicted using FDMine to demonstrate its applicability and we relate therapeutic 34

anti-inflammatory effects of food items informed by FDIs. We hypothesize that the proposed framework 35

can be used to gain new insights on FDIs. FDMine is publicly available to support clinicians and research-36

ers. 37

38

Keywords: Food-Drug Interaction; Link Prediction; Graph Mining; Adverse Effect; Structure Similarity 39

Profile. 40

Introduction 41

Drugs bind to targeted receptors on the surface of the cells or enzymes to regulate the rate of chemical 42

reactions. These chemical reactions may be relied upon to treat different diseases and considerably enhance 43

the patients’ prognoses. However, drug overdoses or drug interactions may cause critical adverse health 44

conditions. Although the impact of the drugs depends on the affinity of the drug to bind to a specific cell/en-45

zyme receptor, its effectiveness depends on other factors such as when taken alongside other drugs or food. 46

Ideally, drug effects should be consistent for all patients and never be impacted by food ingredients or other 47

medical products [1]. However, several studies [2, 3] have demonstrated the impact of certain foods, de-48

creasing or increasing the activity of different drugs (food-drug interactions – FDI). 49

FDIs often cause changes in drug plasma concentrations, which may significantly increase or decrease 50

the effectiveness of the drug [4]. These changes can occur in three ways: it can increase the actions of drugs 51

(i.e., increased metabolism of drugs), decrease the activity of the drugs (i.e., decreasing bioavailability of 52

drugs), or create an adverse effect. 53

FDIs can be classified into two basic mechanisms: pharmacokinetic (PK) interactions, and pharmacody-54

namic (PD) interactions [5]. PK interactions denote the circumstance when foods alter processes related to 55

absorption, distribution, metabolism, and excretion of medications. For example, for a short time after con-56

sumption, grapefruit juice slows the metabolism of cyclosporine (e.g.: cytochrome P450 enzymes) [6, 7]. 57

PD interactions are caused by specific interactions between a drug and a food component that results in a 58

particular pharmacological effect [8]. An example of a PD interaction is a diet high in vitamin K that an-59

tagonizes the therapeutic effects of warfarin (used for blood clot treatments) [5]. 60

3 of 35

Considering the potential for increasing or decreasing the absorption of a drug, FDIs can play a vital role 61

in drug discovery as well [9]. For example, Moringa oleifera leaf extract has been used to inhibit cancer 62

cells and to increase the efficacy of chemotherapy in humans [10, 11, 12]. The roots of Erythroxylum per-63

villei provide pervilleines A, B, C, and F, effective inhibitors of P-glycoprotein, which is linked to multi-64

drug resistance and low cancer therapeutic response [13]. These are only a few examples that demonstrate 65

the importance of understanding the interactions of food constituents and dietary supplements (containing 66

different chemicals and phytochemicals) with drugs. Consequently, knowledge of FDIs is essential for phy-67

sicians, researchers, and patients to (i) minimize the adverse drug events (ADEs) and (ii) maximize the 68

effectiveness of a drug. 69

Most of the earlier research in this area is based on clinical studies or literature reviews that focus on 70

specific drug interactions with a limited set of foods [5, 8, 14, 15]. These studies analyze how particular 71

food items can affect the efficacy of particular drugs based on PD or PK alterations. Some studies have 72

focused on a particular group of patients and examined FDI interactions with the types and number of drugs 73

used (e.g., drugs used for chemotherapy, drugs used as anticoagulants) [16, 17, 18]. Although these studies 74

provided valuable information to physicians about the potentialities of FDIs, the level of novel exploration 75

is limited. Computational approaches can, therefore, potentially be used to predict novel FDIs. 76

Cheminformatics studies have achieved outstanding results in the fields of drug-drug interactions (DDIs), 77

drug-target interactions (DTIs), and new drug discovery. Multiple computational models have been devel-78

oped for detecting how a particular drug pair interacts towards new drug discovery. A survey conducted by 79

Stephenson et al. showed that the adoption of different machine learning models is rapidly increasing in 80

drug discovery [19]. These models have been used for finding new DDIs. For example, Lee et al. Proposed 81

a deep learning model to predict the pharmacological effects of DDIs using structural similarity profile 82

(SSP), target gene similarity profiles, and gene ontology (GO) term similarity profiles of known drug pairs 83

[20]. Ruy et al. recently developed DeepDDI, a multi-label classification model that calculates structural 84

similarity profiles (SSP) of DDIs and uses principal components analysis to reduce features and feed them 85

into a feed-forward deep neural network (DNN) [21]. A predictive machine learning model [22] was de-86

veloped to delineate currently unknown biological effects of inactive ingredients and generally recognized 87

as safe compounds present in food. A general-purpose method, named Alternative Drug-Drug Interaction, 88

was developed to predict the DDIs [23]. Three combined methods were used, including deep learning, text 89

mining, and graph clustering. Feng et al. proposed DPDDI to predict DDIs without considering the biolog-90

ical and chemical properties [24]. The authors used graph convolution networks (GCN) and DNN as a 91

4 of 35

predictor. By identifying the topological association of drugs in the DDI network, GCN explores low-di-92

mensional feature representations of drugs. 93

Several chemoinformatics studies have successfully demonstrated the application of computational mod-94

els for predicting DTIs. Yo et al. [25] used a deep learning model to predict DTIs using a network repre-95

sentation. The solution is a linear classification model based on using the least absolute shrinkage and se-96

lection operator (LASSO) and LASSO-DNN. LASSO helped in feature extraction to predict DTIs. In one 97

of our previous works, we developed DASPfind [26], a novel computational method to predict the DTIs 98

that uses a simple path (up to 3 lengths) to infer novel drug-protein interactions from a graph structure. The 99

graph was derived from similarities among drug-drug, protein-protein, and known drug-protein interac-100

tions. Olayan et al. [27] developed the DDR method for predicting DTIs. The authors constructed a heter-101

ogenous graph from the known DTIs and multiple similarities among the drug-drug and target-target inter-102

actions, used for feature engineering. The engineered features were later used as inputs for a random forest 103

method to predict the novel DTIs. Different studies have developed link prediction approaches to predict 104

DTIs. Lu et al. [28] used link prediction based on similarity indices to predict DTIs. Fokoue et al. [29] 105

developed the Tiresias framework that uses a large-scale similarity-based link prediction based on different 106

drug data to determine the DDIs. The framework uses a large-scale logistic regression model to predict 107

potential DDIs. 108

Although the implementation has made significant advances of these chemoinformatics models for DDIs 109

and DTIs, FDIs remain poorly addressed. This is mainly due to the inadequacy of resources regarding FDIs 110

since it is often difficult to extract a sufficient number of curated interactions. In addition, for FDI there is 111

no gold standard dataset yet for evaluation. Recently, FooDB [30, 31] was developed as a well-structured 112

and annotated database listing food items and compound composition. Although there is no gold standard 113

dataset for evaluation as in the field of DTIs, we propose using known DDIs. Given the homogenous nature 114

of our graph representations (i.e., all nodes are chemicals), we can resort to certain subnetworks for evalu-115

ation. To the best of our knowledge, this is the first work on developing a homogenous graph mining frame-116

work for food-drug interactions. 117

In this study, we propose FDMine, a framework that analyzes FooDB [30, 31] and DrugBank [32] data-118

bases to create a comprehensive dataset of small molecules with known food-food interactions (FFIs), 119

DDIs, and FDIs. FDMine uses the simplified molecular-input-line-entry system (SMILE) description to 120

establish similarity profiles and link prediction algorithms to predict the FDIs. The proposed framework 121

uses two different kinds of representations (disjoint and joint) graphs consisting of three subnetworks con-122

nected. These subnetworks are drug-drug similarity, food-drug similarity, and food-food similarity. The 123

5 of 35

rationale behind this approach is to capitalize on the similarity information of different subnetworks and 124

combine it with building a homogenous graph. We consider a unique representation of food items, their 125

compound composition, and the contribution of each compound. After building the graph network, the 126

framework implements a comprehensive set of different link prediction algorithms to predict potential 127

FDIs. The shortest path-based method has achieved a precision 84%, 60% and 40% for the top 1%, 2% and 128

5%, respectively. In the joint version of the graph, FDMine recovered 27,448 links on average from 27,612 129

available (i.e., 99.4% recovery with standard deviation of 5.1e^-4). 130

Methods 131

Databases and datasets preparation 132

DrugBank 133

We used the DrugBank (v 5.1.7) database that contains detailed information for each drug (i.e., chemical, 134

pharmaceutical, and pharmacological data) with extensive drug target information (i.e., sequence, pathway, 135

and structure) [32, 33, 34]. The database contains information for a total of 13,680 different drugs. In Drug-136

Bank, drugs are grouped into five categories, including approved, experimental, investigational, nutraceu-137

tical, and withdrawn. Drugs can be differentiated as small molecules or biotechnology-driven. The database 138

provides access to the SMILE strings of the drug molecules and reports drug-drug interactions [33]. 139

In this study, we considered the drugs assigned to the approved drug group and have small molecules. 140

This resulted in 1,683 drugs. We further reduced this set of molecules by considering only those having 141

“metabolism (increase or decrease)” related interactions, resulting in 788 unique approved small molecule 142

drugs. FDI interactions are mainly detected in relation to metabolic mechanisms [14]. The details of the 143

drug extraction procedure from the DrugBank dataset can be found in the Additional file 1: Fig. S1. 144

FooDB 145

We used the FooDB Version 1.0 dataset in JSON format [30, 31], containing several datasets related to 146

foods, compounds, nutrients, and health effects. In this study, we considered the FooDB content dataset 147

that directly mapped foods to the chemical compounds’ composition. Initially, we created a subset of the 148

content dataset that stored the required attributes (i.e., food id, original food name, source id, source type, 149

among others), yielding a total of 19,867 objects. Then, we filtered the extracted data by removing the list 150

of predicted and unknown data entries by using the conditions “citation type == DATABASE” and “source 151

type == COMPOUND”. This provides a more accurate source of information. Finally, we only considered 152

the food items mapped to a compound, resulting in 16,230 objects for further analysis. 153

6 of 35

After the parsing step, we mapped the resulting dataset with the “Compound” information to collect the 154

required details for each compound, including SMILE description and content contribution. In FoodDB, 155

the content range of each compound within a food item is presented (e.g., Strawberry has a content range 156

of Potassium of 0.000 - 187.000 mg/100 g). Finally, we have the SMILE description of the corresponding 157

compounds and the international chemical key (InChiKey) as a unique identifier. 158

To relate the food compounds to health effects, we retrieved data from the health effects dataset that enabled 159

us to know which food compound has a health effect on the human body. The resulting dataset contains 160

8,846 objects including 320 unique foods, and 563 unique food compounds having 179 unique health ef-161

fects. One extracted example is that benzoic acid from American cranberry has an allergenic health effect. 162

Since the same compounds can be found in different foods, it is necessary to store these data with a naming 163

convention that allows us to differentiate each food with its composition correctly. In this study, we used 164

the following naming convention: FOODXXXX_FDBXXXXX_CompoundName. For example, the data 165

entries “FOOD00005_ FDB000633_ Kaempferol” and “FOOD00008_ FDB000633_ Kaempferol” refer to 166

the same compound Kaempferol with the compound identifier FDB000633 from two different foods 167

(FOOD00005 and FOOD00008). Each compound can be treated differently based on the reported content 168

range in the food item. 169

The data-flow diagram of the extraction procedure of the FooDB dataset can be found in the Additional file 170

1: Fig. S2. 171

Food composition and compound contribution 172

Each food item is composed of a set of chemical compounds. Clearly, the “amount of the original content” 173

of any compound is not the same for each food. For example, the amount of the phytic acid in carrot is 174

5270.000 ml/100g and buckwheat is 1800.000 ml/100g. Carrot contains approximately three times more 175

phytic acid than buckwheat by mass. Therefore, the contribution of the phytic acid is different for carrot 176

and buckwheat. Consequently, we used the following equation to calculate the contribution of each com-177

pound for each food based on the amount contained in the food: 178 𝐶𝑜𝑛𝑡𝑟𝑖𝑏𝑢𝑡𝑖𝑜𝑛𝑠𝑐𝑜𝑟𝑒(𝑛𝑜𝑟𝑚𝑎𝑙𝑖𝑧𝑒𝑑) = 𝐶𝑜𝑚𝑝𝑜𝑢𝑛𝑑𝑜𝑟𝑖𝑔𝑖𝑛𝑎𝑙𝑐𝑜𝑛𝑡𝑒𝑛𝑡 ∈ 𝑎𝑓𝑜𝑜𝑑𝑖𝑡𝑒𝑚𝑇𝑜𝑡𝑎𝑙𝑜𝑟𝑖𝑔𝑖𝑛𝑎𝑙𝑐𝑜𝑛𝑡𝑒𝑛𝑡𝑜𝑓𝑎𝑙𝑙𝑐𝑜𝑚𝑝𝑜𝑢𝑛𝑑𝑠 ∈ 𝑎𝑓𝑜𝑜𝑑 (1)

179

The range of the normalized contribution is from 0 to 1. Where 0 and 1 contribution refer to a food com-180

pound with no contribution or full contribution, respectively. 181

7 of 35

In the graph, the food item and its compound composition are represented as separate nodes. The normal-182

ized contribution score scales edge weights of links connecting compounds to the food item. 183

184

More details and an example on the contribution score of food compounds is given in the Additional file 1: 185

Table S1. 186

Homogenous Graph Representation 187

We consider a set of food compounds, 𝐹 = {𝑓1, 𝑓2, … , 𝑓𝑚} and a set of drugs, 𝐷 = {𝑑1, 𝑑2, … , 𝑑𝑛} where 188 𝑚 represents the number of food compounds and n represents the number of drugs. We merged all drugs 189

and food compounds into a single graph. So, in our representation, we have a set of drug and food com-190

pounds 𝐹𝐷 = {𝑓1, 𝑓2, … , 𝑓𝑚, 𝑑1, 𝑑2, … , 𝑑𝑛}. Then, we considered the set of an 𝑚 ∗ 𝑛 dimensional struc-191

ture similarity matrices between drugs, between food compounds, and between food-drug. A score between 192

[0, 1] is the degree of similarity. A similarity score close to 0 means that two items are not identical to each 193

other, where the most similar items are represented by a similarity score close to 1. Using this similarity 194

concept, we derived a homogenous graph. From this homogenous graph, we will apply different path cate-195

gory and neighborhood-based similarity-based algorithms to predict the novel FDIs. 196

Structure Similarity Profile 197

A structural similarity profile (SSP) is a feature vector that contains a unique numerical representation after 198

acquiring structural features of individual food compounds and drugs. The SSP contains pairwise structural 199

similarity scores obtained from the comparison among all the 788 approved small molecule drugs of Drug-200

Bank and 8,846 unique food compounds. Structural similarity between a pair of nodes (i.e., drug-drug, 201

food-food, and food-drug) was measured by the Tanimoto coefficient. This coefficient is an efficient way 202

to calculate the structure similarity based on the chemical fingerprint [35, 36]. The Tanimoto coefficient is 203

defined as the number of common chemical fingerprints compared to the number of all chemical finger-204

prints of the two drugs. Chemical fingerprints of each drug were calculated using Morgan/Circular finger-205

prints [37] (also known as extended-connectivity fingerprint ECFP4 [38]) that is widely used in different 206

studies. ECFP4 showed the best performing fingerprints in the target prediction benchmarks [39, 40] and 207

in small molecule virtual screening [41]. The calculating procedure of the SSP can be found in the Addi-208

tional file 1: Fig S3. 209

8 of 35

Sparse Matrix Representation 210

We used the similarity profile to derive the sparse matrix representation, later used for plotting the graphs. 211

In this matrix, we eliminated all the zero entries and applied a threshold since some similarity scores contain 212

trivial values and thus may not indicate significant changes. For determining the threshold, we have con-213

sidered the distribution of the similarity scores. The majority of similarity values lie between 0.3~0.6, hence 214

selecting a high similarity value may drastically change the data-set size. Also, of note, a high threshold 215

will always lead to potential pairs having increased probability of interaction. Several studies have referred 216

to different values in the range of 0.5-0.85 for applying a similarity threshold for the Tanimoto coefficient 217

[42, 43, 44]. While a higher threshold can lead to more potentially valuable hypotheses, it can limit the 218

number of genuinely novel predictions. Table 1 highlights the number of links of each subnetwork after 219

applying a range of similarity thresholds. Compared to a threshold of 0.6, a value of 0.7 would result in 220

75% fewer number of possible FDIs. Therefore, we choose 0.6 at this step. It should be noted that this 221

parameter is provided as an input argument for the user of FDMine. 222

223

Table 1 Number of links in the graph after applying different Tanimoto similarity thresholds 224

Tanimoto Threshold Total Links DD Links FF Links FD Links

>= 0.5 5,392,354 14,298 5,228,607 149,449

>= 0.6 4,177,383 2,926 4,167,202 7,255

>= 0.7 3,834,135 920 3,831,336 1,879 225

226

Updating Similarity Scores using Food-Compound Contribution 227

We obtained a total of 4,177,383 similarities using the SSP. Then, we multiplied the similarity score by the 228

normalized contribution of the food compound (Eq. 1). As illustrated in Table 2, when we have a food-drug 229

pair (see row 1), we multiplied the similarity score by the contribution of the food compound. Similarly, 230

we multiplied the similarity score by the higher contribution of the food compound. For example, the con-231

tribution of the FOOD00006_ FDB000474_ L-Lysine is 0.007301117, and the FOOD00006_ FDB000556_ 232

L-Alanine is 0.009780473. So, we have considered the maximum value of 0.009780473 to update the sim-233

ilarity score. For drug pairs, similarity scores were preserved. 234

235 𝑆𝑐𝑜𝑟𝑒 = 𝑃𝑟𝑖𝑜𝑟𝑆𝑐𝑜𝑟𝑒(𝑆𝑆𝑃) ∗ 𝐶𝑜𝑛𝑡𝑟𝑖𝑏𝑢𝑡𝑖𝑜𝑛𝑜𝑓𝐹𝑜𝑜𝑑𝐶𝑜𝑚𝑝𝑜𝑢𝑛𝑑 (2)

236

Table 2 Calculating New Score based on the Food Compound Contribution 237

9 of 35

nodeA nodeB Prior Score Contribution

(0~1)

New Score

DB00136 FOOD00165 _ FDB012362 _

beta-Sitosterol

0.6947674 0.3459079 0.2403255323224

FOOD00006 _

FDB000474 _ L-

Lysine

FOOD00006 _ FDB000556 _ L-

Alanine

0.6 0.009780473 0.005868284

238

After updating the similarity scores in the graph, we consider another threshold using the contribution score. 239

Here, we consider a more relaxed range (0.3, 0.4, 0.5 and 0.6) as compared to the Tanimoto coefficient 240

threshold. In our literature validation, we prepare and discuss another batch of results using a similarity 241

score of 0.3, though a value of 0.5 has been employed for the generation of our primary findings. For a 242

threshold of 0.5, we ended up with 87,192 interactions and 92,143 for disjoint and joint dataset respectively. 243

Table S2 in Additional file 1 lists the number of interactions for the considered range. 244

Link Prediction Algorithms 245

After applying the similarity thresholds, the generated graph had several disjoint subgraphs. We call this 246

the disjoint version. Some link prediction algorithms cannot handle the disjoint version. Therefore, we con-247

sidered preparing a joint graph. We chose any node (randomly) from each subgraph and added an edge to 248

link all subgraphs to make the joint graph network. Then, a very small edge weight of 1e-5 was assigned to 249

the newly added links, limiting their effect on generating biased hypotheses. We generated results for both 250

versions. A detailed description is available in the Additional file 1: Fig S4. 251

Path Category-based Algorithm 252

Our goal is to predict the novel (unknown) FDIs from the generated homogenous graph. A homogenous 253

graph is one where all nodes are of the same type. Different than DTI heterogenous graphs (e.g., drug-254

protein), nodes in our graph are chemicals. One class of algorithms is based on running the shortest path to 255

find candidate interactions for the considered food and drug pair. Here, we have used 2-length and 3-length 256

pathways. For example, a 2-length path is “Drug1-Food1-Food2” (see Figure 1) connects the Drug1 node 257

with the Food2 node through the similarity between “Drug1 and Food1” and “Food1 and Food2”. This is 258

defined as a D-F-F path. As illustrated in Figure 1, the gold color circle denotes the food node and silver 259

color circle denotes the drug node. There are 8 possible combinations of paths (i.e., Drug-Drug-Drug, Drug-260

Food-Drug, Food-Food-Food, Food-Drug-Food, Drug-Drug-Food, Drug-Food-Food, Food-Drug-Food, 261

and Food-Food-Food). 262

10 of 35

263

264

Figure 1 Example working procedure of the Path Category-based method 265

266

For predicting new interactions, any path can be followed. The same applies for 3-length pathway predic-267

tion. For example, we can get another new link using 3-path length (Food-Food-Drug-Food). The score for 268

the newly predicted link is calculated according to equation 3, where, 𝑝 is the path, 𝑛 is the total number 269

of path and 𝑤 is the weight of the path: 270

𝑠𝑐𝑜𝑟𝑒 = 𝑀𝑖𝑛∑𝑃𝑤𝑛𝑝=1

(3)

271

Dijkstra's algorithm was used for finding the shortest path where the similarity score is used as the 272

path weight. 273

Neighbourhood-based Similarity-based Link Prediction 274

In the link prediction, given a graph 𝐺, the main aim is to predict new edges (drug-food) from the existing 275

graph. Predictions are useful to suggest unknown relations (or interactions) based on edges in the observed 276

graph. In the link prediction, we try to build a similarity measure between pairs of nodes and link the most 277

similar nodes. Link prediction algorithms are very common in many application domains such as, identify-278

ing protein-protein interactions [45], drug-drug interactions [29], DTIs [28], social networks [46], recon-279

structing networks [47], document recommendation, recommendation systems [48], biological networks 280

[49], disease prediction [50], bipartite networks [51], etc. 281

282

Here, we applied six different types of link prediction algorithm. They are, Adamic and Adar Coefficient 283

(AA) [50, 52], Common Neighbor (CN) [28, 50, 53], Jaccard Coefficient (JAC) [28, 50, 54], Resource 284

Allocation (RA) [50, 55, 56], Multiple Paths of Length L=3 (L3) [45, 57], and Dice Coefficient (Dice) [58, 285

59]. All of these algorithms have their scoring function. Each of these algorithms assigns a score for the 286

new predicted links. 287

11 of 35

288

Adamic and Adar Coefficient (AA) 289

The Adamic and Adar Coefficient (AA) gives preference to node pairs with more common neighbors but 290

with a lower degree. If there are no common neighbors for a node pair, then the AA score is 0. The AA 291

measure is formulated to connect node pairs that have common neighbors. 292 𝑆𝐴𝐴(𝑎, 𝑏) = ∑ 1𝑙𝑜𝑔𝑘𝑧𝑧∈𝛤(𝑎)⋂𝛤(𝑏) (4)

293

Here, 𝑎 and 𝑏 are two nodes, and 𝑧 denotes a common neighbor to both 𝑎 and 𝑏. 𝑘 is the degree of node 294 𝑧. 295

Common Neighbor (CN) 296

In the Common Neighbor (CN) algorithm, the score for link prediction is computed by finding the number 297

ofcommon neighbors between two distinct nodes. Where, 𝑎 and 𝑏 are two nodes. Γ(𝑎) and Γ(𝑏) denote the 298

set of neighbors of nodes 𝑎 and 𝑏, respectively. 299 𝑆𝐶𝑁(𝑎, 𝑏) = |𝛤(𝑎)⋂𝛤(𝑏)| (5)

300

Jaccard Coefficient (JAC) 301

The JAC measure considers only node pairs that have at least one common neighbor. The JAC measure 302

gives equal weight to all common neighbors and does not consider the degree of the common neighbors. 303

The JAC measure gives preferences to node pairs that share a larger fraction of their neighbor. The JAC 304

measure always ranges from 0 to 1 irrespective of the size of the neighborhoods of the vertices. The formula 305

is given below to calculate the JAC. Γ(𝑎) and Γ(𝑏) denote the set of neighbors of nodes 𝑎 and 𝑏, respec-306

tively. 307 𝑆𝐽𝑎𝑐𝑐𝑎𝑟𝑑(𝑎, 𝑏) = |𝛤(𝑎)⋂𝛤(𝑏)||𝛤(𝑎) ∪ 𝛤(𝑏)| (6)

308

Resource Allocation (RA) 309

Resource Allocation (RA) calculates the score based on irregular nodes connecting node 𝑎 and 𝑏. The 310

number of resources node 𝑎 receives from node 𝑏 through indirect links is called the similarity index. In 311

12 of 35

the RA each intermediate link contributes a unit of the resource. The RA is also symmetric. 𝑧 denotes 312

common neighbor of both 𝑎 and 𝑏 nodes and k-denotes the degree of node 𝑧. 313 𝑆𝑅𝐴𝐼(𝑎, 𝑏) = ∑ 1𝑘𝑧𝑧∈𝛤(𝑎)⋂𝛤(𝑏) (7)

314

Multiple Paths of Length L=3 (L3) 315

Links of high degree nodes prompt multiple and unspecific shortcuts in the network, resulting in biased 316

predictions. This can be avoided by using proper degree of normalization. Such degree of normalization is 317

very important for L3. To eliminate potential degree biases caused by lower degree nodes, we assign a 318

degree normalized L3 score to each node pair 𝑎 and 𝑏. Here, u and v are intermediate nodes in the 3-length 319

path. 320 𝐿3𝑎𝑏 = ∑ 𝐴𝑎𝑢𝐴𝑢𝑣𝐴𝑣𝑏√𝑘𝑢𝑘𝑣𝑢,𝑣∈𝐿3 (8)

321

Dice Coefficient 322

Dice coefficient is similar to the Jaccard Coefficient (JAC). The Dice coefficient is calculated using equa-323

tion 9, where, 𝑎 and 𝑏 are two nodes. 324 𝑆𝐷𝑖𝑐𝑒(𝑎, 𝑏) = 2 ∗ |𝑎⋂𝑏||𝑎 ∪ 𝑏| (9)

325

Performance evaluation 326

To measure the performance of applied link prediction approaches, we adopted the idea of precision@k 327

[60, 61] or top 𝑘 predictive rate [53, 62]. This metric is also known as 𝑟-precision [63, 64, 65, 66]. preci-328

sion@k is the recommended measure for link prediction algorithms [67]. It refers to the percentage of true 329

positives among only the top 𝑘 ranked predicted links. Given the ranked output of the graph, we need to 330

evaluate the ranking precision of the methods. 331

Following [26], we chose the top 1%, 2%, and 5% as the value of 𝑘. In general, the area under the receiver 332

operating characteristic curve (AUROC) or (AUC) is used to evaluate performance of classification models. 333

Nevertheless, recent studies have shown that AUROC is unsuitable for checking the performance of the 334

link prediction algorithms [56, 68, 69, 70]. Another statistical measure is the area under the precision-recall 335

13 of 35

curve (PRC), which provides a more accurate assessment especially when dealing with imbalanced datasets 336

[71]. In this study, we used, precision@top, AUC, and PRC as performance metrics. 337

338

In order to compute some of the measures, we had to derive true positives (TP), false positives (FP), true 339

negatives (TN), and false negatives (FN). To perform this, we ranked the predicted links in descending 340

order based on the rank score given by the link prediction methods. Then, we considered several thresholds 341

as cutoff values. The starting threshold is the minimum score given by the link prediction methods. Then 342

we increase by a step size of 0.1, which was selected to ensure sufficient granularity in computing the area 343

under the curve. We repeated this step until the threshold value is the same as the maximum score given by 344

the link prediction algorithm. For each specific threshold score, if we found the known link in the test 345

dataset matched with the newly predicted link and the score is greater than the threshold, we considered 346

this matching as a true positive (TP) for evaluative purposes. Given an unknown link, which does not match 347

the test dataset, but was predicted by the link prediction algorithm, and the score is greater than the thresh-348

old, we consider the case a false positive (FP). Similarly, when we found a known link (same as the test 349

dataset and in the newly predicted links), but the score was below the threshold, we consider this a false 350

negative (FN). Lastly, when we found any unknown link with the score below the threshold, we assign the 351

sample as a true negative (TN). Using the TP, FP, TN, and FN we calculated the “precision@top-1%”, 352

“precision@top-2%”, “precision@top-5%”, AUC, and PRC. 353

354

Data splitting for testing 355

To evaluating the performance of link prediction algorithms, the test data is generated by excluding a col-356

lection of links from the full homogenous networks. Our homogenous network contains drug-drug similar-357

ity, food-drug similarity, and food-food similarity. We split 30% of links randomly to make the test data 358

set, while the rest of the 70% of links are used for the training dataset. For stability, we repeat this evaluation 359

ten times and report average performance. 360

361

Ground-truth evaluation using DDS 362

Contrary to food-protein interactions [26], there is no accessible gold standard for widely confirmed food-363

drug interactions. Therefore, we resorted to the extracted drug-drug interactions from DrugBank for ground 364

truth evaluation. Since the graph representation in FDMine is homogenous (i.e., all nodes are chemicals), 365

we can consider any part of the graph as a representative set of evaluation. Here, we remove 30% of the 366

drug-drug links in the graph. Then, we execute the framework and report top ranked cases for the precision 367

14 of 35

evaluation. We split 30% DDS links (randomly) for making the test data set, while the rest of the 70% DDS, 368

and all FDS, FFS links are used in the training dataset. Here, we measured the precision in terms of recov-369

ering the original links in the DDS subgraph. It should be noted that we also performed evaluation using a 370

random subset of any type of links (see Results). 371

372

We have performed three types of evaluations to benchmark the results. In the first evaluation, a drug can 373

have a link with another drug because of certain similarity scores. In the second evaluation, a drug will have 374

a correct link with another drug only if it is reported in the DrugBank database. The difference between the 375

second and third evaluation is that the original links in the second evaluation are assumed based on the 376

established similarity measures. Both evaluations will help us establish a comprehensive overview of link 377

recovery in general and the validity of these recovered links using DrugBank. Although drug-drug interac-378

tions are examined in these two evaluations, they both provide estimates for the accuracy of food-drug 379

predictions since the graph is homogenous in nature. The following Table 3 lists all the evaluative ap-380

proaches we have performed in this study. 381

382

Table 3 List of evaluation approaches 383

Title Evaluation Graph Correct predic-

tions

Methods

Evalua-

tion 1

Remove random 30% of

links from the DDIs (repeat

10 times)

Comprehensive

evaluation for re-

covery of DDS

similarity links

Match predicted

links with the ac-

tual ones

All methods

are applied

Evalua-

tion 2

Remove random 30% of

links (repeat 10 times)

Ground Truth us-

ing DrugBank

Match predicted

links with Drug-

Bank reported in-

teractions

SP_2 (the best

from evalua-

tion 1 over dis-

joint graph)

and RA (the

best from eval-

uation 1 over

joint graph)

15 of 35

Evalua-

tion 3

Remove random 30% of

links (repeat 10 times)

Whole graph in-

cluding DDS, FDS,

FFS

Match predicted

links with the ac-

tual ones

SP_2 (the best

from evalua-

tion 1 over dis-

joint graph)

and RA (the

best from eval-

uation 1 over

joint graph)

384

Implementation 385

We have deployed the code and run all experiments on a server with RAM 64 GB, and Intel(R) Core(TM) 386

i9-7980XE CPU @ 2.60GHz (18 Cores, 36 Threads). For DrugBank data preprocessing, we used Compute 387

Canada cluster and to calculate SSP we used Google Colaboratory (a product from Google Research). 388

Our Proposed FDMine Framework 389

The FDMine framework (see Figure 2) is composed of several phases. In Phase 1, raw data is parsed from 390

DrugBank and FooDB databases. In Phase 2, we execute two steps including a) building a homogenous 391

network based on the structure similarity profile and b) updating the weights of the homogenous network 392

using food compound contributions. Next, the graph is prepared with nodes representing drugs, food and 393

food compounds’ composition. In the graph, links are weighted by similarity and contribution scores (see 394

Phase 3 in Figure 2). When applying the similarity thresholds, the homogenous network produces multiple 395

subgraphs (disjoint graph). We build another version called the joint homogenous graph network and con-396

sider executing several link prediction algorithms including applied path category-based and neighborhood-397

based similarity-based approaches. In the final Phase 4, we rank the newly predicted link (based on the 398

score given by our methods), test the performance of the applied methods with the test dataset and finally, 399

consult the literature to validate the top FDIs found using the different methods. For testing, we perform 400

comparison using ground-truth and report literature validation for our leading findings (see Results and 401

Discussion section). 402

403

16 of 35

404 Figure 2 The framework of FDMine. The main steps are 1) preparing a comprehensive dataset describing 405 FDIs by analyzing the whole DrugBank and FooDB databases with a unique representation of food com-406 position 2) defining a scoring function for computing chemical compound contribution in food items, 3) 407 implementing a set of path category-based (path length 2 and 3) and different neighborhood-based similar-408 ity-based algorithms to discover new FDIs from two different homogenous (disjoint and joint) graph net-409 works, and 4) used the precision@k metric and calculated the precision@top (top 1%, 2%, and top 5%) for 410 drug-drug links to verify the accuracy of the algorithms with the test dataset. 411

Results and Discussion 412

The next subsections describe in detail the FDMine performance evaluation and the analysis of the novel 413

FDI predictions. 414

17 of 35

Prediction Results of FDMine 415

Evaluation 1: Comprehensive evaluation for the recovery of DDS similarity links 416

As explained earlier, DDS similarity links are a priority in our evaluation setup as it establishes a ground 417

truth evaluation (see Evaluation 2 results). Here, drug-drug links are based on the similarity scorings we 418

computed. We have applied two different link prediction approaches over two different types of homoge-419

nous graph networks. One is the disjoint graph network, and the other is the joint graph network. The 420

applied methods are the path category-based and neighborhood-based similarity-based link prediction al-421

gorithms. We used path lengths 2 and 3 for the path category-based algorithm. SP_2 and SP_3 are used to 422

describe (Path length 2), and (Path length 3), respectively. From neighborhood-based similarity-based link 423

prediction, we applied Academic Adar (AA), Common Neighbor (CN), Jaccard Index (JAC), Dice Coeffi-424

cient (Dice), Resource Allocation (RA), and Multiple paths of length l=3 (L3). 425

426

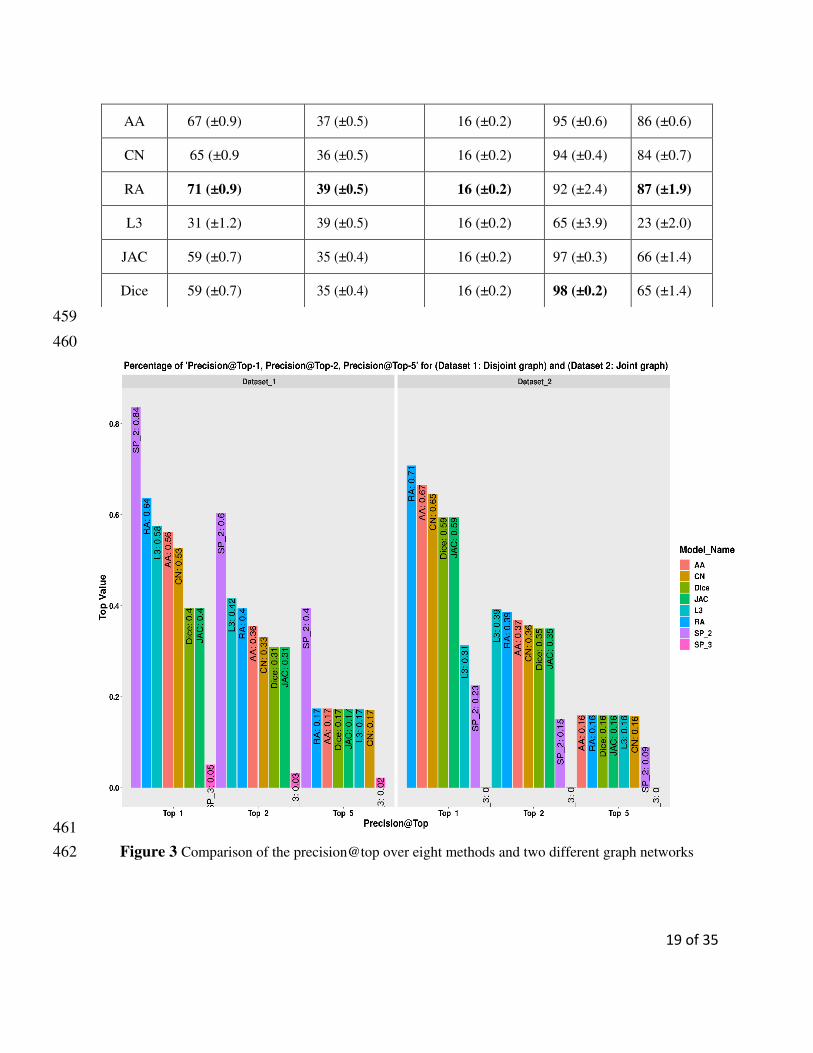
Table 4 provides a summary of different models over the disjoint graph network. For the disjoint graph, the 427

SP_2 outperformed other methods. The precision rate for the top 1% (i.e., precision@top-1) is 84% for 428

SP_2 while RA, the second best has achieved 64%. For precision@top-2, SP_2 achieved the best results 429

with 60% and L3, the second best 42%. The highest value for the precision@top-5 was achieved by the 430

SP_2 (40%). In the disjoint version of the graph, neighborhood-based similarity-based methods achieved, 431

on average 17% with variant standard deviation each. However, SP_3 always showed a low performance 432

(05%, 03%, 02% for precision@top-1, precision@top-2, and precision@top-5 respectively) compared to 433

all other methods. SP_2 achieved 52% and 26% AUC and PRC, respectively. All neighborhood-based sim-434

ilarity-based methods achieved more than 80% (AUC) except L3 which had a reported precision of 60%. 435

The PRC scores of the RA, AA, and CN were 70%, 65%, and 60% respectively. 436

When considering the joint version of the graph, different results were attained. The neighborhood-based 437

similarity-based methods showed best results for the top precision@top-1, precision@top-2, and preci-438

sion@top-5. For the precision@top-1, the RA achieved the best result (71%), followed by AA (67%). For 439

the precision@top-2, L3 and RA both yielded similar performance (39%). Additionally, all neighborhood-440

based similarity-based methods produced the same result (16%) for precision@top-5. Contrary to the case 441

of the disjoint version of the graph, the performance of SP_2 was weak. The SP_2 achieved, 23%, 15%, 442

and 9% for the precision@top-1, precision@top-2, and precision@top-5 respectively. For the joint graph, 443

the neighborhood-based similarity-based algorithms achieved AUC of more than 90% except L3 (65%). 444

The value of the PRC is also high for the neighborhood-based similarity-based methods. The PRC scores 445

for the RA, AA, CN were 87%, 86%, and 84% respectively. However, SP_3 always (disjoint and joint 446

18 of 35

graphs) showed the weakest results in terms of all performance metrics (precision@top, AUC, and PRC). 447

Table 5 summarizes the different models over the joint graph network. The comparison graph for the pre-448

cision@top-1%, precision@top-2%, and precision@top-5% are provided in Figure 3. For more details, see 449

the Additional File 1 Figures S6 and S7. 450

451

Table 4 Comparison of the precision@top (average), AUC, PRC over eight different methods on the dis-452

joint graph network 453

454

Method ‘Precision@Top-

1 (%)

Precision@Top-2

(%)

Precision@Top-5

(%)

AUC

(%)

PRC

(%)

SP_2 84 (±6.3) 60 (±5.3) 40 (±2.5) 52

(±1.0)

26 (±1.0)

SP_3 05 (±5.6) 03 (±3.1) 02(±1.4) 59 (±23.0) 03 (±3.0)

AA 56 (±1.6) 36 (±1.0) 17 (±0.6) 88 (±.01) 65 (±1.7)

CN 53 (±1.5) 33 (±1.1) 17 (±0.4) 88 (±1.0) 60 (±1.6)

RA 64 (±1.7) 40 (±1.4) 17 (±0.6) 80 (±3.5) 70 (±1.7)

L3 58 (±1.9) 42 (±1.2)

17 (±0.6) 60 (±4) 30 (±3.1)

JAC 40 (±1.6) 31 (±0.5) 17 (±0.5) 94 (±0.4) 34 (±1.8)

Dice 40 (±1.6) 31 (±0.5) 17 (±0.5) 97 (±0.7) 35 (±2.0)

455

Table 5 Comparison of the precision@top (average), AUC, PRC over eight different methods on the joint 456

graph network 457

458

Method Precision@Top-1

(%)

Precision@Top-2

(%)

Precision@Top-5

(%)

AUC

(%)

PRC

(%)

SP 2 23 (±1.8) 15 (±1.5) 09 (±0.9) 38 (±1) 08 (±0.07)

SP 3 0.1 (±0.2) 0.1 (±0.1) 0.1 (±0.0) 88 (±31) 00 (±0)

19 of 35

459

460

461

Figure 3 Comparison of the precision@top over eight methods and two different graph networks 462

AA 67 (±0.9) 37 (±0.5) 16 (±0.2) 95 (±0.6) 86 (±0.6)

CN 65 (±0.9 36 (±0.5) 16 (±0.2) 94 (±0.4) 84 (±0.7)

RA 71 (±0.9) 39 (±0.5) 16 (±0.2) 92 (±2.4) 87 (±1.9)

L3 31 (±1.2) 39 (±0.5) 16 (±0.2) 65 (±3.9) 23 (±2.0)

JAC 59 (±0.7) 35 (±0.4) 16 (±0.2) 97 (±0.3) 66 (±1.4)

Dice 59 (±0.7) 35 (±0.4) 16 (±0.2) 98 (±0.2) 65 (±1.4)

20 of 35

Evaluation 2: Ground truth evaluation using DrugBank 463

The dataset we constructed using DrugBank and FooDB contains drug-drug links. The disjoint and joint 464

dataset contains 2,926, and 6,581 drug-drug links respectively. From evaluation 1, out of 2,926, and 6,581, 465

our method managed to discover 1,706, and 4,178 of those links respectively, reported as DDIs in the 466

DrugBank. We have considered these 1,706 and 4,178 as known DDIs and as ground truth. To cross-vali-467

date the performance of FDMine we excluded a portion of known DDIs (or ground truth) as a test dataset 468

from the main dataset and the rest of the dataset was used to train the models. Then, we calculate the 469

precision@top-1%, precision@top-2%, and precision@top-5% and found approximately the same perfor-470

mance of FDMine with the disjoint dataset and slightly better results for the joint dataset. Here, we have 471

chosen only the best models, SP_2 for the disjoint dataset and RA for the joint dataset. Table 6 and Table 472

7 provides the performance of FDMine with the ground truth test dataset. 473

474

Table 6 Performance evaluation of ground truth using disjoint dataset and path category-based (path 475

length-2) method 476

Method Proportion #Test DDI #Matched DDI Precision@

Top-1 (%)

Precision@

Top-2 (%)

Precision@

Top-5 (%)

SP_2

0.6 1023 864.8 (±13.85) 84.49 (±5.09) 72.29 (±6.59) 47.11 (±4.00)

0.5 853 750.7 (±9.91) 78.21 (±7.50) 64.73 (±4.86) 42.20 (±2.79)

0.4 682 613.5 (±6.06) 76.31 (±5.77) 57.51 (±5.53) 36.81 (±3.88)

0.3 511 469.1 (±4.93) 60.60 (±9.06) 43.69 (±5.44) 28.09 (±2.57)

477

Table 7 Performance evaluation of ground truth using joint dataset and Neighborhood-based Similarity-478

based (RA) Method 479

Method Proportion #Test DDI #Matched DDI Precision@

Top-1 (%) Precision@

Top-2 (%) Precision@

Top-5 (%)

RA

0.6 2506 2413.0 (±9.12) 94.93 (±0.30) 93.16 (±0.71) 51.55 (±0.71)

0.5 2089 2027.4 (±12.01) 95.99 (±0.35) 86.64 (±1.29) 40.63 (±1.01)

0.4 1671 1628.4 (±6.97) 96.75 (±0.49) 72.15 (±1.07) 31.64 (±0.54)

0.3 1253 1223.3 (±4.18) 90.96 (±1.05) 54.59 (±0.86) 22.97 (±0.43)

480

Evaluation 3: prediction results for whole graph (DDS, FFS, FDS) 481

Here we randomly assigned 30% of all (DD, FF, FD) links from the whole dataset to make the test dataset, 482

and the rest of the 70% was used to train the model. We applied ‘shortest path length 2’ over the disjoint 483

and ‘RA’ over joint graph. The 30% test dataset from the disjoint and joint dataset contains 26,157 and 484

27,612 links respectively. The FDMine was able to recover an average of 9612.6 (±5723.06) and 27448.4 485

21 of 35

(±14.20) links respectively from the disjoint and joint dataset using ‘shortest path length 2’ and ‘RA’ meth-486

ods respectively. 487

488

New Food Drug Interaction Prediction 489

After comparing the different approaches for link prediction, we executed the FDMine framework to find 490

top candidates for FDIs. In the framework, we consider taking the top results from the joint and disjoint 491

versions. At the final stage of FDMine, we surveyed the literature to find supporting evidence to the gener-492

ated predictions. We have performed two batches using different contribution scores (i.e., 0.5 and 0.3, re-493

spectively). The default value in the FDMine framework is a 0.5 contribution score. The results as listed in 494

Additional file 2, have shown some repeated drugs in top findings due to a higher threshold value. A high 495

threshold value will lead to removing more connections in the graph. This will lead to more disjoint sub-496

graphs and nodes with higher connections within the subgraphs gain higher rank scores. Therefore, we 497

consider a more relaxed threshold and generate Batch-2 results (i.e., contribution score of 0.3). In this batch, 498

we see more diversity in results. Additional file 2 lists all Batch-1 results, and Additional file 3 lists all 499

Batch-2 results with a description of the experiments used in each. We analyzed all results of both batches 500

and discussed here the insights driven from two types of evidence including: 1) linking food to anti-inflam-501

matory effects based on known biological pathways and 2) linking food to pharmacological effects based 502

on matching functions of a drug and a chemical substructure found in food. 503

504

Food compound compositions with Anti-inflammatory effects (biological pathway driven evidence) 505

506

The results in this section are part of Batch-1 results (see Additional file 2). Our findings using a literature 507

review indicate possible pairing of drug and nutraceutical food components. As per the summary in Table 508

8, the interactions we obtained appear to affect key biological pathways including - Prostaglandin biosyn-509

thesis for inflammatory response [72], beta-adrenergic signaling for cardiac output modulation [73] and 510

GABA pathway [74] - a GABA based inhibitory neurotransmitter that down-regulates CNS stimulation 511

[75]. After examining the results in Table 8, we have found that dietary fatty acids like Oleic acid 512

(FDB012858), Erucic acid (FDB004287), (Z,Z)-9,12-Octadecadienoic (FDB012760) and Elaidic acid 513

(FDB002951) available in foods like Onions - FOOD00006, Garden Cress - FOOD00099, Pomegranate- 514

FOOD00151, etc. can affect prostaglandin biosynthesis via PPAR mediated mechanism and Gabaergic 515

pathway. Figures 4 and 5 highlight the list of these compounds and their interaction with Peroxisome pro-516

22 of 35

liferator-activated receptor (PPAR) and GABA-mediated effects, respectively. Similarly, we found evi-517

dence of food components like Eugenol (FDB012171), Carvacrol (FDB014512), which can potentially 518

substantiate hypotensive effects when taken with beta adrenergic drugs. For example, Eugenol has been 519

known to cause vasodilation via vanilloid TRPV4 receptors found on endothelial muscles in arteries. Beta-520

adrenergic drugs are prescribed to patients suffering from hypertension to decrease blood pressure (BP). 521

So, when combined, this can cause an elevated drop in BP. 522

523

Prostaglandins are compounds that play a role in the anti-inflammatory pathway during injury [76]. An 524

essential molecular building block in humans is arachidonic acid. It interacts with the Peroxisome prolifer-525

ator-activated receptor (PPAR) to form various prostaglandins [76] or anti-inflammatory compounds. Var-526

ious dietary fatty acids (see Table 8; Oleic acid, Linoleic acid, Erucic Acid, Eldaic acid) are also absorbed 527

via the exogenous chylomicron pathway and hydrolysed for various tissues to absorb them for further pro-528

cessing [77]. Some of our predicted compound items include Oleic acid - FDB012858, and Erucic acid - 529

FDB004287, that are similar to Arachidonic acid and are analogous [78] structures, belonging to the fatty 530

acid group and are found in many dietary sources including Celery - FOOD00015, Peanuts (FOOD00016) 531

and Burdock - FOOD00017 (See Table 8). Our literature review has highlighted reported evidence on the 532

influence of these dietary fatty acids on the Arachidonic acid cycle. Arachidonic acid is a precursor for the 533

synthesis of various other biomolecules, associated with anti-inflammatory pathways [79]. During injury, 534

inflammation occurs and causes arachidonic acid to bind with PPAR-gamma receptors as shown in Figure 535

4 to form prostaglandins or protective anti-inflammatory agents to curb the injury [80]. Fatty acids (see 536

Table 8) also compete with arachidonic acid during injury or inflammation to produce various substituted 537

prostaglandins belonging to a family of derivative compounds known as eicosanoids [81], via PPAR [82]. 538

Since the substituted prostaglandins are not exactly derived from arachidonic acid, they show slightly fewer 539

anti-inflammatory profiles as compared to other eicosanoids produced directly from arachidonic acid [83]. 540

It is worth noting that arachidonic acid belongs to the list of essential fatty acids including alpha-linoleic 541

acid and docosahexaenoic acid [83]. There has been evidence to show that dietary sources such Linoleic 542

acid, Erucic acid and Elaidic acid (see Table 8) did increase PPAR gene expression in healthy subjects [84]. 543

In 2012 Hung-Tsung Wu et al. also showed the interaction of oleic acid with PPAR-g receptors [85]. These 544

results may suggest taking drugs like Doconexent - DB03756 with foods such as FOOD00099 - Garden 545

Cress, FOOD00151 - Pomegranate, FOOD00009 - Chives, FOOD00062 - Hazelnut, FOOD00525 - Maca-546

damia can alter the normal dynamics of anti-inflammatory responses. Arachidonic acid is biosynthesized 547

from dietary linoleic acid and released by phospholipases during inflammation. This pathway is also known 548

as the COX or Cyclooxygenase pathway [86]. 549

23 of 35

550

Table 8 Depicts some of our top correlations of food substances that can potentially be involved in food 551

drug interactions when combined with a drug with a similar activity. Each food component can link to 552

any of the drugs as long as they are in the same batch. 553

Food com-

ponent

Food source

ID

Food

name

Pharmacological ac-

tions

Drug Refer-

ences

Batch

Oleic acid FOOD00006 Garden

Onion

Dietary fatty acids like

Oleic acid can compete

with arachidonic acid

by interacting with

PPAR-g receptor to

form prostaglandins

They can also cross the

blood brain barrier and

interact with GABA

receptors to induce an-

xiolytic & possible

anti-epileptic effects

Vigabatrin,

Pregabalin,

Gabapentin

Doconexent

[82,

85, 89,

90, 91,

92]

Top 10 in

joint and

disjoint -

batch 1

(supple-

mentary

file 2)

FOOD00009 Chives

FOOD00011 Cashew

Nus

FOOD00012 Pineap-

ple

FOOD00015 Wild

celery

FOOD00016 Peanuts

FOOD00017 Bur-

dock

FOOD00021 Aspara-

gus

FOOD00024 Brazil

Nut

FOOD00026 Borage

Erucic acid FOOD00099 Garden

Cress

Elaidic acid FOOD00151 Pome-

granate

(Z,Z)-9,12-

Octadecadi-

enoic acid

FOOD00009

Eugenol FOOD00179 Cloves Euginol causes vasodi-

lation via vanilloid

Betaxolol,

Atenelol,

[86,

87]

Top 20 in

joint and

24 of 35

TRPV4 receptors

found on endothelial

muscles found on ar-

teries. Euginol & Cap-

sacin have a vanilloid

ring. TRPV4 is in-

volved in BP regula-

tion via various mech-

anisms

Esmolol,

Bisprolol,

Metoprolol

disjoint -

batch 2

(supple-

mentary

file 3)

Isopropyl-2-

methylphe-

nol

FOOD00089 Hyssop p-Cymene has been

reported to cause

smooth muscle vasodi-

lation and has antihy-

pertensive effects

1-Isopropyl-

4-

methylben-

zene

FOOD00013 Dill Also known as p-cy-

mene. It has been

shown to cause seda-

tive effects via GABA

adrenergic receptors

and also causes vaso-

dilation of smooth ar-

terial muscles

1-Methoxy-

4-(2-pro-

penyl)ben-

zene

FOOD00137 Anise Methyl Chavicol has

been reported as an

adjunct therapy for

treatment of hyperten-

sion, found in anise.

FOOD00019 Tarra-

gon

554

555

25 of 35

556

Figure 4 An illustration depicting the effect of dietary fatty acids on COX pathway a) Various foods are 557

rich sources of dietary fatty acids b) During inflammation, Arachidonic acid interacts with PPAR to produce 558

prostaglandins c) Dietary Fatty acids can compete with Arachidonic acid during inflammation at PPAR to 559

form substituted prostaglandin variants. 560

561

Food compound composition with pharmacological effects (similar function-driven evidence) 562

563

Here, we relaxed the contribution score to 0.3 (i.e., Batch-2) to obtain a diverse set of results (see Additional 564

file 3). In this part of our literature validation, we analyze the potential of similar functions of drugs and 565

food compounds on specific diseases. The results in Table 8 highlight some correlations with a group of 566

drugs called beta-adrenergic drugs and essential oils. Our top correlated pairs of food and drug observed 567

that both of them caused reduced blood pressure. Beta-blockers are used to treat hypertension in patients. 568

Beta-blockers consist of b1, b2, and b3 subtype receptors. Beta-blockers can fall into various categories 569

based on the extent of selectivity of binding across these subtypes. For example, Atenolol (DB00335), 570

Bisoprolol (DB00612), Metoprolol (DB00264) and Esmolol (DB00187) are b1 selective blockers [88]. The 571

effects of b1 blockade include a decrease in cardiac output by inhibiting the SA and AV nodes, thereby 572

decreasing stroke volume [89]. Propranolol (DB00571) and Penbutolol (DB01359), on the other hand, are 573

non-selective beta-adrenergic blockers. Studies have also observed that beta-blockers may also contribute 574

to GABA turnover in the cerebrum [90]. 575

576

26 of 35

The results suggest that beta-blocker drugs like Atenolol, Betaxolol, Esmolol, Oxprenolol, Penbutalol, and 577

Propranolol can interact in the form of synergism when combined with a specific compound composition 578

including p-Cymene - FDB014512, Eugenol - FDB012171, and Carvacrol (terpenoid substances). For ex-579

ample, Marcio et al. 2011 reported that monoterpenoids like p-Cymene - FDB014512 and Carvacrol have 580

vasorelaxant effects [86]. 581

582

We were able to confirm that fatty acids (Oleic acid (FDB012858), Erucic acid (FDB004287), (Z,Z)-9,12-583

Octadecadienoic (FDB012760) and Elaidic acid (FDB002951) ) can cross the blood-brain barrier and be 584

beneficial to relieve anxiety [91]. They are also believed to act via stimulation of GABA-A based receptors. 585

Benzodiazepines, barbiturates [92] and some anticonvulsants act by modulating the GABA receptors [93]. 586

The inhibitory effects of GABA help relieve seizures. However, drugs like Pregabalin and Gabapentin in-587

stead act by blocking calcium or sodium channels to help stabilize seizures. Although this is not directly 588

interacting with GABA receptors, it helps reduce excitatory neurotransmitters. Thus, they may help sub-589

stantiate antiepileptic activity by increasing amounts of GABA. 590

591

592

593

Figure 5 An illustration depicting Gabaergic drug mechanisms. Dietary sources containing fatty acids in-594

crease the production of GABA. Taking drugs like Vigabatrin, pregabalin & Gabapentin with such a diet 595

can increase Gabaergic effects. 596

597

27 of 35

In summary, the discussed pairs of food ingredients and drugs can influence their own pharmacokinetics. 598

For example, taking beta-adrenergic drugs with food containing terpenes like Eugenol and Methyl chavicol 599

can potentially cause more pronounced antihypertensive effects. Taking antiepileptic medications along 600

with foods containing fatty acids can potentially elevate overall GABA levels significantly than when they 601

are taken individually. Moreover, dietary fatty acids can also interact with the PPAR receptor during in-602

flammation to produce variations of prostaglandins. This demonstrates the feasibility of using our FDMine 603

framework to identify potential food and drug interactions. 604

Conclusion 605

In this study, we introduced FDMine as a framework to infer the interaction between food compounds and 606

drugs using a homogenous graph representation. We considered several resources to construct food-drug, 607

drug-drug, and food-food similarity profiles. FDMine uses established path category-based and neighbor-608

hood-based similarity methods to predict FDIs efficiently. A subset of Drug-drug interactions was used as 609

ground-truth evaluations. This proposed methodology is based on encoding all entities including drug and 610

food into a homogenous graph of chemical nodes. Therefore, any part of this graph can then be used as a 611

representative evaluation, potentially informative to clinicians and researchers. We have performed addi-612

tionally two types of evaluations to benchmark results using different parts of the graph. The shortest path-613

based method has achieved a precision 84%, 60% and 40% for the top 1%, 2% and 5%, respectively. 614

FDMine was able to achieve an average 99.4% recovery rate from 27,612 available links in the joint version 615

of the graph. We validated the top FDIs predicted using FDMine to demonstrate the applicability of the 616

model. In the literature validation, we discussed the therapeutic effects of a group of food items. We ob-617

served that a set of FDIs may reduce blood pressure, have anti-inflammatory effects or reduce seizure. The 618

benchmark results and literature review suggest that FDMine can help to identify FDIs precisely and may 619

represent an advanced strategy in drug discovery. 620

621

Availability of data and materials 622

The code and datasets supporting the conclusions of this article are included within the article (and its 623

additional files) or is made available at https://github.com/mostafiz67/FDMine_Framework 624

Competing interests 625

The authors declare that they have no competing interests. 626

28 of 35

Author contributions 627

MR and OS conceptualized the problem. MR was responsible for solution development and implementa-628

tion. SV and AM were responsible for validating the new predictions. AM, JL and OS reviewed the text 629

and the evaluation of the work. JL and OS supervised the study. 630

631

Funding information 632

This work was supported by a Natural Science and Engineering Research Council of Canada, Canada Re-633

search Chair grant (grant number 231266) to JL, a Canada Foundation for Innovation and Nova Scotia 634

Research and Innovation Trust infrastructure grant to JL, and a Natural Science and Engineering Research 635

Council of Canada Discovery Grant to JL. This research was supported in part by the Heaps Chair Endow-636

ment Fund at St. Francis Xavier University through the Dr. H. Stanley & Doreen Alley Heaps Chairship. 637

This research was enabled in part by support provided by Compute Canada (www.computecanada.ca) and 638

by Google Cloud under the GCP research credits program. 639

640

Acknowledgements 641

Authors would like to acknowledge Sumaiya Amin for some preliminary data preparation in this work. 642

643

References 644

1. Bushra, R., Aslam, N., Khan, A.Y.: Food-drug interactions. Oman medical journal 26(2), 77 (2011) 645

2. Schmidt, L.E., Dalhoff, K.: Food-drug interactions. Drugs 62(10), 1481–1502 (2002) 646

3. Won, C.S., Oberlies, N.H., Paine, M.F.: Mechanisms underlying food–drug interactions: inhibition of 647

intestinal metabolism and transport. Pharmacology & therapeutics 136(2), 186–201 (2012) 648

4. Mouly, S., Morgand, M., Lopes, A., Lloret-Linares, C., Bergmann, J.: Drug-food interactions in internal 649

medicine: What physicians should know? La Revue de medecine interne 36(8), 530–539 (2015) 650

5. Ased, S., Wells, J., Morrow, L.E., Malesker, M.A.: Clinically significant food-drug interactions. The 651

Consultant Pharmacist® 33(11), 649–657 (2018) 652

6. Hollander, A.A., van Rooij, J., Lentjes, E.G., Arbouw, F., van Bree, J.B., Schoemaker, R.C., van Es, L.A., 653

van der Woude, F.J., Cohen, A.F.: The effect of grapefruit juice on cyclosporine and prednisone metabolism 654

in transplant patients. Clinical Pharmacology & Therapeutics 57(3), 318–324 (1995) 655

29 of 35

7. Dahan, A., Altman, H.: Food–drug interaction: grapefruit juice augments drug bioavailability—mechanism, 656

extent and relevance. European journal of clinical nutrition 58(1), 1–9 (2004) 657

8. Koziolek, M., Alcaro, S., Augustijns, P., Basit, A.W., Grimm, M., Hens, B., Hoad, C.L., Jedamzik, P., Madla, 658

C.M., Maliepaard, M., et al.: The mechanisms of pharmacokinetic food-drug interactions–a perspective from 659

the ungap group. European Journal of Pharmaceutical Sciences 134, 31–59 (2019) 660

9. Goldstein, L.H., Elias, M., Ron-Avraham, G., Biniaurishvili, B.Z., Madjar, M., Kamargash, I., Braunstein, 661

R., Berkovitch, M., Golik, A.: Consumption of herbal remedies and dietary supplements amongst patients 662

hospitalized in medical wards. British journal of clinical pharmacology 64(3), 373–380 (2007) 663

10. Berkovich, L., Earon, G., Ron, I., Rimmon, A., Vexler, A., Lev-Ari, S.: Moringa oleifera aqueous leaf extract 664

down-regulates nuclear factor-kappab and increases cytotoxic effect of chemotherapy in pancreatic cancer 665

cells. BMC complementary and alternative medicine 13(1), 1–7 (2013) 666

11. Hermawan, A., Nur, K.A., Dewi, D., Putri, P., Meiyanto, E., et al.: Ethanolic extract of moringa oleifera 667

increased cytotoxic effect of doxorubicin on hela cancer cells. Journal of Natural remedies 12(2), 108–114 668

(2012) 669

12. Al-Asmari, A.K., Albalawi, S.M., Athar, M.T., Khan, A.Q., Al-Shahrani, H., Islam, M.: Moringa oleifera as 670

an anti-cancer agent against breast and colorectal cancer cell lines. PloS one 10(8), 0135814 (2015) 671

13. Nirmala, M.J., Samundeeswari, A., Sankar, P.D., et al.: Natural plant resources in anti-cancer therapy-a 672

review. Res Plant Biol 1(3), 01–14 (2011) 673

14. Mouly, S., Lloret-Linares, C., Sellier, P.-O., Sene, D., Bergmann, J.-F.: Is the clinical relevance of drug-food 674

and drug-herb interactions limited to grapefruit juice and saint-john’s wort? Pharmacological research 118, 675

82–92 (2017) 676

15. de Boer, A., Van Hunsel, F., Bast, A.: Adverse food–drug interactions. Regulatory Toxicology and 677

Pharmacology 73(3), 859–865 (2015) 678

16. Segal, E.M., Flood, M.R., Mancini, R.S., Whiteman, R.T., Friedt, G.A., Kramer, A.R., Hofstetter, M.A.: Oral 679

chemotherapy food and drug interactions: a comprehensive review of the literature. Journal of oncology 680

practice 10(4), 255–268 (2014) 681

17. Di Minno, A., Frigerio, B., Spadarella, G., Ravani, A., Sansaro, D., Amato, M., Kitzmiller, J.P., Pepi, M., 682

Tremoli, E., Baldassarre, D.: Old and new oral anticoagulants: food, herbal medicines and drug interactions. 683

Blood reviews 31(4), 193–203 (2017) 684

18. Gupta, R.C., Chang, D., Nammi, S., Bensoussan, A., Bilinski, K., Roufogalis, B.D.: Interactions between 685

antidiabetic drugs and herbs: an overview of mechanisms of action and clinical implications. Diabetology & 686

metabolic syndrome 9(1), 1–12 (2017) 687

19. Stephenson, N., Shane, E., Chase, J., Rowland, J., Ries, D., Justice, N., Zhang, J., Chan, L., Cao, R.: Survey 688

of machine learning techniques in drug discovery. Current drug metabolism 20(3), 185–193 (2019) 689

20. Lee, G., Park, C., Ahn, J.: Novel deep learning model for more accurate prediction of drug-drug interaction 690

effects. BMC bioinformatics 20(1), 1–8 (2019) 691

30 of 35

21. Ryu, J.Y., Kim, H.U., Lee, S.Y.: Deep learning improves prediction of drug–drug and drug–food interactions. 692

Proceedings of the National Academy of Sciences 115(18), 4304–4311 (2018) 693

22. Reker, D., Shi, Y., Kirtane, A.R., Hess, K., Zhong, G.J., Crane, E., Lin, C.-H., Langer, R., Traverso, G.: 694

Machine learning uncovers food-and excipient-drug interactions. Cell reports 30(11), 3710–3716 (2020) 695

23. Allahgholi, M., Rahmani, H., Javdani, D., Weiss, G., M´odos, D.: Addi: Recommending alternatives for 696

drug–drug interactions with negative health effects. Computers in Biology and Medicine 125, 103969 (2020) 697

24. Feng, Y.-H., Zhang, S.-W., Shi, J.-Y.: Dpddi: a deep predictor for drug-drug interactions. BMC 698

bioinformatics 21(1), 1–15 (2020) 699

25. You, J., McLeod, R.D., Hu, P.: Predicting drug-target interaction network using deep learning model. 700

Computational biology and chemistry 80, 90–101 (2019) 701

26. Ba-Alawi, W., Soufan, O., Essack, M., Kalnis, P., Bajic, V.B.: Daspfind: new efficient method to predict 702

drug–target interactions. Journal of cheminformatics 8(1), 1–9 (2016) 703

27. Olayan, R.S., Ashoor, H., Bajic, V.B.: Ddr: efficient computational method to predict drug–target 704

interactions using graph mining and machine learning approaches. Bioinformatics 34(7), 1164–1173 (2018) 705

28. Lu, Y., Guo, Y., Korhonen, A.: Link prediction in drug-target interactions network using similarity indices. 706

BMC bioinformatics 18(1), 1–9 (2017) 707

29. Fokoue, A., Sadoghi, M., Hassanzadeh, O., Zhang, P.: Predicting drug-drug interactions through large-scale 708

similarity-based link prediction. In: European Semantic Web Conference, pp. 774–789 (2016). Springer 709

30. Naveja, J.J., Rico-Hidalgo, M.P., Medina-Franco, J.L.: Analysis of a large food chemical database: Chemical 710

space, diversity, and complexity. F1000Research 7 (2018) 711

31. FooDB: Foodb version 1.0 (2017) 712

32. Wishart, D.S., Knox, C., Guo, A.C., Shrivastava, S., Hassanali, M., Stothard, P., Chang, Z., Woolsey, J.: 713

Drugbank: a comprehensive resource for in silico drug discovery and exploration. Nucleic acids research 714

34(suppl 1), 668–672 (2006) 715

33. Wishart, D.S., Feunang, Y.D., Guo, A.C., Lo, E.J., Marcu, A., Grant, J.R., Sajed, T., Johnson, D., Li, C., 716

Sayeeda, Z., et al.: Drugbank 5.0: a major update to the drugbank database for 2018. Nucleic acids research 717

46(D1), 1074–1082 (2018) 718

34. Wishart, D.S., Knox, C., Guo, A.C., Cheng, D., Shrivastava, S., Tzur, D., Gautam, B., Hassanali, M.: 719

Drugbank: a knowledgebase for drugs, drug actions and drug targets. Nucleic acids research 36(suppl 1), 720

901–906 (2008) 721

35. Bajusz, D., R´acz, A., H´eberger, K.: Why is tanimoto index an appropriate choice for fingerprint-based 722

similarity calculations? Journal of cheminformatics 7(1), 1–13 (2015) 723

36. Alazmi, M., Kuwahara, H., Soufan, O., Ding, L., Gao, X.: Systematic selection of chemical fingerprint 724

features improves the gibbs energy prediction of biochemical reactions. Bioinformatics 35(15), 2634–2643 725

(2019) 726

31 of 35

37. Morgan, H.L.: The generation of a unique machine description for chemical structures-a technique developed 727

at chemical abstracts service. Journal of Chemical Documentation 5(2), 107–113 (1965) 728

38. Rogers, D., Hahn, M.: Extended-connectivity fingerprints. Journal of chemical information and modeling 729

50(5), 742–754 (2010) 730

39. Awale, M., Reymond, J.-L.: Web-based tools for polypharmacology prediction. In: Systems Chemical 731

Biology, pp. 255–272. Springer, (2019) 732

40. Awale, M., Reymond, J.-L.: Polypharmacology browser ppb2: target prediction combining nearest neighbors 733

with machine learning. Journal of chemical information and modeling 59(1), 10–17 (2018) 734

41. Riniker, S., Landrum, G.A.: Open-source platform to benchmark fingerprints for ligand-based virtual 735

screening. Journal of cheminformatics 5(1), 1–17 (2013) 736

42. Rai, A., Kumar, V., Jerath, G., Kartha, C., Ramakrishnan, V.: Mapping drug-target interactions and synergy 737

in multi-molecular therapeutics for pressure-overload cardiac hypertrophy. NPJ systems biology and 738

applications 7(1), 1–11 (2021) 739

43. Gottlieb, A., Stein, G.Y., Oron, Y., Ruppin, E., Sharan, R.: Indi: a computational framework for inferring 740

drug interactions and their associated recommendations. Molecular systems biology 8(1), 592 (2012) 741

44. Vilar, S., Harpaz, R., Uriarte, E., Santana, L., Rabadan, R., Friedman, C.: Drug—drug interaction through 742

molecular structure similarity analysis. Journal of the American Medical Informatics Association 19(6), 743

1066–1074 (2012) 744

45. Kov´acs, I.A., Luck, K., Spirohn, K., Wang, Y., Pollis, C., Schlabach, S., Bian, W., Kim, D.-K., Kishore, N., 745

Hao, T., et al.: Network-based prediction of protein interactions. Nature communications 10(1), 1–8 (2019) 746

46. Al Hasan, M., Chaoji, V., Salem, S., Zaki, M.: Link prediction using supervised learning. In: SDM06: 747

Workshop on Link Analysis, Counter-terrorism and Security, vol. 30, pp. 798–805 (2006) 748

47. Guimer`a, R., Sales-Pardo, M.: Missing and spurious interactions and the reconstruction of complex network. 749

Proceedings of the National Academy of Sciences 106(52), 22073–22078 (2009) 750

48. Chen, H., Li, X., Huang, Z.: Link prediction approach to collaborative filtering. In: Proceedings of the 5th 751

ACM/IEEE-CS Joint Conference on Digital Libraries (JCDL’05), pp. 141–142 (2005). IEEE 752

49. Clauset, A., Moore, C., Newman, M.E.: Hierarchical structure and the prediction of missing links in 753

networks. Nature 453(7191), 98–101 (2008) 754

50. Folino, F., Pizzuti, C.: Link prediction approaches for disease networks. In: International Conference on 755

Information Technology in Bio-and Medical Informatics, pp. 99–108 (2012). Springer 756

51. Daminelli, S., Thomas, J.M., Dur´an, C., Cannistraci, C.V.: Common neighbours and the local-community-757

paradigm for topological link prediction in bipartite networks. New Journal of Physics 17(11), 113037 (2015) 758

52. Adamic, L.A., Adar, E.: Friends and neighbors on the web. Social networks 25(3), 211–230 (2003) 759

53. Liben-Nowell, D., Kleinberg, J.: The link-prediction problem for social networks. Journal of the American 760

society for information science and technology 58(7), 1019–1031 (2007) 761

32 of 35

54. Jaccard, P.: ’E comparative study of floral distribution in a portion of the alps and jura. Bull Soc Vaudoise 762

Sci Nat 37, 547–579 (1901) 763

55. Zhou, T., Lu¨, L., Zhang, Y.-C.: Predicting missing links via local information. The European Physical 764

Journal B71(4), 623–630 (2009) 765

56. Yang, Y., Lichtenwalter, R.N., Chawla, N.V.: Evaluating link prediction methods. Knowledge and 766

Information Systems 45(3), 751–782 (2015) 767

57. Chen, Y., Wang, W., Liu, J., Feng, J., Gong, X.: Protein interface complementarity and gene duplication 768

improve link prediction of protein-protein interaction network. Frontiers in genetics 11 (2020) 769

58. Dice, L.R.: Measures of the amount of ecologic association between species. Ecology 26(3), 297–302 (1945) 770

59. Sorensen, T.A.: A method of establishing groups of equal amplitude in plant sociology based on similarity 771

of species content and its application to analyses of the vegetation on danish commons. Biol. Skar. 5, 1–34 772

(1948) 773

60. Crichton, G., Guo, Y., Pyysalo, S., Korhonen, A.: Neural networks for link prediction in realistic biomedical 774

graphs: a multi-dimensional evaluation of graph embedding-based approaches. BMC bioinformatics 19(1), 775

1–11 (2018) 776

61. Lu¨, L., Zhou, T.: Link prediction in weighted networks: The role of weak ties. EPL (Europhysics Letters) 777

89(1), 18001 (2010) 778

62. Chen, H., Zhang, Z., Zhang, J.: In silico drug repositioning based on the integration of chemical, genomic 779

and pharmacological spaces. BMC bioinformatics 22(1), 1–12 (2021) 780

63. Wang, C., Satuluri, V., Parthasarathy, S.: Local probabilistic models for link prediction. In: Seventh IEEE 781

International Conference on Data Mining (ICDM 2007), pp. 322–331 (2007). IEEE 782

64. O’Madadhain, J., Hutchins, J., Smyth, P.: Prediction and ranking algorithms for event-based network data. 783

ACM SIGKDD explorations newsletter 7(2), 23–30 (2005) 784

65. Backstrom, L., Leskovec, J.: Supervised random walks: predicting and recommending links in social 785

networks. In: Proceedings of the Fourth ACM International Conference on Web Search and Data Mining, 786

pp. 635–644 (2011) 787

66. Dong, Y., Tang, J., Wu, S., Tian, J., Chawla, N.V., Rao, J., Cao, H.: Link prediction and recommendation 788

across heterogeneous social networks. In: 2012 IEEE 12th International Conference on Data Mining, pp. 789

181–190 (2012). IEEE 790

67. Kerrache, S., Alharbi, R., Benhidour, H.: A scalable similarity-popularity link prediction method. Scientific 791

reports 10(1), 1–14 (2020) 792

68. Muscoloni, A., Michieli, U., Cannistraci, C.V.: Local-ring network automata and the impact of hyperbolic 793

geometry in complex network link-prediction. arXiv preprint arXiv:1707.09496 (2017) 794

69. Garcia-Gasulla, D., Ayguad´e, E., Labarta, J., Cort´es, U.: Limitations and alternatives for the evaluation of 795

large-scale link prediction. arXiv preprint arXiv:1611.00547 (2016) 796

33 of 35

70. Wang, W., Cai, F., Jiao, P., Pan, L.: A perturbation-based framework for link prediction via non-negative 797

matrix factorization. Scientific reports 6(1), 1–11 (2016) 798

71. Davis, J., Goadrich, M.: The relationship between precision-recall and roc curves. In: Proceedings of the 23rd 799

International Conference on Machine Learning, pp. 233–240 (2006) 800

72. Kumar, N.G., Contaifer, D., Madurantakam, P., Carbone, S., Price, E.T., Van Tassell, B., Brophy, D.F., 801

Wijesinghe, D.S.: Dietary bioactive fatty acids as modulators of immune function: implications on human 802

health. Nutrients 11(12), 2974 (2019) 803

73. do Vale, G.T., Ceron, C.S., Gonzaga, N.A., Simplicio, J.A., Padovan, J.C.: Three generations of β-blockers: 804

history, class differences and clinical applicability. Current hypertension reviews 15(1), 22–31 (2019) 805

74. Tritsch, N.X., Granger, A.J., Sabatini, B.L.: Mechanisms and functions of gaba co-release. Nature Reviews 806

Neuroscience 17(3), 139–145 (2016) 807

75. Jorgensen, E.M.: Gaba. WormBook: The Online Review of C. elegans Biology [Internet] (2005) 808

76. Ricciotti, E., FitzGerald, G.A.: Prostaglandins and inflammation. Arteriosclerosis, thrombosis, and vascular 809

biology 31(5), 986–1000 (2011) 810

77. Engelking, L.R.: Textbook of Veterinary Physiological Chemistry, Updated 2/e. Academic Press, (2010) 811

78. Di Pasquale, E., Chahinian, H., Sanchez, P., Fantini, J.: The insertion and transport of anandamide in 812

synthetic lipid membranes are both cholesterol-dependent. PLoS One 4(3), 4989 (2009) 813

79. Higgins, A., Lees, P.: The acute inflammatory process, arachidonic acid metabolism and the mode of action 814

of anti-inflammatory drugs. Equine Veterinary Journal 16(3), 163–175 (1984) 815

80. Delves, P.J., Roitt, I.M.: Encyclopedia of Immunology, pp. 2024–2027. Academic Press, (1998) 816

81. Baker, R.R.: The eicosanoids: a historical overview. Clinical biochemistry 23(5), 455–458 (1990) 817

82. Varga, T., Czimmerer, Z., Nagy, L.: Ppars are a unique set of fatty acid regulated transcription factors 818

controlling both lipid metabolism and inflammation. Biochimica et Biophysica Acta (BBA)-Molecular Basis 819

of Disease 1812(8), 1007–1022 (2011) 820

83. Kaur, N., Chugh, V., Gupta, A.K.: Essential fatty acids as functional components of foods-a review. Journal 821

of food science and technology 51(10), 2289–2303 (2014) 822

84. Ortun˜o Sahagu´n, D., M´arquez-Aguirre, A., Quintero-Fabi´an, S., L´opez-Roa, R., Rojas-Mayorqu´ın, A.: 823

Modulation of ppar-γ by nutraceutics as complementary treatment for obesity-related disorders and 824

inflammatory diseases. PPAR research 2012 (2012) 825

85. Wu, H.-T., Chen, W., Cheng, K.-C., Ku, P.-M., Yeh, C.-H., Cheng, J.-T.: Oleic acid activates peroxisome 826

proliferator-activated receptor δ to compensate insulin resistance in steatotic cells. The Journal of nutritional 827

biochemistry 23(10), 1264–1270 (2012) 828

86. Santos, M.R., Moreira, F.V., Fraga, B.P., Souza, D.P.d., Bonjardim, L.R., Quintans-Junior, L.J.: 829

Cardiovascular effects of monoterpenes: a review. Revista Brasileira de Farmacognosia 21(4), 764–771 830

(2011) 831

34 of 35

87. Peixoto-Neves, D., Wang, Q., Leal-Cardoso, J.H., Rossoni, L.V., Jaggar, J.H.: Eugenol dilates mesenteric 832

arteries and reduces systemic bp by activating endothelial cell trpv 4 channels. British journal of 833

pharmacology 172(14), 3484–3494 (2015) 834

88. Farzam, K., jan, A.: Beta blockers. StatPearls (2021) 835

89. Alhayek, S., Preuss, C.V.: Beta 1 receptors. StatPearls (2021) 836

90. Remiszewska, M., Jastrzebski, Z., Czyzewska-Szafran, H., Wutkiewicz, M.: Antihypertensive treatment with 837

beta blockers and gabaergic transmission in rat brain. Acta Poloniae Pharmaceutica 52(2), 185–186 (1994) 838

91. Bernal-Morales, B., Cueto-Escobedo, J., Guill´en-Ruiz, G., Rodr´ıguez-Landa, J.F., Contreras, C.M.: A fatty 839

acids mixture reduces anxiety-like behaviors in infant rats mediated by gabaa receptors. BioMed research 840

international 2017 (2017) 841

92. Campo-Soria, C., Chang, Y., Weiss, D.S.: Mechanism of action of benzodiazepines on gabaa receptors. 842

British journal of pharmacology 148(7), 984–990 (2006) 843

93. Czapinski, P., Blaszczyk, B., Czuczwar, S.J.: Mechanisms of action of antiepileptic drugs. Current topics in 844

medicinal chemistry 5(1), 3–14 (2005) 845

Supplementary Information 846

Additional file 1: Figure S1. The DrugBank Dataset extraction procedure. Figure S2. The FooDB dataset extraction 847

procedure. Figure S3. Calculating Structure Similarity Profile Using Tanimoto Coefficient. Table S1. Calculating the 848

contribution of a food compound in a food. Figure S4. Disjoint and Joint Graph. Figure S5. Precision@Top. Figure 849

S6. Precision@top comparison of eight different methods over the disjoint graph network. Figure S7. Precision@top 850

comparison of eight different methods over the joint graph network. Figure S8. Area Under the Curve (AUC) for path 851

category-based (dataset 1: disjoint graph). Figure S9. Area Under the Curve (AUC) for path category-based (dataset 852

2: joint graph). Figure S10. Area Under the Curve (AUC) for neighborhood-based similarity-based (dataset 1: disjoint 853

graph). Figure S11. Area Under the Curve (AUC) for neighborhood-based similarity-based (dataset 2: joint graph). 854

Figure S12. Precision-Recall Curve (PRC) for path category-based (dataset 1: disjoint graph). Figure S13. Precision-855

Recall Curve (PRC) for path category-based (dataset 2: joint graph). Figure S14. Precision-Recall Curve (PRC) for 856

path neighborhood-based similarity-based (dataset 1: disjoint graph). Figure S15. Precision-Recall Curve (PRC) for 857

neighborhood-based similarity-based (dataset 2: joint graph). Table S2. Number of links in the graph after applying 858

different food compound contribution score. 859

Additional file 2: Table S1. Top 10 FDIs found from path category-based (path length-2) method over disjoint graph. 860

Records might appear repeated, but food item IDs are different in this table. Table S2. Top 20 FDIs from path cate-861

gory-based (path length-2) method over disjoint and joint graph. Table S3. Top 10 FDIs from Neighborhood-based 862

Similarity-based method over joint graph. 863

Additional file 3: Table S1. Top 25 FDIs found from path category-based (path length-2) method over disjoint graph. 864

Table S2. Top 25 FDIs found from path category-based (path length-2) method over joint graph. Table S3. Top 20 865

35 of 35

common FDIs found from path category-based (path length-2) method over disjoint and joint graph. Table S4. Top 866

25 FDIs from Neighborhood-based similarity-based methods method over the joint graph. 867

Supplementary Files

This is a list of supplementary �les associated with this preprint. Click to download.

AdditionalFile1.docx

AdditionalFile2.docx

AdditionalFile3.docx


Recommended