179
Feasibility Assessment for Epidemiological Studies at Pease International Tradeport, Portsmouth, New Hampshire November 2017 CS 289981-A

Feasibility Assessment for Epidemiological Studies at
Pease International Tradeport, Portsmouth, New Hampshire
November 2017
CS 289981-A
1
Contents
Summary ..................................................................................................................................................... 2
Introduction ................................................................................................................................................. 8
Site history .................................................................................................................................................. 9
Community concerns ................................................................................................................................ 11
Exposure assessment ................................................................................................................................. 12
Summary of literature review ................................................................................................................... 14
Adult cancers and other adult diseases ............................................................................................. 14
Health effects in children.................................................................................................................... 14
Sources of adverse outcome data for the Pease population ...................................................................... 15
Sources of exposure data .......................................................................................................................... 17
Feasibility of an epidemiological study of children at the Pease Tradeport ............................................. 18
Feasibility of an epidemiological study of adults at the Pease Tradeport ................................................. 32
Feasibility of an epidemiological study of former military service and civilian workers at the former Pease Air Force base ................................................................................................................................. 41
Other study designs and health-related endpoints .................................................................................... 42
References ................................................................................................................................................. 45
Tables ........................................................................................................................................................ 59
Appendix ................................................................................................................................................... 76
Literature review ................................................................................................................................ 77
Description of sample size calculations ............................................................................................. 93
Appendix tables ................................................................................................................................. 115
Comments from the Pease CAP and ATSDR responses……………………………………………….164

2
Summary This report describes the activities and the conclusions of ATSDR’s feasibility assessment of possible future drinking water epidemiological studies at the Pease International Tradeport, Portsmouth, New Hampshire (“Pease”). The drinking water at Pease was contaminated with perfluoroalkyl substances (PFAS), in particular perfluorooctane sulfonate (PFOS) and perfluorohexane sulfonate (PFHxS), from the use of aqueous film-forming foam (AFFF) at the former Pease Air Force Base. The base used AFFF for firefighting training and to extinguish flammable liquid fires. In 2015, the New Hampshire Department of Health and Human Services (NH DHHS) established a PFAS blood testing program at Pease. A total of 1,578 persons submitted a blood sample for analysis. The results from the blood testing program indicated that the exposed population had higher serum levels of PFOS and PFHxS than did the U.S. population. In March 2016, ATSDR established a community assistance panel (CAP) as a mechanism for the community to voice its concerns and provide input on decisions concerning potential health activities at Pease. A key concern expressed by the community was the lack of information on the possible short-term and long-term health effects to children and adults exposed to the PFAS contaminants in the drinking water at Pease. Specifically, the community was concerned about cancers, elevated lipids, effects on thyroid and immune function, and developmental delays in children. ATSDR then assessed whether epidemiological studies focusing on populations at Pease were feasible and whether such studies could answer the concerns of the community. When evaluating whether an epidemiological study would be scientifically feasible, ATSDR used three main criteria:
1. Meaningful and credible results — a study should have sufficient validity and precision, be capable of detecting health-related effects, and be as responsive as possible to the community’s questions and concerns. Ideally, a study should also be capable of detecting health-related effects, for example a 20% to 100% increase in risk with sufficient statistical power (i.e., statistical power ≥80%).
2. Scientific importance — a study should evaluate biologically plausible diseases and other health-related endpoints (also called “effect biomarkers”) and improve our understanding of possible health effects of PFAS exposures.
3. Public health significance — a study should provide a basis for determining if PFAS exposures increase the risks for specific adverse health effects, and if so, what public health actions are necessary to reduce the risks. The study should also be relevant to other populations with similar exposures.
The feasibility assessment is guided by these three criteria and does not address considerations of financial or operational feasibility. Feasibility was also assessed in terms of whether sufficient participation (sample size) could be obtained from within the Pease community to achieve sufficient statistical power for the health-related endpoints being considered, or whether the study would need to be expanded to other communities beyond the Pease population. ATSDR reviewed the epidemiological literature on PFAS exposures to identify the health-related endpoints that have been studied and current data gaps, in particular, for the effects of PFHxS. The

3
literature review also was used to identify adverse effect sizes observed in the PFAS studies for PFAS serum levels similar to those found in the Pease population. The literature review found that most information on potential health effects concerned exposures to perfluorooctanoic acid (PFOA). In particular, numerous studies have been conducted of West Virginia and Ohio residents and workers exposed to PFOA from a chemical plant (the “C8” studies) [Frisbee 2009]. Studies of other workforces also were primarily focused on PFOA exposures. The literature review found that less information was available about the potential health effects of PFOS exposures, and very little information was available on the potential health effects of exposures to PFHxS. Because the primary contaminants in the drinking water at the Pease Tradeport were PFOS and PFHxS, epidemiological studies of the Pease populations have the potential to fill key knowledge gaps and address the community’s concerns. The literature review identified many health-related endpoints evaluated in previous epidemiological studies of PFAS exposures. These included cancers, lipids, effects on thyroid and immune function, and developmental delays. They also included effects on kidney and liver function and sex hormones, and diseases such as endometriosis, ulcerative colitis and osteoporosis. Many of these health-related endpoints were also previously raised by the community and the Pease CAP. In considering possible study designs, ATSDR focused on the methods used in previous epidemiological research of PFAS exposures. Adopting study design methods consistent with previous research would facilitate the interpretation and synthesis of findings across studies. The literature review found that most of the epidemiological studies of PFAS exposures were cross-sectional and evaluated serum PFAS measurements. Some studies also evaluated cumulative PFAS serum levels that were estimated from modeling methods. ATSDR concluded that any study of populations exposed to the PFAS-contaminated drinking water at the Pease Tradeport should be cross-sectional and evaluate measured serum PFAS measurements as well as estimated cumulative PFAS serum levels. ATSDR also concluded that methods used to evaluate health-related endpoints in the Pease Tradeport populations should be consistent with methods used in previous epidemiological research of PFAS exposures. Potential Study Designs A. Cross-sectional study of children The first design is a cross-sectional study of children who were exposed to the PFAS-contaminated drinking water while attending the two day-care centers at Pease. Inclusion would be limited to children who attended the day-care centers any time before June 2014, and who would be in the age range of 4–17 years at the time the study begins. During the 2015 blood testing program at Pease, 379 children aged 1–14 years contributed blood samples. If a study were to begin in 2018, these children would be ages 4–17 years. The study would involve re-contacting these participants and obtaining new blood samples. To increase the sample size, the study would also recruit and obtain blood samples from children who attended the day-care centers at Pease, but who did not participate in the New Hampshire blood testing program. Because PFAS-contaminated drinking water exposures could occur to children in utero and during breastfeeding if the mother worked at the Pease Tradeport, the study would include these additional children if the exposures began prior to June 2014 and their ages are 4 – 17 years at the time the study begins.

4
A comparison group of children, who did not attend day care at the Pease Tradeport and whose parents did not work at the Pease Tradeport or have occupational exposures to PFAS, would be recruited and blood samples collected. The comparison group would be sampled from the Portsmouth public schools and selected to have similar demographics as the Pease children. Based on the health-related endpoints included in the final study, blood samples could be used to evaluate PFAS serum levels and several biomarkers of effect, including lipids, thyroid function, kidney function, immune function, and sex hormones. The children could also be assessed for neurological endpoints such as intelligence quotient (IQ), learning problems, and attention-deficit/hyperactivity disorder (ADHD) behaviors. Calculations were conducted assuming a sample size of 350 exposed children who attended day care at the Pease Tradeport and 175 unexposed children from the Portsmouth area who did not attend day care at the Pease Tradeport. Additional sample size calculations assumed a sample size of 500 exposed children and 250 unexposed children. The sample size calculations also assumed a simple comparison of exposed versus unexposed children. A second approach was to determine the sample sizes needed to detect effects found in other PFAS studies of children with serum PFAS levels similar to those observed in the Pease children population. For some health-related endpoints, there was insufficient information to conduct any sample size calculations. Based on sample size considerations, health-related endpoints were grouped into three categories: 1) feasible to study, 2) possible to study (but would require a larger sample size than 350 exposed children and 175 unexposed children), and 3) not feasible to study using the Pease children population unless additional populations exposed to PFAS-contaminated drinking water from other affected communities are included in the study. Health-related endpoints feasible to study in children at Pease • Mean difference in lipids (total cholesterol, LDL, HDL, triglycerides) • Mean difference in estimated glomerular filtration rate (eGFR), a measure of kidney function • Insulin-like growth factor – 1 (a measure of growth hormone deficiency) • Overweight/Obesity
Health-related endpoints that may be possible to study in children at Pease (although a larger sample size from the Pease community will likely be needed) • Mean difference in uric acid, a measure of kidney function • Elevated total cholesterol (hypercholesterolemia) • Elevated uric acid (hyperuricemia) • IQ/neurobehavioral • Thyroid function • Sex hormones • Asthma and atopic dermatitis (immune function) • Rhinitis (stuffy, runny nose) • Antibody responses to rubella, mumps and diphtheria vaccines

5
Health-related endpoints not feasible to study using the Pease children population (in order to address these health endpoints, populations from other sites beyond the Pease community with PFAS-contaminated drinking water would need to be included along with the Pease children population) • Attention deficit/hyperactivity disorder (ADHD) • Autism spectrum disorder • Delayed puberty • Thyroid disease • Childhood cancers
To evaluate exposure-response trends, the study participants would need to be split into tertiles or quartiles based on their serum PFAS levels. This might require a larger sample size for some of the health-related endpoints listed as feasible to study. B. Cross-sectional study of adults The second cross-sectional study design would involve obtaining blood samples from adults aged ≥18 years who worked anytime at the Pease Tradeport during January 2008–May 2014. This study would evaluate PFAS serum levels, lipids, thyroid function, liver function, kidney function, and immune function. The study would also evaluate diseases such as kidney disease, liver disease, cardiovascular disease, thyroid disease, ulcerative colitis, rheumatoid arthritis, osteoporosis, osteoarthritis, and endometriosis. In the 2015 blood testing program at Pease, 1,182 adults aged ≥18 years participated, and 1,083 (91.6%) adults reported that they last worked at Pease during 2008–2014. Calculations were conducted assuming a sample size of 1,500 adults exposed while employed at the Pease Tradeport and 1,500 unexposed adults from the Portsmouth area who never worked at the Pease Tradeport. The sample size calculations also assumed a simple comparison of exposed versus unexposed adults. A second approach was to determine the sample sizes needed to detect effects found in other PFAS studies of adults with serum PFAS levels similar to those observed in the Pease adult population. Based on sample size considerations, health-related endpoints were grouped into three categories: 1) feasible to study, 2) possible to study (but would require a larger sample size than 1,500 exposed and 1,500 unexposed adults), and 3) not feasible to study using the Pease adult population unless additional populations exposed to PFAS-contaminated drinking water are included in the study. Health-related endpoints feasible to study in adults at Pease • Mean difference in lipids (total cholesterol, LDL, HDL, triglycerides) • Elevated total cholesterol (hypercholesterolemia) • Mean difference in uric acid, a measure of kidney function • Elevated uric acid (hyperuricemia) • Thyroid disease (unconfirmed) • Cardiovascular disease • Hypertension • Osteoarthritis and osteoporosis

6
• Mean differences in serum immunoglobin (IgA, IgE, IgG, IgM), and C-reactive protein (an indicator of inflammation); increase in antinuclear antibodies (an indicator of autoimmune reaction); alterations in specific cytokines
Health-related endpoints that may be possible to study in adults at Pease (although a larger sample size from the Pease community may be needed) • Liver function • Thyroid disease (confirmed) • Thyroid function • Endometriosis • Pregnancy-induced hypertension
Health endpoints not feasible to study using the Pease adult population (i.e., populations from other sites beyond the Pease community with PFAS-contaminated drinking water would need to be included to evaluate these health-related endpoints) • Liver disease • Kidney disease • Ulcerative colitis • Rheumatoid arthritis • Lupus • Multiple sclerosis • Kidney cancer (and other adult cancers)
To evaluate exposure-response trends, the study participants would need to be split into tertiles or quartiles based on their serum PFAS levels. This might require a larger sample size for some of the health endpoints listed as feasible to study. C. Mortality study of former military service and civilian worker personnel A third study design that was considered would evaluate mortality and cancer incidence among former military service and civilian worker personnel at the former Pease Air Force Base and other military bases where drinking water was contaminated with PFOS and PFHxS from the use of AFFF. Comparison military bases would also need to be identified that had no PFAS-contaminated drinking water or drinking water contamination from other chemicals above the U.S. Environmental Protection Agency’s maximum contaminant levels (MCLs). Personal identifier information (e.g., Social Security number, name, date of birth, sex) necessary for data linkage with the national death index and state and federal cancer registries could be obtained from the Defense Manpower Data Center. However, based on sample size considerations, ATSDR concluded that it is not feasible to conduct a mortality or cancer incidence study that is limited to the military service and civilian workers who were stationed or worked at the Pease Air Force Base. Such a study would require, in addition to the Pease

7
Air Force Base populations, several thousands of exposed populations from military bases where PFAS-contaminated drinking water occurred, as well as several thousands of comparison populations from military bases that did not have drinking water contamination. Conclusions The feasibility assessment concluded that it is possible to evaluate some health-related endpoints if a sufficient number of children and adults from the Pease population participate. Other health-related endpoints would require larger numbers of exposed individuals and would require the inclusion of populations from other sites who were exposed to PFAS-contaminated drinking water. The feasibility assessment concluded that a third study design, a mortality and cancer incidence study of former military service and civilian worker personnel, would not be feasible solely with the population at Pease. No single study of the Pease population will provide definitive answers to the community about whether their exposures to the PFAS-contaminated drinking water caused their health problems. All epidemiological studies of environmental exposures and health outcomes have limitations and uncertainties. Whether a study will find an association between an environmental exposure and health effects cannot be known prior to conducting the study. The ability of a study of the Pease population to provide useful information will depend to a great extent on the success of recruiting sufficient number of study participants. The feasibility of successfully evaluating particular health-related endpoints (or effect biomarkers) could change depending on final study design and goals.

8
Introduction This report describes the approach and the conclusions of the Agency for Toxic Substance and Disease Registry’s (ATSDR’s) feasibility assessment of possible drinking water epidemiological studies at the Pease International Tradeport (“Pease”), Portsmouth, New Hampshire. The purpose of the feasibility assessment was to determine whether epidemiological studies are reasonable to conduct at Pease and whether data exist to conduct scientifically credible epidemiological studies. This feasibility assessment report for possible future studies at Pease International Tradeport was distributed to the Pease Community Assistance Panel (CAP) for members’ review and input. Input from the CAP was intended to help ATSDR ensure the proposed research is relevant to community concerns. The report is not intended to be a protocol or systematic literature review. The final study design, including sample size, the health endpoints that can be considered and the development of the study protocol itself, including the statistical analysis approach have yet to be determined. The Pease CAP will have an opportunity to review and provide input on a draft of the study design before it is finalized. The feasibility assessment does not represent a commitment by ATSDR to conduct research at Pease International Tradeport, given that funding and staffing to conduct the described research are not available at this time. Three criteria were used to determine whether epidemiological studies are warranted at Pease:
1. Meaningful and credible results —a study should have sufficient validity and precision, be capable of detecting health-related effects, and be as responsive as possible to the community’s questions and concerns. Ideally, a study should also be capable of detecting health-related effects, for example a 20% to 100% increase in risk with sufficient statistical power (i.e., statistical power ≥80%). To achieve sufficient validity, a study should minimize biases such as selection bias and confounding bias. Sufficient precision can be achieved by a sample size that has at least 80% statistical power to detect health-related effect sizes observed in other studies for PFAS serum levels similar to those in the Pease population.
2. Scientific importance — a study should evaluate biologically plausible diseases and other
health-related endpoints (also called “effect biomarkers”) and improve our understanding of possible health effects of PFAS exposures and fill important data gaps. Evidence for the biological plausibility of a health-related endpoint can come from animal studies of PFAS exposures, information on how PFAS exposures cause adverse effects (i.e., mechanistic information), and epidemiological studies. Since PFHxS and PFOS serum levels were elevated in the Pease population compared to national data, a Pease study should focus on data gaps concerning the health effects of exposures to these chemicals. The feasibility assessment included a literature search of epidemiological studies of PFAS exposures to identify the health-related endpoints evaluated in these studies and the data gaps that exist on the health effects of PFHxS and PFOS.
3. Public health significance — a study should provide a basis for determining if PFAS exposures increase the risks for specific adverse health effects, and if so, what public health actions are necessary to reduce the risks. In particular, the study should provide a basis for early medical intervention for health outcomes that are not routinely evaluated in physical exams. The study should also be relevant to other populations with similar exposures.

9
In addition to the above criteria, a feasibility assessment must address specific questions:
1. Can the study population be enumerated and selected to minimize selection bias? (Selection bias occurs when the probability of selection is related both to exposure status and to disease status.)
2. Is there an appropriate comparison population? 3. Is there a complete exposure pathway, well-defined exposed population, and ability to assign
levels of exposure with adequate accuracy? 4. Is there justification for studying the specific health outcome(s) being considered? (e.g., is there
suggestive biological evidence? A finding in a previous study?) 5. Can the health effect(s) be validly ascertained or measured? 6. Is the exposed population sufficiently large so that risks can be estimated with precision? 7. Can information be obtained on other risk factors that need to be taken into account? 8. Can a study answer the questions of concern to the Pease community?
Site history The Pease International Tradeport is located in Portsmouth, New Hampshire. It contains over 250 companies employing more than 9,525 people. In 1993, companies began to operate at the Pease Tradeport. Two day-care centers are located at the Tradeport. One of the day-care centers estimated that about 695 children attended the center during 1996–2016. The other day-care center could not easily compile total enrollment statistics, but its capacity is 220 children, they usually enroll about 180–195 children at a time, and they have been operating for almost 7 years. As of July 2015, the estimated population of Portsmouth was 21,530 (http://www.census.gov/quickfacts/table/PST045215/3362900). According to the 2010 census, 4.7% were children younger than 5 years, 11.9% were children ages 6–17 years, 67.5% were adults ages 18–64 years, and 15.9% were adults ages 65 years and older. Additionally, 51.5% of the population were female, 91.5% were white, and 95.6% of persons ages 25 years and older were high school graduates. The area on which the Tradeport is located was originally built in 1951 as part of the Pease Air Force Base. In October 1989, 3,465 military personnel were assigned to the base, accompanied by 4,746 dependents. The Air Force estimated that 537 civilian employees worked on-base at that time (ATSDR 1999). During 1970–1990, an average of 3,000 personnel and their families were assigned to the base at any one time. Before 1970, the base supported a maximum of 5,000 personnel (ATSDR 1999). Three major supply wells provided drinking water to the base: the Haven, Smith, and Harrison wells. Before 1981, the wells fed directly into the distribution system so that a particular area of base would primarily receive water from the nearest well. After 1981, the water from the three wells were mixed together and treated before entering the distribution system. These same three supply wells provided drinking water to the Pease Tradeport after it opened. In 1977, water from the base wells was found to contain trichloroethylene (TCE). Two of the three wells serving the base were contaminated. The maximum concentrations of TCE measured in the Haven and Harrison supply wells were 391 micrograms per liter (µg/L) and 28.5 µg/L, respectively. After the discovery of the contamination, those wells were shut down and the city of Portsmouth supplied drinking water to the base during 1977–1978. In the fall of 1978, the wells were back in operation. TCE levels in the Haven well fluctuated between 50 µg/L and 115 µg/L from the fall of 1978 through January 1980, then fell below 50 µg/L, with an occasional spike above 50 µg/L through October 1980. From

10
November 1980 through July 1981, TCE levels averaged about 30 µg/L, then fell to around 10 µg/L from August 1981 through May 1983. Levels continued to decline, but did not remain consistently below the current U.S. Environmental Protection Agency (EPA) maximum contaminant level (MCL) in drinking water of 5 µg/L until January 1986 (ATSDR 1999). The base officially closed in October 1991, and most of the property was transferred to the Pease Development Authority (PDA). During 1993, the business and aviation industrial park began operation. The City of Portsmouth entered into a long-term lease and operation agreement with the PDA to operate and maintain the public water system serving the Tradeport. From approximately 1970 until the base closed, aqueous film-forming foam (AFFF) was used to extinguish and prevent flammable liquid fires. AFFF was also used during firefighting training at the base. Several perfluoroalkyl substances (PFAS) were used in the manufacturing of AFFF, including perfluorooctanoic acid (PFOA), perfluorooctane sulfonate (PFOS), and perfluorohexane sulfonate (PFHxS). AFFF containing PFAS likely leached into the soil and groundwater and migrated to the three supply wells serving the Pease Tradeport. It is not known when these wells were contaminated with PFAS, but it is possible that the contamination began before the opening of the Tradeport, when the Air Force base was still in operation. The Haven, Smith and Harrison wells have also served the Tradeport. In addition, the City of Portsmouth has the capability to supply water to the Tradeport via its main distribution system. Monthly pumping records for the three wells were provided by the City of Portsmouth, Department of Public Works. Up through 1999, the Haven well on average provided about 56% of the total water supply at the Tradeport, with the Smith well providing 44% and the Harrison well out of service. In 2000-2001, the Haven well supplied 88% of the supply and the Smith well supplied 12%. From 2003 until it was taken out of service in May 2014, the Haven well on average supplied about half the water supply. By 2006, the Harrison well was back in service and the Smith and Harrison wells together supplied on average about half of the water supply at the Tradeport. After May 2014, the Smith and Harrison wells supplied 56% of the Tradeport water supply and the City of Portsmouth provided the other 44%. In 2009, EPA established provisional health advisory levels for PFOS and PFOA of 0.2 µg/L and 0.4 µg/L, respectively [US EPA 2009]. In 2013, sampling of monitoring wells at the former Pease Air Force Base fire training areas detected PFOS and PFOA as high as 95 μg/L and 56 μg/L. In May 2016, EPA established a new lifetime health advisory for PFOS and PFOA that said the combined concentrations of PFOS and PFOA in drinking water should not exceed 0.07 µg/L [US EPA 2016a]. No drinking water health advisory level has been established for PFHxS or other PFAS chemicals. While the EPA has a lifetime health advisory for PFOS and PFOA, no federal regulatory standards for these contaminants have been issued. In April and May 2014, the three supply wells serving the Tradeport were sampled for PFAS. In the April sampling, the Haven well had PFOS, PFOA, and PFHxS levels of 2.5 µg/L, 0.35 µg/L, and 0.83 µg/L, respectively. In the May sampling, the Haven well had PFOS, PFOA, and PFHxS levels of 2.4 µg/L, 0.32 µg/L, and 0.96 µg/L. Other PFASs were also detected in the Haven well. The Harrison well had much lower levels of these contaminants with maximum PFOS, PFOA, and PFHxS levels of 0.048 µg/L, 0.009 µg/L, and 0.036 µg/L, respectively. The Smith well had maximum levels of PFOS and PFHxS of 0.018 µg/L and 0.013 µg/L, respectively, with an estimated level of PFOA of about 0.004 µg/L.

11
No samples of the Pease Tradeport distribution system for PFAS are available from the period when the Haven well was in operation. We can use a simple mixing model to estimate the PFAS levels in the distribution system, assuming that contamination concentrations are approximately uniform throughout the system. The model takes into account the pumping rates for each of the three wells, the total water demand, and the concentrations of PFAS in the wells during the April and May 2014 sampling. Using this simple approach, the estimated levels of PFOS, PFOA, and PFHxS in the Pease Tradeport distribution system in April 2014 would be approximately 1.4 µg/L, 0.2 µg/L, and 0.5 µg/L, respectively. In April 2015, the City of Portsmouth created a community advisory board (CAB) to address the PFAS contamination in the Tradeport drinking water. The CAB was established to act as a liaison between the affected community and the New Hampshire Department of Health and Human Services (NH DHHS), to represent the diverse views of the affected community, to review the blood testing conducted by NH DHHS, and to provide input into future direction of the blood testing program (CAB 2015). The CAB held 14 public meetings during May through December 1, 2015, and disbanded after issuing its final report of its activities on December 21, 2015. Among the recommendations of the CAB in its final report were the following:
1. Establish a community body to coordinate ongoing issues with ATSDR, NH DHHS, and the U.S. Air Force’s Restoration Advisory Board at Pease and to provide an effective mechanism for communication with all persons working or cared for at the Pease Tradeport.
2. A new community body should, along with its partner agencies, provide health education to the public regarding environmental chemical exposures and how exposures and risks can be reduced.
In February 2016, ATSDR began recruiting community volunteers to serve as members of a Pease community assistance panel (CAP). Technical advisors who could help CAP members in reviewing the scientific information on PFAS and proposed health activities were also recruited. The purpose of the CAP was to provide a mechanism for the community to participate directly in ATSDR’s health activities related to the exposures to the contaminated drinking water at the Tradeport. The CAP would provide input concerning possible health activities proposed by ATSDR. CAP members would also work with ATSDR to gather and review community health concerns, provide information on how people might have been exposed to hazardous substances, and inform ATSDR about ways to involve the community. The first public meeting of the CAP was held in May 2016 in Portsmouth. The second public meeting was held in September 2016. ATSDR has also convened monthly calls with the CAP.
Community concerns The final report of the CAB, issued on December 21, 2015, noted that “…the lack of any definitive information regarding the possible health effects of PFC [perfluorinated compound] exposure remains a source of frustration and concern.” [CAB 2015] The report concluded, “There is a great need to better understand what if any health effects might result for PFC exposure, and at what levels of exposure these risks might be manifested.” In an email sent to ATSDR in November 2015, the CAB asked that ATSDR consider the following question: “What, if any, long-term health effects, such as specific cancers, elevated blood lipids, thyroid function, immune function and developmental delays, are associated with the PFC exposure at Pease? This question should be broken down with regard to specific populations including children,

12
nursing/pregnant women, firefighters, and adult exposed workers.” This question was reiterated at the first in-person CAP meeting in May 2016. Some CAP members, as parents, were very concerned about the health of their children who were exposed at a critical, early age of development while attending the two day-care centers at the Pease Tradeport. They noted the lack of pediatric studies associated with PFAS exposure and wanted ATSDR to consider testing the exposed children for health endpoints such as lipids. CAP members also voiced concern about the exposed adult population, especially former military service personnel and civilian workers at the former Pease Air Force Base. Concern was also expressed for firefighters who were exposed to contaminated drinking water at Pease and also directly to AFFF as part of their firefighting duties. CAP members expressed their desire for a longitudinal approach (compared to a cross-sectional approach) to evaluate short-term and long-term health conditions, including cancers.
Exposure assessment Using the information currently available on PFAS concentrations in the supply wells during April and May 2014, supply well pumping data, the total demand in the system, and assuming that PFAS concentrations in the supply wells during the April–May 2014 sampling reflect historical concentrations (given the persistence of these chemicals in the environment), a simple but crude assessment of PFAS drinking water exposures could be conducted. However, to accurately estimate historical PFAS concentrations in the Haven, Harrison, and Smith supply wells and the distribution system they served, both during the operation of the Air Force base and the Tradeport, would require the following steps:
1. Obtain information on the locations and use of AFFF at the Air Force base, including accidental releases.
2. Model the migration of contaminants from the soil where AFFF was used or released to the groundwater and then to the supply wells.
3. Model the PFAS concentrations throughout the distribution system.
Historical reconstruction of PFAS concentrations in the drinking water distribution system would be needed to assess exposures to service personnel and civilian employees who were at the Air Force base during its operations, and to workers and day-care attendees at the Tradeport. Another important source of information on exposures at the Pease Tradeport was the NH DHHS PFAS blood testing program conducted during April–October 2015. A person was eligible for this program if he or she had worked at, lived on, or attended childcare at the Pease Tradeport or Pease Air Force Base, or lived in a home near the Pease Tradeport that was served by a PFAS-contaminated private well. A total of 1,578 persons volunteered to submit a blood sample for PFASs testing [NH DHHS 2016]. This was a convenience (or volunteer) sample, not a statistically based sample. Nevertheless, the testing program provided important information on the extent and magnitude of exposures to the PFAS-contaminated drinking water at the Pease Tradeport. Table 1 shows the serum concentrations of PFOS, PFOA, PFHxS, and perfluorononanoic acid (PFNA) for the 366 children younger than 12 years at the time of testing and comparison values from studies conducted in Texas [Schecter 2012] and California (Wu 2015). Data from the National Health and Nutrition Examination Survey (NHANES) are not available for children younger than 12 years.

13
NHANES testing for serum PFAS was restricted to those ages 12 years and older. The California study [Wu 2015] conducted a random sample of households in northern California and obtained blood samples from 68 children ages 2–8 years for PFAS analyses during December 2007–November 2009. The parents of the children had higher education levels than the general population. The Texas study [Schecter 2012] analyzed serum samples collected from 300 children ages ≤12 years at a children’s hospital during 2009. Whether the children in the Texas study were healthy or receiving treatment for illness was not reported. None of the California and Texas children were known to be exposed to PFAS-contaminated drinking water. The children in both studies were considered to be representative of general population exposures to PFAS via diet and consumer products. Table 1 shows that the median and geometric mean serum PFHxS and PFOS levels in the Pease children (ages <12 years) are considerably higher than background median and geometric mean levels seen in the Texas and California studies. For PFOA, the Pease children have slightly higher levels than the reference group in the Texas study, but lower than in the California study. However, the comparisons with Texas and California results might not be appropriate given the difference in sampling years. Nationally, serum levels of PFOS and PFOA have been declining sharply over time. For example, in the 1999–2000 NHANES cycle, the geometric mean serum PFOA level for persons aged ≥12 years was 5.2 µg/L. By the 2013–2014 cycle, it had declined to 1.9 µg/L. Serum PFOS declined even more sharply, from 30.4 µg/L during the 1999–2000 cycle to 5.0 µg/L in the 2013–2014 cycle. PFHxS also declined, but more gradually, from 2.1 µg/L during the 1999–2000 cycle to 1.3 µg/L in the 2013–2014 cycle. In the NHANES 2013–2014 cycle, children ages 12–19 years had geometric mean PFOA, PFOS, and PFHxS serum levels of 1.66 µg/L, 3.54 µg/L, and 1.27 µg/L, respectively. Therefore, the most appropriate PFAS comparison values for the Pease blood testing program would be serum levels obtained near in time to the Pease sampling (i.e., 2015). Such comparison values are not currently available. Table 2 shows the serum concentrations of PFOS, PFOA, PFHxS, and PFNA for the 1,212 participants ages 12 years and older at the time of testing and comparison values from NHANES for 2013–2014 (the most recent years data are currently available). Table 2 indicates that, similar to the children at Pease, the median and geometric mean serum levels of PFHxS and PFOS among those ages ≥12 years are considerably higher than those in the NHANES 2013–2014 cycle. The median and geometric mean serum PFOA among those at Pease were also slightly elevated compared with NHANES results. In analyses conducted by NH DHHS, geometric mean PFHxS serum levels were higher for persons who drank ≥4 cups of water per day compared to those who drank <4 cups per day. Of all the PFAS serum levels measured, water consumption had the strongest effect on PFHxS serum levels. In particular, water consumption had the highest effect on PFHxS serum levels among persons aged ≤19 years (β = 0.31, SE = 0.15, marginal effect = 36.4%). Geometric mean PFOS and PFOA serum levels were also higher among persons who drank ≥4 cups of water per day compared with those who drank <4 cups per day [NH DHHS 2016]. Linear trends were observed for geometric mean serum levels of PFOS, PFOA, and PFHxS and increasing time spent at the Pease Tradeport. The trend was strongest for PFOS and PFHxS [NH DHHS 2016].

14
Summary of literature review ATSDR reviewed published health studies to identify health-related endpoints that have been studied and the data gaps that exist, in particular, for the effects of PFHxS and PFOS. The literature review also was used to identify adverse effect sizes observed in the PFAS studies for PFAS serum levels similar to those found in the Pease population. The Appendix has a listing of the epidemiological literature on PFAS exposures and adult cancers, other adult diseases, and adverse outcomes in children. Tables 3 and 4 provide a summary. In these tables, a “+” indicates that at least one study had a finding for a specific PFAS chemical that suggests an increased risk of an adverse outcome (e.g., an odds ratio [OR] or risk ratio [RR] of ≥1.20), and a “*” indicates that no study has been conducted for that PFAS chemical. In these tables, an “I” indicates that the findings from studies have not suggested an increased risk for an adverse outcome (e.g., all odds ratios or risk ratios are <1.20) but the information is too limited to conclude that there is no association between the PFAS exposure and the adverse outcome. These tables are for illustrative purposes, to indicate where data gaps exist and therefore additional research may be needed. Tables 3 and 4, and the tables and descriptions of the studies in the appendix, should not be interpreted as implying causation or as an assessment of the weight of evidence for an association. Currently, epidemiological research on the health effects of PFAS exposures is at an early stage. This is particularly true for PFHxS in addition to PFAS chemicals other than PFOA and PFOS. However, even for PFOA and PFOS, additional research on all the health-related endpoints mentioned in these tables will be needed to provide sufficient evidence for causal assessments and to address community health concerns. Adult cancers and other adult diseases Based on its assessment of the epidemiological literature, ATSDR concluded that there was limited or no information concerning associations with PFAS exposures and most cancers and other adult diseases (Table 3). In particular, very few studies have evaluated PFHxS exposures and cancers and other adult diseases. Although more information is available for PFOS exposures and cancers and other adult diseases than for PFHxS exposures, the information is still very limited and therefore inadequate to determine whether PFOS exposures increase the risk for most of the adult diseases evaluated. Although more information is available on PFOA exposure, the information is still too limited to determine whether a causal association exists between PFOA and specific cancers and other adult disease. Therefore, additional research on the effects of PFHxS, PFOS, and PFOA would be needed to determine whether exposures increase the risk for many adult cancers and non-cancer diseases. Health effects in children There is some evidence that PFAS exposures are associated with decreased birth weight, small fetus size for gestational age, measures of intrauterine growth retardation, and preterm birth. In particular, two meta-analyses have found an overall decrease in birthweight associated with PFOA and PFOS [Verner 2015; Bach 2015]. However, the findings across studies are inconsistent for these outcomes and for

15
other adverse birth outcomes, and few studies have evaluated PFHxS. Several studies of infants have found that prenatal PFAS exposures affect thyroid function, but only two studies have evaluated thyroid function in older children. A few studies have found elevated uric acid with PFAS exposures, but the possibility of reverse causation cannot be ruled out. Four studies of PFAS exposures and testosterone and other sex hormones have been conducted. However, the findings have not been consistent across studies and further research is needed. Three of the studies did find that PFAS exposures decreased testosterone in boys or girls. There is some evidence from four studies that PFAS exposures might be associated with ADHD, but findings have not been consistent across studies. Evaluating the evidence for PFAS exposures and neurobehavioral outcomes is difficult for several reasons: 1) the studies used different methods to measure the outcomes, 2) studies are inconsistent in the outcomes evaluated, and 3) too few studies have been conducted. A few studies have found associations between PFAS exposures and a decline in antibody response to specific vaccines, but only two studies evaluated the same vaccine (i.e., rubella). In summary, there are considerable data gaps concerning the health effects in children of PFAS exposures. This is because of the small number of studies conducted, inconsistencies in methods and findings across studies, and limited sample sizes in some studies. As for other adverse outcomes, few studies have evaluated the effects on children of PFHxS exposures.
Sources of adverse outcome data for the Pease population The adverse outcomes of interest for PFAS exposure that can be ascertained from the birth certificate are pregnancy-induced hypertension, diabetes, small for gestational age (SGA), low birth weight, birth weight, preterm birth, and gestational age. Although the birth certificate has a checklist for congenital anomalies, the most reliable data on birth defects are provided by population-based birth defect registries. Birth defects registries exist in 41 states, including New Hampshire. The New Hampshire Birth Conditions Program (NHBCP), based at the Geisel School of Medicine at Dartmouth College, began collecting data on births occurring in-state to New Hampshire residents in 2003 (http://www.cdc.gov/ncbddd/birthdefects/states/newhampshire.html). Data reported on 46 different birth defects are ascertained for infants aged ≤1 year are collected through active surveillance methods. Congenital hypothyroidism data can be obtained from the newborn screening program. Newborn screening for congenital hypothyroidism is conducted in every state, including New Hampshire. The birth certificate has information on sex of the child, plurality, gestational and pre-pregnancy diabetes, previous preterm birth, parity and gravidity, cigarette smoking before and during pregnancy, principal source of payment for the delivery (a measure of socio-economic status), date of last pregnancy, date of last normal menses, date of first and last prenatal care visit and total number of prenatal care visits, race/ethnicity of the mother and father, education of the mother and father, parents’ names and address, mother’s marital status, labor and delivery complications, and whether the infant is being breastfed at discharge. The New Hampshire Division of Vital Records Administration collects information on births in New Hampshire from hospitals and midwives, birth certificates, and interstate exchange agreements for births occurring out-of-state to New Hampshire residents (http://www.dhhs.nh.gov/dphs/hsdm/birth/ ). Mortality information is available from the National Death Index (NDI) operated by the National Center for Health Statistics (NCHS), Centers for Disease Control and Prevention. Currently, 2014 data are complete and available for searches. “Early release data” for 2015 are ≥90% complete (98% complete for New Hampshire) and also available for searches. NDI “plus” provides information on cause of death (underlying, contributing and all other causes of death listed on the death certificate) and date and state of death based on death certificate data provided by the states. The NDI has data starting from 1979.

16
New Hampshire death certificate data are available from the New Hampshire Division of Vital Records Administration, which collects information on deaths of New Hampshire residents and deaths occurring in New Hampshire (http://www.dhhs.nh.gov/dphs/hsdm/death/index.htm). Information on deaths of New Hampshire residents that occur out-of-state is captured through interstate exchange agreements. Information on underlying cause of death and up to 14 contributing causes of death is collected. Complete data are available approximately 24–48 months after the close of a calendar year. Population-based cancer registries exist in all 50 states and Washington, DC. The New Hampshire State Cancer Registry (NHSCR) is a statewide, population-based cancer surveillance program that has collected incidence data on all cancer cases diagnosed or treated in the state since 1985 (http://geiselmed.dartmouth.edu/nhscr/). NHSCR, which is contracted to the Geisel School of Medicine at Dartmouth College, currently collects data from the larger hospitals in the state. NHSCR also receives case reports from physician practices, free standing radiation oncology centers, pathology laboratories and other sources. NHSCR staff assist hospitals with fewer than 100 cases per year with reporting. Through interstate data exchange agreements, NHSCR also receives case reports for New Hampshire residents who are diagnosed outside the state. The New Hampshire Uniform Hospital Discharge Data Set (UHDDS) collects discharge data from all health care facilities in the state (acute care hospitals, specialty hospitals, freestanding hospital emergency facilities, and walk-in urgent care centers), as required by law (http://www.dhhs.nh.gov/dphs/hsdm/hospital/index.htm). Discharge data from Maine, Massachusetts, and Vermont hospitals for New Hampshire residents are included in the UHDDS via interstate data exchange agreements. The dataset includes transfers of NH residents. Chronic diseases such as asthma, chronic obstructive pulmonary disease, angina, hypertension, congestive heart failure, hypoglycemia, and diabetes are included in the UHDDS. Limitations of this dataset are that discharges are not de-duplicated and one person with multiple admissions might falsely increase the number of persons hospitalized. Additionally, state law requires health care professionals to report information on chronic health conditions relating to children, infectious diseases, immunizations, and autism to NH DHHS (http://www.healthinfolaw.org/state-topics/30,67/f_topics). To ascertain autism or ADHD reliably, a review of school special education records and medical records from providers that conduct developmental evaluations of children or provide treatment is necessary. In Portsmouth, records are available from three elementary schools (serving grades K–5), one middle school (serving grades 6–8), and one high school (serving grades 9–12). Projected enrollment for the 2016–17 school year was 988 students in the elementary schools, 516 students in the middle school, and 1,183 students in the high school (http://cityofportsmouth.com/school/FY16BudgetBooklet.pdf). In school year 2015–2016, the Portsmouth Public Schools provided special education services to 416 students. Among those students, 121 (29.1%) had an orthopedic impairment, 36 (8.7%) had a speech/language impairment, 32 (7.7%) had a developmental delay, 25 (6.0%) had autism, 17 (4.1%) had an emotional disturbance, 11 (2.6%) had some other disability, and 174 (41.8%) were classified as having a “specific learning disability.” Various studies have focused on West Virginia and Ohio residents and workers exposed to PFOA from a chemical plant (the “C8” studies) [Frisbee 2009]. In a C8 study that evaluated ADHD, affected persons were identified via questionnaire, which included a question requesting information on medications used [Stein 2011]. For chronic diseases, the C8 studies relied primarily on self-reported information from questionnaires with attempted confirmation of self-reports by obtaining medical records.

17
Sources of exposure data An important source of exposure information is PFAS biomonitoring. Measuring serum levels of PFAS chemicals provides information on the amount of these chemicals that has entered the body from all sources. At Pease, 1,578 persons volunteered to submit blood samples for PFAS analyses during the NH DHHS biomonitoring program in 2015. In the C8 study, blood samples for PFAS analyses were obtained from 66,899 persons during the 13-month baseline period, 2005–2006 [Frisbee 2009]. Biomonitoring for PFAS is useful in estimating past exposures, given the long half-lives of PFOS (approximately 5.4 years) and PFHxS (approximately 8.5 years). Although biomonitoring integrates PFAS exposures from all sources, including diet and consumer products, PFAS levels in serum from populations exposed to PFAS-contaminated drinking water will mostly reflect the drinking water exposures, unless the person is or was also exposed occupationally (e.g., firefighters, PFAS manufacturing workers). The use of PFAS biomonitoring in epidemiological studies has some limitations. A key limitation is the issue of “reverse causation,” in which the disease under investigation (e.g., kidney disease or kidney function) affects the elimination of PFAS in the body, causing higher serum levels of PFAS. Other problems include potential confounding by a factor that is both a risk factor for the disease of interest and a factor influencing serum PFAS levels (e.g., parity in the evaluation of adverse birth outcomes). Another limitation is that biomonitoring results, by themselves, might not provide sufficient information to estimate historical exposures. Estimating historical exposures is necessary to assess cumulative exposure and to characterize periods of special vulnerability to PFAS exposures, such as prenatal or early childhood exposures. Modeling methods are used to reconstruct historical PFAS serum levels. The results of PFAS biomonitoring can be used to validate estimates of PFAS serum levels obtained from modeling. C8 researchers have successfully used physiologically based pharmacokinetic modeling of absorption, distribution, metabolism, and excretion of PFOA in the body in conjunction with drinking water contaminant levels, estimates of water intake, and residential history to predict historical and current PFOA serum levels [Shin 2011]. Researchers have also been able to simulate PFOS serum levels using information on drinking water levels and PBPK modeling [Loccisano 2011]. Therefore, reconstruction of historical PFOS serum levels is also feasible. However, reconstruction of PFOA and PFOS serum levels is limited by various uncertainties. These include lack of accurate information on individual consumption of drinking water and length of time exposed and limited information on factors that produce inter-individual variability (e.g., gender, age) and pre-existing medical conditions (e.g., compromised renal function) [Loccisano 2011]. Nevertheless, the ability to predict serum PFOS and PFOA levels based on drinking water contamination levels can substitute for, and enhance, the information provided by PFAS biomonitoring. Issues concerning cross-sectional study designs Cross-sectional studies are especially suitable for assessing effect biomarkers and the prevalences of nonfatal diseases, in particular, diseases with no clear point of onset [Checkoway 2004]. However, if the cross-sectional study concurrently measures the exposure and the outcome (i.e., the disease or effect biomarker), then it might be difficult to determine whether the exposure caused the outcome or whether the outcome influenced the measured exposure level [Flanders 1992, 2016]. For example, as discussed above, the concurrent measurement of serum PFAS levels and kidney function biomarkers might raise the question of “reverse causation” because kidney function can affect the levels of PFAS in serum. This

18
issue can be addressed by estimating exposures based on the historical reconstruction modeling of serum PFAS levels. In addition, it might be possible to estimate exposures during critical vulnerable periods (e.g., in utero exposure) through the modeling of historical serum PFAS levels. However, the modeling of historical PFAS serum levels is subject to uncertainties and data limitations, as discussed above, and published methods are available only to model serum levels of PFOA and PFOS. Other issues concerning cross-sectional study designs are similar to those that confront other observational study designs, such as cohort studies. These issues include: 1) the ability to clearly define, enumerate and recruit (without introducing selection bias) the exposed and comparison populations, 2) the comparability of the exposed and comparison populations on risk factors other than the PFAS exposures, 3) accurate exposure assessment, and 4) accurate measurement of effect biomarkers and ascertainment of diseases. Based on its review of the literature, ATSDR concludes that several health-related endpoints could be considered for studies of the Pease population. It is also clear that exposures to the PFAS-contaminated drinking water have occurred in the Pease population, as documented by the observed serum PFAS levels in the NH DHHS PFAS blood testing program. Therefore, it is reasonable to conduct epidemiological studies of the Pease population. However, whether it is feasible to study a specific health-related endpoint depends to a great extent on the size of the exposed population that can be recruited into a study. The usual approach to determine the necessary size of the study population for each health-related endpoint is to conduct sample size calculations. All epidemiological studies of environmental exposures and health outcomes have limitations and uncertainties. Whether a study will find an association between an environmental exposure and health effects cannot be known prior to conducting the study. No single study of the Pease population will provide definitive answers to the community about whether their exposures to the PFAS-contaminated drinking water caused their health problems. The ability of a study of the Pease population to provide useful information will depend to a great extent on the success of recruiting a sufficient number of study participants.
Feasibility of an epidemiological study of children at the Pease Tradeport The first population that ATSDR considered for an epidemiological study was the children who attended the two day-care centers at the Pease Tradeport. One reason to focus on children is that they are more vulnerable to environmental exposures, in particular exposures to potential endocrine-disrupting chemicals. In addition, there is serious concern in the community about the possible health effects to children from the drinking water exposures, which was conveyed to ATSDR by the Pease CAP. Finally, a study of children who attended daycare at the Pease Tradeport is the most feasible epidemiological study to conduct. The population is less transient than an adult population and the adverse health endpoints of interest do not require as large a sample size as adult chronic conditions. The public health significance of conducting a study of these children consists of 1) the possibility of early intervention if early signs of adverse health effects, including developmental delays, are observed and 2) the relevance of a study at Pease for other populations exposed to drinking water primarily contaminated with PFOS and PFHxS. A study of children at Pease would have scientific importance because of key data gaps concerning PFAS exposure effects on sex hormones and on neurobehavioral,

19
immunological, and thyroid function. Animal studies support the biological plausibility of immune effects. Animal data also suggest that PFAS might be developmental neurotoxicants that can alter cognitive function and reduce learning ability. PFAS also have endocrine-disruptive properties and could interfere with thyroid function and sex hormones. A study of children at Pease would be responsive to the community’s concerns and has the potential (from the perspective of statistical power) to provide meaningful and credible results for some of the adverse outcomes of interest. However, a study limited to the population of children who attended the Pease Tradeport day-care centers would likely not be sufficiently large for some of the possible adverse outcomes of interest (e.g., higher prevalences of rare diseases or very subtle changes in biomarkers of effect that have been observed in research conducted elsewhere). A. Study population The population of interest could be persons who attended day care at the Pease Tradeport before June 2014 and are in the age range of 4−17 years at the start of the study. The end of the period was selected because the Haven well was taken out of service in May 2014. Because PFAS-contaminated drinking water exposures could occur to children in utero and during breastfeeding if the mother worked at the Pease Tradeport, the study would include these additional children if the exposures began prior to June 2014 and their ages are 4 – 17 years at the time the study begins. The age range for the Pease children study was determined by taking into account the age ranges in previous PFAS studies and the age range appropriate for the candidate endpoints. Previous epidemiological studies of children exposed to PFAS included varying age ranges. Because of data limitations (i.e., no PFAS serum data for those aged <12 years), the studies that used NHANES data evaluated those aged 12–18 years or 12–19 years. Some of the C8 studies limited participant ages to those <12 years; other C8 studies included persons up to 18 years of age. The upper age limit for many of the Taiwan children studies of PFAS was 15 years. An age range of 4–17 years would overlap the age ranges in these studies. The chosen age range also reflected the focus of the study (i.e., children exposed to the PFAS-contaminated drinking water while attending daycare at the Pease Tradeport). The younger age limit of 4 years was chosen because intelligence quotient (IQ) testing is available for those aged 4 years and older. (For example, the Wechsler Preschool and Primary Scale of Intelligence test has an age band of 4 years to 7 years, 7 months that overlaps the Wechsler test for those aged 6–16 years.) The Strengths and Difficulties Questionnaire (SDQ), a behavioral screening questionnaire used in a Faroes study [Oulhote 2016], a Taiwan study [Lien 2016] and a Danish study [Fei 2011] has an age range of 4 – 16 years. The upper age limit of 17 years was chosen for three reasons:
1. Age at puberty was a candidate endpoint and virtually all of the children in a C8 study achieved puberty by age 17 years.
2. The IQ and SDQ testing instruments for children can be used for those aged ≤17 years.
3. Children aged >17 years would have been last exposed (i.e., last attended daycare) more than 10 years ago.

20
Table 5 provides the data on serum PFOS, PFOA, and PFHxS for the 379 children who participated in the 2015 NH DHHs testing program at Pease and who were aged 1–14 years at the time of blood draw. These children would be aged 4–17 years in 2018. The geometric mean serum PFHxS in these children was 3.75 µg/L, approximately three times higher than the serum levels reported in the Texas [Schecter 2012] and California [Wu 2015] studies and in the NHANES data for 2013–2014. We currently do not know how many children attended daycare at the Pease Tradeport before June 2014 and who would be in the 4–17 years age range in 2018. The Discovery Child Enrichment Center is located at the Pease Tradeport and began operation in 1994. Its yearly enrollment is approximately 149 children ages 6 weeks to 5 years. Computerized records at this day-care center start in 1996. A preliminary records search by the director of the Discovery Child Enrichment Center identified 695 children who attended the daycare during 1996–2015 and who would be aged of 6–18 years in 2018. Based on the results of this search, the number of children who attended this day care prior to June 2014 and would be between the ages of 4 and 17 years in 2018 could be within the range of 250 – 450 individuals. The Great Bay Kids’ Company is also located at the Pease Tradeport and began operation in 2010. Its annual enrollment is approximately 270 children aged ≤12 years. Assuming that most of the children enrolled would be ≤5 years of age, and that most of the children attend daycare for 4 years, about 300 children might have attended this daycare during the period of interest and would be aged 4–17 years in 2018. Assuming that a minimum of about 500 children attended the two day-care centers at Pease before June 2014 and would be aged 4–17 years in 2018, and assuming a reasonable participation rate of 70%, it would be possible to recruit 350 Pease children into the study. It would also be feasible to recruit at least 175 children in the same age range from the public schools in Portsmouth, NH, who were unexposed to the PFAS-contaminated drinking water at the Pease Tradeport and whose parents did not work at the Pease Tradeport or have occupational exposures to PFAS. It is reasonable to assume that participation rates would be high because of strong interest in the community concerning the Pease Tradeport situation. Moreover, the Pease CAP members have pledged to support recruitment efforts if and when a study is to be conducted. Pease CAP members have strong ties and are active in the Portsmouth community. If the actual number of children who attended the two day-care centers prior to June 2014 and would be aged 4 – 17 years in 2018 is in the range of 650 – 750, then as many as 500 children could be recruited from the Pease population. It should also be possible to recruit at least 250 children in the same age range from the Portsmouth public schools for the unexposed group. A sample size of 350 exposed children and 175 unexposed children would be similar to the sample sizes used in the Faroes study [Grandjean 2012, 2016] and in a C8 study of 320 exposed children [Stein 2013, 2014b]. However, the sample size of 350 exposed and 175 unexposed would be considerably smaller than most of the C8 children studies and some of the other epidemiological studies of children exposed to PFAS. Therefore, a total of 525 children, 350 exposed and 175 unexposed, should be considered a minimum sample size, and attempts should be made to recruit a higher number of exposed and unexposed children to improve the statistical power of the study.

21
B. Study Hypotheses As indicated in the literature review summary, the scientific literature has little information on the health effects of exposures to PFHxS. PFHxS is a key contaminant associated with the use of AFFF for firefighting training and extinguishing flammable liquid fires. The study would be an important contribution in filling this data gap and would generate knowledge relevant to other populations exposed to drinking water contaminated by PFHxS from the use of AFFF. In addition, few studies have been conducted to evaluate possible associations between childhood exposures to PFASs and effects on thyroid function, uric acid and sex hormone levels, delays in reaching puberty, IQ, and immune function. Inconsistent findings have been observed for most of these endpoints, likely in part because of differences in exposures (e.g., drinking water and other sources, such as diet) and PFAS levels of exposure, study population differences (e.g., age differences), and differences in methods. Moreover, few studies have evaluated the same neurobehavioral or immune endpoint. The study would address these issues by using methods and evaluating health effects similar to those used in previous studies of PFAS exposures in children, in particular, methods used in the C8 studies. Based on the literature review, the following hypotheses could be evaluated:
1. Higher serum levels of PFOA, PFOS, or PFHxS are associated with higher total cholesterol, low-density lipoprotein, and triglycerides, and higher prevalence of hypercholesterolemia.
2. Higher serum levels of PFOA, PFOS, or PFHxS are associated with differences in thyroid stimulating hormone (TSH), TT4, and TT3, and a higher prevalence of hypothyroidism.
3. Higher serum levels of PFOA, PFOS, or PFHxS are associated with a higher level of uric acid and a higher prevalence of hyperuricemia.
4. Higher serum levels of PFOA, PFOS, or PFHxS are associated with higher levels of cytokeratin-18 (CK-18), a biomarker for fatty liver disease.
5. Higher serum levels of PFOA, PFOS, or PFHxS are associated with differences in testosterone, estradiol, and sex hormone-binding globulin (SHBG).
6. Higher serum levels of PFOA, PFOS, or PFHxS are associated with delayed puberty.
7. Higher serum levels of PFOA, PFOS, or PFHxS are associated with lower IQ.
8. Higher serum levels of PFOA, PFOS, or PFHxS are associated with ADHD behaviors and learning problems.
9. Higher serum levels of PFOA, PFOS, or PFHxS are associated with a higher prevalences of hypersensitivity-related outcomes (e.g., asthma, rhinitis infectious diseases).
10. Higher serum levels of PFOA, PFOS, or PFHxS are associated with lower antibody responses to rubella, mumps, and diphtheria vaccines.

22
C. Recruitment and Consent Based on sample size calculations (see Appendix), a minimum of 350 exposed children aged 4–17 years who attended the day-care centers at Pease before June 2014 would need to be recruited. To recruit the children who participated in the blood testing program, NH DHHS would have to send letters to the parents to ask that their child participate in the study. Additional children who were exposed to the contaminated drinking water while attending the two day-care centers could be recruited via outreach to the two day-care centers at Pease, the Portsmouth public schools, media, and community organizations in the Portsmouth area. The Pease CAP has also offered to assist in recruitment, and CAP involvement will be crucial in achieving high participation rates. A minimum of 175 children aged 4–17 years, who were unexposed to the PFAS-contaminated drinking water at the Pease Tradeport and whose mother did not work at the Pease Tradeport (or in an occupation that involved PFAS exposure) during the pregnancy and breastfeeding of the child would be recruited from the Portsmouth, NH, public schools. Before enrollment in the study, the child’s mother would be interviewed to determine whether the child is eligible for the study. Recruitment would involve outreach to the eight day-care centers in Portsmouth that were located outside the Pease Tradeport, the Portsmouth public schools, media, and community organizations. The Pease CAP has offered to help with the recruitment effort. The total enrollment of Portsmouth’s elementary, middle, and high schools is projected to be 2,687 in 2016–17. To encourage participation of exposed and unexposed children, an appropriate incentive would be provided. The Pease blood testing program’s consent form was strictly limited to the use of the participant’s blood sample for PFAS analyses only. The participant also consented to complete a brief questionnaire at the time of blood draw concerning demographic information, time at Pease Tradeport, and consumption of drinking water. The consent form did not mention the use of the blood sample for research purposes or the possibility of re-contacting the participant for future studies. Moreover, the amount of blood drawn from the children was only sufficient for the PFAS analyses. Therefore, ATSDR cannot directly contact the participants in the Pease blood testing program to recruit them for a children’s study. In addition, these participants must sign a new consent form to participate in a research study. A parent of each child would be asked to sign a parental permission form requesting a blood sample (about 4 teaspoons or 20 mL) from the child for the analyses of PFASs and the effect biomarkers (i.e., lipids, TSH, uric acid, sex hormones, and immune function parameters). The consent form would also ask that the child be administered the Wechsler Abbreviated Scale of Intelligence (IQ) tests if aged 6 years or older or the Wechsler Preschool and Primary Scale of Intelligence for children younger than 6 years. The consent form would ask permission to access the child’s school records, including special education records. The parent would be asked to sign a consent form to complete a questionnaire. Children ages 7 years and older would be asked to give their assent to participate in the study. D. Questionnaire The parents of the child participant could be asked to complete the questionnaire. The questionnaire could obtain demographic information, medical history of the parents and child, the child’s medications, the dates the child’s mother worked at the Pease Tradeport (or in other occupations involving PFAS exposures) and her reproductive history, the dates the child attended daycare at the Pease Tradeport, water consumption of the mother and child while at Pease Tradeport (including use of water for formula,

23
juices, etc.) if applicable, bottled water consumption by the mother and child, length of time the child was breastfed, parental information (e.g., education, primary occupation, maternal age at birth of the participating child), the child’s height and weight, and whether the child regularly exercises, currently smokes (and the number of cigarettes/day), or consumes alcohol (and the number of drinks/week). Specific questions could be included in the questionnaire that address health outcomes of interest based on the final study design. For example, for ADHD, the questionnaire could ask, “Has a doctor or health professional ever told your child that your child has/had ADD or ADHD?” If the answer is “yes,” a second question could ask for a list of medications being used for the condition. Parents would also be asked if the child had learning or behavioral problems, and if so, the type of problem and the treatment being used. Questions would be included for the hypersensitivity-related outcomes, asthma, atopic dermatitis (or atopic eczema), and allergies. Information on the child’s vaccination history would also be requested from the parents. The parents would also be asked when the female child first began to menstruate. E. Biomarkers of exposure and effect The following biomarkers of lipids, thyroid function, kidney function, sex hormones, nonalcoholic steatohepatitis (fatty liver), and immune function could be analyzed in the serum:
• Total cholesterol, low density lipoprotein, high density lipoprotein, total triglycerides • Thyroxine (T4), T3, thyroid stimulating hormone (TSH) • Uric acid, creatinine • Cytokeratin-18 (CK-18) fragment levels (fatty liver disease) • Testosterone, estradiol, sex hormone-binding globulin (SHBG), follicle stimulating hormone,
insulin-like growth factor • Immunoglobulin G (IgG), IgA, and IgM; antibodies to measles, mumps, rubella, tetanus, and
diphtheria Approximately 4 teaspoons of blood (20 mL) could be drawn from each participant to be analyzed for the standard panel of PFAS compounds and the effect biomarkers. An attempt would be made to obtain an 8-hour fasting blood sample. The parents could be asked how long the child fasted before the blood draw. The cut points of 50 ng/dL of total testosterone and 20 pg/mL of estradiol would be used to identify sexual maturation in boys and girls, respectively. IgG antibodies for measles, rubella, and diphtheria would be analyzed to determine vaccine responses. Allergen-specific IgE (mold, dust mites, dog, cat, cow’s milk, peanut, hen’s egg, and birch) could be analyzed. Serum levels of thyroid stimulating hormone (TSH) and total T4 could be analyzed separately and also used to determine clinical and subclinical hypothyroidism. Uric acid, total cholesterol, low-density and high-density lipoprotein, and triglycerides could be analyzed. For children older than 6 years, the Wechsler Abbreviated Scale of Intelligence could be administered to the child to assess verbal IQ, performance IQ, and full-scale IQ. For children aged 4–6 years, the Wechsler Preschool and Primary Scale of Intelligence would be administered. For each child, school records, including special education records could be reviewed to identify learning problems and behavioral problems. The SDQ could be administered to parents to assess emotional, conduct, and peer relationship problems as well as problems with hyperactivity and inattention.

24
F. Exposure Assessment As stated earlier, the analyses by NH DHHS of the data from the blood testing program at Pease indicated that geometric mean PFHxS serum levels were higher for persons who drank ≥4 cups of water per day than for those who drank <4 cups per day. The strongest finding was for serum PFHxS in participants aged 0–19 years and water consumption (β = 0.31, SE=0.15, marginal effect=36.4%). Geometric mean PFOS and PFOA serum levels were also higher among those who, while at the Tradeport, drank ≥4 cups of water per day than for those who drank <4 cups per day [NH DHHS 2016]. Although these findings are based on a “convenience sample” (or a “volunteer sample,” i.e., not a statistically-based sample), it is clear from these results that consumption of PFAS-contaminated drinking water at the Pease Tradeport was a complete exposure pathway. Study participants could submit blood samples for PFAS and biomarker analyses during 2018. For those who participated in the 2015 blood testing program, these measurements would be used to assess their exposures. For those who did not participate in the 2015 blood testing program but who attended daycare at the Pease Tradeport during January 2008–May 2014, the PFAS serum levels obtained in 2018 could be used to estimate serum levels during 2015 by adjusting for PFAS elimination rates and taking into account background PFAS exposures. For those who consumed drinking water from the Pease Tradeport after the Haven well was taken out of service, the adjustment could also take into account the PFAS levels in the drinking water after May 2014. The 2015 (estimated or measured) PFAS serum levels and 2018 measured PFAS serum levels would be used in the analyses. No water samples from the Pease Tradeport distribution system for PFAS testing are available before 2014. Using a simple mixing model that takes into account the pumping rates for each of the three wells, the total water demand, and the concentrations of PFAS in the wells during the April and May 2014 sampling, we can estimate historical PFAS levels in the distribution system, assuming that contamination concentrations are approximately uniform throughout the distribution system and assuming that the contamination was present at least from 2008 through May 2014. To estimate serum levels of PFOA and PFOS over the child’s life, the historical estimates of the drinking water contamination could be combined using PBPK modeling with information from the questionnaires on 1) the dates and length of time the child attended daycare at the Tradeport and the child’s consumption of drinking water at the daycare and 2) whether the child’s mother worked at the Pease Tradeport during pregnancy and during the period of breastfeeding and the length of the period when the child was breastfed. PBPK modeling estimates would also incorporate information from NHANES and from the PFAS serum levels of the unexposed comparison group to estimate background levels of PFAS in serum. For those children whose mothers worked at the Pease Tradeport, estimates of the mother’s serum levels during the pregnancy and breastfeeding of the child would be needed. If the mother participated in the 2015 blood testing program at Pease, her measured PFAS serum levels could be used in the modeling. Children’s serum levels from the 2015 NH DHHS Pease blood testing program and serum levels obtained for this study would be used to calibrate the PBPK models. No human PBPK model for PFHxS is currently available. However, correlation coefficients for serum PFHxS and serum PFOS and PFOA were quite high among persons ages 2–14 years who participated in the 2015 testing (Pearson correlation for PFHxS was 0.75, and for PFOS and PFOA was 0.73). Therefore, it might be possible to predict historical serum levels of PFHxS based on historical estimates for serum PFOA and PFOS.

25
G. Sample Size The sample size for the Pease children study should include at a minimum 350 exposed children. It should also include a minimum of 175 unexposed children randomly sampled from the Portsmouth public schools with frequency matching to the exposed children on age, sex, and race. This minimum sample size is based on several considerations. First, 379 children ages 1–14 years participated in the 2015 blood testing at Pease. That would be about a 75% participation rate, assuming that a minimum of 500 children attended daycare at Pease and would be in that age range in 2015. It should be possible to recruit a similar percentage of the children who attended daycare at Pease. However, children who did not participate in the 2015 blood testing would have to be recruited, as well as a high percentage of those who did participate. Second, some studies conducted of PFAS exposure and children had similar or smaller sample sizes than the 350 exposed and 175 unexposed children at Pease (e.g., Zeng [2015] and Qin [2016] in Taiwan, Grandjean [2012] in the Faroes, Stein [2013] in a C8 study of neurobehavioral effects, Hoffman [2010] in a NHANES study), but had sufficient statistical power to observed findings to achieve statistical significance. Finally, sample size calculations conducted for this feasibility assessment indicated that at least some of the health-related endpoints of interest could be evaluated, with sufficient statistical power (i.e., statistical power ≥80%) to detect effects of exposure that are equal to or greater than those listed in Tables 6a and 6b as well as effects observed in other PFAS studies that occurred at PFAS serum levels similar to those in the Pease children population. Sample size calculations were conducted using four different combinations for type 1 error (α error or false positive error) and type 2 error (β error, false negative error, or 1 – statistical power):
1. Type 1 error = 0.05 (corresponds to a two-tail hypothesis test using a p-value cutoff of 0.05, or a 95% confidence interval, to determine statistical significance) and a type 2 error = 0.05 (corresponding to statistical power of 95%).
2. Type 1 error = 0.05 and type 2 error = 0.20 (80% power).
3. Type 1 error = 0.10 (corresponds to a one-tail hypothesis test using a p-value cutoff of 0.05, or a 90% confidence interval, to determine statistical significance) and a type 2 error = 0.10 (90% power).
4. Type 1 error = 0.10 and type 2 error = 0.20 (80% power). (Note: Setting the type 1 and type 2 errors to be equal indicates an equal concern for false negatives and false positives and could be justified from a public health perspective.) Table 6a indicates the minimum effect sizes that can be detected with a sample size of 350 Pease children and 175 unexposed children from the Portsmouth area using the four combinations of type 1 and type 2 errors. Table 6b also includes the minimum effect sizes that can be detected with a sample size of 500 exposed and 250 unexposed. These minimum effect sizes assume a simple comparison between the exposed and unexposed children that is not adjusted for possible confounding risk factors or stratified into smaller exposure groupings (e.g., low, medium, and high exposure). Another approach to sample size calculations that might be informative was to fix the minimum detectable effects to the effect sizes observed in previous studies for PFAS serum levels similar to those observed in the Pease population, select the type 1 and type 2 error rates, and allow the sample size to

26
“float” instead of the minimum detectable effect. However, this approach is problematic because there are few studies of PFAS exposures and the childhood outcomes being considered for the Pease children study. In some instances, studies evaluating similar PFAS serum levels obtained very different effect sizes for the same outcome. In other instances, a study with a lower PFAS serum level obtained a higher effect size for an outcome than a study with a higher PFAS serum level. Moreover, there are no studies of children exposed to PFAS drinking water contamination as a result of AFFF use. Therefore, there is much uncertainty about the effect size for each health-related endpoint that would be expected for PFAS serum levels observed among the Pease children. With these caveats, the following sample size per stratum calculations use the findings from studies of PFAS-exposed children. (Note: a sample size of 500 per stratum means that the study would need 500 exposed and 500 unexposed children. If the goal is to compare an outcome by exposure quartiles, then each quartile would need 500 children. Also, a 2:1 ratio of exposed to unexposed requires a larger total sample size than a 1:1 ratio of exposed to unexposed.) Table 6c provides a summary of the sample size considerations for each health-related endpoint.
Lipids Mean Total Cholesterol, LDL, HDL, triglycerides: In the Taiwan study of lipids (Zeng 2015), the sample size of 225 children aged 12-15 was sufficient to detect total cholesterol and LDL differences of 11-12 mg/dL for PFOA serum levels similar to Pease. Table 6 indicates that with a sample size of 350 exposed and 175 unexposed, much lower mean differences in total cholesterol could be detected with sufficient statistical power. However, the observed PFOA OR of 1.2 for hypercholesterolemia would have required a sample size of over 1,700 per stratum with a type 1 error of 0.10 and 80% power (using the prevalence of hypercholesterolemia in this study of 28.4%). Using a lower type 1 error and/or higher statistical power would require even larger sample sizes to detect an OR of 1.2 for hypercholesterolemia. The serum levels of PFOA and PFOS among the children at Pease would put them in the first quartile (i.e., the reference level) if they had been in the C8 study (Frisbee 2010). In the lower PFOA and PFOS quartiles, the ORs for hypercholesterolemia were between 1.2 and 1.3, requiring sample sizes of 800 – 1660 per stratum with type 1 error of 0.10 and 80% power (using the prevalence of hypercholesterolemia in this study of 34.2%). The strongest findings in this study for total cholesterol were observed for the top quintile of PFOS serum levels. When the top quintile PFOS serum level was compared with the reference level, the mean difference in total cholesterol was 8.5 mg/dL and the OR for hypercholesterolemia was 1.6. Both of these findings are within the range that could be detected with sufficient statistical power in a Pease study with 350 exposed and 175 unexposed children. However, the top quintile for PFOS in the C8 study contained serum levels several times higher than serum levels in the top quintile of the Pease children. A study using NHANES data for 1999–2008 [Geiger 2014] observed a mean difference in total cholesterol of 4.7 mg/dL for the 2nd tertile serum levels of PFOA compared with the reference level. The 2nd tertile serum levels of PFOA in this study correspond to the PFOA serum levels among children at Pease. To calculate a sample size to detect this mean difference, a standard deviation of 28 mg/dL (similar to the standard deviations for total cholesterol in the Taiwan and C8 study) was used. With type 1 error of 0.10 and 80% power, the sample size required to detect a mean difference of 4.7 mg/dL would be 439 per stratum (or with an exposed to unexposed ratio of 2, as suggested for the Pease children study, 660 exposed and 330 unexposed would be required). In the NHANES study, the 2nd tertile PFOS serum levels corresponded to the PFOS serum levels among Pease children. The mean difference in total
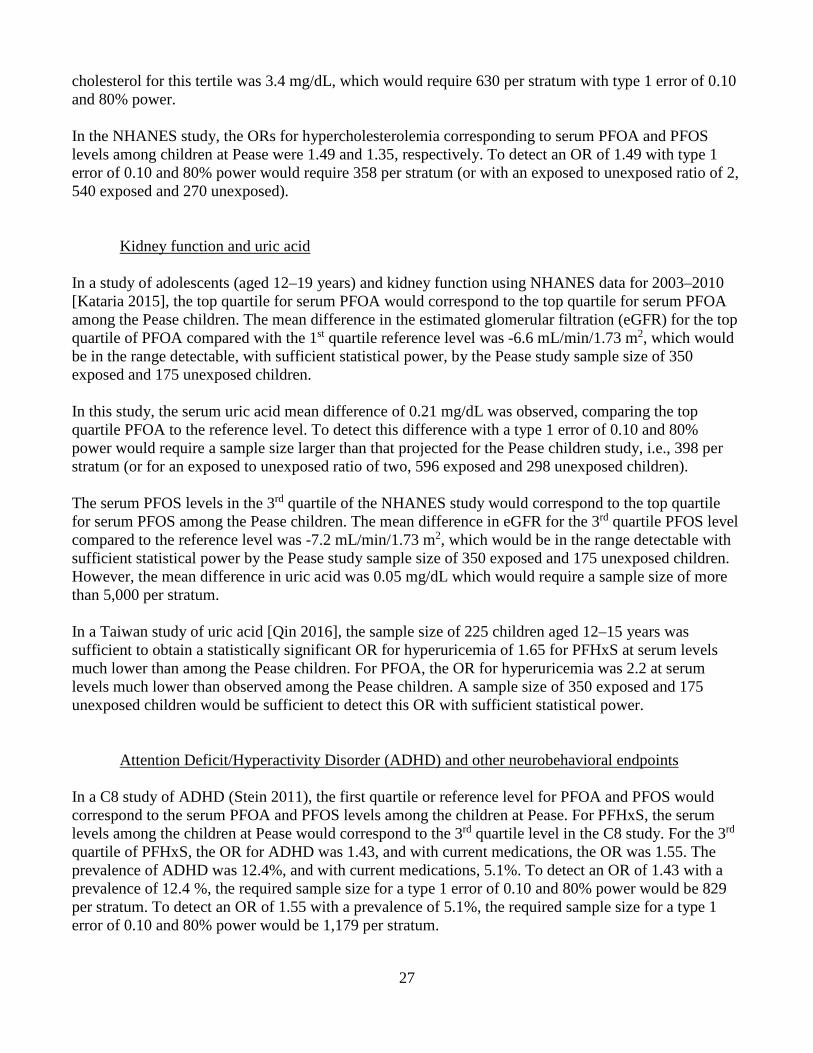
27
cholesterol for this tertile was 3.4 mg/dL, which would require 630 per stratum with type 1 error of 0.10 and 80% power. In the NHANES study, the ORs for hypercholesterolemia corresponding to serum PFOA and PFOS levels among children at Pease were 1.49 and 1.35, respectively. To detect an OR of 1.49 with type 1 error of 0.10 and 80% power would require 358 per stratum (or with an exposed to unexposed ratio of 2, 540 exposed and 270 unexposed).
Kidney function and uric acid In a study of adolescents (aged 12–19 years) and kidney function using NHANES data for 2003–2010 [Kataria 2015], the top quartile for serum PFOA would correspond to the top quartile for serum PFOA among the Pease children. The mean difference in the estimated glomerular filtration (eGFR) for the top quartile of PFOA compared with the 1st quartile reference level was -6.6 mL/min/1.73 m2, which would be in the range detectable, with sufficient statistical power, by the Pease study sample size of 350 exposed and 175 unexposed children. In this study, the serum uric acid mean difference of 0.21 mg/dL was observed, comparing the top quartile PFOA to the reference level. To detect this difference with a type 1 error of 0.10 and 80% power would require a sample size larger than that projected for the Pease children study, i.e., 398 per stratum (or for an exposed to unexposed ratio of two, 596 exposed and 298 unexposed children). The serum PFOS levels in the 3rd quartile of the NHANES study would correspond to the top quartile for serum PFOS among the Pease children. The mean difference in eGFR for the 3rd quartile PFOS level compared to the reference level was -7.2 mL/min/1.73 m2, which would be in the range detectable with sufficient statistical power by the Pease study sample size of 350 exposed and 175 unexposed children. However, the mean difference in uric acid was 0.05 mg/dL which would require a sample size of more than 5,000 per stratum. In a Taiwan study of uric acid [Qin 2016], the sample size of 225 children aged 12–15 years was sufficient to obtain a statistically significant OR for hyperuricemia of 1.65 for PFHxS at serum levels much lower than among the Pease children. For PFOA, the OR for hyperuricemia was 2.2 at serum levels much lower than observed among the Pease children. A sample size of 350 exposed and 175 unexposed children would be sufficient to detect this OR with sufficient statistical power.
Attention Deficit/Hyperactivity Disorder (ADHD) and other neurobehavioral endpoints In a C8 study of ADHD (Stein 2011), the first quartile or reference level for PFOA and PFOS would correspond to the serum PFOA and PFOS levels among the children at Pease. For PFHxS, the serum levels among the children at Pease would correspond to the 3rd quartile level in the C8 study. For the 3rd quartile of PFHxS, the OR for ADHD was 1.43, and with current medications, the OR was 1.55. The prevalence of ADHD was 12.4%, and with current medications, 5.1%. To detect an OR of 1.43 with a prevalence of 12.4 %, the required sample size for a type 1 error of 0.10 and 80% power would be 829 per stratum. To detect an OR of 1.55 with a prevalence of 5.1%, the required sample size for a type 1 error of 0.10 and 80% power would be 1,179 per stratum.

28
In a study that used NHANES data for 1999–2004 [Hoffman 2010], the serum PFHxS levels were about half the levels among the children at Pease. For serum levels corresponding to the top quintile level among the Pease children, the OR for ADHD was 1.67 (using the regression coefficient in the logistic model). To detect this OR, a sample size of 540 per stratum would be required for type 1 error of 0.10 and 80% power. For PFOA, the serum levels corresponding to the top quintile level among the children at Pease in the NHANES population would have an OR of 1.82 for ADHD. For this OR, the required sample size would be 390 per stratum (or 596 exposed and 298 unexposed children) for a type 1 error of 0.10 and 80% power. For neurobehavioral outcomes other than ADHD, some of the neurobehavioral outcome studies (e.g., Stein [2013, 2014b]; Wang [2015], Lien [2016]) were also in the range of the minimum sample size suggested for the Pease children study. IQ differences in the range of 3 to 4 points could be detected with reasonable statistical power with a sample size of 350 exposed and 175 unexposed children. One study [Liew 2015] evaluated autism spectrum disorder and obtained an OR of 1.3 for serum PFHxS. With a prevalence of about 1.5%, a sample size of several thousand children would be necessary to detect this OR. To detect an OR of 2.0 with sufficient statistical power would require sample sizes of over 1,600 exposed and 1,600 unexposed.
Sex hormones and delayed puberty In the C8 study of sex hormones [Lopez-Espinosa 2016], the serum levels of PFOA, PFOS, and PFHxS were considerably higher than among the children at Pease. For PFOS, the natural log estradiol percent difference in boys of -4% (per interquartile range of the natural log of PFOS) would require at least 1,154 per stratum for type 1 error of 0.10 and 80% power. The strongest finding in this study was the decrease in testosterone among girls associated with PFOS. The natural log testosterone percent difference in girls was -6.6% per interquartile range of the natural log of PFOS. To detect a percent difference this large with type 1 error of 0.10 and 80% power would require at least 290 per stratum, or 434 exposed and 217 unexposed children. There was insufficient information to make sample size calculations for the endpoint, delayed puberty. The C8 study that evaluated this endpoint in included thousands of boys and girls [Lopez-Espinosa 2011]. Growth hormone In the C8 study that evaluated sex hormones, insulin-like growth factor-1 (IGF-1) was also evaluated [Lopez-Espinosa 2016]. The difference in the natural log IGF-1 among boys and girls was -2.5% and -2.1% per interquartile range of the natural log of PFHxS, respectively. To detect these differences with sufficient statistical power, a sample size of 350 exposed and 175 unexposed children would be sufficient.

29
Thyroid disease and function A C8 study [Lopez-Espinosa 2012] evaluated thyroid disease among children. The prevalence of participant-reported thyroid disease among children in this study was very low, about 0.6% and an OR of 1.44 was obtained for PFOA serum levels considerably higher than those in the Pease population. To detect this OR with 80% statistical power would require a sample size of over 10,000 exposed children. In the C8 study of thyroid function [Lopez-Espinosa 2012], the largest percent difference for natural log TSH was 3.1%, and 2.3% for TT4. These percent changes were for PFOA and PFOS serum levels considerably higher than the serum levels among the children at Pease. To detect a 2.3% change in TT4 would require a sample size of at least 850 per stratum (type 1 error = 0.10 and 80% power). To detect a 3.1% change in natural log TSH would require a sample size of at least 8,545 per stratum (type 1 error = 0.10 and 80% power). In the Taiwan study of thyroid function [Lin 2013], the sample size for those aged 12–19 years was 212. The geometric means for serum PFOA and PFOS were lower than the geometric mean serum levels among the children at Pease. For males and females, the natural log TSH declined by 0.5 mIU/L and 0.35 mIU/L respectively, for the >90th percentile serum PFOA compared with the reference level. To detect either of these differences with sufficient statistical power, a sample size of 350 exposed and 175 unexposed children would be sufficient.
Immune function and diseases related to immune function For immune function, one study [Grandjean 2012] had a similar sample size (N = 532) as the minimum proposed for the Pease children study (i.e., 350 exposed and 175 unexposed children), and two studies had somewhat larger sample sizes that might be achievable at Pease (Stein [2016a], N = 640; and Buser [2016], N = 637). The data reported in these studies were insufficient to conduct sample size calculations. For asthma, the ORs observed in the NHANES studies [Humblet 2014, Stein 2016a] were in the range of 1.2 – 1.3 and would require much larger sample sizes than can be recruited at Pease to achieve sufficient statistical power. However, a Taiwan study [Dong 2013] obtained ORs for asthma between 3.8 and 4.0 for PFHxS and PFOA serum levels lower than those observed in the Pease children population. A sample size of 350 exposed and 175 unexposed would be sufficient to detect these ORs with sufficient statistical power. Only one study [Stein 2016a] evaluated rhinitis and observed an OR of 1.35 for serum PFOA. To detect an OR this low with sufficient statistical power would require a sample size larger than could be recruited from the Pease population. However, with sufficient statistical power, ORs in the range of 1.5 – 1.6 could be detected in a study of the Pease population with a sample size of 500 exposed and 250 unexposed children. These ORs would fall within the 95% CI for the finding in this study. Other health-related endpoints A NHANES study [Geiger 2014b] evaluated PFOS and PFOA serum levels and hypertension and obtained ORs < 1.0. Since there is no evidence so far of an association between PFAS serum levels and hypertension in children, this endpoint is not considered further.

30
A study conducted in the Faroes [Karlsen 2016] evaluated serum levels of PFOA, PFOS and PFHxS and overweight/obesity in children. At age 5 years, the ORs for overweight/obesity and the third tertile serum levels of PFOA, PFOS and PFHxS were 1.88, 0.94, and 1.22. The serum levels of the PFAS chemicals were considerably lower than at Pease. An OR of 1.62 could be detected with 80% statistical power with a sample size of 350 exposed and 175 unexposed children. No study has been conducted of PFAS and liver function or fatty liver disease biomarkers in children.
Childhood cancers For childhood cancers such as leukemias, the incidence and prevalence is very low, requiring large sample sizes. For example, the probability of getting a leukemia at ≤15 years is 0.08% or 8 per 10,000. For ages ≤20 years, the probability is 0.09% or 9 per 10,000. At ages ≤14 years, the incidence rate for leukemias is 5.5 per 100,000 person-years. A study that attempted to evaluate leukemias or other childhood cancers would have to be multi-site or national. H. Conclusion Very little is known about the health effects from exposure to PFHxS, a PFAS that was considerably elevated in the serum of children tested at Pease. More information is available on the health effects of PFOS exposure, which was also elevated in the serum of children at Pease. However, there are still major data gaps and inconsistencies in the findings concerning the health effects of PFOS exposure, particularly effects on immune, thyroid and kidney function, neurobehavioral endpoints, sex hormones, and age at puberty. Based on sample size calculations, a study of children at Pease could have sufficient statistical power to evaluate several health-related endpoints. The study could also meet the criteria of public health significance and scientific importance, and could address some of the health concerns voiced by the Pease CAP and the previous CAB. The study population can be enumerated and selection bias can be minimized if recruitment is carefully done to avoid selection bias (i.e., selection that is associated with exposure and disease status). A sample of Portsmouth public school students would be an appropriate comparison group for the Pease children. There is a complete exposure pathway and a well-defined exposed population. The health-related endpoints under consideration have been evaluated in at least one epidemiological study of PFAS exposures to children, and these endpoints can be measured accurately. Information on potential confounding factors can be obtained via questionnaire. The issue of reverse causation and confounding from the use of measured serum PFAS levels can be avoided by predicting serum levels using PBPK modeling. Therefore, a children’s study at Pease could provide meaningful and credible results. A key issue is whether a study limited to the children exposed at the Pease Tradeport would have sufficient statistical power and precision for some of the endpoints under consideration. A minimum sample size of 350 exposed Pease children and 175 unexposed children from the Portsmouth area would be sufficient for several outcomes of interest. For example, Table 6 indicates that a sample size of 350 exposed and 175 unexposed children is sufficient to detect effects of reasonable size for most of the endpoints listed in the table. In addition, some of the immune and neurobehavioral studies that had sufficient statistical power to obtain effect estimates that achieved statistical significance had sample sizes within the range suggested as a minimum for the Pease children study.

31
When the effect sizes seen in previous PFAS studies are considered, the suggested minimum sample size for the Pease children study could be sufficient for several endpoints, such as mean differences in lipids, eGFR, and IGF-1. For other outcomes, such as uric acid mean difference, the sex hormones testosterone and estradiol, and thyroid function, the sample size of a study limited to the Pease children population might not be sufficient. Based on sample size calculations assuming 350 Pease children and 175 unexposed children, and assuming a simple comparison of exposed versus unexposed, health endpoints are grouped below into three categories: 1) feasible to study, 2) possible to study (but might require a larger sample size, e.g. 500 exposed and 250 unexposed), and 3) not feasible to study using the Pease children population, unless additional populations exposed to PFAS-contaminated drinking water are included in the study. Health endpoints feasible to study in children at Pease • Mean difference in lipids (total cholesterol, LDL, HDL, triglycerides) • Mean difference in estimated glomerular filtration rate (eGFR), a measure of kidney function • Insulin-like growth factor-1 (IGF-1, a measure of growth hormone deficiency) • Overweight/Obesity
Health endpoints that might be possible to study in children at Pease (although a larger sample size may be needed) • Mean difference in uric acid, a measure of kidney function • Elevated total cholesterol (hypercholesterolemia) • Elevated uric acid (hyperuricemia) • IQ/neurobehavioral • Thyroid function • Sex hormones • Asthma and atopic dermatitis (immune function) • Rhinitis (stuffy, runny nose) • Antibody responses to rubella, mumps, and diphtheria vaccines
Health endpoints not feasible to study using the Pease children population (to address these health endpoints, populations from other sites with PFAS-contaminated drinking water would need to be included, along with the Pease children population) • Attention deficit/hyperactivity disorder (ADHD) • Autism spectrum disorder • Delayed puberty • Thyroid disease • Fatty liver disease (C-18 biomarker) • Childhood cancers
To evaluate exposure response relationships, more than two strata are necessary. For some of the candidate outcomes that are listed above as feasible to study or possible to study, the Pease children

32
population that can be recruited to participate will not be large enough to be split into exposure tertiles or quartiles and still have sufficient statistical power for comparisons between each of the exposure strata and a reference (unexposed) stratum. Data analyses similar to those used in the C8 studies could be used. The methods include linear regression of continuous (untransformed and natural log transformed) effect biomarkers on continuous (untransformed and natural log transformed) PFAS serum levels and categorized PFAS serum levels, and logistic regression of categorized effect biomarkers (e.g., hypercholesterolemia) or disease prevalence on continuous (untransformed and natural log transformed) and categorical PFAS serum levels. Restricted cubic splines for linear and logistic regression would be conducted to obtain flexible, smoothed exposure-response curves. Measured PFAS serum levels would be evaluated. In addition, for PFOS and PFOA (and possibly PFHxS, if an historical reconstruction modeling method becomes available), estimated cumulative serum levels and estimated serum levels during critical vulnerability periods (e.g., in utero exposure) could be evaluated. In summary, a study limited to the Pease children population will likely have a sufficient sample size for some of the candidate endpoints if the comparisons are simply between an exposed and unexposed group. For some of the candidate endpoints, the sample size will be insufficient for even a simple comparison between an exposed an unexposed group. Moreover, for many of the candidate endpoints, the Pease children population will be of insufficient size to split into tertiles or quartiles to evaluate exposure–response trends. Therefore, the inclusion of other sites with PFAS-contaminated drinking water could be considered.
Feasibility of an epidemiological study of adults at the Pease Tradeport Compared with NHANES data, PFHxS serum levels were elevated among adults who participated in the 2015 NH DHHS blood testing program. However, the literature review indicated that very few studies have been conducted that evaluated PFHxS exposures and adult health effects. PFOS serum levels were also elevated among the adults who participated in the NH DHHS blood testing program. Although considerably more studies found evaluated PFOS exposures and adult health effects, there remain data gaps and inconsistencies in the findings for liver function, kidney function and kidney disease, thyroid disease and thyroid function, autoimmune diseases and immune function, osteoporosis/osteoarthritis, endometriosis, and most cancers. The public health significance of conducting a study of adults at Pease is that the study will be relevant to other adult populations exposed to drinking water primarily contaminated with PFOS and PFHxS. A study might also provide an opportunity for early medical intervention for certain health endpoints that might be associated with PFAS exposure but not evaluated in routine physical exams, such as alterations in thyroid, liver, and kidney function. A study of adults at Pease would have scientific importance because it potentially could help to fill critical data gaps mentioned above concerning the health effects of PFHxS and PFOS exposures. Based on animal studies, there is biological plausibility that PFAS exposures could result in alterations of immune function and might have endocrine-disruptive properties that could lead to alterations in thyroid function. However, few epidemiological studies have evaluated PFHxS or PFOS exposures and these health endpoints. Finally, a study of adults at Pease has the potential to provide meaningful and credible results (from the perspective of statistical power) for some of the adverse outcomes of interest and would be responsive to community concerns. However, a study

33
limited to Pease adults would likely not be sufficiently large to associate exposures and some adverse health outcomes (e.g., rare diseases such as specific cancers and specific chronic diseases). A. Study hypotheses Based on the literature review, the following hypotheses could be evaluated:
1. Higher serum levels of PFOA, PFOS, or PFHxS are associated with higher total cholesterol, low-density lipoprotein and triglycerides, and a higher prevalence of hypercholesterolemia.
2. Higher serum levels of PFOA, PFOS, or PFHxS are associated with higher prevalences of coronary artery disease and hypertension.
3. Higher serum levels of PFOA, PFOS, or PFHxS are associated with differences in thyroid stimulating hormone (TSH), TT4, and TT3, and a higher prevalence of hypothyroidism.
4. Higher serum levels of PFOA, PFOS, or PFHxS are associated with a higher level of uric acid and a higher prevalence of hyperuricemia.
5. Higher serum levels of PFOA, PFOS, or PFHxS are associated with a lower estimated glomerular filtration rate (eGFR) and a higher prevalence of kidney disease.
6. Higher serum levels of PFOA, PFOS, or PFHxS are associated with higher levels of liver function biomarkers alanine transaminase (ALT), γ-glutamyltransferase (GGT), and direct bilirubin, fatty liver disease biomarker cytokeratin-18 (CK-18), and a higher prevalence of liver disease.
7. Higher serum levels of PFOA, PFOS, or PFHxS are associated with higher prevalences of osteoarthritis and osteoporosis.
8. Higher serum levels of PFOA, PFOS, or PFHxS are associated with a higher prevalence of endometriosis.
9. Higher serum levels of PFOA, PFOS, or PFHxS are associated with higher prevalences of autoimmune diseases such as ulcerative colitis, rheumatoid arthritis, lupus, and multiple sclerosis.
10. Higher serum levels of PFOA, PFOS, or PFHxS are associated with differences in serum levels of IgA, IgE, IgG, IgM, C reactive protein (CRP), and antinuclear antibodies (ANA) and alterations in specific cytokines.
A study of adults could include the collection of new blood samples to analyze PFAS serum levels. The blood samples would also be analyzed for lipids and biomarkers of kidney, liver, thyroid, and immune function. A questionnaire could be used to ascertain kidney disease, liver disease, cardiovascular disease, hypertension, thyroid disease, autoimmune diseases, osteoporosis, osteoarthritis, pregnancy-induced hypertension, and endometriosis. Diseases ascertained via questionnaire would be confirmed using medical records
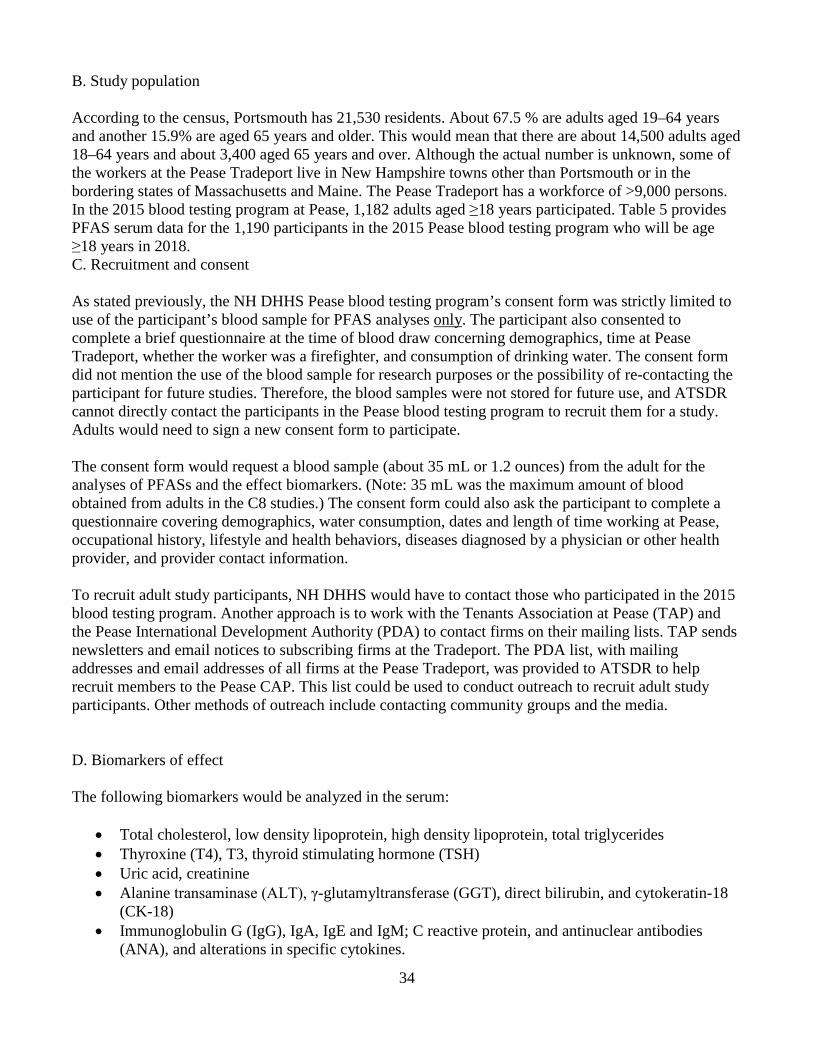
34
B. Study population According to the census, Portsmouth has 21,530 residents. About 67.5 % are adults aged 19–64 years and another 15.9% are aged 65 years and older. This would mean that there are about 14,500 adults aged 18–64 years and about 3,400 aged 65 years and over. Although the actual number is unknown, some of the workers at the Pease Tradeport live in New Hampshire towns other than Portsmouth or in the bordering states of Massachusetts and Maine. The Pease Tradeport has a workforce of >9,000 persons. In the 2015 blood testing program at Pease, 1,182 adults aged ≥18 years participated. Table 5 provides PFAS serum data for the 1,190 participants in the 2015 Pease blood testing program who will be age ≥18 years in 2018. C. Recruitment and consent As stated previously, the NH DHHS Pease blood testing program’s consent form was strictly limited to use of the participant’s blood sample for PFAS analyses only. The participant also consented to complete a brief questionnaire at the time of blood draw concerning demographics, time at Pease Tradeport, whether the worker was a firefighter, and consumption of drinking water. The consent form did not mention the use of the blood sample for research purposes or the possibility of re-contacting the participant for future studies. Therefore, the blood samples were not stored for future use, and ATSDR cannot directly contact the participants in the Pease blood testing program to recruit them for a study. Adults would need to sign a new consent form to participate. The consent form would request a blood sample (about 35 mL or 1.2 ounces) from the adult for the analyses of PFASs and the effect biomarkers. (Note: 35 mL was the maximum amount of blood obtained from adults in the C8 studies.) The consent form could also ask the participant to complete a questionnaire covering demographics, water consumption, dates and length of time working at Pease, occupational history, lifestyle and health behaviors, diseases diagnosed by a physician or other health provider, and provider contact information. To recruit adult study participants, NH DHHS would have to contact those who participated in the 2015 blood testing program. Another approach is to work with the Tenants Association at Pease (TAP) and the Pease International Development Authority (PDA) to contact firms on their mailing lists. TAP sends newsletters and email notices to subscribing firms at the Tradeport. The PDA list, with mailing addresses and email addresses of all firms at the Pease Tradeport, was provided to ATSDR to help recruit members to the Pease CAP. This list could be used to conduct outreach to recruit adult study participants. Other methods of outreach include contacting community groups and the media. D. Biomarkers of effect The following biomarkers would be analyzed in the serum:
• Total cholesterol, low density lipoprotein, high density lipoprotein, total triglycerides • Thyroxine (T4), T3, thyroid stimulating hormone (TSH) • Uric acid, creatinine • Alanine transaminase (ALT), γ-glutamyltransferase (GGT), direct bilirubin, and cytokeratin-18
(CK-18) • Immunoglobulin G (IgG), IgA, IgE and IgM; C reactive protein, and antinuclear antibodies
(ANA), and alterations in specific cytokines.

35
E. Exposure assessment Exposure assessment could be based on the serum PFAS levels obtained in the study supplemented by the serum PFAS levels for those who participated in the 2015 NH DHHS Pease blood testing program. Using historical estimates of the PFAS contaminant levels in the drinking water at the Pease Tradeport (based on water modeling methods), PBPK modeling can be used to estimate historical serum levels of PFOA and PFOS, combining information from the questionnaire on water consumption and dates and length of time employed at Pease Tradeport, and information on background PFAS serum levels from NHANES and from a comparison group unexposed to PFAS-contaminated drinking water or occupationally exposed to PFAS or AFFF. Serum levels from the 2015 NH DHHS Pease blood testing program and serum levels obtained for this study would be used to calibrate the PBPK models. If feasible, historical estimates of serum PFHxS can be based on historical estimates for serum PFOA and PFOS, because serum levels of PFHxS and PFOS were highly correlated among the Pease adults who participated in the 2015 blood testing program (Pearson correlation coefficient = 0.73). F. Sample size considerations A key problem for an adult study at Pease will be identifying an appropriate comparison population of workers from the Portsmouth area with similar occupations as the Pease workforce and who were not exposed to PFAS-contaminated drinking water or occupationally exposed to PFAS or AFFF. Another key problem will be recruiting a sufficient number of participants to achieve reasonable statistical power and precision of effect estimates. Studies conducted of the adult C8 population included tens of thousands of participants. For example, studies of thyroid disease [Winquist 2014a], cardiovascular disease and lipids [Winquist 2014b], kidney disease [Dhingra 2016], and liver function [Darrow 2016] included 28,541 community members and 3,713 workers at the DuPont plant. Smaller studies using NHANES data (e.g., Wen [2013], Webster [2016], Shankar [2011], Gleason [2015], and Lin [2010]) had sample sizes of 1,181–4,333 adults. Table 7a indicates the minimum detectable effects for a study that included 1,500 participants per stratum. For a simple comparison between exposed and unexposed, this would require a total of 3,000 participants, i.e., 1,500 exposed and 1,500 unexposed. If the study population were divided into quartiles of PFAS serum levels, with the first quartile being the reference exposure level, then this would result in a total sample size of 6,000 persons (i.e., 4,500 exposed and 1,500 unexposed). Four combinations of type 1 error (α error) and type 2 error (β error) are used in the table. A type 1 error of 0.05 corresponds to a two-tailed hypothesis test using a p-value cutoff of 0.05 to determine statistical significance, or using a 95% confidence interval. A type 1 error of 0.10 corresponds to a one-tail hypothesis test using a p-value cutoff of 0.05 to determine statistical significance, or using a 90% confidence interval. A type 2 errors of 0.05, 0.10, and 0.20 correspond to statistical power of 95%, 90% and 80%, respectively. Another possible approach to sample size calculations that might be informative would be to fix the minimum detectable effects to the effect sizes observed in previous studies for similar levels of exposure, select the type 1 and type 2 error rates, and allow the sample size to “float” instead of the minimum detectable effect. However, this approach is problematic because there are few studies of PFAS exposures and the adult outcomes being considered for the Pease adult study. In some instances, studies evaluating similar PFAS serum levels obtained very different effect sizes for the same outcome. In other instances, a study with a lower PFAS serum level obtained a higher effect size for an outcome

36
than a study with a higher PFAS serum level. Moreover, there are no studies of adults exposed to PFAS drinking water contamination as a result of AFFF use. Therefore, there is much uncertainty about the effect size for each health-related endpoint that would be expected for PFAS serum levels observed among the Pease adults. With these caveats, the following sample size per stratum calculations use the findings from studies of PFAS-exposed adults. Table 7b provides a summary of the sample size considerations for each health-related endpoint.
Lipids In the lipid study conducted of the C8 adult population [Steenland 2009], PFOS serum levels corresponding to the PFOS serum levels among adults who participated in the Pease blood testing program would result in a 3–4 mg/dL change in total cholesterol and in LDL. Table 7a indicates that detecting a difference of about 4 mg/dL in total cholesterol would require a sample size of about 1,500 per stratum. To detect a difference of 3 mg/dL would require a larger sample size. For LDL, a sample size of 1,500 per stratum would be sufficient for mean differences in the 3–4 mg/dL range. The predicted increase in total cholesterol at the highest decile for PFOA and PFOS in the C8 study was 11–12 mg/dL. To detect a difference of 11 mg/dL, a sample size in the range of 200–300 per stratum would probably be sufficient. However, the highest decile for PFOA and PFOS in the C8 population is considerably higher than the serum levels observed for the adult participants in the Pease 2015 blood testing. In a C8 study [Steenland 2009] and a Canadian study [Fisher 2013], ORs in the range of 1.35 – 1.6 were observed for hypercholesterolemia. Although PFAS serum levels were higher in the C8 population than the Pease population, the PFAS serum levels in the Canadian study were lower than in the Pease population. Table 7a indicates that ORs in this range for hypercholesterolemia can be detected with sufficient statistical power with a sample size of 1,500 per stratum.
Kidney disease/function, and uric acid In the C8 study of chronic kidney disease [Dhingra 2016], the highest hazard ratio (HR) was observed for the lowest quintile of exposure (compared with the reference level) and was equal to 1.36. To detect this HR, given the low prevalence of the disease (approximately 1.4%). would require a sample size of at least 8,600 per stratum. In the C8 study of uric acid [Steenland 2010], serum PFOS levels that correspond to those observed among the adult participants in the Pease blood testing program resulted in a difference of 0.14 mg/dL. To detect this difference would require a sample size in the range of 1,600–2,100 per stratum. The largest differences in uric acid observed in this study was 0.28 mg/dL for PFOA serum levels ≥188.7 ng/mL and 0.22 mg/dL for PFOS serum levels ≥40.5 ng/mL. These serum levels are considerably higher than those observed for the adults at Pease. Based on sample size calculations, a uric acid difference of 0.28 mg/dL could be detected with reasonable statistical power and a sample size in the range of 500–600 per stratum. Table 7a indicates that much lower differences in uric acid could be detected with reasonable statistical power using a sample size of 1,500 per stratum.

37
In the C8 study, the OR for hyperuricemia for PFOA serum levels similar to those at Pease equaled 1.02. For the top quintile of serum PFOA in the C8 population, the OR was 1.47. Based on sample size calculations, a sample size in the range of 450–600 would be sufficient to detect an OR of 1.47 with reasonable statistical power. However, the top quintile serum PFOA level in the C8 study was considerably higher than observed in the Pease population. In a study using NHANES data [Shankar 2011], a change in uric acid of 0.40 mg/dL was observed for serum PFOA levels similar to those observed for Pease. Based on sample size calculations, this difference could be detected with reasonable statistical power using a sample size of about 300 per stratum. For hyperuricemia, an OR of 1.90 was observed for serum PFOA levels similar to Pease. Based on sample size calculations, an OR of 1.90 can be detected with reasonable statistical power using a sample size of about 240 per stratum.
Liver function For liver function, to detect the very subtle changes observed in the C8 studies [Gallo 2012; Darrow 2016] would require a sample size as large as the C8 study itself. The same is true for liver disease. In the Darrow 2016 study, the highest OR observed was 1.19 for the 2nd quintile of serum PFOA. The 2nd quintile of serum PFOA in the C8 study is higher than the serum levels at Pease. To detect an OR of 1.19 would require a sample size of at least 20,000 per stratum. A study using NHANES data [Gleason 2015] was able to detect associations with uric acid and liver function biomarkers at serum PFAS levels similar to those observed at Pease and with a total sample size of 4,333 persons. This study evaluated quartiles of serum PFAS, so each stratum had a sample size of about 1,083 persons. Another study that used NHANES data [Lin 2010] also was able to detect associations with liver function biomarkers with a total sample size of 2,216 persons. This study also evaluated quartiles, so each stratum had a sample size of about 554 persons.
Cardiovascular disease The C8 study that evaluated coronary artery disease did not find an elevation in risk [Winquist 2014b]. However, a study that used NHANES data [Shankar 2012] obtained an OR of 2.01 for cardiovascular disease for the 4th quartile PFOA serum levels. These PFOA serum levels, ≥6 ng/mL, would correspond to the 5th quintile of PFOA serum levels among Pease adults. The prevalence of cardiovascular disease in this study was 13%. To detect an OR of 2.01, a sample size of about 250/stratum would probably be sufficient. Hypertension One study evaluated hypertension in a community population and observed an OR <1.0 [Winquist 2014b]. The prevalence of hypertension in this study was about 38%. With a sample size of 1,500 per stratum and a prevalence of 38%, ORs between 1.21 and 1.31 could be detected with sufficient statistical power.
Thyroid disease/function For thyroid disease, the C8 study evaluated self-reported disease and self-reported disease that was confirmed by medical records [Winquist 2014a]. For serum PFOA levels similar to those at Pease, the

38
hazard ratios were in the range of 1.2–1.3. For all self-reported thyroid disease (prevalence = 11.3%), a sample size of about 2,100 per stratum would probably be sufficient to detect a hazard ratio of 1.3. The prevalence for confirmed disease was 6.5%, so that a sample size of about 3,500 per stratum would probably be necessary to detect an HR of 1.3. A study that used NHANES data evaluated thyroid disease [Melzer 2010]. For confirmed thyroid disease (prevalence = 2.4% in this study), the ORs were slightly above 1.1 for PFOS and PFOA serum levels similar to those at Pease. To detect this OR would require a sample size equivalent to the C8 population. The highest OR observed was 1.89 among men in the top quartile of PFOS and PFOA. To detect this odds ratio, a sample size of about 1,400 per stratum would probably be sufficient. The C8 study that evaluated thyroid function biomarkers [Knox 2011] observed very subtle changes that would require a study of equivalent size (52,296) to detect associations with sufficient statistical power. On the other hand, a study that used NHANES data [Wen 2013] to evaluate thyroid function observed larger changes that could be detected with a total sample size of <1,200 (or <300 per quartile stratum). Immune function and autoimmune diseases Only one published study [Stein 2016b] evaluated serum immune biomarkers at baseline (i.e., cross-sectionally) and PFAS serum levels. The study evaluated de-identified archived blood samples from 75 adults aged 21-49. Given the very small sample size, this should be considered a pilot study. The PFHxS serum levels in this study were considerably lower than in the Pease adult population and a few positive findings were observed but the confidence intervals for these findings were extremely wide indicating little precision and a high degree of uncertainty in the effect estimates. Given the strong animal evidence of effects on the immune system from PFAS exposures [NTP 2016], a cross-sectional evaluation of PFAS serum levels and immune biomarkers in a Pease adult study could provide important information on the effects of PFAS exposures on immune function in humans. The prevalences of ulcerative colitis, rheumatoid arthritis, lupus, and multiple sclerosis in a C8 study [Steenland 2013] were ≤ 1.2%. As indicated in Table 7a, ORs ≤ 2.0 cannot be detected with sufficient statistical power for these endpoints with a sample size of 1,500 per stratum. For lupus and multiple sclerosis, ORs <3.5 cannot be detected with sufficient statistical power with a sample size of 1,500 per stratum. Osteoarthritis and Osteoporosis Two studies evaluated osteoarthritis. In a C8 study [Innes 2011], an OR of about 1.4 was observed for serum PFOA levels considerably higher than those at Pease. However, in an NHANES study [Uhl 2013], an OR of 1.5 was observed for serum PFOA levels similar to those at Pease. Table 7a indicates that ORs in the range of 1.4 – 1.6 can be detected with sufficient statistical power with a sample size of 1,500 per stratum. An NHANES study evaluated osteoporosis in women [Khalil 2016] and obtained an OR > 10 for serum PFHxS levels lower than those at Pease. With 750 women per stratum, an OR of 1.58 can be detected with sufficient statistical power.

39
Endometriosis An NHANES study [Campbell 2016] obtained ORs of 1.47 and 2.86 for serum PFHxS and PFOA, respectively. The serum levels for these two PFAS were similar to those in the Pease population. Table 7a indicates that with a sample size of 750 per stratum, ORs in the range of 1.55 – 1.85 can be detected with sufficient statistical power. Pregnancy-induced hypertension Several C8 studies evaluated pregnancy-induced hypertension. One study observed an OR of 1.6 for serum PFOS. However, the PFOS serum levels in the C8 study were higher than those at Pease. Table 7a indicates that ORs in the range of 1.6 – 1.9 can be detected with sufficient statistical power for a sample size of 750 pregnancies per stratum. Cancer incidence For kidney cancer, Table 7a indicates that ORs <3.8 cannot be detected with sufficient statistical power with a sample size of 1,500 per stratum. Even for a cancer with a much higher prevalence than kidney cancer, e.g., prostate cancer, ORs < 2.0 cannot be detected with sufficient statistical power with a sample size of 750 men per stratum. F. Conclusion A sample size of about 1,500 per stratum (or a total sample size of 6,000 if quartiles are evaluated) would have sufficient statistical power to detect several of the health-related endpoints, as indicated by Tables 7a and 7b. For some endpoints, such as mean difference in uric acid, hyperuricemia, and cardiovascular disease, smaller sample sizes of about 500 per stratum might be sufficient. For other endpoints, such as ulcerative colitis, rheumatoid arthritis, and chronic kidney and liver disease, sample sizes larger than 1,500 per stratum would be necessary. Based on the sample size calculations that assume a sample size of 1,500 adults employed at the Pease Tradeport and 1,500 adults from the Portsmouth area who were never employed at the Pease Tradeport, and assuming a simple comparison of exposed versus unexposed, health endpoints are grouped below into three categories: 1) feasible to study, 2) possible to study (but might require a larger sample size from the Pease population), and 3) not feasible to study using the Pease adult population unless additional populations exposed to PFAS-contaminated drinking water are included in the study. Health endpoints feasible to study in adults at Pease • Mean difference in lipids (total cholesterol, LDL, HDL, triglycerides) • Elevated total cholesterol (hypercholesterolemia) • Mean difference in uric acid, a measure of kidney function • Elevated uric acid (hyperuricemia) • Thyroid disease (unconfirmed) • Cardiovascular disease • Hypertension • Osteoarthritis and osteoporosis

40
• Mean differences in serum immunoglobin (IgA, IgE, IgG, IgM), and C-reactive protein (an indicator of inflammation); increase in antinuclear antibodies (an indicator of autoimmune reaction); alterations in specific cytokines
Health endpoints that may be possible to study in adults at Pease (although a larger sample size may be needed) • Liver function and CK-18 (fatty liver disease biomarker) • Thyroid disease (confirmed) • Thyroid function • Endometriosis • Pregnancy-induced hypertension
Health endpoints not feasible to study using the Pease adult population (in order to address these health endpoints, populations from other sites with PFAS-contaminated drinking water would need to be included along with the Pease adult population) • Liver disease • Kidney disease • Ulcerative colitis • Rheumatoid arthritis • Lupus • Multiple sclerosis • Kidney cancer (and other adult cancers)
To evaluate exposure–response trends, the study participants would need to be split into tertiles or quartiles based on their serum PFAS levels. For some of the candidate health endpoints that are listed above as feasible to study or possible to study, the Pease adult population that can be recruited to participate will not be large enough to be split into exposure tertiles or quartiles and still have sufficient statistical power for comparisons between each of the exposure strata and a reference (unexposed) stratum. For example, if the study population is to be divided into quartiles, and assuming that a sample size of 1,500 per stratum would be sufficient for many of the endpoints of interest, then it would be necessary to recruit 4,500 adults (aged ≥18 years at the start of the study) from the Pease workforce and a representative group (i.e., employed in similar occupations as the Pease workforce) of 1,500 adults from the Portsmouth area who were not exposed at Pease. Data analyses similar to those used in the C8 studies would be used. The methods include linear regression of continuous (untransformed and natural log-transformed) effect biomarkers on continuous (untransformed and natural log-transformed) PFAS serum levels and categorized PFAS serum levels; and logistic regression of categorized effect biomarkers (e.g., hypercholesterolemia) or disease prevalence on continuous (untransformed and natural log-transformed) and categorical PFAS serum levels. Restricted cubic splines for linear and logistic regression would be conducted to obtain flexible, smoothed exposure-response curves. Measured PFAS serum levels would be evaluated. In addition, for PFOS and PFOA (and possibly PFHxS if an historical reconstruction modeling method becomes available), estimated cumulative serum levels would be evaluated.

41
In summary, a study limited to the Pease adult population could likely have a sufficient sample size for some of the candidate endpoints if the comparisons are simply between an exposed and unexposed group. Recruitment of at least 1,500 adults from Pease should be feasible, given that the 2015 blood testing program at Pease was able to recruit at least 1,182 adults aged >18 years who worked at Pease. However, a study limited to the Pease adult population might not have a sufficient sample size to evaluate exposure–response relationships. Moreover, a study limited to the Pease worker population might not have sufficient variability in serum PFAS levels to evaluate exposure–response trends effectively. Sufficient variability in PFAS serum levels might be achieved by including other populations with residential exposures to PFAS-contaminated drinking water.
Feasibility of an epidemiological study of former military service and civilian workers at the former Pease Air Force base Drinking water contamination at a military base involves potential residential exposures to those living and training at the base and potential exposures to those working at the base. At the former Pease Air Force Base, starting in the 1970s, AFFF foam was used for fire training and to extinguish flammable liquid fires. The PFAS contamination in the Haven well water supply likely occurred sometime during the period from the start of AFFF usage and the closing of the base and would have resulted in exposures to those living and working at the base. To evaluate the incidence and mortality of specific cancers, a large population of adults would need to be followed for a sufficient number of years to account for the long induction periods of most cancers and to have sufficient statistical power. For example, the Camp Lejeune mortality study of U.S. Marines and Navy personnel followed a cohort of 154,932 from 1979 to 2008 for a total of over 4 million person-years [Bove 2014]. To evaluate cancer incidence for the Camp Lejeune cohort, ATSDR will conduct follow-up using state and federal cancer registries for the period 1996–2016 (1996 is the earliest date that >90% of the state registries were in operation), for a total of over 3 million person-years. For the civilian worker cohort at Camp Lejeune, 8,085 workers will be followed over the period 1996–2016 for cancer incidence, for a total of 121,875 person-years. This is similar in size to a study of cancer incidence among workers at a PFAS manufacturing plant [Raleigh 2014]. A recent study of firefighters followed a pooled cohort of 29,993 from San Francisco, Chicago, or Philadelphia from 1985 through 2009, for a total of 403,152 person-years [Daniels 2014]. A C8 study of cancer incidence that relied on self-reported cancers that were confirmed by medical records and cancer registry review included 32,254 who contributed over 1 million person-years of follow-up [Barry 2013]. In October 1989, 3,465 military personnel were assigned to Pease Air Force Base, accompanied by 4,746 dependents. The Air Force estimates that 537 civilian employees were employed on base at that time [USAF 1990]. From 1970 to 1990, an average of 3,000 personnel and their families were assigned to the base at any one time. Before 1970, the base supported a maximum of 5,000 personnel [USAF 1994]. One important consideration about including Pease service personnel and civilian workers in a cancer incidence and mortality study is that drinking water at the base was also contaminated by TCE from the Haven well during some of the years the base operated. Service personnel and civilian workers stationed at the base before 1986 should not be included because of this contamination. Because the base closed by 1991, the number of service personnel and civilian workers at Pease AFB that could be included in a study would be insufficient to evaluate cancers with sufficient statistical power.

42
Because of the relatively small numbers of personnel assigned to Pease Air Force Base, we conclude that it is not feasible to conduct a study of cancer incidence and mortality that is limited to the Pease military service personnel and civilian worker cohorts stationed at the base from 1986 onward. For a study to be feasible, it would require a larger population size, for example, by including service personnel and civilian workers from other military bases with PFAS-contaminated drinking water as a result of the use of AFFF. Exposures to other drinking water contaminants, such as TCE, other chlorinated organic chemicals, and benzene, must also be taken into account when considering candidate military bases and defining the cohorts. Cohorts of service personnel and civilian workers can be identified at military bases from personnel data maintained at the Defense Manpower Data Center. Personnel data are available from 1971, although information on military unit, which is needed to determine the base where the individual was stationed, does not begin until the second quarter of 1975. For civilian workers, data are available starting in the last quarter of 1972, with data missing for the first quarter of 1973. The data contain the location of the workplace (codes for state, city, and ZIP code). The Defense Manpower Data Center data contain Social Security number, name, date of birth, and sex to facilitate follow-up. Military service personnel constitute a highly mobile population after their tours of duty are completed. For a mortality study, this is not a problem, because the NDI is available to obtain information on causes of death. However, there is no national cancer registry to ascertain cancer incidence. Therefore, a study of military service personnel and civilian workers would require gaining the participation of all or most of the state cancer registries and the Department of Veterans Affairs Central Cancer Registry (VACCR). The Camp Lejeune Cancer Incidence Study is one model for such a study. This study is attempting to recruit at least two-thirds of the state cancer registries and VACCR to cover >90% of the Camp Lejeune and Camp Pendleton cohorts. The study will send the personal identifiers for each cohort member to each registry for matching with the registry’s data. For any matches that occur, the registry will send to ATSDR the cancer information that is linked to personal identifier (e.g., Social Security number or a unique identification number linked to the Social Security number). This will allow assessment of exposures and other covariates and cancers at the individual level. The most appropriate military sites for inclusion would be those with water systems that are not complex so that simple mixing models can be used to estimate PFAS-contaminant levels throughout the distribution system. In addition, candidate sites should have information on the history of AFFF use at the base including major incidents such as spills, fires, etc.
Other study designs and health-related endpoints 1. Adverse birth outcomes To evaluate adverse birth outcomes such as SGA, preterm birth, and specific congenital malformations with sufficient statistical power, several thousand births should be studied. For example, to detect an OR of 1.5 for SGA (5th percentile) with 80% power would require 1,775 births per stratum. For SGA (10th percentile) and preterm birth, with 80% power, an OR of 1.5 can be detected with a sample size of about 960–990 births per stratum. For rare birth defects, such as neural tube defects, to detect an OR of 2.5 with 80% power would require a sample size of about 22,000 births per stratum. For oral clefts, to detect an OR of 2.0 would require about 15,000 births per stratum.

43
Birth weight, SGA and preterm birth can be evaluated using birth certificate data. For birth defects, a population-based registry must be used to identify cases. An adverse birth outcome study is not feasible at Pease because there were too few births to mothers who worked at the Tradeport during their pregnancy. The most appropriate candidate populations for a study of adverse birth outcomes would be one or more large municipalities with residential exposures to PFAS-contaminated drinking water where a simple mixing model could be used to estimate contaminant levels throughout the distribution system, i.e., a system that is not complex but instead has relatively uniform contaminant levels throughout the distribution system. 2. Registry Creating a registry of exposed children and adults at the Pease Tradeport involves following the health status over a period of time and is similar to an epidemiological, longitudinal study of an exposed cohort. The difference is that an epidemiological study would usually include a comparison, unexposed cohort. A registry, like a longitudinal epidemiological study, can be resource-intensive. A decision would also have to be made concerning the length of the follow-up. As in any longitudinal effort, individuals will drop out over time, resulting in interpretation difficulties (e.g., selection bias resulting from loss to follow-up). In any event, before a registry or longitudinal study can be contemplated, an initial cross-sectional study must first be conducted, similar to the children’s study and adult study discussed above. 3. Multi-site studies The results of sample size calculations indicated that the exposed populations at the Pease Tradeport and the former Pease Air Force Base were of insufficient size for some of the health-related endpoints of interest to the community. Moreover, Pease CAP members have expressed interest in linking the Pease communities with other communities that have been exposed to PFAS-contaminated drinking water. A national database exists that can be used to identify other communities with PFAS-contaminated drinking water. Data on PFAS contamination of public drinking water supplies are available for large systems (serving >10,000 retail customers) and a small sample of small systems (n = 800 or 0.5% of a total of 144,165 systems serving <10,000 retail customers) via the Third Unregulated Contaminant Monitoring Rule (UCMR-3) database maintained by the EPA [US EPA 2016b]. UCMR-3 monitoring for PFAS is required at the entry point to the distribution system for each well and at any interconnection that is in operation. Water utilities had to sample twice during a 12-month period from 2013–2015 with sampling events occurring 5–7 months apart. The UCMR dataset contains sampling data from January 2, 2013 through March 1, 2016. Table A1 in the Appendix lists the utilities ranked by the maximum level of combined PFOS and PFHxS detected in the system. The highest level was detected in the system serving the Mariana Islands. Among the U.S. water systems, the top 10 systems for combined PFOS and PFHxS were Artesian Water Company in Delaware; Security Water System in Colorado Springs, CO; Horsham and Warminster systems in Pennsylvania; Oatman Water Company in Arizona; Issaquah Water System in Washington; Hyannis Water System in Massachusetts; Suffolk County Water Authority in New York; Warrington Township Water in Pennsylvania; and United Water in Pennsylvania, which serves various municipalities.

44
Although the UCMR database can be used to identify potential sites for further consideration for health studies, it has several limitations. First, most small systems are not included in the database. Second, the data represent levels of contamination at the entry points to the distribution system of the water utility (e.g., contaminant levels in a supply well) and generally do not represent the levels of contamination reaching particular residences served by the utility. To estimate the population receiving contaminated drinking water and the levels of PFAS in their drinking water, the UCMR data must be supplemented with information on the configuration and operation of the utility’s system. For a system that mixes all its sources of water before to entering the distribution system, a simple mixing model can be used to estimate the contaminant levels in the drinking water serving the residences by taking into account the contaminant levels in each source and the contribution of each source to the total supply. This is the situation at the Pease Tradeport, where water from each of the supply wells is mixed at the treatment plant before entering the distribution system. However, many utilities have more complex systems in which each of the supply wells (or surface water sources) primarily serve particular areas of the distribution system. For these systems, additional information is needed (for example, on the operation of the supply wells, tank levels, and the water demand in each area of the distribution system), and complex modeling methods must be used.
Conclusions
The ability of a study of the Pease population to provide useful information will depend to a great extent on the success of recruiting sufficient number of study participants. The feasibility assessment concluded that it is possible to evaluate some health-related endpoints if a sufficient number of children and adults from the Pease population participate. Other health-related endpoints would require larger numbers of exposed individuals and would require the inclusion of populations from other sites who were exposed to PFAS-contaminated drinking water. The feasibility assessment concluded that a third study design, a mortality and cancer incidence study of former military service and civilian worker personnel, would not be feasible solely with the population at Pease. The feasibility of successfully evaluating particular health-related endpoints (or effect biomarkers) could change depending on final study design and goals.

45
References Agency for Toxic Substances & Disease Registry (ATSDR). Public Health Assessment for Pease Air Force Base, Portsmouth, Rockingham County, New Hampshire. Atlanta: US Department of Health and Human Services; September 30, 1999. https://www.atsdr.cdc.gov/HAC/pha/PHA.asp?docid=1198&pg=0 Agency for Toxic Substances and Disease Registry (ATSDR). Public Health Assessment: Willow Grove Naval Air Station/Air Reserve Station (a.k.a. Naval Air Station Joint Reserve Base and Air Force Reserve Station) Montgomery County, Pennsylvania. Atlanta: US Department of Health and Human Services; 2002a. Agency for Toxic Substances and Disease Registry (ATSDR). Public Health Assessment: Naval Air Warfare Center [A/K/A Naval Air Development Center (8 Waste Areas)] Warminster Township, Bucks County, Pennsylvania. Atlanta: US Department of Health and Human Services; 2002b. Agency for Toxic Substances and Disease Registry (ATSDR). Letter Health Consultation: Perfluorochemicals (Pfcs) Contamination in Public and Private Drinking Water Sources Near the Former Naval Air Warfare Center Warminster, Bucks County, Pennsylvania. Atlanta: US Department of Health and Human Services; 2016. Alexander BH, Olsen GW, Burris JM, Mandel JH, Mandel JS. Mortality of employees of a perfluorooctanesulphonyl fluoride manufacturing facility. Occup Environ Med 2003;60:722–729. Alexander BH, Olsen GW. Bladder cancer in perfluorooctanesulfonyl fluoride manufacturing workers. Ann Epidemiol 2007;17:471-478. Andersen CS, Fei C, Gamborg M, Nohr EA, Sørensen TI, Olsen J. Prenatal exposures to perfluorinated chemicals and anthropometric measures in infancy. Am J Epidemiol 2010;172(11):1230-7. Anderson EL, Howe LD, Jones HE, Higgins JPT, Lawlor DA, Fraser A. The prevalence of non-alcoholic fatty liver disease in children and adolescents: A systematic review and meta-analysis. PLoS One 2015;10:e0140908. Apelberg BJ, Witter FR, Herbstman JB, Calafat AM, Halden RU, Needham LL, Goldman LR. Cord serum concentrations of perfluorooctane sulfonate (PFOS) and perfluorooctanoate (PFOA) in relation to weight and size at birth. Environ Health Perspect 2007;115(11):1670-6. Avanasi R1, Shin HM, Vieira VM, Savitz DA, Bartell SM. Impact of Exposure Uncertainty on the Association between Perfluorooctanoate and Preeclampsia in the C8 Health Project Population. Environ Health Perspect 2016;124(1):126-32. Bach CC, Bech BH, Brix N, Nohr EA, Bonde JP, Henriksen TB. Perfluoroalkyl and polyfluoroalkyl substances and human fetal growth: a systematic review. Crit Rev Toxicol 2015a;45(1):53-67. Bach CC, Liew Z, Bech BH, Nohr EA, Fei C, Bonefeld-Jorgensen EC, Henriksen TB, Olsen J. Perfluoroalkyl acids and time to pregnancy revisited: An update from the Danish National Birth Cohort. Environ Health 2015b;14:59.

46
Bach CC, Vested A, Jørgensen KT, Bonde JP, Henriksen TB, Toft G. Perfluoroalkyl and polyfluoroalkyl substances and measures of human fertility: a systematic review. Crit Rev Toxico. 2016a;46(9):735-55. Bach CC, Bech BH, Nohr EA, Olsen J, Matthiesen NB, Bonefeld-Jørgensen EC, Bossi R, Henriksen TB. Perfluoroalkyl Acids in Maternal Serum and Indices of Fetal Growth: The Aarhus Birth Cohort. Environ Health Perspect 2016b;124(6):848-54. Barry V, Winquist A, Steenland K. Perfluorooctanoic Acid (PFOA) Exposures and Incident Cancers among Adults Living Near a Chemical Plant. Environ Health Perspect 2013;121:1313–1318. Berg V, Nøst TH, Hansen S, Elverland A, Veyhe AS, Jorde R, Odland JØ, Sandanger TM. Assessing the relationship between perfluoroalkyl substances, thyroid hormones and binding proteins in pregnant women; a longitudinal mixed effects approach. Environ Int 2015;77:63-9. Berg V, Nøst TH, Pettersen RD, Hansen S, Veyhe AS, Jorde R, Odland JØ, Sandanger TM. Persistent Organic Pollutants and the Association with Maternal and Infant Thyroid Homeostasis: A Multipollutant Assessment. Environ Health Perspect 2017;125:127-133. Bonefeld-Jorgensen EC, Long M, Bossi R, Ayotte P, Asmund G, Krüger T, Ghisari M, Mulvad G, Kern P, Nzulumiki P, Dewailly E. Perfluorinated compounds are related to breast cancer risk in Greenlandic Inuit: a case control study. Environ Health 2011;10:88. Bonefeld-Jorgensen EC, Long M, Fredslund SO, Bossi R, Olsen J. Breast cancer risk after exposure to perfluorinated compounds in Danish women: a case-control study nested in the Danish National Birth Cohort. Cancer Causes Control 2014;25:1439-48. Bove FJ, Ruckart PZ, Maslia M, Larson TC. Evaluation of mortality among Marines and navy personnel exposed to contaminated drinking water at USMC base Camp Lejeune: A retrospective cohort study. Environ Health 2014a; 13:10. Bove FJ, Ruckart PZ, Maslia M, Larson TC. Mortality study of civilian employees exposed to contaminated drinking water at USMC base Camp Lejeune: A retrospective cohort study. Environ Health 2014b;13:68. Braun JM, Kalkbrenner AE, Just AC, Yolton K, Calafat AM, Sjödin A, Hauser R, Webster GM, Chen A, Lanphear BP. Gestational exposure to endocrine-disrupting chemicals and reciprocal social, repetitive, and stereotypic behaviors in 4- and 5-year-old children: the HOME study. Environ Health Perspect 2014;122(5):513-20. Buck Louis GM, Peterson CM, Chen Z, Hediger ML, Croughan MS, Sundaram R, Stanford JB, Fujimoto VY, Varner MW, Giudice LC, Kennedy A, Sun L, Wu Q, Kannan K. Perfluorochemicals and endometriosis: The ENDO Study. Epidemiology 2012;23:799-805. Buck Louis GM, Sundaram R, Schisterman EF, Sweeney AM, Lynch CD, Gore-Langton RE, Maisog J, Kim S, Chen Z, Barr DB. Persistent environmental pollutants and couple fecundity: the LIFE study. Environ Health Perspect 2013;121(2):231-6.

47
C8 Science Panel (Tony Fletcher, Kyle Steenland, David Savitz). Status Report: PFOA and immune biomarkers in adults exposed to PFOA in drinking water in the mid Ohio valley. March 2009. Callan AC, Rotander A, Thompson K, Heyworth J, Mueller JF, Odland JØ, Hinwood AL. Maternal exposure to perfluoroalkyl acids measured in whole blood and birth outcomes in offspring. Sci Total Environ 2016;569-570:1107-13. Campbell S, Raza M, Pollack AZ. Perfluoroalkyl substances and endometriosis in US women in NHANES 2003-2006. Reprod Toxicol 2016;65:230-235. Checkoway H, Pearce N, Kriebel D. Research Methods in Occupational Epidemiology, Second Edition. Oxford U. Press 2004. Chen MH, Ha EH, Wen TW, Su YN, Lien GW, Chen CY, Chen PC, Hsieh WS. Perfluorinated compounds in umbilical cord blood and adverse birth outcomes. PLoS One 2012;7(8):e42474. Christensen KY, Maisonet M, Rubin C, Holmes A, Calafat AM, Kato K, Flanders WD, Heron J, McGeehin MA, Marcus M. Exposure to polyfluoroalkyl chemicals during pregnancy is not associated with offspring age at menarche in a contemporary British cohort. Environ Int 2011;37:129-135. Community Advisory Board – Haven Well, City of Portsmouth, NH. Final Report on PFC Contamination in Pease Tradeport Wells. December 21, 2015. http://cityofportsmouth.com/CAB%20Final%20Report%20December%2014%202015.pdf Consonni D, Straif K, Symons JM, Tomenson JA, van Amelsvoort LG, Sleeuwenhoek A, Cherrie JW, Bonetti P, Colombo I, Farrar DG, Bertazzi PA. Cancer risk among tetrafluoroethylene synthesis and polymerization workers. Am J Epidemiol 2013;178:350-358. Daniels RD, Kubale TL, Yiin JH, Dahm MM, Hales TR, Baris D, Zahm SH, Beaumont JJ, Waters KM, Pinkerton LE. Mortality and cancer incidence in a pooled cohort of US firefighters from San Francisco, Chicago and Philadelphia (1950–2009). Occup Environ Med 2014;71:388-397. Darrow LA, Stein CR, Steenland K. Serum perfluorooctanoic acid and perfluorooctane sulfonate concentrations in relation to birth outcomes in the Mid-Ohio Valley, 2005-2010. Environ Health Perspect 2013;121(10):1207-13. Darrow LA, Howards PP, Winquist A, Steenland K. PFOA and PFOS serum levels and miscarriage risk. Epidemiology 2014;25(4):505-12. Darrow LA, Groth AC, Winquist A, Shin HM, Bartell SM, Steenland K. Modeled perfluorooctanoic acid (PFOA) exposure and liver function in a Mid-Ohio Valley Community. Environ Health Perspect 2016;124:1227-1233. Dhingra R, Lally C, Darrow LA, Klein M, Winquist A, Steenland K. Perfluorooctanoic acid and chronic kidney disease: Longitudinal analysis of a Mid-Ohio Valley community. Environ Res 2016a;145:85-92.

48
Dhingra R, Winquist A, Darrow LA, Klein M, Steenland K. A study of reverse causation: examining the associations of perfluorooctanoic acid serum levels with two outcomes. Environ Health Perspect 2016b Aug 16. [Epub ahead of print] Domazet SL, Grøntved A, Timmermann AG, Nielsen F, Jensen TK. Longitudinal associations of exposure to perfluoroalkylated substances in childhood and adolescence and indicators of adiposity and glucose metabolism 6 and 12 years later: The European Youth Heart Study. Diabetes Care 2016; 39(10):1745-51. Dong GH, Tung KY, Tsai CH, Liu MM, Wang D, Liu W, Jin YH, Hsieh WS, Lee YL, Chen PC. Serum polyfluoroalkyl concentrations, asthma outcomes, and immunological markers in a case-control study of Taiwanese children. Environ Health Perspect 2013; 121(4): 507-513, 513e501-508. Emmett EA, Zhang H, Shofer FS, Freeman D, Rodway NV, Desai C, Shaw LM. Community Exposure to Perfluorooctanoate: Relationships Between Serum Levels and Certain Health Parameters. J Occup Environ Med 2006;48:771-9. Fei C, McLaughlin JK, Tarone RE, Olsen J. Perfluorinated chemicals and fetal growth: a study within the Danish National Birth Cohort. Environ Health Perspect 2007;115(11):1677-82. Fei C, McLaughlin JK, Tarone RE, Olsen J. Fetal growth indicators and perfluorinated chemicals: a study in the Danish National Birth Cohort. Am J Epidemiol 2008;168(1):66-72. Fei C, McLaughlin JK, Lipworth L, Olsen J. Maternal levels of perfluorinated chemicals and subfecundity. Hum Reprod 2009;24(5):1200-5. Fisher M, Arbuckle TE, Wade M, Haines DA. Do perfluoroalkyl lsubstances affect metabolic function and plasma lipids?—Analysis of the 2007–2009, Canadian Health Measures Survey (CHMS) Cycle1. Environ Res 2013;121:95-103. Fitz-Simon N, Fletcher T, Luster MI, Steenland K, Calafat AM, Kato K, Armstrong B. Reductions in serum lipids with a 4-year decline in serum perfluorooctanoic acid and perfluorooctanesulfonic acid. Epidemiology 2013;24:569-76. Flanders WD, Lin L, Pirkle JL, Caudill SP. Assessing the direction of causality in cross-sectional studies. Am J Epidemiol 1992;135:926-935. Flanders WD, Klein M, Mirabelli MC. Conditions for valid estimation of causal effects on prevalence in cross-sectional and other studies. Ann Epidemiol 2016;26:389-394. Forns J, Iszatt N, White RA, Mandal S, Sabaredzovic A, Lamoree M, Thomsen C, Haug LS, Stigum H, Eggesbø M. Perfluoroalkyl substances measured in breast milk and child neuropsychological development in a Norwegian birth cohort study. Environ Int 2015;83:176-82. Frisbee SJ, Brooks Jr AP, Maher A, et al. The C8 health project: design, methods, and participants. Environ Health Perspect 2009;117:1873-1882.

49
Frisbee SJ, Shankar A, Knox SS, Steenland K, Savitz DA, Fletcher T, Ducatman AM. Perfluorooctanoic acid, perfluorooctanesulfonate, and serum lipids in children and adolescents: Results from the C8 Health Project. Arch Pediatr Adolesc Med 2010;164:860-869. Fu Y, Wang T, Fu Q, Wang P, Lu Y. Associations between serum concentrations of perfluoroalkyl acids and serum lipid levels in a Chinese population. Ecotoxicol Environ Saf 2014;106:246-52. Gallo V, Leonardi G, Genser B, Lopez-Espinosa MJ, Frisbee SJ, Karlsson L, Ducatman AM, Fletcher T. Serum perfluorooctanoate (PFOA) and perfluorooctane sulfonate (PFOS) concentrations and liver function biomarkers in a population with elevated PFOA exposure. Environ Health Perspect 2012;120:655–660. Geiger SD, Xiao J, Shankar A. Positive association between perfluoroalkyl chemicals and hyperuricemia in children. Am J Epidemiol 2013;177:1255-1262. Geiger SD, Xiao J, Ducatman A, Frisbee S, Innes K, Shankar A. The association between PFOA, PFOS and serum lipid levels in adolescents. Chemosphere 2014a;98:78-83. Geiger SD, Xiao J, Shankar A. No association between perfluoroalkyl chemicals and hypertension in children. Integr Blood Press Control 2014b;7:1-7. Gleason JA, Post GB, Fagliano JA Associations of perfluorinated chemical serum concentrations and biomarkers of liver function and uric acid in the US population (NHANES), 2007-2010. Environ Res 2015;136:8-14. Goudarzi H, Miyashita C, Okada E, Kashino I, Kobayashi S, Chen CJ, Ito S, Araki A, Matsuura H, Ito YM, Kishi R. Effects of prenatal exposure to perfluoroalkyl acids on prevalence ofallergic diseases among 4-year-old children. Environ Int 2016;94:124-32. Grandjean P, Andersen EW, Budtz-Jørgensen E, Nielsen F, Mølbak K, Weihe P, Heilmann C. Serum Vaccine Antibody Concentrations in Children Exposed to Perfluorinated Compounds. JAMA 2012;307: 391–397. Grandjean P, Heilmann C, Weihe P, Nielsen F, Mogensen UB, Budtz-Jørgensen E. Serum vaccine antibody concentrations in adolescents exposed to perfluorinated compounds. Environ Health Perspect 2016 Aug 9. [Epub ahead of print] Granum, Haug LS, Namork E, Stølevik SB, Thomsen C, Aaberge IS, van Loveren H, Løvik M, Nygaard UC. Pre-natal exposure to perfluoroalkyl substances may be associated with altered vaccine antibody levels and immune-related health outcomes in early childhood. J Immunotoxicol 2013; 10:4, 373-379. Grice MM, Alexander BH, Hoffbeck R, Kampa DM. Self-reported medical conditions in perfluorooctanesulfonyl fluoride manufacturing workers. J Occup Environ Med 2007;49:722-729. Gump BB, Wu Q, Dumas AK, Kannan K. Perfluorochemical (PFC) exposure in children: associations with impaired response inhibition. Environ Sci Technol 2011;45(19):8151-9.

50
Hamm MP, Cherry NM, Chan E, Martin JW, Burstyn I. Maternal exposure to perfluorinated acids and fetal growth. J Expo Sci Environ Epidemiol 2010;20(7):589-97. Hardell E, Kärrman A, van Bavel B, Bao J, Carlberg M, Hardell L. Case–control study on perfluorinated alkyl acids (PFAAs) and the risk of prostate cancer. Environ Int 2014;63:35-39. Hoffman K, Webster TF, Weisskopf MG, Weinberg J, Vieira VM. Exposure to polyfluoroalkyl chemicals and attention deficit/hyperactivity disorder in U.S. children 12-15 years of age. Environ Health Perspect 2010;118(12):1762-7. Humblet O, Diaz-Ramirez LG, Balmes JR, Pinney SM, Hiatt RA. Perfluoroalkyl Chemicals and Asthma among Children 12-19 Years of Age: NHANES (1999-2008). Environ Health Perspect 2014; 122(10): 1129-1133. Innes KE, Ducatman AM, Luster MI, Shankar A. Association of osteoarthritis with serum levels of the environmental contaminants perfluorooctanoate and perfluorooctane sulfonate in a large Appalachian population. Am J Epidemiol 2011;174:440-50. Islami F, Moreira DM, Boffeta P, Freedland SJ. A systematic review and meta-analysis of tobacco use and prostate cancer mortality and incidence in prospective cohort studies. Eur Urol 2014;66:1054-1064. Jain RB. Association between thyroid profile and perfluoroalkyl acids: data from NHNAES 2007-2008. Environ Res 2013;126:51-9. Jensen TK, Andersen LB, Kyhl HB, Nielsen F, Christesen HT, Grandjean P. Association between perfluorinated compound exposure and miscarriage in Danish pregnant women. PLoS ONE 2015;10(4): e0123496. Ji K, Kim S, Kho Y, Paek D, Sakong J, Ha J, Kim S, Choi K. Serum concentrations of major perfluorinated compounds among the general population in Korea: Dietary sources and potential impact on thyroid hormones. Environ Int 2012;45:78-85. Jørgensen KT, Specht IO, Lenters V, Bach CC, Rylander L, Jönsson BA, Lindh CH, Giwercman A, Heederik D, Toft G, Bonde JP. Perfluoroalkyl substances and time to pregnancy in couples from Greenland, Poland and Ukraine. Environ Health 2014;13:116. Karlsen M, Grandjean P, Weihe P, Steuerwald U, Oulhote Y, Valvi D. Early-life exposures to persistent organic pollutants in relation to overweight in preschool children. Reprod Toxicol 2016 Aug 3. [Epub ahead of print] Kataria A, Trachtman H, Malaga-Dieguez L, Trasande L. Association between perfluoroalkyl acids and kidney function in a cross-sectional study of adolescents. Environ Health 2015;14:89. Kato S, Itoh S, Yuasa M, Baba T, Miyashita C, Sasaki S, Nakajima S, Uno A, Nakazawa H, Iwasaki Y, Okada E, Kishi R. Association of perfluorinated chemical exposure in utero with maternal and infant thyroid hormone levels in the Sapporo cohort of Hokkaido Study on the Environment and Children's Health. Environ Health Prev Med 2016 Apr 30. [Epub ahead of print]

51
Kennedy GL, Symons JM. Carcinogenicity of Perfluoroalkyl Compounds. In J.C. Dewitt ed. Toxicological Effects of Perfluoroalkyl and Polyfluoroalkyl Substances, Molecular and Integrative Toxicology, Chapter 12. Springer (Switzerland 2015). Khalil N. Chapter 13. Epidemiological Findings. In J.C. DeWitt ed. Toxicological Effects of Perfluoroalkyl and polyfluoroalkyl Substances, Molecular and Integrative Toxicology. Springer International, Switzerland 2015. Khalil N, Chen A, Lee M, Czerwinski SA, Ebert JR, DeWitt JC, Kannan K. Association of Perfluoroalkyl Substances, Bone Mineral Density, and Osteoporosis in the U.S. Population in NHANES 2009-2010. Environ Health Perspect 2016;124:81-7. Kielsen K, Shamim Z, Ryder LP, Nielsen F, Grandjean P, Budtz-Jorgensen E, Heilmann C. Antibody response to booster vaccination with tetanus and diphtheria in adults exposed to perfluorinated alkylates. J Immunotoxicol 2016: 13:2, 270-273. Kim DH, Kim UJ, Kim HY, Choi SD, Oh JE. Perfluoroalkyl substances in serum from South Korean infants with congenital hypothyroidism and healthy infants--Its relationship with thyroid hormones. Environ Res 2016;147:399-404. Kishi R, Nakajima T, Goudarzi H, Kobayashi S, Sasaki S, Okada E, Miyashita C, Itoh S, Araki A, Ikeno T, Iwasaki Y, Nakazawa H. The Association of Prenatal Exposure to Perfluorinated Chemicals with Maternal Essential and Long-Chain Polyunsaturated Fatty Acids during Pregnancy and the Birth Weight of Their Offspring: The Hokkaido Study. Environ Health Perspect 2015;123(10):1038-45. Knox SS, Jackson T, Frisbee SJ, Javins B, Ducatman AM. Perfluorocarbon exposure, gender and thyroid function in the C8 Health Project. J Toxicol Sci 2011;36:403-410. Kristensen SL, Ramlau-Hansen CH, Ernst E, Olsen SF, Bonde JP, Vested A, Halldorsson TI, Becher G, Haug LS, Toft G. Long-term effects of prenatal exposure to perfluoroalkyl substances on female reproduction. Hum Reprod 2013;28(12):3337-48. Lau C. Perfluorinated Compounds: An Overview. In J.C. Dewitt ed. Toxicological Effects of Perfluoroalkyl and Polyfluoroalkyl Substances, Molecular and Integrative Toxicology, Chapter 12. Springer (Switzerland 2015). Lauritzen HB, Larose TL, Øien T, Sandanger TM, Odland JO, van de Bor M, Jacobsen GW. Maternal serum levels of perfluoroalkyl substances and organochlorines and indices of fetal growth: a Scandinavian case-cohort study, Pediatr Res 2017;81(1-1):33-42. Lee ES, Han S, Oh JE. Association between perfluorinated compound concentrations in cord serum and birth weight using multiple regression models. Reprod Toxicol 2016;59:53-9. Lenters V, Portengen L, Rignell-Hydbom A, Jönsson BA, Lindh CH, Piersma AH, Toft G, Bonde JP, Heederik D, Rylander L, Vermeulen R. Prenatal Phthalate, Perfluoroalkyl Acid, and Organochlorine Exposures and Term Birth Weight in Three Birth Cohorts: Multi-Pollutant Models Based on Elastic Net Regression. Environ Health Perspect 2016;124(3):365-72.
52
Lien GW, Huang CC, Shiu JS, Chen MH, Hsieh WS, Guo YL, Chen PC. Perfluoroalkyl substances in cord blood and attention deficit/hyperactivity disorder symptoms in seven-year-old children. Chemosphere. 2016;156:118-27. Liew Z, Ritz B, Bonefeld-Jørgensen EC, Henriksen TB, Nohr EA, Bech BH, Fei C, Bossi R, von Ehrenstein OS, Streja E, Uldall P, Olsen J. Prenatal exposure to perfluoroalkyl substances and the risk of congenital cerebral palsy in children. Am J Epidemiol 2014;180(6):574-81. Liew Z, Ritz B, von Ehrenstein OS, Bech BH, Nohr EA, Fei C, Bossi R, Henriksen TB, Bonefeld-Jørgensen EC, Olsen J. Attention deficit/hyperactivity disorder and childhood autism in association with prenatal exposure to perfluoroalkyl substances: a nested case-control study in the Danish National Birth Cohort. Environ Health Perspect 2015;123(4):367-73. Lin CY, Lin LY, Chiang CK, Wang WJ, Su YN, Hung KY, Chen PC. Investigation of the associations between low-dose serum perfluorinated chemicals and liver enzymes in US adults. Am J Gastroenterol 2010;105:1354-63. Lin CY, Wen LL, Lin LY, Wen TW, Lien GW, Hsu SH, Chien KL, Liao CC, Sung FC, Chen PC, Su TC. The associations between serum perfluorinated chemicals and thyroid function in adolescents and young adults. J Hazard Mater 2013;244-245:637-644. Lin LY, Wen LL, Su TC, Chen PC, Lin CY. Negative association between serum perfluorooctane sulfate concentration and bone mineral density in US premenopausal women: NHANES, 2005-2008. J Clin Endocrinol Metab 2014;99:2173-80. Loccisano AE, Campbell Jr. JL, Andersen ME, Clewell III HJ. Evaluation and prediction of pharmacokinetics of PFOA and PFOS in the monkey and human using a PBPK model. Regul Toxicol Pharmacol 2011;59:157-175. Looker C, Luster MI, Calafat AM, Johnson VJ, Burleson GR, Burleson FG, Fletcher T. Influenza Vaccine Response in Adults Exposed to Perfluorooctanoate and Perfluorooctanesulfonate. Toxicol Sci 2014; 138(1): 76–88. Lopez-Espinosa MJ, Fletcher T, Armstrong B, Genser B, Dhatariya K, Mondal D, Ducatman A, Leonardi G. Association of Perfluorooctanoic Acid (PFOA) and Perfluorooctane Sulfonate (PFOS) with age of puberty among children living near a chemical plant. Environ Sci Technol 2011;45:8160-8166. Lopez-Espinosa MJ, Mondal D, Armstrong B, Bloom MS, Fletcher T. Thyroid function and perfluoroalkyl acids in children living near a chemical plant. Environ Health Perspect 2012;120:1036-1041. Lopez-Espinosa MJ, Mondal D, Armstrong BG, Eskenazi B, Fletcher T. Perfluoroalkyl substances, sex hormones, and insulin-like growth factor-1 at 6–9 years of age: a cross-sectional analysis within the C8 Health Project. Environ Health Perspect 2016;124:1269-1275. Lundin JI, Alexander BH, Olsen GW, Church TR. Ammonium perfluorooctanoate production and occupational mortality. Epidemiol 2009;20:921-928.

53
Maisonet M, Terrell ML, McGeehin MA, Christensen KY, Holmes A, Calafat AM, Marcus M. Maternal concentrations of polyfluoroalkyl compounds during pregnancy and fetal and postnatal growth in British girls. Environ Health Perspect 2012;120(10):1432-7. Maisonet M, Näyhä S, Lawlor DA, Marcus M. Prenatal exposures to perfluoroalkyl acids and serum lipids at ages 7 and 15 in females. Environ Int 2015a;82:49-60. Maisonet M, Calafat AM, Marcus M, Jaakkola JJ, Lashen H. Prenatal exposure to perfluoroalkyl acids and serum testosterone concentrations at 15 years of age in female ALSPAC study participants. Environ Health Perspect 2015b;123:1325-1330. Mattsson K, Rignell-Hydbom A, Holmberg S, Thelin A, Jönsson BA, Lindh CH1, Sehlstedt A, Rylander L. Levels of perfluoroalkyl substances and risk of coronary heart disease: Findings from a population-based longitudinal study. Environ Res 2015;142:148-54. Melzer D, Rice N, Depledge MH, Henley WE, Galloway TS. Association between serum perfluorooctanoic acid (PFOA) and thyroid disease in the U.S. National Health and Nutrition Examination Survey. Environ Health Perspect 2010;118:686–692. Mogensen UB, Grandjean P, Heilmann C, Nielsen F, Weihe P, Budtz-Jorgensen E. Structural equation modeling of immunotoxicity associated with exposure to perfluorinated alkylates. Environ Health 2015;14:47. Mora AM, Oken E, Rifas-Shiman SL, Webster TF, Gillman MW, Calafat AM, Ye X, Sagiv SK. Prenatal exposure to perfluoroalkyl substances and adiposity in early and mid-childhood. Environ Health Perspect 2016 Jun 28. [Epub ahead of print] National Toxicology Program (NTP). Systematic Review of Immunotoxicity Associated With Exposure to Perfluorooctanoic acid (PFOA) or Perfluorooctane Sulfonate (PFOS). U.S. DHHS, May 11, 2016. Nelson JW, Hatch EE, Webster TF. Exposure to polyfluoroalkyl chemicals and cholesterol, body weight, and insulin resistance in the general U.S. population. Environ Health Perspect 2010;118:197-202. New Hampshire Division of Public Health Services, Department of Health and Human Services (NH DHHS). Pease PFC Blood Testing Program: April 2015 – October 2015. Pease Tradeport, Portsmouth, NH, June 2016. http://www.dhhs.nh.gov/dphs/documents/pease-pfc-blood-testing.pdf Nolan LA, Nolan JM, Shofer FS, Rodway NV, Emmett EA. The relationship between birth weight, gestational age and perfluorooctanoic acid (PFOA)-contaminated public drinking water. Reprod Toxicol 2009;27(3-4):231-8. Nolan LA, Nolan JM, Shofer FS, Rodway NV, Emmett EA. Congenital anomalies, labor/delivery complications, maternal risk factors and their relationship with perfluorooctanoic acid (PFOA)-contaminated public drinking water. Reprod Toxicol 2010;29(2):147-55.

54
Ode A, Kallen K, Gustafsson P, Rylander L, Jonsson BA, Olofsson P, Ivarsson SA, Lindh CH, Rignell-Hydbom A. Fetal Exposure to Perfluorinated Compounds and Attention Deficit Hyperactivity Disorder in Childhood. PLoS ONE 2014; 9(4): e95891. Ogden CL, Carroll MD, Lawman HG, Fryar CD, Kruszon-Moran D, Kit BK, Flegal KM. Trends in Obesity Prevalence Among Children and Adolescents in the United States, 1988-1994 Through 2013-2014. JAMA 2016;315:2292-2299. Olsen GW, Burlew MM, Marshall JC, Burris JM, Mandel JH. Analysis of episodes of care in a perfluorooctanesulfonyl fluoride production facility. J Occup Environ Med 2004;46:837-846. Oulhote Y, Steuerwald U, Debes F, et al. Behavioral difficulties in 7-year old children in relation to developmental exposure to perfluorinated alkyl substances. Environ Int 2016;97:237-245. Qin XD, Qian Z, Vaughn MG, Huang J, Ward P, Zeng XW, Zhou Y, Zhu Y, Yuan P, Li M, Bai Z, Paul G, Hao YT, Chen W, Chen PC, Dong GH, Lee YL. Positive associations of serum perfluoroalkyl substances with uric acid and hyperuricemia in children from Taiwan. Environ Pollution 2016;212:519-524. Raleigh KK, Alexander BH, Olsen GW, Ramachandran G, Morey SZ, Church TR, Logan PW, Scott LL, Allen EM. Mortality and cancer incidence in ammonium perfluorooctanoate production workers. Occup Environ Med 2014;71:500-506. Savitz DA, Stein CR, Bartell SM, Elston B, Gong J, Shin HM, Wellenius GA. Perfluorooctanoic acid exposure and pregnancy outcome in a highly exposed community. Epidemiology 2012a;23(3):386-92. Savitz DA, Stein CR, Elston B, Wellenius GA, Bartell SM, Shin HM, Vieira VM, Fletcher T. Relationship of perfluorooctanoic acid exposure to pregnancy outcome based on birth records in the mid-Ohio Valley. Environ Health Perspect 2012b;120(8):1201-7. Schecter A, Malik-Bass N, Calafat AM, Kato K, Colacino JA, Gent TL, Hynan LS, Harris TR, Malla S, Birnbaum L. Polyfluoroalkyl compounds in Texas children from birth through 12 years of age. Environ Health Perspect 2012;120:590-594. Shankar A, Xiao J, Ducatman A. Perfluoroalkyl chemicals and elevated serum uric acid in US adults. Clin Epidemiol 2011;3:251-258. Shankar A, Xiao J, Ducatman A. Perfluorooctanoic acid and cardiovascular disease in US adults. Arch Intern Med 2012;172:1397-403. Shin HM, Vieira VM, Ryan PB et al. Retrospective exposure estimation and predicted versus observed serum perfluorooctanoic acid concentrations for participants in the C8 Health Project. Environ Health Perspect 2011;119:1760-1765. Shrestha S, Bloom MS, Yucel R, Seegal RF, Wu Q, Kannan K, Rej R, Fitzgerald EF. Perfluoroalkyl substances and thyroid function in older adults. Environ Int 2015;75:206-14.

55
Starling AP, Engel SM, Richardson DB, Baird DD, Haug LS, Stuebe AM, Klungsøyr K, Harmon Q, Becher G, Thomsen C, Sabaredzovic A, Eggesbø M, Hoppin JA, Travlos GS, Wilson RE, Trogstad LI, Magnus P, Longnecker MP. Perfluoroalkyl substances during pregnancy and validated preeclampsia among nulliparous women in the Norwegian Mother and Child Cohort Study. Am J Epidemiol 2014;179(7):824-33. Steenland K, Tinker S, Frisbee S, Ducatman A, Vaccarino V. Association of perfluorooctanoic acid and perfluorooctane sulfonate with serum lipids among adults living near a chemical plant. Am J Epidemiol 2009;170:1268-1278. Steenland K Association of perfluorooctanoic acid (PFOA) and perfluorooctane sulfonate (PFOS) with uric acid among adults with elevated community exposure to PFOA. Environ Health Perspect 2010;118:229–233. Steenland K, Woskie S. Cohort mortality study of workers exposed to perfluorooctanoic acid. Am J Epidemiol. 2012;176:909–917. Steenland K, Zhao L, Winquist A, Parks C. 2013. Ulcerative colitis and perfluorooctanoic acid (PFOA) in a highly exposed population of community residents and workers in the mid-Ohio valley. Environ Health Perspect 2013; 121(8):900-5. Steenland K, Zhao L, Winquist A. A cohort incidence study of workers exposed to perfluorooctanoic acid (PFOA). Occup Environ Med 2015;72:373-380. Stein CR, Savitz DA, Dougan M. Serum levels of Perfluorooctanoic Acid and Perfluorooctane Sulfonate and pregnancy outcome. Am J Epidemiol. 2009;170:837–846. Stein CR, Savitz DA. Serum perfluorinated compound concentration and attention deficit/hyperactivity disorder in children 5-18 years of age. Environ Health Perspect 2011;119:1466-1471. Stein CR, Savitz DA, Bellinger DC. Perfluorooctanoate and neuropsychological outcomes in children. Epidemiology 2013;24:590-599. Stein CR, Savitz DA, Elston B, Thorpe PG, Gilboa SM. Perfluorooctanoate exposure and major birth defects. Reprod Toxicol. 2014a;47:15-20. Stein CR, Savitz DA, Bellinger DC. Perfluorooctanoate exposure in a highly exposed community and parent and teacher reports of behavior in 6-12-year-old children. Paediatr Perinat Epidemiol 2014b;28:146-156. Stein CR, McGovern KJ, Pajak AM, Maglione PJ, Wolff MS. Perfluoroalkyl and Polyfluoroalkyl Substances and Indicators of Immune function in children aged 12–19 y: National Health and Nutrition Examination Survey. Pediatr Res. 2016a; 79(2):348-57. Stein CR, Ge Y, Wolff MS et al. Perfluoroalkyl substance serum concentrations and immune response to FluMist vaccination among healthy adults. Environ Res 2016b;149:171-178.

56
Strøm M, Hansen S, Olsen SF, Haug LS, Rantakokko P, Kiviranta H, Halldorsson TI. Persistent organic pollutants measured in maternal serum and offspring neurodevelopmental outcomes--a prospective study with long-term follow-up. Environ Int 2014;68:41-8. Toft G, Jönsson BA, Bonde JP, Nørgaard-Pedersen B, Hougaard DM, Cohen A, Lindh CH, Ivell R, Anand-Ivell R, Lindhard MS. Perfluorooctane Sulfonate Concentrations in Amniotic Fluid, Biomarkers of Fetal Leydig Cell Function, and Cryptorchidism and Hypospadias in Danish Boys (1980-1996). Environ Health Perspect 2016;124(1):151-6. U.S. Air Force (USAF) (1990). Final Environmental Impact Statement for the Closure of Pease AirForce Base. May 1990. U.S. Air Force (USAF) (1994). Revised Community Relations Plan. Pease AFB. June 1994. U.S. Environmental Protection Agency (EPA). Provisional Health Advisories for Perfluorooctanoic Acid (PFOA) and Perfluorooctyl Sulfonate (PFOS); 2009. Available from http://water.epa.gov/action/advisories/drinking/upload/2009_01_15_criteria_drinking_pha-PFOA_PFOS.pdf U.S. Environmental Protection Agency (EPA). Fact Sheet – PFOS & PFOA Drinking Water Health Advisories. Ground Water and Drinking Water; 2016a. Available from: https://www.epa.gov/sites/production/files/2016-06/documents/drinkingwaterhealthadvisories_pfoa_pfos_updated_5.31.16.pdf U.S. Environmental Protection Agency (EPA). Third Unregulated Contaminant Monitoring Rule, July 2016b. Available from: https://www.epa.gov/dwucmr/occurrence-data-unregulated-contaminant monitoring-rule#3 Uhl SA, James-Todd J, Bell ML. Association of Osteoarthritis with Perfluorooctanoate and Perfluorooctane Sulfonate in NHANES 2003–2008. Environ Health Perspect 2013;121:447-452. Vélez MP, Arbuckle TE, Fraser WD. Maternal exposure to perfluorinated chemicals and reduced fecundity: the MIREC study. Hum Reprod. 2015;30(3):701-9. Verner MA, Loccisano AE, Morken NH, Yoon M, Wu H, McDougall R, Maisonet M, Marcus M, Kishi R, Miyashita C, Chen MH, Hsieh WS, Andersen ME, Clewell HJ 3rd, Longnecker MP. Associations of perfluoroalkyl substances (PFAS) with lower birth weight: an evaluation of potential confounding by glomerular filtration rate using a physiologically based pharmacokinetic model (PBPK). Environ Health Perspect 2015;123(12):1317-24. Vested A, Ramlau-Hansen CH, Olsen SF, Bonde JP, Kristensen SL, Halldorsson TI, Becher G, Haug LS, Ernst EH, Toft G. Associations of in utero exposure to perfluorinated alkyl acids with human semen quality and reproductive hormones in adult men. Environ Health Perspect 2013;121(4):453-8. Vesterholm Jensen D, Christensen J, Virtanen HE, Skakkebæk NE, Main KM, Toppari J, Veje CW, Andersson AM, Nielsen F, Grandjean P, Jensen TK. No association between exposure to perfluorinated compounds and congenital cryptorchidism: a nested case-control study among 215 boys from Denmark and Finland. Reproduction 2014;147(4):411-7.

57
Vieira VM, Hoffman K, Shin HM, Weinberg JM, Webster TF, Fletcher T. Perfluorooctanoic Acid Exposure and Cancer Outcomes in a Contaminated Community: A Geographic Analysis. Environ Health Perspect 2013;121:318–323. Vuong AM, Yolton K, Webster GM, Sjödin A, Calafat AM, Braun JM, Dietrich KN, Lanphear BP, Chen A. Prenatal polybrominated diphenyl ether and perfluoroalkyl substance exposures and executive function in school-age children. Environ Res 2016;147:556-64. Wan X, Wang W, Liu J, Tong T. Estimating the sample mean and standard deviation from the sample size, median, range and/or interquartile range. BMC Med Res Methodol 2014;14:135. Wang IJ, Hsieh WS, Chen CY, Fletcher T, Lien GW, Chiang HL, Chiang CF, Wu TN, Chen PC. The effect of prenatal perfluorinated chemicals exposures on pediatric atopy. Environ Res 2011; 111:785–791. Wang Y, Rogan WJ, Chen PC, Lien GW, Chen HY, Tseng YC, Longnecker MP, Wang SL. Association between maternal serum perfluoroalkyl substances during pregnancy and maternal and cord thyroid hormones: Taiwan maternal and infant cohort study. Environ Health Perspect 2014;122:529-34. Wang Y, Rogan WJ, Chen HY, Chen PC, Su PH, Chen HY, Wang SL. Prenatal exposure to perfluroalkyl substances and children's IQ: The Taiwan maternal and infant cohort study. Int J Hyg Environ Health 2015;218(7):639-44. Washino N, Saijo Y, Sasaki S, Kato S, Ban S, Konishi K, Ito R, Nakata A, Iwasaki Y, Saito K, Nakazawa H, Kishi R. Correlations between prenatal exposure to perfluorinated chemicals and reduced fetal growth. Environ Health Perspect 2009;117(4):660-7. Watkins DJ, Josson J, Elston B, Bartell SM, Shin H-M, Vieira VM, Savitz DA, Fletcher T, Wellenius GA. Exposure to perfluoroalkyl acids and markers of kidney function among children and adolescents living near a chemical plant. Environ Health Perspect 2013;121:625-630. Webster GM, Venners SA, Mattman A, Martin JW. Associations between perfluoroalkyl acids (PFASs) and maternal thyroid hormones in early pregnancy: a population-based cohort study. Environ Res 2014;133:338–347. Webster GM, Rauch SA, Marie NS, Mattman A, Lanphear BP, Venners SA. Cross-sectional associations of serum perfluoroalkyl acids and thyroid hormones in U.S. adults: variation according to TPOAb and iodine status (NHANES 2007-2008). Environ Health Perspect. 2016;124(7):935-42. Wen LL, Lin LY, Su TC, Chen PC, Lin CY. Association between serum perfluorinated chemicals and thyroid function in U.S. adults: The National Health and Nutrition Examination Survey 2007–2010. J Clin Endocrinol Metab 2013;98:E1456-E1464. Whitworth KW, Haug LS, Baird DD, Becher G, Hoppin JA, Skjaerven R, Thomsen C, Eggesbo M, Travlos G, Wilson R, Longnecker MP. Perfluorinated compounds and subfecundity in pregnant women. Epidemiology 2012a;23(2):257-63.

58
Whitworth KW, Haug LS, Baird DD, Becher G, Hoppin JA, Skjaerven R, Thomsen C, Eggesbo M, Travlos G, Wilson R, Cupul-Uicab LA, Brantsaeter AL, Longnecker MP. Perfluorinated compounds in relation to birth weight in the Norwegian Mother and Child Cohort Study. Am J Epidemiol. 2012b;175(12):1209-16. Winquist A, Steenland K. Perfluorooctanoic acid exposure and thyroid disease in community and worker cohorts. Epidemiology 2014a;25:255-264. Winquist A, Steenland K. Modeled PFOA exposure and coronary artery disease, hypertension, and high cholesterol in community and worker cohorts. Environ Health Perspect 2014b; 122:1299-1305. Wu K, Xu X, Peng L, Liu J, Guo Y, Huo X. Association between maternal exposure to perfluorooctanoic acid (PFOA) from electronic waste recycling and neonatal health outcomes. Environ Int 2012;48:1-8. Wu XM, Bennett DH, Calafat AM, Kato K, Strynar M, Andersen E, Moran RE, Tancredi DJ, Tulve NS, Hertz-Picciotto I. Serum concentrations of perfluorinated compounds (PFC) among selected populations of children and adults in California. Environ Res 2015;136:264-273. Zeng XW, Qian Z, Emo B, Vaughn M, Bao J, Qin XD, Zhu Y, Li J, Lee YL, Dong GH. Association of polyfluoroalkyl chemical exposure with serum lipids in children. Sc Total Environ 2015;512-513;364-370. Zhang Y, Beesoon S, Zhu L, Martin JW. Biomonitoring of perfluoroalkyl acids in human urine and estimates of biological half-life. Environ Sci Technol 2013;47:10619–10627. Zhou Y, Hu LW, Qian ZM, Chang JJ, King C, Paul G, Lin S, Chen PC, Lee YL, Dong GH. Association of perfluoroalkyl substances exposure with reproductive hormone levels in adolescents: By sex status. Environ International 2016;94:189-195. Zhu Y, Qin XD, Zeng XW, Paul G, Morawska L, Su MW, Tsai CH, Wang SQ, Lee YL, Dong GH. Associations of serum perfluoroalkyl acid levels with T-helper cell-specific cytokines in children: By gender and asthma status. Sci Total Environ 2016;559:166-73.

59
Tables

60
Table 1. Serum levels of selected PFAS in µg/L, children aged <12 years in Pease and comparison populations. PFAS
Pease Tradeport* TX† CA‡
Median
Geometric mean
95% CI
Max.
Median
Max.
Median
Geometric mean
Max.
PFOA 3.63 3.43 3.23 – 3.64 12.00 2.85 13.50 4.50 4.46 19.50 PFOS 8.27 8.11 7.59 – 8.67 30.80 4.10 93.90 6.15 6.28 26.70 PFHxS 4.24 3.83 3.48 – 4.22 31.70 1.20 31.20 1.25 1.30 9.80 PFNA 0.90 0.92 0.86 – 0.98 5.20 1.20 55.80 1.70 1.84 11.20
* Pease: N=366, aged <12 years; sampling occurred in 2015. † TX reference group: N=300, age ≤12 years (Schecter et al 2012), sampling occurred in 2009. ‡ CA reference group: N=68, ages 2-8 years (Wu et al 2015), sampling occurred in 2007-2009. Table 2. Serum levels of selected PFAS in µg/L, aged ≥12 years in Pease and NHANES comparison values.
PFAS
Pease Tradeport* NHANES 2013-2014†
Median Geometric
Mean
95% CI
Max.
Median Geometric
Mean
95% CI 95th
percentile
PFOA 3.10 2.99 2.87 – 3.11 32.00 2.07 1.94 1.76 – 2.14 5.57 PFOS 9.17 8.74 8.37 – 9.13 95.60 5.20 4.99 4.50 – 5.52 18.50 PFHxS 4.16 4.21 3.98 – 4.46 116.00 1.40 1.35 1.20 – 1.60 5.60 PFNA 0.70 0.68 0.65 – 0.70 4.90 0.70 0.68 0.61 – 0.72 2.00
*N=1,212 ages ≥12 years, sampled in 2015 † N=2,168 ages ≥12 years.

61
Table 3. Summary of the PFAS literature on adults. PFOS PFHxS PFOA Cancer Prostate + + + Bladder + * + Colorectal + * I Breast I I + Pancreatic I * + Testicular * * + Kidney * * + Thyroid * * + Liver * * + Leukemia * * + non-Hodgkin lymphoma * * + Multiple myeloma * * * Ovarian * * + Other diseases Kidney disease/kidney function * * + Hyperuricemia + I + Liver disease/liver function + + + Cardiovascular Disease, hypertension, hypercholesterolemia
+ + +
Thyroid disease/function + + + Autoimmune diseases * * + Osteoarthritis, osteoporosis and bone mineral density
+ + +
Immune response + + + Reproductive outcomes + + +
“+” One or more studies suggesting increased risk of an adverse outcome (e.g., OR or RR ≥ 1.20) “*” no studies were conducted (for liver cancer and PFOS, and multiple myeloma and PFOA, there were too few deaths (≤2) to evaluate). “I” inconclusive – the findings have not suggested an increased risk (e.g., an OR or RR <1.20)

62
Table 4. Summary of the PFAS literature on children. PFOS PFHxS PFOA Adverse birth outcomes + + + Lipids + I + Thyroid function + * + Thyroid disease I * + Uric acid + + + Sex hormones + + + Delay in reaching puberty + I + Neurobehavioral outcomes + + + Immune function + + + Hypertension I * I Adiposity/BMI/Overweight + + +
“+” One or more studies suggesting increased risk of an adverse outcome (e.g., OR or RR ≥ 1.20) “*” no studies were conducted. “I” inconclusive – the findings have not suggested an increased risk (e.g., an OR or RR <1.20) Note: adverse birth outcomes are not included in this table because these outcomes are not feasible to study at Pease. Although the number of children potentially exposed to the PFAS-contaminated drinking water while attending daycare at the Pease Tradeport can be estimated, there is a lack of information on the number of children potentially exposed in utero to the PFAS-contaminated drinking water because their mothers were employed at the Pease Tradeport during the pregnancy. To evaluate adverse birth outcomes with sufficient statistical power would require the inclusion of several hundreds of exposed births.

63
Table 5. Pease serum levels in µg/L for PFOS, PFOA and PFHxS, based on ages in 2018.
Population age (during 2018)
PFOS PFOA PFHxS
4 – 17 (N=379) Mean 9.66 3.85 5.47 SD 6.01 2.14 4.62
Median 8.09 3.40 4.10 Geometric mean 7.98 3.29 3.75 Maximum 30.80 12.00 31.70 Top quartile 12.70 5.00 7.60 Top quintile 14.20 5.41 8.79
≥18 (n=1,190) Mean 11.59 3.76 7.05 SD 9.63 2.74 8.75
Median 9.30 3.12 4.21 Geometric mean 8.82 3.02 4.26 Maximum 95.60 32.00 116.00 Top quartile 14.20 4.65 8.60 Top quintile 16.10 5.20 10.00
≥18, not a firefighter (n=1,092) Mean 10.95 3.75 6.52 SD 8.32 2.78 7.44
Median 8.97 3.10 4.08 Geometric mean 8.53 2.99 4.04 Maximum 78.00 32.00 61.40 Top quartile 13.70 4.62 8.10 Top quintile 15.50 5.10 9.45
Firefighter (n=98) Mean 18.70 3.93 12.95 SD 17.41 2.14 16.64
Median 11.75 3.40 8.14 Geometric mean 12.80 3.37 7.74 Maximum 95.60 12.10 116.00 Top quartile 23.10 5.26 14.70 Top quintile 28.64 5.90 17.46

64
Table 6a. Minimum detectable effects for a Pease children study with 350 exposed and 175 unexposed.*
Endpoint α and β = .05 α = .05, β=.20 α and β = .10 α = .10, β=.20 Total cholesterol (mean difference)
9.8 mg/dL 7.6 mg/dL 8.0 mg/dL 6.8 mg/dL
Hypercholesterolemia OR = 2.00 OR = 1.73 OR = 1.77 OR =1 .63 Hyperuricemia OR = 2.30 OR = 1.96 OR = 2.00 OR = 1.83 Uric acid (mean difference)
0.40 mg/dL 0.31 mg/dL 0.33 mg/dL 0.28 mg/dL
eGFR (mean difference)#
9.3 7.2 7.5 6.4
ADHD¶ OR = 2.47 OR = 2.09 OR = 2.13 OR = 1.94 ADHD + meds¶ OR = 3.50 OR = 2.80 OR = 2.89 OR = 2.52 Atopic dermatitis OR = 2.49 OR = 2.10 OR = 2.15 OR = 1.95 Asthma OR = 2.56 OR = 2.16 OR = 2.21 OR = 2.00 Rhinitis OR = 2.08 OR = 1.79 OR = 1.83 OR = 1.69 Hypertension OR = 2.12 OR = 1.80 OR = 1.85 OR = 1.69 Overweight/Obese OR = 2.18 OR = 1.85 OR = 1.90 OR = 1.75
Table 6b. Minimum detectable effects for a Pease children study with 500 exposed and 250 unexposed.*
Endpoint α and β = .05 α = .05, β=.20 α and β = .10 α = .10, β=.20 Total cholesterol (mean difference)
8.2 mg/dL 6.4 mg/dL 6.7 mg/dL 5.7 mg/dL
Hypercholesterolemia OR = 1.78 OR = 1.57 OR = 1.60 OR =1 .50 Hyperuricemia OR = 2.04 OR = 1.75 OR = 1.79 OR = 1.65 Uric acid (mean difference)
0.34 mg/dL 0.26 mg/dL 0.27 mg/dL 0.23 mg/dL
eGFR (mean difference)#
7.7 6.0 6.3 5.4
ADHD¶ OR = 2.18 OR = 1.85 OR = 1.90 OR = 1.73 ADHD + meds¶ OR = 2.98 OR = 2.40 OR = 2.48 OR = 2.19 Atopic dermatitis OR = 2.20 OR = 1.86 OR = 1.91 OR = 1.74 Asthma OR = 2.26 OR = 1.91 OR = 1.96 OR = 1.78 Rhinitis OR = 1.85 OR = 1.62 OR = 1.65 OR = 1.54 Hypertension OR = 1.88 OR = 1.64 OR = 1.68 OR = 1.56 Overweight/Obese OR = 1.93 OR = 1.69 OR = 1.73 OR = 1.60
* Some health-related endpoints are not included in the table because there was insufficient information to calculate minimum detectable effects. For sex hormones, insulin-like growth factor – 1, and thyroid function, see the appendix for a description of the assumptions used in the sample size calculations and the resulting calculations.
# mL/min/1.73 m2

65
¶ The prevalence of an ADHD diagnosis reported by a study participant in the C8 study (Stein 2011) was 12.4%. In this study, the prevalence of an ADHD diagnosis reported by a study participant who also reported currently using a medication commonly used to treat ADHD was 5.1%.

66
Table 6c. Summary of information used to categorize the feasibility of studying health-related endpoints for a Pease children study.
Health-related Endpoint
Minimum Detectable Effect Size: 350 exposed, 175 unexposed
Other Sample Size Considerations Conclusion
Lipids (total cholesterol)
6.8 mg/dL A Taiwan study (Zeng 2015) obtained mean differences of 11-12 mg/dL for total cholesterol and low density lipoprotein at PFOA serum levels similar to Pease.
Feasible to study at Pease
Estimated glomerular filtration rate (eGFR)
5.5 mL/min/1.73 m2 A NHANES study (Kataria 2015) observed a mean difference of 6.6 mL/min/1.73 m2 for PFOA serum levels similar to those at Pease. For PFOS, the mean difference was 7.2 mL/min/1.73 m2
Feasible to study at Pease
Insulin-like growth hormone-1 (IGF-1)
See appendix for sample size calculations and assumptions required for the calculations.
A C8 study (Lopez-Espinosa 2016) observed a reduction of IGF-1 for PFHxS serum levels similar to those at Pease that could be detected with sufficient power by a sample size of 350 exposed and 175 unexposed.
Feasible to study at Pease.
Overweight/Obesity OR=1.62 A Faroes study (Karlsen 2016) observed and OR of 1.88 for PFOA serum levels below those at Pease. This OR could be detected with a sample size of 350 exposed and 175 unexposed children. The prevalence of obesity in children is 17% (Ogden 2016)
Feasible to study at Pease.
Hypercholesterolemia OR=1.63 A NHANES study (Geiger 2014) obtained ORs of 1.49 and 1.35
for serum PFOA and PFOS levels similar to those at Pease. To detect an OR of 1.49 with 80% power requires a minimum of 540 exposed and 270 unexposed
Possible to study at Pease although a sample size of at least 500 exposed and 250 unexposed would be necessary (see table 6b).
Uric acid 0.28 mg/dL A NHANES study (Kataria 2015) obtained a mean difference of 0.21 mg/dL for PFOA serum levels similar to Pease. However, for PFOS, the mean difference was 0.05 mg/dL.
Possible to study at Pease although a larger sample size than 500 exposed and 250 unexposed would be necessary.

67
Health-related Endpoint
Minimum Detectable Effect Size
Other Sample Size Considerations Conclusion
Hyperuricemia OR=1.83 A Taiwan study (Qin 2016) obtained an OR of 1.65 for PFHxS serum levels much lower than at Pease. For PFOA serum levels lower than at Pease, an OR of 2.2 was obtained.
Possible to study at Pease although a sample size of at least 500 exposed and 250 exposed may be necessary to evaluate the effect of serum PFHxS. (For serum PFOA, the Pease sample size of 350 exposed and 175 unexposed may be sufficient)
IQ 3 point mean difference
A Taiwan study (Wang 2015) obtained IQ mean differences of ≤2 points for PFOS serum levels higher than at Pease. A C8 study (Stein 2013) did not find a decrease in IQ with PFOA exposure and did not evaluate PFOS or PFHxS.
Possible to study at Pease although a sample size larger than 500 exposed and 250 unexposed would be necessary.
Neurobehavioral Could not be calculated due to insufficient information
Some studies had sample sizes achievable at Pease while others had much larger sample sizes. The effects observed were not large (e.g., an OR for learning problems was 1.2 for PFHxS and lower for the other PFAS, and ORs for hyperactivity and coordination problems were <1.5 for each of the PFAS). The few studies that have been conducted evaluated different neurobehavioral tests.
Similar conclusion as for IQ: Possible to study at Pease although a sample size larger than 500 exposed and 250 unexposed would be necessary.
Sex hormones See appendix for sample size calculations and assumptions required for the calculations.
At PFOS serum levels much higher than at Pease, a C8 study (Lopez-Espinosa 2016) observed reductions in estradiol that would require a sample size of over a thousand of exposed to achieve sufficient statistical power. However, the observed reductions in testosterone would require a sample size of between 500 and 1,000 exposed.
Possible to study at Pease although a sample size larger than 500 exposed and 250 unexposed would be necessary.

68
Health-related Endpoint
Minimum Detectable Effect Size
Other Sample Size Considerations Conclusion
Thyroid function See appendix for sample size calculations and assumptions required for the calculations.
A C8 study (Lopez-Espinosa 2012) observed small differences for PFOS and PFOA serum levels considerably higher than at Pease. To detect these differences would require a sample size of over a thousand exposed. On the other hand, a Taiwan study (Lin 2013) observed differences that could be detected with sufficient power with a sample size of 350 exposed and 175 unexposed.
Possible to study at Pease.
Liver function/CK-18 Could not be calculated due ot insufficient information
No PFAS study has evaluated liver function or fatty liver disease biomarkers in children. In a meta-analysis (Anderson 2015), the prevalence of non-alcoholoic fatty liver disease was 11% among those aged >5 - ≤15 years. Higher prevalences occur among children who are overweight. Childhood studies that evaluated biomarker CK-18 have used sample sizes smaller than those anticipated at Pease, but these studies included a high proportion of children with fatty liver disease.
Possible to study at Pease
Atopic dermatitis OR=1.95 A Taiwan study (Wang 2011) obtained an OR of 2.19 for PFOS serum levels similar to Pease. However, the study evaluated children aged 2 years. No other PFAS study evaluated atopic dermatitis
Possible to study at Pease.
Asthma OR=2.00 Two NHANES studies (Humblet 2014, Stein 2016) observed ORs between 1.2 and 1.3 which would require a sample size of over 2,000 exposed. However, a Taiwan study (Dong 2013) obtained ORs between 3.8 and 4.0 for PFHxS and PFOA serum levels lower than at Pease.
Possible to study at Pease.
Rhinitis OR=1.69 A NHANES study (Stein 2016a) evaluated rhinitis and obtained an OR of 1.35 for serum PFOA similar to those at Pease. To detect this OR would require over a thousand exposed. However, ORs between 1.5 and 1.6 could be detected with sufficient statistical power with a sample size of 500 exposed and 250 unexposed. These are ORs that are reasonable to detect and fall within the 95% CI for the finding in the NHANES study.
Possible to study at Pease

69
Health-related Endpoint
Minimum Detectable Effect Size
Other Sample Size Considerations Conclusion
Antibody response to childhood vaccines
Could not be calculated due to insufficient information
Three studies that have been conducted of these endpoints had sample sizes that could be achievable at Pease. Only two studies (Granum 2013, Stein 2016) have evaluated the same endpoint – rubella.
Possible to study at Pease although a sample size larger than 500 exposed and 250 exposed may be necessary.
Attention deficit/hyperactivity disorder (ADHD)
ORs: 1.9 – 2.5 A C8 study (Stein 2011) obtained an OR of 1.55 (ADHD + meds) for PFHxS serum levels similar to Pease. A NHANES study (Hoffman 2010) observed an OR of 1.67 for PFHxS serum levels similar to Pease.
Not feasible to study using the Pease population alone (for ADHD confirmed by current medications)
Autism spectrum disorder (ASD)
ORs > 4.0 One study (Liew 2015) obtained an OR of 1.3 for serum PFHxS levels lower than at Pease. To detect this OR would require >10,000 exposed.
Not feasible to study using the Pease population alone.
Delayed puberty Could not be calculated due to insufficient information
Only one study evaluated delayed puberty among children. This was a C8 study (Lopez-Espinosa 2011) that evaluated several thousand children. It is likely that sample sizes much larger than at Pease would be necessary.
Not feasible to study using the Pease population alone.
Thyroid disease OR > 8.0 A C8 study (Lopez-Espinosa 2012) obtained an OR of 1.44 for PFOA serum levels considerably higher than those in the Pease population. To detect this OR with 80% statistical power would require a sample size of over 10,000 exposed children.
Not feasible to study using the Pease population alone.
Childhood cancers No PFAS study has evaluated childhood cancers. Given the incidence and prevalence of cancers such as leukemia, a sample size of many thousands of exposed would be necessary.
Not feasible to study using the Pease population alone.
The minimum detectable effect size is based on a sample size of 350 children exposed and 175 children unexposed, and specifying statistical power of 80% (or a type 2 or “β” error of .20) and a type 1 (“α”) error of .10 (see table 6a). This minimum detectable effect size is compared to the adverse effect sizes observed in other PFAS studies. Where possible, the focus is on adverse effect sizes in the PFAS studies observed for PFAS serum levels similar to those among the Pease children. An endpoint is considered feasible to study at Pease if an adverse effect size observed in PFAS study can be detected with sufficient statistical power (i.e., statistical power of ≥80%) by a sample size achievable at Pease, i.e., a sample size of 350 exposed children at Pease and 175 children unexposed to the PFAS-contaminated drinking water at Pease. If

70
only one PFAS study has been conducted on a health-related endpoint, then the endpoint was considered feasible to study at Pease if an odds ratio of <2.0 could be detected with statistical power of 80%. Note: The studies mentioned in the column of the table labeled “Other Sample Size Considerations” are included only to give a sense of the adverse effect sizes that might occur in a Pease study. Due to the paucity of studies for each health-related endpoint, there is considerable uncertainty concerning the effect sizes that might be expected to occur in a Pease study. OR: Odds ratio. The odds ratio roughly approximates the risk ratio. The risk ratio is the proportion of the exposed population with a disease divided by the proportion of the unexposed population with a disease. Note: Hypertension is not included in this table because there is no evidence so far of an association between PFAS serum levels and hypertension in children. Liver function and fatty acid biomarkers are not included in this table because no study has been done to evaluate these biomarkers and PFAS exposure in children. Adverse birth outcomes are not included in this table because these outcomes are not feasible to study at Pease. Although the number of children potentially exposed to the PFAS-contaminated drinking water while attending daycare at the Pease Tradeport can be estimated, there is a lack of information on the number of children potentially exposed in utero to the PFAS-contaminated drinking water because their mothers were employed at the Pease Tradeport during the pregnancy. To evaluate adverse birth outcomes with sufficient statistical power would require the inclusion of several hundreds of exposed births. Note: The health-related endpoints listed in this table satisfy the criteria of scientific importance and public health significance as discussed on page 8 of the text.

71
Table 7a. Minimum detectable effects for an adult epidemiological study, 1,500 per stratum.*
* Some health-related endpoints are not included in the table because there was insufficient information to calculate minimum detectable effects. For thyroid function, see the appendix for a description of the assumptions used in the sample size calculations and the resulting calculations.
Endpoint α and β = .05 α = .05, β=.20 α and β = .10 α = .10, β=.20 Chronic kidney disease OR=2.54 OR=2.14 OR=2.20 OR=2.00 Thyroid disease, unconfirmed OR=1.48 OR=1.36 OR=1.38 OR=1.32 Thyroid disease, confirmed OR=1.63 OR=1.48 OR=1.50 OR=1.42 Total cholesterol (mean difference)
5.5 mg/dL 4.3 mg/dL 4.5 mg/dL 3.8 mg/dL
LDL (mean difference) 4.5 mg/dL 3.5 mg/dL 3.7 mg/dL 3.1 mg/dL Hypercholesterolemia OR=1.42 OR=1.32 OR=1.34 OR=1.28 Uric acid (mean difference) 0.21 mg/dL 0.17 mg/dL 0.18 mg/dL 0.15 mg/dL Hyperuricemia OR=1.35 OR=1.27 OR=1.28 OR=1.24 Elevated ALT (>45 IU/L, men; >34 IU/L, women)
OR=1.49 OR=1.37 OR=1.39 OR=1.33
Elevated GGT (>55 IU/L, men; >38 IU/L, women)
OR=1.44 OR=1.33 OR=1.35 OR=1.29
Elevated direct bilirubin (>0.03 mg/dL)
OR=2.80 OR=2.34 OR=2.40 OR=2.16
ALT (mean difference) 2.65 IU/L 2.06 IU/L 2.15 IU/L 1.83 IU/L GGT (mean difference) 5.92 IU/L 4.60 IU/L 4.80 IU/L 4.09 IU/L Direct bilirubin (mean difference)
0.079 mg/dL 0.060 mg/dL 0.064 mg/dL 0.055 mg/dL
Liver disease OR=2.24 OR=1.92 OR=1.97 OR=1.80 Cardiovascular disease OR=1.45 OR=1.34 OR=1.36 OR=1.30 Hypertension OR=1.31 OR=1.24 OR=1.25 OR=1.21 Ulcerative colitis OR=4.13 OR=3.24 OR=3.38 OR=2.94 Rheumatoid arthritis OR=2.70 OR=2.25 OR=2.32 OR=2.10 Lupus OR=6.87 OR=4.97 OR=5.24 OR=4.33 Multiple Sclerosis OR=5.30 OR=3.97 OR=4.15 OR=3.50 Osteoporosis OR=1.73 OR=1.55 OR=1.58 OR=1.48 Osteoarthritis OR=1.58 OR=1.44 OR=1.46 OR=1.39 Endometriosis (750 per stratum)
OR=1.92 OR=1.69 OR=1.73 OR=1.61
Pregnancy-induced hypertension (750 per stratum)
OR=1.84 OR=1.63 OR=1.66 OR=1.55
Kidney cancer OR=5.60 OR=4.27 OR=4.45 OR=3.80

72
Table 7b. Summary of information used to categorize the feasibility of studying health-related endpoints for a Pease adult study.
Health-related Endpoint
Minimum Detectable Effect Size: 1,500 exposed and 1,500 unexposed
Other Sample Size Considerations Conclusion
Lipids (total cholesterol) 3.8 mg/dL A C8 study (Steenland 2009) observed a 3 – 4 mg/dL change in total cholesterol and LDL for PFOS serum levels similar to those at Pease.
Feasible to study at Pease
Hypercholesterolemia OR=1.28 A Canadian study (Fisher 2013) obtained an OR of 1.57 for PFHxS serum levels similar to those at Pease.
Feasible to study at Pease
Uric acid 0.15 mg/dL A NHANES study (Shankar 2011) observed a mean difference of 0.40 mg/dL for serum PFOA levels similar to those at Pease.
Feasible to study at Pease
Hyperuricemia OR=1.24 A NHANES study (Shankar 2011) obtained an OR of 1.90 for serum PFOA levels similar to those at Pease.
Feasible to study at Pease
Thyroid disease (unconfirmed)
OR=1.32 A C8 study (Winquist 2014a), hazard ratios ≤1.3 were obtained for PFOA serum levels similar to those at Pease. (Only PFOA was evaluated in this study.)
Feasible to study at Pease
Cardiovascular disease OR=1.30 A NHANES study (Shankar 2012) obtained an OR of 2.01 for PFOA serum levels similar to those at Pease.
Feasible to study at Pease
Hypertension OR=1.21 Only one community study (a C8 study, Winquist 2014b), evaluated hypertension and obtained an OR < 1.0 for serum PFOA (the only PFAS evaluated). However, the sample size achievable at Pease is capable of detecting very low ORs with sufficient statistical power.
Feasible to study at Pease
Osteoarthritis OR=1.39 A NHANES study (Uhl 2013) obtained an OR of 1.5 for serum PFOA levels similar to those at Pease.
Feasible to study at Pease
Osteoporosis
OR=1.48 A NHANES study (Khalil 2016) obtained an OR > 10 among women, for serum PFHxS levels lower than those at Pease.
Feasible to study at Pease

73
Health-related Endpoint
Minimum Detectable Effect Size
Other Sample Size Considerations Conclusion
Serum Immune Biomarkers
Could not be calculated due to insufficient information
Only one published study (Stein 2016b) has been conducted that evaluated serum immune biomarkers at baseline (i.e., cross-sectionally). This study had a sample size of 75 adults. A cross-sectional evaluation of PFAS serum levels and immune biomarkers in a Pease adult study could provide important information on the effects of PFAS exposures on immune function in humans.
Feasible to study at Pease
Liver function: Elevated ALT Elevated GGT Elevated direct bilirubin CK-18
OR=1.33 OR=1.29 OR=2.16 Not studied
A NHANES study (Gleason 2015) evaluated PFAS serum levels similar to those at Pease. For elevated ALT, ORs between1.2 and 1.5 were obtained. For elevated GGT, ORs between 1.0 and 1.3 were obtained. For elevated direct bilirubin, ORs between 1.1 and 1.7 were obtained. No study has evaluated PFAS exposures and fatty liver disease biomarker CK-18
Possible to study at Pease, but may require a larger sample size than 1,500 exposed and 1,500 unexposed to evaluate PFOS and PFHxS serum levels and ALT and GGT. Direct bilirubin is probably not feasible to study using the Pease population alone.
Thyroid disease (confirmed)
OR=1.42 A C8 study (Winquist 2014a), hazard ratios ≤1.3 were obtained for PFOA serum levels similar to those at Pease. (Only PFOA was evaluated in this study.)
Possible to study at Pease, but will require a larger sample size than 1,500 exposed and 1,500 unexposed.
Thyroid function See appendix for sample size calculations and assumptions required for the calculations.
A C8 study (Knox 2011) observed very subtle changes that would require a study of equivalent size (52,296) to detect associations with sufficient statistical power. On the other hand, a NHANES study (Wen 2013) observed larger changes (at PFAS serum levels similar to those at Pease) that could be detected with a sample size achievable at Pease.
Possible to study at Pease.

74
Health-related Endpoint
Minimum Detectable Effect Size
Other Sample Size Considerations Conclusion
Endometriosis OR=1.61 (750 exposed & 750 unexposed)
A NHANES study (Campbell 2016) obtained ORs of 1.47 and 2.86 for serum PFHxS and PFOA, respectively. The serum levels for these two PFAS were similar to those in the Pease population.
Possible to study at Pease if sufficient numbers of women can be recruited.
Pregnancy-induced hypertension
OR=1.55 (750 exposed pregnancies and 750 unexposed pregnancies
A C8 study (Stein 2009, Darrow 2013) obtained an OR of 1.6 for serum PFOS levels higher than at Pease.
Possible to study at Pease but may require a larger sample size than 1,500 exposed and 1,500 unexposed in order to achieve a sufficient number of pregnancies.
Liver disease OR=1.80 A C8 study (Darrow 2016) and a NHANES study
(Melzer 2010) observed no elevation in liver disease. However, the C8 study evaluated only PFOA and the NHANES study evaluated PFOA and PFOS but not PFHxS.
Not feasible to study using the Pease population alone.
Kidney disease OR=2.00 A C8 study (Dhingra 2016a) evaluated only PFOA and obtained ORs of 1.26 and 1.36 for the retrospective and prospective analyses, respectively, at the second quintile PFOA serum level. (Smaller ORs were observed at higher PFOA serum levels.)
Not feasible to study using the Pease population alone.
Ulcerative colitis OR=2.94 A C8 study (Steenland 2013) observed RRs between 2.8 and 3.1 at the highest serum PFOA levels, considerably higher than those at Pease. At lower PFOA serum levels, the RRs were <2.2
Not feasible to study using the Pease population alone.
Rheumatoid arthritis OR=2.10 A C8 study (Steenland 2013) observed RRs between 1.3 and 1.7 for serum PFOA.
Not feasible to study using the Pease population alone.
Lupus OR=4.33 A C8 study (Steenland 2013) observed RRs <1.3 for serum PFOA.
Not feasible to study using the Pease population alone.
Multiple sclerosis OR=3.50 A C8 study (Steenland 2013) observed RRs between 1.1 and 1.6 for serum PFOA
Not feasible to study using the Pease population alone.
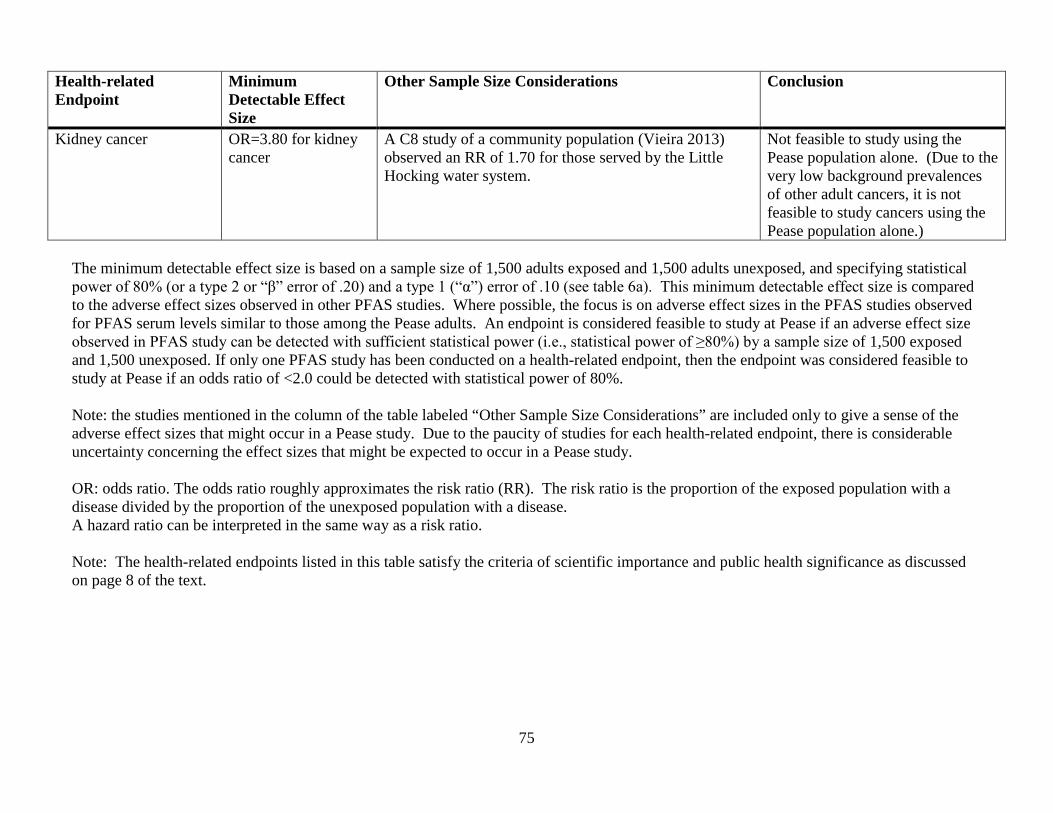
75
Health-related Endpoint
Minimum Detectable Effect Size
Other Sample Size Considerations Conclusion
Kidney cancer OR=3.80 for kidney cancer
A C8 study of a community population (Vieira 2013) observed an RR of 1.70 for those served by the Little Hocking water system.
Not feasible to study using the Pease population alone. (Due to the very low background prevalences of other adult cancers, it is not feasible to study cancers using the Pease population alone.)
The minimum detectable effect size is based on a sample size of 1,500 adults exposed and 1,500 adults unexposed, and specifying statistical power of 80% (or a type 2 or “β” error of .20) and a type 1 (“α”) error of .10 (see table 6a). This minimum detectable effect size is compared to the adverse effect sizes observed in other PFAS studies. Where possible, the focus is on adverse effect sizes in the PFAS studies observed for PFAS serum levels similar to those among the Pease adults. An endpoint is considered feasible to study at Pease if an adverse effect size observed in PFAS study can be detected with sufficient statistical power (i.e., statistical power of ≥80%) by a sample size of 1,500 exposed and 1,500 unexposed. If only one PFAS study has been conducted on a health-related endpoint, then the endpoint was considered feasible to study at Pease if an odds ratio of <2.0 could be detected with statistical power of 80%. Note: the studies mentioned in the column of the table labeled “Other Sample Size Considerations” are included only to give a sense of the adverse effect sizes that might occur in a Pease study. Due to the paucity of studies for each health-related endpoint, there is considerable uncertainty concerning the effect sizes that might be expected to occur in a Pease study. OR: odds ratio. The odds ratio roughly approximates the risk ratio (RR). The risk ratio is the proportion of the exposed population with a disease divided by the proportion of the unexposed population with a disease. A hazard ratio can be interpreted in the same way as a risk ratio. Note: The health-related endpoints listed in this table satisfy the criteria of scientific importance and public health significance as discussed on page 8 of the text.

76
Appendix

77
Literature review The literature review focused on the epidemiological results for PFOA, PFOS and PFHxS since these were the major contaminants detected in the Haven Well during the April and May 2014 sampling as well as the elevated PFAS in the serum of those tested in the NH DHHS Pease testing program. The purpose of the literature review was to identify the health-related endpoints that have been evaluated in at least one epidemiological study, and to assess the extent of the epidemiological research on the health effects of PFHxS and PFOS. The findings of the studies included in the literature review were also used to inform sample size calculations. Literature searches using PubMed were conducted to identify epidemiological studies that evaluated measured or estimated serum levels of PFOS, PFOA and PFHxS. The key words used in the search were perfluorooctane sulfonate, PFOS, perfluorooctanoic acid, PFOA, perfluorohexane sulfonate, PFHxS, perfluoroalkyl substances, PFAS, perfluorinated compounds, PFC, and perfluorinated chemicals. The PubMed search identified epidemiological studies through October 31, 2016. Cancers The C8 science panel in 2012 reviewed the literature on PFAS and cancers and concluded that there was a “probable link” between exposure to PFOA and testicular and kidney cancer (http://www.c8sciencepanel.org/pdfs/Probable_Link_C8_Cancer_16April2012_v2.pdf). No other cancers were considered to have a probable link with PFOA exposure. The panel noted that PFOA caused liver, testicular and pancreatic tumors (adenomas) in rodent studies. A review of the literature by DuPont researchers noted that PFOS causes liver adenomas in rodent studies (Kennedy and Symons 2015) but concluded that the evidence of associations between community drinking water exposures to PFOA and kidney and testicular cancers was “limited”. The review also concluded that studies of populations exposed to low levels of PFOA and PFOS had equivocal results with no consistent associations across studies. Studies of workers exposed to higher levels of PFOS and PFOA were also viewed as lacking consistent associations. Their overall conclusion was: “Based on the evidence reported to date, the prospect for developing a carcinogenic outcome following exposure to PFOA and PFOS is remote.” ATSDR’s literature search identified fifteen studies and the results from these studies are summarized in Table A2. Based on its assessment of the epidemiological literature, ATSDR concluded that for most cancers there was either limited information or no information concerning associations with PFAS exposures. In particular, very few studies have evaluated PFHxS exposures and cancers. Although more information is available for PFOS exposure and cancers, the information is still very limited. Clearly more research is needed to investigate whether PFHxS and PFOS exposures are associated with increased risks of specific cancers. More information is available on PFOA exposure and cancers because of the studies conducted of the C8 population (workers and community members) and of workers at the 3M Cottage Grove plant. However, the available information is still too limited to determine whether a causal association exists between PFOA exposure and specific cancers. While cancer research at Pease is not feasible, additional research on the effects of PFOA exposure on specific cancers has the potential to provide the evidence necessary to assess whether PFOA is a cause of one or more specific cancers.

78
Other adult diseases (Table A3) The C8 science panel reviewed the literature for adult non-cancer diseases and found probable links for PFOA and ulcerative colitis (an autoimmune disease), hypercholesterolemia (high cholesterol), thyroid disease (hyperthyroidism in females, hypothyroidism in males), and pregnancy-induced hypertension (PIH). The panel concluded that the evidence was not sufficient for a probable link between PFOA and other autoimmune diseases (e.g., lupus, rheumatoid arthritis and Crohn’s disease), stroke, hypertension, coronary artery disease, diabetes, chronic kidney or liver disease, asthma, chronic obstructive pulmonary disease, osteoarthritis or Parkinson disease (http://www.c8sciencepanel.org/prob_link.html). Another review of the literature noted that PFOA was linked to uric acid levels and that PFAS exposure was associated with elevated liver enzymes, osteoarthritis, kidney disease and immunotoxicity in some studies, but the findings across studies were inconsistent (Khalil 2015). The following literature review of other adult diseases focuses on studies of populations (e.g., studies utilizing NHANES data) and highly exposed communities (e.g., the C8 population). In these studies, the exposure assessment is based on serum PFAS levels, either measured or predicted based on physiologically-based pharmacokinetic (PBPK) models. We use the same classification scheme for the other adult diseases as was used above for cancers. 1. Kidney function/kidney disease Two studies of the C8 population were conducted to evaluate kidney disease or kidney function. The first study of chronic kidney disease used both a retrospective and prospective longitudinal approach (Dhingra 2016a). In the retrospective approach, there were 397 confirmed cases arising from a cohort of 32,254. Of the 397 cases, 187 were non-diabetic. In the prospective approach, the cohort was restricted to those who were kidney disease-free at the baseline interview (2005-2006) and evaluated 212 confirmed cases (106 non-diabetic) that occurred after the baseline interview. Analyses were also conducted restricting the cohort and the kidney disease cases to those without diabetes. The study evaluated yearly modeled PFOA serum concentrations and cumulative exposure. In the full cohort, the estimated hazard ratio (HR) in the top quintile of cumulative serum PFOA in the retrospective analysis was 1.24 (95% CI: 0.88, 1.75), and the trend was not monotonic. In the prospective analysis, the HR in the top quintile was 1.12 (95% CI: 0.72, 1.75) and the trend was also not monotonic. Similar findings were obtained for the non-diabetic population. When exposures were lagged, the HRs were reduced. In a second C8 study, the phenomenon of “reverse causation” was assessed in a cross-sectional evaluation of impaired kidney function (estimated glomerular filtration rate, eGFR) and earlier menopause (Dhingra 2016b). Self-reported menopause was evaluated among 9,192 women aged 30-65 and kidney function among 29,499 adults. Although there was a non-monotonic negative trend for eGFR across measured serum PFOA quintiles (β ± S.E.= -0.98 ± 0.27 for the top quintile), neither modeled serum PFOA nor modeled cumulative exposure showed associations with eGFR. This suggested that the finding for eGFR was due to reverse causation, i.e., that reduced kidney function as measured by eGFR caused the increased measured serum PFOA. This result would occur because reduced kidney function slowed the excretion of PFOA. The study also found a significant increasing trend of reported early menopause with increasing measured PFOA category, but when using modeled serum or modeled cumulative exposure PFOA instead of measured, this trend disappeared. Again, this suggested reverse causation, i.e., that early menopause caused the increased PFOA serum levels. The study found that measured serum PFOA levels increased on average 4% per year for the first seven years after menopause and then stopped increasing. he authors emphasized that caution is necessary when using exposure biomarkers in cross-sectional studies.

79
A study using NHANES data for the 2003-2010 cycles evaluated estimated GFR and serum uric acid among adolescents aged 12-19 years (Kataria 2015). PFOA and PFOS serum levels were associated with lower eGFR and higher serum uric acid. However, given the findings in the C8 study, these associations may, at least in part, be due to the phenomenon of reverse causation. In summary, there is little clear evidence that PFAS affects kidney function or increases the risk of kidney disease. However, because so few studies have been conducted, there is insufficient information to determine whether PFAS exposures affect the kidney. Therefore additional research is needed. In order to avoid the issue of reverse causation, future cross-sectional studies should not rely solely on serum PFAS levels to assess exposures. Three studies have evaluated uric acid in adults and PFAS exposures. In a C8 cross-sectional study of 54,951 adults, both PFOA and PFOS serum levels were associated with increased uric acid (Steenland 2010). Elevated uric acid (hyperuricemia) was also evaluated, and the OR in the top quintile was 1.47 (95% CI: 1.37, 1.58) with a monotonic trend. PFOS also was associated with hyperuricemia, but to a lesser extent than PFOA. A second cross-sectional study used NHANES data for 1999-2000 and 2003-2006 (serum uric acid was not included in the 2001-2002 NHANES cycle) and found that PFOA and PFOS were associated with hyperuricemia (Shankar 2011). Again, PFOA had the stronger relationship with a fourth quartile OR of 1.97 (95% CI: 1.44, 2.70) and a monotonic trend compared to a fourth quartile OR of 1.48 (95% CI: 0.99, 2.22) for PFOS and a non-monotonic trend. A third cross-sectional study evaluated NHANES data for the 2007-2010 cycles and found that both PFOA and PFOS serum levels were associated with increasing serum uric acid (Gleason 2015). However, the study found that only serum PFOA had a monotonic increased risk of hyperuricemia. Because these studies relied on serum PFAS levels to assess exposure and were cross-sectional, it is possible that the phenomenon of reverse causation may explain at least part of these findings, i.e., that a reduction in kidney function or chronic kidney disease causes hyperuricemia as well as increased PFAS serum levels due to a reduction in excretion. Nevertheless, the studies consistently found an increased risk of hyperuricemia associated with serum levels of PFOA, and to a lesser extent PFOS. Further research is needed that supplements serum PFAS measurements with modeled serum PFAS estimates to account for possible reverse causation. 2. Liver disease/liver function Two C8 studies and one study that evaluated NHANES data have assessed PFAS exposures and liver function. The first C8 cross-sectional study included 47,092 adults and measured alanine transaminase (ALT), γ-glutamyltransferase (GGT) and direct bilirubin (Gallo 2012). Both PFOA and PFOS serum levels were associated with increased ALT in linear models and with high ALT in logistic models. The trends were not monotonic. The second C8 study evaluated liver disease among 32,254 adults including 3,713 DuPont workers and liver biomarkers among 30,723 adults including 1,892 DuPont workers (Darrow 2016). The liver biomarker part of the study was cross-sectional. The study avoided the issue of reverse causation by using modeled estimates of yearly serum levels of PFOA. Estimated cumulative exposure and the estimated PFOA serum level during 2005-2006 were evaluated. PFOA was associated with increasing levels of ALT and with abnormal ALT. PFOA was not associated with liver disease. An earlier study conducted in the C8 study area by Emmett 2006 was limited by a small sample size (371 residents including 20 children ages 2-10 and 29 individuals aged 11-20). Another study using NHANES data for the 1999-2006 cycles found no association with liver disease, with 4th quartile ORs for PFOA and PFOS of 0.61 and 0.95, respectively (Melzer 2010).

80
A study using NHANES data for 2007−2010 found associations between serum PFAS and liver function parameters (Gleason 2015). PFHxS was associated with increased ALT, PFOS was associated with increased total bilirubin, PFOA was associated with increased ALT, GGT and total bilirubin, and PFNA was associated with increased ALT. An earlier study using NHANES data for 1999-2004 found positive associations between PFOA and ALT and natural log GGT and PFHxS and PFNA and total bilirubin (Lin 2010). The association between PFOA and liver enzymes was more evident in obese subjects, as well as subjects with insulin resistance and/or metabolic syndromes. In summary, the two studies that evaluated PFAS exposures and liver disease found no association. Consistent associations across three studies were found for PFOA and increased ALT. PFOS was also associated with increased ALT in a C8 study. The C8 study that evaluated modeled estimated PFOA serum levels avoided the issue of reverse causation and observed an association between PFOA and increased ALT. Even though the number of studies is small, PFOA has consistently been associated with increased ALT. Because few studies have been conducted, further research is needed to evaluate PFAS exposures and liver function, supplementing serum PFAS measurements with modeled serum PFAS estimates to account for the issue of reverse causation. 3. Coronary Artery Disease, hypertension, hypercholesterolemia (high cholesterol) One C8 study evaluated incident coronary artery disease and hypertension and modeled PFOA serum levels (Winquist and Steenland 2014b). There was no association with hypertension or coronary artery disease – in both analyses, the HRs were higher for the lower quintiles than the higher quintiles, no HR was higher than 1.26, and most HRs were ≤1.1. For coronary artery disease, the HR for the top quintile of cumulative exposure to PFOA was 1.07 (95% CI: 0.93, 1.23) with a non-monotonic trend. For hypertension, the HR for the top quintile of cumulative exposure to PFOA was 0.98 (95% CI: 0.91, 1.06). A case-control study of coronary heart disease was conducted in Sweden with 253 cases and 253 matched controls (Mattsson 2015). The adjusted ORs for serum PFOS for the 3rd and 4th quartile were 1.30 (95% CI: 0.74, 2.26) and 1.07 (95% CI: 0.60, 1.92), respectively. The strongest finding in this study was for perfluoroheptanoic acid (PFHpA) with adjusted ORs for the 3rd and 4th quartile of 2.58 (95% CI: 1.39, 4.78) and 1.73 (95% CI: 0.94, 3.16). All of the other PFAS had adjusted ORs in the 4th quartile <1.0. A study that evaluated NHANES data for 1999-2006 found a slight increase in heart disease for PFOA (4th quartile OR=1.08, 95% CI: 0.70, 1.69) and no association with PFOS (4th quartile OR=0.91) (Melzer 2010). Another study that evaluated NHANES data (1999-2003) found PFOA associated with cardiovascular disease (Shankar 2012). For the top quartile of PFOA, the OR for cardiovascular disease was 2.01 (95% CI: 1.12, 3.60) with a monotonic trend. Elevated ORs were observed for PFOA and both coronary heart disease and stroke but the trend was not monotonic, with 4th quartile ORs of 2.24 (95% CI: 1.02, 4.94) and 4.26 (95% CI: 1.84, 9.89), respectively. Several studies have evaluated hypercholesterolemia or serum lipids and have found consistent positive associations with PFAS. In the C8 cross-sectional study of 46,294 adults, both PFOS and PFOA were associated with increasing total cholesterol and LDL (Steenland 2009). The predicted increase in total cholesterol from the lowest to highest decile of PFOS and PFOA was 11–12 mg/dL. For hypercholesterolemia, the OR for the top quartile of PFOA was 1.38 (95% CI: 1.28, 1.50) with a

81
monotonic trend, while for PFOS, the OR was 1.51 (95% CI: 1.40, 1.64), with a monotonic trend. PFOA was also associated with triglycerides. In a longitudinal study of 560 adults from the C8 population who were followed for 4.4 years, individuals with the greater declines in serum PFOA and PFOS had greater LDL decreases (Fitz-Simon 2013). For an individual whose serum PFOA fell by half, the predicted fall in LDL was 3.6% (95% CI: 1.5%, 5.7%). A stronger finding was observed for PFOS: a decline in serum PFOS by half was predicted to decrease LDL by 5% (95% CI: 2.5%, 7.4%). Incident hypercholesterolemia was found to be associated with PFOA in a C8 study, especially among men aged 40-60. The HR for the top quintile of cumulative exposure was 1.44 (95% CI: 1.28, 1.62) although the trend was not monotonic (Winquist and Steenland 2014b). A study of cholesterol using NHANES data for the 2003-2004 cycle found positive associations for PFOS, PFOA and PFNA but a negative association with PFHxS (Nelson 2010). The highest quartile of PFOS exposure had total cholesterol levels 13.4 mg/dL (95% CI: 3.8–23.0) higher than in the lowest quartile. For PFOA, PFNA, and PFHxS, effect estimates were 9.8 (95% CI, –0.2 to 19.7), 13.9 (95% CI, 1.9–25.9), and –7.0 (95% CI, –13.2 to –0.8), respectively. A study using 2007-2009 cross-sectional data from the Canadian Health Measures Survey found a positive association between PFHxS and hypercholesterolemia (Fisher 2013). For the top quartile of PFHxS, the weighted OR was 1.57 (95% CI: 0.93, 2.64) with a monotonic trend. The finding for PFHxS contradicted the NHANES study which found that PFHxS was associated with a decline in cholesterol. In the Canadian study, the top quartile for PFOA had an OR of 1.50 (95% CI: 0.86, 2.62) with a non-monotonic trend. In a small study conducted in China, 133 individuals were evaluated for PFAS exposure and high serum lipid levels (Fu 2014). The study did not evaluate PFHxS, but did evaluate PFOA, PFOS, PFNA, perfluorodecanoic acid (PFDA) and perfluoroundecanoic acid (PFUdA). For high total cholesterol, there was a monotonic trend for PFDA with the top quartile OR of 3.84 (95% CI: 0.87, 16.95). Non-monotonic trends for high total cholesterol were observed for PFOS (4th quartile OR=2.27, 95% CI: 0.47, 10.92) and PFUdA (4th quartile OR=3.70, 95% CI: 0.76, 18.03). For high LDL, monotonic trends were observed for PFOS (top quartile OR=2.27, 95% CI: 0.50, 10.37) and PFUdA (top quartile OR=4.16, 95% CI: 0.96, 18.00). The wide confidence intervals in this study were due to the small sample size. A study of 891 pregnant women in Norway found a monotonic trend for PFOA and increasing total cholesterol with a regression coefficient of 2.58 (95% CI: -4.32, 9.47) per natural log PFOA (ng/ml) (Starling 2014). Non-monotonic trends were also observed for total cholesterol and PFOS and PFHxS with regression coefficients (per natural log-ng/ml) of 8.96 (95% CI: 1.70, 16.22) and 3.00 (95% CI: -1.75, 7.76), respectively. Monotonic trends were observed for PFOS, PFHxS, and PFUdA and HDL, but no monotonic trends were observed for PFAS and LDL. The strongest finding for LDL was for PFOS with a regression coefficient of 6.48 (95% CI: -0.07, 13.03). Smaller effects were observed between LDL and PFOA and PFHxS with regression coefficients of 2.25 (95% CI: -3.97, 8.48) and 1.92 (95% CI: -2.50, 6.33), respectively. No associations were observed for triglycerides. In summary, because of the small number of studies and conflicting findings, more research is needed to evaluate whether PFAS exposures affect the risk of cardiovascular disease or hypertension. Several studies have evaluated PFOA and PFOS and lipids and the findings consistently indicate that an association exists with increased lipids.

82
4. Thyroid function/disease A C8 study that evaluated thyroid disease in retrospective and prospective analyses included 32,254 adults aged ≥20 years (28,541 community members and 3,713 workers) who completed baseline questionnaires in 2005-2006 and follow-up questionnaires during 2008-2010 and 2010-2011 (Winquist and Steenland, 2014a). About 2/3 of the thyroid diseases were hypothyroidism. In the retrospective analysis, the HR for the top quintile of cumulative exposure to PFOA and functional thyroid disease was 1.28 (95% CI: 1.06, 1.53) with a non-monotonic trend. The finding was much stronger in females with a 5th quintile HR of 1.37 (95% CI: 1.11, 1.68) and a monotonic trend compared to the results in males (5th quintile HR=1.05, 95% CI: 0.66, 1.66, and no trend). PFOA was more strongly associated with hypothyroidism with a HR for the top quintile of 1.40 (95% CI: 1.12, 1.75) and a non-monotonic trend. Elevated HRs were observed for both males and females and hypothyroidism, but there was a monotonic trend for females. Elevated HRs were observed for females and hyperthyroidism, but the trend was not monotonic. HRs were not elevated for males and hyperthyroidism. Similar findings were observed when the community cohort was evaluated separately. However there was a monotonic trend for females and hyperthyroidism, and the HRs for males and hypothyroidism were higher than for females although the trend was not monotonic. In the prospective analysis, the HR for the top quintile of cumulative PFOA exposure and functional thyroid disease was 1.12 (95% CI: 0.82, 1.52) with a non-monotonic trend. There was no association for females, but there was a monotonic trend for males with an HR for the top quintile of 1.85 (95% CI: 0.93, 3.68). The highest HRs were for hyperthyroidism among males and females although based on relatively small numbers, particularly among males, and the trends were not monotonic. For hypothyroidism, there was no association among females, but there was a monotonic trend for males with an HR for the top quintile of 2.02 (95% CI: 0.87, 4.65). Similar findings were observed when the community cohort was evaluated separately. The authors concluded that there was an association between PFOA exposure and thyroid disease, especially for hyperthyroidism among women in the retrospective analyses and for hypothyroidism among men in the prospective analyses. A study that evaluated NHANES data for 1999-2006 found associations between PFOA and PFOS and reported ever had thyroid disease and reported current thyroid disease with medication (Melzer 2010). None of the exposure-response trends were monotonic. For the 4th quartile PFOA, the ORs for ever had thyroid disease were 1.68 (95% CI: 1.14, 2.49) for women and 1.50 (95% CI: 0.66, 3.39) for men. For current thyroid disease with medication, the ORs for 4th quartile PFOA were 2.24 (95% CI: 1.38, 3.65) for women and 2.12 (95% CI: 0.93, 4.82) for men. For the 4th quartile PFOS, the ORs for ever had thyroid disease were 1.15 (95% CI: 0.78, 1.70) for women and 1.78 (95% CI: 0.58, 5.52) for men. For current thyroid disease with medication, the ORs for 4th quartile PFOA were 1.27 (95% CI: 0.82, 1.97) for women and 2.68 (95% CI: 1.03, 6.98) for men. In summary, although only two studies have evaluated thyroid disease in adults and PFAS exposure, both had positive findings. In particular, the C8 study found elevated HRs for thyroid diseases in the prospective analyses. However, there also appears to be effect modification by gender. Because of the few studies that have evaluated PFAS exposure and thyroid disease, more research is necessary, in particular, studies designed to evaluate effect modification by gender. Thyroid function biomarkers were evaluated in a C8 cross-sectional study that included 52,296 adults with a year or more exposure to PFOA (Knox 2011). The biomarkers evaluated were thyroxine (T4), T3 uptake, and thyroid stimulating hormone (TSH). Both PFOA and PFOS were associated with an

83
elevation in serum thyroxine and a reduction in T3 uptake. Interactions between gender and PFOS were observed for T3 uptake and thyroxine and between PFOA and gender for T3 uptake. Three studies evaluated NHANES data and thyroid function. The first study evaluated NHANES data for 2007-2008 and found that TSH and TT3 levels increased with PFOA and TT4 levels increased with PFHxS (Jain 2013). This study is not included in Table A3 because no confidence intervals were presented, the age range included adolescents (i.e., ages 12-18), and these NHANES data were evaluated by a second study that evaluated NHANES data for 2007-2010 (Wen 2013). The latter study found mixed results by gender (Wen 2013). PFHxS was associated with an increase in TT4 for women (β = 0.26, 95% CI: 0.11, 0.41) but not for men (β = -0.03, 95% CI: -0.18, 0.64). On the other hand PFHxS was associated with a decline in T4 among men (β = -0.016, 95% CI: -0.029, -0.003) but not for women (β = 0.003, 95% CI: -0.024, 0.030). PFHxS was associated with an increase in TT3 for women β = 4.07, 95% CI: 2.23, 5.92) but not for men (β = -0.08, 95% CI: -1.70, 1.56). PFOA was associated with TT3 among women (β = 6.63, 95% CI: 0.55, 12.72) but not for men (β = 0.78, 95% CI: -3.05, 4.60). The third NHANES study evaluated NHANES data for 2007-2008 but focused on potential susceptible subgroups with thyroid “stressors”, i.e., with low iodine status, with high thyroid peroxidase antibody (TPOAb) or with both (Webster 2016). The key findings were that all 4 PFAS evaluated (PFOA, PFOS, PFHxS and PFNA) were associated with increased fT3, increased fT3/fT4, increased TSH, and increased TT3 in the group with joint exposure to high TPOAb and low iodine. PFOS and PFHxS were also associated with decreased fT4 in the group with high TPOAb and low iodine. The findings were considerably weaker for those with normal iodine and TPOAb status and those with either low iodine alone or high TPOAb alone. A group of 87 men and women residing in the upper Hudson River area of New York who were originally recruited for a study of PCB exposure were evaluated for PFOA and PFOS exposure and thyroid function (Shrestha 2015). Natural log PFOS was positively associated with fT4 (β=0.054, 95% CI: 0.002, 0.106) and T4 (β = 0.766, 95% CI: 0.327, 1.205), which corresponded to 4% and 9% increases in fT4 and T4 per interquartile range difference in PFOS. A positive association also was observed for log PFOS and TSH (β = 0.129, 95% CI: -0.023, 0.281). An association was also observed for natural log PFOA and T4 (β = 0.380, 95% CI: -0.070, 0.830). When both PFOS and PFOA were included in the models, the association between PFOS and T4 persisted, but the association between PFOS and fT4 was attenuated. A cohort of 633 individuals aged >12 years from Siheung, Korea was evaluated for PFAS exposure and thyroid function (Ji 2012). Slight declines in T4 (e.g., for PFOS, β = -0.021, 95% CI: -0.048, 0.005) and slight increases in TSH (e.g., for PFNA, β = 0.110, 95% CI: -0.035, 0.255) were observed. The strongest findings were for perfluorotridecanoic acid (PFTrDA) and decreased T4 and increased TSH. In summary, based on findings from these studies, there appears to be gender differences in the effects of PFAS exposures on thyroid function. This is not surprising given the evidence of effect modification by gender for the associations between PFOS and PFOA and thyroid diseases. In general, TSH and TT4 increased with PFOA, PFOS and PFHxS exposure. TT3 also appeared to increase but not in the C8 study. A susceptible population with low iodine status and high TPOAb status was identified in one study. Although several studies have been conducted of PFAS exposure and adult alterations in thyroid function, there are inconsistencies in the findings for TT3 and TT4. Additional research is needed to resolve these inconsistencies. In particular, studies should be designed to evaluate effect modification by gender as well as by vulnerable subpopulations such as those who have thyroid “stressors”.

84
Several studies evaluated thyroid function among pregnant women primarily because of the potential effect on the fetus of maternal thyroid hormone disruption. A study in Taiwan of 285 women in their third trimester observed the strongest findings for PFNA, perfluorododecanoic acid (PFDoDA), and perfluoroundecanoic acid (PFUnDA) and decreased maternal free T4 and TT4. The effects of PFHxS on free T4 and TT4 were considerably weaker than these three PFAS but much stronger than PFOA or PFOS (Wang 2014). In a Canadian study of 152 women, those with normal TPOAb had little effects from PFAS exposure on fT4, TT4 or TSH (Webster 2014). However, women with high TPOAb had increases of 46% to 69% in TSH for interquartile range increases of PFOA, PFOS, and PFNA. (Interquartile range increase in PFHxS was associated with only a 2% increase in TSH in these women.) All four PFAS evaluated were associated with a 3% − 7% decrease in fT4 among women with high TPOAb. No associations were found for TT4. In a study of 375 women in Norway, 4th quartile PFOS levels were associated with a 0.35 (95% CI: 0.21, 0.50) mean difference in TSH, corresponding to a 24% higher mean concentration of TSH (Berg 2015). A multipollutant assessment of persistent organic pollutants (POPs) including PCBs, DDT, hexachlorobenzene, and PFAS was conducted with a similar group of Norway women, and PFOS was again found to be associated with increased TSH with a monotonic trend controlling for other POPs (Berg 2017). A study of 392 women from Hokkaido, Japan found a negative correlation between PFOS and TSH and a smaller positive correlation with fT4 (Kato 2016). There was little correlation between PFOA and TSH or fT4. In general, the studies of maternal thyroid function and PFAS exposure suggested associations between PFAS and increased TSH. For the other thyroid biomarkers, the results were mixed. 5. Autoimmune diseases A C8 study evaluated autoimmune diseases retrospectively and prospectively in a cohort of 32,254 adults including 3,713 workers (Steenland 2013). Self-reported autoimmune diseases were confirmed via medical records. For the retrospective analyses, the follow-up was from 1952 through the interviews conducted in 2008-2011. For the 4th quartile cumulative PFOA exposure, the RRs for ulcerative colitis for unlagged and 10-year lagged exposures were 2.86 (95% CI: 1.65, 4.96) and 3.05 (1.56, 5.96), respectively. The trends for ulcerative colitis were monotonic. For multiple sclerosis, the 4th quartile exposure RRs, unlagged and 10-year lagged, were 1.26 (0.65, 2.42) and 1.32 (0.61, 2.84), respectively, but the trends were not monotonic. For rheumatoid arthritis, an elevated RR for 4th quartile PFOA exposure was observed only for the 10-year lagged exposure (RR=1.35, 95% CI: 0.87, 2.11), but the trend was not monotonic. In the prospective analyses, autoimmune cases that occurred between the baseline 2005-2006 interviews and the 2008-2011 follow-up interviews were too few to evaluate multiple sclerosis, lupus, type 1 diabetes or Crohn’s disease. For ulcerative colitis, the RRs for the 4th quartile cumulative PFOA exposure, unlagged and 10-year lagged, were 1.62 (95% CI: 0.57, 4.61) and 1.51 (95% CI: 0.43, 4.30). The wide confidence intervals were due to the small number (n=30) of cases that occurred during the follow-up period. The trends were not monotonic. The RRs for rheumatoid arthritis for the 4th quartile PFOA cumulative exposure were <1.0. On the basis of this study, the C8 Science Panel decided that there was a probable link between PFOA exposure and ulcerative colitis. Of note, the RRs were elevated in both the retrospective and prospective analyses. A study of ulcerative colitis conducted of the 3,713 workers at the DuPont West Virginia plant
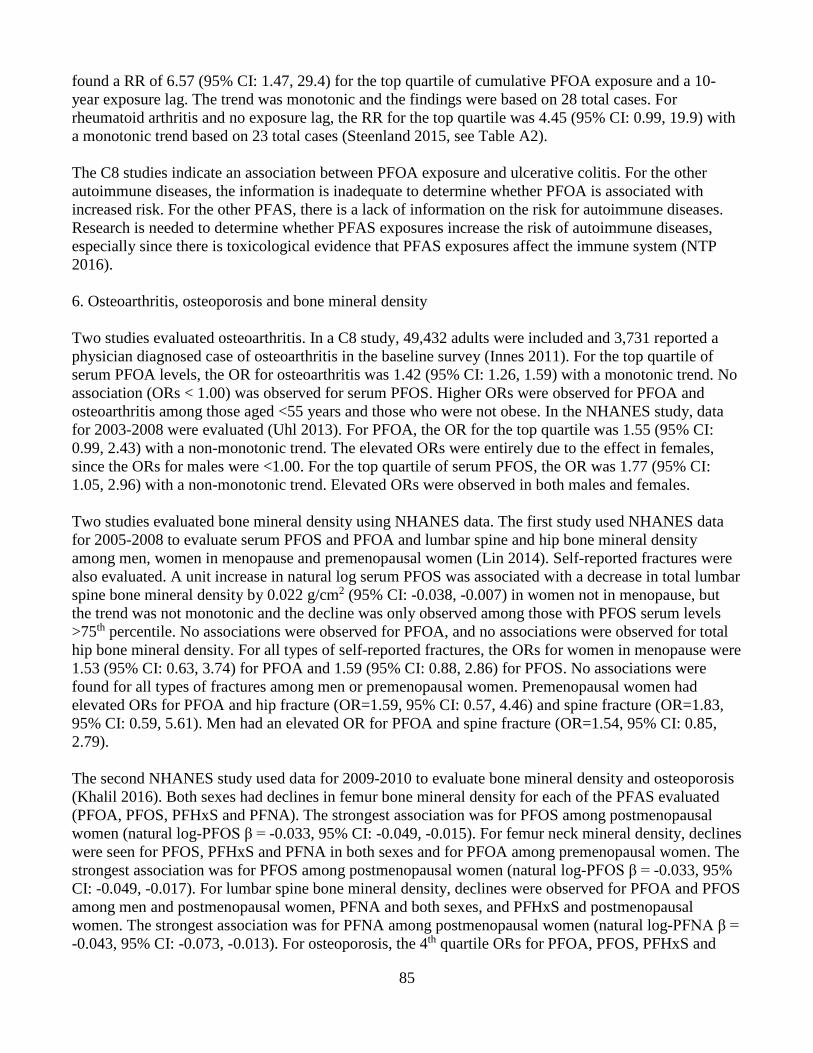
85
found a RR of 6.57 (95% CI: 1.47, 29.4) for the top quartile of cumulative PFOA exposure and a 10-year exposure lag. The trend was monotonic and the findings were based on 28 total cases. For rheumatoid arthritis and no exposure lag, the RR for the top quartile was 4.45 (95% CI: 0.99, 19.9) with a monotonic trend based on 23 total cases (Steenland 2015, see Table A2). The C8 studies indicate an association between PFOA exposure and ulcerative colitis. For the other autoimmune diseases, the information is inadequate to determine whether PFOA is associated with increased risk. For the other PFAS, there is a lack of information on the risk for autoimmune diseases. Research is needed to determine whether PFAS exposures increase the risk of autoimmune diseases, especially since there is toxicological evidence that PFAS exposures affect the immune system (NTP 2016). 6. Osteoarthritis, osteoporosis and bone mineral density Two studies evaluated osteoarthritis. In a C8 study, 49,432 adults were included and 3,731 reported a physician diagnosed case of osteoarthritis in the baseline survey (Innes 2011). For the top quartile of serum PFOA levels, the OR for osteoarthritis was 1.42 (95% CI: 1.26, 1.59) with a monotonic trend. No association (ORs < 1.00) was observed for serum PFOS. Higher ORs were observed for PFOA and osteoarthritis among those aged <55 years and those who were not obese. In the NHANES study, data for 2003-2008 were evaluated (Uhl 2013). For PFOA, the OR for the top quartile was 1.55 (95% CI: 0.99, 2.43) with a non-monotonic trend. The elevated ORs were entirely due to the effect in females, since the ORs for males were <1.00. For the top quartile of serum PFOS, the OR was 1.77 (95% CI: 1.05, 2.96) with a non-monotonic trend. Elevated ORs were observed in both males and females. Two studies evaluated bone mineral density using NHANES data. The first study used NHANES data for 2005-2008 to evaluate serum PFOS and PFOA and lumbar spine and hip bone mineral density among men, women in menopause and premenopausal women (Lin 2014). Self-reported fractures were also evaluated. A unit increase in natural log serum PFOS was associated with a decrease in total lumbar spine bone mineral density by 0.022 g/cm2 (95% CI: -0.038, -0.007) in women not in menopause, but the trend was not monotonic and the decline was only observed among those with PFOS serum levels >75th percentile. No associations were observed for PFOA, and no associations were observed for total hip bone mineral density. For all types of self-reported fractures, the ORs for women in menopause were 1.53 (95% CI: 0.63, 3.74) for PFOA and 1.59 (95% CI: 0.88, 2.86) for PFOS. No associations were found for all types of fractures among men or premenopausal women. Premenopausal women had elevated ORs for PFOA and hip fracture (OR=1.59, 95% CI: 0.57, 4.46) and spine fracture (OR=1.83, 95% CI: 0.59, 5.61). Men had an elevated OR for PFOA and spine fracture (OR=1.54, 95% CI: 0.85, 2.79). The second NHANES study used data for 2009-2010 to evaluate bone mineral density and osteoporosis (Khalil 2016). Both sexes had declines in femur bone mineral density for each of the PFAS evaluated (PFOA, PFOS, PFHxS and PFNA). The strongest association was for PFOS among postmenopausal women (natural log-PFOS β = -0.033, 95% CI: -0.049, -0.015). For femur neck mineral density, declines were seen for PFOS, PFHxS and PFNA in both sexes and for PFOA among premenopausal women. The strongest association was for PFOS among postmenopausal women (natural log-PFOS β = -0.033, 95% CI: -0.049, -0.017). For lumbar spine bone mineral density, declines were observed for PFOA and PFOS among men and postmenopausal women, PFNA and both sexes, and PFHxS and postmenopausal women. The strongest association was for PFNA among postmenopausal women (natural log-PFNA β = -0.043, 95% CI: -0.073, -0.013). For osteoporosis, the 4th quartile ORs for PFOA, PFOS, PFHxS and

86
PFNA were 2.59 (95% CI: 1.01, 6.67), 1.07 (95% CI: 0.36, 3.19), 13.20 (95% CI: 2.72, 64.15) and 3.23 (95% CI: 1.44, 7.21), respectively. None of the trends were monotonic except possibly for PFOA where the ORs for the 2nd and 3rd quartiles were essentially the same and could be considered monotonic. In summary, some positive findings were observed in the two studies that evaluated bone mineral density and the two studies that evaluated osteoarthritis. Only one study evaluated osteoporosis and positive findings were observed as well. Because only a few studies have been conducted, additional research is needed. 7. Immune Response Four studies have evaluated immune response or immune biomarkers. A report by the C8 Science Panel on a cross-sectional study that has not yet been published evaluated immune biomarkers such as IgG, IgM, IgA, IgE, total antinuclear antibodies (ANA) and C reactive protein (CRP) among the C8 adult population (C8 Science Panel 2009). The study included 56,315 adults. The Panel reported that “several statistically significant associations between levels of immunoglobulins and C8 were found: For IgA the pattern of association indicated a significant decreasing trend with increasing PFOA; this was also apparent for IgE but only in females. For IgG there was not a consistent trend with PFOA. ANA shows a positive significant relationship with increasing PFOA. CRP showed a strong downward trend with increasing PFOA,” A second C8 study evaluated influenza vaccine response in 403 adults who did not have influenza within the last 3 months and who provided pre- and post-vaccination blood samples to determine virus-specific antibody titers (Looker 2014). Associations between PFOA and PFOS and self-reported influenza and colds in the past 12 months as reported on questionnaires (n = 755) were also assessed. Elevated PFOA serum concentrations (4th vs 1st quartiles of exposure) were associated with reduced antibody titer rise which may correlate with an increased risk of not attaining the antibody threshold considered to offer long-term protection. Small negative associations (regression coefficients for the geometric mean antibody titer ranging from -0.03 to -0.22) were observed comparing the highest and lowest quartiles of PFOA and antibody titer rise and ratios for influenza B and Influenza A/H3N2 and antibody titer rise for Influenza A/H1N1; there was a monotonic exposure response relationship for H1N1. For PFOS, small negative associations were observed comparing the highest and lowest quartiles and antibody titer rise and ratios for Influenza A/H3N2 (-0.04 and -0.03, respectively). People exposed to the highest quartile PFOA and PFOS were less likely to seroconvert following vaccinations for Influenza B (ORs = 0.71 and 0.87, respectively). Additionally, people exposed to the highest quartile of PFOS were less likely to seroconvert following vaccinations for Influenza A/H1N1 (OR = 0.94) and people exposed to the highest quartile of PFOA were less likely to seroconvert following vaccinations for Influenza A H3N2 (OR = 0.62). OR for cold or flu ranged from 1.09-1.20 for people exposed to the highest quartile of PFOS. An exploratory study measured serum-PFAS concentrations in 12 adults whose antibody responses were followed for 30 days after a booster vaccination with diphtheria and tetanus (Kielsen 2016). Participants were healthy volunteers from a hospital in Denmark. Diphtheria antibody concentrations post-vaccination were decreased by 8.2 to 18.2% for a doubling of exposures to several PFASs, including PFOA, PFOS, and PFHxS. Tetanus antibody concentrations were decreased by 4.4 to 10.8% for a doubling of exposures to several PFASs, including PFOS and PFHxS (but not PFOA). The authors note that “serum PFAS concentrations showed significant negative associations with the rate of increase in

87
the antibody responses.” The authors also noted that this effect was particularly strong for the longer-chain PFAS such as PFDA and PFNA. Another exploratory study included 78 adults and evaluated the immune response to vaccination with FluMist intranasal live attenuated influenza vaccine and PFAS exposure (Stein 2016b). Between 9% and 25% of the adults seroconverted after vaccination. PFAS exposure was associated with seroconversion but the small numbers that had seroconverted resulted in extremely wide confidence intervals. The strongest association observed between PFAS and immune marker response was for PFHxS and lower mean interferon-γ (IFN-γ) and tumor necrosis factor-α (TNF-α) levels. The second and third tertile regression coefficients for PFHxS and IFN-γ were -40 (95% CI: -76, -3.7), and -40 (95% CI: -84, 2.69). For TNF-α, the second and third tertile regression coefficients were -5.3 (95% CI: -9.2, -1.3) and -4.8 (955 CI: -9.4, -0.10). However the authors concluded that the findings did not support an association between PFAS exposure and reduced immune response to FluMist vaccination, although the study had severe limitations including small sample size and the limited antibody response to FluMist. Although there were positive findings in the four studies that have been conducted, each study had serious limitations. Therefore additional research is needed with improved study designs and sufficient statistical power to evaluate PFAS exposures and immune response. 8. Reproductive outcomes Table A4 provides details on the studies of subfertility and infertility. Six studies evaluated subfertility (time to pregnancy [TTP]) and/or infertility. Positive associations were found for subfertility/delayed TTP for PFOA in three studies (Bach 2015a, Fei 2009, Whitworth 2012a) and PFOS in four studies (Bach 2015a, Fei 2009, Jorgenson 2014, Whitworth 2012a), and slightly positive associations were found for PFOA, PFHxS, and PFOS in one study (Velez 2015) and for PFNA in one study (Jorgenson 2014). Positive associations were found for infertility and PFOA in two studies (Fei 2009, Velez 2015), for PFOS in two studies (Fei 2009, Jorgenson 2014), and for PFHxS and PFNA in one study each (Jorgenson 2014, Velez 2015), and slightly positive associations were found for PFOS and PFOA in one study each (Jorgenson 2014, Velez 2015). An additional study assessed adult male semen quality, testicular volume, and reproductive hormone levels in men who were exposed in utero to PFOS and PFOA and found positive associations with these chemicals and outcomes (Vested 2013). A systematic review assessed fertility by evaluating studies on reproductive hormones (10 studies in men and 3 in women) and TTP (2 studies in men and 8 in women) as well as nine studies of semen characteristics (Bach 2016a). In men, there were inconsistent results across PFAS studies of semen volume, sperm concentration, total sperm count, motility, and morphology; levels of testosterone, free androgen index/free testosterone, estradiol, SHBG, LH, FSH, and inhibin B; and TTP. In women, studies showed mostly positive associations for PFOS and PFOA and infertility and fecundability in parous women, but were inconsistent for PFAS and reproductive hormones. The review concluded that there was not strong evidence for an association between PFAS exposures and reproductive outcomes in men or women. Another review of the epidemiological literature on reproductive outcomes came to a similar conclusion (Khalil 2015). Table A5 provides details on the studies of pre-eclampsia and pregnancy-induced hypertension. Five studies evaluated pre-eclampsia. Positive associations were found for pre-eclampsia and PFOA (Savitz 2012a) and PFOS (Stein 2009) and slightly positive associations were found with PFOA in two studies

88
(Avanasi 2015, Nolan 2010) and PFOS in one study (Starling 2014). Three studies evaluated pregnancy-induced hypertension (PIH). Positive associations were found for PIH and PFOA in three studies (Darrow 2013, Nolan 2010, Savitz 2012b) and PFOS in one study (Darrow 2013). The C8 Science Panel concluded that there was a probable link between PFOS exposure and pregnancy-induced hypertension. Two studies evaluated PFAS exposure and endometriosis. The first study included a sample of 495 women aged 18-44 scheduled for laparoscopy/laparotomy in clinics located in Salt Lake City and San Francisco (Buck Louis 2012). The second sample was a population-based sample of 131 women matched to the first sample on age and residence within a 50-mile radius of the participating clinics. Forty-one percent (n=190) of the women scheduled for laparoscopy (“operative sample”) had newly diagnosed endometriosis and 11% (n=14) of the population-based sample had endometriosis. The ORs for PFOS, PFOA, PFHxS and PFNA among the operative sample were 1.25 (95% CI: 0.87, 1.80), 1.62 (95% CI: 0.99, 2.66), 0.85 (0.42, 1.73), and 1.99 (95% CI: 0.91, 4.33). Among those cases with stage 3 or stage 4 disease, the ORs for PFOS, PFOA, PFHxS and PFNA were 1.50 (95% CI: 0.82, 2.74), 1.86 (95% CI: 0.81, 4.24), 1.24 (0.47, 3.31), and 0.99 (95% CI: 0.27, 3.65). The second study evaluated NHANES data for 2003-2006 (Campbell 2016). Seven percent of the sample of 753 women reported physician-diagnosed endometriosis (n=54). Fourth quartile ORs for PFOA, PFOS, PFHxS and PFNA were 2.86 (95% CI: 0.63, 12.91), 3.48 (95% CI: 1.00, 12.00), 1.47 (95% CI: 0.40, 5.41), and 3.24 (95% CI: 0.81, 12.91). None of the trends were monotonic. Both studies of PFAS exposures and endometriosis had positive findings. However, since only two studies have been conducted, more research is needed to determine whether PFAS exposures increase the risk of endometriosis. Summary of the Literature Review for adult diseases For most adult diseases there is little or no information on the effects of exposures to PFHxS. Although there is more information for PFOS, it is still inadequate to determine whether exposures increase the risk for most of the adult diseases. PFOA has the most information, primarily because of the C8 studies. Still additional research is needed to determine whether PFOA exposures increase the risk of several adult cancers and non-cancers including colorectal cancer, multiple myeloma, kidney function/kidney diseases, liver function, autoimmune diseases other than ulcerative colitis, and immune function. Health Effects of PFAS in Children Tables A6 and A7 provides details of studies of adverse birth outcomes and congenital malformations. Table A8 provides details of studies of other adverse outcomes in children aged ≥2 years. 1. Adverse birth outcomes Table A6 provides details on the studies that evaluated adverse birth outcomes. Twenty studies evaluated birth weight and the results are presented in Table A6. Additionally, two meta-analysis of birthweight found an overall decrease in birthweight associated with PFOA and PFOS (Verner 2015, Bach 2015b). Ten studies evaluated preterm birth. Five studies evaluated small for gestational age (SGA). Ten studies evaluated birth length, seven evaluated head circumference, one evaluated

89
abdominal circumference, and eight evaluated gestational age as a continuous variable. As evident from Table A6, virtually all of the studies of these adverse birth outcomes evaluated PFOA and PFOS but only a minority evaluated PFHxS. Table A7 presents the results of five studies that evaluated birth defects. Positive associations with PFOA and club foot, heart defect, and circulatory defect were found in one study with very small numbers of cases (Nolan 2010). One study found a positive association between PFOS and PFOA (slight) and cryptorchidism (Jensen 2014) while another study found no associations with cryptorchidism and hypospadias (Toft 2016). One study relying on maternally-reported cases found positive associations with PFOA and defects of the brain, limb, eye, and heart (Stein 2014a). A study on congenital hypothyroidism found a “large” difference in PFOA concentrations between cases and controls and mean concentrations of PFOA and PFNA in cases were “significantly higher” than in controls, but the study was based on small numbers (Kim 2016). One study evaluated cerebral palsy (Liew 2014). Using case-cohort sampling of the Danish National Birth Cohort during 1996-2002, the study evaluated 156 cases and 550 controls. Maternal serum PFAS were associated with cerebral palsy for boys, in particular PFOS (RR per ln unit increase=1.7, 95% CI: 1.0, 2.8) and PFOA (RR=2.1, 95% CI: 1.2, 3.6). However risks were not elevated in girls except for PFHxS (RR=1.1, 95% CI: 0.6, 1.9). Five studies evaluated miscarriage and two studies evaluated stillbirth. Positive associations were found for miscarriage and PFOS in two studies (Jensen 2015, Darrow 2014); PFNA, PFDA, and PFHxS in one study (Jensen 2015); and PFOA (slight) in one study (Darrow 2014). No associations were found for stillbirth. Because of inconsistencies in the findings across studies, more research is needed to evaluate the effect of PFAS exposures on birth weight, SGA, head circumference and other fetal growth parameters, reduced gestational age, and preterm birth. Few studies have been conducted of PFAS exposures and miscarriage, stillbirth, birth defects, congenital hypothyroidism or cerebral palsy, therefore additional research is necessary with improved study designs and sufficient statistical power. 2. Lipids Table A8 presents the results of the five studies, including a C8 study, that evaluated lipids (Frisbee 2010, Nelson 2010, Geiger 2014a, Maisonet 2015a, Zeng 2015). All five studies found increases in lipids with increasing exposures to PFOS and/or PFOA. In one NHANES study (Nelson 2010), PFHxS was associated with increased lipids. Overall, the findings of increased lipids from exposures to PFAS has been consistent. 3. Thyroid function There have been several studies conducted of infants and most have observed that prenatal PFAS exposures disrupted thyroid function. Only two studies have been conducted of older children, and their results are presented in Table A8. The C8 study found increases in a thyroid hormone (TSH [thyroid stimulating hormone]) with increasing serum levels of PFOS and PFOA (Lopez-Espinosa 2012). PFHxS was not evaluated. PFOA, but not PFOS, was associated with an increased risk of thyroid disease.

90
In a Taiwan study (Lin 2013), findings were inconsistent for PFOS and PFOA and thyroid hormones when boys and girls were evaluated separately (effect was stronger in males). PFHxS was not evaluated. Because of the few studies that evaluated PFAS exposures and thyroid function among children older than infants, more research is needed. 4. Uric acid Table A8 presents the results of studies that evaluated uric acid. A study in Taiwan found elevated uric acid levels associated with PFOA, PFHxS, and PFOS (Qin 2016). Two studies that evaluated NHANES data found elevations in uric acid and in the risk of hyperuricemia for PFOA and PFOS (Geiger 2013, Kataria 2015). More research is needed to follow up these findings. Because these studies were cross-sectional, there is concern about the possibility of reverse causation (e.g., impaired kidney function could cause both elevated uric acid and a reduction in the elimination of PFAS via the kidney resulting in higher serum PFAS levels). Future studies should attempt to predict serum PFAS levels and/or evaluate this outcome longitudinally (prospectively). 5. Sex hormones Four studies evaluated sex hormones and are presented in Table A8. The C8 study found declines for testosterone in boys and girls with increasing serum levels of PFOA and PFOS and decline in boys with increasing serum levels of PFHxS (Lopez-Espinosa 2016). In the larger of the two Taiwan studies, declines in testosterone levels were observed in both sexes with increasing serum levels of PFOA, in boys only with increasing serum levels of PFOS, and in girls only with increasing serum levels of PFHxS (Zhou 2016). On the other hand, a study of girls in the UK observed increases rather than decreases in testosterone with increasing serum levels of PFOS, PFOA and PFHxS (Maisonet 2015b). Overall, there is some evidence that PFAS exposure may decrease testosterone levels, but the findings have not been consistent across the few studies that have been conducted. More research is needed to determine whether and how PFAS exposures affect sex hormone levels. 6. Delay in reaching puberty Three studies evaluated delays in reaching puberty and are presented in Table A8. In the C8 study, both PFOA and PFOS were associated with delays in puberty (Lopez-Espinosa 2011). PFHxS was not evaluated. In a study conducted in Denmark, PFOS and PFOA were also associated with delay in reaching puberty (Kristensen 2013). However, a study conducted in the UK found that PFOA was associated with an earlier age at puberty while PFOS was associated with delayed puberty, and the results were conflicting for PFHxS (Christensen 2011). More research is needed to evaluate whether PFAS exposure can cause delays in reaching puberty. 7. Neurobehavioral outcomes Neurobehavioral outcomes are presented in Table A8. Two studies evaluated IQ. The C8 study found only slight differences in IQ and the results were not consistent for PFOA, the only PFAS evaluated (Stein 2013). A study conducted in Taiwan found deficits in IQ for PFOS, but not for PFOA or PFHxS (Wang 2015).

91
There is some evidence from the C8 study (Stein 2011) and studies conducted in Denmark (Liew 2015), Sweden (Ode 2014), and using NHANES data (Hoffman 2010) that PFAS may be associated with ADHD. The C8 study found no association for PFOA, but elevated risks for PFOS and PFHxS with odds ratios (ORs) of 1.3 and 1.6, respectively (Stein 2011). The C8 study found a slight increase in risk (OR=1.2) for higher exposures to PFHxS and learning problems but no associations for PFOS or PFOA (Stein 2011). A recent study that evaluated measures of executive function of “clinical relevance” found elevated risks especially for PFOS and PFHxS (Vuong 2016). However, in general, the effects observed have not been large for neurobehavioral outcomes. Evaluating the evidence for associations between PFAS exposures and IQ, ADHD, and other neurobehavioral outcomes is hampered by different methods for ascertaining ADHD, different methods for testing IQ, lack of consistency in the other neurobehavioral outcomes evaluated, and the small number of studies that have been conducted. Therefore additional research is necessary to determine whether PFAS exposures are associated with adverse neurobehavioral outcomes in children such as IQ, depression, deficits in executive function, ADHD, and developmental delay, 8. Immune function Few studies have been conducted to evaluate immune function and PFAS exposure. These studies are presented in Table A8. Three studies have evaluated whether PFAS exposures suppress the antibody response to specific vaccines, but only two of these studies evaluated the same vaccine, i.e., rubella. Both of these studies found deficits in serum rubella antibody response (Granum 2013, Stein 2016). The studies in the Faroes have evaluated tetanus and diphtheria longitudinally and found deficits in antibody to these vaccines (Grandjean 2012, 2016). Asthma was evaluated in three studies, with strong risks found in a Taiwan case-control study (Dong 2013) but considerably weaker risks found in two NHANES studies (Humblet 2014, Stein 2016). Other outcomes such as atopic dermatitis and infectious diseases such as gastroenteritis and the common cold were not evaluated in more than one study. A systematic review of the evidence for immunotoxicity associated with exposures to PFOA and PFOS conducted by NTP concluded that these exposures alter immune function in humans but that the epidemiological evidence was too limited to conduct meta-analyses. Issues include the heterogeneity of the studies and the small number of studies that evaluated the same outcome. NTP concluded that more research is needed to evaluate the same vaccines and hypersensitivity-related outcomes in children across different populations using similar research methods. 9. Hypertension and adiposity Studies of hypertension and adiposity are presented in Table A8. One study has evaluated hypertension in children using NHANES data and found no elevation in risk (Geiger 2014b). Three studies have evaluated adiposity in children, adolescents and/or young adults. In one study, an association between PFAS and measures of adiposity was found only in girls (Mora 2016). A second study (Karlsen 2016) found slightly elevated risks for being overweight except for PFOA among children aged 5 years where a stronger risk was observed (OR = 1.88, 95% CI: 1.05, 3.35). In a third study, PFOS was found to be associated with measures of adiposity (Domazet 2016). Additional research is needed to determine whether PFAS exposures increase the risk of hypertension or adiposity in children.

92
Summary of the Literature Review for childhood diseases For most adverse outcomes in children evaluated in this assessment, the information was inadequate to determine whether children exposed to PFAS were at increased risk. In particular, very few studies have been conducted of PFHxS exposures, the PFAS that was considerably elevated in the serum of the children tested at Pease. Additional research is needed for PFAS exposures and adverse birth outcomes; thyroid, liver, kidney and immune function; uric acid; sex hormones; delays in reaching puberty; ADHD and other neurobehavioral outcomes; hypertension; and adiposity.

93
Description of sample size calculations Sample size calculations were conducted using OpenEpi Version 3.03. (Dean AG, Sullivan KM, Soe MM. OpenEpi: Open Source Epidemiologic Statistics for Public Health, www.OpenEpi.com, updated 2014/09/22). For some health-related endpoints, calculations could not be conducted because of a lack of information in the studies on the parameters needed to make the calculations. Sample size calculation for mean difference: N1 = (variance of group 1 + variance of group 2 / (N2/N1)) (Z1-α/2 + Z1-β)2 (Mean difference)2 Where N2/N1 is the ratio of the two sample sizes. Then N2 is simply this ratio multiplied by N1. For a type 1 error (or α error) of .05, the Z1-α/2 value is 1.96. This calculation is for a two-tailed hypothesis test and equivalent to using a 95% confidence interval to determine statistical significance. For a one-tail test with α =.05, the Z1-α/2 in the above equation is replaced by Z1-α and its value is 1.65, equivalent to using a 90% confidence interval to determine statistical significance. The Z1-β in the above equation is the Z value for the selected power. For 80% power, Z1-β = 0.84, for 90% power, Z1-β = 1.28, and for 95% power, Z1-β = 1.65. (See Rosner B. Fundamentals of Biostatistics, 7th Edition, equation 8.27, p. 302).
The sample size calculations for odds ratios, risk ratios, etc. are as follows: The sample size formula without the correction factor by Fleiss is:
For the Fleiss method with the correction factor, take the sample size from the uncorrected sample size formula and place into the following formula:
When the input is provided as an odds ratio (OR) rather than the proportion of exposed with disease, the proportion of exposed with disease is calculated as:
When the input is provided as a risk (or prevalence) ratio (RR) rather than the proportion of exposed with disease, the proportion of exposed with disease is calculated as:
Fleiss JL. Statistical Methods for Rates and Proportions. John Wiley & Sons, 1981.

94
Sample size calculations for the mean difference in an effect biomarker between the exposed and unexposed groups used the following formula:
Bernard Rosner. Fundamentals of Biostatistics (7th edition). Brooks/Cole, Boston 2011 (equation 8.27, p. 302) Note: In some studies, the standard deviation is not presented but instead, the interquartile range (IQR) is given. Assuming a normal distribution for the outcome under evaluation (e.g., thyroid function measures), the standard deviation can be calculated by dividing the IQR range by 1.35. However if the outcome is not normally distributed, this formula could underestimate the standard deviation. In particular, if the outcome under evaluation has been log-transformed presumably to achieve a normal distribution, the untransformed outcome is unlikely to have a normal distribution. Therefore, using this formula when the outcome does not have a normal distribution may underestimate the SD by as much as 20% according to simulations conducted in Wan X. 2014. A higher SD would increase the sample size requirement.
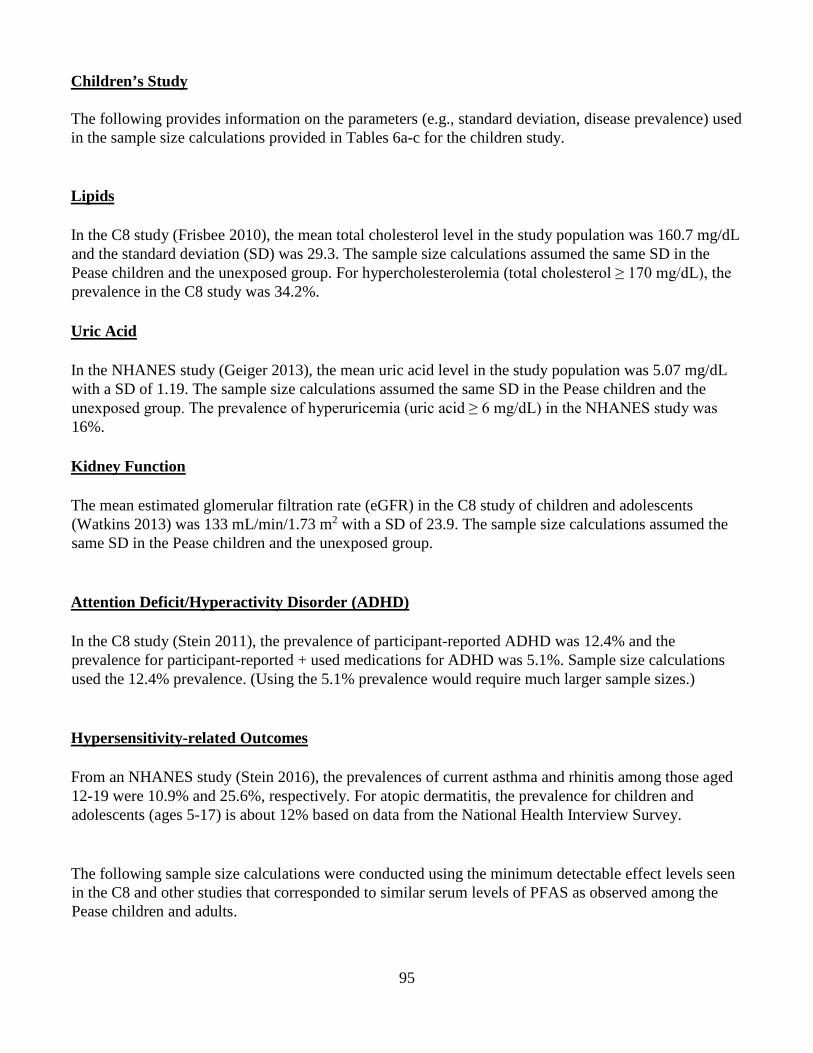
95
Children’s Study The following provides information on the parameters (e.g., standard deviation, disease prevalence) used in the sample size calculations provided in Tables 6a-c for the children study. Lipids In the C8 study (Frisbee 2010), the mean total cholesterol level in the study population was 160.7 mg/dL and the standard deviation (SD) was 29.3. The sample size calculations assumed the same SD in the Pease children and the unexposed group. For hypercholesterolemia (total cholesterol ≥ 170 mg/dL), the prevalence in the C8 study was 34.2%. Uric Acid In the NHANES study (Geiger 2013), the mean uric acid level in the study population was 5.07 mg/dL with a SD of 1.19. The sample size calculations assumed the same SD in the Pease children and the unexposed group. The prevalence of hyperuricemia (uric acid ≥ 6 mg/dL) in the NHANES study was 16%. Kidney Function The mean estimated glomerular filtration rate (eGFR) in the C8 study of children and adolescents (Watkins 2013) was 133 mL/min/1.73 m2 with a SD of 23.9. The sample size calculations assumed the same SD in the Pease children and the unexposed group. Attention Deficit/Hyperactivity Disorder (ADHD) In the C8 study (Stein 2011), the prevalence of participant-reported ADHD was 12.4% and the prevalence for participant-reported + used medications for ADHD was 5.1%. Sample size calculations used the 12.4% prevalence. (Using the 5.1% prevalence would require much larger sample sizes.) Hypersensitivity-related Outcomes From an NHANES study (Stein 2016), the prevalences of current asthma and rhinitis among those aged 12-19 were 10.9% and 25.6%, respectively. For atopic dermatitis, the prevalence for children and adolescents (ages 5-17) is about 12% based on data from the National Health Interview Survey. The following sample size calculations were conducted using the minimum detectable effect levels seen in the C8 and other studies that corresponded to similar serum levels of PFAS as observed among the Pease children and adults.

96
Sex hormones and Insulin-like growth factor – 1 (IGF-1) C8 study of children (Lopez-Espinosa 2016) a. Estradiol For PFOS, there was a -4% difference in the natural log estradiol among boys (per interquartile range of the natural log of PFOS). Among boys, the median estradiol level was 10 pg/mL, with an interquartile range (IQR) of <LOD, 15 where the LOD (estradiol detection limit) was 7 pg/mL. For the sample size calculation of mean difference, the standard deviation (SD) was assumed to be equal for the exposed and unexposed groups and equal to 8.5. (Assuming LOD/2 was the lower limit of the IQR, the range = 15 - 3.5 = 11.5. Assuming a normal distribution for estradiol, dividing 11.5 by 1.35 converts the IQR to a standard deviation, which equaled 8.5)1. To obtain the mean difference, the median estradiol level (10 pg/mL) was assumed to be the reference level (i.e., the level among unexposed). The natural log of the median equals 2.302. A 4% decrease equals 2.21. Exponentiating 2.21 equals 9.12. The mean difference is then 10 – 9.12 = 0.88. Assuming a 95% CI and 80% power, the sample size = 1,465/group; for a ratio of 2 (exposed/unexposed), the sample sizes = 2,198 and 1,099. Assuming a 95% CI and 95% power, the sample size = 2,425/group; for a ratio of 2, the sample sizes = 3,638 and 1,819. Assuming a 90% CI and 80% power = the sample size = 1,154/group; for a ratio of 2, the sample sizes = 1,732 and 866. b. Testosterone For PFOS, there was a -6.6% difference in the natural log testosterone among girls (per interquartile range of the natural log of PFOS). Among girls, the median testosterone level was 15 ng/dL with an IQR of <LOD, 21 and the LOD of 10 ng/dL. For the sample size calculation of mean difference, the standard deviation was assumed to be equal for the exposed and unexposed groups and equal to 11.85. (Assuming LOD/2 was the lower limit of the IQR, the range = 21 - 5 = 16. Assuming a normal distribution, dividing 16 by 1.35 converts the IQR to a standard deviation, which equaled 11.85)1. To obtain the mean difference, the median testosterone level (15 ng/dL) was assumed to be the reference level (i.e., the level among the unexposed). The natural log of the median equals 2.71. A 6.6% decrease equals 2.53. Exponentiating 2.53 equals 12.55. The mean difference is then 15 – 12.55 = 2.45. Assuming a 95% CI and 80% power, the sample size = 368/group; for a ratio of 2, the sample sizes = 552 and 276. Assuming a 95% CI and 95% power, the sample size = 608/group; for a ratio of 2, the sample sizes = 912 and 456.

97
c. IGF-1 For PFHxS, there was a -2.5% difference in the natural log IGF-1 among boys (per interquartile range of the natural log of PFHxS). Among boys, the median IGF-1 level was 147 ng/mL with an IQR of 116, 187. For the sample size calculation of mean difference, the standard deviation was assumed to be equal for the exposed and unexposed groups and equal to 52.6. (The IQR range was 187 – 116 = 71. Assuming a normal distribution, dividing 71 by 1.35 converts the IQR to a standard deviation, which equaled 52.6)1. To obtain the mean difference, the median IGF-1 level (147 ng/mL) was assumed to be the reference level (i.e., the level among the unexposed). The natural log of the median equals 4.99. A 2.5% decrease equals 4.865. Exponentiating 4.865 equals 129.7. The mean difference is then 147 – 129.7 = 17.3. Assuming a 95% CI and 80% power, the sample size = 146/group; for a ratio of 2, the sample sizes = 218 and 109. Assuming a 95% CI and 95% power, the sample size = 241/group; for a ratio of 2, the sample sizes = 362 and 181. For PFOS, there was a -5.9% difference in the natural log IGF-1 among boys (per interquartile range of the natural log of PFOS). This would require considerably smaller sample sizes for IGF-1 than those for PFHxS. Thyroid function – Children/Adolescents 1. C8 study of children (Lopez-Espinosa 2012) a. Thyroid –stimulating hormone (TSH) Fourth quartile PFOS was associated with a 3.1% change in the natural log TSH. The median TSH level was 1.83 µIU/mL and the IQR was 1.31, 2.55. For the sample size calculation of mean difference, the standard deviation was assumed to be equal for the exposed and unexposed groups and equal to 0.92. (The IQR range was 2.55 – 1.31 = 1.24. Assuming a normal distribution, dividing 1.24 by 1.35 converts the IQR to a standard deviation, which equaled 0.92.)1 To obtain the mean difference, the median TSH level (1.83 µIU/mL) was assumed to be the reference level (i.e., the level among the unexposed). The natural log of the median equals 0.604. A 3.1% increase equals 0.623. Exponentiating 0.623 equals 1.865. The mean difference is 1.865 – 1.83 = 0.035. Assuming a 95% CI and 80% power, the sample size=10,846/group. b. Total thyroxine (TT4) Fourth quartile PFOS was associated with a 2.3% change in TT4. The median TT4 level was 7.4 µg/dL and the IQR was 6.5, 8.4. For the sample size calculation of mean difference, the standard deviation was assumed to be equal for the exposed and unexposed groups and equal to 1.41. (The IQR range was 8.4 – 6.5 = 1.9. Assuming a normal distribution, dividing 1.9 by 1.35 converts the IQR to a standard deviation,

98
which equaled 1.41.)1 To obtain the mean difference, the median TT4 level (7.4 µg/dL) was assumed to be the reference level (i.e., the level among the unexposed). An increase of 2.3% in TT4 produces a mean difference of 0.17. Assuming a 95% CI and 80% power, the sample size = 1,080/group; for a ratio of 2, the sample sizes = 1,620 and 810. Assuming a 95% CI and 95% power, the sample size = 1,788/group; for a ratio of 2, the sample sizes = 2,682 and 1,341. 2. Taiwan study of children. (Lin 2013) a. For males aged 12-19, there was a mean difference in the log TSH of -.50 mIU/L for PFOA levels in the 90th percentile (>9.71 ng/ml) compared to the reference level of PFOA exposure. The standard error for the reference group was 0.26 with N=32 in this group; and the standard error for the 90th percentile group was 0.33 with N=6. The standard deviations for the reference and 90th percentile groups were therefore 1.47 and 0.81, respectively. Assuming a 95% CI and 80% power, the sample size = 89/group; for a ratio of 2, the sample sizes = 158 and 79. Assuming a 95% CI and 95% power, the sample size = 147/group; for a ratio of 2, the sample sizes = 260 and 130. b. For females aged 12-19, there was a mean difference in the log TSH of -.35 mIU/L for PFOA levels in the 90th percentile (>9.71 ng/ml) compared to the reference level of PFOA exposure. The standard error for the reference group was 0.18 with N=71 and the standard error for the 90th percentile group was 0.24 with N=14. The standard deviations for the reference and 90th percentile groups were therefore 1.52 and 0.90, respectively. Assuming a 95% CI and 80% power, the sample size = 200/group; for a ratio of 2, the sample sizes = 348 and 174. Assuming a 95% CI and 95% power, the sample size = 331/group; for a ratio of 2, the sample sizes = 578 and 289. Sample sizes for the categorical outcomes in Tables 6a-c were based on the following prevalences in children: Hypercholesterolemia: 34.2% Hyperuricemia: 16% Thyroid disease: 0.6% ADHD 12.4% reported only; 5.1% reported with additional reporting on medications used for ADHD Asthma: 11%

99
Rhinitis: 25.6% Atopic dermatitis: 10.7% Hypertension: 23.4% Obesity: 17% In addition to the sample size calculations presented in Tables 6 a-c, sample size calculations were done assuming that a national PFAS study of children may be conducted in the future. Sample size calculations were conducted with type 1 (“α error”) set at .05 and type 2 error (“β error) set at .20. Sample sizes per stratum and sample sizes assuming a 2:1 ratio of exposed group to reference group were calculated. It was considered important that a national study have a total sample size so that exposures could be categorized into tertiles (i.e., reference level, medium level, and high level) or preferably into quartiles (i.e., reference level, low, medium and high). Studies were selected that were considered the most representative of U.S. populations exposed via drinking water to PFOA, PFOS and/or PFHxS as a result of the migration of these PFAS chemicals into ground water or surface water sources from the use of aqueous film forming foam (AFFF). The PFAS serum results from the Pease International Tradeport testing program were used as representative PFAS serum levels. Studies conducted using NHANES data had PFOA and PFHxS serum levels similar to or lower than those observed at Pease. In some of the more recent NHANES studies, the PFOS serum levels were only moderately higher than at Pease. Therefore the PFOS, PFOA and PFHxS results in the NHANES studies were used in many of the following sample size calculations for a possible national study. One major drawback of the NHANES studies was that children under the age of 12 were not included because PFAS was not measured in their serum. Recently, NHANES serum PFAS data for children under the age of 12 was published, so it is likely that future NHANES studies will include this age group. For those outcomes not included in NHANES studies, the C8 studies were used. The C8 results were considered more representative of U.S. populations (e.g., in background disease rates and prevalence of non-PFAS risk factors) than studies conducted in other countries, although the PFOS, and especially the PFOA, serum levels in the C8 studies were higher than at Pease. Table 8 provides the sample size calculations for several health outcomes. For some health outcomes such as IQ, antibody response to vaccines, and delayed puberty, the information was insufficient to estimate sample sizes. For the biomarkers, lipids, uric acid, testosterone, insulin-like growth factor – 1, a total sample size of between 2,000 and 2,500 children should be sufficient. NHANES studies of ADHD, rhinitis and antibody response to the MMR vaccine observed statistically significant findings with total sample sizes considerably smaller than 2,000 children although the age range for the ADHD study was limited to 12 – 15 years. Studies of executive function, attention, IQ, adiposity and obesity conducted in the U.S. and other countries also had total sample sizes less than 2,000. An NHANES study of estimated glomerular filtration rate observed statistically significant findings with a total sample size of just under 2,000 children. For thyroid function, estradiol, asthma, and delayed puberty, total sample sizes exceeding 3,000 children may be necessary. Outcomes such as specific childhood cancers and autism spectrum disorders would also require total sample sizes much larger than 3,000.

100
In summary, a total sample size of 2,000 to 2,500 would be sufficient to evaluate a wide range of biomarkers and outcomes including lipids (and hypercholesterolemia), uric acid (and hyperuricemia), estimated glomerular filtration rate, testosterone, IGF-1, neurobehavioral measures (executive function, attention, IQ) and ADHD, rhinitis, antibody response to MMR (and possibly also DPT) adiposity and obesity.
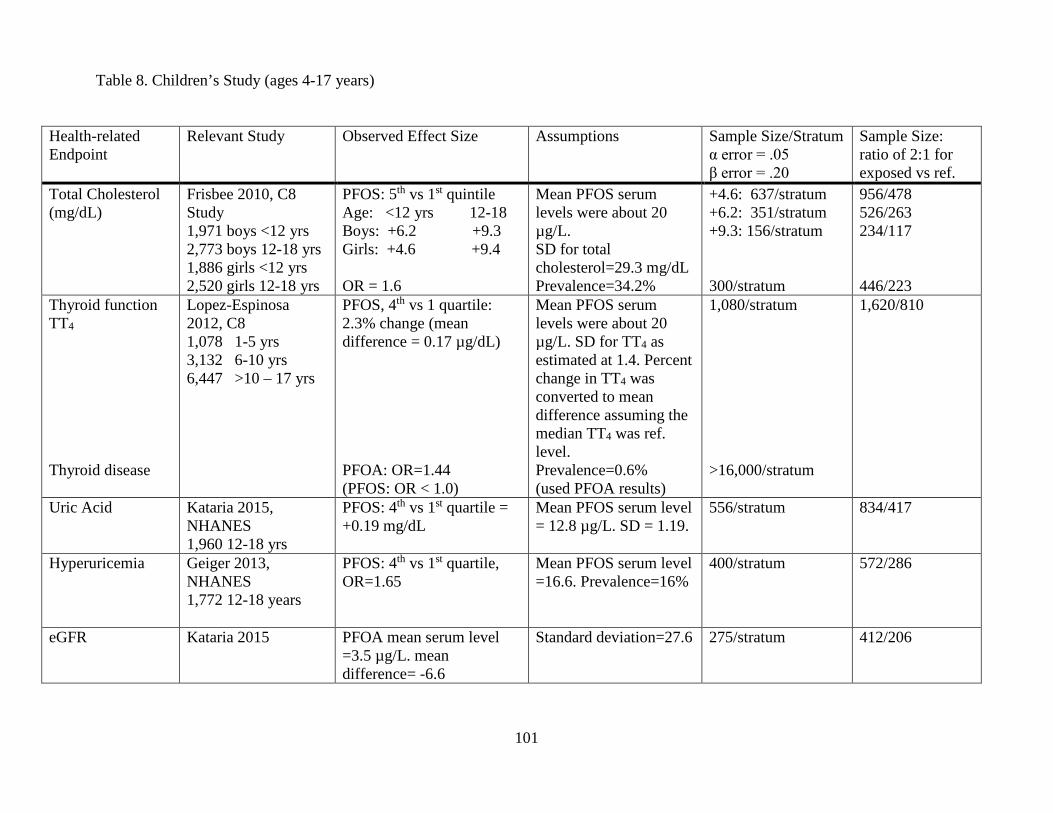
101
Table 8. Children’s Study (ages 4-17 years)
Health-related Endpoint
Relevant Study Observed Effect Size Assumptions Sample Size/Stratum α error = .05 β error = .20
Sample Size: ratio of 2:1 for exposed vs ref.
Total Cholesterol (mg/dL)
Frisbee 2010, C8 Study 1,971 boys <12 yrs 2,773 boys 12-18 yrs 1,886 girls <12 yrs 2,520 girls 12-18 yrs
PFOS: 5th vs 1st quintile Age: <12 yrs 12-18 Boys: +6.2 +9.3 Girls: +4.6 +9.4 OR = 1.6
Mean PFOS serum levels were about 20 µg/L. SD for total cholesterol=29.3 mg/dL Prevalence=34.2%
+4.6: 637/stratum +6.2: 351/stratum +9.3: 156/stratum 300/stratum
956/478 526/263 234/117 446/223
Thyroid function TT4 Thyroid disease
Lopez-Espinosa 2012, C8 1,078 1-5 yrs 3,132 6-10 yrs 6,447 >10 – 17 yrs
PFOS, 4th vs 1 quartile: 2.3% change (mean difference = 0.17 µg/dL) PFOA: OR=1.44 (PFOS: OR < 1.0)
Mean PFOS serum levels were about 20 µg/L. SD for TT4 as estimated at 1.4. Percent change in TT4 was converted to mean difference assuming the median TT4 was ref. level. Prevalence=0.6% (used PFOA results)
1,080/stratum >16,000/stratum
1,620/810
Uric Acid Kataria 2015, NHANES 1,960 12-18 yrs
PFOS: 4th vs 1st quartile = +0.19 mg/dL
Mean PFOS serum level = 12.8 µg/L. SD = 1.19.
556/stratum 834/417
Hyperuricemia Geiger 2013, NHANES 1,772 12-18 years
PFOS: 4th vs 1st quartile, OR=1.65
Mean PFOS serum level =16.6. Prevalence=16%
400/stratum 572/286
eGFR Kataria 2015 PFOA mean serum level =3.5 µg/L. mean difference= -6.6
Standard deviation=27.6 275/stratum 412/206

102
Health-related Endpoint
Relevant Study Observed Effect Size Assumptions Sample Size/Stratum α error = .05 β error = .20
Sample Size: ratio of 2:1 for exposed vs ref.
Testosterone Lopez-Espinosa 2016, C8 1,169 boys, 6-9 yrs 1,123 girls, 6-9 yrs
PFOS (IQR): -5.8% boys (diff=1.9) -6.6% girls (diff=2.45)
Percent change was converted to mean difference assuming median testosterone level was ref. level. SD estimated at 11.85 for girls and 9.63 for boys.
Boys: 404/stratum Girls: 368/stratum
606/303 552/276
Estradiol Lopez-Espinosa 2016, C8
PFOS (IQR): Boys: -4% (diff=0.88) Girls: -0.3%
Percent change was converted to mean difference assuming median estradiol in boys as ref. level. SD estimated at 8.5.
Sample size calculation for boys only: 1,465/stratum
Sample size calculated for boys only: 2,198/1,099
IGF-1 (Insulin-like growth factor – 1)
Lopez-Espinosa 2016, C8
PFHxS (IQR): Boys: -2.5% (diff=17.3 Girls: -2.1%
Percent change was converted to mean difference assuming median IGF-1 in boys as ref. level. SD estimated as 52.6
146/stratum 218/109
Delayed Puberty Lopez-Espinosa 2011. C8 3,072 boys, 8-18 yrs 2,903 girls, 8-18 yrs
PFOS: mean serum level was about 19 µg/L.
OR for delayed puberty and the number of days delayed puberty had narrow CIs
Insufficient information to calculate sample size, but sample sizes in this study were more than enough for sufficient precision
ADHD Stein 2011, C8 10,546 aged 5-18 yrs.
PFHxS mean serum level was 5.2 µg/L. 4th vs 1st quartile, OR=1.5 OR=1.6
Prevalence: ADHD Dx: 12.4% ADHD Dx/meds: 5.1%
764/stratum 1,204/stratum
1,092/546 1,684/842
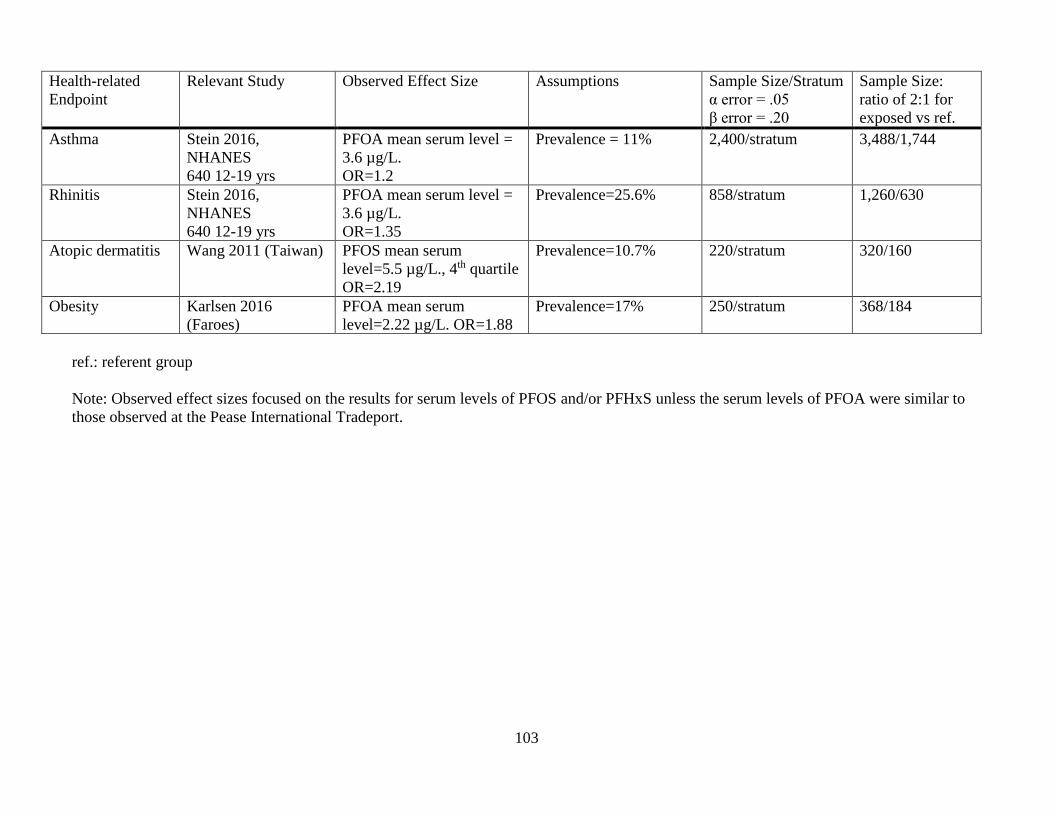
103
Health-related Endpoint
Relevant Study Observed Effect Size Assumptions Sample Size/Stratum α error = .05 β error = .20
Sample Size: ratio of 2:1 for exposed vs ref.
Asthma Stein 2016, NHANES 640 12-19 yrs
PFOA mean serum level = 3.6 µg/L. OR=1.2
Prevalence = 11% 2,400/stratum 3,488/1,744
Rhinitis Stein 2016, NHANES 640 12-19 yrs
PFOA mean serum level = 3.6 µg/L. OR=1.35
Prevalence=25.6% 858/stratum 1,260/630
Atopic dermatitis Wang 2011 (Taiwan) PFOS mean serum level=5.5 µg/L., 4th quartile OR=2.19
Prevalence=10.7% 220/stratum 320/160
Obesity Karlsen 2016 (Faroes)
PFOA mean serum level=2.22 µg/L. OR=1.88
Prevalence=17% 250/stratum 368/184
ref.: referent group Note: Observed effect sizes focused on the results for serum levels of PFOS and/or PFHxS unless the serum levels of PFOA were similar to those observed at the Pease International Tradeport.

104
Adult Study The following provides information on the parameters (e.g., standard deviation, disease prevalence) used in the sample size calculations provided in Tables 7a-b for the adult study. Liver Function – Adults
In the C8 study (Darrow 2016), the mean alanine aminotransferase (ALT) level was 26 IU/L and the standard deviation was 19. The linear regression coefficient for the natural log ALT in the fifth quintile level of cumulative natural log PFOA was 0.058. Assuming that the reference group had an ALT level equal to the mean, the natural log of the mean ALT would be 3.26. Therefore the natural log of ALT for the fifth quintile cumulative log PFOA would be 3.32. Exponentiating 3.32 equals 27.6. The mean difference in the untransformed ALT is then 1.6.
Assuming a 95% CI and 80% power, the sample size = 2,214/group. Assuming a 95% CI and 95% power, the sample size = 3,665/group.
In the C8 study (Gallo 2012), the linear regression on the natural log of ALT resulted in a regression coefficient for the natural log PFOS of 0.029. The top quintile of PFOS level in the Pease adult population was about 15 ng/mL. The natural log of 15 is 2.71; multiplying by 0.029 results in a natural log ALT increase of 0.08. From the graph in the article, the reference level of ALT is about 21.3 IU/L. The natural log of 21.3 is 3.06. Adding 0.08 to 3.06 equals 3.14, and exponentiating 3.14 equals 23.1. Therefore the mean difference is 23.1 – 21.3 which equals 1.8. The ALT standard deviation for the entire population was 20.1, and it was assumed that this was the standard deviation for each quintile PFOS. Assuming a 95% CI and 80% power, the sample size = 1,958/group. Assuming a 95% CI and 95% power, the sample size = 3,241/group. Thyroid Function – Adults In a study done by Shrestha 2015, the sample size was 87 adults aged 55-74. Mean and SD for TSH was 2.58 µIU/mL and 1.47, respectively. The linear regression of the natural log TSH resulted in a coefficient for the natural log PFOS of 0.129. Using a PFOS level of 15 ng/mL, the natural log of 15 is 2.71; multiplied by 0.129 equals 0.35. The reference level TSH was assumed to be the median TSH of 2.15 µIU/mL. The natural log of 2.15 is 0.77; adding 0.35 equals 1.12. Exponentiating 1.12 equals 3.06. The mean difference is then 3.06 – 2.15 = 0.91. The standard deviation of 1.47 was used for each group.
Assuming a 95% CI and 80% power, the sample size = 41/group. Assuming a 95% CI and 95% power, the sample size = 68/group.

105
a. TSH
In Ji 2012, the sample size was 633, ≥12 years of age and the median TSH level was 1.37 µIU/mL with an IQR of 0.90, 2.01. The standard deviation was estimated as the IQR range divided by 1.35: (2.01 - .90)/1.35 = 0.82. This standard deviation was assumed for each group. For TSH, the linear regression coefficients for PFOS and PFHxS were 0.062 and 0.013, respectively. Using a PFOS level of 15 ng/mL and a PFHxS level of 9 ng/mL, the mean difference for PFOS and PFHxS are 0.93 and 0.12, respectively.
Assuming a 95% CI and 80% power, the sample size = 13/group for PFOS Assuming a 95% CI and 95% power, the sample size = 21/group for PFOS Assuming a 95% CI and 80% power, the sample size = 733/group for PFHxS Assuming a 95% CI and 95% power, the sample size = 1,214/group for PFHxS
b. TT4 (total thyroxine)
In Ji 2012, the sample size was 633, ≥12 years of age and the median TT4 level was 7.4 µg/dL and the IQR was 6.7, 8.1. The standard deviation was estimated: (8.1 – 6.7)/1.35 = 1.04. This standard deviation was assumed for each group. For TT4, the linear regression coefficients for PFOS and PFHxS were -0.021 and -0.007, respectively. Using a PFOS level of 15 ng/mL and a PFHxS level of 9 ng/mL, the mean difference for PFOS and PFHxS are -0.32 and -0.06, respectively.
Assuming a 95% CI and 80% power, the sample size = 166/group for PFOS Assuming a 95% CI and 95% power, the sample size = 275/group for PFOS Assuming a 95% CI and 80% power, the sample size = 4,716/group for PFHxS Assuming a 95% CI and 95% power, the sample size = 7,809/group for PFHxS
Sample sizes for the categorical outcomes in Tables 7a-b were based on the following prevalences in adults: Hypercholesterolemia: 15% Hyperuricemia: 24% Thyroid disease: 6.5% (reported and confirmed by medical records); 11.5% (reported only) Chronic kidney disease: 1.4% Elevated ALT: 11.2% Elevated GGT: 14% Elevated bilirubin: 1.1% Liver disease: 2% Cardiovascular disease: 13% Hypertension: 37% Ulcerative colitis: 0.5% Rheumatoid arthritis: 1.2% Lupus: 0.2% Multiple sclerosis: 0.32% Osteoporosis: 5%

106
Osteoarthritis: 7.6% Endometriosis: 7% Pregnancy-induced hypertension: 8.5% Kidney cancer: 0.3% In addition to the sample size calculations presented in Tables 7 a-b, sample size calculations were done assuming that a national PFAS study of adults may be conducted in the future. Sample size calculations were conducted with type 1 (“α error”) set at .05 and type 2 error (“β error) set at .20. Sample sizes per stratum and sample sizes assuming a 1:1 ratio of exposed group to reference group were calculated. It was considered important that a national study have a total sample size so that exposures could be categorized into tertiles (i.e., reference level, medium level, and high level) or preferably into quartiles (i.e., reference level, low, medium and high). Studies were selected that were considered the most representative of U.S. populations exposed via drinking water to PFOA, PFOS and/or PFHxS as a result of the migration of these PFAS chemicals into ground water or surface water sources from the use of aqueous film forming foam (AFFF). The PFAS serum results from the Pease International Tradeport testing program were used as representative PFAS serum levels. Studies conducted using NHANES data had PFOA and PFHxS serum levels similar to or lower than those observed at Pease. In some of the more recent NHANES studies, the PFOS serum levels were only moderately higher than at Pease. Therefore the PFOS, PFOA and PFHxS results in the NHANES studies were used in many of the sample size calculations. For those outcomes not included in NHANES studies, the C8 studies were used. The C8 results were considered more representative of U.S. populations (e.g., in background disease rates and prevalence of non-PFAS risk factors) than studies conducted in other countries, although the PFOS, and especially the PFOA, serum levels in the C8 studies were higher than at Pease. Table 9 provides the sample size calculations for several health outcomes. For lipids, uric acid, cardiovascular disease, and osteoarthritis, a total sample of 6,000 should be sufficient. For thyroid disease and thyroid function, a total sample size of 7,000 – 8,000 might be needed. However, NHANES studies of thyroid function and thyroid disease obtained statistically significant findings with total sample sizes considerably less than 6,000. NHANES studies of liver function also obtained statistically significant findings with total sample sizes considerably less than 6,000. For ulcerative colitis, a sample size of 6,000 might be sufficient if the effect size in the C8 study (i.e., OR=3.05) was likely for PFOA serum levels considerably lower than those in the C8 study. For more likely effect sizes (e.g., ORs < 2.75), a total sample size of 6,000 would not be adequate to evaluate ulcerative colitis effectively. For outcomes such as MS, lupus, rheumatoid arthritis, liver disease, kidney disease and kidney cancer, a total sample size of 6,000 would likely not be adequate. For biomarkers of immune function (e.g., immunoglobin, C-reactive protein and cytokines) and fatty liver disease, there was insufficient information to calculate sample sizes. However, a total sample size of 6,000 should be sufficient to effectively evaluate these biomarkers. In summary, a total sample size of 6,000 – 7,000 should be sufficient to evaluate a broad range of biomarkers and outcomes such as lipids (and hypercholesterolemia), uric acid (and hyperuricemia), cardiovascular disease, osteoarthritis, immune biomarkers and biomarkers for fatty liver disease. It also may be sufficient to evaluate thyroid disease, thyroid function and liver function.

107
Table 9. Adult study (ages ≥18 years)
Health-related Endpoint
Relevant Study Observed Effect Size Assumptions Sample Size/Stratum α error = .05 β error = .20
Total Cholesterol (mg/dL)
Steenland 2009, C8 46,294 aged ≥18 yrs
PFOS, mean serum level = 19.6 µg/L, 10th vs 1st decile:+11 mg/dL 4th vs 1st quartile, OR=1.51
SD=41.9 Prevalence=15%
228/stratum 660/stratum
Total Cholesterol (mg/dL)
Fisher 2013, Canada PFHxS, mean serum level = 2.2 µg/L, 4th vs 1st quartile, OR=1.57
Prevalence=44% 290/stratum
Thyroid disease Melzer 2010, NHANES 1,900 men, aged ≥20 yrs 2,066 women, aged ≥20 yrs
PFOA, mean serum level=3.5 µg/L, 4th vs 1st quartile: Thyroid disease ever: Women, OR=1.64 Men, OR=1.58 Thyroid disease with current meds Women, OR=1.86 Men, OR=1.89
Prevalences: 16.18% 3.06% 9.89% 1.88%
410/stratum 2,035/stratum 365/stratum 1,575/stratum
Subclinical hypothyroidism
Wen 2013, NHANES 672 males aged ≥20 yrs 509 females aged ≥20 yrs
PFHxS mean serum level averaged about 2 µg/L. Unit increase in Ln(PFHxS): Women, OR=3.10 Men, OR=1.57
Prevalences: 1.6% 2.2%
475/stratum 2,918/stratum
Uric Acid Shankar 2011, NHANES 3,883 aged ≥20 yrs
PFOA mean serum level = 3.5 µg/L, 4th vs 1st quartile: +0.44 mg/dL Hyperuricemia, 4th vs 1st quartile: OR=1.97 PFOS mean serum level = 17.9 µg/L Hyperuricemia, 4th vs 1st quartile: OR=1.5
SD = 2.5 Prevalence: 19.2%
507/stratum 200/stratum 550/stratum
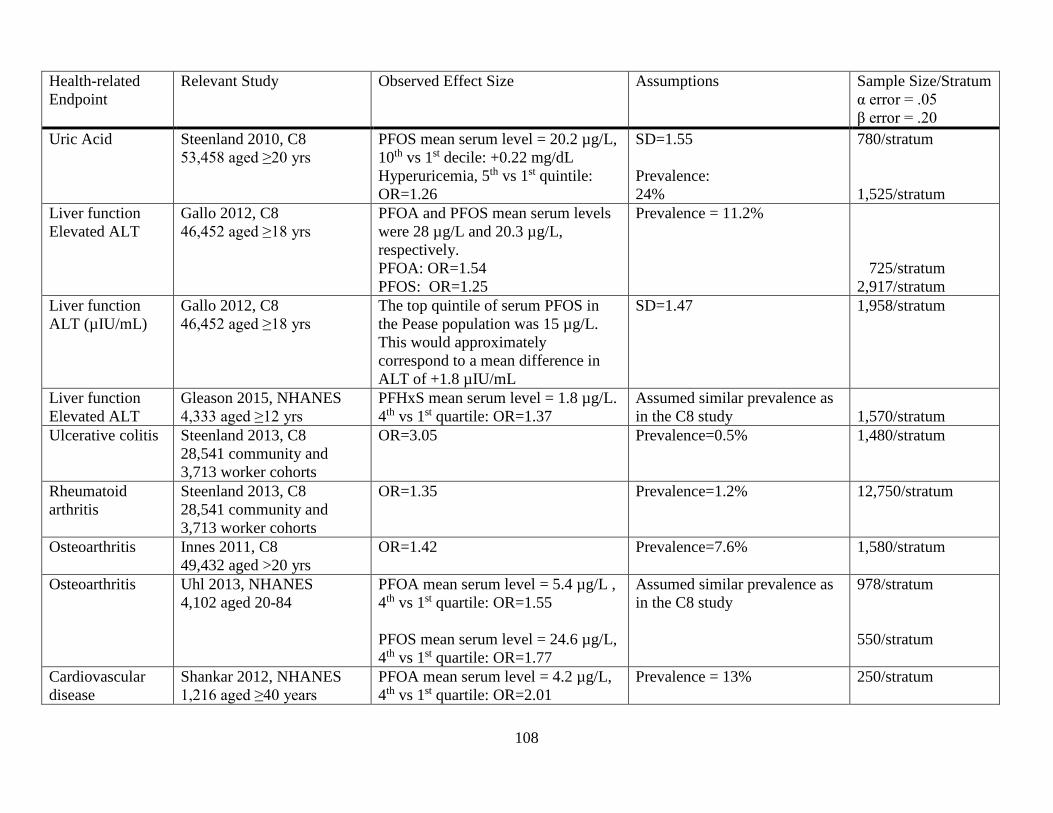
108
Health-related Endpoint
Relevant Study Observed Effect Size Assumptions Sample Size/Stratum α error = .05 β error = .20
Uric Acid Steenland 2010, C8 53,458 aged ≥20 yrs
PFOS mean serum level = 20.2 µg/L, 10th vs 1st decile: +0.22 mg/dL Hyperuricemia, 5th vs 1st quintile: OR=1.26
SD=1.55 Prevalence: 24%
780/stratum 1,525/stratum
Liver function Elevated ALT
Gallo 2012, C8 46,452 aged ≥18 yrs
PFOA and PFOS mean serum levels were 28 µg/L and 20.3 µg/L, respectively. PFOA: OR=1.54 PFOS: OR=1.25
Prevalence = 11.2% 725/stratum 2,917/stratum
Liver function ALT (µIU/mL)
Gallo 2012, C8 46,452 aged ≥18 yrs
The top quintile of serum PFOS in the Pease population was 15 µg/L. This would approximately correspond to a mean difference in ALT of +1.8 µIU/mL
SD=1.47 1,958/stratum
Liver function Elevated ALT
Gleason 2015, NHANES 4,333 aged ≥12 yrs
PFHxS mean serum level = 1.8 µg/L. 4th vs 1st quartile: OR=1.37
Assumed similar prevalence as in the C8 study
1,570/stratum
Ulcerative colitis Steenland 2013, C8 28,541 community and 3,713 worker cohorts
OR=3.05 Prevalence=0.5% 1,480/stratum
Rheumatoid arthritis
Steenland 2013, C8 28,541 community and 3,713 worker cohorts
OR=1.35 Prevalence=1.2% 12,750/stratum
Osteoarthritis Innes 2011, C8 49,432 aged >20 yrs
OR=1.42 Prevalence=7.6% 1,580/stratum
Osteoarthritis Uhl 2013, NHANES 4,102 aged 20-84
PFOA mean serum level = 5.4 µg/L , 4th vs 1st quartile: OR=1.55 PFOS mean serum level = 24.6 µg/L, 4th vs 1st quartile: OR=1.77
Assumed similar prevalence as in the C8 study
978/stratum 550/stratum
Cardiovascular disease
Shankar 2012, NHANES 1,216 aged ≥40 years
PFOA mean serum level = 4.2 µg/L, 4th vs 1st quartile: OR=2.01
Prevalence = 13% 250/stratum

109
Other sites with PFAS-contaminated drinking water from the UCMR-3
Table A1 shows the maximum combined levels of PFHxS and PFOS in any sample taken from
each utility. Only utilities with detectable levels of either PFHxS or PFOS are listed. The data are from the UCMR-3 database as of July 2016 (US EPA 2016b). The ten utilities with the highest PFOS/PFHxS levels in a sample are: the Commonwealth Utilities Corporation serving the Mariana Islands, the Artesian Water Company serving portions of the state of Delaware, the Security Water and Sanitation Districts serving Colorado Springs, the Horsham Water & Sewer (PA), the Warminster Municipal Authority (PA), the Oatman Water Company (AZ), the Issaquah Water System (WA), the Hyannis Water System (MA), the Suffolk County Water Authority (NY) and the Warrington Township Water & Sewer (PA). Three of the top 10 utilities are located near each other in the vicinity of Philadelphia, PA: Horsham, Warminster, and Warrington. ATSDR is currently considering whether it is feasible to include children and adults from these towns in studies that would also evaluate the Pease populations. Willow Grove Naval Air Station/Air Reserve Station (a.k.a. Naval Air Station Joint Reserve Base and Air Force Reserve Station), Montgomery County, Pennsylvania
The Naval Air Station Joint Reserve Base (NASJRB) and Air Reserve Station (ARS) at Willow Grove (“Willow Grove”) are two separate, but co-located military facilities in Montgomery County, Pennsylvania. The Navy acquired site in 1942 and began jet training there in 1949; the air force base began operations in 1958. In 2001, the Willow Grove bases employed 1,571 active-duty individuals, 993 members of the National Guard, 3,500 members of the Reserves, and 778 civilians with approximately 1,700 staff on-station daily. About 230 people resided on the bases year-round: less than 30 people resided in single family dwellings and less than 200 resided in barracks. Additionally, there were five officer family units, 200 enlisted family units, and 250 unaccompanied enlisted units as well as a daycare center on base for 96 children. The Willow Grove Branch Medical Clinic was also located there and provided primary care, medical support, preventive medicine, and occupational health services to 20,000 active duty, reserve, retired personnel, and their family members (ATSDR 2002a). Willow Gove became an Air National Guard Base in September 2011. The surplus land with the runways was turned over to Horsham Township for redevelopment.
AFFF used on the Willow Grove bases resulted in PFAS contamination of two nearby water systems – the Warrington Township Water and Sewer Department (WTWSD) which served the eastern portion of Warrington and the Horsham Water and Sewer Authority (HWSA).
In late October 2014, three of nine wells in the southern portion of the WTWSD were above the EPA Provisional Health Advisory Level (PHAL) for PFOS and were taken out of service. PFOS levels were the following: Well 1 (0.21 μg/L), Well 2 (1.6 μg/L), and Well 6 (1.3 μg/L). Although the wells pump directly into the distribution system, wells 1, 2, and 6 are blended together at a tank and enter the distribution system at one point. These wells constituted about 30% of the WTWSD supply. Well 3, in the northeast area of the eastern section, and well 9, which is centrally located in the eastern section, had very low levels of contamination.
Using currently available water distribution system information, ATSDR determined that for “present-day” conditions, the northern part of the eastern section of the WTWDS system generally received water that did not contain PFOA and PFOS. If any customers in the northern part of the system received water containing PFOA and PFOS, it was at levels below the EPA Lifetime Health Advisory (LTHA). The central part of the eastern section of the system may have received water containing PFOA and PFOS concentrations above the EPA LTHA. The southeastern part of the eastern section of the system received water containing PFOA and PFOS concentrations up to 10 times the EPA LTHA. More

110
detailed analyses of the water-distribution system need to be conducted to estimate historical PFAS concentrations at specific housing areas. These analyses would involve looking at the water-distribution system operating conditions, historical monthly well pumping records, and customer consumption information in more detail.
The western section of the Warrington system is supplied by water purchased from North Wales Water Authority (NWWA) and is not contaminated with PFAS. However, there is another interconnection between the eastern sections of the system and NWWA which is used when there is a need in the eastern section.
Warrington Township Water and Sewer Department (WTWSD) UCMR 2014-2015 data* Well PFOS (µg/L) PFHxS (µg/L) PFOA (µg/L) PFNA (µg/L) Wells 1, 2, 6 0.67 0.24 0.12 - Well 3 0.06 0.04 0.02 - Well 9 0.09 0.06 0.03 -
*Wells 1, 2, 3, and 6 were sample 11/11/2014; Well 9 was sampled 5/11/2015 The HWSA is served by 15 wells as well as interconnections with other nearby water utilities.
The water system is separated into two pressure zones, “high” and “low,” with the wells in each zone pumping to fill storage tanks. The high zone has two storage tanks supplied by three wells and two separate interconnections with North Wales Water Authority. The low zone has three storage tanks served by 11 wells and an interconnection with Aqua Pennsylvania Southeastern Division. (Note: the Aqua system had 0.009 µg/L of PFOS and .005 µg/L PFOA during UCMR-3 sampling in 4/16. Samples taken between August 2016 and August 2017 at the Aqua Interconnection where it enters the HWSA system measured an average of 0.0116 µg/L for PFOS and 0.0079 µg/L for PFOA.). June 2014 UCMR3 drinking water source sample results indicated that PFAS contamination was solely in the low pressure zone which serves the majority of the service area. Prior to 1996 the system did not have pressure zones which means customers located in the current high pressure zone may have received water from wells in the low pressure zone. Generally, demand in each zone is met using water from the storage tanks within that zone. The wells in each zone begin to pump simultaneously to meet customer demand and refill the tanks when the water level in the tanks in the respective zone drop to a predetermined level Varying well production rates and the active or inactive state of the wells and interconnections affect the quantity of water from a specific source supplying the storage tanks, thus the PFAS concentrations in the tanks will vary. While the wells are pumping, water is being supplied throughout the interconnected system both from the tanks and from the various sources of water entering the system. When the tanks refill, the wells turn off and water is supplied from the storage tanks. Water in the tanks is diminished and restored based on demand and the wells cycle accordingly between active and inactive pumping states. As a result, sources of supply are blended within the storage tanks and throughout the distribution system. However it is possible that a property in close proximity to a well which has a demand at the same time the well is pumping will have a higher percentage of water from the nearby well than from other sources of supply.
Through the controlled operation of valves at two separate locations in the system, water from the high zone can be moved by gravity into the low zone. A single booster location allows the movement of water from the low zone into the high zone through a controlled pump and valve operation.
In June 2014, HWSA wells were tested for PFAS as part of the UCMR3. PFAS were not detected at nine supply wells. Three wells, Well 10, Well 17, and Well 21, had PFAS detected but below the EPA PHALs. Two wells, well #26 and well #40, had levels of PFOA below the EPA PHAL of 0.4 μg/l but levels of PFOS greater than the EPA PHAL of 0.2 μg/l.. Both wells #26 and #40 were

111
removed from service in July 2014 upon receipt of the sample results. The two contaminated wells generally supplied about 25% of the water for the system; however, there were times that the two contaminated wells supplied as much as 35% of the water for the system. A 15th well, Well 6 has been in a reserve status since 2009 and was not sampled. PFAS levels from the UCMR-3 for the Horsham supply wells are shown in the table below.
Following receipt of the first set of UCMR3 results, HWSA began actively monitoring its supply wells for PFAS. Analyses performed at minimum reporting limits (MRL) lower than the UCMR3 MRLs ultimately revealed detections at all 14 wells. In May 2016 subsequent to the EPA announcement of its Lifetime Health Advisory (LTHA) for PFOA/PFOS, wells 10, 17, and 21 were immediately taken out of service. The other nine wells have tested below the LTHA.
ATSDR used currently available water-distribution system information to determine that for “present-day” conditions, some areas in the southern and southeastern part of the low pressure zone received water containing PFOA and PFOS concentrations up to 9 times the EPA LTHA. The northeastern part of the low pressure zone received water containing PFOA and PFOS concentrations less than the EPA LTHA. More detailed analyses of the system need to be conducted to estimate historical PFAS concentrations at specific housing areas. These analyses would involve looking at the water-distribution system operating conditions, historical monthly well pumping records, and customer consumption information in more detail.
In addition to the five HWSA public wells exceeding the LTHA, the Navy and National Guard Bureau (NGB) have identified over 90 additional private wells in Horsham that are at or above the LTHA of 70 parts per trillion (ppt). The Navy or NGB is providing bottled water to these private well owners. Horsham Water and Sewer Authority (HWSA) UCMR 2014 data* Well PFOS (µg/L) PFHxS (µg/L) PFOA (µg/L) PFNA (µg/L) Well 10 0.05 0.04 0.03 -ND Well 17 0.10 0.05 0.03 -ND Well 21 0.14 0.08 ND- -ND Well 26 0.70 0.39 0.29 -ND Well 40 1.00 0.59 0.06 -ND
*Wells 10 and 17 were sampled 12/9/2014; Wells 21, 26, and 40 were sampled 6/24/2014 Other drinking water contaminants
Supply wells on base contained volatile organic compounds (VOC) and metals. Maximum detected levels in supply wells from sampling conducted in 1979-1984 were 91 ppb for PCE and 300 ppb for TCE. After contamination was detected, the well with the highest levels of contamination was used mainly for fire protection. Additionally, the Navy installed an air stripper to treat groundwater prior to distribution, and monitoring of treated water between 1996 and 1998 found no contaminants above EPA’s Maximum Contaminant Levels (MCLs) (ATSDR 2002a). According to the EPA, over 800 employees at the two facilities may have drank or come into contact with treated water from the Navy supply wells (https://cumulis.epa.gov/supercpad/cursites/csitinfo.cfm?id=0303820). VOC contamination in off-site wells has not been attributed to the base, and the local water authorities (HWSA and WTWSD) treat the water for VOCs before distribution (ATSDR 2002a).

112
Naval Air Warfare Center (a/k/a Naval Air Development Center), Warminster Township, Bucks County, Pennsylvania The former Naval Air Warfare Center (NAWC) is located in Warminster Township. The base operated from 1944 until its closure in September 1996. In 1994, approximately 1,850 civilians and 1,000 military personnel were stationed or employed on base. At its peak, the base employed 2,800 civilians, 200 military personnel, and up to 300 daily contractors (ATSDR 2002b).
Approximately 800 to 1,000 military personnel and their families stationed at nearby Willow Grove Naval Air Station lived in two on-base housing areas at NAWC while as many as six families may have resided in officer housing. Between 450-550 enlisted personnel and their families lived at the Shenandoah Woods housing complex. Site 5, a former landfill, was located in Shenandoah Woods. Quarters A and B, located within Area C, provided housing for the base’s commanding officer and second-in-command (ATSDR 2002b).
Four out of eighteen of the Warminster Municipal Authority (WMA) public water supply wells are in close proximity to the former NAWC site. The WMA provides water to approximately 40,000 people. The water supplied to the customers is from water supply wells in the WMA system and may be purchased from the North Wales Water Authority (NWWA) as well as the Upper Southampton Municipal Authority on an emergency basis. WMA's water supply wells are connected individually to the distribution network and are subsequently blended within the distribution system in tanks and standpipes. Therefore, customers located geographically closest to a given water supply well will likely receive more water from that well than users located further away (ATSDR 2016).
AFFF was used for decades at the base for firefighting training activities. PFAS were first tested for in groundwater as emerging contaminants in preparation for the CERCLA 2012 Five Year Review for this site. In summer 2013, PFOS levels above the EPA PHAL were first discovered in groundwater on the former Navy property. As part of the EPA's UCMR-3, sampling for six PFAS in the WMA first occurred in November 2013. UCMR-3 monitoring for PFAS is required at the entry point to the distribution system for each well and at any interconnection in operation. Accordingly, WMA conducted sampling in November 2013 and May 2014 for all wells and conducted sampling in November 2013 and February, May, and August 2014 for the interconnection with NWWA (ATSDR 2016).
Samples taken in the WMA system detected levels of PFOS, PFOA, PFHxS and/or PFHpA. The source of the contamination was the use of AFFF at NAWC. In November 2013, three WMA public water wells had levels at or above EPA’s PHAL for PFOS. In this sampling event, 17 samples covering 17 wells in the WMA and one sample of the NWWA interconnection were taken and analyzed for PFAS. One of the 17 WMA samples represents the combined water extracted from WMA Wells 43 and 44. Water from these two wells is combined for treatment and samples are taken after treatment at the entry point to the distribution system. PFOS was detected in 6 public wells and PFOA was detected in 8 public wells. PFOS was detected in Well 26 at 0.791 µg/L, more than three times the 0.2 µg/L PFOS PHAL value. Wells 10 and 13 had PFOS concentrations of 0.193 and 0.16 µg/L that can be rounded to 0.2 µg/L. None of the PFOA detections exceeded the PFOA PHAL in the WMA wells. Well 26 had the highest detections for PFOA and PFOS. In summer 2014, PFOS was detected in four public wells. The highest concentrations were in Well 26 at 1.09 µg/L, more than five times the 0.2 µg/L PFOS PHAL value, and in Well 10 at 0.176 µg/L. PFOA was detected in four wells, including Well 26 at 0.349 µg/L, close to the 0.4 µg/L PHAL for PFOA. Wells 13 and 26 were shut down in June 2014. Well 10 was shut down in September 2014. On May 19, 2016, wells 2, 14 and 15 were removed from service due to the EPA new lifetime health advisory level for PFOA/FPOS (ATSDR 2016).
PFOS levels above the PHAL were also detected in private drinking water samples. As of September 2015, 100 private wells (94 residential and 6 non-residential) were identified and sampled within an approximate 1-3 mile radius of the site. At least one PFAS was detected in the majority (93

113
out of 100) of these private water wells. Of the 94 residential private water wells, five were non-detect for PFOA and PFOS, 18 had detections of PFOA only, and 71 had both PFOA and PFOS. Eleven exceeded the PFOS PHAL, ranging from 0.152 µg/L to 0.729 µg/L. The PFOS PHAL exceedances are in two general locations: one location is south of the Jacksonville Road and East Bristol Road intersection and the other location is in the area of York Road and W Street. Six residential wells with PFOS levels that range from 0.102 to 0.109 µg/L (50% of the PHAL) are located at the Jacksonville/East Bristol Roads intersection (ATSDR 2016).
The Navy and EPA provided a limited number of residents whose private well water was at or above EPA's PHAL (with rounding up to one significant digit) with bottled water to use for drinking and cooking water, and is currently working to connect these locations to public water (ATSDR 2016).
Using currently available water-distribution system information, ATSDR determined that for “present day” conditions, the southwestern part of the Warminster system typically received water that did not contain PFOA and PFOS concentrations. If any customers in this part of the system received water containing PFOA and PFOS concentrations, it was at levels below the EPA LTHA. The northwestern part of the Warminster system typically received water containing PFOA and PFOS concentrations at or below the EPA LTHA. Some areas in the eastern parts of the Warminster system received water containing PFOA and PFOS concentrations at levels up to three times the EPA LTHA, and areas in the central part received water containing concentrations at level up to 15 times the EPA LTHA. More detailed analyses of the system need to be conducted to estimate historical PFAS concentrations at specific housing areas. These analyses would involve looking at the water-distribution system operating conditions, historical monthly well pumping records, and customer consumption information in more detail.
Although some WMA customers received the majority of their water from one of the contaminated wells, the majority of water customers likely received water that either did not contain PFAS or had levels less than the PHALs (but levels may be higher than the EPA LTHA for PFOS/PFOA). If one assumes that all the wells supply a similar amount of water to the system (each well typically supplied 5-10% of the water to the system), then the number of customers potentially exposed to elevated PFAS in their drinking water could be approximately 7,000. Warminster Municipal Authority (WMA) UCMR 2013-2014 data* Well PFOS (µg/L) PFHxS (µg/L) PFOA (µg/L) PFNA (µg/L) Well 2 0.06 0.03 0.03 Well 10 0.19 0.10 0.09 - Well 13 0.16 0.09 0.12 - Well 14 0.06 0.03 0.02 - Well 15 0.06 0.04 0.02 - Well 26 1.09 0.39 0.35 -
*Wells 2, 10, 13, 14, and 15 were sampled 11/19/2013; Well 26 was sampled 6/9/2014 Other drinking water contaminants
Samples taken in 1979 showed maximum levels of contamination in on-site supply wells of 36 ppb for PCE and 293 ppb for TCE. These wells were closed in 1979. Contamination levels in samples taken from off-site municipal supply wells found 17 ppb for PCE and 67.8 ppb for TCE; past off-base residents may have been exposed to these VOCs between 1974, when the well first began supplying water, until it was closed in 1979. Sampling of VOCs in off-site private wells detected PCE at 31 ppb; as a result, affected homes were connected to municipal water supplies or groundwater treatment systems were installed (ATSDR 2002b).

114
Because the TCE- and PCE-contaminated wells were shut down in 1979, military service personnel and DOD civilian workers who began service/employment at NAWC after 1979 might be eligible for a PFAS study. More information is needed to determine when the water supply may have been contaminated with PFAS.
More detailed analyses will help determine which specific housing areas received water containing PFOA and PFOS from the NASJRB and ARS at Willow Grove and the NAWC in Warminster. To conduct more detailed analyses, including modeling, additional information and specific data pertinent to each water system’s operations needs to be obtained from site visits to the water utilities.

115
Appendix tables

116
Table A1. Maximum levels (parts per billion) of combined PFHxS and PFOS from the US EPA’s Third Unregulated Contaminant Monitoring Rule (UCMR-3) Water Utility Name State Size PFHxS & PFOS sum Commonwealth Utilities Corp. (Saipan) MP L 8.60 Artesian Water Company DE L 2.48 Security WSD CO L 1.89 Horsham Water & Sewer Authority PA L 1.59 Warminster Municipal Authority PA L 1.479 Oatman Water Company AZ S 1.03 Warrington Township Water & Sewer Department PA L 0.91047 Issaquah Water System WA L 0.841 Hyannis Water System MA L 0.7 Suffolk County Water Authority NY L 0.67 United Water PA PA L 0.572 Emerald Coast Utilities Authority FL L 0.56 GU Waterworks Authority - Northern System GU L 0.55 Widefield WSD CO L 0.54 Oakdale MN L 0.4913 City of Tucson AZ L 0.476 City of Cleveland Heights OH L 0.4 Sanford Water District ME L 0.4 Wright-Patterson AFB Area A/C OH L 0.36 Liberty Water LPSCO AZ L 0.33 Westfield Water Department MA L 0.33 City of Zephyrhills FL L 0.32 Bemidji MN L 0.32 City of Fountain CO L 0.29 City of Stuart Water Plant FL L 0.259

117
Water Utility Name State Size PFHxS & PFOS sum City of Tempe AZ L 0.245 CA American Water Co. - Suburban CA L 0.241 City of Newburgh NY L 0.24 CA Water Service - Visalia CA L 0.212 Eastern Municipal Water District CA L 0.202 New Windsor Consolidated Water District NY L 0.1936 VAW Water System, Inc. AL L 0.18 Freeport IL L 0.18 La Crosse Waterworks WI L 0.172 Salt River Public Works 09* L 0.166 City of Martinsburg WV L 0.157 Dyer Water Department IN L 0.1437 Atlantic City MUA NJ L 0.142 West Morgan - East Lawrence Water Authority AL L 0.13 City of Greensboro NC L 0.124 Rome GA L 0.12 Dover Water Department NH L 0.12 CA Water Service - Chico CA L 0.118 Moore County Public Utilities - Pinehurst NC L 0.118 Rhinelander Water & Wastewater WI S 0.1173 Bayleaf Master NC L 0.11 City of Ocala FL L 0.104 NJ American Water Co. - Raritan NJ L 0.103 Mahwah Water Department NJ L 0.098 City of Abilene TX L 0.09781 West Lawrence Water Co-op AL L 0.09 Hampton Bays Water District NY L 0.082 Fort Drum NY L 0.08

118
Water Utility Name State Size PFHxS & PFOS sum City of Lathrop CA L 0.076 Northeast Alabama Water System AL L 0.07 City of Anaheim CA L 0.07 Fair Lawn Water Department NJ L 0.06603 City of Orange CA L 0.0659 Montebello Land & Water Company CA L 0.065 Vienna WV L 0.0641 Chatsworth GA L 0.06303 Bethany OK L 0.063 City of Pico Rivera Water Department CA L 0.062 Camp Pendleton (South) CA L 0.062 Montgomery County Water Services #2 OH L 0.061 Rainbow City Utilities Board AL L 0.06 Florence Water-Wastewater Department AL L 0.06 Plainfield Township MI L 0.06 Pendleton County Water District #1/South KY S 0.05853 City of Miami Beach FL L 0.058 Ridgewood Water NJ L 0.058 Woodbury MN L 0.0577 Montgomery County Water Services #1 OH L 0.0542 CA Water Service - East Los Angeles CA L 0.054 Town of Nashville NC S 0.05312 Metropolitan DWID AZ L 0.053 City of Downey Water Department CA L 0.053 Pierre SD L 0.053 Park Water Company - Bellflower/Norwalk CA L 0.051 Washington Township MUA NJ L 0.0503

119
Water Utility Name State Size PFHxS & PFOS sum Colbert County Rural Water System AL L 0.05 Gadsden Waterworks & Sewer Board AL L 0.05 Southside Waterworks AL L 0.05 City of North Miami FL L 0.05 Kennebunk, Kennebunkport & Wells WD ME L 0.05 Bell Arthur Water Corp. NC S 0.05 City of Garden Grove CA L 0.0496 City of Lauderhill FL L 0.049 FKAA FL L 0.049 Yorba Linda Water District CA L 0.0474 City of Miramar FL L 0.047 Miami International Airport FL L 0.047 City of Corona CA L 0.046 Orchard Dale Water District CA L 0.045 Lima City Water OH L 0.045 Pico Water District CA L 0.044 Golden State Water Co. - Norwalk CA L 0.043 MDWASA - Main System FL L 0.043 Ann Arbor MI L 0.043 City of Fullerton CA L 0.0412 Cliffdale West NC L 0.041 Central ASG AS L 0.04 City of DeFuniak Springs Water System FL L 0.04 Cottage Grove MN L 0.0381 City of Great Bend KS L 0.037 City of Pleasanton CA L 0.036 Sacramento Suburban Water District CA L 0.036

120
Water Utility Name State Size PFHxS & PFOS sum Mashpee Water District MA L 0.033 Belvidere IL L 0.03167
L=large system (serves >10,000); S=small system (serves <10,000) * Tribal nation located in Arizona

121
Table A2. PFAS studies on cancers and other chronic diseases in adults.
Reference Exposure* Outcome RR (SIR, SMR, OR, HR) & 95% CI
Duration/Intensity/cumulative exp.
Alexander 2003 Decatur, AL POSF plant Geometric mean serum level: PFOS=0.9 ppm PFOA=1.13 ppm
POSF/PFOS High exposure job ≥1 yr High exposure job ≥1 yr
Bladder Cancer (and other urinary organs) mortality Urinary Cancers mortality
3 cases SMR=12.77 (2.63, 37.35) SMR=16.12 (3.32, 47.14) SMR=4.02 (0.83, 11.75) (3 cases) SMR=5.11 (1.05, 14.93)
Olsen 2004 Decatur, AL POSF plant
POSF/PFOS Colon Cancer Rectal Cancer Prostate Cancer
RR=5.4 (0.5, >100) 4 exposed RR=1.8 (0.3, 12.4) 4 exposed RR=7.7 (0.9, >100) 5 exposed
Long term: RR=12 (0.8, >100) Long term: RR=11 (0.8, >100) Long term: RR=8.2 (0.8, >100)
Grice 2007 Decatur, AL POSF plant
POSF/PFOS Colon Cancer Prostate Cancer
Odds Ratios: Low/high L/H (>1 yr) High (>1 yr) 1.2 (0.5, 2.9) 1.4 (0.6, 3.3) 1.7 (0.7, 4.2) 1.3 (0.6, 2.9) 1.4 (0.6, 3.0) 1.1 (0.4, 2.7)
Alexander 2007 Decatur, AL POSF plant
POSF/PFOS Ever low Ever low or high Low or high (≥1 yr) Ever high High (≥1 yr)
Bladder Cancer (11 cases)
SIR=2.26 (0.91, 4.67) SIR=1.70 (0.77, 3.22) SIR=1.31 (0.48, 2.85) SIR=1.74 (0.64, 3.79) SIR=1.12 (0.23, 3.27)
Cumulative exposure: Low RR=0.83 (0.15, 4.65) Medium RR=1.92 (0.30, 12.06) High RR=1.52 (0.21, 10.99)
Eriksen 2009 Danish Pop. Median serum level: PFOS=35 ng/ml PFOA=6.9 ng/ml
PFOS PFOA PFOS PFOA
Prostate Cancer (PFOS & PFOA: no association for cancers of bladder or liver) Pancreatic Cancer
Trend: RR=1.05 (0.97, 1.14)/10 ppb Trend: RR=1.03 (0.99, 1.07)/1 ppb (plasma concentration) No association with PFOS Trend: RR=1.03 (0.98, 1.10)/1 ppb
RRs PFOS PFOA Low: 1.35 (0.97, 1.87) 1.09 (0.78, 1.53) Med: 1.31 (0.94, 1.82) 0.94 (0.67, 1.32) High: 1.38 (0.99, 1.93) 1.18 (0.84, 1.65) Low: 0.88 (0.49, 1.57) Med: 1.33 (0.74, 2.38) High: 1.55 (0.85, 2.80)
Hardell 2014 Swedish Pop. Median serum level: (ng/ml) PFOS=9.0 PFOA=2.0 PFHxS=0.91
PFAS (the median level of each PFAS among the controls was used as the cut point for the calculation of the OR.)
Prostate Cancer (case-control)
PFHxS: OR=1.3 (0.8, 1.9) PFOS: OR=1.0 (0.6, 1.5) PFOA: OR=1.1 (0.7, 1.7) PFNA: OR=1.2 (0.8, 1.8) PFDA: OR=1.4 (0.9, 2.1) PFUnDA: OR=1.2 (0.8, 1.9)
ORs: PSA ≥11 Heredity, PFC>median 1.5 (0.9, 2.6) 4.4 (1.7, 12) 0.8 (0.4, 1.3) 2.7 (1.04, 6.8) 1.3 (0.8, 2.1) 2.6 (1.2, 6.0) 1.2 (0.7, 2.1) 2.1 (0.9, 4.8) 1.2 (0.7, 2.0) 2.6 (1.1, 6.1) 1.0 (0.6, 1.6) 2.6 (1.1, 5.9)
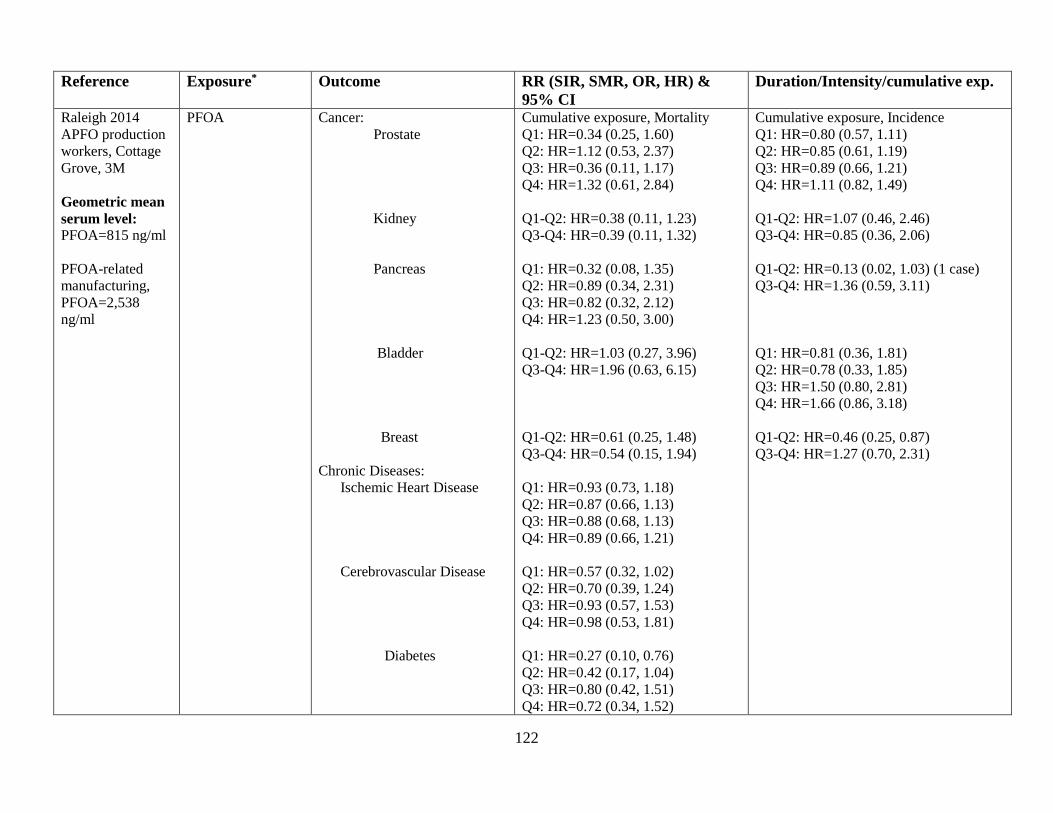
122
Reference Exposure* Outcome RR (SIR, SMR, OR, HR) & 95% CI
Duration/Intensity/cumulative exp.
Raleigh 2014 APFO production workers, Cottage Grove, 3M Geometric mean serum level: PFOA=815 ng/ml PFOA-related manufacturing, PFOA=2,538 ng/ml
PFOA Cancer: Prostate Kidney Pancreas Bladder Breast Chronic Diseases: Ischemic Heart Disease Cerebrovascular Disease Diabetes
Cumulative exposure, Mortality Q1: HR=0.34 (0.25, 1.60) Q2: HR=1.12 (0.53, 2.37) Q3: HR=0.36 (0.11, 1.17) Q4: HR=1.32 (0.61, 2.84) Q1-Q2: HR=0.38 (0.11, 1.23) Q3-Q4: HR=0.39 (0.11, 1.32) Q1: HR=0.32 (0.08, 1.35) Q2: HR=0.89 (0.34, 2.31) Q3: HR=0.82 (0.32, 2.12) Q4: HR=1.23 (0.50, 3.00) Q1-Q2: HR=1.03 (0.27, 3.96) Q3-Q4: HR=1.96 (0.63, 6.15) Q1-Q2: HR=0.61 (0.25, 1.48) Q3-Q4: HR=0.54 (0.15, 1.94) Q1: HR=0.93 (0.73, 1.18) Q2: HR=0.87 (0.66, 1.13) Q3: HR=0.88 (0.68, 1.13) Q4: HR=0.89 (0.66, 1.21) Q1: HR=0.57 (0.32, 1.02) Q2: HR=0.70 (0.39, 1.24) Q3: HR=0.93 (0.57, 1.53) Q4: HR=0.98 (0.53, 1.81) Q1: HR=0.27 (0.10, 0.76) Q2: HR=0.42 (0.17, 1.04) Q3: HR=0.80 (0.42, 1.51) Q4: HR=0.72 (0.34, 1.52)
Cumulative exposure, Incidence Q1: HR=0.80 (0.57, 1.11) Q2: HR=0.85 (0.61, 1.19) Q3: HR=0.89 (0.66, 1.21) Q4: HR=1.11 (0.82, 1.49) Q1-Q2: HR=1.07 (0.46, 2.46) Q3-Q4: HR=0.85 (0.36, 2.06) Q1-Q2: HR=0.13 (0.02, 1.03) (1 case) Q3-Q4: HR=1.36 (0.59, 3.11) Q1: HR=0.81 (0.36, 1.81) Q2: HR=0.78 (0.33, 1.85) Q3: HR=1.50 (0.80, 2.81) Q4: HR=1.66 (0.86, 3.18) Q1-Q2: HR=0.46 (0.25, 0.87) Q3-Q4: HR=1.27 (0.70, 2.31)

123
Reference Exposure* Outcome RR (SMR, HR) & 95% CI Duration/Intensity/cumulative exp. Lundin 2009 APFO production workers, Cottage Grove, 3M€
PFOA Mortality Prostate Cancer Pancreatic Cancer Bladder Cancer Cerebrovascular Disease Diabetes
Job classification Low (ref.) Med HR=3.0 (0.9, 9.7) High HR=6.6 (1.1, 37.7) Low (ref.) Med/hi HR=1.6 (0.5,4.8) Low (ref.) Med/hi HR=0.7 (0.2, 3.4) Low (ref.) Med HR=1.8 (0.9, 3.7) High HR=4.6 (1.3, 17.0) Low (ref.) Med/hi HR=3.4 (1.3, 9.3)
Cumulative Exposure-Years <1 (ref.) ≥1 HR=2.0 (0.7, 5.3) <1 (ref.) ≥1 HR=1.8 (0.6, 5.6) <1 (ref.) ≥1 HR=1.7 (0.4, 7.8) <1 (ref.) 1-4.9 HR=0.6 (0.2, 2.2) ≥5 HR=2.1 (1.0, 4.6) <1 (ref.) ≥1 HR=1.3 (0.6, 3.1)
Steenland and Woskie 2012 Dupont plant, Parkersburg WV (Washington Works Plant) Median serum level: (1979-2004) PFOA=580 ng/ml Nonexposed workers: PFOA=160 ng/ml Directly exposed workers: PFOA=2,880 ng/ml
PFOA Mortality Liver Cancer Pancreatic Cancer Lung Cancer Breast Cancer Prostate Cancer Kidney Cancer Bladder Cancer Mesothelioma NHL Leukemias Diabetes Ischemic Heart Disease Stroke COPD Chronic Liver Disease Chronic Renal Disease
SMR=1.07 (0.51, 1.96) SMR=1.04 (0.62, 1.64) SMR=0.78 (0.62, 1.64) SMR=0.65 (0.13, 1.90) SMR=0.76 (0.47, 1.16) SMR=1.28 (0.66, 2.24) SMR=1.08 (0.52, 1.99) SMR=2.85 (1.05, 6.20) SMR=1.05 (0.57, 1.76) SMR=1.05 (0.57, 1.76) SMR=1.90 (1.35, 2.61) SMR=0.97 (0.86, 1.09) SMR=0.86 (0.64, 1.14) SMR=1.05 (0.75, 1.42) SMR=1.09 (0.54, 1.95) SMR=3.11 (1.66, 5.32)
cumulative exposure-years (SMR¥≠) Q1 Q2 Q3 Q4 2.39 0 2.01 0.32 1.18 1.02 1.09 0.92 0.58 0.63 1.09 0.75 1.49 0 0.87 0 1.07 0.82 0.65 0.57 1.07 1.37 0 2.66 1.24 2.49 0.39 0.36 0 0 1.73 6.27 1.54 0.99 0.85 0.96 0.28 2.34 0.57 1.03 1.85 1.47 2.30 1.90 1.07 1.02 0.87 0.93 0.63 0.78 1.34 0.69 0.93 1.00 1.30 0.93 1.32 2.10 0.37 0.72 0 3.79 1.83 8.60

124
Reference Exposure* Outcome cumulative exposure-years (RR & 95% CI), 10 year exposure lag Q1 (ref.) Q2 Q3 Q4
Steenland 2015 Dupont plant, Parkersburg WV Median serum level: (2005/2006) PFOA=113 ng/ml
PFOA Ulcerative colitis Rheumatoid arthritis Bladder cancer Colorectal cancer Prostate cancer Melanoma Liver disease (non-hepatitis) Thyroid disease (males) Thyroid disease (females) Coronary heart disease Hypertension High cholesterol Osteoarthritis Stroke COPD Asthma Kidney disease Diabetes
3.00 (0.82, 11.0) 3.26 (0.70, 15.1) 6.57 (1.47, 29.4) 1.74 (0.45, 6.77) 2.12 (0.40, 11.1) 2.62 (0.47, 14.7) 0.55 (0.12, 2.61) 0.47 (0.10, 2.21) 0.31 (0.06, 1.54) 0.31 (0.90, 1.11) 0.99 (0.33, 2.94) 1.06 (0.34, 3.31) 1.92 (0.56, 6.58) 1.89 (0.57, 6.34) 2.15 (0.64, 7.26) 0.85 (0.27, 2.71) 1.10 (0.34, 3.58) 0.75 (0.21, 2.67) 1.46 (0.42, 5.04) 2.13 (0.59, 7.71) 2.02 (0.50, 8.10) 1.23 (0.57, 2.66) 1.70 (0.74, 3.91) 1.71 (0.68, 4.25) 0.79 (0.42, 1.50) 0.87 (0.37, 2.02) 0.23 (0.05, 1.01) 1.20 (0.82, 1.75) 1.06 (0.71, 1.58) 0.93 (0.61, 1.41) 0.95 (0.81, 0.98) 0.91 (0.75, 1.16) 0.95 (0.77, 1.16) 0.93 (0.79, 1.10) 1.01 (0.84, 1.22) 0.96 (0.78, 1.18) 0.74 (0.49, 1.10) 0.56 (0.34, 0.93) 0.67 (0.39, 1.14) 1.48 (0.56, 3.69) 1.53 (0.60, 3.89) 1.33 (0.51, 3.43) 0.75 (0.38, 1.48) 1.16 (0.60, 2.26) 0.77 (0.38, 1.57) 0.48 (0.10, 2.29) 0.57 (0.11, 2.93) 0.52 (0.09, 2.83) 1.32 (0.32, 5.43) 0.50 (0.11, 2.34) 0.67 (0.15, 3.05) 1.06 (0.75, 1.49) 1.10 (0.76, 1.61) 1.12 (0.76, 1.66)

125
Reference Exposure Outcome Odds Ratio & 95% CI Odds Ratios & 95% CI Bonefeld-Jorgensen 2011 Greenlandic Inuit Median serum level: PFOS=45.6 ng/ml PFOA=2.5 ng/ml
PFCs PFOS PFOA sumPFSA£ sumPFCA±
Breast Cancer (case-control) (per ng/ml, serum) OR=1.03 (1.00, 1.07) OR=1.20 (0.77, 1.88) OR=1.03 (1.00, 1.05) OR=1.07 (0.96, 1.18)
Bonefeld-Jorgensen 2014 Case-control study, premenopausal mothers nested in the Danish National Birth Cohort Bonefeld-Jorgensen 2014 (cont.) Mean serum level: PFOS=30.6 ng/ml PFOA=5.2 ng/ml PFHxS=1.2 ng/ml PFNA=0.5 ng/ml PFOSA=3.5 ng/ml
PFOS, Q2 Q3 Q4 Q5 PFOA, Q2 Q3 Q4 Q5 PFNA, Q2 Q3 Q4 Q5 PFHxS, Q2 Q3 Q4 Q5 PFOSA, Q2 Q3 Q4 Q5
Breast Cancer Breast Cancer
Quartile 1 (ref.) OR=1.51 (0.81, 2.71) OR=1.51 (0.82, 2.84) OR=1.13 (0.59, 2.04) OR=0.90 (0.47, 1.70) OR=0.97 (0.53, 1.75) OR=1.02 (0.56, 1.89) OR=1.14 (0.62, 2.12) OR=0.94 (0.51, 1.76) Quartile 1 (ref.) OR=1.10 (0.60, 2.02) OR=0.75 (0.41, 1.40) OR=1.08 (0.58, 1.99) OR=0.80 (0.43, 1.47) OR=0.64 (0.34, 1.18) OR=0.70 (0.38, 1.29) OR=0.38 (0.20, 0.70) OR=0.61 (0.33, 1.12) OR=1.38 (0.75, 2.52) OR=0.91 (0.49, 1.66) OR=1.11 (0.60, 2.05) OR=1.89 (1.01, 3.54)
Age, Dx ≤40 Age, Dx > 40 OR=1.2 (0.5, 2.9) OR=2.3 (0.9, 5.6) OR=1.4 (0.6, 3.3) OR=1.9 (0.7, 5.0) OR=0.8 (0.3, 1.9) OR=2.2 (0.9, 5.7) OR=1.0 (0.4, 2.5) OR=0.9 (0.3, 2.4) OR=0.7 (0.3, 1.6) OR=1.8 (0.7, 4.3) OR=1.3 (0.5, 3.2) OR=0.9 (0.4, 2.3) OR=0.8 (0.4, 2.0) OR=1.9 (0.8, 4.8) OR=0.8 (0.3, 1.9) OR=1.2 (0.5, 2.9) Age, Dx ≤40 Age, Dx > 40 OR=1.1 (0.4, 2.5) OR=1.2 (0.5, 3.0) OR=0.5 (0.2, 1.3) OR=1.3 (0.5, 3.3) OR=0.8 (0.4, 1.9) OR=1.9 (0.7, 4.9) OR=0.6 (0.2, 1.4) OR=1.1 (0.5, 2.8) OR=0.4 (0.2, 0.9) OR=1.2 (0.4, 3.4) OR=0.6 (0.2, 1.4) OR=1.0 (0.4, 2.7) OR=0.3 (0.1, 0.7) OR=0.5 (0.2, 1.4) OR=0.4 (0.2, 1.0) OR=1.0 (0.4, 2.5) OR=1.5 (0.7, 3.3) OR=1.3 (0.5, 3.6) OR=1.0 (0.5, 2.4) OR=1.0 (0.4, 2.5) OR=1.1 (0.5, 2.6) OR=1.4 (0.5, 3.6) OR=2.5 (1.0, 6.0) OR=1.6 (0.6, 4.3)

126
Reference Exposure Outcome Hazard Ratio (95% CI) 10 yr. lag Community Occupational Barry et al 2013 C8 Health Project Entire cohort=32,254 Community Cohort = 28,541 Worker Cohort = 3,713 Median serum level: Community, PFOA=24.2 ng/ml Worker, PFOA=112.7 ng/ml
PFOA∆
Bladder Cancer Brain Cancer Breast Cancer Cervical Cancer Colorectal Cancer Esophageal Cancer Leukemia Liver Cancer Lung Cancer Lymphoma Melanoma Oral Cancer Ovarian Cancer Pancreatic Cancer Prostate Cancer Soft Tissue Cancer Stomach Cancer Uterine Cancer Kidney Cancer Q2 Q3 Q4 Testicular Cancer Q2 Q3 Q4 Thyroid Cancer Q2 Q3 Q4
HR=0.98 (0.88, 1.10) HR=1.06 (0.79, 1.41) HR=0.93 (0.88, 0.99) HR=0.98 (0.69, 1.38) HR=0.99 (0.92, 1.07) HR=0.97 (0.72, 1.31) HR=1.02 (0.88, 1.18) HR=0.74 (0.43, 1.26) HR=0.92 (0.81, 1.04) HR=0.98 (0.88, 1.10) HR=1.04 (0.96, 1.13) HR=0.66 (0.43, 1.02) HR=0.90 (0.69, 1.16) HR=0.96 (0.75, 1.22) HR=0.99 (0.94, 1.05) HR=0.72 (0.48, 1.09) HR=0.77, 0.49, 1.22) HR=0.99 (0.86, 1.15) HR=1.09 (0.97, 1.21) HR=0.99 (0.53, 1.85) HR=1.69 (0.93, 3.07) HR=1.43 (0.76, 2.69) HR=1.28 (0.95, 1.73) HR=0.87 (0.15, 4.88) HR=1.08 (0.20, 5.90) HR=2.36 (0.41, 13.7) HR=1.04 (0.89, 1.20) HR=2.06 (0.93, 4.56) HR=2.02 (0.90, 4.52) HR=1.51 (0.67, 3.39)
0.90 (0.75, 1.09) 0.73 (0.55, 0.98) 1.02 (0.68, 1.52) 0.73 (0.32, 1.67) 0.95 (0.89, 1.01) 1.03 (0.59, 1.79) 1.02 (0.72, 1.43) one case 0.98 (0.89, 1.09) 1.08 (0.84, 1.39) 1.01 (0.67, 1.52) 1.17 (0.19, 7.36) 0.92 (0.75, 1.13) 1.30 (0.78, 2.18) 0.53 (0.21, 1.34) one case 0.89 (0.76, 1.05) 1.04 (0.68, 1.58) 1.02 (0.89, 1.17) 1.10 (0.73, 1.65) 1.02 (0.92, 1.14) 0.93 (0.73, 1.18) 0.77 (0.47, 1.27) one case 0.94 (0.73, 1.22) no cases 0.98 (0.72, 1.34) 1.14 (0.33, 3.89) 0.98 (0.90, 1.06) 0.98 (0.83, 1.16) 0.64 (0.36, 1.13) 0.91 (0.25, 3.33) 0.74 (0.41, 1.31) one case 0.99 (0.84, 1.16) 0.96 (0.42, 2.18) 1.11 (0.96, 1.29) 0.99 (0.67, 1.46) 0.94 (0.45, 1.99) 1.22 (0.28, 5.30) 1.08 (0.52, 2.25) 3.27 (0.76, 14.1) 1.50 (0.72, 3.13) 0.99 (0.21, 4.68) 1.53 (1.09, 2.15) 1.61 (0.21, 12.2) 0.98 (0.13, 7.14) two cases total 1.54 (0.19, 12.2) in the cohort 4.66 (0.52, 41.6) 1.00 (0.84 (1.20) 1.12 (0.61, 2.05) 2.09 (0.91, 4.82) 1.65 (0.09, 31.5) 1.92 (0.82, 4.50) 4.52 (0.10, 198) 1.42 (0.60, 3.37) 5.85 (0.13, 257)

127
Reference Exposure Outcome Odds Ratio & 95% CI Odds Ratios & 95% CI Vieira 2013 C8 Health Project Median serum level: PFOA=28.2 ng/ml Estimate PFOA median serum level in 1995 at Little Hocking WD =125 ng/ml
PFOA Cancers©: Breast Cancer Kidney Cancer NHL Ovarian Cancer Prostate Cancer Testicular Cancer
OR for the Little Hocking system OR=1.2 (0.8, 2.0) OR=1.7 (0.9, 3.3) OR=1.6 (0.9, 2.8) OR=1.8 (0.7, 4.4) OR=1.4 (0.9, 2.3) OR=5.1 (1.6, 15.6)
OR for Very High serum level category OR=1.4 (0.9, 2.3) (non-monotonic trend) OR=2.0 (1.0, 3.9) (non-monotonic trend) OR=1.8 (1.0, 3.4) (non-monotonic trend) OR=2.1 (0.8, 5.5) (non-monotonic trend) OR=1.5 (0.9, 2.5) (non-monotonic trend) OR=2.8 (0.8, 9.2) (non-monotonic trend)
Reference Exposure* Outcome SMR & 95% CI Cumulative exposure (SMR) Consonni 2013 TFE synthesis & polymerization workers (including the WV Dupont plant workers and 6 other production sites in NJ and Europe)
APFO (PFOA) APFO (PFOA)
Mortality: Esophageal cancer Liver cancer Pancreatic cancer Lung cancer Kidney/other urinary cancers Leukemias Stomach cancer Colon cancer Rectal cancer Laryngeal cancer Prostate cancer Testicular cancer Bladder cancer Brain cancer NHL Multiple myeloma Diabetes mellitus Circulatory diseases Respiratory diseases Liver cirrhosis Nephritis, nephrosis
1.44 (0.72, 2.57) 1.43 (0.57, 2.94) 1.05 (0.51, 1.94) 0.73 (0.54, 0.97) 1.69 (0.81, 3.11) 1.61 (0.80, 2.88) 0.52 (0.17, 2.21) 0.48 (0.19, 0.99) 1.03 (0.38, 2.25) 0.76 (0.09, 2.75) (2 cases) 0.24 (0.05, 0.70) (3 cases) 1.35 (0.03, 7.49) (1 case) 0.55 (0.11, 1.60) (3 cases) 0.64 (0.17, 1.63) 0.79 (0.26, 1.84) 0.66 (0.08, 2.39) (2 cases) 0.57 (0.23, 1.17) 0.88 (0.77, 1.00) 0.63 (0.42, 0.89) 1.00 (0.60, 1.56) 0.92 (0.25, 2.37)
No Exp. Low Med High 0 1.62 1.54 1.16 0.72 0.70 1.25 2.14 1.66 0 1.30 1.84 0.75 0.91 0.75 0.54 0 1.57 1.50 2.00 0.79 1.64 1.35 1.85 No Exp. Low Med High 1.19 1.49 0.92 0.52 0 0.67 1.49 0.67

128
* Exposures are occupational unless otherwise noted. € The cohort evaluated in the Lundin 2009 study is the same cohort included in the Raleigh 2014 study. The Lundin 2009 study is included in the table because it provides additional information that can be used to interpret the more recent Raleigh 2014 study. ¥ Reference rates are from other Dupont workers. ≠ Exposure was not lagged. £ sumPFSA: sum of PFOS, PFHxS and PFOSA ± sumPFCA: sum of PFHpA, PFOA, PFNA, PFDA, PFUnA, PFDoA and PFTrA ∆ The hazard ratio is per unit of log estimated cumulative PFOA serum concentration (ng/ml). For cancers of the kidney, testes and thyroid, hazard ratios are also provided for quartiles of cumulative PFOA serum concentration with the first quartile as referent. © Except for kidney cancer, these are cancers with ORs at Little Hocking ≥ the ORs for the other water systems and also with elevated ORs in the very high PFOA serum exposure category. For kidney cancer, the OR for the Tuppers Plains system was 2.0 compared to the OR for Little Hocking of 1.7. Other cancers not listed were not elevated in the Little Hocking system and/or were not elevated in the very high serum category. Mortality: Alexander 2003, Grice 2007, Alexander 2007, Lundin 2009, Steenland & Woskie 2012, Consonni 2013, Raleigh 2014 Incidence: Grice 2007, Alexander 2007, Eriksen 2009, Barry 2013, Vieira 2013, Hardell 2014, Raleigh 2014, Steenland 2015
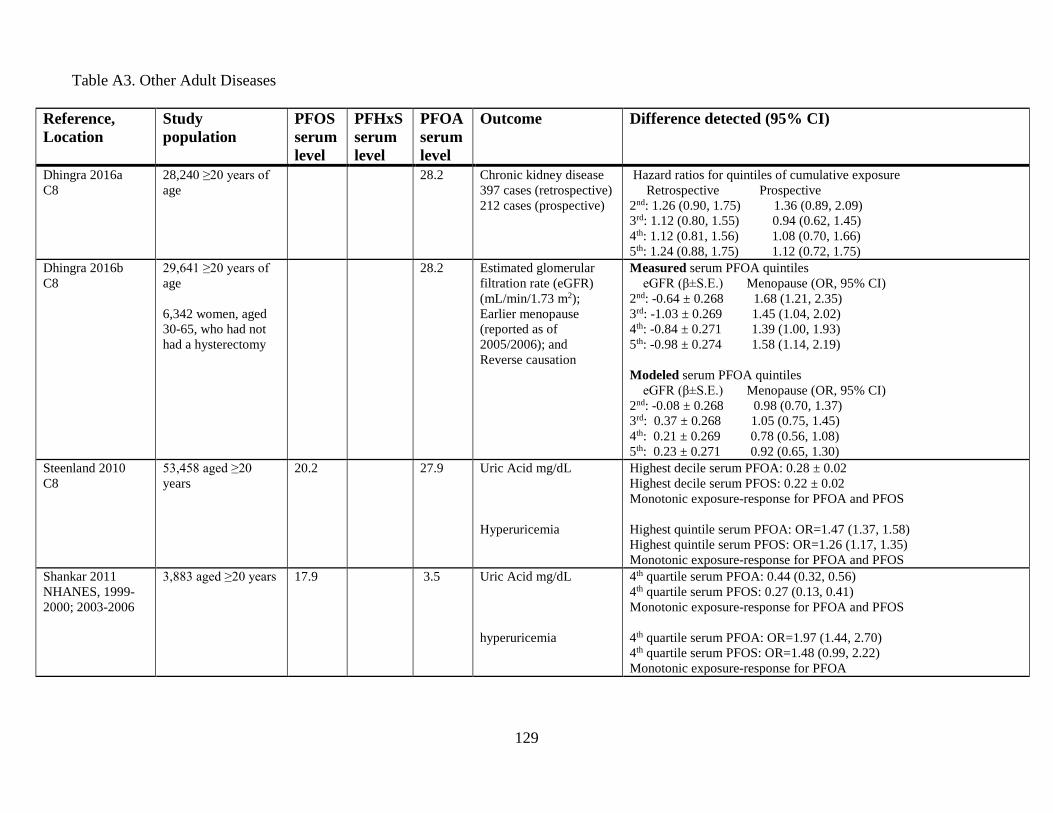
129
Table A3. Other Adult Diseases
Reference, Location
Study population
PFOS serum level
PFHxS serum level
PFOA serum level
Outcome Difference detected (95% CI)
Dhingra 2016a C8
28,240 ≥20 years of age
28.2 Chronic kidney disease 397 cases (retrospective) 212 cases (prospective)
Hazard ratios for quintiles of cumulative exposure Retrospective Prospective 2nd: 1.26 (0.90, 1.75) 1.36 (0.89, 2.09) 3rd: 1.12 (0.80, 1.55) 0.94 (0.62, 1.45) 4th: 1.12 (0.81, 1.56) 1.08 (0.70, 1.66) 5th: 1.24 (0.88, 1.75) 1.12 (0.72, 1.75)
Dhingra 2016b C8
29,641 ≥20 years of age 6,342 women, aged 30-65, who had not had a hysterectomy
28.2 Estimated glomerular filtration rate (eGFR) (mL/min/1.73 m2); Earlier menopause (reported as of 2005/2006); and Reverse causation
Measured serum PFOA quintiles eGFR (β±S.E.) Menopause (OR, 95% CI) 2nd: -0.64 ± 0.268 1.68 (1.21, 2.35) 3rd: -1.03 ± 0.269 1.45 (1.04, 2.02) 4th: -0.84 ± 0.271 1.39 (1.00, 1.93) 5th: -0.98 ± 0.274 1.58 (1.14, 2.19) Modeled serum PFOA quintiles eGFR (β±S.E.) Menopause (OR, 95% CI) 2nd: -0.08 ± 0.268 0.98 (0.70, 1.37) 3rd: 0.37 ± 0.268 1.05 (0.75, 1.45) 4th: 0.21 ± 0.269 0.78 (0.56, 1.08) 5th: 0.23 ± 0.271 0.92 (0.65, 1.30)
Steenland 2010 C8
53,458 aged ≥20 years
20.2 27.9 Uric Acid mg/dL Hyperuricemia
Highest decile serum PFOA: 0.28 ± 0.02 Highest decile serum PFOS: 0.22 ± 0.02 Monotonic exposure-response for PFOA and PFOS Highest quintile serum PFOA: OR=1.47 (1.37, 1.58) Highest quintile serum PFOS: OR=1.26 (1.17, 1.35) Monotonic exposure-response for PFOA and PFOS
Shankar 2011 NHANES, 1999-2000; 2003-2006
3,883 aged ≥20 years 17.9 3.5 Uric Acid mg/dL hyperuricemia
4th quartile serum PFOA: 0.44 (0.32, 0.56) 4th quartile serum PFOS: 0.27 (0.13, 0.41) Monotonic exposure-response for PFOA and PFOS 4th quartile serum PFOA: OR=1.97 (1.44, 2.70) 4th quartile serum PFOS: OR=1.48 (0.99, 2.22) Monotonic exposure-response for PFOA

130
Reference, Location
Study population
PFOS serum level
PFHxS serum level
PFOA serum level
Outcome Difference detected (95% CI)
Gleason 2015 NHANES, 2007-2010
4,333 aged ≥12 years 11.3 1.8 3.7 Hyperuricemia Elevated ALT Elevated GGT Elevated AST Total Bilirubin
Serum PFAS quartiles, odds ratios PFOA PFOS PFHxS 2nd 1.46 (1.16, 1.85) 1.18 (0.88, 1.56) 0.83 (0.64, 1.09) 3rd 1.74 (1.35, 2.25) 1.09 (0.81, 1.47 1.14 (0.88, 1.48) 4th 1.88 (1.37, 2.58) 1.20 (0.88, 1.63) 1.13 (0.89, 1.43) 2nd 1.42 (1.11, 1.83) 1.29 (0.93, 1.78) 1.35 (1.01, 1.80) 3rd 1.55 (1.14, 2.10) 1.26 (0.88, 1.81) 1.37 (1.06, 1.77) 4th 1.51 (1.18, 1.94) 1.23 (0.87, 1.74) 1.18 (0.94, 1.49) 2nd 1.09 (0.79, 1.52) 1.16 (0.87, 1.55) 0.97 (0.80, 1.81) 3rd 1.11 (0.80, 1.52) 1.14 (0.87, 1.51) 1.02 (0.81, 1.30) 4th 1.34 (1.00, 1.80) 1.10 (0.82, 1.47) 0.91 (0.75, 1.11) 2nd 1.31 (1.03, 1.65) 1.03 (0.78, 1.36) 1.29 (0.97, 1.71) 3rd 1.26 (0.97, 1.64) 1.14 (0.87, 1.50) 1.29 (0.96, 1.73) 4th 1.39 (1.06, 1.80) 0.91 (0.69, 1.21) 1.30 (0.94, 1.78) 2nd 1.31 (0.98, 1.75) 1.44 (1.12, 1.84) 1.10 (0.86, 1.40) 3rd 1.66 (1.19, 2.32) 1.65 (1.25, 2.18) 1.40 (1.04, 1.88) 4th 1.68 (1.31, 2.14) 1.51 (1.06, 2.15) 1.32 (0.97, 1.81)
Gallo 2012 C8
46,452 ≥18 years 20.3 28.0 Ln-ALT (IU/L) Ln-GGT (IU/L) Ln-Direct bilirubin (mg/dL) Elevated ALT Elevated GGT Elevated Direct bilirubin
Ln-PFOA Ln-PFOS β = 0.022 (0.018, 0.025) β = 0.020 (0.014, 0.026) β = 0.015 (0.010, 0.019) β = 0.008 (-0.000, 0.016) β = 0.001 (-0.002, 0.004) β = 0.029 (0.024, 0.034) tenth decile odds ratios; 1.54 ( 1.33, 1.78) 1.25 (1.08, 1.44) 1.06 (0.92, 1.20) 0.94 (0.83, 1.07) 1.01 (0.66, 1.53) 1.23 (0.82, 1.83) No monotonic exposure-response relationships

131
Reference, Location
Study population
PFOS serum level
PFHxS serum level
PFOA serum level
Outcome Difference detected (95% CI)
Darrow 2016 C8
30,723 aged ≥20 years
28.2 Ln-ALT (IU/L) Ln-GGT (IU/L) Ln-Direct bilirubin (mg/dL) Elevated ALT Elevated GGT Elevated Direct bilirubin Any liver disease
Fifth quintile, estimated cumulative serum PFOA β = 0.058 (0.040, 0.076) β = 0.020 (-0.004, 0.044) β = -0.017 (-0.032, -0.001) monotonic exposure-response for ALT Fifth quintile, estimated cumulative serum PFOA OR=1.16 (1.02, 1.33) OR=0.96 (0.85, 1.09) OR=0.95 (0.66, 1.37) No monotonic exposure-response relationships 5th quintile cumulative exposure: OR=0.95 (0.70, 1.27)
Melzer 2010 NHANES, 1999-2000, 2003-2006
3,974 aged ≥20 years 17.9 3.5 Ever reported: Arthritis Asthma COPD Diabetes Heart Disease Liver disease (current) Women: Thyroid disease ever Thyroid disease with current medication Men: Thyroid disease ever Thyroid disease with current medication
4th quartile serum concentrations, ORs: PFOA PFOS 1.28 (0.97, 1.68) 0.74 (0.53, 1.04) 0.93 (0.64, 1.36) 0.79 (0.50, 1.26) 0.85 (0.54, 1.34) 0.58 (0.43, 0.76) 0.69 (0.41, 1.16) 0.87 (0.57, 1.31) 1.08 (0.70, 1.69) 0.91 (0.50, 1.64) 0.61 (0.21, 1.78) 0.95 (0.39, 2.29) 1.64 (1.09, 2.46) 1.15 (0.70, 1.91) 1.86 (1.12, 3.09) 1.31 (0.72, 2.36) Exposure-response trends were non-monotonic 1.58 (0.74, 3.39) 1.58 (0.72, 3.47) 1.89 (0.60, 5.90) 1.89 (0.72, 4.93) Exposure-response trends were non-monotonic
Lin 2010 NHANES, 1999-2000, 2003-2004
2,216 aged ≥18 years ALT (IU/L) Ln-GGT (IU/L) Total bilirubin (µM)
Regression coefficient (s.e.) per unit increase in log serum PFAS PFOA PFOS PFHxS 1.86 (0.62) 1.01 (0.53) 0.19 (0.48) 0.08 (0.03) 0.01 (0.03) -0.00 (0.02) -0.09 (0.20) -0.30 (0.24) 0.38 (0.20)

132
Reference, Location
Study population
PFOS serum level
PFHxS serum level
PFOA serum level
Outcome Difference detected (95% CI)
Winquist 2014b C8
32,254 aged ≥20 years
26.1 Hypertension Hypercholesterolemia Men 40-59 Coronary artery disease
Fifth quintile, cumulative serum PFOA, HR=0.98 (0.91, 1.06) Fifth quintile, cumulative serum PFOA, HR=1.19 (1.11, 1.28) Fifth quintile, cumulative serum PFOA, HR=1.44 (1.28, 1.62) Fifth quintile, cumulative serum PFOA, HR=1.07 (0.93, 1.23) None of the analyses had a monotonic trend.
Mattsson 2015 Sweden: male cohort of farmers and rural residents
231 cases of coronary heart disease and 231 controls
22.4 1.6 4.1 Coronary heart disease Quartile of serum PFAS, Odds ratios (95% CI): PFOS PFOA PFHxS 2nd 0.82 (0.46, 1.45) 0.79 (0.44, 1.43) 0.91 (0.51, 1.63) 3rd 1.30 (0.74, 2.26) 1.18 (0.67, 2.06) 1.00 (0.56, 1.77) 4th 1.07 (0.60, 1.92) 0.88 (0.50, 1.55) 0.95 (0.54, 1.67)
Shankar 2012 NHANES, 1999-2000, 2003-2004
1,216 aged ≥40 years 4.2 Cardiovascular disease Peripheral arterial disease Either CVD or PAD Coronary heart disease Stroke
Serum PFOA level, Odds ratios (95% CI) CVD PAD Either CVD or PAD 2nd 1.58 (0.80, 3.12) 0.75 (0.37, 1.52) 1.41 (0.81, 2.45) 3rd 1.77 (1.04, 3.02) 1.18 (0.47, 2.96) 1.72 (1.13, 2.64) 4th 2.01 (1.12, 3.60) 1.78 (1.03, 3.08) 2.28 ( 1.40, 3.71) Coronary heart disease Stroke 2nd 0.90 (0.37, 2.23) 4.39 (1.44, 13.4) 3rd 1.90 (0.89, 4.08) 3.94 (1.48, 10.5) 4th 2.24 (1.02, 4.94) 4.26 (1.84, 9.89)
Steenland 2009 C8
46,294 aged ≥18 years
19.6 26.6 Log total cholesterol Log total cholesterol Log HDL Log LDL Log triglycerides Log total cholesterol/HDL High total cholesterol (≥240 mg/dL)
10th decile, serum PFAS: change in the log total cholesterol, (SE) PFOA: 0.05 (0.004) PFOS: 0.06 (0.004) (equivalent to an increase of 11-12 mg/dL in total cholesterol) Linear regression coefficient (SD) Log serum PFOA Log serum PFOS 0.01112 (0.00076) 0.02660 (0.00140) 0.00276 (0.00094) 0.00355 (0.00173) 0.01499 (0.00121) 0.04176 (0.00221) 0.00169 (0.00219) 0.01998 (0.00402) 0.00831 (0.00110) 0.02290 (0.00202) PFOA (OR, 95% CI) PFOS 2nd 1.21 (1.12, 1.31) 1.14 (1.05, 1.23) 3rd 1.33 (1.23, 1.43) 1.28 (1.19, 1.39) 4th 1.38 (1.28, 1.50) 1.51 (1.40, 1.64)

133
Reference, Location
Study population
PFOS serum level
PFHxS serum level
PFOA serum level
Outcome Difference detected (95% CI)
Fitz-Simon 2013 C8 (longitudinal study)
560 aged >20 years 8.2 30.8 Total cholesterol LDL HDL Triglycerides
Percentage decrease in lipid per halving of serum PFAS PFOA: 1.65 (0.32, 2.97) PFOS: 3.20 (1.63, 4.76) PFOA: 3.58 (1.47, 5.66) PFOS: 4.99 (2.46, 7.44) PFOA: 1.33 (-0.21, 2.85) PFOS: 1.28 (-0.59, 3.12) PFOA: -0.78 (-5.34, 3.58) PFOS: 2.49 (-2.88, 7.57)
Nelson 2010 NHANES, 2003-2004
860 aged ≥20 years
21.0 1.8 3.9 Total Cholesterol LDL cholesterol Non-HDL cholesterol
Mean difference in lipid PFOS PFOA PFHxS 2nd 6.12 (-4.45, 16.7) 5.40 (-2.11, 12.9) -3.22 (-11.8, 5.30) 3rd 5.07 (-4.24, 14.4) 7.50 (-3.71, 18.7) -2.27 (-8.95, 4.41) 4th 13.42 (3.83, 23.0) 9.76 (-0.23, 19.7) -7.01 (-13.2, -0.79) 2nd 2.78 (-12.7, 18.3) 6.07 (-8.65, 20.8) -4.49 (-12.4, 3.40) 3rd 0.38 (-9.64, 10.4) 0.71 (-12.6, 14.0) -4.07 (-13.4, 5.28) 4th 8.50 (-7.10, 24.1) 2.94 (-10.8, 16.7) -9.67 (-20.1, 0.71) 2nd 4.64 (-6.87, 16.2) 7.41 (-0.97, 15.8) -3.94 (-12.2, 4.37) 3rd 4.97 (-5.30, 15.2) 9.11 (-2.44, 20.7) -2.02 (-9.32, 5.28) 4th 12.55 (1.62, 23.5) 11.03 (1.20, 20.9) -9.32 (-15.9, -2.77)
Fisher 2013 Canadian Health Measures Survey
2,700 aged ≥18 years 2,345
8.4 2.18 2.46 High cholesterol
Odds ratios (95% CI) PFOA PFOS PFHxS 2nd 1.61 (1.02, 2.53) 0.97 (0.58, 1.62) 1.05 (0.69, 1.61) 3rd 1.26 (0.76, 2.07) 0.94 (0.58, 1.54) 1.43 (0.85, 1.40) 4th 1.50 (0.86, 2.62) 1.36 (0.87, 2.12) 1.57 (0.93, 2.64)
Fu 2014 China
133 aged 0 to 88 years
1.47 1.43 High total cholesterol High LDL cholesterol High Triglycerides
Odds ratios PFOA PFOS 2nd 0.82 (0.14, 4.81) 0.57 (0.12, 2.81) 3rd 2.60 (0.56, 12.1) 0.82 (0.17, 3.91) 4th 0.55 (0.09, 3.31) 2.27 (0.47, 10.9) 2nd 0.55 (0.11, 2.82) 1.06 (0.25, 4.53) 3rd 1.70 (0.40, 3.49) 1.11 (0.25, 4.82) 4th 0.71 (0.14, 3.49) 2.27 (0.50, 10.4) 2nd 1.73 (0.57, 5.21) 0.52 (0.17, 1.56) 3rd 1.03 (0.33, 3.20) 0.93 (0.31, 2.80) 4th 1.97 (0.59, 6.55) 1.26 (0.41, 3.90)

134
Reference, Location
Study population
PFOS serum level
PFHxS serum level
PFOA serum level
Outcome Difference detected (95% CI)
Winquist 2014a C8
32,254 aged ≥20 years (community & worker cohort) 28,541 (community cohort only)
26.1 24.2
Functional thyroid disease Hyperthyroidism Hypothyroidism Functional thyroid disease Hyperthyroidism Hypothyroidism community cohort only: Functional thyroid disease Hyperthyroidism Hypothyroidism
Quintiles of serum PFOA, cumulative exposure, hazard ratios All Females Males 2nd 1.21 (1.01, 1.45) 1.24 (1.02, 1.51) 1.12 (0.69, 1.79) 3rd 1.17 (0.97, 1.41) 1.27 (1.04, 1.55) 0.83 (0.51, 1.37) 4th 1.27 (1.06, 1.52) 1.36 (1.12, 1.66) 1.01 (0.63, 1.62) 5th 1.28 (1.06, 1.53) 1.37 (1.11, 1.68) 1.05 (0.66, 1.66) 2nd 0.94 (0.62, 1.42) 1.04 (0.65, 1.67) 0.71 (0.29, 1.74) 3rd 1.12 (0.75, 1.68) 1.33 (0.84, 2.11) 0.57 (0.23, 1.43) 4th 1.22 (0.82, 1.82) 1.45 (0.92, 2.28) 0.70 (0.30, 1.66) 5th 1.20 (0.80, 1.81) 1.39 (0.86, 2.26) 0.74 (0.33, 1.65) 2nd 1.31 (1.06, 1.63) 1.32 (1.04, 1.67) 1.43 (0.77, 2.66) 3rd 1.27 (1.01, 1.58) 1.33 (1.05, 1.69) 1.12 (0.59, 2.14) 4th 1.30 (1.04, 1.62) 1.34 (1.06, 1.70) 1.32 (0.71, 2.45) 5th 1.40 (1.12, 1.75) 1.47 (1.15, 1.88) 1.36 (0.74, 2.48) 2nd 1.24 (1.03, 1.49) 1.24 (1.02, 1.52) 1.06 (0.62, 1.80) 3rd 1.21 (1.00, 1.46) 1.27 (1.04, 1.56) 0.80 (0.46, 1.40) 4th 1.32 (1.09, 1.59) 1.36 (1.11, 1.66) 1.02 (0.59, 1.75) 5th 1.36 (1.11, 1.66) 1.36 (1.10, 1.69) 1.21 (0.69, 2.12) 2nd 0.96 (0.62, 1.47) 1.07 (0.66, 1.73) 0.60 (0.22, 1.64) 3rd 1.13 (0.74, 1.73) 1.36 (0.85, 2.18) 0.47 (0.17, 1.32) 4th 1.23 (0.81, 1.88) 1.45 (0.91, 2.33) 0.57 (0.21, 1.58) 5th 1.28 (0.81, 2.01) 1.45 (0.88, 2.40) 0.70 (0.24, 2.06) 2nd 1.34 (1.07, 1.68) 1.31 (1.03, 1.66) 1.53 (0.76, 3.11) 3rd 1.31 (1.04, 1.64) 1.32 (1.04, 1.68) 1.26 (0.60, 2.61) 4th 1.35 (1.07, 1.70) 1.33 (1.04, 1.69) 1.55 (0.75, 3.18) 5th 1.49 (1.17, 1.89) 1.43 (1.10, 1.84) 1.89 (0.90, 3.97) Prospective Analyses: cumulative exposure, quintile 5 results: 1.13 (0.83, 1.54) 0.97 (0.68, 1.37) 1.88 (0.95, 3.75) 1.81 (0.77, 4.25) 1.71 (0.68, 4.30) 2.26 (0.23, 22.1) 1.09 (0.75, 1.59) 0.90 (0.59, 1.39) 2.08 (0.90, 4.80) Non-monotonic trends in the prospective analyses.

135
Reference, Location
Study population
PFOS serum level
PFHxS serum level
PFOA serum level
Outcome Difference detected (95% CI)
Starling 2014 Norway
891 pregnant women, aged 19-44
13.03 0.60 2.25 Total cholesterol per ln-ng/ml PFAS LDL cholesterol per ln-ng/ml PFAS Ln-triglycerides per ln-ng/ml PFAS
Linear regression coefficients for lipids (mg/dL) PFOA PFOS PFHxS 2nd 1.49 (-6.49, 9.48) -3.35 (-10.3, 3.64) 0.65 (-6.87, 8.17) 3rd 3.54 (-4.51, 11.6) 3.06 (-4.93, 11.1) 1.62 (-6.08, 9.32) 4th 3.90 (-5.00, 12.8) 7.59 (-0.42, 15.6) 4.25 (-3.88, 12.4) 2.58 (-4.32, 9.47) 8.96 (1.70, 16.2) 3.00 (-1.75, 7.76) 2nd 0.94 (-6.08, 7.96) -3.23 (-9.28, 2.83) 0.44 (-6.19, 7.08) 3rd 4.16 (-3.19, 11.5) 2.60 (-4.49, 9.70) 0.50 (-6.15, 7.16) 4th 3.35 (-4.35, 11.1) 5.51 (-1.62, 12.6) 1.48 (-5.89, 8.85) 2.25 (-3.97, 8.48) 6.48 (-0.07, 13.0) 1.92 (-2.50, 6.33) 2nd 0.03 (-0.04, 0.11) 0.00 (-0.06, 0.07) -0.04 (-0.11, 0.02) 3rd 0.01 (-0.08, 0.09) -0.03 (-0.10, 0.05) -0.02 (-0.10, 0.05) 4th -0.04 (-0.12, 0.04) 0.00 (-0.07, 0.07) -0.02 (-0.09, 0.05) 0.00 (-0.07, 0.06) -0.02 (-0.09, 0.04) -0.01 (-0.05, 0.03)
Knox 2011 C8
50,113 aged ≥20 years
Median or geometric mean values for PFOA and PFOS were not provided
Thyroxine (total T4) T3 uptake Thyroid stimulating hormone (TSH) Serum albumin
No confidence intervals were provided. (Many p-values were presented as less than a value, so CIs could not be estimated.) PFOA results: PFOA was associated with increased thyroxine and decreased T3 uptake in women of all ages and in men who were >50 years of age. PFOA was associated with a slight increase in albumin among all participants. T3 uptake was lower in women than in men; TSH was lower in men than in women; T4 was higher in women than in men; and albumin was higher in men. PFOS results: PFOS was associated with increased thyroxine, decreased T3 uptake, and increased albumin in all participants. Thyroxine was higher in women than in men; T3 update was lower in women than in men; and albumin was lower in women than in men.

136
Reference, Location
Study population
PFOS serum level
PFHxS serum level
PFOA serum level
Outcome Difference detected (95% CI)
Wen 2013 NHANES, 2007-2010
1,181 aged ≥20 years 672 males 509 females
17.14 11.09
2.60 1.41
4.70 3.53
Total T4 (µg/mL) Ln-free T4 (ng/dL) Total T3 (ng/dL) Ln-free T3 (pg/mL) Ln TSH (mIU/L)Ln Thyroglobulin (ng/mL) Total T4 (µg/mL) Ln-free T4 (ng/dL) Total T3 (ng/dL) Ln-free T3 (pg/mL) Ln TSH (mIU/L) Ln Thyroglobulin (ng/mL) Subclinical hypothyroidism: Men: Women: Subclinical hyperthyroidism: Men: Women:
Regression coefficient per unit increase in log PFAS, Men: PFOA PFOS PFHxS 0.000 (-0.280, 0.280) -0.020 (-0.223, 0.183) -0.032 (-0.175, 0.111) -0.010 (-0.041, 0.022) -0.009 (-0.034, 0.017) -0.016 (-0.029, -0.003) 0.775 (-3.048, 4.598) -1.111 (-3.856, 1.634) -0.081 (-1.698, 1.536) 0.013 (-0.004, 0.031) 0.002 (-0.008, 0.012) 0.005 (-0.003, 0.012) 0.004 (-0.081, 0.090) 0.003 (-0.070, 0.076) 0.019 (-0.057, 0.524) -0.096 (-0.258, 0.066) -0.047 (-0.149, 0.055) -0.049 (-0.185, 0.087) Women: 0.082 (-0.369, 0.532) 0.087 (-0.143, 0.318) 0.260 ( 0.108, 0.413) -0.004 (-0.047, 0.039) 0.009 (-0.019, 0.036) 0.003 (-0.024, 0.030) 6.628 (0.545, 12.712) 1.453 (-1.987, 4.891) 4.074 ( 2.232, 5.916) 0.016 (-0.018, 0.051) -0.007 (-0.024, 0.010) 0.003 (-0.021, 0.026) -0.030 (-0.215, 0.154) -0.048 (-0.156, 0.060) -0.019 (-0.128, 0.090) 0.095 (-0.111, 0.302) 0.135 (-0.007, 0.277) -0.018 (-0.122, 0.087) Odds ratio 1.29 (0.40, 4.10) 1.98 (1.19, 3.28) 1.57 (0.76, 3.25) 7.42 (1.14, 48.1) 3.03 (1.14, 8.07) 3.10 (1.22, 7.86) 0.38 (0.16, 0.95) 0.92 (0.19, 4.46) 0.56 (0.24, 1.20) 0.99 (0.13, 7.59) 1.90 (0.53, 6.80) 2.27 (1.07, 4.80)
Webster 2016 NHANES, 2007-2008
1,525 aged ≥18 years 14.2 2.0 4.2 Free T3 Free T4 Free T3/Free T4 Thyroid stimulating hormone (TSH) Total T3 Total T4
Low iodine & high thyroid peroxidase antibody (TPOAb): percent difference per interquartile ratio increase in log serum PFAS PFOS PFOA PFHxS 4.7 (3.9, 5.5) 4.8 (3.7, 5.8) 3.9 (2.3, 5.5) -4.4 (-7.6, -1.1) -2.7 (-6.1, 0.8) -8.3 (-15.8, -0.2) 9.5 (5.8, 13.2) 7.7 (3.6, 12.0) 13.3 (4.4, 22.9) 17.1 (6.6, 17.7) 16.2 (5.1, 28.5) 27.3 (0.7, 60.9) 12.0 (6.7, 17.7) 12.4 (7.0, 18.1) 13.8 (6.0, 22.1) 2.5 (-1.3, 6.5) 3.9 (-0.3, 8.3) 1.8 (-3.9, 7.8)
Shrestha 2015 Hudson River area, NY
87 aged 55-74 29.8 9.3 Thyroid stimulating hormone (TSH) Free T4 Total T4 Total T3
Regression coefficient, log serum PFAS PFOS PFOA 0.129 (-0.023, 0.281) 0.102 (-0.047, 0.250) 0.054 (0.002, 0.106) 0.016 (-0.036, 0.069) 0.766 (0.327, 1.205) 0.380 (-0.070, 0.830) 2.631 (-2.248, 7.510) 3.032 (-1.725, 7.789)

137
Reference, Location
Study population
PFOS serum level
PFHxS serum level
PFOA serum level
Outcome Difference detected (95% CI)
Ji 2012 Korea
633 aged >12 years 7.96 1.51 2.74 Thyroid stimulating hormone (TSH) Total T4
Regression coefficients, serum PFAS PFOS PFOA PFHxS 0.062 (-0.069, 0.192) -0.066 (-0.220, 0.089) 0.013 (-0.094, 0.120) -0.021 (-0.048, 0.005) -0.020 (-0.051, 0.012) -0.007 (-0.029, 0.015)
Wang 2014 Taiwan
285 pregnant women (average age=29)
12.73 0.81 2.39 Thyroid stimulating hormone (TSH) Free T4 Total T4 Total T3
Regression coefficients, serum PFAS PFOS PFOA PFHxS -0.005 (-0.024, 0.013) 0.011 (-0.057, 0.078) 0.105 (0.002, 0.207) 0.001 (-0.002, 0.003) -0.003 (-0.012, 0.005) -0.010 (-0.023, 0.003) 0.019 (-0.016, 0.053) 0.011 (-0.108, 0.130) -0.130 (-0.316, 0.057) 0.000 (-0.002, 0.001) -0.000 (-0.002, 0.009) -0.002 (-0.005, 0.001)
Webster 2014 Canada
152 pregnant women without thyroid disease, aged ≥25 years
4.8 1.0 1.7 Thyroid stimulating hormone (TSH) Free thyroxine (fT4)
Percent change (compared to the median thyroid function in the study population) per interquartile increase in PFAS among those with high TPOAb: PFOS PFOA PFHxS 69% (15%, 123%) 54% (8%, 100&) 2% (-45%, 48%) -7% (-18%, 3%) -4% (-14%, 5%) -5% (-15%, 4%)
Berg 2015 Norway
375 pregnant women aged 18-43
8.03 0.44 1.53 Thyroid stimulating hormone (TSH) mIU/L Subclinical hypothyroidism (%)
Mean difference in TSH, and proportion with subclinical hypothyroidism per quartile of PFOS 1st 12.8% (n=12) 2nd 0.18 (0.06, 0.31) 17.8% (n=16) 3rd 0.26 (0.13, 0.40) 25.3% (n=24) 4th 0.35 (0.21, 0.50) 31.3% (n=30)
Berg 2016 Norway
370 pregnant women aged 18-43
8.03 0.44 1.53 Thyroid stimulating hormone (TSH) mIU/L
Percent change in TSH per quartile of PFOS 2nd 4 (-3.1, 11.4) 3rd 8 (0.6, 15.4) 4th 10 (1.6, 16.9)
Kato 2016 Japan
392 pregnant women 5.2 1.2 Ln-Thyroid stimulating hormone (TSH) Ln-Free Thyroxine (T4)
Regression coefficient per Ln-PFAS (confidence intervals are estimated) PFOS PFOA -0.214 (p-value presented as <0.001) 0.039 (-0.067, 0.144) 0.061 (-0.039, 0.161) 0.004 (-0.102, 0.110)

138
Reference, Location
Study population
PFOS serum level
PFHxS serum level
PFOA serum level
Outcome Difference detected (95% CI)
Steenland 2013 C8
28,541 community cohort 3,713 worker cohort Total=32, 254 aged ≥20 years
24 113 26
Ulcerative colitis Rheumatoid arthritis Crohn’s disease Type 1 diabetes Lupus Multiple sclerosis
10 year lagged cumulative PFOA quartiles, RR: Retrospective: Prospective: 2nd 1.71 (0.89, 3.27) 1.21 (0.43, 3.34) 3rd 2.05 (1.07, 3.91) 2.16 (0.80, 5.81) 4th 3.05 (1.56, 5.96) 1.51 (0.43, 4.30) 2nd 1.53 (0.61, 2.58) 0.31 (0.14, 0.71) 3rd 1.73 (1.10, 2.71) 0.90 (0.41, 0.72) 4th 1.35 (0.87, 2.11) 0.32 (0.14, 0.72) 10 year lagged cumulative PFOA quartiles, retrospective analyses, RR: 2nd Q 3rd Q 4th Q 0.80 (0.32, 1.99) 0.97 (0.36, 2.60) 0.69 (0.26, 1.82) 0.50 (0.05, 4.90) 1.32 (0.14, 12.4) 0.71 (0.07, 7.14) 0.79 (0.27, 2.34) 1.26 (0.40, 4.03) 0.61 (0.19, 1.91) 1.16 (0.54, 2.47) 1.62 (0.75, 3.52) 1.32 (0.61, 2.84)
Innes 2011 C8
49,432 aged ≥21 years
20.3 28.2 Osteoarthritis PFOA odds ratio PFOS 2nd 1.16 (1.03, 1.31) 0.91 (0.81, 1.01) 3rd 1.21 (1.07, 1.36) 0.94 (0.84, 1.06) 4th 1.42 (1.26, 1.59) 0.76 (0.68, 0.85) 1.07 (1.04, 1.1) per 1-unit increment in ln-PFOA
Uhl 2013 NHANES, 2003-2008
4,102 aged 20-84 24.6 (mean)
5.4 (mean)
Osteoarthritis PFOA All Female Male 2nd 1.32 (0,78, 2.23) 1.44 (0.80, 2.62) 0.97 (0.42, 2.27) 3rd 1.20 (0.72, 2.00) 1.18 (0.67, 2.08) 0.98 (0.46, 2.08) 4th 1.55 (0.99, 2.43) 1.98 (1.24, 3.19) 0.82 (0.40, 1.70) Per ln-PFOA: 1.20 (0.96, 1.49) 1.35 (1.02, 1.79) 0.89 (0.67, 1.19) PFOS 2nd 1.04 (0.58, 1.85) 0.88 (0.46, 1.70) 1.32 (0.41, 4.25) 3rd 1.99 (1.14, 3.49) 1.92 (0.98, 3.75) 1.86 (0.55, 6.25) 4th 1.77 (1.05, 2.96) 1.73 (0.97, 3.10) 1.56 (0.54, 4.53) Per ln-PFOS: 1.15 (0.94, 1.40) 1.22 (0.94, 1.58) 0.95 (0.73, 1.23)

139
Reference, Location
Study population
PFOS serum level
PFHxS serum level
PFOA serum level
Outcome Difference detected (95% CI)
Lin 2014 NHANES, 2005-2008
2,339 aged ≥20 years 1,192 men 1,147 women 842 not in menopause 305 in menopause
15.32 3.96 Total Lumbar spine bone mineral density (BMD) (g/cm2) Total hip BMD (g/cm2) All fractures Hip fracture Wrist fracture Spine fracture
Regression coefficient for change in BMD per unit-increase in ln-PFOA Men Women not in menopause Women in menopause 0.006 (-0.014, 0.026) 0.001 (-0.020, 0.022) 0.018 (-0.014, 0.049) Regression coefficient for change in BMD per unit-increase in ln-PFOS Men Women not in menopause Women in menopause 0.000 (-0.013, 0.013) -0.022 (-0.038, -0.007) -0.004 (-0.026, 0.034) Regression coefficient for change in BMD per unit-increase in ln-PFOA Men Women not in menopause Women in menopause -0.002 (-0.023, 0.019) 0.008 (-0.010, 0.027) 0.022 (-0.011, 0.055) Regression coefficient for change in BMD per unit-increase in ln-PFOS Men Women not in menopause Women in menopause -0.003 (-0.016, 0.010) 0.000 (-0.017, 0.017) 0.017 (-0.012, 0.047) OR per unit-increase in ln-PFOA Men Women not in menopause Women in menopause 0.84 (0.67, 1.07) 0.98 (0.75, 1.28) 1.53 (0.63, 3.74) OR per unit-increase in ln-PFOS Men Women not in menopause Women in menopause 0.92 (0.73, 1.16) 0.97 (0.75, 1.24) 1.59 (0.88, 2.86) OR per unit-increase in ln-PFOA Men Women not in menopause Women in menopause 0.64 (0.39, 1.06) 1.59 (0.57, 4.46) 0.48 (0.06, 4.16) OR per unit-increase in ln-PFOS Men Women not in menopause Women in menopause 1.07 (0.76, 1.52) 1.12 (0.62, 2.03) 0.83 (0.23, 3.00) OR per unit-increase in ln-PFOA Men Women not in menopause Women in menopause 1.12 (0.75, 1.70) 1.07 (0.65, 1.77) 1.21 (0.46, 3.13) OR per unit-increase in ln-PFOS Men Women not in menopause Women in menopause 1.09 (0.72, 1.66) 1.04 (0.63, 1.72) 1.22 (0.61, 2.45) OR per unit-increase in ln-PFOA Men Women not in menopause Women in menopause 1.54 (0.85, 2.79) 1.83 (0.59, 5.61) 0.84 (0.46, 1.53) OR per unit-increase in ln-PFOS Men Women not in menopause Women in menopause 1.27 (0.67, 2.42) 0.52 (0.15, 1.86) 1.12 (0.26, 4.78)

140
Reference, Location
Study population
PFOS serum level
PFHxS serum level
PFOA serum level
Outcome Difference detected (95% CI)
Khalil 2016 NHANES, 2009-2010
1,914 aged ≥12 years 956 men 959 women 590 premenopausal 368 postmenopausal
9.70 Means: 12.70 15.10 10.30
1.70 Means: 2.50 3.10 1.90
5.20 Means: 3.70 4.10 3.30
Total femur PFOA Men Women not in menopause Women in menopause bone mineral 2nd -0.010 (-0.034, 0.055) -0.026 (-0.051, -0.001) -0.011 (-0.059, 0.037) density (BMD) 3rd -0.012 (-0.056, 0.033) 0.006 (-0.041, 0.052) -0.002 (-0.049, 0.045) 4th -0.001 (-0.042, 0.041) -0.029 (-0.068, 0.010) -0.024 (-0.072, 0.024) Per Ln-PFOA -0.007 (-0.028, 0.014) -0.017 (-0.038, 0.004) -0.012 (-0.043, 0.019) PFOS Men Women not in menopause Women in menopause 2nd -0.029 (-0.074, 0.016) -0.013 (-0.050, 0.023) -0.001 (-0.072, 0.069) 3rd -0.029 (-0.063, 0.006) -0.017 (-0.048, 0.014) 0.002 (-0.065, 0.070) 4th -0.032 (-0.072, 0.008) -0.013 (-0.046, 0.021) -0.059 (-0.115, -0.002) Per Ln-PFOS -0.010 (-0.027, 0.006) -0.004 (-0.020, 0.012) -0.033 (-0.049, -0.015) PFHxS Men Women not in menopause Women in menopause 2nd -0.004 (-0.046, 0.038) -0.013 (-0.050, 0.023) -0.001 (-0.072, 0.069) 3rd -0.029 (-0.063, 0.006) -0.017 (-0.048, 0.014) 0.002 (-0.065, 0.070) 4th -0.032 (-0.072, 0.008) -0.013 (-0.046, 0.021) -0.059 (-0.115, -0.002) Per Ln-PFHxS -0.010 (-0.025, 0.004) -0.009 (-0.026, 0.007) -0.009 (-0.029, 0.011) Total femur PFOA Men Women not in menopause Women in menopause neck mineral 2nd 0.011 (-0.021, 0.043) -0.028 (-0.060, 0.003) -0.022 (-0.077, 0.033) density 3rd -0.013 (-0.053, 0.028) 0.014 (-0.031, 0.060) -0.024 (-0.083, 0.035) 4th 0.004 (-0.035, 0.043) -0.019 (-0.056, 0.018) -0.041 (-0.098, 0.016) Per Ln-PFOA 0.001 (-0.025, 0.022) -0.012 (-0.030, 0.007) -0.020 (-0.049, 0.010) PFOS Men Women not in menopause Women in menopause 2nd -0.036 (-0.077, 0.006) -0.005 (-0.028, 0.018) -0.005 (-0.087, 0.077) 3rd -0.027 (-0.063, 0.009) -0.005 (-0.028, 0.017) -0.001 (-0.082, 0.080) 4th -0.046 (-0.078, -0.015) -0.001 (-0.029, 0.029) -0.062 (-0.134, 0.009 Per Ln-PFOS -0.013 (-0.024, 0.002) -0.001 (-0.015, 0.015) -0.033 (-0.049, -0.017) PFHxS Men Women not in menopause Women in menopause 2nd -0.002 (-0.042, 0.038) -0.004 (-0.042, 0.033) -0.025 (-0.100, 0.050) 3rd -0.004 (-0.031, 0.023) -0.010 (-0.018, 0.038) -0.017 (-0.092, 0.058) 4th -0.013 (-0.052, 0.025) -0.010 (-0.039, 0.016) -0.026 (-0.104, 0.051 Per Ln-PFHxS -0.009 (-0.024, 0.006) -0.001 (-0.015, 0.013) -0.005 (-0.024, 0.013) Lumbar spine PFOA Men Women not in menopause Women in menopause bone mineral 2nd 0.013 (-0.042, 0.068) -0.008 (-0.041, 0.025) -0.001 (-0.089, 0.088) density (BMD) 3rd -0.023 (-0.083, 0.037) 0.020 (-0.020, 0.060) 0.011 (-0.090, 0.113) 4th -0.005 (-0.058, 0.049) -0.010 (-0.042, 0.021) -0.017 (-0.111, 0.077) Per Ln-PFOA -0.011 (-0.039, 0.017) 0.001 (-0.020, 0.021) -0.017 (-0.058, 0.024)

141
Lumbar spine PFOS Men Women not in menopause Women in menopause BMD 2nd -0.023 (-0.064, 0.018) 0.001 (-0.044, 0.045) -0.040 (-0.165, 0.085) 3rd -0.026 (-0.066, 0.014) 0.009 (-0.026, 0.045) -0.023 (-0.144, 0.097) 4th -0.023 (-0.064, 0.017) 0.015 (-0.022, 0.052) 0.058 (-0.192, 0.075) Per Ln-PFOS -0.011 (-0.028, 0.006) 0.010 (-0.008, 0.027) -0.019 (-0.047, 0.009) PFHxS Men Women not in menopause Women in menopause 2nd 0.015 (-0.021, 0.050) 0.026 (-0.017, 0.069) -0.017 (-0.103, 0.069) 3rd 0.021 (-0.015, 0.057) 0.028 (-0.017, 0.073) 0.035 (-0.067, 0.137) 4th 0.005 (-0.022, 0.033) -0.014 (-0.043, 0.015) 0.001 (-0.089, 0.091) Per Ln-PFHxS 0.001 (-0.011, 0.012) 0.003 (-0.013, 0.019) -0.001 (-0.021, 0.020) Odds ratio for osteoporosis in women PFOA PFOS PFHxS 2nd 1.25 (0.38, 4.06) 0.42 (0.13, 1.32) 9.29 (1.81, 47.6) 3rd 1.23 (0.37, 4.05) 0.83 (0.45, 1.51) 8.06 (1.84, 35.3) 4th 2.59 (1.01, 6.67) 1.07 (0.36, 3.19) 13.20 (2.72, 64.2) Per Ln: 1.84 (1.17, 2.90) 1.14 (0.68, 1.94) 1.64 (1.14, 2.38)
Reference, Location
Study population
PFOS serum level
PFHxS serum level
PFOA serum level
Outcome Difference detected (95% CI)
Looker 2014 C8
403 aged >18 years
8.32 33.74 Influenza Type B Geometric mean antibody titer (GMT) Log10-titer rise Log10-titer ratio: Postvaccine / prevaccine
PFOA quartiles regression coefficient, log10-PFOA GMT log10-titer rise log10-titer ratio 1st 49.5 (38.1, 64.1) 2nd 46.0 (35.3, 60.0) -.03 (-.19, .13) .05 (-.09, .19) 3rd 43.6 (33.1, 57.3) -.02 (-.19, .15) .07 (-.07, .22) 4th 20.9 (16.6, 28.2) -.07 (-.24, .10) -.03 (-.17, .12) Regression coefficient per unit increase in log10-PFOA: -.02 (-.13, .09) -.02 (-.11, .08) PFOA Odds ratio: Seroconversion Seroprotection 2nd 1.43 (0.76, 2.70) 0.76 (0.40, 1.45) 3rd 1.39 (0.73, 2.66) 1.13 (0.57, 2.23) 4th 0.71 (0.38, 1.36) 0.77 (0.39, 1.50) Odds ratio per unit-increase in log10-PFOA: 0.80 (0.53, 1.21) 1.04 (0.68, 1.60) PFOS quartiles regression coefficient, log10-PFOS GMT log10-titer rise log10-titer ratio 1st 42.3 (33.4, 53.4) 2nd 41.5 (30.7, 56.0) .02 (-.13, .18) .004 (-.14, .14) 3rd 41.1 (31.7, 53.4) -.03 (-.19, .14) -.02 (-.16, .12) 4th 52.8 (38.9, 71.7) .04 (-.14, .21) .03 (-.12, .18) Regression coefficient per unit increase in log10-PFOS: .05 (-.11, .21) .05 (-.09, .18)

142
Influenza Type A H1N1 Geometric mean antibody titer (GMT) Log10-titer rise Log10-titer ratio: Postvaccine / prevaccine Influenza Type A H3N2 Geometric mean antibody titer (GMT) Log10-titer rise Log10-titer ratio:
PFOS Odds ratio: Seroconversion Seroprotection 2nd 0.72 (0.39, 1.33) 0.67 (0.35, 1.25) 3rd 0.81 (0.42, 1.53) 0.82 (0.42, 1.59) 4th 0.87 (0.43, 1.74) 0.73 (0.36, 1.47) Odds ratio per unit-increase in log10-PFOS: 1.17 (0.63, 2.17) 0.85 (0.44, 1.64) PFOA quartiles regression coefficient, log10-PFOA GMT log10-titer rise log10-titer ratio 1st 476.2 (360.8, 628.7) 2nd 352.2 (255.3, 485.9) -.09 (-.27, .08) -.08 (-.29, .12) 3rd 306.3 (232.6, 403.2) -.10 (-.28, .09) -.04 (-.25, .18) 4th 274.8 (202.9, 372.2) -.12 (-.30, .06) .07 (-.14, .29) Regression coefficient per unit increase in log10-PFOA: -.03 (-.14, .09) .07 (-.06, .21) PFOA Odds ratio: Seroconversion Seroprotection 2nd 0.74 (0.34, 1.59) 0.74 (0.17, 3.28) 3rd 1.11 (0.49, 2.50) 1.59 (0.33, 7.70) 4th 2.23 (0.90, 5.53) 6.47 (0.91, 45.9) Odds ratio per unit-increase in log10-PFOA: 1.51 (0.89, 2.56) 2.34 (0.91, 6.07) PFOS quartiles regression coefficient, log10-PFOS GMT log10-titer rise log10-titer ratio 1st 342.3 (256.0, 457.7) 2nd 280.4 (197.6, 397.9) -.04 (-.21, .14) -.07 (-.28, .13) 3rd 417.7 (319.0, 547.1) .13 (-.04, .31) .03 (-.18, .24) 4th 341.8 (258.0, 452.8) .10 (-.09, .29) .03 (-.19, .26) Regression coefficient per unit increase in log10-PFOS: .15 (-.02, .32) .10 (-.11, .30) PFOS Odds ratio: Seroconversion Seroprotection 2nd 0.97 (0.44, 2.14) 0.55 (0.13, 2.37) 3rd 0.78 (0.35, 1.75) 1.81 (0.32, 10.2) 4th 0.94 (0.38, 2.31) 1.26 (0.24, 6.61) Odds ratio per unit-increase in log10-PFOS: 1.10 (0.51, 2.37) 0.93 (0.23, 3.71) PFOA quartiles regression coefficient, log10-PFOA GMT log10-titer rise log10-titer ratio 1st 228.9 (161.5, 324.3) 2nd 125.4 ( 86.0, 182.7) -.28 (-.51, -.06) -.10 (-.30, .10) 3rd 104.1 ( 72.5, 149.6) -.37 (-.60, -.13) -.07 (-.28, .14) 4th 183.7 (127.3, 265.2) -.12 (-.36, .13) -.22 (-.43, -.01) Regression coefficient per unit increase in log10-PFOA: log10-titer rise log10-titer ratio

143
755 aged >18 years
Postvaccine / prevaccine Self-reported cold or flu in last 12 months
-.01 (-.17, .14) -.12 (-.25, .02) PFOA Odds ratio: Seroconversion Seroprotection 2nd 0.90 (0.48, 1.68) 0.34 (0.14, 0.83) 3rd 1.13 (0.59, 2.17) 0.28 (0.11, 0.70) 4th 0.62 (0.33, 1.16) 0.39 (0.15, 0.99) Odds ratio per unit-increase in log10-PFOA: 0.76 (0.51, 1.15) 0.66 (0.39, 1.12) PFOS quartiles regression coefficient, log10-PFOS GMT log10-titer rise log10-titer ratio 1st 137.7 ( 98.7, 192.1) 2nd 147.3 ( 99.3, 218.5) .03 (-.19, .26) -.06 (-.26, .14) 3rd 211.0 (141.2, 315.3) .18 (-.06, .41) .02 (-.18, .23) 4th 126.7 ( 88.9, 180.7) -.04 (-.28, .21) -.03 (-.24, .19) Regression coefficient per unit increase in log10-PFOS: .09 (-.13, .32) -.005 (-.20, .19) PFOS Odds ratio: Seroconversion Seroprotection 2nd 1.08 (0.59, 1.97) 0.85 (0.38, 1.88) 3rd 1.10 (0.59, 2.06) 1.09 (0.47, 2.56) 4th 1.41 (0.72, 2.78) 0.56 (0.24, 1.28) Odds ratio per unit-increase in log10-PFOS: 1.17 (0.63, 2.15) 0.63 (0.26, 1.49) PFOA odds ratio PFOS 2nd 1.21 (0.73, 2.00) 1.66 (1.00, 2.75) 3rd 1.10 (0.67, 1.81) 1.19 (0.74, 1.94) 4th 0.84 (0.52, 1.36) 1.15 (0.69, 1.91) OR per unit increase in log10-PFAS: 0.85 (0.62, 1.16) 0.90 (0.55, 1.48)
Reference, Location
Study population
PFOS serum level
PFHxS serum level
PFOA serum level
Outcome Difference detected (95% CI)
Kielsen 2016 Denmark
12 adults 9.52 0.37 1.69 Diphtheria Tetanus
% change in antibody per doubling of PFAS PFOA PFOS PFHxS -8.22 (6.44, -20.85) -11.90 (-0.33, -21.92) -13.31 (0.29, -25.07) 0.23 (12.1, -10.40) --3.59 (5.51, -11.91) -4.35 (6.04, -13.72)

144
Reference, Location
Study population
PFOS serum level
PFHxS serum level
PFOA serum level
Outcome Difference detected (95% CI)
Reference, Location
Stein 2016b New York
75 aged 21-49 years 5.22 1.1 2.28 FluMist Seroconversion measured by immuno-histochemistry Serum Immune Markers: Interferon-α2 Interferon-γ Tumor necrosis factor-α Interferon-γ-inducible protein 10 (IP-10) Monocyte chemo-attractant protein-1 Macrophage inflam-matory protein-1a Granulocyte colony-stimulating factor Nasal Secretion Immune Markers: IP-10 Monocyte chemo-attractant protein-1 Mucosal immune-globulin A
RR PFOS PFOA PFHxS 2nd 2.6 (0.9, 7.4) 0.6 (0.2, 2.0) 1.1 (0.4, 2.9) 3rd 2.4 (0.9, 6.6) 1.8 (0.7, 4.3) 1.7 (0.6, 4.8) Mean change between baseline and FluMist response: 2nd 8.69 (-23, 40.5) 2.54 (-28, 32.9) -21 (-51, 8.61) 3rd -5.6 (-37, 25.7) 10.9 (-19, 40.4) -29 (-64, 5.20) 2nd 8.00 (-34, 49.6) -23 (-61, 14.1) -40 (-76, -3.7) 3rd 9.95 (-28, 47.9) -23 (-61, 16.1) -40 (-84, 2.69) 2nd -0.06 (-4.6, 4.45) 1.28 (-2.8, 5.39) -5.3 (-9.2, -1.3) 3rd 0.59 (-3.6, 4.81) -0.96 (-5.2, 3.26) -4.8 (-9.4, -0.1) 2nd 12.0 (-44, 67.6) -3.4 (-55, 48.7) -32 (-84, 20.1) 3rd -42 (-94, 10.4) -28 (-82, 25.0) -15 (-76, 46.9) 2nd 4.75 (-60, 69.7) -9.9 (-70, 49.8) -39 (-97, 19.5) 3rd 19.0 (-42, 79.8) -2.7 (-64, 58.6) 20.6 (-48, 89.5) 2nd -1.6 (-22, 18.8) 4.25 (-15, 23.7) -6.6 (-25, 12.1) 3rd -0.51 (-20, 19.2) 5.09 (-15, 24.8) -5.0 (-28, 18.4) 2nd -8.7 (-60, 42.8) -1.4 (-49, 45.7) -10 (-56, 35.9) 3rd -0.36 (-49, 47.9) -13 (-62, 35.2) 36.6 (-18, 91.3) 2nd 429 (-1309, 2166) -30 (-1623, 1563) -691 (-2279, 896) 3rd -215 (-1841, 1412) -564 (-2200, 1072) -713 (-2596, 1170) 2nd 2.34 (-9.2, 13.8) 0.72 (-9.9, 11.3) -0.7 (-11, 10.6) 3rd -6.7 (-17, 4.04) -6.6 (-18, 4.24) -3.6 (-16, 9.08) 2nd 73.9 (-216, 364) -17 (-285, 251) 294 (35.2, 553) 3rd -88 (-359, 183) 28.7 (-246, 304) 238 (-69, 545)

145
Table A4. PFAS studies on infertility/subfertility.
Reference Exposure Outcome OR/FR/β & 95% CI Fei 2009 Danish study
PFOA and PFOS in blood samples at gestational week 17
Subfecundity (n= 1240 women)
Infertility OR = 1.77 (1.06, 2.95) and 2.54 (1.47, 4.39) for highest vs lowest quartile of PFOS and PFOA, respectively Fecundity OR (FOR) = 0.74 (0.58, 0.93) and 0.60 (0.47, 0.76) for highest vs lowest quartile of PFOS and PFOA, respectively FORs <1 indicate decreased fecundity and a longer TTP
Whitworth 2012a Norway study
PFOA and PFOS in blood samples at gestational week 17
Subfecundity (n= 910)
ORs = 0.7 0.4–1.3) for highest PFOS quartile and 0.5 (0.2–1.2) for highest PFOA quartile among primiparous women and there was a monotonic exposure-response relationship for PFOS
Buck Louis 2013 LIFE study
PFOS, PFOA, PFNA and 4 other PFCs in serum
Fecundability ORs (TTP) (n=501 couples followed for 12 months)
FORs about 1 for PFOS, PFOA, and PFNA
Velez 2015 MIREC study
PFOS PFOA PFHxS Measured in the 1st trimester
Female fecundity odds ratio (FOR) as measured by TTP Infertility (n= 1743 women recruited before 14 weeks of gestation)
FOR = 0.89 (0.83–0.94), 0.91 (95% CI 0.86–0.97), and 0.96 (0.91–1.02) per one SD increase in log-transformed serum concentrations of PFOA, PFHxS, and PFOS, respectively ORs for infertility = 1.31 (1.11–1.53) for PFOA 1.14 (0.98–1.34) for PFOS, and 1.27 (1.09–1.48) for PFHxS
Jorgensen 2014
PFOA, PFOS, PFHxS and PFNA Fecundability ratios (FRs) infertility (n= 938 women; 448 were from Greenland, 203 from Poland, and 287 from Ukraine)
log-scale FR = 0.80 (0.69-0.94) and 0.90 (0.76, 1.07) for PFNA and PFOS, respectively, in pooled sample FRs in Greenland ranged from 0.71-0.90 for categorical analyses and there were monotonic exposure-response relationships for PFOA, PFOS, and PFNA FRs in Poland were 0.90 and 0.94 for categorical analyses of PFOS and PFHxS, respectively FRs in Ukraine were 0.93 and 0.88 for categorical analyses of PFOS and PFNA, respectively log-scale OR = 1.53 (1.08-2.15), 1.11 (0.74, 1.66), and 1.39 (0.93, 2.07) for PFNA, PFOA, and PFOS, respectively, and infertility in pooled sample ORs in Greenland ranged from 1.22-2.15 for categorical analyses and there was a monotonic exposure-response relationships for PFOA

146
ORs in Poland were 1.41 and 1.92 for categorical analyses of PFOA and PFOS, respectively, and there were monotonic exposure-response relationships for PFOA ORs in Ukraine ranged from 1.17-1.22 for categorical analyses of PFOA, PFOS, and PFNA associations were weaker in a sensitivity analysis of primiparous women
Reference Exposure Outcome OR/FR/β & 95% CI Bach 2015a Danish study
plasma PFOS and PFOA Time to pregnancy (TTP) (n=440 for sample 1 and n= 1161 for sample 2)
PFOA: FRs ranging from 0.74-0.86 comparing the highest and lowest quartiles FRs was 0.74 and 0.82 comparing the highest and lowest quartiles in nulliparous women in sample 2 and the pooled analysis, respectively, and the log FR were 0.67 and 0.84 and there was an exposure-response relationship for sample 2 FRs ranged from 0.74-0.76 comparing the highest and lowest quartiles in parous women and the log FRs ranged from 0.66-0.72 and there was an exposure-response relationship in the pooled sample PFOS: FRs ranged from 0.69-0.97 comparing the highest and lowest quartiles in nulliparous women and the log FR was 0.62 in sample 2 and 0.78 in the pooled analysis FRs was 0.93 and 0.97 comparing the highest and lowest quartiles in parous women in sample 2 and the pooled analysis, respectively, and the log FR ranged from 0.85-0.91
Vested 2013 Danish study
In utero exposure to PFOA and PFOS measured in maternal blood samples from pregnancy week 30 Maternal and adult son questionnaires on dietary/health and lifestyle habits Mothers’ median plasma concentrations of PFOA and PFOS were 3.8 ng/mL (2.8–4.7
Adult male semen quality, testicular volume, and reproductive hormone levels (n=169)
PFOA was associated with a lower percentage of adjusted sperm concentration (–34%, –58, 5), total sperm count (–34%, –62, 12), and morphologically normal spermatozoa (–19%, –42, 13) and with higher adjusted levels of luteinizing hormone (6 IU/L, –11, 27) and follicle-stimulating hormone (15 IU/L, –8, 44). Monotonic exposure-response relationships for sperm concentration and LH and FSH levels PFOS was associated with a lower percentage of adjusted total sperm count (–23%, –56, 38) and morphologically normal

147
ng/mL) and 21.2 ng/mL (17.4–26.5 ng/mL), respectively
spermatozoa (–14%, –39, 20) and with higher adjusted levels of follicle-stimulating hormone (20 IU/L, –5, 51). Monotonic exposure-response relationships for morphologically normal spermatozoa and FSH levels
Bach 2016a systematic review PFOS and PFOA measured in blood Men: Average exposure levels in the non-occupational studies ranged from 4.6-44.7 ng/mL for PFOS and 1.3-9.2 ng/mL for PFOA Women: Average exposure levels ranged from 3.8-36.3 ng/mL for PFOS and 1.5-5.6 ng/mL for PFOA
Fertility measured by: Reproductive hormones and TTP in men and women Semen characteristics Men: n’s varied from 56-857 Women: TTP n’s varied from 222-1743; hormone n’s varied from 178-825
Men: Inconsistent results for semen volume, sperm concentration, total sperm count, motility, and morphology; levels of testosterone, free androgen index/free testosterone, estradiol, SHBG, LH, FSH, and inhibin B; and TTP Women: Inconsistent results except for mostly positive associations for infertility and fecundability in parous women

148
Table A5. PFAS studies on pregnancy-induced hypertension/pre-eclampsia.
Reference Exposure Outcome OR/HR & 95% CI Stein 2009 C8 project
PFOA PFOS
Pre-eclampsia (n=1,845 pregnancies for PFOA and 5,262 pregnancies for PFOS)
For exposures >90th percentile: Pre-eclampsia: OR = 1.6 (1.2, 2.3) for PFOS; OR <1 for PFOA
Savitz 2012a C8 project
Serum PFOA levels at the time of pregnancy from drinking water contaminated by chemical plant releases analysis uses modeled serum PFOA estimates
Preeclampsia (n= 11,737 pregnancies)
OR = 1.2 (1.0–1.6) for highest vs lowest quartile
Starling 2014 Norwegian Mother and Child Cohort Study
PFOA, PFOS, and PFHxS in maternal plasma extracted midpregnancy
Preeclampsia (n= 466 cases, 510 noncases)
PFOS: HR = 1.09 (0.75, 1.58) for highest vs lowest quartile and HR = 1.13 (0.84, 1.52) for per ln-unit PFHxS: HRs <1
Avanasi 2015 C8 project
Estimated and simulated PFOA concentrations
Preeclampsia (n= 10,149 participants for each of the 12 Monte Carlo simulations [500 iterations per simulation])
OR in 12 simulations ranged between 1.10 and 1.12 OR = 1.11 (0.99, 1.24) from original exposure assignments
Savitz 2012b C8 project
Historical estimates of serum PFOA from a fate and transport model using address at delivery (birth records) and a survey with residential history data
Pregnancy-induced hypertension (PIH) (n=224 cases and n=3616 controls)
OR = 1.2 (0.8, 1.7) using survey data and comparing the highest vs lowest quintile of PFOA (Bayesian calibration)
Darrow 2013 C8 project
PFOA and PFOS measurements Pregnancy-induced hypertension (n=106 and n=1630 total births)
ORs = 3.16 (1.35, 7.38) and 1.56 (0.72, 3.38) for the highest vs lowest quintile of PFOA and PFOS, respectively

149
Table A6. PFAS studies on adverse birth outcomes.
Reference Exposure Outcome OR/β & 95% CI Apelberg 2007 Baltimore THREE study
PFOA and PFOS in cord serum samples
Gestational age, birth weight, and birth size (n = 293)
birth weight per ln-unit: β = –69 g ( –149 to 10) for PFOS and –104 g ( –213 to 5) for PFOA ponderal index per ln-unit: β = –0.074 g/cm3 × 100 ( –0.123 to –0.025) for PFOS and = –0.070 g/cm3 × 100 ( –0.138 to –0.001) for PFOA head circumference per ln-unit: β = –0.32 cm ( –0.56 to –0.07) for PFOS and –0.41 cm ( –0.76 to –0.07) for PFOA length per ln-unit: β = -0.10 cm ( -0.64 to 0.44) for PFOA
Fei 2007 Danish study
PFOS and PFOA Preterm birth, low birth weight, SGA (n=1400)
β = –10.63 g ( –20.79, –0.47) for PFOA and birth weight OR = 4.82 (0.56–41.16) and 2.44 (0.27–22.25) for LBW and highest vs lowest quartiles of PFOS and PFOA, respectively OR = 1.43 (0.50–4.11) and 1.71 (0.55–5.28) for preterm birth and highest vs lowest quartiles of PFOS and PFOA, respectively
Stein 2009 C8 project
PFOA PFOS
Preterm birth Low birth weight (n=1,845 pregnancies for PFOA and 5,262 pregnancies for PFOS)
For exposures >90th percentile: Pre-term birth: OR = 1.4 (1.1, 1.7 ) for PFOS and there was a monotonic exposure-response relationship and OR <1 for PFOA Low birth weight OR = 1.8 (1.2, 2.8) for PFOS and there was a monotonic exposure-response relationship and OR <1 for PFOA
Fei 2008 Danish study
PFOS and PFOA in maternal blood samples taken early in pregnancy
Placental weight Birth length Head and abdominal circumferences Ponderal index (n=1400)
Placental weight β = -21.3 g (-46.1, 3.4) and -10.8 g (-33.4, 11.8) for highest vs lowest quartiles of PFOA and PFOS, respectively; monotonic exposure-response relationship for PFOA Birth length β = -0.49 cm (-0.81, -0.16) for highest vs lowest quartiles of PFOA

150
Head circumference β = -0.14 cm (-0.39, 0.12) for highest vs lowest quartiles of PFOA Abdominal circumference β = -0.29 cm (-0.63, 0.06) for highest vs lowest quartiles of PFOA; monotonic exposure-response relationship for PFOA
Reference Exposure Outcome OR/β & 95% CI Nolan 2009 Little Hocking communities
PFOA Mean birthweight, mean gestational age, low birthweight, and preterm birth (n=1555)
β = −8.81 g (−86.1–68.5) for mean birth weight comparing LHWA only to no LHWA water service
Washino 2009 Japan
PFOS and PFOA in maternal serum Birth weight Birth length Chest circumference Head circumference (n=428)
β = –269.4 g (–465.7 to –73.0 g) and –76.7 (–234.7 to 81.3) for PFOS and PFOA per log10 unit and birth weight only in female infants
Andersen 2010 Danish study
maternal plasma levels of PFOS and PFOA and cord blood samples
Weight, length, and body mass index development during 1st year of life (n=1400 born in 1996-2002)
Weight: aβ = -0.8 g (-4.2, 2.6) at 5 months and -5.8 g (-10.4,-1.2) at 12 months for PFOS; -9.4 g (-28.6, 9.9) at 5 months and -19.0 g (-44.9, 6.8) at 12 months for PFOA
Hamm 2010 Canada
PFOS PFOA PFHxS
Birth weight Fetal growth SGA Preterm birth (n=252)
adjusted changes in birth weight per natural log (ng/ml) of PFOA were -37.4 g (-86.0 to 11.2 g) Difference of -0.086 (- 0.62 to 0.45) gestation week for highest vs lowest tertile of PFOA RR= 2.35 (0.63–8.72) for highest vs lowest tertile of PFHxS and SGA RR = 1.31 (0.38-4.45) and 1.11 (0.36–3.38) for preterm birth comparing highest vs lowest tertile of PFOA and PFOS, respectively; monotonic exposure-response relationship for PFOS

151
Reference Exposure Outcome OR/β & 95% CI Chen 2012 Taiwan
Cord blood for PFOA, PFOS, PFNA, and PFUA
Gestational age Birth weight Birth length Head circumference Ponderal index (indicator of disproportionate or asymmetric growth restriction) Preterm birth Low birth weight SGA (n=429)
per ln unit: β = -0.37 (-0.60, -0.13) weeks for gestational age and -0.17 cm (-0.42, 0.09) for birth length and PFOS βs ranged from -19.2 to -110.2 g for birth weight and -0.05 to -0.25 cm for head circumference and PFOA, PFOS, and PFUA; there was a monotonic exposure-response relationship for head circumference and PFOS when exposures were categorized into quartiles βs ranged from -0.01 to -0.02 for Ponderal index and PFOA, PFOS, PFNA, and PFUA ORs of preterm birth and low birth weight = 2.45 (1.47, 4.08) and 2.61 (0.85, 8.03), respectively, for PFOS ORs = 2.27 (1.25, 4.15) and 1.24 (0.75, 2.05) for SGA and PFOS and PFOA, respectively An exposure response relationship was observed for PFOS and head circumference and preterm birth
Savitz 2012a C8 project
Serum PFOA levels at the time of pregnancy from drinking water contaminated by chemical plant releases analysis uses modeled serum PFOA estimates
Preterm birth, term low birthweight (n= 11,737 pregnancies)
OR ≤ 1 for preterm birth and term low birthweight
Maisonet 2012 Avon Longitudinal Study (Britain)
PFOS PFOA PFHxS
Fetal and postnatal growth in girls (n=447)
Birth weight: β ranged from -107.93 to -14.01 g for the highest vs lowest tertiles of PFOS, PFOA, and PFHxS, respectively; exposure-response relationships were observed for all 3 chemicals Birth length: β ranged from -0.44 to -0.82 cm for the highest vs lowest tertiles of PFOS, PFOA, and PFHxS;
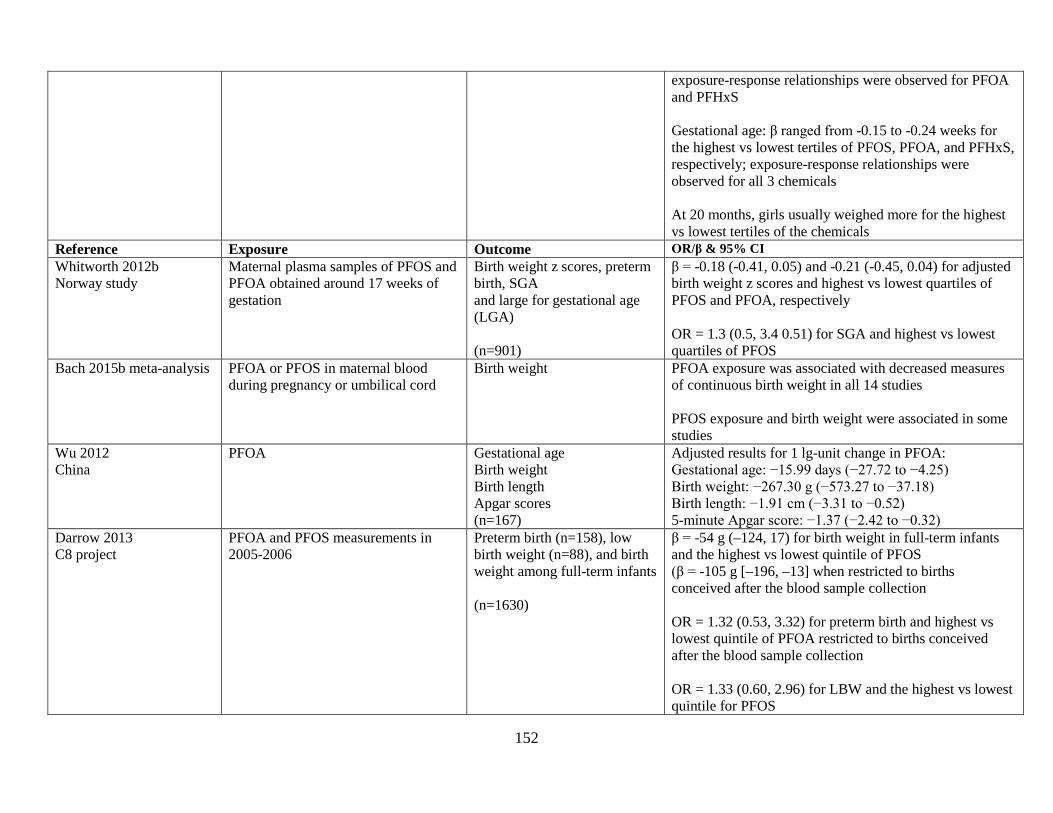
152
exposure-response relationships were observed for PFOA and PFHxS Gestational age: β ranged from -0.15 to -0.24 weeks for the highest vs lowest tertiles of PFOS, PFOA, and PFHxS, respectively; exposure-response relationships were observed for all 3 chemicals At 20 months, girls usually weighed more for the highest vs lowest tertiles of the chemicals
Reference Exposure Outcome OR/β & 95% CI Whitworth 2012b Norway study
Maternal plasma samples of PFOS and PFOA obtained around 17 weeks of gestation
Birth weight z scores, preterm birth, SGA and large for gestational age (LGA) (n=901)
β = -0.18 (-0.41, 0.05) and -0.21 (-0.45, 0.04) for adjusted birth weight z scores and highest vs lowest quartiles of PFOS and PFOA, respectively OR = 1.3 (0.5, 3.4 0.51) for SGA and highest vs lowest quartiles of PFOS
Bach 2015b meta-analysis PFOA or PFOS in maternal blood during pregnancy or umbilical cord
Birth weight
PFOA exposure was associated with decreased measures of continuous birth weight in all 14 studies PFOS exposure and birth weight were associated in some studies
Wu 2012 China
PFOA Gestational age Birth weight Birth length Apgar scores (n=167)
Adjusted results for 1 lg-unit change in PFOA: Gestational age: −15.99 days (−27.72 to −4.25) Birth weight: −267.30 g (−573.27 to −37.18) Birth length: −1.91 cm (−3.31 to −0.52) 5-minute Apgar score: −1.37 (−2.42 to −0.32)
Darrow 2013 C8 project
PFOA and PFOS measurements in 2005-2006
Preterm birth (n=158), low birth weight (n=88), and birth weight among full-term infants (n=1630)
β = -54 g (–124, 17) for birth weight in full-term infants and the highest vs lowest quintile of PFOS (β = -105 g [–196, –13] when restricted to births conceived after the blood sample collection OR = 1.32 (0.53, 3.32) for preterm birth and highest vs lowest quintile of PFOA restricted to births conceived after the blood sample collection OR = 1.33 (0.60, 2.96) for LBW and the highest vs lowest quintile for PFOS

153
Reference Exposure Outcome OR/β & 95% CI Kishi 2015 Hokkaido Study
prenatal PFOS and PFOA levels were measured in maternal serum samples
Birthweight (n= 306 mother-child pairs)
β = - 186.6 g (–363.4, –9.8) for females comparing the 4th and 1st quartiles of PFOS
Bach 2015b Danish study
serum levels of PFHxS, PFHpS, PFOS, PFOA, PFNA, PFDA, and PFUnA measured between 9-20 completed gestational weeks
Birth weight Birth length Head circumference Gestational age at birth Preterm birth (n=1507 mother-child pairs)
βs for birthweight ranged from -8 to -23 g for the highest vs lowest quartiles of PFHxS, PFHpS, PFOS, and PFUnA βs for birthweight for girls ranged from -39 to -76 g for the highest vs lowest quartiles of PFHxS, PFHpS, PFOS, PFNA, PFDA, and PFUnA Association between PFAA exposures and birth length, head circumference, and gestational age were all close to zero OR = 1.18 (0.65, 2.16) for preterm birth for the highest vs lowest quartile of PFNA
Lenters 2015 Greenland, Poland and Ukraine
PFHpA, PFHxS, PFOS, PFOA, PFNA, PFDA, PFUnDA, and PFDoDA
Term birth weight (n=1250) ln‒PFOA β = -63.77 g (-122.83, -4.71); represents change per a 2-SD increase in ln‒transformed exposure biomarker or untransformed continuous covariate levels
Verner 2015 Meta-analysis
PFOA and PFOS Birth weight summary β coefficients for g birth weight per ng/ml increase in PFOA and PFOS levels were -14.7 g (-21.7, -7.8) and -5.0 g (-8.9, -1.1), respectively
Lee 2016 South Korea
PFBS PFHxS PFHpS PFOS PFOA PFNA PFDA PFUnA PFDoA
Birthweight in (n=85 births) lnPFOS β = −0.14 (95% CI: −0.33, 0.03) lnPFOA β = −0.03 (95% CI: −0.25, 0.18) lnPFNA β = −0.14 (95% CI: −0.39, 0.10) lnPFDA β = −0.12 (95% CI: −0.39, 0.14) lnPFDoA β = −0.03 (95% CI: −0.36, 0.30)

154
Reference Exposure Outcome OR/β & 95% CI Callan 2016 Western Australia
PFOS PFOA PFHxS And 11 other PFAS measured in whole blood Median (in μg/L): PFOS 1.99 PFHxS 0.33 PFOA 0.86
Birth weight Birth length Head circumference (n=98 pregnant women) Proportion of optimal birth weight (POBW), proportion of optimal birth length (POBL) and proportion of optimal head circumference (POHC) (n=82-89 infants)
OR = 3.5 (1.1–11.5) for being 95% of their calculated optimal birth weight comparing the highest to lowest tertile of PFHxS β= - 69 g (−231, 94), -48 g (−203, 108) and -103 g (−221, 15) for birthweight and ln-unit increase in PFOS, PFOA, and PFHxS
Lauritzen 2017
PFOS and PFOA Median serum levels (ng/ml): PFOA: 2.33 in Sweden and 1.62 In Norway PFOS: 16.4 in Sweden and 9.74 in Norway
Birth weight, birth length, head circumference, gestational age, SGA 424 mother-child pairs, excluding 1st time mothers: 143 SGA births and 281 non-SGA controls
Sweden: PFOA: Birthweight β= -359 g (-596, -122) Birth length β= -1.3 (-2.3, -0.3) Head circumference β= -0.4 (-1.0, 0.1) Gestational age β= -0.3 (-0.9, 0.3) SGA OR=5.25 (1.68-16.4) Differences more pronounced in boys PFOS: Birthweight β= -292 (-500, -84) Birth length β= -1.2 (-2.1, -0.3) Head circumference β= -0.4 (-0.9, 0.04) Gestational age β= -0.4 (-0.9, 0.2) 0.201 SGA OR=2.51 (0.93-6.77) In Norway, SGA ORs < 1 and βs > 1 or very close to 0

155
Table A7. PFAS studies on congenital malformations.
Reference Exposure Outcome OR/β/RR & 95% CI Nolan 2010 Little Hocking communities
PFOA Congenital anomaly (n=168 served by LHWA only and 1171 no LHWA)
Serviced entirely by contaminated LHWA water: OR = 7.0 (0.4-113) for both heart and circulatory defect OR = 21 (0.9-517) for club foot
Savitz 2012a C8 project
Serum PFOA levels at the time of pregnancy from drinking water contaminated by chemical plant releases analysis uses modeled serum PFOA estimates
Birth defects (n= 11,737 pregnancies)
OR ≤ 1 for birth defects
Stein 2014a C8 project
Modeled PFOA Maternally reported birth defects (n = 325) among 10,262 births
Brain defect OR = 2.6 (1.3-5.1) for IQR increase from 25th to 75th percentile and OR = 16.1 (0.8, 325) for highest vs lowest tertile Limb defect ORs = 1.2 (0.7, 2.0) for IQR increase and 1.5 (0.2, 9.7) for highest vs lowest tertile Eye defect OR = 1.3 (0.2-8.4) for highest vs lowest tertile Heart defect ORs = 1.2 (0.8, 1.7) for IQR increase and 1.4 (0.4, 5.1) for highest vs lowest tertile
Vesterholm Jensen 2014
Cord blood PFAS levels Cryptorchidism (n=29 Danish cases and 30 matched controls and 78 Finnish cases and 78 matched controls)
OR = 1.14 (0.19–6.95) and 1.30 (0.27–6.39) for ln PFOA and PFOS in Danish cases, respectively OR = 2.34 (0.16–34.67) for the highest vs lowest tertile of PFOS in Denmark
Toft 2016 Danish study
Amniotic fluid PFOS level Cryptorchidism Hypospadias (n= 270 cryptorchidism cases, 75 hypospadias cases, and 300 controls)
ORs for cryptorchidism and hypospadias were < 1
Kim 2016 South Korea
16 PFAS in infant sera Mean concentrations were: PFOS 4.05ng/mL), PFOA (2.12ng/mL), PFHxS 1.17ng/mL)
Congenital hypothyroidism (CH) measured by serum thyroid stimulating hormone (TSH),free
large difference in PFOA concentrations between cases and controls (2.12 ng/mL in controls and 5.40 ng/mL in cases)

156
thyroxine (FT4), total T3, thyroglobulin antibody (TGAb), relevant microsomal antibodies (microAb), and thyroid stimulating immuno-globulin (TSI) (n=27 infants with CH and 13 healthy infants)
mean concentrations of PFOA, PFNA, PFDA, PFUnDA, and total PFAS in cases (0.525–16.8ng/mL) were “significantly” higher than in controls (0.298–10.0ng/mL) (data presented in figure only) in CH infants, correlations were -0.482 and -0.642 for TSI and PFOA and PFHxS, respectively (results not shown for PFOS)
Reference Exposure Outcome OR/β/RR & 95% CI Liew 2014 Danish study
PFASs in maternal plasma collected in early or midpregnancy: PFOS, PFOA, PFHxS, PFNA, PFHpS, PFDA Median (ng/ml) PFOS: 27.40 PFOA: 4.00 PFHxS: 0.92
Cerebral palsy (n=156 cases and 550 controls)
per 1-unit (natural-log ng/mL) increase in boys: RR = 1.7 (1.0, 2.8) for PFOS RR = 2.1 (1.2, 3.6) for PFOA RR = 1.2 (0.9, 1.7) for PFHxS RR = 1.2 (0.6, 2.5) for PFNA RR = 1.5 (1.0, 2.2) for PFHpS RR = 1.1 (0.7, 1.7) for PFDA and there was an exposure response relationship for PFHxS, PFNA, and PFHpS when exposure was categorized RRs generally increased for boys born at term

157
Table A8. PFAS studies on adverse health outcomes in children ages ≥2 years.
Reference, Location
Study population PFOS serum level
PFHxS serum level
PFOA serum level
Outcome Difference detected (95% CI)
Pease Tradeport children <12 years, N=366 children <18 years, N=396
8.3 8.1
4.2 4.0
3.6 3.4
Frisbee 2010 C8 study
1,971 boys <12 years 2,773 boys 12 - <18
19.9 20.3
n/a 35.1 30.1
Total cholesterol (mg/dL)
< 12 years 12 - < 18 yrs PFOA: +6.3¶ β=1.6 (0.4) +4.8¶ β=1.1 (0.4) PFOS: +6.2¶ β=1.2 (0.5) +9.3¶ β=2.1 (0.4)
1,886 girls <12 years 2,520 girls 12 - <18
21.7 18.2
n/a 30.7 22.9
Total cholesterol (mg/dL)
PFOA: +5.8¶ β=1.1 (0.4) +3.9¶ β=1.0 (0.4) PFOS: +4.6¶ β=1.3 (0.5) +9.4¶ β=1.9 (0.4)
≥170 mg/dL OR=1.6 (1.4, 1.9), PFOS (5th quintile) OR=1.2 (1.1, 1.4) PFOA (5th quintile)
Zeng 2015 Taiwan
102 boys, age 12-15 29.9 1.4 0.5 Total cholesterol (all children)
4th quartile: 23.1 mg/dL increase for PFOS, 12 mg/dL increase for PFOA. Ln PFHxS β = 1.1 (-0.7, 2.9) Ln PFNA β =12.9 (0.7, 25.1) Ln PFOS β = 0.3 (0.2, 0.5) Ln PFOA β = 6.6 (2.7, 10.4)
123 girls, age 12-15 28.8 1.2 0.5 225 total age 12-15 28.9 1.3 0.5
Maisonet 2015a Avon, UK
Maternal serum (N=199 girls aged 7 and 15)
20.0 3.6 Total cholesterol 3rd tertile β for PFOS & PFOA were <0. Mean differences at age 15, 3rd tertile vs 1st tertile, for PFOA and PFOS = 8.1 and 19.1, respectively.
Geiger 2014a NHANES
815 children, aged 12-18 1999-2008
17.7 (mean)
4.2 (mean)
Total cholesterol High cholesterol
PFOS: 5.9 mg/dL increase (0.1, 11.6), 3rd tertile PFOA: 7.0 mg/dL increase (1.4, 12.6), 3rd tertile PFOS: OR=1.53 (1.07, 2.19), 3rd tertile PFOA: OR=1.49 (1.05, 2.12) 3rd tertile
Nelson 2010 NHANES
322 boys, 12-19 (2003-2004) 19.9 2.4 4.0 Total cholesterol Non-HDL cholesterol
4th quartile mean difference (vs 1st quartile), (mg/dL) Boys Girls PFOS: 3.6 (-8.5, 15.7) -0.4 (-9.3, 8.6) PFOA: 5.0 (-2.3, 12.2) 3.3 (-4.2, 10.8) PFHxS: -3.2 (-15.4, 9.0) -12.7 (-23.4, -2.0) PFOS: 2.0 (-8.1, 12.1) -4.1 (-12.9, 4.7) PFOA: 6.8 (-1.3, 14.9) -1.0 (-9.1, 7.2) PFHxS: -3.3 (-14.6, 8.1) -16.5 (-29.5, -3.4)
263 girls, 12-19 (2003-2004)
Lopez-Espinosa 2012 C8 study
1,078 children, ages 1–5 years 16.3 33.8 thyroid stimulating hormone, TT4 Thyroid disease
PFOS, 4th vs 1st quartile: 3.1% (0.0, 6.2) increase in TSH, 2.3% (1.2, 3.3) increase in TT4 PFOA: OR=1.44 (1.02, 2.03) PFOS: OR=0.80 (0.62, 1.08)
3,132 children ages 6–10 years 21.8 32.2 6,447 ages >10–17 years 19.6 26.9

158
Reference, Location
Study population PFOS serum level
PFHxS serum level
PFOA serum level
Outcome Difference detected (95% CI)
Lin 2013 Taiwan
212 aged 12-19 7.0 2.8 Free T4 5% increase in free T4 for PFNA(same level as Pease)¥
Qin 2016 Taiwan
102 boys, aged 12-15
29.9
1.4
0.5
Uric acid ≥6 mg/dL; 14.7% prevalence (Odds ratios)
PFOA PFOS PFHxS 2.8 (1.4, 5.6) 1.4 (0.9, 2.2) 1.65 (1.01, 2.69)
123 girls, aged 12-15 28.8 1.2 0.5 1.6 (0.7, 3.9) 1.5 (0.8, 2.9) 1.3 (0.7, 2.3) 225 total, aged 12-15 28.9 1.3 0.5 2.2 (1.3, 3.6) 1.35 (0.95, 1.93) 1.4 (0.9, 2.1)
Geiger 2013 NHANES
1,772 aged 12-18 1999-2008 data
16.6 4.1 Serum uric acid (4th quartile)
PFOA: .30 mg/dL increase PFOS: .12 mg/dL increase
Hyperuricemia (16%) PFOA: OR=1.62 (4q vs 1q) PFOS: OR=1.65 (4q vs 1q)
Kataria 2015 NHANES
1,960 aged 12-18 2003-2010
12.8 2.0 3.5 Serum uric acid (4th quartile eGFR (4th quintile) (mL/min/1.73 m2)
PFOA: .21 mg/dL increase (0.06, 0.37) PFOS: .19 mg/dL increase (0.03, 0.34) PFHxS: .05 mg/dL decrease (-9.22, 0.11) PFOA: -6.61 (-11.39, -1.83) PFOS: -9.47 (-14.68, -4.25) PFHxS: -0.32 (-4.44, 3.81)
Lopez-Espinosa 2016 C8
1,169 boys aged 6-9 years
22.4
8.1
34.8
Percent difference Ln testosterone
PFOS PFOA PFHxS -5.8 (-9.4, -2.0) -4.9 (-8.7, -0.8) -2.7 (-6.4, 1.2)
Ln estradiol -4.0 (-7.7, -0.1) 4.3 (-0.4, 9.1) -1.3 (-5.5, 3.1) Ln IGF-1 -5.9 (-8.3, -3.3) -0.4 (-3.4, 2.7) -2.5 (-5.2, 0.3)
1,123 girls aged 6-9 years 20.9 7.0 30.1 Ln testosterone -6.6 (-10.1, -2.8) -2.5 (-6.7, 1.8) 0.2 (-3.5, 4.0) Ln estradiol -0.3 (-4.6, 4.2) 4.2 (-0.7, 9.4) 2.1 (-2.2, 6.5) Ln IGF-1 -5.6 (-8.2, -2.9) -3.6 (-6.6, -0.5) -2.1 (-4.8, 0.7)
Tsai 2015 Taiwan
95 children aged 12-17 7.12 3.03 Ln SHBG Ln FSH Ln testosterone
PFOA: decline among girls PFOS: declines both sexes PFOS: decline among girls
Maisonet 2015b Avon, UK
72 girls, 15 years of age∆
19.2 1.6 3.6 Total testosterone SHBG
Increase in total testosterone by about .20 nmol/L for PFOS, PFOA, and PFHxS (95% CI: .01, .38) Declines for PFOA and PFHxS in 3rd tertile but increases in 2nd tertile
Zhou 2016 Taiwan
102 boys, aged 12-15 29.9 1.4 0.5 Ln testosterone Declines in both sexes for PFOA; decline in boys, PFOS
123 girls, aged 12-15 28.8 1.2 0.5 Ln estradiol Increase in both sexes, PFOA Christensen 2011 Avon, UK
218 girls (puberty <11.5 yrs) 230 controls (aged 13 yrs) ∆
19.8 1.6 3.7 Early age at puberty PFOA: OR=1.29 (0.86, 1.93) PFOS: OR=0.83 (0.56, 1.23)

159
Reference, Location
Study population PFOS serum level
PFHxS serum level
PFOA serum level
Outcome Difference detected (95% CI)
Lopez-Espinosa 2011 C8
3,072 boys, ages 8-18
20
26
Reaching puberty: Odds ratio # days delay
4th quartile PFOS PFOA 0.46 (0.29, 0.71) 0.75 (0.49, 1.15) 190 days delay 69 day delay
2,903 girls, ages 8-18 18 20 Odds ratio # days delay
0.55 (0.35, 0.87) 0.57 (0.37, 0.89) 138 days delay 130 days delay
Kristensen 2013 Denmark
343 women, 20 years old ∆
21.1 3.6 Reaching puberty, Months delay
3rd tertile: PFOS, 1.5 (-2.5, 5.4) months delay; PFOA, 5.3 (1.3, 9.3) months delay
Wang 2015 Taiwan
120 at age 5∆ € 13.25 0.69 2.5 VIQ, PIQ, FSIQ ø Age 5: VIQ PIQ FSIQ PFOS:-1.7 (-4.0, 0.7) -2.2 (-4.7, 0.3) -1.9 (-4.3, 0.5) PFOA: 0.9 (-1.4, 3.3) 1.0 (-1.4, 3.4) 1.2 (-1.0, 3.5) PFNA: 0.7 (-1.3, 2.7) -1.4 (-3.4, 0.6) -0.2 (-2.1, 1.7)
120 at age 8∆ € 12.28 0.69 2.5 Age 8: VIQ PIQ FSIQ PFOS: -1.3 (-3.6, 1.1) -1.6 (-4.0, 0.7) -1.9 (-4.3, 0.4) PFOA: 0.5 (-1.5, 2.5) -1.1 ( -3.2, 1.0) -0.4 (-2.5, 1.7) PFNA:-2.1 (-3.9, -0.2) -1.5 (-3.5, 0.4) -1.5 (-3.4, 0.4)
Stein 2013 C8
320 children, 6-12 years 35 IQ, reading, language, memory, (etc.)
PFOA evaluated. 4th quartile PFOA had higher IQ scores than 1st quartile and decreased scores for ADHD characteristics.
Lien 2016 Taiwan
282 children, 7 years old Cord blood levels
4.79 1.55 Hyperactivity symptoms
Slight, inconsistent results for PFOS and PFOA.
Stein 2011 C8
10,546 children ages 5-18 20.2 5.2 28.2 ADHD
4th quartile, ORs: PFOS, 1.3 (1.0, 1.6); PFHxS, 1.6 (1.2, 2.1); PFOA, 0.7 (0.6, 0.9); PFNA, 1.2 (0.9, 1.5)
Learning problem 4th quartile, ORs: PFHxS, 1.2 (1.0, 1.4); PFOS, 0.9 (0.7, 1.0); PFOA, 0.9 (0.8, 1.1); PFNA, 0.7 (0.6, 0.9)
Stein 2014b C8
320 children, 6-12 years 35 ADHD behaviors Inconsistent results (parents vs teachers; boys vs girls)
Fei 2011 Denmark
787 children, 7 years old∆
34.4 5.4 HyperactivityѰ CoordinationѰ
Conduct problem: PFOS OR=1.45 (0.77, 2.72); PFOA OR=1.29 (0.67, 2.52) Coordination problem: PFOS OR=1.39 (0.65, 3.00); PFOA OR=1.14 (0.46, 2.81)
Hoffman 2010 NHANES, 1999-2000, 2003-2004
571 children aged 12-15 22.6 2.2 4.4 ADHD, ORs for IQR PFOS: OR=1.60 (1.10, 2.31) PFOA: OR=1.35 (1.04, 1.77) PFHxS: OR=1.19 (1.05, 1.34) PFNA: OR=1.15 (0.93, 1.42)
Ode 2014 Sweden
203 ADHD cases and 205 controls (cord blood PFASs)
6.8 1.8 ADHD PFOA, ≥75th percentile: OR=1.07 (0.67, 1.70) (PFOS OR < 1.0)

160
Reference, Location
Study population PFOS serum level
PFHxS serum level
PFOA serum level
Outcome Difference detected (95% CI)
Liew 2015 Denmark 545 controls∆ Serum levels: PFOS=27.4 PFHxS=0.9 PFOA=4.0
215 ADHD∆ 26.8 0.8 4.1 ADHD PFOA, 4th quartile: OR=1.14 (0.92, 1.40). OR=2.0 (1.5, 2.8) when all six PFAS included in model; PFOS & PFHxS ORs <1.0. PFNA OR < 1.0, but when all 6 PFAS in model, the OR for PFNA=1.6 (1.2, 2.1)
213 ASD∆ 25.4 0.9 3.9 ASD PFHxS, 4th quartile: OR=1.07 (0.73, 1.56). When all 6 PFAS in model, OR=1.3 (0.8, 2.1). Per ln(PFHxS), OR=1.10 (0.92, 1.33). OR<1.0 for PFOA, PFOS, PFNA. When all 6 PFAS in model, PFOS OR=1.2 (0.7, 2.1)
Braun 2014 Cincinnati, OH
175 children tested at age 4 and/or age 5∆
13.0
1.6
5.5
SRS PFOS: 1.6 (-0.8, 4.1) increase in SRS score per 2-SD increase. PFHxS, 1.0 (-1.2, 3.3) increase; (decreased SRS score for PFOA)
Strøm 2014 Denmark
876 adolescents∆ 21.4
3.4
ADHD (3.1%) Depression (11.9%) Scholastic achievement
HRs < 1.0 3rd tertile: PFOS HR=1.16 (0.69, 1.95); PFOA HR=1.03 (0.61, 1.73) Slight decrements for PFOS and PFOA
Chen 2013 Taiwan
239 children aged 2 years Cord blood PFASs
7.4 2.6 Developmental delay PFOS associated with deficits in development scores, especially for motor development: gross-motor domain, IQR= -3.7 points (-6.0, -1.5); OR for poor performance= 2.4 (1.3, 4.2). (Slight deficits to null findings for PFOA)
Forns 2015 Norway
843 toddlers Breast milk PFASs
0.11 0.04 Developmental delay PFOA, >median: OR=1.25 (0.81, 1.95); PFOS, OR<1.0
Gump 2011 Oswego, NY
83 children, aged 9-11 8.79 3.67 3.28 Response inhibition All PFASs measured reduced inhibition
Vuong 2016 Cincinnati, OH
256 mother-child pairs (maternal serum measured , 2nd trimester) Children aged 5 and 8 years
12.6 1.4 5.3 Executive function: Behavioral regulation Metacognition index Global Executive composite
3rd tertile, ORs (clinical relevance): PFOA PFOS PFHxS 1.36 (0.55, 3.35) 2.45 (0.91, 6.56) 2.03 (0.80, 5.18) 1.06 (0.43, 2.60) 2.17 (0.85, 5.51) 1.53 (0.63, 3.74) 1.25 (0.51, 3.08) 2.42 (0.92, 6.35) 2.31 (0.91, 5.88)
Dong 2013 Taiwan
225 children, 12-15, w/asthma 33.9 2.5 1.2 Asthma 4th quartile, PFOA: OR=4.05 (2.21, 7.42) 4th quartile, PFHxS: OR=3.83 (2.11, 6.93) 4th quartile, PFOS: OR=2.63 (1.48, 4.69) 4th quartile, PFNA: OR=2.56 (1.41, 4.65)
231 children, 12-15, controls 28.9 1.3 0.5

161
Reference, Location
Study population PFOS serum level
PFHxS serum level
PFOA serum level
Outcome Difference detected (95% CI)
Stein 2016a NHANES
1,191 children aged 12-19, 1999-2000, 2003-2004 640 children (2005-2006)
20.8 15.0
2.47 2.09
4.13 3.59
MMR antibody PFOS: among seropositives, a 13.3% decrease in rubella antibody (-19.9, -6.2), and a 5.9% decrease in mumps antibody (-9.9, -1.6). (declines also for PFOA and PFHxS for rubella, & PFOA for mumps)
Allergic conditions PFOA: OR=1.28 (0.81, 2.04) for asthma (similar findings for PFOS and PFNA); OR=1.35 (1.10, 1.66) for rhinitis. For rhinitis, PFOS OR=1.16 (0.90, 1.50) and PFNA OR=1.24 (0.97, 1.60). PFOS & PFOA sensitivity to mold; PFOA sensitivity to rodents
Humblet 2014 NHANES
1,877 aged 12-19 years (1999-2008) Current asthma Wheeze
PFOA, 3rd tertile, OR=1.18 (0.90, 1.53). (ORs for PFOA, PFNA and PFHxS < 1.1.) For wheeze, all ORs for the PFAS chemicals were <1.1)
Goudarzi 2016 Japan
1,558 mother-child (aged 4 year) pairs. Maternal serum PFAS at 3rd trimester
4.9 0.28 2.1 Eczema, wheezing, rhinoconjunctivitis
For total allergic diseases, 4th quartile ORs for PFOA, PFOS, PFHxS and PFNA < 1.00. For wheezing, PFOA OR=1.09 (0.73, 1.65) (elevation in boys only); for PFNA, OR=1.11 (0.76, 1.63) (elevation in boys only). For PFOS and PFHxS, ORs < 1.00
Granum 2013 Norway
99 prenatal blood samples; 50 children aged 3 years
5.5 0.3 1.1 Rubella Gastroenteritis Common cold
PFOA & PFHxS: β= -0.4 optical density (-0.64, -0.11) PFOS: β= -0.08 optical density (-0.14, -0.02) PFNA: β= -1.26 optical density (-2.32, -0.20) (regression coefficients were also negative for measles but confidence intervals were wide) PFOA & PFHxS: ORs > 3.0 (CIs were very wide) PFHxS: OR=1.71 (0.20, 14.8)
Buser 2016 NHANES
Children aged 12-19, 2005-2006, 2007-2010
Food allergies, sensitization (IgE)
4th quartile ORs Self-reported allergies food sensitization PFOA: 9.09 (3.32, 24.9) 1.23 (0.57, 2.65) PFOS: 2.95 (1.21, 7.24) 0.74 (0.23, 2.40) PFHxS: 3.06 (1.35, 6.93) 1.17 (0.56, 2.44) PFNA: 1.73 (0.54, 5.52) 0.51 (0.28, 0.92)

162
Reference, Location
Study population PFOS serum level
PFHxS serum level
PFOA serum level
Outcome Difference detected
Wang 2011 Taiwan
244 children, aged 2 years Cord blood
5.5 0.04 1.71 Atopic dermatitis PFOS, 4th quartile: OR=2.19 (0.78, 6.17). OR for PFOA and PFNA < 1.00
Dalsager 2016 Denmark
346 children aged 1-3 years. Maternal serum PFAS <16 weeks gestation
8.07 0.32 1.68 Fever Fever & cough
3rd tertile ORs (above median proportion of days) PFOS: 2.35 (1.34, 4.11) PFOA: 1.97 (1.07, 3.62) PFHxS: 1.29 (0.72, 2.28) PFNA: 1.49 (0.86, 2.59) 3rd tertile RRs (# days with fever) PFOS: 1.65 (1.24, 2.18) PFOA: 1.12 (0.82, 1.54) PFHxS: 1.20 (0.89, 1.62) PFNA: 1.12 (0.84, 1.49) 3rd tertile RR (fever & cough, # of episodes) PFOS: 1.33 (0.99, 1.80) PFOA: 1.11 (0.80, 1.56) PFHxS: 1.13 (0.82, 1.55) PFNA: 1.02 (0.76, 1.38) 3rd tertile RR (# episodes of diarrhea) PFHxS: 1.71 (0.92, 3.16) PFOS: 1.19 (0.67, 2.12) PFOA: 1.08 (0.55, 2.13)
Grandjean 2012 Faroes
532 children aged 5 years 16.7 0.63 4.06 Inadequate antibody (<0.1 IU/mL), age 7)
ORs Tetanus (age 5) Diphtheria (age 5) PFOA: 4.2 (1.5, 11.4) 3.3 (1.4, 7.5) PFOS: 2.6 (0.8, 8.9) 2.4 (0.9, 6.4) PFHxS: 1.8 (1.1, 2.9) 1.5 (1.0, 2.3) PFNA: 1.6 (0.7, 3.6) 1.8 (1.0, 3.4)
Grandjean 2016 Faroes
515 children aged 13 years 6.7 0.4 2.0 Diphtheria antibody % change per doubling of age 7 serum PFAS PFOS: -31.1 (-49.8, -5.4) PFOA: -9.4 (-31.1, 19.2) PFHxS: -19.5 (-34.7, -0.7) PFNA: -17.4 (-33.7, 2.8) (Tetanus had increased % change for PFAS)
Geiger 2014b NHANES
1,655 children, 1999-2000, 2003-2008 (aged 12-18)
Hypertension 4th quartile OR: PFOS: 0.69 (0.41, 1.17) PFOA: 0.77 (0.37, 1.61)

163
Reference, Location
Study population PFOS serum level
PFHxS serum level
PFOA serum level
Outcome Difference detected
Domazet 2016 Denmark
590 aged 9 years 444 aged 15 years 369 aged 21 years
42 21.5 10.5
9.3 3.5 2.9
adiposity PFOS serum levels at age 9 was associated with indicators of adiposity in adolescence and young adulthood. PFOA serum levels at age 9 was associated with decreased β-cell function in adolescence. Later exposures were not associated with indicators of adiposity or glucose metabolism.
Mora 2016 MA
1,006 children in early childhood (3-6 years), 876 mid-childhood (6-11)
24.7 2.3 5.6 BMI, skinfold thickness, total fat mass index, waist circumference
Among girls, each interquartile increment of prenatal PFOA was associated with 0.21 kg/m2 (-0.05, 0.48) higher BMI, 0.76 mm (-0.17, 1.70) higher sum of subscapular and triceps skinfold thickness, and 0.17 kg/m2 higher total fat mass index. Similar findings for PFOS and PFHxS. No associations with boys.
Karlsen 2016 Faroes
444 children at 18 months 371 children at 5 years Maternal 2-week postpartum serum
4.68 8.04
0.34 0.19
2.22 1.37
Overweight 3rd tertile ORs age 18 months age 5 years PFOS: 1.24 (0.98, 1.57) 0.94 (0.53, 1.66) PFOA: 1.10 (0.84, 1.46) 1.88 (1.05, 3.35) PFHxS: 1.24 (0.97, 1.58) 1.22 (0.73, 2.04)
PFASs serum levels are in micrograms per liter (µg/L) SHBG: sex hormone-binding globulin. (Note: Testosterone circulating in the bloodstream is mostly bound to SHBG. Endocrine disruptors may bind to SHBG displacing reproductive hormones and affecting their bioavailability.) FSH: follicle stimulating hormone ¶ 5th vs 1st quintile ¥ PFNA=0.91 µg/L geometric in the Taiwan study, and 0.92 µg/L among Pease Tradeport children. ∆ The PFASs levels are for the mothers of this study population during their pregnancies. € 89 of the children were tested at both ages (“paired children”). Ѱ high score on a screening test for hyperactivity/conduct problems; low scores on developmental coordination screening test. ø change in IQ with a doubling of PFASs level (Wang 2015) Note: For the Nelson 2010 study, a monotonic dose-response was observed only for total cholesterol and PFOS among males 12-19. The average differences in the table are based on the highest difference observed regardless of quartile observed (i.e., the largest difference could appear in quartiles 2, 3 or 4). For PFHxS, the highest quartile was negative for total cholesterol but there was considerable inconsistency between quartiles. Note: For the Fei 2011 study, total scores for hyperactivity/behavior problem

164
Comments from the Pease CAP on the 5/23/17 draft Feasibility Assessment for Epidemiological Studies at Pease International Tradeport, Portsmouth, NH, and ATSDR responses
A large number of comments on the 5/23/17 draft of the Feasibility Assessment from individual members of the Pease CAP were received by ATSDR. ATSDR consolidated the comments and provided the following responses. Comment: Evaluate the health endpoints against the full spectrum of PFAS, not just PFOS and PFHxS. Although PFOS and PFHxS were the highest PFCs in the Pease population, there are others that came back higher in the Pease population when compared to the national averages such as PFOA and PFNA. Current testing for PFAS in water does not include many PFAS often found in AFFF-contaminated groundwater. In order to more thoroughly characterize PFAS exposures at Pease prior to May 2014, would it be feasible to analyze a more extensive suite of PFAS, including novel PFAS, by researchers who specialize in AFFF contamination in samples of groundwater (monitoring wells or from the Haven well) and serum samples? Response: The draft feasibility assessment emphasized PFOS and PFHxS because these were the two PFAS with the highest concentrations in the Haven Well and were the most elevated in serum among those who participated in the New Hampshire Pease blood testing program. Additionally, PFOS and PFHxS were notably elevated compared to NHANES data. However, ATSDR intends to measure all PFAS in serum and possibly urine for which analytical methods are currently available, and we expect analytical methods to improve by the time a study is begun. We will not sample or analyze groundwater but will rely on samples taken by the water utilities and/or DOD and other agencies to inform our exposure assessments. Comment: The Pease community wants a longitudinal study design, registry, and surveillance program because PFAS are persistent and have long half-lives. The community wants to be monitored over time. If a cross-sectional study is the best way to begin, it should be noted as such. Please explain the different phases and step associated with what comes after the “first” study. Develop a multi-site longitudinal preconception birth and children’s cohort. This would provide the necessary sensitivity and statistical power to investigate the other proposed outcomes. Examples of exposure and health outcomes that are useful and sensitive to the proposed study design are outlined below:
• Preconception: Measures of maternal and paternal exposures and health including fertility, miscarriage, thyroid function, and sex hormones
• Birth cohort: Measures of infant and maternal exposure and health including fetal growth, birth outcomes, thyroid function, pregnancy induced hypertension, post-partum depression, breastfeeding duration, and biomarkers in breast milk
• Children’s cohort: Measures of exposure and health from early life through puberty including IQ/neurobehavioral, asthma and atopic dermatitis, rhinitis, antibody response, ADHD, ASD, delayed puberty, thyroid function, and cholesterol
• Impacts to the immune system with children (especially with prenatal and early life exposure)

165
Response: ATSDR appreciates the concern about long term effects of PFAS exposures and the Pease community’s desire for longitudinal studies. Our first priority is to conduct cross-sectional studies of the children and adults at Pease. A longitudinal study could then be conducted to evaluate future health effects and make comparisons with the results of the cross-sectional study. If sufficient funding becomes available, we will consider conducting prospective longitudinal studies (following participants into the future). This was the approach for the C8 studies. In order to conduct longitudinal studies, the contact information for individuals must be updated when they move so they can be re-contacted for questionnaire interviews and additional blood samples. If funding is available, a “registry” or updated mailing list could be established for this purpose. Collecting the person’s social security number, full name and date of birth would facilitate linkages with cancer registry and hospital discharge databases. If current contact information can be collected over time (e.g., if the participant can name 1-2 people who will know where to find the participant), then children and adults could also be periodically surveyed to obtain disease information. For military service and civilian worker populations at military bases that had PFAS drinking water contamination, ATSDR is considering conducting a retrospective longitudinal study to evaluate causes of mortality and possibly cancer incidence (to see if past exposures resulted in current diseases). This would be a data linkage study that does not involve contact with participants. This type of study is discussed in the draft. ATSDR is not at this time considering a longitudinal surveillance program. The draft feasibility assessment concluded that if multiple sites in addition to Pease were included in a cross-sectional children study, then it was possible to evaluate the most of the diseases mentioned among children with sufficient statistical power and precision. The assessment also concluded that pregnancy-induced hypertension could be evaluated in a multi-site adult cross-sectional study. The assessment did not evaluate the feasibility of studying infertility but did conclude that endometriosis could be evaluated in a multi-site cross-sectional study. The feasibility assessment concluded that immune effects in children such as asthma and atopic dermatitis would likely require a larger sample size than can be achieved at Pease to achieve sufficient statistical power. To study antibody responses to vaccines such as diphtheria and tetanus, a multi-site study would be required. The assessment did not address birth outcomes because such endpoints were not feasible at Pease and may not be feasible even with a multi-site study. Studying birth outcomes may only be feasible at sites where large populations such as entire cities were served with PFAS-contaminated drinking water over a long period. Although ATSDR currently is not considering establishing a birth cohort and following it longitudinally, other researchers, e.g., NIEHS-funded studies, have established birth cohorts exposed to “background” PFAS levels that are being followed. Comment: Consider studying: cardiovascular disease, thyroid disease, hypertension, osteoarthritis and osteoporosis, endometriosis, liver disease (including non-alcoholic fatty liver disease), kidney disease, rheumatoid arthritis, lupus, multiple sclerosis, thyroid function, cholesterol, lipids, potential endocrine disrupting impacts, sex hormone impacts, cancers in both children and adults (including consideration of incidence of brain cancers, RMS & PPB in children) and fertility issues from PFAS with both men & women Response: Effects of endocrine disrupting chemicals are wide-ranging and include adverse effects on thyroid function, sex hormones, and fertility endpoints, as well as diseases such as endometriosis and

166
cancers of the breast and prostate. The feasibility assessment evaluated the possibility of studying some of these endpoints at Pease. A larger sample size than can be achieved at Pease alone is likely needed to evaluate thyroid function in children and adults as well as sex hormones in children and endometriosis in adults with sufficient statistical power. The feasibility assessment concluded that lipids can be evaluated in both children and adults at Pease. To evaluate cancers, a multi-site study would be required. The feasibility assessment draft did not address early markers of fatty liver disease. We plan to address these biomarkers in the final version. To evaluate liver function, liver disease, and kidney disease, a multi-site study would be necessary. Comment: Page 19 notes that the younger age limit of 4 was selected because of the appropriate age range for testing IQ. However, younger children may experience elevated exposures in utero and via breastfeeding from mothers who worked at the Tradeport prior to 2014 and continue to have elevated body burden due to the long human half-lives of PFOS and PFHxS. Could the age range for children be lowered from age 4 (even if child was not at daycare on Pease, many mothers were exposed) and expanded to age 17? Is it feasible to include younger children (under age 4) when assessing endpoints other than IQ? Response: We realize that those < age 4 at the start of the study may have elevated PFAS serum levels, but this fact alone is not sufficient to include those aged <4 in the study. Expanding the age range would add few additional children into the study and would not change the health endpoints that are feasible to study using the Pease population alone. However, we will consider expanding the ages for the children study, but our decision will be based on the endpoints that will be evaluated as well as the degree of difficulty convincing parents of very young unexposed children to allow their children to participate. We will also consider whether it is appropriate to draw blood from those aged <4 years, the amount of blood necessary to measure and evaluate the effect biomarkers. Comment: Consider studying the endpoints listed as “not feasible to study” at Pease as part of a broader/national study. For both the children and adult proposed studies, the second tier entitled “Health-related endpoints that may be possible to study (although a larger sample size from the Pease community will likely be needed,” a) When will we know when a larger sample size will be needed, and b) Please associate an estimated number that that larger sample size would need to be For both the children and adult proposed studies, the third tier entitled “Health-related endpoints not feasible to study,” would these endpoints need to be included in a national study? The health related endpoints in this tier for both the children and adult studies are the big ticket health endpoints that our community is worried about. This study design should be started right away. a) Are there current plans for a national study underway? b) Will the Pease CAP and community have input to that study? c) Who will be conducting that study? d) Can the national health study for these tier 3 endpoints be noted in writing in the Pease Study design that a national health study will be conducted and Pease will be a part of it? e) If there are not plans in place for a larger sample size when the Pease study starts, will this data still be proactively collected in the event a larger population is identified and participates in the study in the future? Or will this data be collected at a later time and only when a larger population is identified and enrolled in the study?

167
Response: Depending on available resources, ATSDR plans to conduct multi-site (or national) studies of PFAS-drinking water contamination that would include the Pease population. This will permit the study of health endpoints in the second tier. For the final version of the feasibility assessment, the sample sizes needed for each endpoint in tier 2 and tier 3 will be included. Our first step is to prepare protocols for pilot studies of children and adults at Pease that will be used to inform the multi-site studies. The Pease CAP will have the opportunity to provide input for the study protocols. ATSDR has not decided how the studies will be conducted. In the past, ATSDR has used contractors to conduct the recruitment and data collection for studies. ATSDR then receives the data from the contractors, analyzes and interprets the data, and prepares reports and/or journal articles. The Pease population will be included in any multi-site or national study of PFAS-contaminated drinking water. The resulting sample size should enable the evaluation of most if not all of the health endpoints in tier 3. A multi-site study that includes the Pease populations would include neurobehavioral testing. The serum samples will be analyzed for all the effect biomarker endpoints listed in the feasibility assessment including those that are listed as not feasible to study at Pease alone. In addition, the consent form for the study will request permission to archive the serum samples so that additional effect biomarkers as well as PFAS chemicals can be analyzed if necessary in the future. This will be made clear in the protocol for the study. Comment: Study former military/civilian population from PAFB and children (now adults) from Discovery Enrichment Center or from schools for military children on base from years ago – these are important to consider regarding latency of endpoints seeing that they could have been exposed at the highest doses and for extended periods of time. Response: We are considering studying former military and civilian workers at Pease and other military sites. This is discussed in the draft feasibility assessment on page 41. ATSDR is in the process of identifying military bases that had PFAS-contaminated drinking water and could be included in a national study of military and civilian workers. We can include those who attended daycare at Pease in the adult study if the daycare centers have information sufficient to track and locate these individuals (e.g., full name, date of birth, sex, and if possible, social security number). Similarly, if the schools have records of students that contain sufficient information to track and locate these individuals, they could be included in the adult study. Comment: Children endpoints considered a lower priority/possibly not include (not that they are not important, but think it would help to lower # of endpoints to reduce time and financial commitments for this study): • Overweight/obesity • IQ/neurobehavioral (would eliminating this also allow a lower population age range?) (also cohort for these being studied by NIEHS?) • ADHD • Autism (longitudinal cohort being analyzed by NIEHS) * Based on feedback, I also think it will be a challenge for parents to allow access to children’s school
records if they are a requirement for some of these endpoints, possibly impacting recruitment numbers

168
Response: We believe that neurobehavioral effects may be important to study, especially effects on executive function and attention. A few studies have found associations between exposures to PFAS and these endpoints. Although NIEHS may be evaluating these endpoints, the cohorts have lower PFHxS and PFOS exposures than the Pease population. As stated above, expanding the age range for children will not add appreciably to the sample size, and it may not be appropriate to draw the amount of blood necessary for PFAS and effect biomarker analyses from those aged <4 years. Studying autism would require a larger population than at Pease to achieve sufficient statistical power, and access to student records would be necessary. It is possible to evaluate ADHD via questionnaire, as was done in the C8 study and NHANES study, although access to school records would be useful to confirm the diagnosis. Overweight/obesity can be ascertained via questionnaire, and is worth studying because a few studies have found associations. Comment: With a broader national study, is it possible to not eliminate participants based on TCE being a confounding factor, but instead use it as a study focus in combination with PFAS? (TCE seems to be just as common as PFAS on military installations, so it may be important to study how being exposed to a combination of both these classes may increase people’s risks to certain cancers/diseases). Response: Before we attempt to study any interaction effects of exposures to both TCE and PFAS chemicals, it is important first to establish the health effects of PFAS exposures. Most populations will not be exposed to both TCE and PFAS chemicals. Even at military installations, TCE contaminated drinking water is not very prevalent. Therefore, we will attempt to identify populations exposed to PFAS-contaminated drinking water who are not also exposed to TCE and other solvents. On the other hand, some PFAS-contaminated drinking water may also have disinfection byproducts such as chloroform and trihaloacetic acids. These disinfection byproducts will be taken into account as possible confounders in any analyses. Comment: Consider that adult females that were exposed may have lower PFAS levels due to menstruation and nursing Response: In the protocol, we will discuss methods to take into account the elimination of PFAS from the body due to menstruation, pregnancy and nursing, as well as other ways that PFAS may be eliminated (e.g., blood transfusions). Comment: Look at potential study focuses for the shorter chain PFAS that were measured in Pease serum to expand data on potential effects Response: We intend to measure all the PFAS chemicals that can be currently analyzed in serum and urine. We also intend to archive serum and urine samples for future analyses of PFAS chemicals. Comment: In my opinion, this assessment will be limited by the number of persons available at Pease, and will not be the best means to provide data relative to all of the health impacts that our affected families are interested in so they can best monitor with their health providers. As such, I believe that it is imperative that this study be developed as a pilot program for a national study to include other affected populations so that this opportunity to gather meaningful health information for the affected public is not missed. Response: We agree and plan to have Pease be a pilot study for the national study that will include other sites with PFAS-contaminated drinking water in addition to Pease.

169
Comment: While this is not directly under the scope of ATSDR, we must advocate to all available resources to find funding. In my own opinion, the Department of Defense has admitted fault, and also has an obligation to remediate the site and contaminants. In my opinion that includes contaminants in an affected population, not just in the physical property itself. Response: No response needed. Comment: In terms of the non-exposed populations for the comparison groups: a) Why are we restricting ourselves to just Portsmouth? Can we open this up to the Seacoast area? b) What protocols or precautions will be taken to ensure that the “non-exposed” population is really non-exposed? For example, parts of Portsmouth have been affected by PFCs. There are low levels of PFASs in two Portsmouth municipal wells (Portsmouth well and Collins well). These two wells are in the southern well field with the three Pease wells (Smith, Harrison, and Haven well). If we are taking the non-exposed from these parts of Portsmouth wouldn’t the results be skewed? We have learned at a recent PFAS conference at Northeastern University in June 2017 that health effects are being discovered in populations with low level PFAS exposure. Is there another community nearby that should be considered as a control group that does not have known low level of PFAS in their drinking water? The city of Portsmouth gets water from many sources (not just the Portsmouth & Collins well). Would it be in the scope of ATSDR to perform water modeling on the low level PFAS in the two Portsmouth municipal wells to determine how much PFAS exposure a Portsmouth resident was receiving while drinking municipal water? Would this be factored into the control group design? Could this bias the results of the control group? Response: Except for exposure to PFAS-contaminated drinking water, the non-exposed population should be as similar as possible to the exposed population on age, sex, socio-economic factors, occupations, environmental exposures, and other potential risk factors. We anticipated that members of the Portsmouth population who never worked or attended day care at Pease would be an excellent non-exposed comparison population. However, if we find that members of the Portsmouth population also received PFAS-contaminated drinking water, then it may be necessary to identify another population unexposed to PFAS-contaminated drinking water with similar characteristics as the Pease population. ATSDR will take into consideration the PFAS concentrations in the Portsmouth public drinking water supply before deciding on whether Portsmouth residents can be used as comparison populations for the childhood and adult studies at Pease. If necessary, water modeling will be conducted to determine the PFAS concentrations in the Portsmouth water supply. Comment: NH recently admitted publicly that PFCs are migrating from the Coakley Landfill/Dump to residential wells and that the Air Force disposed of industrial waste there. (Previously the AirForce said it was only household waste that they disposed of at Coakley.) Does this recent development change the definition/scope of the exposed population? If so, that may change the endpoints that would be feasible to study as that would increase the sample size. Response: If residential wells have been contaminated with PFAS leaching from the Coakley landfill, then we would consider including in the study those residents with contaminated wells. However, at present we are not aware of any wells currently impacted by the leachate.

170
Comment: Adult study age starts at age 18. Children study age end at 16. Please include anyone who will be 17. Response: The feasibility assessment now includes those aged 17 in the children study. Comment: What about including the children who were either developing in utero or were breastfed by mothers who worked on Pease who never attended daycare on Pease and will not be 4 when the study starts? PFAS pass through the placenta and through breastmilk so these children were also exposed. Response: Currently, the draft feasibility assessment includes children exposed in utero or via breastfeeding if their exposures occurred prior to the closing of the Haven Well (i.e., exposure occurred prior to June 2014) and their ages are between 4 and 16 years at the time of the study. Comment: After all comments are compiled and the assessment is in a more final stage, what is the review process for the Pease CAP and community to see the next draft? Will that need to be approved by the CDC again? Response: The final version will need to complete the clearance process including CDC review. Any proposed changes to the feasibility assessment, and responses to the comments received, will be discussed with the CAP prior to finalizing the document. Comment: Will a detailed timeline be provided as to when the study would start, research would begin and a report drafted? Response: Timelines will be included in the protocols for the studies. Comment: Is there any data/value that you can gain by receiving the blood samples from NHDHHS’s blood sampling program? Given NH DHHS’s blood sampling program is still open, would it be beneficial for NH DHHS to consent the new people and take more blood to be a part of this? Has it been determined that if those PFAS samples from 2015 are still available? And assuming new consent can be obtained from the participants, is there any valuable data that can be extracted from these blood samples that were taken at a critical window in time shortly after the PFAS exposure was identified? Response: Because the consent form for the NH blood sampling program did not mention analyses other than PFAS measurements and did not request permission to provide ATSDR (or any other entity other than the NH DHHS) with the blood samples, ATSDR cannot access these samples for further analyses. However, the PFAS results for each individual who participated in the 2015 or 2016 blood sampling program are useful for the proposed studies, and the consent form for the proposed studies will request access to these results from the individual participant or, if necessary, from the NH DHHS. The sample sizes would be too small to be beneficial. Also, the amount of blood being drawn is insufficient for the effect biomarkers being considered. Comment: Would it be feasible to archive blood samples from each participant for future analyses with more extensive target analyte lists, and possibly other biological endpoints? Response: Yes. We plan to include in the consent form a request for archiving the samples. Comment: PBPK modeling? What is that?

171
Response: Physiologically based pharmacokinetic (PBPK) modeling is a mathematical technique for predicting the absorption, distribution, metabolism and excretion (ADME) of chemical substances in humans and animals. In the C8 study, PBPK modeling was used in conjunction with information on the drinking water contaminant levels of PFOA, the residential history, water consumption habits, and the cross-sectional serum PFAS levels in order to historically reconstruct PFAS serum levels. The historically reconstructed PFAS serum levels were used to estimate cumulative exposures as well as estimate PFAS serum levels during critical periods in the past (e.g, in utero exposure). Comment: Should the study results show that a health endpoint was possibly or conclusively the result of PFAS exposure, will a medical monitoring protocol be provided? Can this be written into the study as a follow up/next steps? The community has continuously advocated for ongoing medical monitoring to diagnose adverse health effects early and limit the impacts of the disease process on their health. This very important point should be mentioned in the feasibility assessment as it is a significant community request of ATSDR when addressing the health questions and concerns of the community. The point was made clear several times in the feasibility assessment that a health study may not find conclusive evidence of health impacts in the studied population. That point is all the more reason that medical monitoring is critical for the impacted community despite a health study or in combination with a health study. Response: Medical monitoring is a separate issue and outside the scope of the feasibility assessment. The feasibility assessment focused on whether epidemiological studies were feasible to conduct at Pease, and if so, what studies might be feasible. As stated above, medical monitoring is a separate program and is not part of an epidemiological study. The epidemiological study will be evaluating endpoints that might be included in a medical monitoring program (e.g., lipids, liver and kidney biomarkers). But these endpoints will all be evaluated in the same fashion (e.g., same method of collection, same lab and same analytical methods) in order for the results to be comparable. This does not occur with medical monitoring. Comment: There are adults now that were exposed to PFAS at Pease while in daycare in the later 1990's and early 2000's. Where would this demographic fall into the study as they were exposed as children, but are now adults in their 20's and never worked on Pease. This is a valuable population to study as they were exposed many years ago and their data may offer insight into the potential long term health effects many years after an exposure as a child. Response: ATSDR will consider including these adults in the multi-site study when developing the protocol for the pilot studies at Pease. However, there is concern that those who attended daycare and are 18 years of age or older at the time of the study will be last exposed to the contaminated drinking water 13 or more years ago, and therefore their PFAS serum levels will only poorly reflect their drinking water exposures when they attended daycare. If ATSDR determines that it is possible to accurately reconstruct historically their PFAS serum levels using modeling methods, then these adults could be included. Comment: Many of the children that attend daycare on Pease have one parent that works on Pease and one parent that does not. Is it possible to identify these families and use the parent/adult that is not working on Pease in the control group?
172
Response: As part of the development of the protocol for the adult study, ATSDR will consider including the adult family member who did not work or attend daycare at Pease in the comparison population. Comment: The feasibility assessment states that comparison military bases would include those with no PFAS-contaminated drinking water or drinking water contamination from other chemicals above the U.S. Environmental Protection Agency’s maximum contaminant levels (MCLs). Does a military base like this exist given the widespread use of AFFF by DoD in multiple branches of the military? Are there considerations by ATSDR to study veterans from Pease and other DoD bases with known PFAS expsoure? Response: Although many bases used AFFF, much fewer had PFAS-contaminated drinking water. It may be possible to conduct a study comparing bases with and without PFAS-contaminated drinking water. Pease would be included in a study of military bases. Comment: What happens if the study is funded and despite recruitment efforts, there is not enough community enrollment to meet the sample size of 350 children and 1500 adults? Will the study start? Response: Yes, the study will start. Our current position is that the Pease studies of children and adults will be pilot studies for the larger national PFAS studies. Comment: What is current plan to recruit study participants from other impacted PFAS sites? Residents from several communities in Pennsylvania have expressed interest in being part of a national PFAS study. Veterans and residents around the Wurtsmith Air Force Base in Oscoda, Michigan, have also expressed interest in being part of a national study. How can these communities be recruited to be part of a larger study that includes Pease community members to look at the endpoints that require larger numbers to study? Response: Our current plan is to conduct pilot childhood and adult studies at Pease and to include other sites if sufficient resources become available. We would evaluate the same endpoints at Pease as we plan to do with these additional sites. Comment: The feasibility assessment states "The feasibility of successfully evaluating particular health-related endpoints (or effect biomarkers) could change depending on final study design and goals.” When do these changes occur in the timeline of the study (before or during the study) and how is the CAP, community, and participants informed of these changes? Response: These changes would occur as ATSDR develops the protocols for the pilot studies at Pease. The CAP will have an opportunity to comment on changes that occur as the protocols develop. Comment: What treatment was put in place for TCE to make the wells "back in operation" in the fall of 1978? Why were the wells allowed to be in operation from 1978 through 1986 despite the TCE levels "did not remain consistently below the current U.S. Environmental Protection Agency (EPA) maximum contaminant level (MCL) in drinking water of 5 µg/L until January 1986"? Response: These are questions better directed at the USAF staff with historical knowledge about Pease.

173
Comment: How has the AFFF use impacted the other two Portsmouth municipal wells (Portsmouth and Collins well) in the southern well field where the three Pease wells reside? There are low level PFAS chemicals detected in these wells based on sampling done by the Air Force since 2014. Response: From information gathered, it does not appear the Portsmouth drinking water system was contaminated with PFAS. All of the Portsmouth water sources, as well as two locations in the water distribution system, were sampled for PFASs in May 2014 by the NHDES and during four rounds of the USEPA’s UCMR3 performed between July 2014 and April 2015. The sample results were all below the laboratory’s reporting limit for the PFASs tested. In June 2016 the NHDES requested all community water systems to voluntarily collect a water sample for PFOA and PFOS and share the results. Following this request, Portsmouth water operations staff sampled for PFOA and PFOS. A second round of sampling was performed in November 2016 and the Greenland water-supply well that supplies the Portsmouth water system with public drinking water was found to have an average level of 9 parts per trillion (ppt) of PFOS. This level of contamination is one order of magnitude lower than the U.S. EPA lifetime health advisory level (LTHA) of 70 ppt for combined PFOA and PFOS. It should be noted that the levels were also flagged by the laboratory as “J” values, which means that they were an estimate. Comment: Why was the Harrison well out of service? Response: This question is better directed to the Portsmouth Department of Public Works. Comment: The feasibility assessment states, "In 2013, sampling of monitoring wells at the former Pease Air Force Base fire training areas detected PFOS and PFOA above these EPA provisional health advisory levels." I think it's important to note that the PFAS levels in the 2013 sampling of monitoring wells were in some samples > 100,000 ppt for PFAS in the ground water. Response: On page 10, the Feasibility Assessment now provides additional information concerning the 2013 sampling. Comment: It is unclear to me why it took a year for the drinking water wells to be tested for PFAS when significantly elevated levels of PFAS (> 100,000 ppt) were discovered in the monitoring wells on the Pease Tradeport the year before. It would seem that the next logical and immediate step would have been to test the drinking wells as soon as possible when the monitoring wells were discovered to be very high. Response: This comment is better directed to the US Air Force. Comment: The feasibility assessment states "No water samples from the Pease Tradeport distribution system for PFAS testing are available before 2014." Has this been confirmed with the DoD that they did not sample for PFAS in the drinking wells prior to 2014? Response: That is our understanding. We will check with the DOD to make sure. Comment: Does ATSDR provide a list of contributors to the document (i.e. the specific staff that contributed to the document)? Or is the document released from ATSDR as a whole? Did anyone else other than ATSDR staff contribute to this document?

174
Response: No one other than ATSDR staff contributed to the document. The document is considered an agency-wide, ATSDR report and will not list contributors. Comment: How was the literature review and the data generated on the tables in pages 112 to 154 verified? Do multiple scientists validate this data? Is this part of what CDC reviews prior to clearing the document for public view? Response: The description of how the literature review was conducted is on page 77. The data are from the published studies that were accessed by the literature search. ATSDR assumes that the data contained in each published article has been validated by the article’s authors. As part of the agency clearance process, CDC staff reviewed the entire document. Comment: The feasibility assessment does not address an action plan in the event that the study shows conclusive health effects in the studied population. Is it possible to add an action plan as to what the community can expect for next steps if adverse health effects are identified in the study and they are diagnosed with one of those health effects? Response: The purpose of a feasibility assessment is to determine whether studies are feasible. A feasibility assessment does not address actions to be taken once studies are completed. Once the studies are completed, ATSDR will consider what additional steps need to be taken including whether medical monitoring is appropriate. Comment: Does ATSDR feel capable of conducting a national PFAS study on Pease and many other sites impacted by PFAS contamination should funding become available? Response: Yes Comment: Does ATSDR collaborate with other scientists, agencies, and members from academia when designing and performing health studies? If so, please describe that process? Involve intra and extramural researchers at the National Institute of Environmental Health Sciences (NIEHS) in designing and executing any health studies in order to leverage their expertise and experience conducting such studies. Response: On a few occasions, ATSDR has collaborated with other scientists and agencies on specific health studies. But more often, ATSDR conducts studies by itself, relying on contractors to conduct recruitment of study participants and data collection. ATSDR plans to have discussions with a group of experts with PFAS study experience to receive technical assistance in the development of study protocols. Comment: Page 10 notes the use of PFAS in the manufacturing of AFFF “through 2001.” PFAS continue to be used in AFFF, although newer formulations likely contain short-chain and other families of PFAS compounds. Response: We agree and have amended this sentence. Comment: The PFNA concentration in the Haven well water was 17 ng/L in April and May 2014. In 2015, the New Jersey Drinking Water Quality Institute established a PFNA MCL for drinking water of

175
13 ng/L. Was the documentation for the New Jersey guideline consulted to identify potential health endpoints linked to PFNA exposures? Response: No, we did not consult the New Jersey guideline. Instead, we consulted the epidemiological literature on PFAS to identify possible health endpoints for study. PFNA levels in serum in the Pease population were similar to PFNA levels in the NHANES data. Based on the 2014 sampling of the Pease supply wells, the concentration of PFNA in the distribution system would be less than 13 ng/L since the Haven well provides about half of the supply, the other two wells had non-detects for PFNA, and the water from all three wells were mixed at the treatment plant before entering the distribution system. Comment: Why use a 2:1 ratio of exposed:unexposed participants in the children’s study but a 1:1 ratio in the adult study? Response: Exact figures for the number of children who attended the two day care centers at the Pease Tradeport are not available, but it is possible that up to 1,000 children attended these centers from the dates of opening through 2016. On the other hand, the Tradeport employs almost 10,000 workers at any point in time since 1993, so the total number of workers who were employed at the Tradeport since its opening through 2014 is likely to be over 20,000. This difference in the sizes of the daycare and worker populations is also reflected in the demographics of the participants in the NH blood testing program at Pease. Three-quarters of the participants in the NH blood testing of the Pease population would be aged ≥18 years in 2018 when a possible study might begin (N=1,092 excluding firefighters). On the other hand, about 370 who participated in the program would be between the ages of 4 and 16 years in 2018. So the number of exposed children that could be recruited for a study would be considerably smaller than the number of exposed adults that could be recruited. Moreover, it was believed that it would be more difficult to recruit unexposed children than unexposed adults. Therefore, we used a 2:1 ratio for the sample size calculations for the children study and a 1:1 ratio for the adult study. Using a 1:1 ratio in the sample size calculations for the children study would not have changed the list of endpoints that were feasible to conduct at Pease. However, we will conduct sample size calculations using a 1:1 ratio for children and include that in the report. Comment: For the children’s study, would it be feasible to include fevers? As noted in Table A8, Dalsager et al. 2016 found more frequent fevers in 1-4 year olds with higher prenatal exposures to PFOS and PFOA and co-occurrence of fevers with coughing and nasal discharge. Response: For the children study, the draft feasibility assessment recommended an age range of 4 – 16 years which is different than the age range of 1-4 years in the Dalsager et al 2016 study. The sample size that was assumed to be feasible at Pease, i.e., 350 exposed and 175 unexposed, would be larger than the Dalsager et al study. We will consider fevers as an endpoint and will attempt to do a sample size calculation. Comment: Page 17 notes the potential for reverse causation between elevated serum PFAS and certain endpoints. A 2017 review by Rappazzo et al. notes that elevated PFAS exposures have been associated in some studies with delayed age of menarche, which, in turn, may lead to relatively high serum PFAS since blood loss during menstruation can decrease body burden. Should age of menarche be included in regression models for girls in the children’s study? Response: This comment is more appropriate for a protocol for the study. We will be obtaining this information in the questionnaire because we are considering evaluating age at menarche as an endpoint

176
(i.e., delayed puberty). If age at menarche is a risk factor for a particular endpoint, then it would need to be evaluated as a potential confounder and included in regression models if necessary. Comment: Page 21 notes the role of NH DHHS in assisting with recruitment of participants. Has DHHS committed to providing this assistance? Response: We will approach NH DHHS once we obtain funding for a study. Comment: Page 24 describes the method for estimating PFOA and PFOS over a child’s life for children exposed at Pease. How will exposures in utero and through breastfeeding be included in these calculations? Response: This comment is more appropriate for a study protocol. In developing the protocol, we will consult with researchers who have modeled PFOA serum levels and evaluate strategies for including in utero and breastfeeding exposures in the historical reconstruction of serum levels. Comment: Page 24 also notes that serum levels in the unexposed comparison group can assist in that modeling. However, background levels in the unexposed group are shifting as population-wide exposures to long-chain PFAS have decreased, and exposures to replacement compounds have increased. Is it feasible to model the levels of PFAS across the lifetime of children in the unexposed group? Response: Yes. This was done in the C8 study for PFOA. We would take into account the decline in PFOS and PFOA levels as indicated by NHANES data. Comment: Page 29 describes the sample sizes in other pediatric immune system studies. The Grandjean 2012 study evaluated a cohort of children that were all the same age, evaluated at ages 5 and 7. Antibody levels vary substantially over time following vaccination, and are best evaluated during a relatively narrow window of time (e.g., 3 weeks post-vaccination). Is it feasible to evaluate antibody response to vaccinations in children within a narrower age range? Response: To evaluate vaccines such as rubella, tetanus and diphtheria, it would be necessary to evaluate children before and after their booster shots at around age 5, as was done in the Grandjean study. To obtain an appropriate sample size, it will be necessary to include children from other sites with PFAS-contaminated drinking water in addition to Pease. During the NH blood testing program at Pease in 2015, 28 children, 38 children and 54 children were aged one, two and three years, respectively. These children would be in the age range 4-6 in 2018, the age range that receives booster shots for these vaccines. Given that some children will not participate and others may have already received their booster shot prior to the start of the study, it is unlikely that more than 60 children will be available for study at Pease. Comment: For evaluating immune system effects, would participants be excluded if they are receiving immunosuppressant medications or have immune-related medical? Response: This comment is more appropriate for a study protocol. Certainly if these conditions are the endpoints under evaluation, we would not exclude children with these conditions. On the other hand, if the evaluation is of immune biomarkers that would be affected by these medications, then they may be excluded from the evaluation of these biomarkers.

177
Comment: Page 42 notes the considerations in developing a study of military personnel across sites. An additional challenge is that the mixture of PFASs present at each site is likely different, due to different formulations produced by various manufacturers. This is an important consideration because serum levels PFOS, PFOA, and other known PFAS are proxies for the mixture of PFAS at each site. How can the site-specific mix of PFASs be incorporated into a multi-site evaluation? Response: Studies of military personnel across sites will utilize modeling methods in order to historically reconstruct PFAS concentrations in drinking water. Ground water sampling data as well as drinking water data will be used in the modeling effort. It is likely that the formulations used for AFFF will be similar across military bases because of DOD requirements and bulk purchasing. Nevertheless, we will use the modeling results to assess exposures at each base. Comment: How will the results of blood testing for PFASs and other biomarkers be reported back to participants in a way that helps them interpret their results for both exposure and clinical measurements? Will community members have the opportunity to provide feedback about the format of the report-back? Investigate interventions for improving health outcomes such as measures to reduce cholesterol, treat thyroid disorders, nutritional supplements, and cancer screenings? Response: How the results are reported back to study participants will be addressed in the protocol. Community members would get an opportunity to provide feedback on the format of the reporting back of individual results. Interventions is not within ATSDR’s mandate, but ATSDR could encourage other researchers and other agencies (e.g., NIH) to pursue clinical trials for interventions. Comment: The evidence presented in this feasibility plan focuses on the results of epidemiological studies, yet these results are strengthened when considering results of toxicological studies in rodents and other animals that can support biologically relevant pathways. Toxicological studies can also provide compound specific health effects information, whereas interpretation of epidemiological studies can be complicated by complex mixtures in exposure media. Is it feasible to use the results of toxicological studies to prioritize health endpoints that seem most plausible, and to potentially identify additional endpoints that have not previously been considered in epidemiological studies? Response: Yes. We will consider toxicological information in order to identify and prioritize possible endpoints. Comment: As mentioned on page 41, assembling a multi-site cohort of military and civilian base employees may be able to achieve sufficient power to detect meaningful risk estimates for cancer and rare disease. This design has the benefits of efficiency and responsiveness to military and civilian base employees, and the notable limitation of accurate exposure assessment. Therefore, is it feasible to supplement investigation of these endpoints by also utilizing a prospective multi-site case-control study nested within the cross-sectional design that has been proposed or the longitudinal surveillance program and preconception birth cohort that have been suggested? Response: A case-control sample is useful to obtain additional information on exposure status and/or outcome status. However, it is not clear what would be accomplished by a nested case-control sample of either the military and civilian employee cohorts or the cross-sectional study populations in the adult and children study. For the military and civilian employee cohorts, we could ask cases and controls about their water consumption during the period when they worked or were stationed at the bases, but it is

178
unlikely that the information will be accurate given the length of time since they last were at the bases. We could also ask about their work or barracks locations when onsite, but we have found (from our experience conducting studies at Camp Lejeune) that this information also is unreliable because of the length of time that has passed. For the cross-sectional populations, we plan to collect serum to measure PFAS levels, and we plan to estimate historical serum levels using information from the questionnaire on water consumption and history at the site. So a case-control sample is unnecessary to improve the exposure assessment. Moreover, a case-control sample is not necessary to improve outcome ascertainment in the cross-sectional studies. On the other hand, a case-control sample might be useful in the evaluation of specific birth defects and childhood cancers in large populations exposed to PFAS-contaminated drinking water and comparison populations. Residential histories and drinking water consumption prior to and during the pregnancy and during the child’s early years of life could be obtained via interview of case and control mothers. The accuracy of such information will depend on how far in the past the pregnancies occurred. Comment: Aqueous film forming foam (AFFF) is a hugely complex mixture with a composition that has varied over time and with company of origin. The mixture in groundwater will depend on these factors as well as mitigating geological factors. This variability will also translate to variability in exposures that will have occurred between sites, likely increasing the impact of exposure misclassification bias. Therefore it is important to fully characterize the mixture of contaminants that was in the drinking water as well as the most appropriate combination of exposure biomarkers. Response: It is likely that military bases used similar formulations of AFFF. We will use recent ground water and drinking water sampling results at these bases to estimate PFAS drinking water concentrations in the studies of military and civilian worker personnel who were stationed or employed at these bases. For the children and adult studies, we will analyze all the PFAS for which methods are available, in serum and urine.


