Feasibility Study Decentralized Water Reclamation & Reuse This document explores the feasibility and economic viability of decentralized water reclamation and reuse using ecologically designed water treatment technologies at Georgia Tech’s main campus in Atlanta, Georgia. Sustainable Water Consultants • 23 W. Broad St. • Suite 303 • Richmond, Va • 23220
Transcript
Feasibility Study Decentralized Water Reclamation & Reuse
This document explores the feasibility and economic viability of decentralized water reclamation and reuse using ecologically designed water treatment technologies at Georgia Tech’s main campus in Atlanta, Georgia.
Sustainable Water Consultants • 23 W. Broad St. • Suite 303 • Richmond, Va • 23220
Feasibility Study: Black Water Reclamation & Reuse Georgia Institute of Technology Atlanta, GA
Table of Contents ....................................................................................................................................... 2
2.5. Cost of Water ..........................................................................................................................................22
2.6. Current Water Conservation Strategies..............................................................................................23
3.0 Water Audit and Balance............................................................................................................ 25
3.1. Gross Campus Water Consumption ...................................................................................................25
3.1.1. Domestic and Sanitary Use ..........................................................................................................26
3.1.3. HVAC/Utility Water Make-up ....................................................................................................30
3.2. Water Use in Basin A ............................................................................................................................34
3.3. Potable vs. Non-Potable Water Demand ............................................................................................35
3.3.1. Non-potable Demand in Basin A ................................................................................................36
3.4. Future Water Demand ..........................................................................................................................36
6.1. Reuse Program Recommendations .....................................................................................................65
6.1.1. Phase I .............................................................................................................................................66
6.1.2. Phase II ............................................................................................................................................70
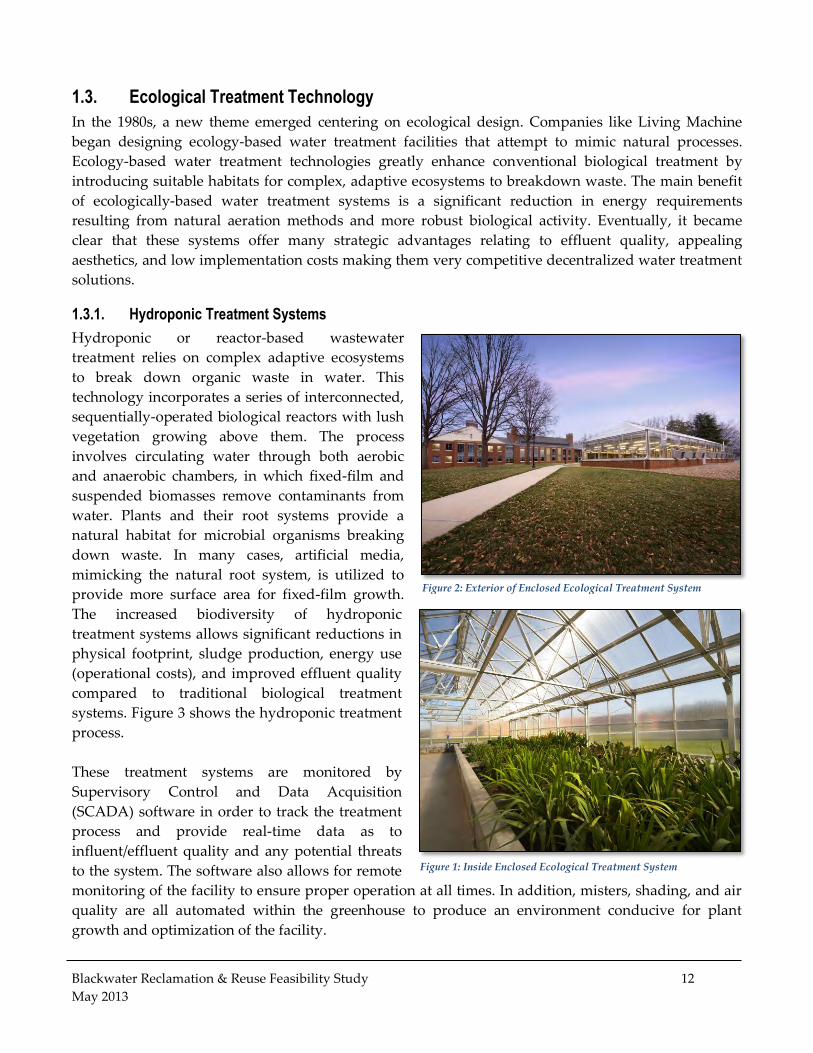
Figure 2: Exterior of Enclosed Ecological Treatment System ............................................................................... 12
Figure 3: Hydroponic Treatment System Process Schematic ............................................................................... 13
Figure 4: Tidal Flow Wetland, San Diego, CA ........................................................................................................ 13
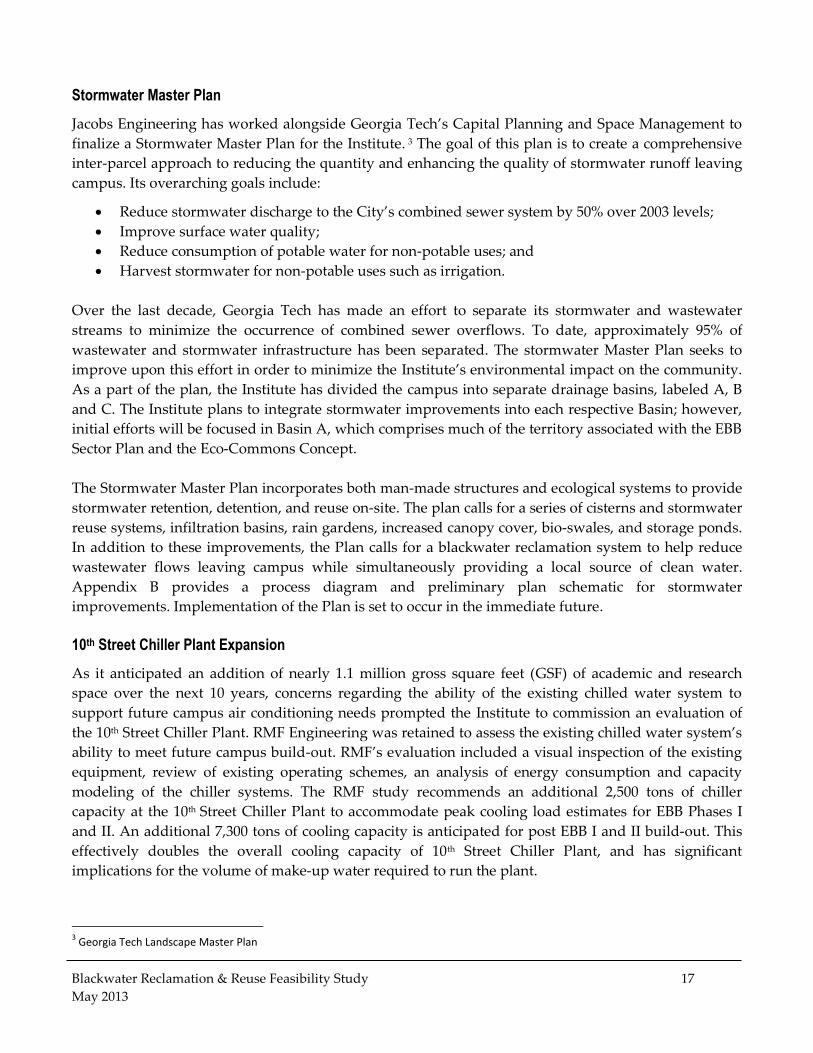
Figure 5: Living Machine in building atria, Lake Worth, Florida ....................................................................... 14
Figure 6: Tidal-Flow Wetland (Living Machine) Process Diagram ..................................................................... 14
Figure 7: Georgia Tech EBB and Ferst Sector Plan ................................................................................................. 16
Figure 8: Current 10th Street Chiller Layout............................................................................................................ 48
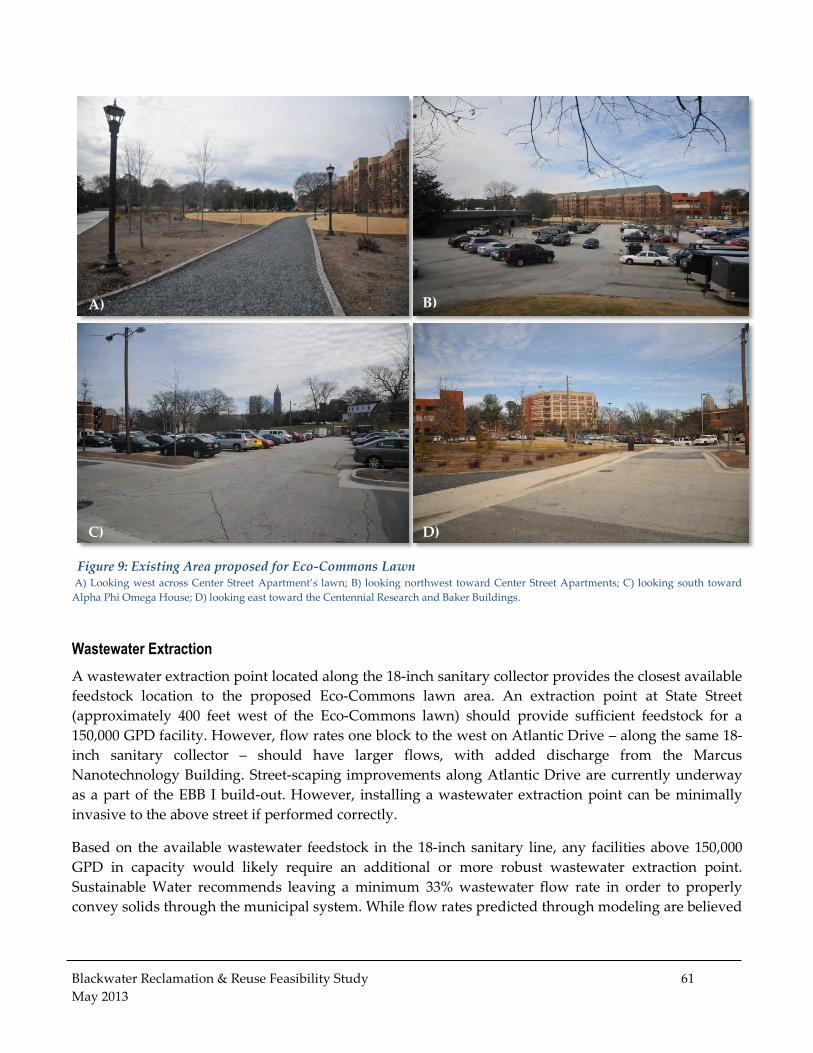
Figure 9: Existing Area proposed for Eco-Commons Lawn .................................................................................. 61
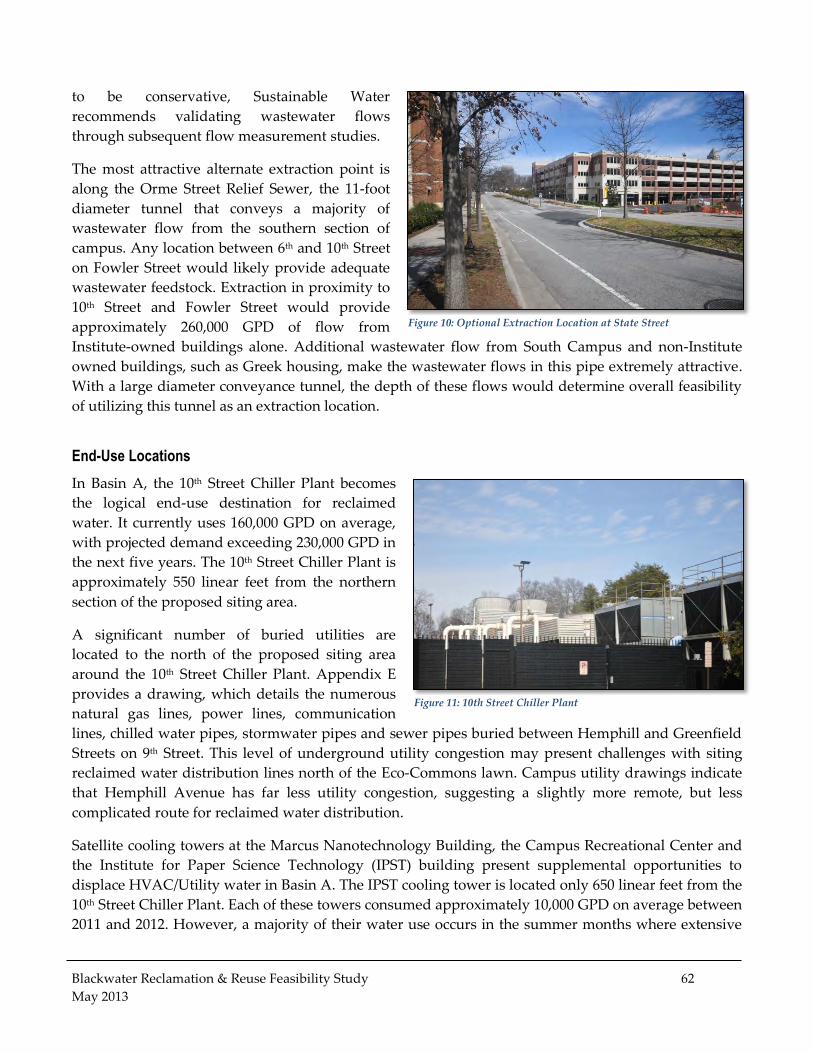
Figure 10: Optional Extraction Location at State Street ......................................................................................... 62
Figure 11: 10th Street Chiller Plant ............................................................................................................................ 62
Figure 12: Holland Utility Plant ................................................................................................................................. 63
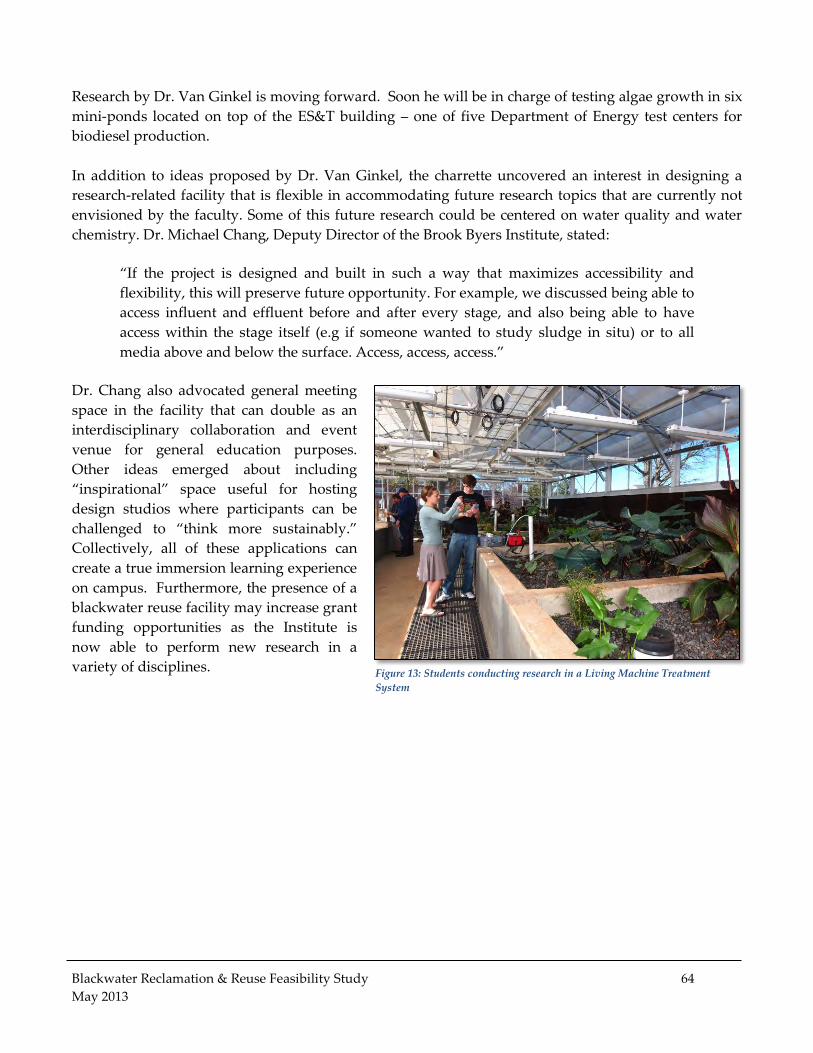
Figure 13: Students conducting research in a Living Machine Treatment System .......................................... 64
Figure 14: Phase I Facility Adjacent to Eco-Commons Lawn ............................................................................... 67
Figure 15: Conceptual Rendering of Phase I Tidal Flow Wetland System ........................................................ 69
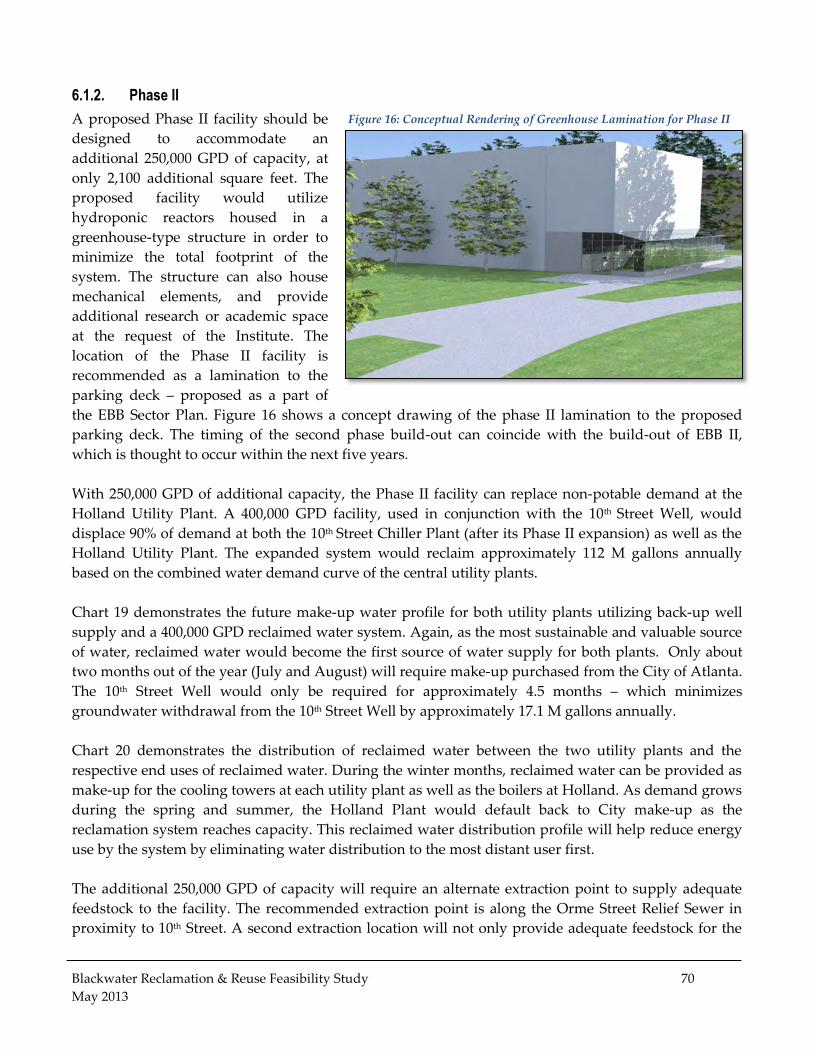
Figure 16: Conceptual Rendering of Greenhouse Lamination for Phase II ....................................................... 70
Table 7: City of Atlanta Drinking Water Characteristics ...................................................................................... 45
Table 8: Campus Well Water Characteristics........................................................................................................... 45
Table 9: 10th Street Chiller Specifications ............................................................................................................... 47
Table 10: Chemical Treatment Controls at 10th Street Chiller Plant .................................................................. 51
Table 11: Georgia Reclaimed Water Quality Standards ........................................................................................ 55
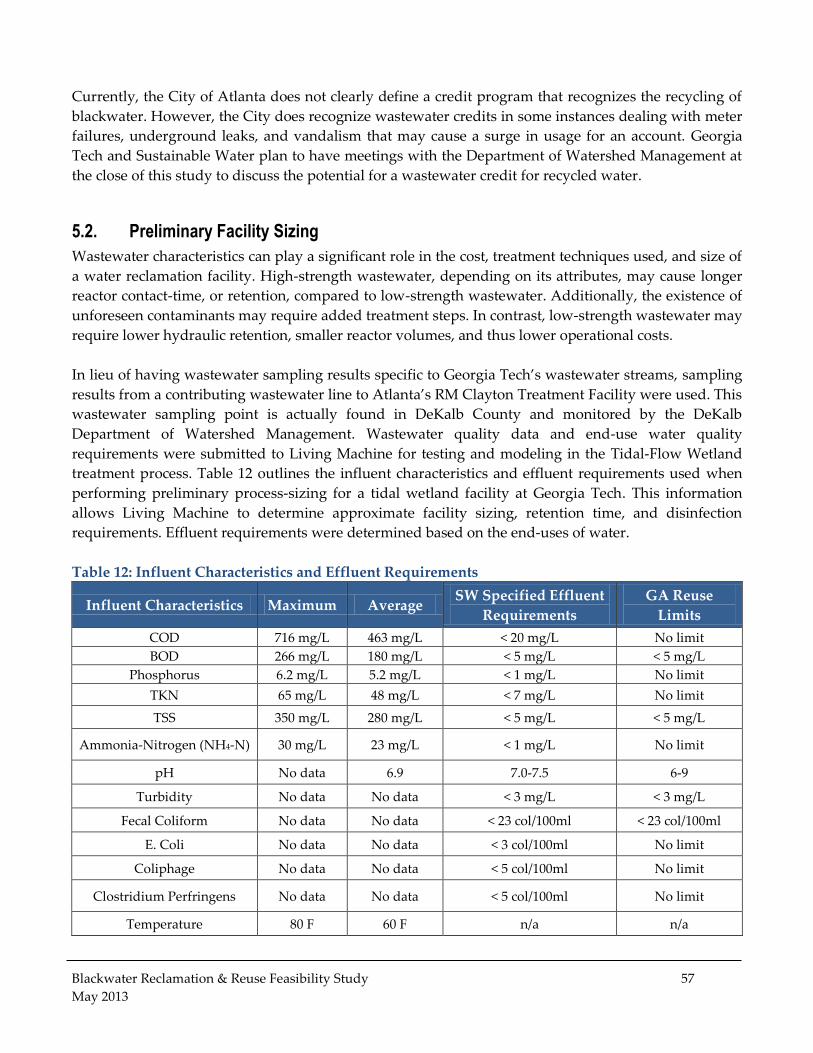
Table 12: Influent Characteristics and Effluent Requirements ............................................................................ 57
Table 13: Minimum System Footprint Based on Capacity.................................................................................... 58
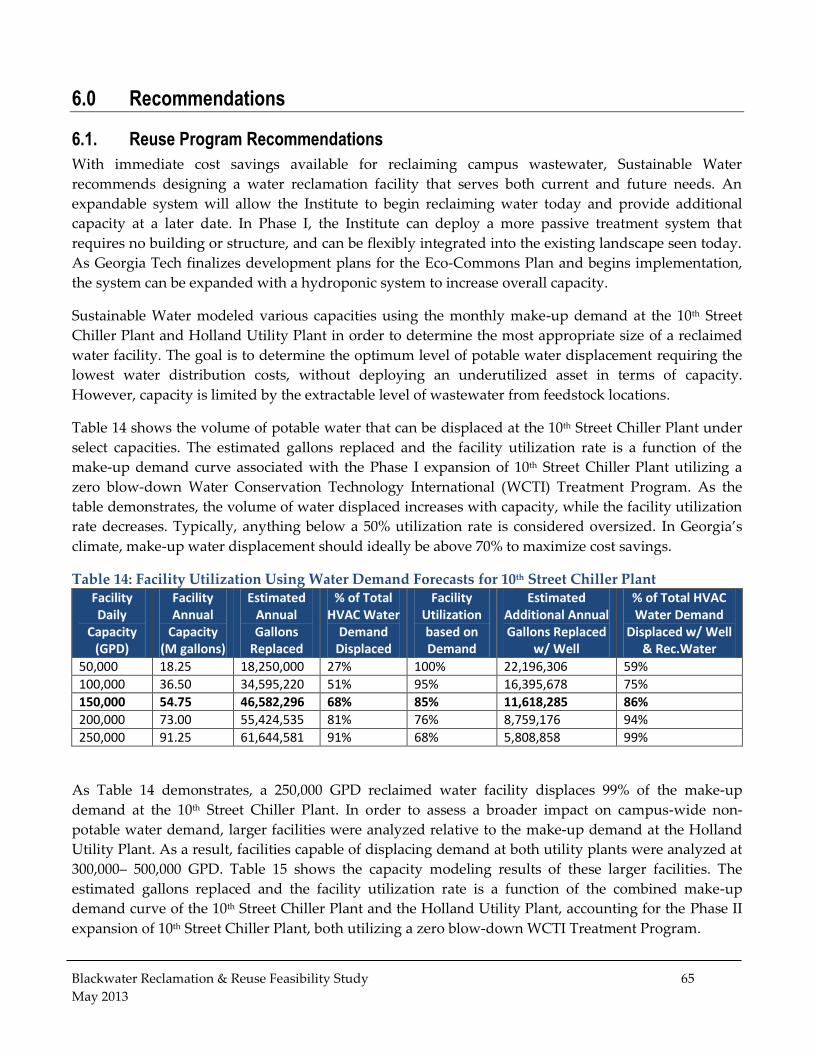
Table 14: Facility Utilization Using Water Demand Forecasts for 10th Street Chiller Plant ........................... 65
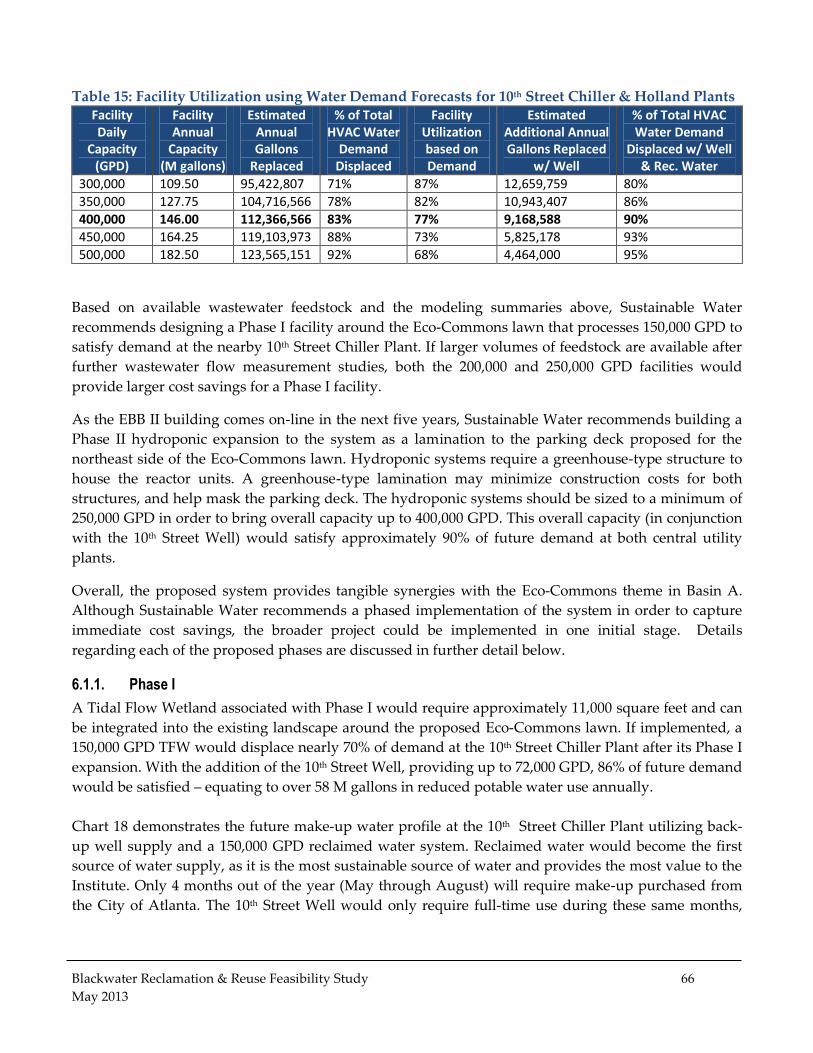
Table 15: Facility Utilization using Water Demand Forecasts for 10th Street Chiller & Holland Plants ...... 66
Chart 1: City of Atlanta Water & Sewer Rates ($/1,000 gallons), 2007 – 2012 ..................................................... 23
Chart 2: Municipally Supplied Water Use by Month (2011, 2012), GT Main Campus .................................... 25
Chart 3: Water Use by Type (2012), GT Main Campus .......................................................................................... 26
Chart 4: Irrigation Use by Month (April 2011 – December 2012), GT Main Campus ...................................... 28
Chart 5: Average Daily Irrigation Use by Season (April 2011 – December 2012), GT Main Campus........... 28
Blackwater Reclamation & Reuse Feasibility Study 5
May 2013
Chart 6: Top 10 Irrigation Accounts (2012), GT Main Campus ............................................................................ 29
Chart 7: Average Daily Water Use for HVAC by Month (2011 - 2012), GT Main Campus ............................. 32
Chart 8: Average Daily Make-Up at Tenth Street Chiller Plant (2011, 2012) ..................................................... 33
Chart 9: Average Daily Make-Up at Holland Utility Plant (2012) ....................................................................... 33
Chart 10: Total Usage by Category (2012), Basin A ................................................................................................. 34
Chart 11: Potable vs. Non-potable Demand (2012), GT Main Campus .............................................................. 35
Chart 12: Average Daily Non-Potable Demand by Season (2012), GT Main Campus .................................... 35
Chart 13: Potable vs. Non-potable Demand (2012), Basin A ................................................................................. 36
Chart 14: Average Daily Non-Potable Demand by Season (2012), Basin A ....................................................... 36
Chart 15: Future Water Demand at 10th Street Chiller Plant after WCTI Implementation ............................ 39
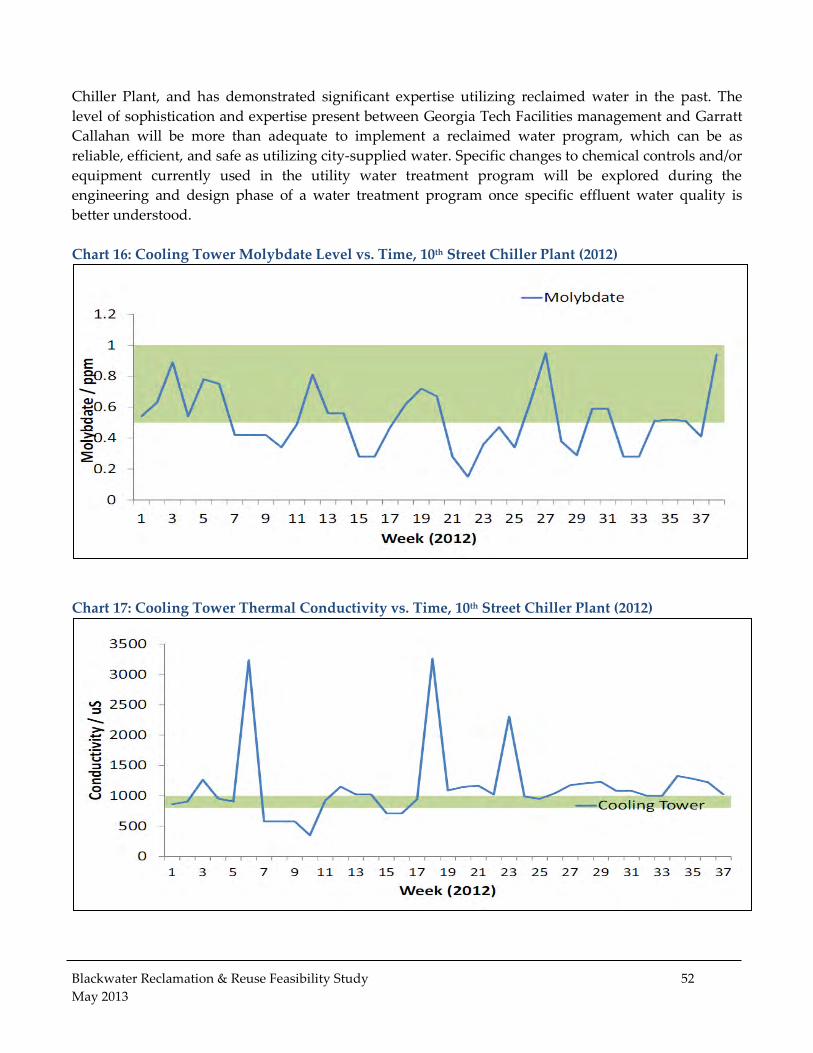
Chart 16: Cooling Tower Molybdate Level vs. Time, 10th Street Chiller Plant (2012) ...................................... 52
Chart 17: Cooling Tower Thermal Conductivity vs. Time, 10th Street Chiller Plant (2012) ............................ 52
Chart 18: Proposed Phase I Make-up Water Source Profile at 10th Street Chiller Plant .................................. 67
Chart 19: Phase II Make-up Water Source Profile, 10th Street Chiller and Holland Plants ........................... 71
Chart 20: Monthly Reclaimed Water Distribution to 10th Street Chiller and Holland Plants....................... 71
Chart 21: Business-as-Usual Water Costs vs. Phase I Reclaimed Water Program Costs .................................. 77
Chart 22: Year 1 Monthly Savings under Phase I WPA ......................................................................................... 77
Chart 23: Annual Savings over 20 Years under Phase I WPA ............................................................................... 78
Chart 24: Cumulative Savings over 20 years under Phase I WPA ....................................................................... 78
Chart 25: Business-as-Usual Water Costs vs. Phase II Reclaimed Water Costs ................................................ 80
Chart 26: Year 1 Monthly Savings after Phase II Installation .............................................................................. 80
Chart 27: Annual Savings over 20 Years after Phase II Installation .................................................................... 81
Chart 28: Cumulative Savings over 20 Years after Phase II Installation ............................................................ 81
Map 1: Georgia Tech Main Campus and Focus Area ............................................................................................. 10
Map 2: Campus Topography and Wastewater Infrastructure, GT Main Campus ........................................... 18
Map 3: Sanitary and Stormwater Sewer Infrastructure, Basin A ......................................................................... 21
Map 4: Cistern Locations, GT Main Campus .......................................................................................................... 24
Map 5: Domestic Water Use by Building (2012), GT Main Campus ................................................................... 27
Map 6: Irrigation Account Locations and Usage (2012), GT Main Campus ....................................................... 29
Map 7: HVAC Process Make-up Location and Usage (2012), GT Main Campus ............................................. 30
Map 8: Non-potable Demand Location and Usage (2012), Basin A ..................................................................... 34
Map 9: Locations of Projected Future Water Demand, Basin A ........................................................................... 38
Map 10: Wastewater Flow Contributions by Building (2012), GT Main Campus ............................................ 41
Map 11: Wastewater Flow Modeling, GT Main Campus ...................................................................................... 42
Map 12: Potential Facility Siting Locations, Basin A ............................................................................................. 59
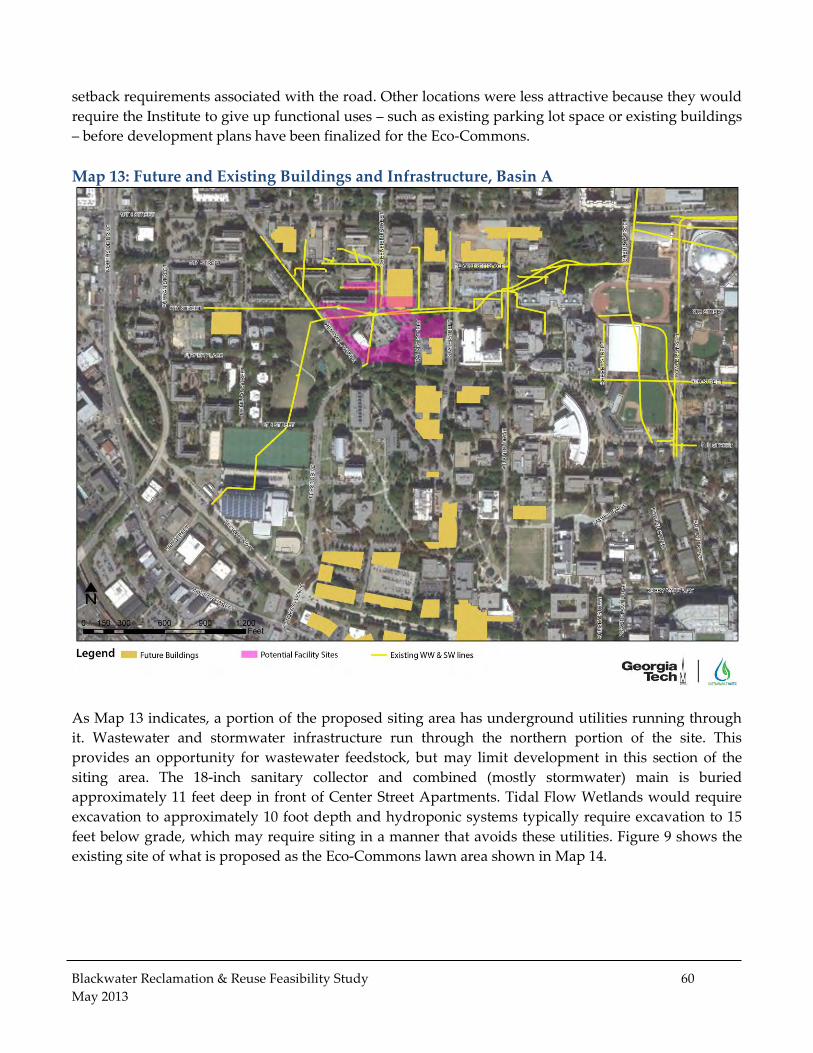
Map 13: Future and Existing Buildings and Infrastructure, Basin A .................................................................. 60
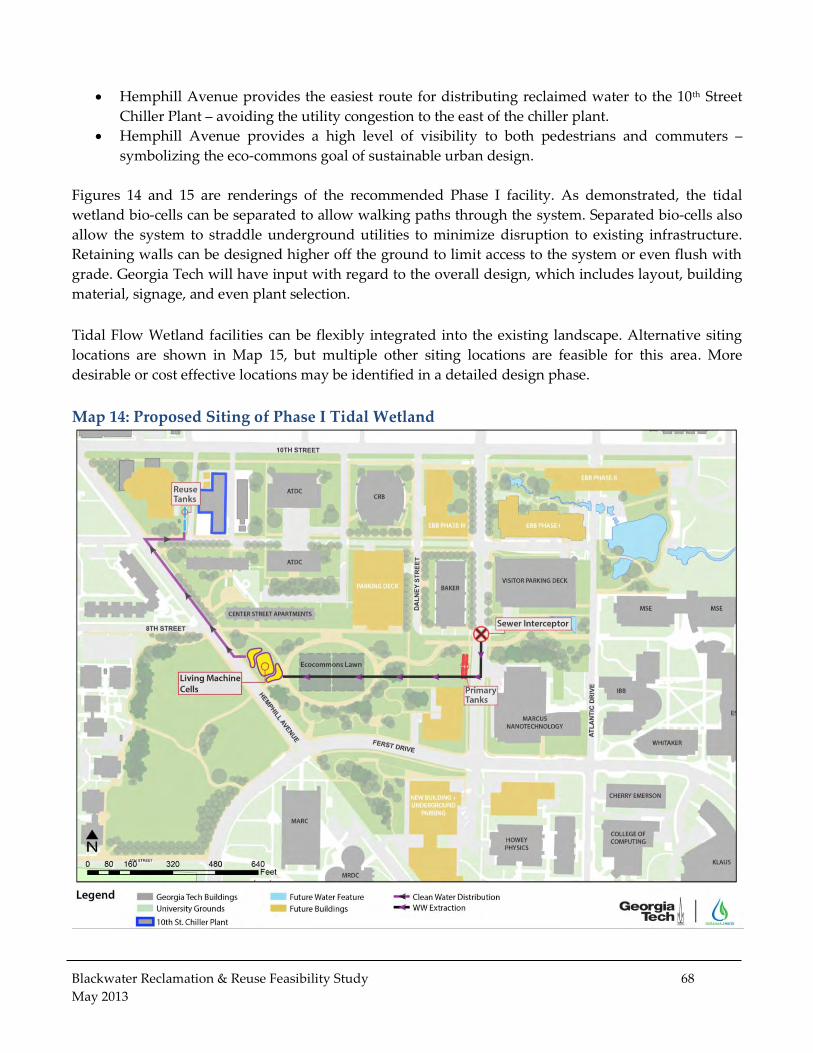
Map 14: Proposed Siting of Phase I Tidal Wetland ................................................................................................ 68
Map 15: Alternative Siting Areas for Phase I Tidal Wetland ............................................................................... 69
Map 16: Proposed Siting for Phase II Hydroponic System................................................................................... 73
Blackwater Reclamation & Reuse Feasibility Study 6
May 2013
Executive Summary
~Abstract~
Sustainable Water was retained by the Georgia Institute of Technology (GT) to explore the feasibility of installing
a decentralized water reclamation and reuse facility to help lower the Institute’s dependence on potable water.
This facility would have positive environmental and economic benefits for GT and the surrounding community,
as well as multiple educational- and research-related benefits. The following summarizes the Blackwater Reuse
Feasibility Report, which validated the practicality and economic viability of a water reclamation program on
campus. The study confirmed that decentralized water reclamation using ecologically-based treatment
technologies is both feasible and economically viable. In total, GT uses over 420 million gallons of water per year,
of which approximately 177 million gallons is considered non-potable demand. Displacing 60% of this demand
(112 million gallons per year) presents the Institue with nearly $24 million in potential savings over a 20-year
period, with no upfront capital requirements. The findings in this study recommend pursuing a two-phase water
reclamation and reuse program to address a majority of GT’s non-potable water demand.
Currently in the midst of environmental- and energy-related campus planning initiatives, Georgia Tech
is in an ideal position to incorporate innovative best management practices to improve water
management. Water reclamation and reuse is an impactful water management tool that can help de-risk
campus operations by providing a stable alternative water supply for utilities and irrigation. With high
water utility rates, bulk water reuse will also present significant economic savings to the Institute.
In 2012, GT used an estimated 424 million (M) gallons of water at an average rate of 1.16 M gallons per
day (GPD). Nearly 44% of campus water use, over 177 M gallons annually, is considered non-potable
demand and can thus be replaced with alternative sources of water. Approximately 84% of non-potable
demand (148 M gallons annually) is used for campus HVAC (Heating Ventilation, and Air
Conditioning) and utility functions. GIS-based flow modeling indicates a substantial volume of
wastewater feedstock available for reuse on-site. Conservative estimates indicate an average of 570,000
GPD of flow from Institute-owned campus buildings. If non-Institute-owned buildings are included, the
total available volume of reclaimable wastewater is conceivably much higher.
Based on the immediate cost savings available for reclaiming campus wastewater, Sustainable Water
recommends designing a two-phase water reclamation facility that serves both current and future
needs. An expandable system would allow GT to begin reclaiming water today and provide additional
capacity at a later date. Based on siting considerations, available wastewater feedstock, and end-use
water demand, a Phase I facility is recommended to be designed at a capacity of 150,000 GPD and utilize
a passive Tidal Flow Wetland (TFW) technology patented by Living Machine. Over the next five years,
an additional 250,000 GPD of capacity can be added using hydroponic reactors, as part of a Phase II
expansion.
In Basin A, the 10th Street Chiller Plant becomes the logical end-use destination for reclaimed water. It
currently uses 160,000 GPD on average, with projected demand exceeding 230,000 GPD in the next five
Blackwater Reclamation & Reuse Feasibility Study 7
May 2013
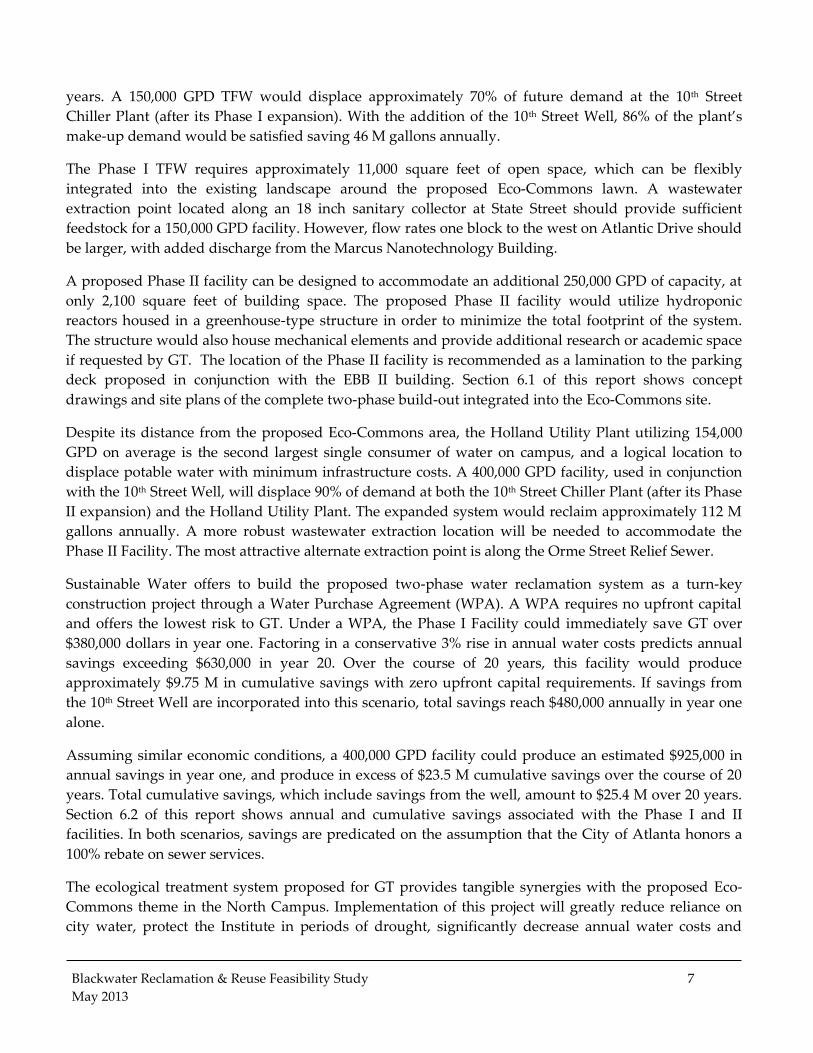
years. A 150,000 GPD TFW would displace approximately 70% of future demand at the 10th Street
Chiller Plant (after its Phase I expansion). With the addition of the 10th Street Well, 86% of the plant’s
make-up demand would be satisfied saving 46 M gallons annually.
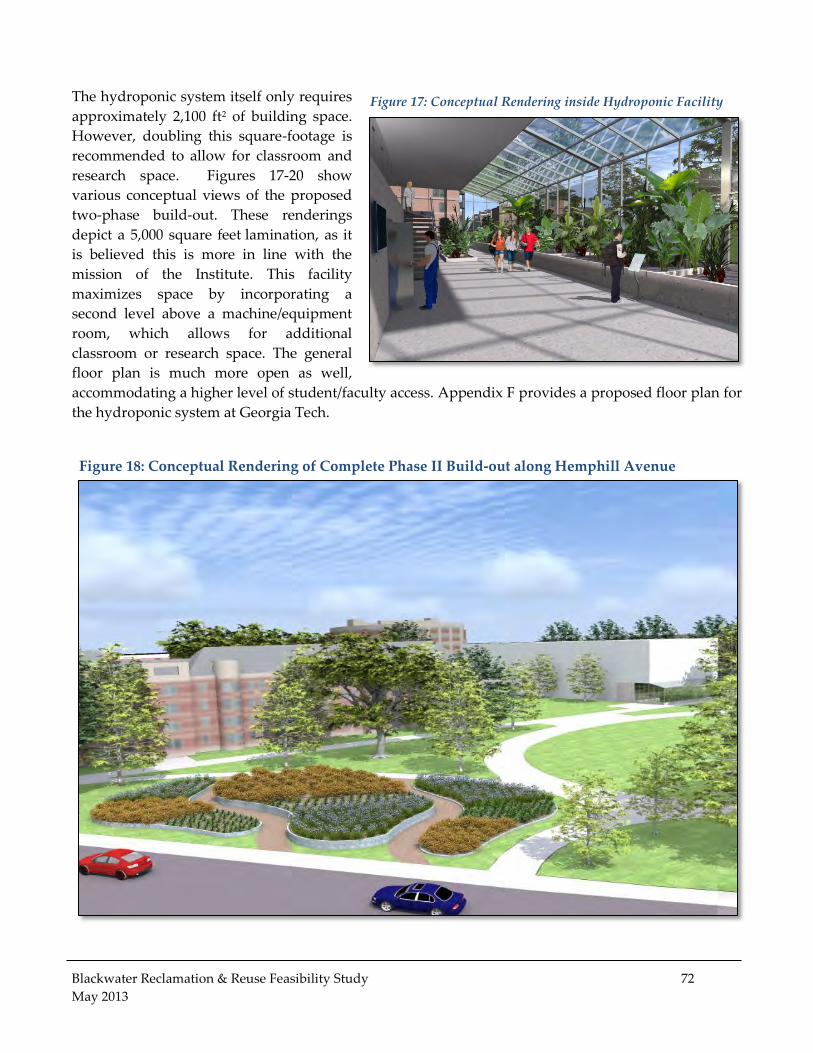
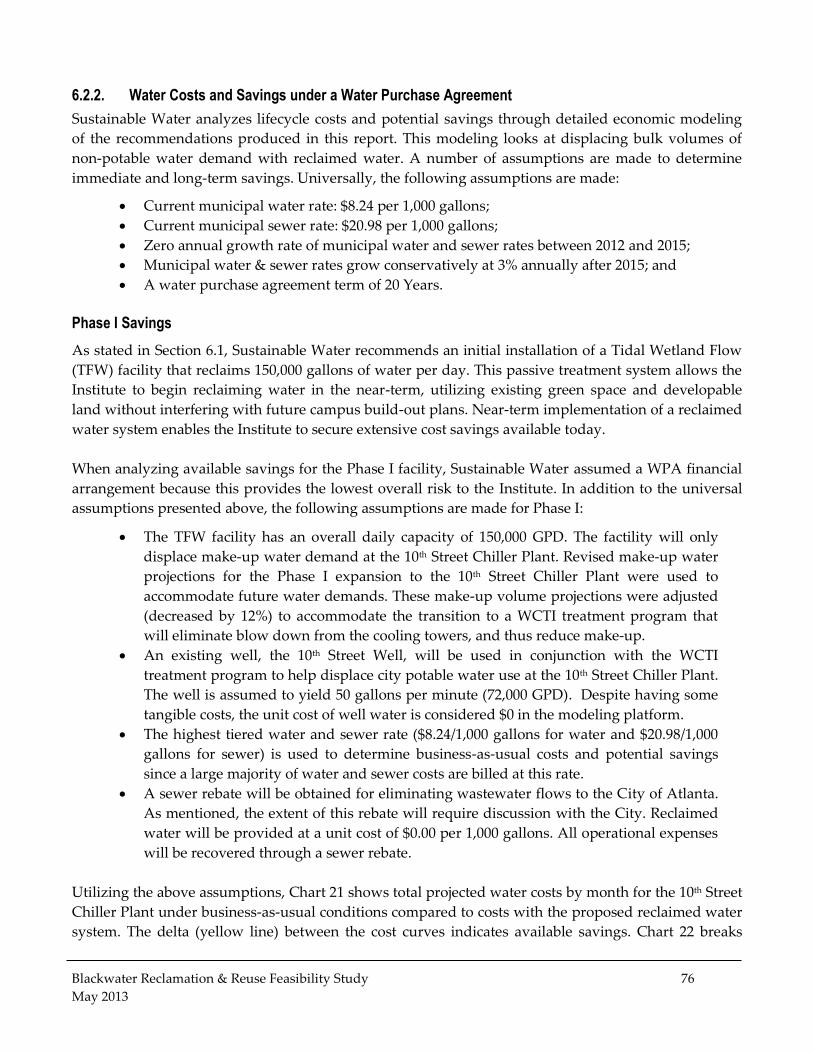
The Phase I TFW requires approximately 11,000 square feet of open space, which can be flexibly
integrated into the existing landscape around the proposed Eco-Commons lawn. A wastewater
extraction point located along an 18 inch sanitary collector at State Street should provide sufficient
feedstock for a 150,000 GPD facility. However, flow rates one block to the west on Atlantic Drive should
be larger, with added discharge from the Marcus Nanotechnology Building.
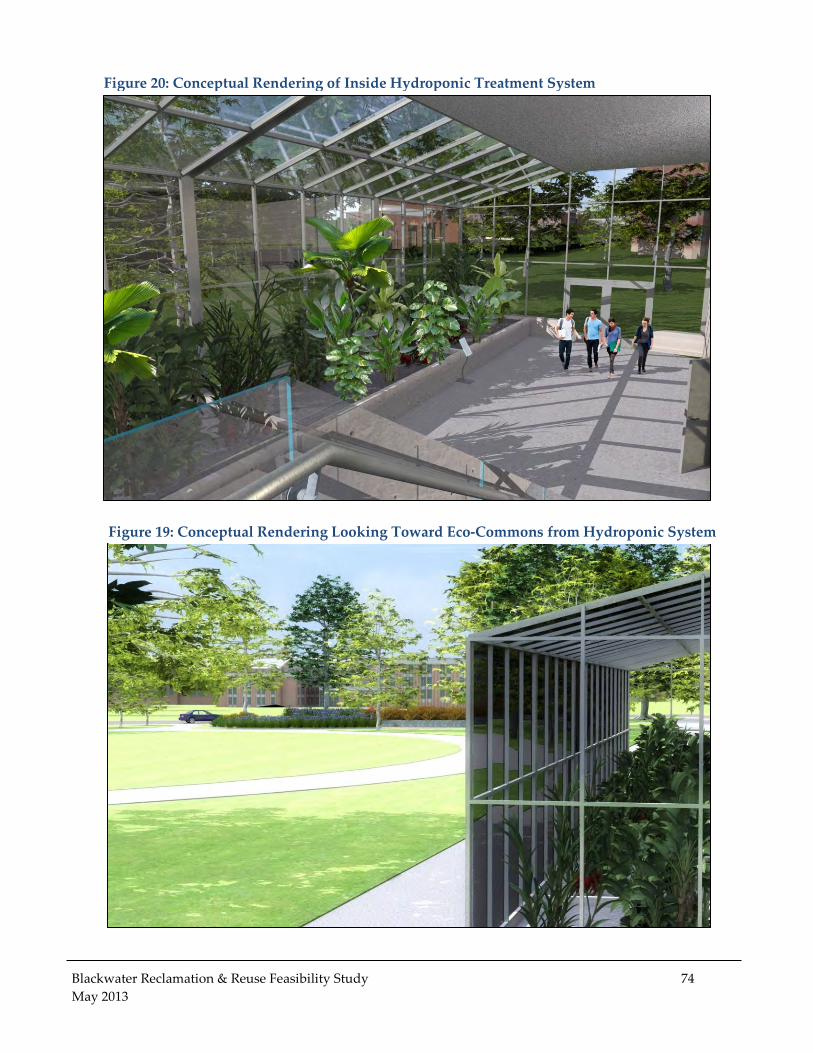
A proposed Phase II facility can be designed to accommodate an additional 250,000 GPD of capacity, at
only 2,100 square feet of building space. The proposed Phase II facility would utilize hydroponic
reactors housed in a greenhouse-type structure in order to minimize the total footprint of the system.
The structure would also house mechanical elements and provide additional research or academic space
if requested by GT. The location of the Phase II facility is recommended as a lamination to the parking
deck proposed in conjunction with the EBB II building. Section 6.1 of this report shows concept
drawings and site plans of the complete two-phase build-out integrated into the Eco-Commons site.
Despite its distance from the proposed Eco-Commons area, the Holland Utility Plant utilizing 154,000
GPD on average is the second largest single consumer of water on campus, and a logical location to
displace potable water with minimum infrastructure costs. A 400,000 GPD facility, used in conjunction
with the 10th Street Well, will displace 90% of demand at both the 10th Street Chiller Plant (after its Phase
II expansion) and the Holland Utility Plant. The expanded system would reclaim approximately 112 M
gallons annually. A more robust wastewater extraction location will be needed to accommodate the
Phase II Facility. The most attractive alternate extraction point is along the Orme Street Relief Sewer.
Sustainable Water offers to build the proposed two-phase water reclamation system as a turn-key
construction project through a Water Purchase Agreement (WPA). A WPA requires no upfront capital
and offers the lowest risk to GT. Under a WPA, the Phase I Facility could immediately save GT over
$380,000 dollars in year one. Factoring in a conservative 3% rise in annual water costs predicts annual
savings exceeding $630,000 in year 20. Over the course of 20 years, this facility would produce
approximately $9.75 M in cumulative savings with zero upfront capital requirements. If savings from
the 10th Street Well are incorporated into this scenario, total savings reach $480,000 annually in year one
alone.
Assuming similar economic conditions, a 400,000 GPD facility could produce an estimated $925,000 in
annual savings in year one, and produce in excess of $23.5 M cumulative savings over the course of 20
years. Total cumulative savings, which include savings from the well, amount to $25.4 M over 20 years.
Section 6.2 of this report shows annual and cumulative savings associated with the Phase I and II
facilities. In both scenarios, savings are predicated on the assumption that the City of Atlanta honors a
100% rebate on sewer services.
The ecological treatment system proposed for GT provides tangible synergies with the proposed Eco-
Commons theme in the North Campus. Implementation of this project will greatly reduce reliance on
city water, protect the Institute in periods of drought, significantly decrease annual water costs and
1. 2.
Blackwater Reclamation & Reuse Feasibility Study 8
May 2013
improve the Institute’s overall environmental footprint. As a result, Sustainable Water recommends that
GT move forward with the detailed engineering design of a decentralized water reclamation and reuse
facility. Before proceeding to Engineering and Design, Sustainable Water recommends performing the
following tasks:
1. Perform a detailed flow-measurement study to validate available feedstock;
2. Evaluate and validate economic models for various financing scenarios; and,
3. Present this project to the City of Atlanta Department of Watershed Management.
Blackwater Reclamation & Reuse Feasibility Study 9
May 2013
1.0 Introduction
1.1. Project Description & Study Area
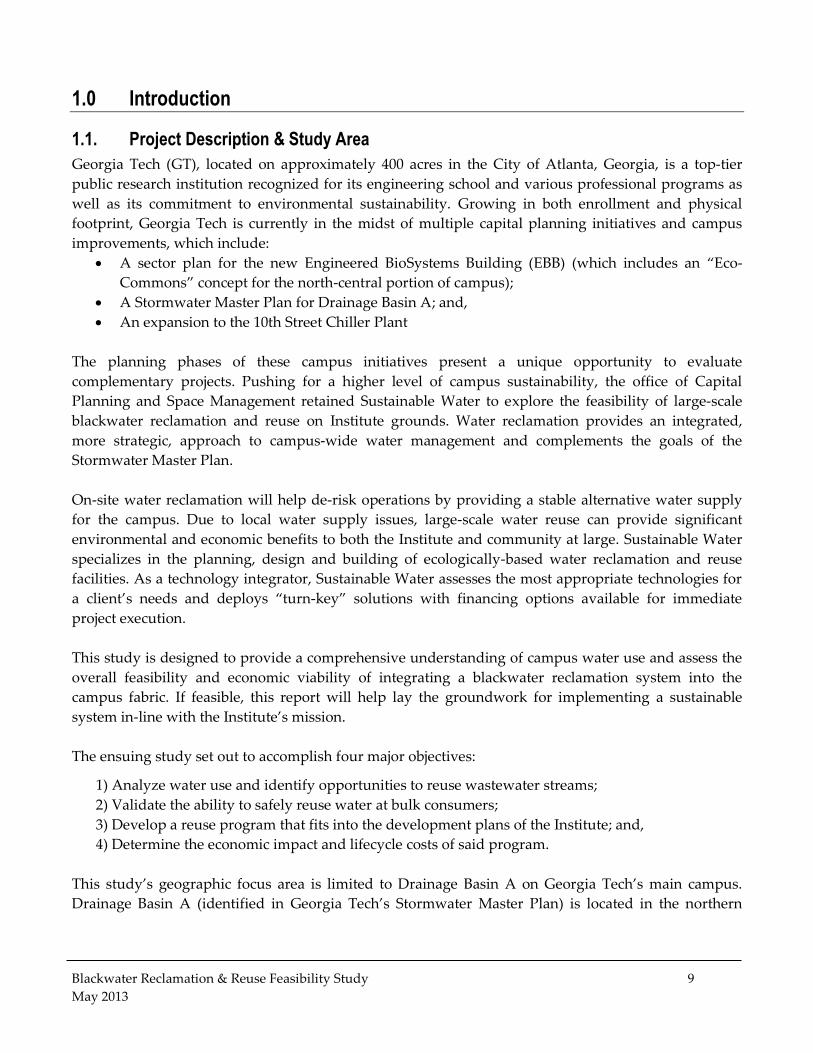
Georgia Tech (GT), located on approximately 400 acres in the City of Atlanta, Georgia, is a top-tier
public research institution recognized for its engineering school and various professional programs as
well as its commitment to environmental sustainability. Growing in both enrollment and physical
footprint, Georgia Tech is currently in the midst of multiple capital planning initiatives and campus
improvements, which include:
A sector plan for the new Engineered BioSystems Building (EBB) (which includes an “Eco-
Commons” concept for the north-central portion of campus);
A Stormwater Master Plan for Drainage Basin A; and,
An expansion to the 10th Street Chiller Plant
The planning phases of these campus initiatives present a unique opportunity to evaluate
complementary projects. Pushing for a higher level of campus sustainability, the office of Capital
Planning and Space Management retained Sustainable Water to explore the feasibility of large-scale
blackwater reclamation and reuse on Institute grounds. Water reclamation provides an integrated,
more strategic, approach to campus-wide water management and complements the goals of the
Stormwater Master Plan.
On-site water reclamation will help de-risk operations by providing a stable alternative water supply
for the campus. Due to local water supply issues, large-scale water reuse can provide significant
environmental and economic benefits to both the Institute and community at large. Sustainable Water
specializes in the planning, design and building of ecologically-based water reclamation and reuse
facilities. As a technology integrator, Sustainable Water assesses the most appropriate technologies for
a client’s needs and deploys “turn-key” solutions with financing options available for immediate
project execution.
This study is designed to provide a comprehensive understanding of campus water use and assess the
overall feasibility and economic viability of integrating a blackwater reclamation system into the
campus fabric. If feasible, this report will help lay the groundwork for implementing a sustainable
system in-line with the Institute’s mission.
The ensuing study set out to accomplish four major objectives:
1) Analyze water use and identify opportunities to reuse wastewater streams;
2) Validate the ability to safely reuse water at bulk consumers;
3) Develop a reuse program that fits into the development plans of the Institute; and,
4) Determine the economic impact and lifecycle costs of said program.
This study’s geographic focus area is limited to Drainage Basin A on Georgia Tech’s main campus.
Drainage Basin A (identified in Georgia Tech’s Stormwater Master Plan) is located in the northern
Blackwater Reclamation & Reuse Feasibility Study 10
May 2013
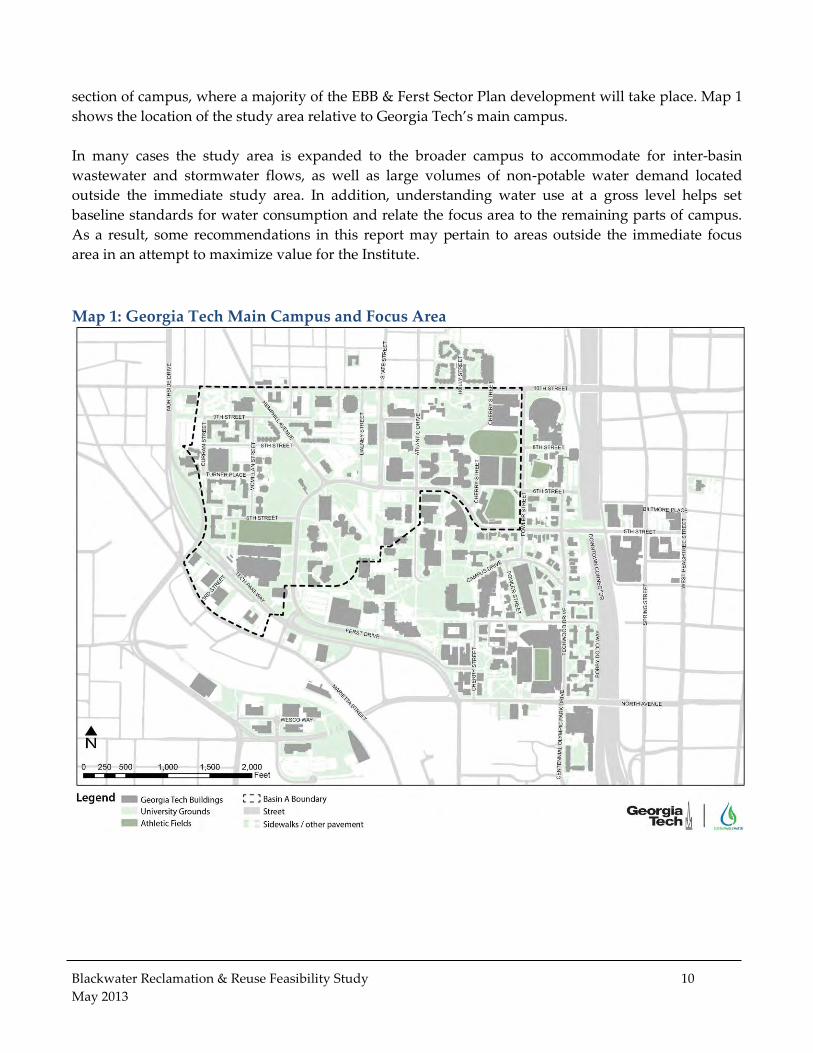
section of campus, where a majority of the EBB & Ferst Sector Plan development will take place. Map 1
shows the location of the study area relative to Georgia Tech’s main campus.
In many cases the study area is expanded to the broader campus to accommodate for inter-basin
wastewater and stormwater flows, as well as large volumes of non-potable water demand located
outside the immediate study area. In addition, understanding water use at a gross level helps set
baseline standards for water consumption and relate the focus area to the remaining parts of campus.
As a result, some recommendations in this report may pertain to areas outside the immediate focus
area in an attempt to maximize value for the Institute.
Map 1: Georgia Tech Main Campus and Focus Area
Blackwater Reclamation & Reuse Feasibility Study 11
May 2013
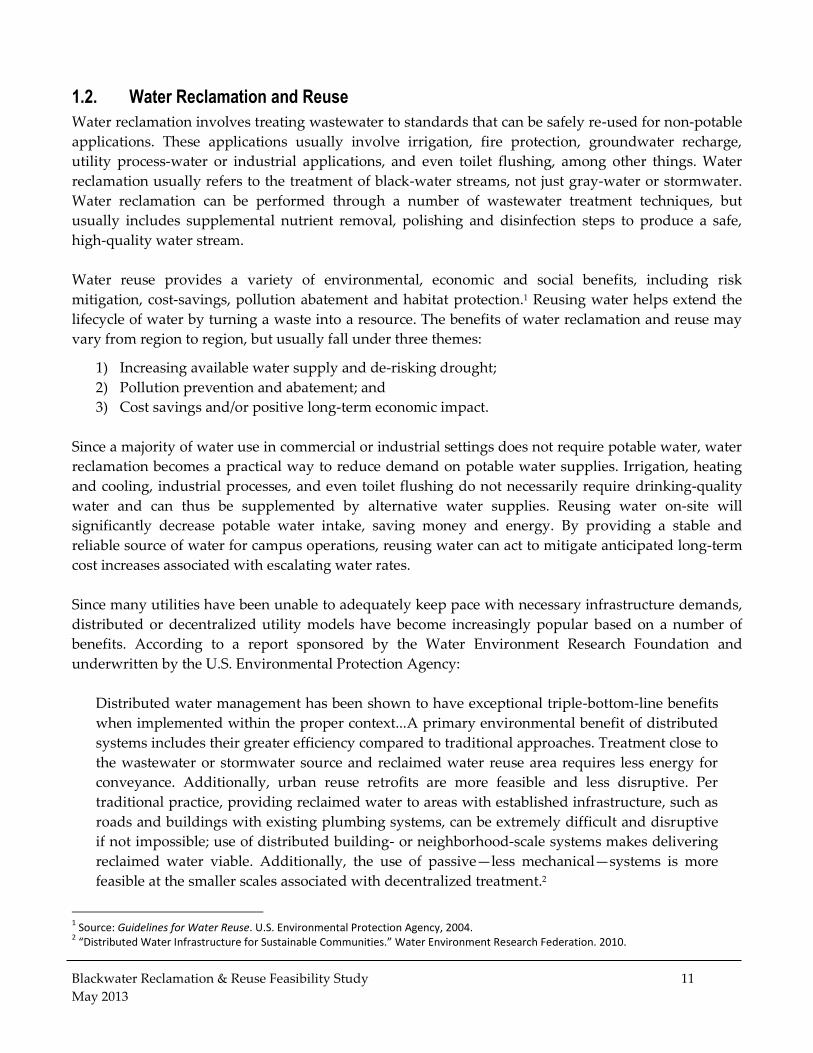
1.2. Water Reclamation and Reuse
Water reclamation involves treating wastewater to standards that can be safely re-used for non-potable
applications. These applications usually involve irrigation, fire protection, groundwater recharge,
utility process-water or industrial applications, and even toilet flushing, among other things. Water
reclamation usually refers to the treatment of black-water streams, not just gray-water or stormwater.
Water reclamation can be performed through a number of wastewater treatment techniques, but
usually includes supplemental nutrient removal, polishing and disinfection steps to produce a safe,
high-quality water stream.
Water reuse provides a variety of environmental, economic and social benefits, including risk
mitigation, cost-savings, pollution abatement and habitat protection.1 Reusing water helps extend the
lifecycle of water by turning a waste into a resource. The benefits of water reclamation and reuse may
vary from region to region, but usually fall under three themes:
1) Increasing available water supply and de-risking drought;
Blackwater Reclamation & Reuse Feasibility Study 21
May 2013
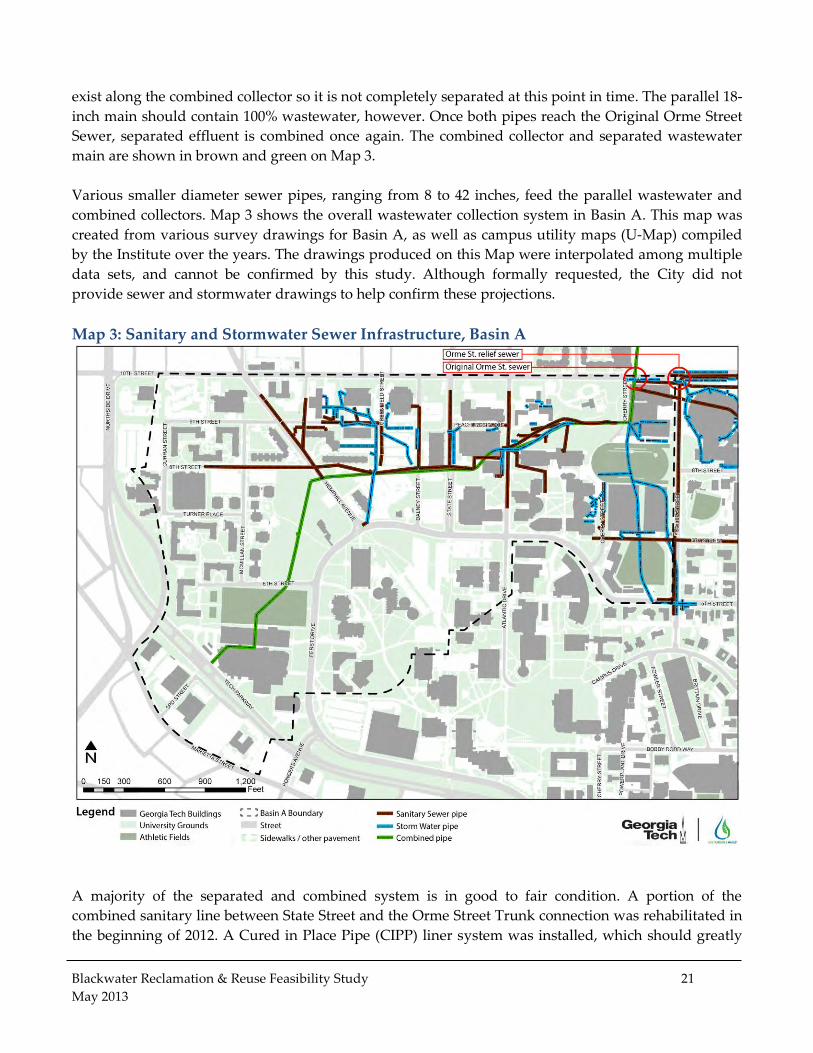
exist along the combined collector so it is not completely separated at this point in time. The parallel 18-
inch main should contain 100% wastewater, however. Once both pipes reach the Original Orme Street
Sewer, separated effluent is combined once again. The combined collector and separated wastewater
main are shown in brown and green on Map 3.
Various smaller diameter sewer pipes, ranging from 8 to 42 inches, feed the parallel wastewater and
combined collectors. Map 3 shows the overall wastewater collection system in Basin A. This map was
created from various survey drawings for Basin A, as well as campus utility maps (U-Map) compiled
by the Institute over the years. The drawings produced on this Map were interpolated among multiple
data sets, and cannot be confirmed by this study. Although formally requested, the City did not
provide sewer and stormwater drawings to help confirm these projections.
Map 3: Sanitary and Stormwater Sewer Infrastructure, Basin A
A majority of the separated and combined system is in good to fair condition. A portion of the
combined sanitary line between State Street and the Orme Street Trunk connection was rehabilitated in
the beginning of 2012. A Cured in Place Pipe (CIPP) liner system was installed, which should greatly
Blackwater Reclamation & Reuse Feasibility Study 22
May 2013
extend the service life of this portion of the combined sewer. During its analysis of the system for the
EBB Sector Plan, Jacobs found only one area of concern: an old culvert beneath Hemphill Avenue. A
Utility and Development Assessment report, produced by Jacobs Engineering, states:
The condition of this culvert and particularly the transitions between the differing
materials and shapes at the upstream and downstream ends is a concern. A failure of the
sewer in this area puts the city of Atlanta’s Water transmission mains in Hemphill
Avenue at risk.9
Wastewater from south campus primarily flows into another large collector, known as the Orme Street
Relief Sewer (shown in Map 3), located beneath Fowler Street. This 11-foot diameter tunnel, installed in
the late 1990s, was primarily built to resolve flooding issues that occurred during rain events. A
majority of stormwater flow leaving south campus continues north through the Original Orme Street
Sewer. The Original Orme Street Sewer is mainly separated stormwater until it intersects the 18-inch
collector, conveying wastewater from Basin A, near Byers Tennis Complex. The two circled references
to the Original Orme Street Sewer and Orme Street Relief Sewer on Map 3 are the locations where a
majority of campus wastewater and stormwater leave campus.
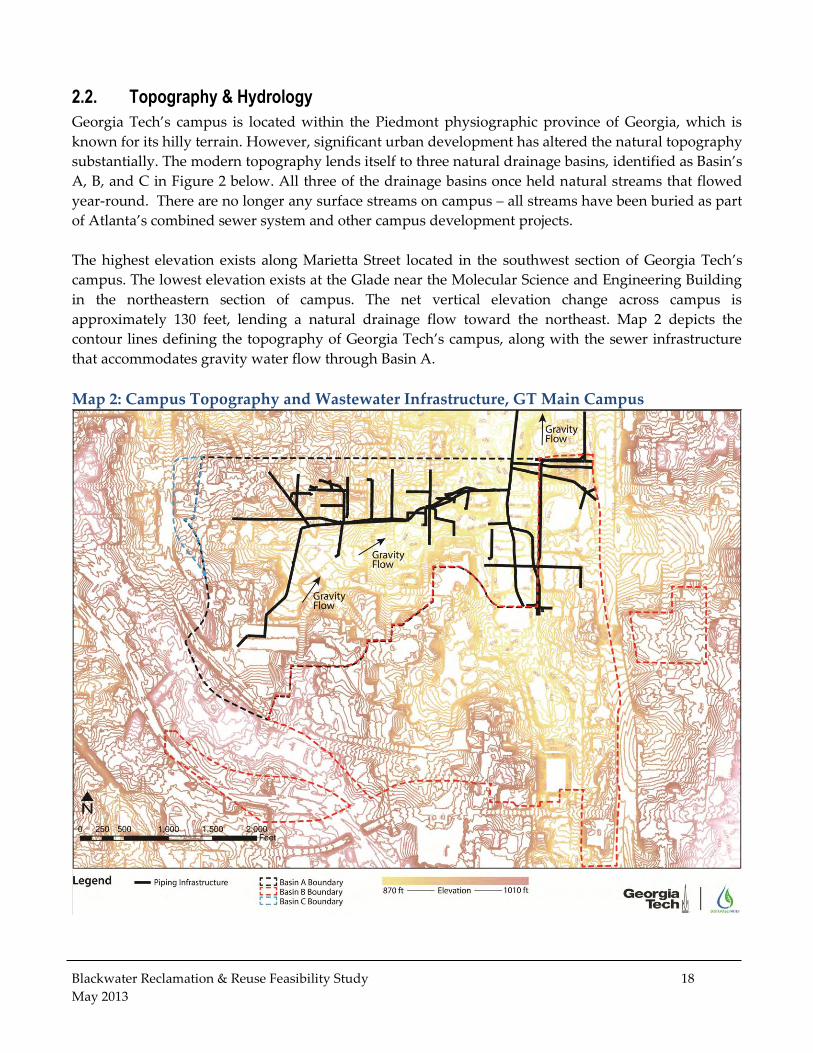
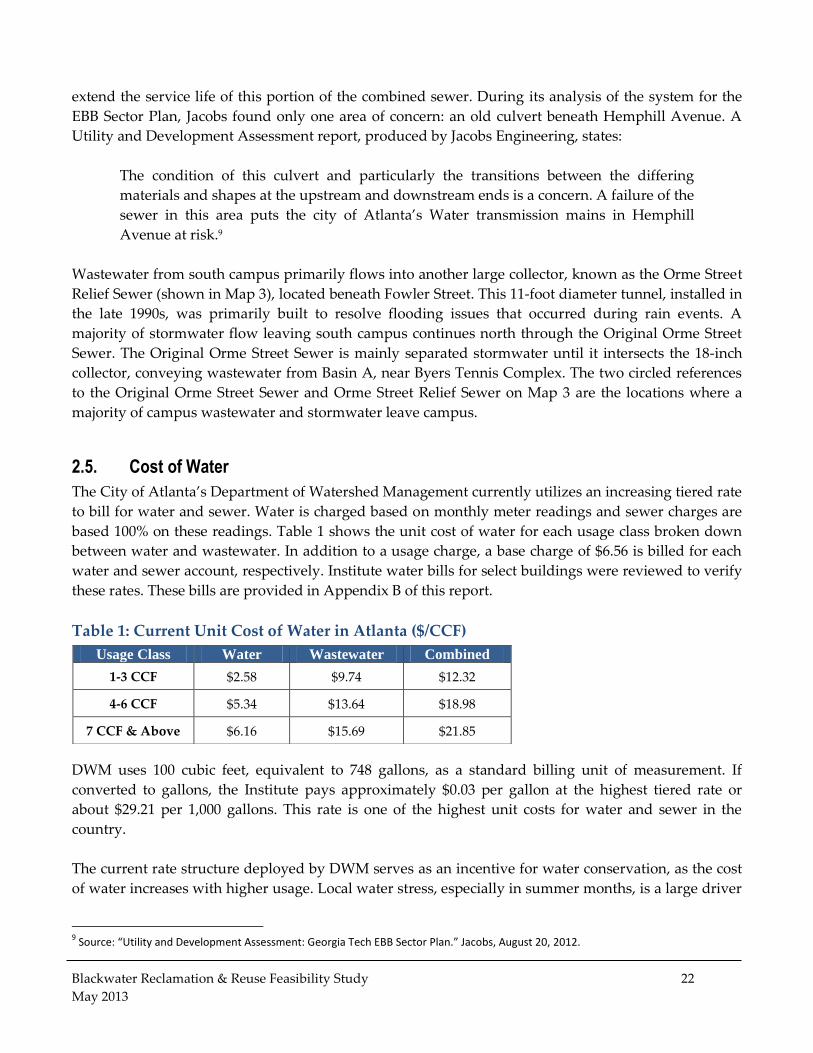
2.5. Cost of Water
The City of Atlanta’s Department of Watershed Management currently utilizes an increasing tiered rate
to bill for water and sewer. Water is charged based on monthly meter readings and sewer charges are
based 100% on these readings. Table 1 shows the unit cost of water for each usage class broken down
between water and wastewater. In addition to a usage charge, a base charge of $6.56 is billed for each
water and sewer account, respectively. Institute water bills for select buildings were reviewed to verify
these rates. These bills are provided in Appendix B of this report.
Table 1: Current Unit Cost of Water in Atlanta ($/CCF)
DWM uses 100 cubic feet, equivalent to 748 gallons, as a standard billing unit of measurement. If
converted to gallons, the Institute pays approximately $0.03 per gallon at the highest tiered rate or
about $29.21 per 1,000 gallons. This rate is one of the highest unit costs for water and sewer in the
country.
The current rate structure deployed by DWM serves as an incentive for water conservation, as the cost
of water increases with higher usage. Local water stress, especially in summer months, is a large driver
9 Source: “Utility and Development Assessment: Georgia Tech EBB Sector Plan.” Jacobs, August 20, 2012.
Usage Class Water Wastewater Combined
1-3 CCF $2.58 $9.74 $12.32
4-6 CCF $5.34 $13.64 $18.98
7 CCF & Above $6.16 $15.69 $21.85
Blackwater Reclamation & Reuse Feasibility Study 23
May 2013
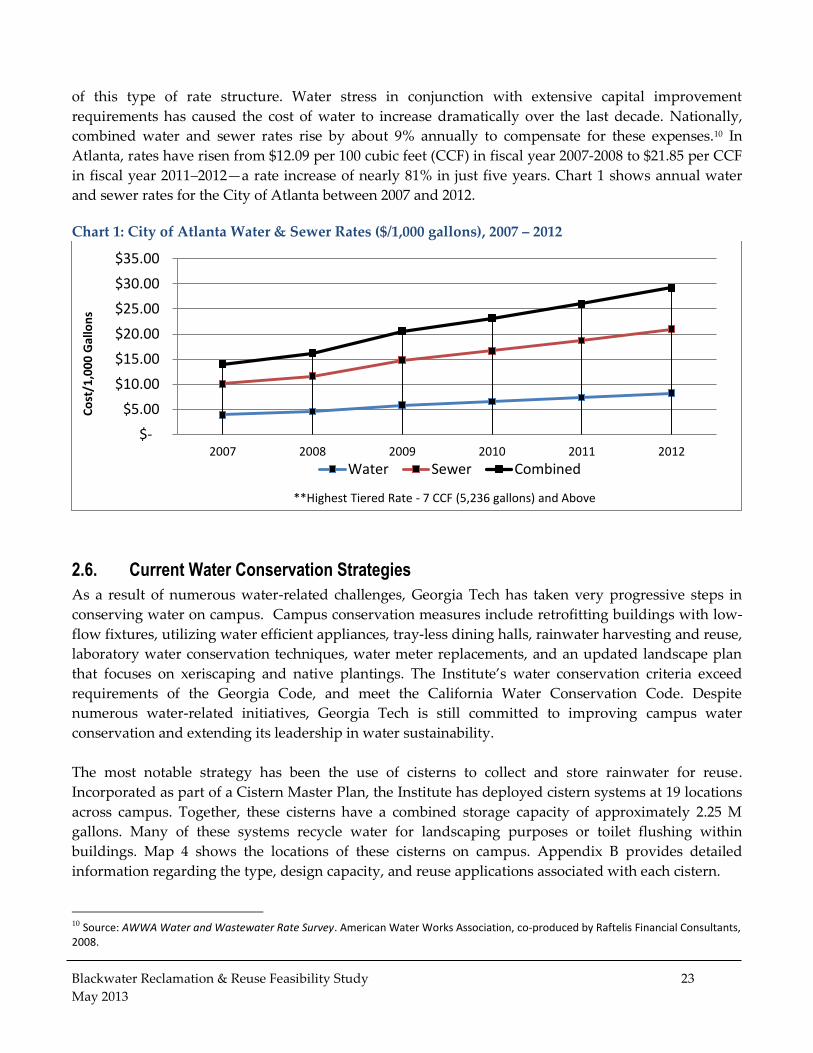
of this type of rate structure. Water stress in conjunction with extensive capital improvement
requirements has caused the cost of water to increase dramatically over the last decade. Nationally,
combined water and sewer rates rise by about 9% annually to compensate for these expenses.10 In
Atlanta, rates have risen from $12.09 per 100 cubic feet (CCF) in fiscal year 2007-2008 to $21.85 per CCF
in fiscal year 2011–2012—a rate increase of nearly 81% in just five years. Chart 1 shows annual water
and sewer rates for the City of Atlanta between 2007 and 2012.
Chart 1: City of Atlanta Water & Sewer Rates ($/1,000 gallons), 2007 – 2012
2.6. Current Water Conservation Strategies
As a result of numerous water-related challenges, Georgia Tech has taken very progressive steps in
conserving water on campus. Campus conservation measures include retrofitting buildings with low-
flow fixtures, utilizing water efficient appliances, tray-less dining halls, rainwater harvesting and reuse,
laboratory water conservation techniques, water meter replacements, and an updated landscape plan
that focuses on xeriscaping and native plantings. The Institute’s water conservation criteria exceed
requirements of the Georgia Code, and meet the California Water Conservation Code. Despite
numerous water-related initiatives, Georgia Tech is still committed to improving campus water
conservation and extending its leadership in water sustainability.
The most notable strategy has been the use of cisterns to collect and store rainwater for reuse.
Incorporated as part of a Cistern Master Plan, the Institute has deployed cistern systems at 19 locations
across campus. Together, these cisterns have a combined storage capacity of approximately 2.25 M
gallons. Many of these systems recycle water for landscaping purposes or toilet flushing within
buildings. Map 4 shows the locations of these cisterns on campus. Appendix B provides detailed
information regarding the type, design capacity, and reuse applications associated with each cistern.
10 Source: AWWA Water and Wastewater Rate Survey. American Water Works Association, co-produced by Raftelis Financial Consultants, 2008.
$-
$5.00
$10.00
$15.00
$20.00
$25.00
$30.00
$35.00
2007 2008 2009 2010 2011 2012
Co
st/1
,00
0 G
allo
ns
**Highest Tiered Rate - 7 CCF (5,236 gallons) and Above
Water Sewer Combined
Blackwater Reclamation & Reuse Feasibility Study 24
May 2013
The most impressive cistern system is located at the Clough Undergraduate Learning Commons
(CULC). This 1.4 M gallons cistern is one of the largest in the United States, and provides water for
both toilet flushing and efficient landscaping around the building. Engineering projections estimate
that 89% of the building’s water demand is supplied by the cistern. Exact levels of potable water
displacement are not known as a result of un-calibrated water meters on the system. Unfortunately this
is true for most of campus. Overall, only two cisterns systems are metered–one system only measures
HVAC condensate influent and the other system has an un-calibrated meter.
Map 4: Cistern Locations, GT Main Campus
Blackwater Reclamation & Reuse Feasibility Study 25
May 2013
3.0 Water Audit and Balance
The purpose of this section is to account for and analyze water use in its many forms at Georgia Tech.
Understanding types of water demand and its spatial distribution across campus is critical for
determining the general viability of water reuse and preferred siting locations of water reclamation
facilities. Furthermore, wastewater flow analysis helps quantify the volume of water that can be easily
collected and recycled to displace potable water use. The following sections outline total water use at
the Institute (Section 3.1), total water use in Basin A (Section 3.2), non-potable demand (Section 3.3),
future water demand (Section 3.4), and wastewater flow contributions (Section 3.5).
3.1. Gross Campus Water Consumption
Currently, all water use, except recycled HVAC condensate, captured stormwater, and the well for the
Burger Bowl Field, is potable water provided by the City of Atlanta. Billing data was used to calculate
gross water usage for 2011 and 2012. In total, there are over 200 individual water accounts with the City
of Atlanta, including 50 irrigation sub-meters and 24 HVAC sub-meters.
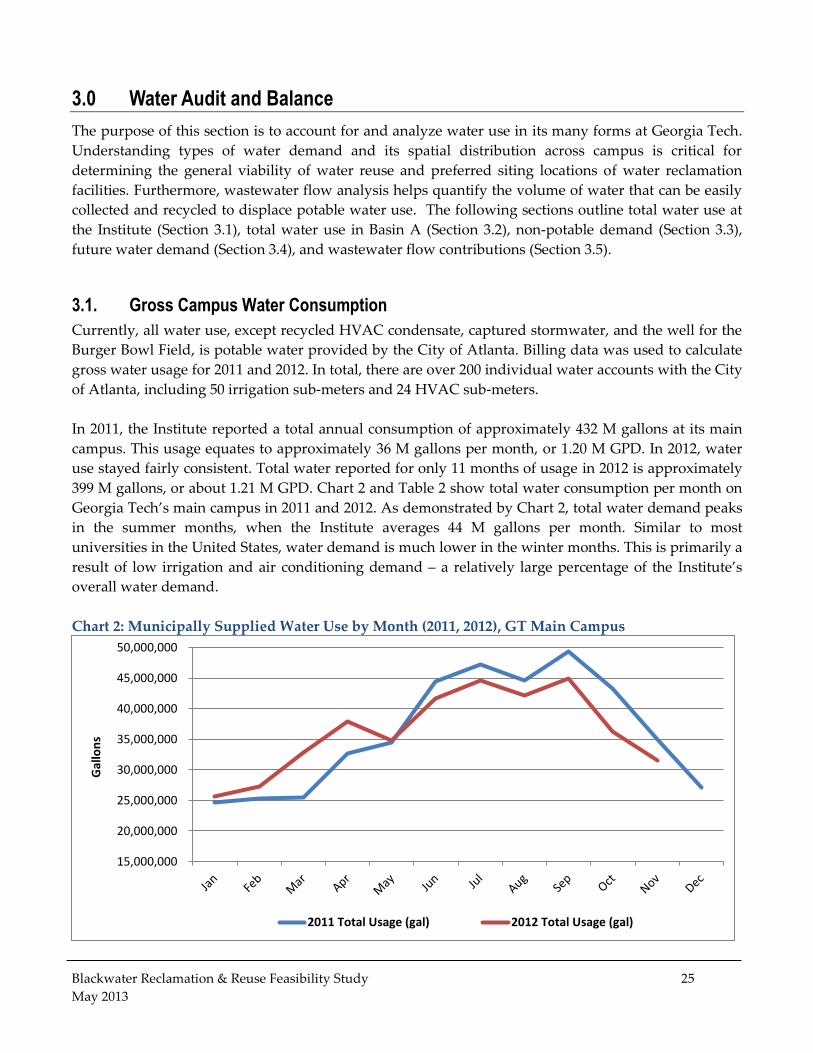
In 2011, the Institute reported a total annual consumption of approximately 432 M gallons at its main
campus. This usage equates to approximately 36 M gallons per month, or 1.20 M GPD. In 2012, water
use stayed fairly consistent. Total water reported for only 11 months of usage in 2012 is approximately
399 M gallons, or about 1.21 M GPD. Chart 2 and Table 2 show total water consumption per month on
Georgia Tech’s main campus in 2011 and 2012. As demonstrated by Chart 2, total water demand peaks
in the summer months, when the Institute averages 44 M gallons per month. Similar to most
universities in the United States, water demand is much lower in the winter months. This is primarily a
result of low irrigation and air conditioning demand – a relatively large percentage of the Institute’s
overall water demand.
Chart 2: Municipally Supplied Water Use by Month (2011, 2012), GT Main Campus
15,000,000
20,000,000
25,000,000
30,000,000
35,000,000
40,000,000
45,000,000
50,000,000
Gal
lon
s
2011 Total Usage (gal) 2012 Total Usage (gal)
Blackwater Reclamation & Reuse Feasibility Study 26
May 2013
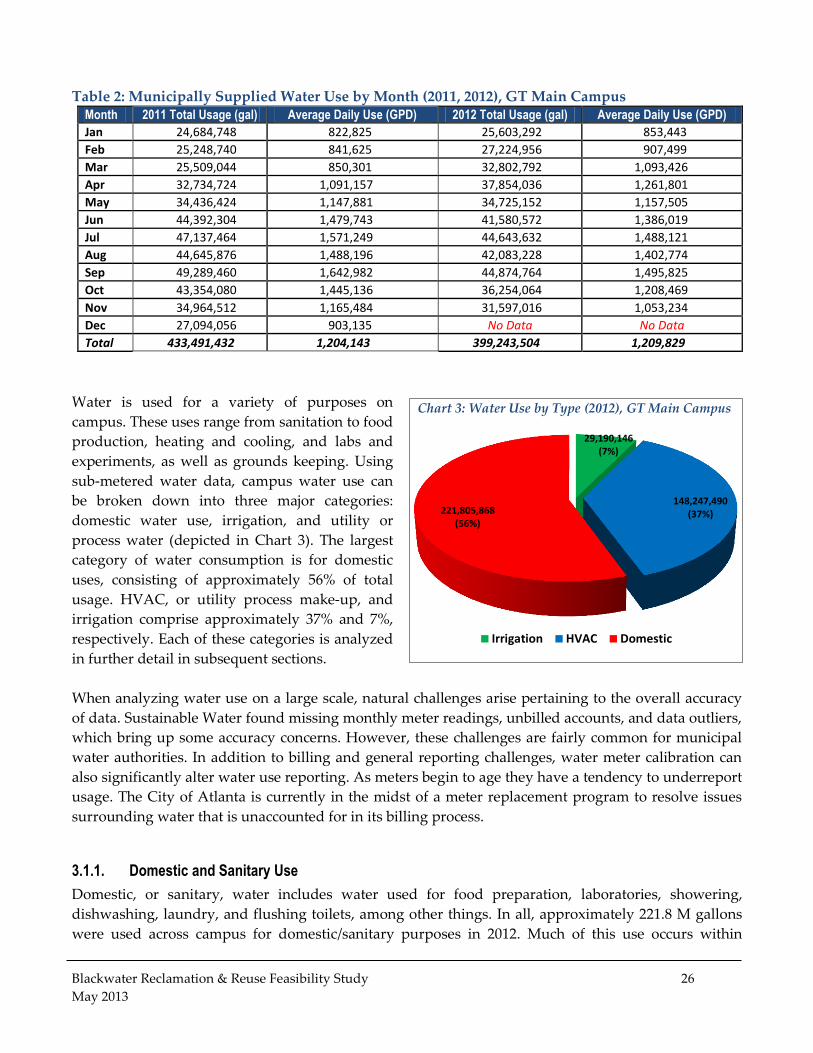
Table 2: Municipally Supplied Water Use by Month (2011, 2012), GT Main Campus Month 2011 Total Usage (gal) Average Daily Use (GPD) 2012 Total Usage (gal) Average Daily Use (GPD)
Jan 24,684,748 822,825 25,603,292 853,443
Feb 25,248,740 841,625 27,224,956 907,499
Mar 25,509,044 850,301 32,802,792 1,093,426
Apr 32,734,724 1,091,157 37,854,036 1,261,801
May 34,436,424 1,147,881 34,725,152 1,157,505
Jun 44,392,304 1,479,743 41,580,572 1,386,019
Jul 47,137,464 1,571,249 44,643,632 1,488,121
Aug 44,645,876 1,488,196 42,083,228 1,402,774
Sep 49,289,460 1,642,982 44,874,764 1,495,825
Oct 43,354,080 1,445,136 36,254,064 1,208,469
Nov 34,964,512 1,165,484 31,597,016 1,053,234
Dec 27,094,056 903,135 No Data No Data
Total 433,491,432 1,204,143 399,243,504 1,209,829
Water is used for a variety of purposes on
campus. These uses range from sanitation to food
production, heating and cooling, and labs and
experiments, as well as grounds keeping. Using
sub-metered water data, campus water use can
be broken down into three major categories:
domestic water use, irrigation, and utility or
process water (depicted in Chart 3). The largest
category of water consumption is for domestic
uses, consisting of approximately 56% of total
usage. HVAC, or utility process make-up, and
irrigation comprise approximately 37% and 7%,
respectively. Each of these categories is analyzed
in further detail in subsequent sections.
When analyzing water use on a large scale, natural challenges arise pertaining to the overall accuracy
of data. Sustainable Water found missing monthly meter readings, unbilled accounts, and data outliers,
which bring up some accuracy concerns. However, these challenges are fairly common for municipal
water authorities. In addition to billing and general reporting challenges, water meter calibration can
also significantly alter water use reporting. As meters begin to age they have a tendency to underreport
usage. The City of Atlanta is currently in the midst of a meter replacement program to resolve issues
surrounding water that is unaccounted for in its billing process.
3.1.1. Domestic and Sanitary Use
Domestic, or sanitary, water includes water used for food preparation, laboratories, showering,
dishwashing, laundry, and flushing toilets, among other things. In all, approximately 221.8 M gallons
were used across campus for domestic/sanitary purposes in 2012. Much of this use occurs within
29,190,146 (7%)
148,247,490 (37%) 221,805,868
(56%)
Irrigation HVAC Domestic
Chart 3: Water Use by Type (2012), GT Main Campus
Blackwater Reclamation & Reuse Feasibility Study 27
May 2013
buildings, and is therefore not easily separated into individual uses. Map 5 shows water use by
building for Georgia Tech’s main campus. Buildings in dark blue represent those with the highest
overall water use. Almost all of the campus wastewater production originates from this category of
water use.
Map 5: Domestic Water Use by Building (2012), GT Main Campus
3.1.2. Irrigation
Irrigation comprises approximately 7% of total water use at Georgia Tech. Currently, there are
approximately 50 locations where irrigation is applied, ranging from athletic fields to landscaping
around buildings. Twenty-eight locations are metered directly by the city, with an additional 22
locations sub-metered by Georgia Tech. A spreadsheet provided in Appendix C shows all recorded
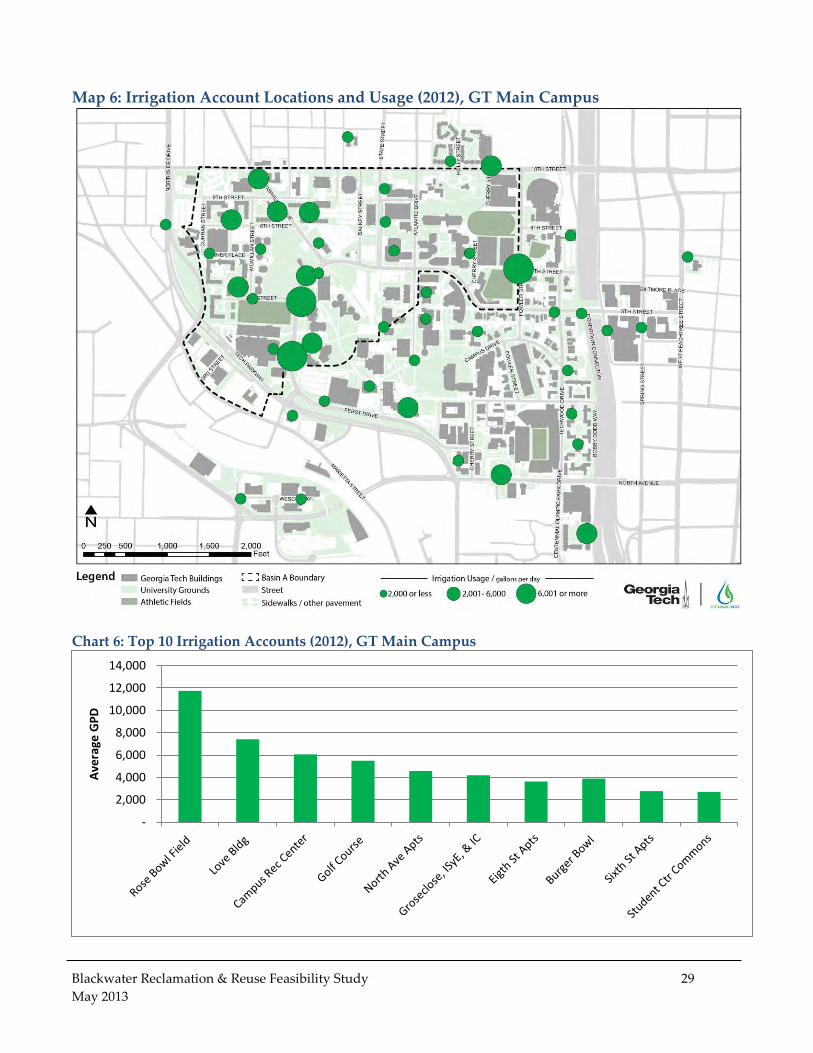
irrigation consumption on campus from April 2011 through December 2012. Map 6 shows the location
of irrigation meters on campus and their relative consumption. Chart 4 shows the total irrigation use
for the campus by month from April 2011 through December 2012.
Blackwater Reclamation & Reuse Feasibility Study 28
May 2013
It is important to note that this consumption is not comprehensive to all irrigation use on campus.
Rainwater cisterns supplement potable water use at a number of locations on campus. In addition, well
water is used to irrigate the Burger Bowl field. As a result, the actual amount of water used by Georgia
Tech for irrigation is higher than these reported values. The Institute currently performs limited
metering of these systems. The Clough Undergraduate Learning Commons is the only cistern system
that meters its effluent.
Chart 4: Irrigation Use by Month (April 2011 – December 2012), GT Main Campus
The greatest volume of irrigation use occurs in the summer months - peaking at nearly 6 M gallons per
month. Conversely, irrigation drops to virtually zero in the winter months. Chart 5 illustrates the
seasonal variation in daily irrigation use across campus. In addition to seasonal variations in irrigation
use, climatic settings greatly affect irrigation use. Local water restrictions, resulting from seasonal
drought, often decrease irrigation use in summer months.
In 2011 and 2012, the largest irrigator was the Rose Bowl field, adjacent to the Brock Football Practice
Facility (Chart 6). In 2012, this field used approximately 3.9 M gallons, or approximately 11,730 GPD
when irrigation is applied. Love Building Irrigation System was the second largest irrigator, using 2.4
M gallons, or approximately 7,414 GPD.
6,375,232 5,701,568
0
1,000,000
2,000,000
3,000,000
4,000,000
5,000,000
6,000,000
7,000,000
Usa
ge p
er
Mo
nth
(ga
l)
-
50,000
100,000
150,000
200,000
Spring Summer Fall Winter
Ave
rage
GP
D
Chart 5: Average Daily Irrigation Use by Season (April 2011 – December 2012), GT Main Campus
Blackwater Reclamation & Reuse Feasibility Study 29
May 2013
Map 6: Irrigation Account Locations and Usage (2012), GT Main Campus
Chart 6: Top 10 Irrigation Accounts (2012), GT Main Campus
-
2,000
4,000
6,000
8,000
10,000
12,000
14,000
Ave
rage
GP
D
Blackwater Reclamation & Reuse Feasibility Study 30
May 2013
3.1.3. HVAC/Utility Water Make-up
HVAC/Utility process water is the largest single point source consumer of water on campus,
comprising an estimated 37% of total consumption. At Georgia Tech, this category mainly consists of
water used for large-scale heating and cooling. Water is used intensively in these processes to create
steam heat or chilled water for basic air conditioning, humidification, sanitation and heating services.
Georgia Tech has three central chiller plants, one of which is also a steam plant. A number of satellite
cooling towers and boiler systems are used at individual buildings as well.
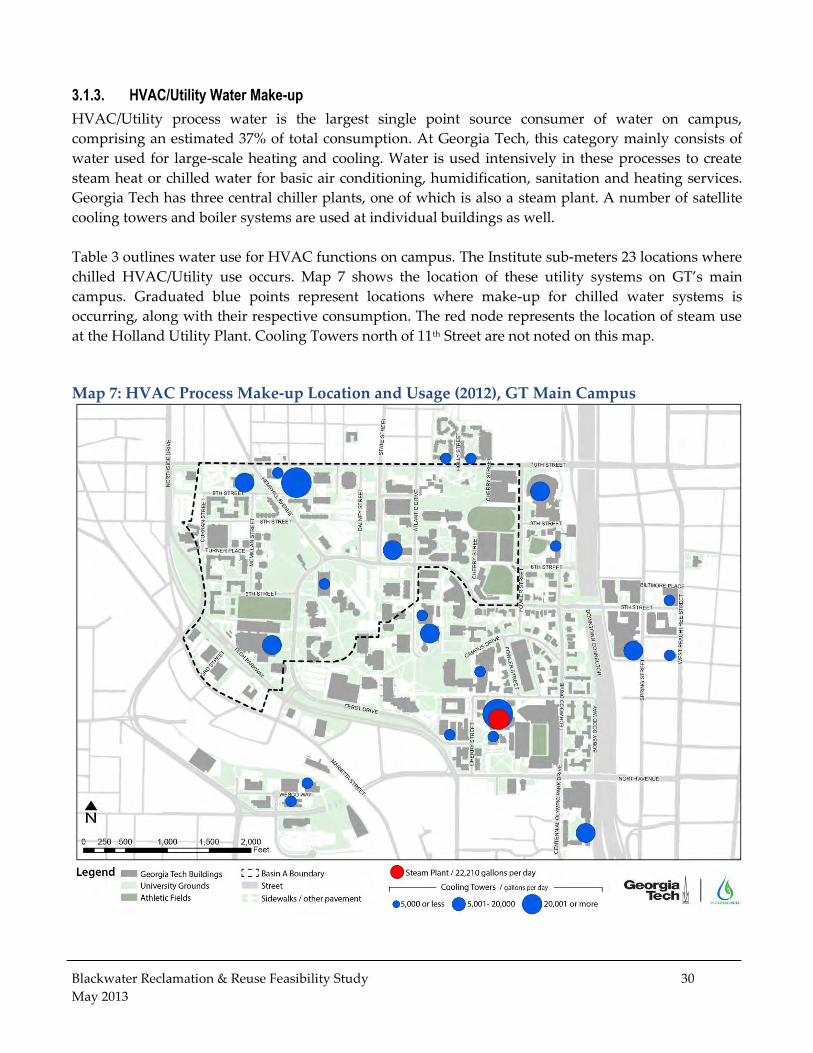
Table 3 outlines water use for HVAC functions on campus. The Institute sub-meters 23 locations where
chilled HVAC/Utility use occurs. Map 7 shows the location of these utility systems on GT’s main
campus. Graduated blue points represent locations where make-up for chilled water systems is
occurring, along with their respective consumption. The red node represents the location of steam use
at the Holland Utility Plant. Cooling Towers north of 11th Street are not noted on this map.
Map 7: HVAC Process Make-up Location and Usage (2012), GT Main Campus
Blackwater Reclamation & Reuse Feasibility Study 31
May 2013
In 2012, over 148 M gallons were used for utility make-up at an average rate of 406,000 GPD. This is
comprehensive of much of the chilled water system, but does not include make-up for satellite
(building-level) boiler systems. It does, however, include make-up for the steam plant, which accounts
for a majority of campus steam heat. Appendix C provides a detailed list and map of individual
building boiler systems on campus. A majority of these systems require relatively small volumes of
make-up.
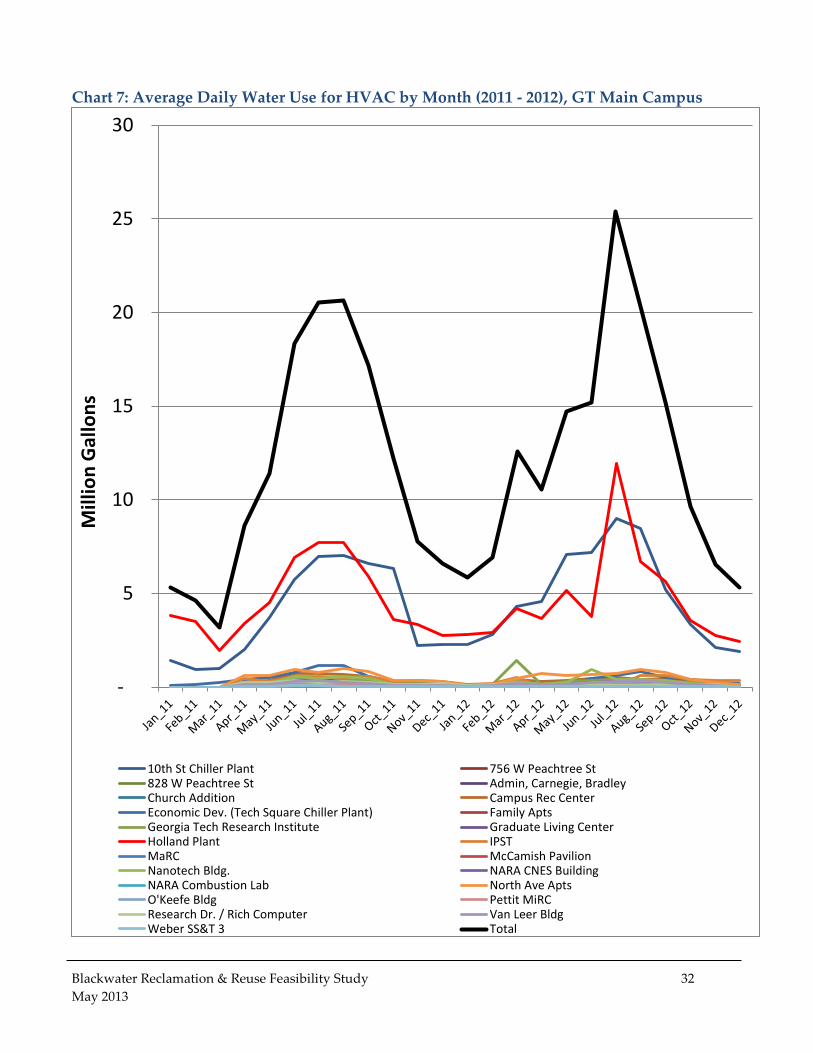
As Table 3 demonstrates, the largest users of water in this category are the 10th Street Chiller Plant and
the Holland Utility Plant. Together, they comprise nearly 77% of total HVAC/Utility water use metered
on campus. Chart 7 shows average daily water use for HVAC functions on campus between 2011 and
2012. Similar to irrigation, HVAC make-up peaks in the summer as air conditioning demand grows.
Total seasonal demand ranges from approximately 144,000 GPD in the winter to about 576,000 GPD in
the summer. Water use in the spring and fall stays relatively consistent at 327,000 and 332,000 GPD,
respectively. As Chart 7 demonstrates, only the two large utility plants (the Holland Utility Plant
shown in green and the 10th Street Chiller Plant shown in pink) stand out in terms of usage.
Table 3: HVAC/Utility Water Use by Consumption (2012), GT Main Campus
Location Bldg # Type 2012 Usage
(gal)
Months
Reporting
2012 Average
GPD 10th St Chiller Plant 133 Central Plant 58,121,300 12 161,448
Holland Utility Plant 26 Central Plant 55,449,300 12 154,026
North Ave Apartments 191 Satellite Tower 5,888,000 12 16,356
Georgia Tech Research Institute 141 Satellite Tower 3,957,100 11 11,991
Economic Development (Tech Square
Chiller Plant) 173 Central Plant 3,816,200 12 10,601
Campus Recreation Center Domestic 160 Satellite Tower 3,463,300 12 9,620
Marcus Nanotechnology Building 181 Satellite Tower 3,385,000 12 9,403
Institute of Paper Science & Technology 129 Satellite Tower 3,231,900 12 8,978
Van Leer Building 85 Satellite Tower 1,879,300 11 5,695
Graduate Living Center 52 Satellite Tower 1,565,500 12 4,349
Family Apartments 180 Satellite Tower 1,283,100 12 3,564
O'Keefe Building 33 Satellite Tower 1,230,700 12 3,419
Research Dr. Master (Rich Computer) 51 Satellite Tower 1,173,980 11 3,558
Pettit Microelectronics Research Center 95 Satellite Tower 1,059,500 11 3,211
Manufacturing Research Center 126 Satellite Tower 641,670 11 1,944
Weber Space, Science & Technology
Building 3 98 Other 327,930 12 911
NARA Combustion Lab 151 Other 252,700 11 766
756 W Peachtree St 826 Other 181,110 12 503
Church Addition 128 Other 152,210 12 423
828 W Peachtree St 178 Other 151,110 12 420
Carbon-Neutral Energy Solutions Lab 199 Other 81,500 3 906
Admin, Carnegie, Bradley Dormitories 35 Other 30,680 12 85
Total 148,247,490 417,313
Blackwater Reclamation & Reuse Feasibility Study 32
May 2013
Chart 7: Average Daily Water Use for HVAC by Month (2011 - 2012), GT Main Campus
-
5
10
15
20
25
30
Mill
ion
Gal
lon
s
10th St Chiller Plant 756 W Peachtree St828 W Peachtree St Admin, Carnegie, BradleyChurch Addition Campus Rec CenterEconomic Dev. (Tech Square Chiller Plant) Family AptsGeorgia Tech Research Institute Graduate Living CenterHolland Plant IPSTMaRC McCamish PavilionNanotech Bldg. NARA CNES BuildingNARA Combustion Lab North Ave AptsO'Keefe Bldg Pettit MiRCResearch Dr. / Rich Computer Van Leer BldgWeber SS&T 3 Total
Blackwater Reclamation & Reuse Feasibility Study 33
May 2013
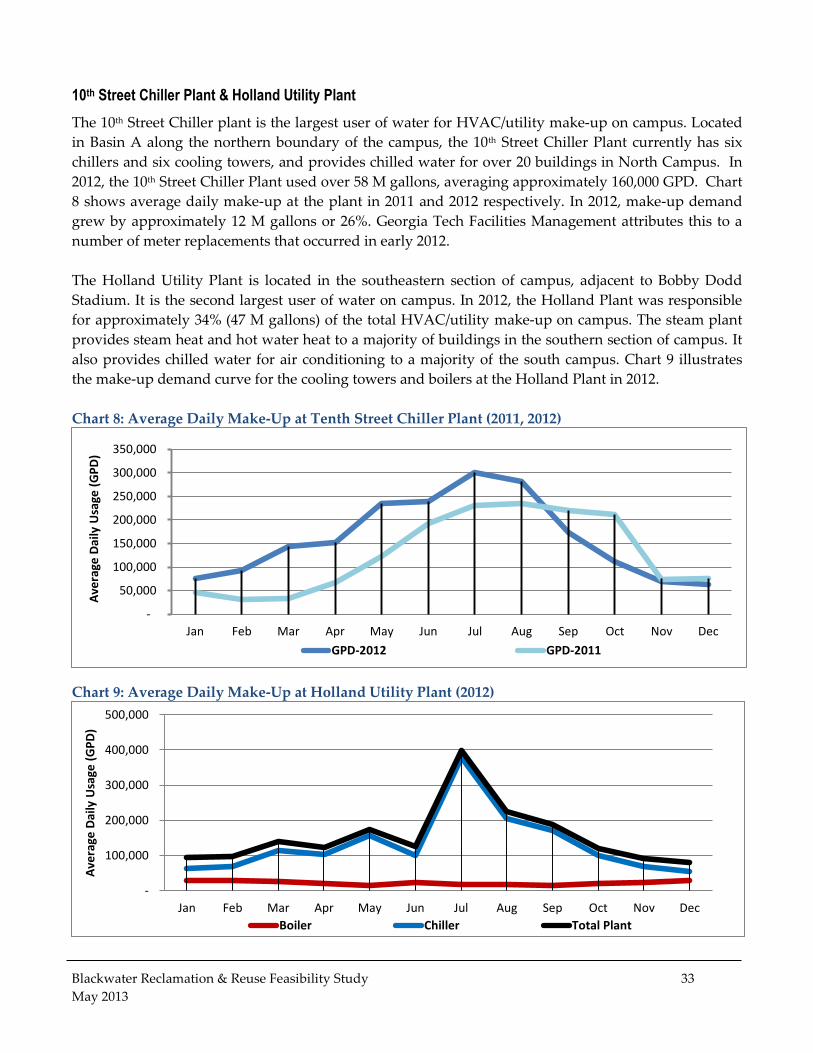
10th Street Chiller Plant & Holland Utility Plant
The 10th Street Chiller plant is the largest user of water for HVAC/utility make-up on campus. Located
in Basin A along the northern boundary of the campus, the 10th Street Chiller Plant currently has six
chillers and six cooling towers, and provides chilled water for over 20 buildings in North Campus. In
2012, the 10th Street Chiller Plant used over 58 M gallons, averaging approximately 160,000 GPD. Chart
8 shows average daily make-up at the plant in 2011 and 2012 respectively. In 2012, make-up demand
grew by approximately 12 M gallons or 26%. Georgia Tech Facilities Management attributes this to a
number of meter replacements that occurred in early 2012.
The Holland Utility Plant is located in the southeastern section of campus, adjacent to Bobby Dodd
Stadium. It is the second largest user of water on campus. In 2012, the Holland Plant was responsible
for approximately 34% (47 M gallons) of the total HVAC/utility make-up on campus. The steam plant
provides steam heat and hot water heat to a majority of buildings in the southern section of campus. It
also provides chilled water for air conditioning to a majority of the south campus. Chart 9 illustrates
the make-up demand curve for the cooling towers and boilers at the Holland Plant in 2012.
Chart 8: Average Daily Make-Up at Tenth Street Chiller Plant (2011, 2012)
Chart 9: Average Daily Make-Up at Holland Utility Plant (2012)
-
50,000
100,000
150,000
200,000
250,000
300,000
350,000
Jan Feb Mar Apr May Jun Jul Aug Sep Oct Nov Dec
Ave
rage
Dai
ly U
sage
(G
PD
)
GPD-2012 GPD-2011
-
100,000
200,000
300,000
400,000
500,000
Jan Feb Mar Apr May Jun Jul Aug Sep Oct Nov Dec
Ave
rage
Dai
ly U
sage
(G
PD
)
Boiler Chiller Total Plant
Blackwater Reclamation & Reuse Feasibility Study 34
May 2013
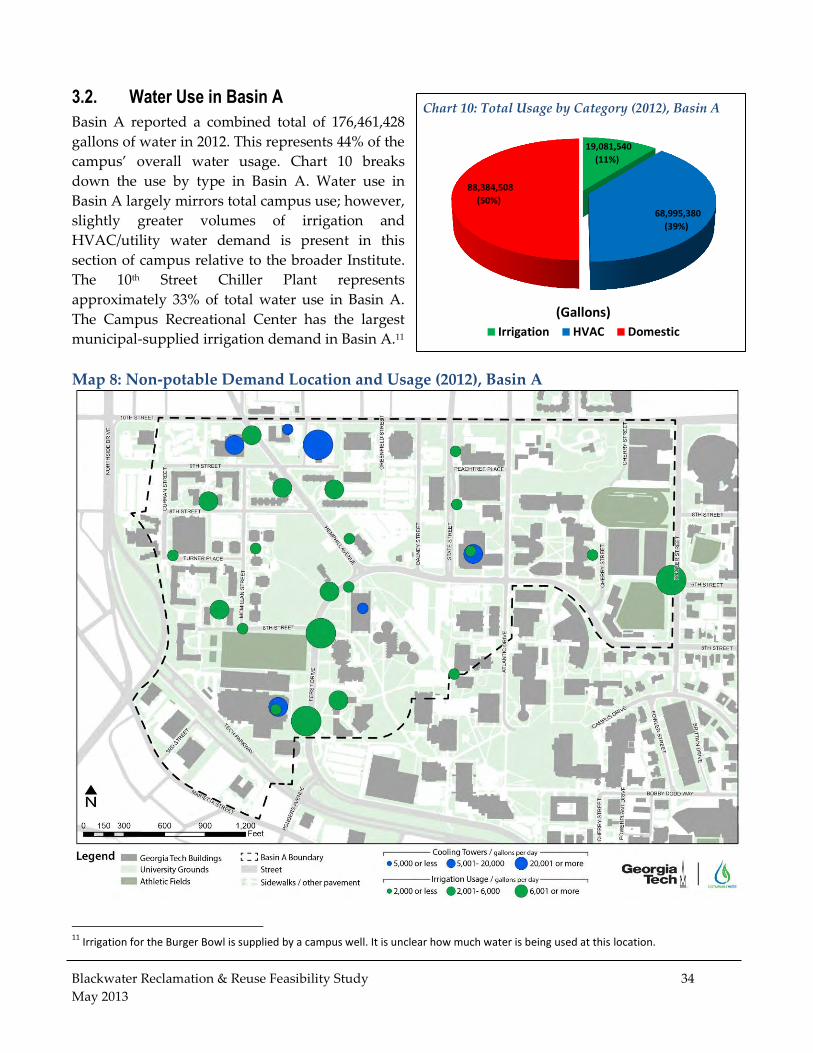
3.2. Water Use in Basin A
Basin A reported a combined total of 176,461,428
gallons of water in 2012. This represents 44% of the
campus’ overall water usage. Chart 10 breaks
down the use by type in Basin A. Water use in
Basin A largely mirrors total campus use; however,
slightly greater volumes of irrigation and
HVAC/utility water demand is present in this
section of campus relative to the broader Institute.
The 10th Street Chiller Plant represents
approximately 33% of total water use in Basin A.
The Campus Recreational Center has the largest
municipal-supplied irrigation demand in Basin A.11
Map 8: Non-potable Demand Location and Usage (2012), Basin A
11
Irrigation for the Burger Bowl is supplied by a campus well. It is unclear how much water is being used at this location.
19,081,540
(11%)
68,995,380
(39%)
88,384,508
(50%)
Irrigation HVAC Domestic
(Gallons)
Chart 10: Total Usage by Category (2012), Basin A
Blackwater Reclamation & Reuse Feasibility Study 35
May 2013
3.3. Potable vs. Non-Potable Water Demand
Georgia Tech currently uses potable water to meet nearly all of its water demand. However, not all
campus uses require potable-quality water. A large percentage of everyday water use can be replaced
by alternative sources of water, such as rainwater, gray-water, or reclaimed wastewater. Potable water
is required for human consumption or whenever there exists a potential for prolonged human contact.
All other water use could be supplemented with non-potable quality water. While acceptable non-
potable water uses vary from state to state, some common uses are: irrigation, utility process water, fire
protection, dust control, street cleaning, toilet-
flushing and decorative fountains.
Sustainable Water attempts to quantify “easily
accessible” sources of non-potable demand,
which include the largest users and systems that
can switch to an alternate source of water with
relative ease. At Georgia Tech, Irrigation and
HVAC/Utility uses comprise easily accessible
non-potable water demand. In 2012, 177 M
gallons, or 44% percent of demand, is considered
non-potable. Chart 12 breaks down average daily
non-potable water demand by season for the
entire campus. Non-potable demand is highest
in the summer months, reaching over 846,000
GPD on average. In contrast, winter months witness average daily demands of approximately 208,000
GPD. Average daily non-potable water demand for the year equates to approximately 485,000 GPD.
221,805,868 (56%)
177,437,636 (44%)
Potable Non-Potable
(Gallons)
Chart 11: Potable vs. Non-potable Demand (2012), GT
Main Campus
Spring Summer Fall Winter
Steam 20,333 20,589 19,502 28,414
Cooling Makeup 400,439 659,525 329,039 177,164
Irrigation 74,963 166,473 81,720 2,676
-
100,000
200,000
300,000
400,000
500,000
600,000
700,000
800,000
900,000
Gal
lon
s p
er
Day
Chart 12: Average Daily Non-Potable Demand by Season (2012), GT Main Campus
Blackwater Reclamation & Reuse Feasibility Study 36
May 2013
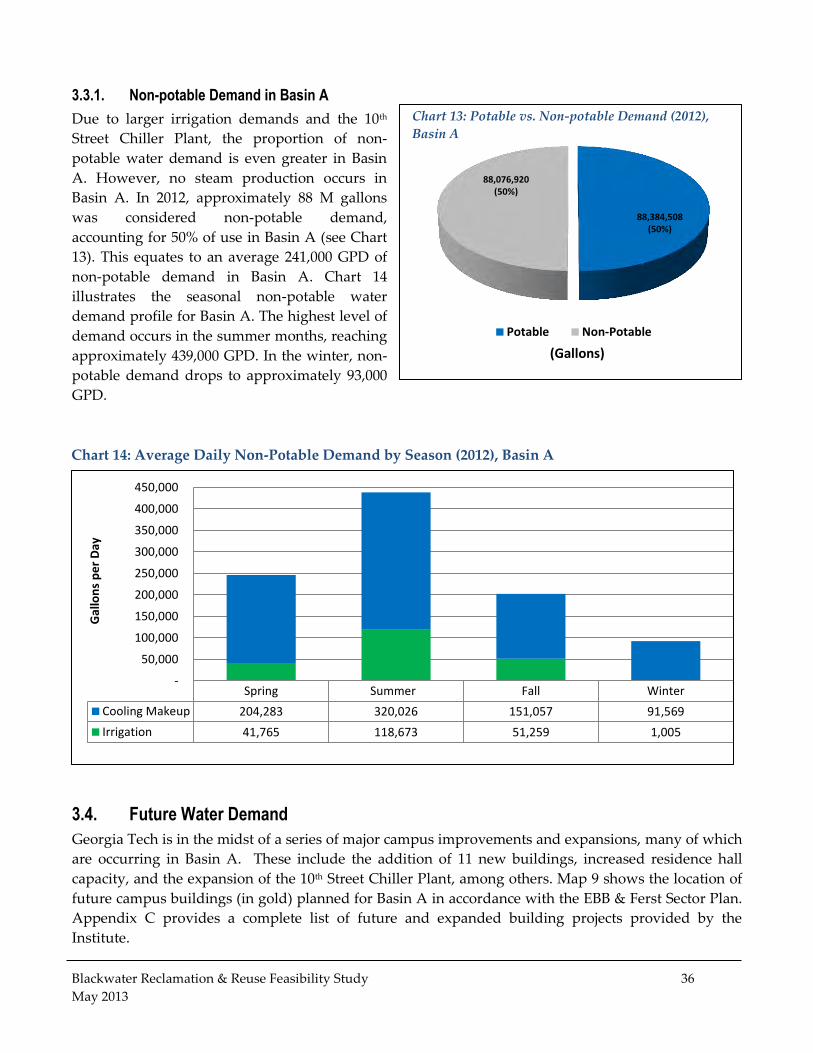
3.3.1. Non-potable Demand in Basin A
Due to larger irrigation demands and the 10th
Street Chiller Plant, the proportion of non-
potable water demand is even greater in Basin
A. However, no steam production occurs in
Basin A. In 2012, approximately 88 M gallons
was considered non-potable demand,
accounting for 50% of use in Basin A (see Chart
13). This equates to an average 241,000 GPD of
non-potable demand in Basin A. Chart 14
illustrates the seasonal non-potable water
demand profile for Basin A. The highest level of
demand occurs in the summer months, reaching
approximately 439,000 GPD. In the winter, non-
potable demand drops to approximately 93,000
GPD.
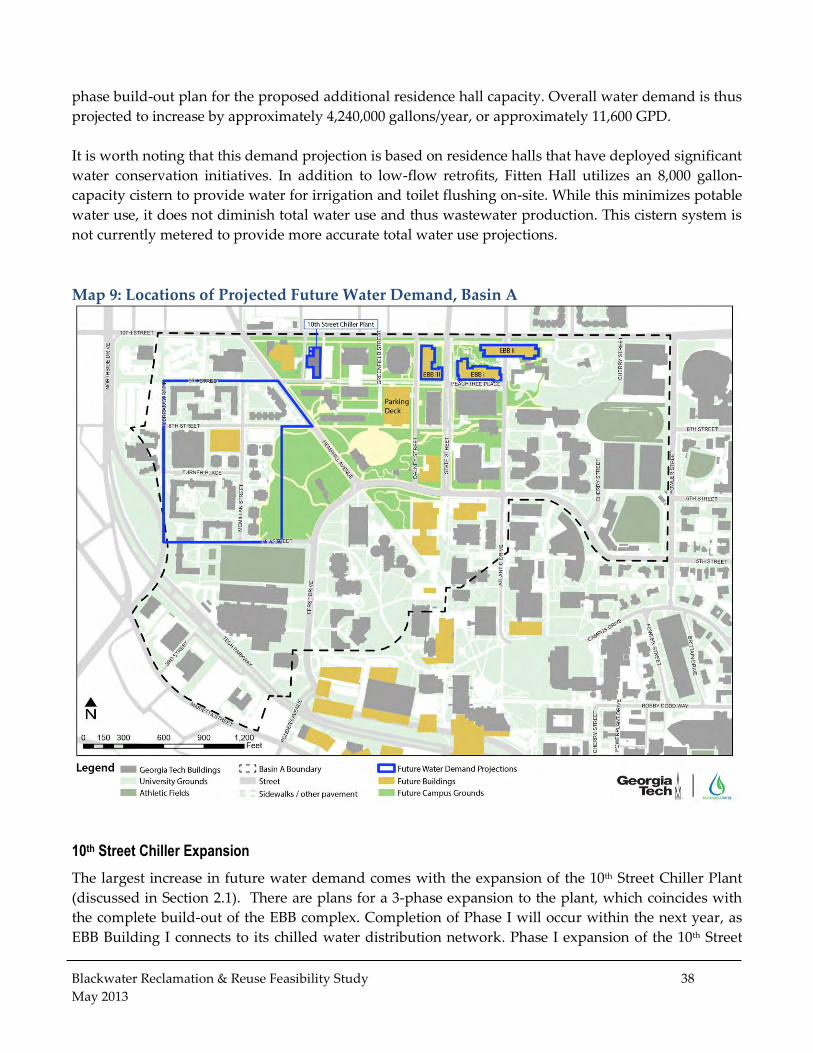
3.4. Future Water Demand
Georgia Tech is in the midst of a series of major campus improvements and expansions, many of which
are occurring in Basin A. These include the addition of 11 new buildings, increased residence hall
capacity, and the expansion of the 10th Street Chiller Plant, among others. Map 9 shows the location of
future campus buildings (in gold) planned for Basin A in accordance with the EBB & Ferst Sector Plan.
Appendix C provides a complete list of future and expanded building projects provided by the
Institute.
88,384,508 (50%)
88,076,920 (50%)
Potable Non-Potable
(Gallons)
Chart 13: Potable vs. Non-potable Demand (2012),
Basin A
Spring Summer Fall Winter
Cooling Makeup 204,283 320,026 151,057 91,569
Irrigation 41,765 118,673 51,259 1,005
-
50,000
100,000
150,000
200,000
250,000
300,000
350,000
400,000
450,000
Gal
lon
s p
er
Day
Chart 14: Average Daily Non-Potable Demand by Season (2012), Basin A
Blackwater Reclamation & Reuse Feasibility Study 37
May 2013
Table 4 shows the projected future water demand for select campus improvements over the next 10
years. Future water demand is broken out over two five-year increments. Conservative estimates were
made assuming water conservation initiatives would be deployed with each project. Detailed
descriptions regarding the estimations for each project are provided below. In total, the five projects
outlined in Table 4 are expected to increase water demand in Basin A by approximately 55M gallons
per year after Phase II.
Table 4: Future Campus Water Demand Projections
Building Name Phase I (1-5 yrs.)
Additional Use (gal)
Phase II (6-10 yrs.)
Additional Use (gal)
Total Build-Out
Use (gal)
EBB I 2,365,000 n/a 2,365,000
EBB II 2,365,000 n/a 2,365,000
EBB III n/a 2,365,000 2,365,000
800 Added Beds 2,120,000 2,120,000 4,240,000
10th St. Chiller Expansion P. 1 9,904,000 n/a 9,904,000
10th St. Chiller Expansion P. 2 16,900,000 n/a 16,900,000
10th St. Chiller Expansion P. 3 n/a 16,900,000 16,900,000
Total (gal/yr.) 33,645,000 21,385,000 55,039,000
Total (GPD) 92,203 58,589 150,792
This table is only inclusive of building projects in Basin A where there was adequate visibility to make
semi-accurate water demand projections. In other instances, building projects, such as the parking deck
planned in conjunction with the EBB II building, were left out because their water demand is not likely
to affect Basin A’s water footprint or wastewater production in any significant way. Map 9 outlines
buildings or areas (in blue) associated with the future water demand projections made in this report.
Engineered BioSystems Building Complex
The EBB I building is currently under construction. Its construction will be followed by EBB Building II
in the next 2-5 years and by EBB Building III within the next 10 years. To determine future water
demand for this research/academic building complex, Sustainable Water analyzed water demand at the
four buildings in the Ford Environmental Science and Technology (ES&T) complex, which is thought to
have similar water usage patterns. In 2011 and 2012, the ES&T complex used approximately 10.8
gallons/ft2/year. This ratio was then applied to the square footage for EBB I and projected to EBB II and
EBB III. This yielded a total increase in demand of nearly 7.1 M gallons/year between these buildings.
Additional Residence Hall Capacity
The Institute plans to increase residence hall capacity by approximately 800 beds. The exact location of
the proposed 800 beds has not been finalized, but it is assumed that it will likely occur in the area
around Eighth Street Apartments. To determine the impact this will have on future water demand,
Sustainable Water analyzed water use at Freeman, Montag, and Fitten residence halls, which were
believed to demonstrate representative water usage patterns. On average, the 361 beds in these
residence halls required approximately 5,300 gallons/bed/year. This ratio was applied across a two-
Blackwater Reclamation & Reuse Feasibility Study 38
May 2013
phase build-out plan for the proposed additional residence hall capacity. Overall water demand is thus
projected to increase by approximately 4,240,000 gallons/year, or approximately 11,600 GPD.
It is worth noting that this demand projection is based on residence halls that have deployed significant
water conservation initiatives. In addition to low-flow retrofits, Fitten Hall utilizes an 8,000 gallon-
capacity cistern to provide water for irrigation and toilet flushing on-site. While this minimizes potable
water use, it does not diminish total water use and thus wastewater production. This cistern system is
not currently metered to provide more accurate total water use projections.
Map 9: Locations of Projected Future Water Demand, Basin A
10th Street Chiller Expansion
The largest increase in future water demand comes with the expansion of the 10th Street Chiller Plant
(discussed in Section 2.1). There are plans for a 3-phase expansion to the plant, which coincides with
the complete build-out of the EBB complex. Completion of Phase I will occur within the next year, as
EBB Building I connects to its chilled water distribution network. Phase I expansion of the 10th Street
Blackwater Reclamation & Reuse Feasibility Study 39
May 2013
Chiller Plant also includes designs to move to a Water Conservation Technology International (WCTI)
treatment program, which will eliminate cooling tower blow down and thus decrease make-up water
demands by approximately 12% against 2012 baseline standards.
RMF Engineering originally predicted increased water demand at the plant using 2011 make-up water
as a baseline. However, the significant increase in water use after installing calibrated water meters
calls into question the accuracy of these predictions. Furthermore, final approval for transitioning to the
WCTI Treatment Program occurred after the completion of the RMF report. As a result, future water
demand projections were revised by using 2012 make-up as a baseline and incorporating the make-up
demand changes associated with the new WCTI treatment program. Appendix C provides a table
outlining revised make-up projections in detail.
Chart 15 shows future water demand projections over the three phases in gallons per day. If
implemented, the Phase III expansion would effectively double the cooling capacity of the plant and
increase make-up water demand by approximately 75% over 2012 levels. However, due to capacity
limitations with the chilled water distribution network, it is unlikely that Phase III will come to fruition.
Plans for Phases I and II seem more definitive. Phase I is projected to increase total demand from 58.1
M gallons to 68.0 M gallons annually – an increase of approximately 17% compared to current (2012)
demand. Phase II is projected to increase total demand to 84.9 M gallons – an increase of approximately
46% compared to current demand.
Chart 15: Future Water Demand at 10th Street Chiller Plant after WCTI Implementation
-
100,000
200,000
300,000
400,000
500,000
600,000
Jan Feb Mar Apr May Jun Jul Aug Sep Oct Nov Dec
Gal
lon
s p
er
Day
2012 Baseline Phase 1 Phase 2 Phase 3
Blackwater Reclamation & Reuse Feasibility Study 40
May 2013
3.5. Wastewater Flow Contributions
Factors affecting the quantity of wastewater flow from a given property relate to: 1) human water
consumption, 2) evaporative losses due to irrigation or utility process water, and 3) line losses due to
leaks. Since wastewater is unmetered at Georgia Tech, wastewater flow volumes are typically
estimated based on water consumption. The City of Atlanta assumes a 1:1 ratio between water use and
wastewater generation for billing purposes. However, a large proportion of the water consumed on
campus is lost to evaporation and runoff. The City does honor a diverted wastewater credit for metered
irrigation and HVAC/utility uses.
This study was careful not to overestimate wastewater flow contributions because those estimations
correlate to the availability of recyclable water on-site. To determine wastewater production by
building, most campus buildings were assigned an 85% wastewater flow rate. Any known irrigation
use or HVAC uses associated with a given building was factored out before this flow rate was applied.
Wastewater flows from cooling tower systems were considered to be 10% of make-up water demand.12
Wastewater flows from boiler systems were considered to be 2% of make-up water demand.
Conservative flow modeling demonstrated an approximate 50% return for all water consumed on
campus. In total, Institute-owned buildings contributed approximately 212 M gallon of wastewater to
the municipal collection system in 2012 – equating to approximately 580,000 GPD on average. The
buildings with the largest wastewater flow returns in 2012 were North Ave Apartments (71,234 GPD),
Nanotechnology Building (38,707 GPD), Family Housing Apartments (37,810 GPD), and 8th Street
Apartments (27,314 GPD). A comprehensive list of all Georgia Tech buildings and their associated
wastewater flows can be found in Appendix C.
Map 10 shows wastewater flow contributions by building for Georgia Tech’s main campus in 2012.
Buildings in dark brown produced the largest wastewater flow rates, while buildings in yellow
produced the smallest flow rates. A number of buildings in gray had no wastewater production values,
which is a result of one of three factors:
Shared Account Data – multiple buildings had a shared or common water meter with an
adjacent building; and, therefore all wastewater flow production is associated with just one
building. Examples of this occurred at Center Street Apartments and the Manufacturing
Related Disciplines Complex.
No Account Data – some buildings, such as Greek Housing, are non-Institute owned
buildings, and water usage is not tracked by the Institute.
No Water Use – multiple buildings, such as the Burge Parking Deck and Student Center
Parking Deck, had zero water use over the course of 2012.
12
Average cooling tower blow-down (water returned to the sewer) varied between 10%-20% depending on the system and the season.
Blackwater Reclamation & Reuse Feasibility Study 41
May 2013
Map 10: Wastewater Flow Contributions by Building (2012), GT Main Campus
Once wastewater production by building was estimated, wastewater flow by line can be analyzed
based on Georgia Tech’s wastewater collection system. In accordance with the campus Stormwater
Master Plan, wastewater is thought to primarily shed between Basin A and B. Much of Basin A feeds
into an 18-inch collector and eventually into the Original Orme Street Sewer. Much of Basin B is
believed to shed into the Orme Street Relief Sewer. Both sewer collectors exit the main campus at 10th
Street approximately 350 feet apart.
Map 11 demonstrates the wastewater flow modeling at five measurement points on campus. Campus
buildings (shown in pink and yellow) are divided between Basin A and B, and represent wastewater
flows originating in North Campus and South Campus, respectively. Buildings in pink contribute to
measurement points 1, 2 and 3. Buildings in yellow contribute to flow measurement points 4 and 5.
Point 3, which includes wastewater production from Family Housing, modeled the overall highest
wastewater flows on campus. Flows at measurement point 3 are inclusive of flows at points 1 and 2.
Flows at measurement point 5 are inclusive of point 4.
Blackwater Reclamation & Reuse Feasibility Study 42
May 2013
This model underrepresents total available wastewater feedstock in the campus sewer collection
network. A number of buildings in the southern section of campus, such as Greek Housing, have no
data in this model. In addition, a number of non-Institute buildings south of North Avenue also
contribute wastewater flows to measurement Points 4 and 5. Table 5 shows the detailed flow modeling
results for each measurement point.
Wastewater flows at each measurement point were also analyzed from a seasonal perspective. A small
spike in wastewater production is seen at each location in the fall. At point 3, this spike corresponded
to a 26% increase in flow between summer and fall. Winter and summer saw comparative flow rates,
while fall flows always exceeded spring flow rates in this model. A wastewater flow measurement
study should be performed to validate wastewater flow volumes and seasonal flow variations.
Map 11: Wastewater Flow Modeling, GT Main Campus
Blackwater Reclamation & Reuse Feasibility Study 43
May 2013
Table 5: Modeled Wastewater Flows at Select Locations on Campus
The wastewater flow projections calculated here are very conservative in terms of quantifying
additional wastewater feedstock availability. Wastewater produced from the additional residence hall
capacity is likely underestimated as a result. However, if these values are applied to the flow modeling
in Section 3.5, approximately 60% of this future flow will be seen at measurement point 1; and 100% of
this flow will be seen at measurement point 2.
Blackwater Reclamation & Reuse Feasibility Study 44
May 2013
4.0 Water Quality and Utility Water Treatment Audit
Water quality is a critical issue for both treatment processes and end-users of water. Reclaimed water
must be compatible with its end-users in order to have a successful reuse program that provides a level
of operational reliability to the campus. Central Utility Plants are the largest point-source water
consumer on campus that can use non-potable water supplies, which makes them a primary target for
reclaimed water. However, utility systems are significant campus assets that require 100% uptime; and,
therefore require proper management.
This section of the report looks at the water quality of various streams of water and the existing utility
water treatment program implemented at the 10th Street Chiller Plant in order to ensure that
wastewater can be safely and reliable reused at Georgia Tech. This section is broken into two
subsections: 4.1: Water Quality and Characteristics and 4.2: Utility Water Treatment Program
Assessment.
Overall, no evidence exists that suggests a water reclamation and reuse program would not be
successfully administered at Georgia Tech. The utility water audit produced results that are conducive
to water reclamation and reuse. The current water treatment program administered at utility plants
consistently produces high-quality results. Equipment conditions appear to be appropriate for the age
of the systems, and operator expertise is sophisticated enough to implement a successful treatment
program utilizing reclaimed water.
4.1. Water Quality and Characteristics
Water quality is a critical issue for understanding overall treatability – whether that pertains to city
water used as make-up in utility systems or wastewater streams used as feedstock in a reclamation
process. Sustainable Water attempts to benchmark water quality characteristics for each source of
water: drinking water from the City of Atlanta, raw groundwater characteristics from campus wells,
and wastewater (blackwater). This is done in order to understand natural characteristics of regional
water sources and develop a treatment process that is tailored specifically to any end-use applications
at Georgia Tech.
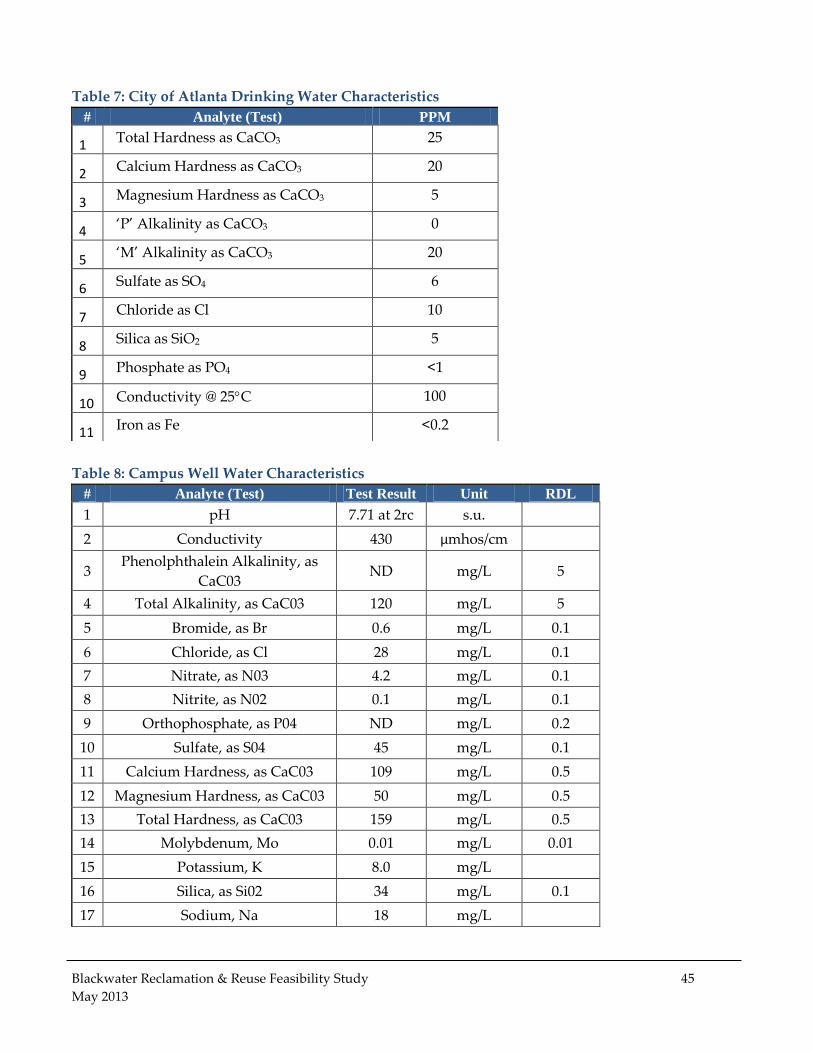
4.1.1. Drinking Water and Well Water Characteristics
Water quality will vary from region to region depending on the source, natural geologic and
environmental conditions, as well as human influences. The basic constituents of water are important
to understand, as any elements naturally present will also prevail or be magnified in wastewater
streams. At Georgia Tech, Garratt Callahan performs laboratory testing on potable water provided by
the City of Atlanta, and, on occasion, groundwater quality at the request of the Institute. Currently, city
water is used as process make-up in the utility plants. Table 7 examines the approximate constituents
(in parts per million, or PPM) of numerous analytes pertinent to the Institute’s chemical treatment
program. Table 8 examines the approximate constituents of well water, which will be an alternate
source of make-up water at the 10th Street Chiller Plant beginning in 2014.
Blackwater Reclamation & Reuse Feasibility Study 45
May 2013
Table 7: City of Atlanta Drinking Water Characteristics
Table 8: Campus Well Water Characteristics
# Analyte (Test) PPM
1 Total Hardness as CaCO3 25
2 Calcium Hardness as CaCO3 20
3 Magnesium Hardness as CaCO3 5
4 ‘P’ Alkalinity as CaCO3 0
5 ‘M’ Alkalinity as CaCO3 20
6 Sulfate as SO4 6
7 Chloride as Cl 10
8 Silica as SiO2 5
9 Phosphate as PO4 <1
10 Conductivity @ 25C 100
11 Iron as Fe <0.2
# Analyte (Test) Test Result Unit RDL
1 pH 7.71 at 2rc s.u.
2 Conductivity 430 µmhos/cm
3 Phenolphthalein Alkalinity, as
CaC03 ND mg/L 5
4 Total Alkalinity, as CaC03 120 mg/L 5
5 Bromide, as Br 0.6 mg/L 0.1
6 Chloride, as Cl 28 mg/L 0.1
7 Nitrate, as N03 4.2 mg/L 0.1
8 Nitrite, as N02 0.1 mg/L 0.1
9 Orthophosphate, as P04 ND mg/L 0.2
10 Sulfate, as S04 45 mg/L 0.1
11 Calcium Hardness, as CaC03 109 mg/L 0.5
12 Magnesium Hardness, as CaC03 50 mg/L 0.5
13 Total Hardness, as CaC03 159 mg/L 0.5
14 Molybdenum, Mo 0.01 mg/L 0.01
15 Potassium, K 8.0 mg/L
16 Silica, as Si02 34 mg/L 0.1
17 Sodium, Na 18 mg/L
Blackwater Reclamation & Reuse Feasibility Study 46
May 2013
4.1.2. Wastewater Characteristics
There was no existing wastewater sampling data for Georgia Tech’s main campus. Subsequent work is
planned to perform composite sampling in addition to wastewater flow monitoring at select locations.
Once performed, sampling will provide detailed information with regard to wastewater quality, which
is essential to help properly size a treatment facility and model end-use quality.
While no wastewater sampling has occurred near Georgia Tech’s campus, Sustainable Water has
performed wastewater sampling studies in other areas of the Metro Atlanta region. Characteristics of
wastewater streams from similar land uses in DeKalb County were found to have medium to low
levels of Biochemical Oxygen Demand (BOD5), Chemical Oxygen Demand (COD), Ammonia,
Nitrogen, and Phosphorus. If representative of Georgia Tech’s waste stream, no major impediments to
water reclamation are foreseen. Section 5.2 shows wastewater characteristics used for facility sizing in
lieu of having specific wastewater characteristics for Georgia Tech.
4.2. Utility Water Treatment Program Assessment
Utility, or process water, refers to water used in manufacturing, industrial, or utility applications. These
applications usually include rinsing, plating, coating, cooling, or heating. At Georgia Tech, process
water is used for HVAC systems. This includes water use for boiler and cooling tower make-up.
(Section 3.2.2 outlines campus water use for these applications.) At Georgia Tech, utility process water
is the largest source of non-potable water demand on campus—equating to 84% of campus non-potable
demand. In any water reuse program, utility plants will offer the greatest potential cost savings, as they
require the least amount of infrastructure costs per gallon of water delivered.
Sustainable Water performed a Utility Water Treatment Program Assessment to ensure that reclaimed
water could reliably be reused on site. This assessment looked at two major facets of utility water use,
addressed in the following sections: 4.2.1: Utility Equipment and Conditions and 4.2.2: Treatment
Program Administration. Comprehensively, this assessment sought to:
Understand/inspect equipment uses and conditions;
Review maintenance history and upkeep;
Understand frequency and accuracy of existing treatment programs;
Confirm the expertise of water treatment companies and operators;
Analyze products dosages, consumption, and cost of programs;
Review laboratory testing results; and
Establish baseline metrics for corrosion, biological growth, and solids deposition for historical
benchmarking.
4.2.1. Utility Equipment and Conditions
Over the years, Georgia Tech has increased its physical footprint, which results in a constant need to
expand capacity at central chiller and steam plants. Incremental additions to air conditioning and
heating capacity result in different generations of utility equipment, at various stages of useful life,
reliability, and efficiency. Chillers, boilers, and cooling towers will vary in condition based on age,
Blackwater Reclamation & Reuse Feasibility Study 47
May 2013
upkeep, use, and environment. A major objective of the feasibility study is to ensure that utility
systems that may receive reclaimed water are operating effectively and in relatively good condition.
As the only chiller plant in Basin A, equipment conditions assessments were limited to the 10th street
chiller plant. A tour of the 10th Street Chiller Plant was performed by Sustainable Water in February of
2013. During this walk through, chiller systems seemed to be operating normally. No outstanding
equipment defects, hazards, or problems were noticed. Prior to this walkthrough, a list of operating
chillers and their specifications was provided by Georgia Tech Facilities Management. Table 9 outlines
this information.
Table 9: 10th Street Chiller Specifications
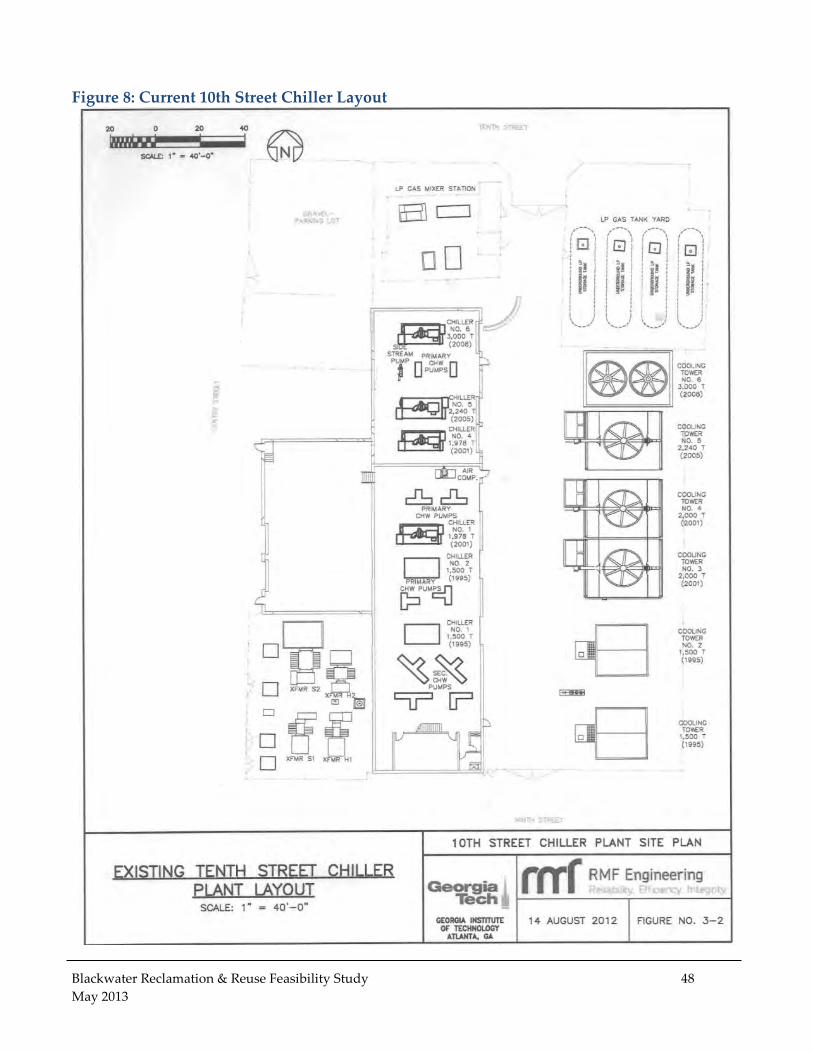
The 10th Street Chiller Plant has six electric centrifugal or dual centrifugal chillers and six cooling
towers. The chillers range in size from 1,500 to 3,000 tons of capacity and have a total available capacity
of approximately 12,200 tons. The age and model of the chillers vary. Five of the six chillers were
designed by York; one was designed by McQuay. The first chillers were installed in 1995 – making
these units approximately 17 years old. The newest chiller, the largest unit, was installed in 2008.
Overall, the average age of the chillers is approximately 11 years.
The 10th Street Chiller Plant currently serves 27 buildings in North Campus, but is also interconnected
with Holland’s chilled water distribution system (serving the southern part of campus) by a series of
valves. The chilled water system relies on a series of primary and secondary pumps. Six primary
(dedicated) pumps circulate water through the plant and four secondary pumps circulate water
through the North Campus distribution system. Each primary pump can only operate with its paired
chiller. The secondary pumps are rated at 400 horsepower and designed for 9,600 gallons per minute.
The cooling towers are a combination of cross-flow as well as field-erected cross- and counter-flow
types. Each tower and pump is designed to serve a single chiller. Each tower has its own chemical
management system. The current layout of the 10th Street Chiller Plant and its configuration of cooling
towers can be seen in Figure 8. Design parameters of the chillers are provided in Appendix D.
# Manuf. Chiller
Type
Date
Installed
Tonnage Refrigerant
Type
Condenser
Type
Voltage
1 York Centrifugal 1995 1,500 HFC-134a Tower-open 4,160
2 York Centrifugal 1995 1,500 HFC-134a Tower-open 4,160
3 York Centrifugal 2001 1,978 HFC-134a Tower-open 4,160
4 York Centrifugal 2001 1,978 HFC-134a Tower-open 4,160
5 McQuay
Dual Centrifugal
2005 2,250 HFC-134a Tower-open 4,160
6 York
Dual Centrifugal
2008 3,000 HFC-134a Tower-open 4,160
Blackwater Reclamation & Reuse Feasibility Study 48
May 2013
Figure 8: Current 10th Street Chiller Layout
Blackwater Reclamation & Reuse Feasibility Study 49
May 2013
Georgia Tech Facilities Management is responsible for the overall operation and maintenance of
campus utility systems. The utility water treatment program is outsourced to Garratt Callahan – which
has a regional headquarters in Atlanta. Garratt Callahan’s technicians are typically on site once a week
to check water quality parameters and the general administration of the treatment program.
Utility Water Audit Forms were provided by Sustainable Water to gather pertinent information about
the 10th Street Chiller Plant. Forms were completed by Garratt Callahan technicians upon request from
Georgia Tech Facilities Management. Completed audit forms can be found in Appendix D of this
report. The audit requests various historical data and literature to help assess the treatment program
and equipment conditions. Data requests pertinent to equipment condition were as follows:
Inspection reports from the past five years,
Boiler and chiller video inspection results from the past five years
Five-year historical corrosion coupon data, and
Non-destructive integrity assessments (i.e., ultrasonic testing and EDDY Current
Testing) from the past five years.
Garratt Callahan provided field reports and operator logs for January 2011 through December 2012.
During this time period, operators kept meticulous logs indicating equipment defects and system
operations. On numerous occasions, field reports identify minor equipment problems – such as needed
piping repairs, leaks, or faulty control systems. Once noted, repairs are made by Georgia Tech Facilities
Management. Beyond normal wear and tear, field reports did not indicate any major flaws or
equipment problems.
Outside of the provided field reports, Georgia Tech has limited supplemental information pertaining to
equipment conditions. To our knowledge, no chiller video inspections or non-destructive integrity
assessments have been performed at the 10th Street Chiller Plant within the last five years. Moving
forward, it is recommended that EDDY Current testing be performed on each chiller as a part of
routine maintenance.
In October 2012, RMF Engineering released a draft report of its findings related to the 10th Street Chiller
Plant. The report did not cite any major problems or concerns with existing equipment or performance.
Consequently, RMF assumes that existing equipment will be able to maintain its current capacity over
the next 10 years as new chillers accommodate future cooling requirements for the additional 1.1
million gross-square feet of building space planned for North Campus.
4.2.2. Treatment Program Administration
Water quality plays a major role in the efficiency and lifespan of utility equipment. To protect
expensive utility equipment, a water treatment program is always administered, regardless of the
water source (drinking water, well water, or reclaimed water), to ensure the highest level of
compatibility with the utility process. A proper water treatment program will safeguard utility systems
from unnecessary water consumption, along with providing corrosion, mineral deposition, scaling, and
microbiological control within the system. In addition to this, the efficacy of a utility water treatment
Blackwater Reclamation & Reuse Feasibility Study 50
May 2013
program ultimately plays a significant role in the heat-transfer efficiency and lifespan of utility systems.
When properly administered, water treatment ensures safe and reliable operations.
Sustainable Water reviewed treatment products, chemical treatment dosages, historical chemical usage,
program costs, operator test logs, field reports, chemical feed automation, control equipment,
laboratory analyses, and corrosion monitoring data to better understand GT’s existing treatment
program. A reclaimed water program may cause a slight change in influent water characteristics at
utility systems, which may require subsequent adjustments to the treatment program administered. At
the start of the feasibility process, Sustainable Water requested various historical data and literature to
help review the treatment programs at the large area-wide utility plants. This data request included:
Treatment program design specifications,
Any laboratory testing from past years,
Operator log sheets/test logs from past years,
Chemical treatment supplier service reports from the past two years, and
Five-year historical corrosion coupon data.
The Utility Water Audit form (provided in Appendix D) captured most of the detail pertaining to the
administration of the treatment program. Overall, operator testing at the 10th Street Chiller Plant is
thought to be consistent and comprehensive – showing extensive operator expertise. Systems are
currently treated via a conventional inhibitor and dual alternating biocide treatment program. Table 10
summarizes the chemical treatment controls used in the cooling towers, the chilled water closed loop
and the hot water closed loop. Product Material Safety Data Sheets (MSDS) are provided in Appendix
D.
The conventional treatment program applied at the 10th Street Chiller Plant is appropriate and
achieving excellent results in terms of efficiency. Cooling Towers are operating at about 10 cycles of
concentration. Georgia Tech Facilities Management cycles chillers to spread load between units as far
as possible. Systems cycle between idle and duty depending on load. Tower blow down occurs via
conductivity control. Cycles are limited by hardness, and to a certain extent, suspended solids in the
tower sump. There is no acid or caustic feed to these systems as make-up water quality does not dictate
that this would be necessary. The systems could gain some improvement through the use of traced
chemical inhibitor which will dose chemical inhibitor based on demand and use.
Field reports show that products and chemical dosages have been maintained consistently by Garratt
Callahan, and historical use demonstrates reliable and consistent chemical consumption in accordance
with program targets. This indicates reliable operator control and automation and quick, responsive
action. For corrosion monitoring, the 10th Street Chiller Plant utilizes an on-line CorTrac corrater unit
installed by Garratt Callahan. The unit measures mild steel and copper corrosion. Results of the
corrater were not provided, but there is no indication from field reports of outstanding corrosion issues
with any of the condensers or evaporator units.
Blackwater Reclamation & Reuse Feasibility Study 51
May 2013
Table 10: Chemical Treatment Controls at 10th Street Chiller Plant
Charts 16 and 17 track inhibitor feed and thermal conductivity on a weekly basis throughout 2012.
These are important control parameters that are constantly analyzed by Garratt Callahan. The
following descriptions outline these controls tests as they relate to the 10th Street Chiller Plant:
Molybdate is a control test for the corrosion inhibitor applied by Garratt Callahan.
Molybdenum itself is a corrosion inhibitor and scale control product. Molybdate target
concentrations are between 0.5 and 1 ppm.
Thermal Conductivity, also known as conductance, is a material’s ability to conduct heat. With
regard to cooling water systems, it demonstrates scale control and reliability of automation
(automatic blow down). Conductivity levels typically indicate mineral levels in water and are
used to help optimize water conservation and minimize risk of scaling deposition and
corrosion. Target conductivity results are between 750 and 1,000 ℧.
Variation in concentration levels is expected as influent water quality can change daily. Operator logs
and testing demonstrate that the current treatment program is operating with timely corrective actions
when treatment residuals are out of specification. Field service reports and laboratory analyses provide
additional validation of proper program implementation.
Overall, review of available data shows consistent control over corrosion, deposition, and biological
growth. Not all data requests were fulfilled during the Utility Program Audit, but disclosed data does
indicate adequate program control and expertise. It is Sustainable Water’s opinion that Garratt
Callahan delivers cost-effective water treatment program results, well within industry standards.
Garratt Callahan expressed comfort using reclaimed water as a make-up source for the 10th Street
Location Product Feed
Point
Generic
Type
Active
Ingredient
Desired
Concentration
Control
Test
Cooling Towers
GC-222-L Chemical
Bypass
Corrosion
Inhibitor
Sodium
Hydroxide
150 PPM based
on makeup Molybdate
GC-3338 Chemical
Bypass Biocide 1
Halogenated
Complex,
Sodium
Hydroxide
60 ppm twice
per week Halogen
GC-312 Chemical
Bypass Biocide 2 Glutaraldehyde
120 ppm once
per week None
Chilled Water Closed Loop
GC-16 Bypass
Feeder
Corrosion
Inhibitor Sodium Silicate 3lb./1,000 gal. Si
GC-2018 Bypass
Feeder Biocide
Sodium
Tolyltriazole 0.2lb./1,000 gal. Azole
Hot Water Closed Loop
GC-12L Bypass
Feeder
Closed
System
Corrosion
Inhibitor
Sodium Nitrite;
Sodium
Tolyltriazole;
Sodium
Hydroxide
20 lb./1,000 gal.
(as required) Nitrite
Blackwater Reclamation & Reuse Feasibility Study 52
May 2013
Chiller Plant, and has demonstrated significant expertise utilizing reclaimed water in the past. The
level of sophistication and expertise present between Georgia Tech Facilities management and Garratt
Callahan will be more than adequate to implement a reclaimed water program, which can be as
reliable, efficient, and safe as utilizing city-supplied water. Specific changes to chemical controls and/or
equipment currently used in the utility water treatment program will be explored during the
engineering and design phase of a water treatment program once specific effluent water quality is
better understood.
Chart 16: Cooling Tower Molybdate Level vs. Time, 10th Street Chiller Plant (2012)
Chart 17: Cooling Tower Thermal Conductivity vs. Time, 10th Street Chiller Plant (2012)
Blackwater Reclamation & Reuse Feasibility Study 53
May 2013
5.0 Integrating Water Reclamation and Reuse at Georgia Tech
This section reviews regulatory, siting, and facility sizing considerations specific to Georgia Tech.
Section 5.1 provides a brief overview of the federal, local and regulatory environment specific to
decentralized water treatment and reclamation. Section 5.2 analyzes physical footprint requirements
for various ecological treatment technologies. Section 5.3 reviews siting considerations and challenges
uncovered during the feasibility process.
5.1. Regulatory Environment
5.1.1. Federal Regulations
The U.S. Environmental Protection Agency (EPA) sets minimum environmental regulatory standards
relating to water quality, treatment, and discharge. Most of these standards are laid out in the Clean
Water Act. State governments have the option of exceeding these standards, but must conform to their
minimum criteria. The EPA does not have specific regulations pertaining to water reclamation and
reuse, but it does produce guidelines for states to voluntarily follow.13 Many states choose to accept and
implement these policies. Many water reuse regulations within the state of Georgia have been
influenced by these guidelines. Appendix E of this report provides the EPA’s Guidelines for Water
Reuse.
Although the EPA does not produce formal water reuse regulations, it clearly endorses water reuse as a
best management approach to conserving water resources and reducing pollution. The introduction to
the 2012 Guidelines for Water Reuse notes the following:
As urban areas continue to grow, pressure on local water supplies will continue to increase.
Already, groundwater aquifers used by over half of the world population are being over-drafted.
As a result, it is no longer advisable to use water once and dispose of it; it is important to identify
ways to reuse water. Reuse will continue to increase as the world’s population becomes
increasingly urbanized and concentrated near coastlines, where local freshwater supplies are
limited or are available only with large capital expenditure.
In addition, the EPA cites water reuse and reclamation as beneficial in terms of economic savings,
environmental protection, energy production, sustainability and infrastructure capacity.
The ability to reuse water, regardless of whether the intent is to augment water supplies or
manage nutrients in treated effluent, has positive benefits that are also the key motivators for
implementing reuse programs. These benefits include improved agricultural production; reduced
energy consumption associated with production, treatment, and distribution of water; and
significant environmental benefits, such as reduced nutrient loads to receiving waters due to
reuse of the treated wastewater.
The Clean Water Act (CWA) governs state water reuse regulations by setting basic requirements in
regard to wastewater treatment and discharge. As such, the EPA developed the National Pollutant
Discharge Elimination System (NPDES) in 1972 to regulate point source water pollution. Wastewater
13
The EPA Guidelines for Water Reuse, 2012 are provided in Appendix E.
Blackwater Reclamation & Reuse Feasibility Study 54
May 2013
treatment facilities are required to meet federal discharge standards as laid out in this permit system.
States are responsible for the enforcement of regulations associated with NPDES and the CWA, as well
as the development of their own water reuse regulations if so inclined. The following sections
summarize the regulatory environment pertaining to water reclamation and reuse for the state of
Georgia and the City of Atlanta.
5.1.2. Georgia Water Reclamation & Reuse Regulations
The State of Georgia recognizes that water reclamation and reuse is a viable water management tool,
which helps reduce demand on available surface and ground waters, delays or eliminates the need to
expand potable water supply and treatment facilities, and eases pressure on these water supplies by
helping conserve potable water reserves.14 Because of these benefits, Georgia informally incentivizes
water reuse through a number of policies and endorsements. Water reuse is mentioned as a viable and
sustainable water management tool in multiple state-published water supply planning and water
conservation documents. To promote the use of water reclamation and reuse, the Georgia Department
of Natural Resources, Environmental Protection Division (EPD) released the Guidelines for Water
Reclamation and Urban Water Reuse in 2002.
Currently, there are approximately 75 permitted reuse facilities in the state of Georgia. The Georgia
EPD, Watershed Protection Branch specifies the requirements for wastewater treatment and water
reclamation and reuse. The state officially reviews each permit application and issues necessary
permits. The Georgia Guidelines for Water Reclamation and Urban Water Reuse, provided in
Appendix D, outline the specifications and regulatory requirements for a water reclamation permit.
The following regulatory topics are found in these guidelines:
1) Wastewater treatment,
2) Monitoring requirements,
3) System requirements and reliability,
4) Operation requirements,
5) Reclaimed water storage and disposal,
6) Access control and warning signs, and
7) Distribution systems
A majority of the guidelines focus on treatment process, monitoring, and operational requirements for
permitting reclaimed water facilities. They outline standards regarding detailed treatment design
(biological oxidation, filtration, disinfection, etc.), clean water distribution and plumbing, reclaimed
water quality, excess water disposal, and operations and maintenance.15 For the most part, these
regulations are similar to other states’ water reclamation and reuse standards. The most significant
differences are related to permitting time-frames, effluent standards for water reclamation facilities,
and allowable uses of reclaimed water.
14
Source: Georgia Guidelines for Water Reclamation and Urban Water Reuse. GA Department of Natural Resources, Environmental Protection Division, Watershed Protection Branch, 2002. 15
ibid
Blackwater Reclamation & Reuse Feasibility Study 55
May 2013
The guidelines released in 2002 are heavily tilted toward irrigation uses of reclaimed water. However,
the guidelines do recognize a number of “expanded” allowable uses. Expanded uses of reclaimed
water include: “fire protection, aesthetic purposes (landscape impoundments and fountains), industrial
uses16 and some agricultural irrigation.” As of 2002, the use of reclaimed water inside of a dwelling was
prohibited, but recent revisions to the plumbing code have approved the use of reclaimed water within
dwellings where residents do not have access to the plumbing. This greatly expands the use of
reclaimed water in hotels, apartment buildings, and dormitories.
The Georgia EPD, Watershed Protection Branch issues water reclamation permits that allow permittees
to provide reclaimed water to approved designated users. Generally, the permit holder must establish
reasonable policies, regulations and resolutions, ordinances, or written agreements concerning the use
of reclaimed water and compliance with state requirements. The permittee is responsible for ensuring
that reclaimed water meets the requirements set forth by state regulations at the point and time of
delivery. An industrial pre-treatment permit may also be required based on the return of solids or any
discharge to the municipal sewer system. This permit is issued by the local water and sewer authority.
The state’s largest concern is water quality. Georgia’s Guidelines for Water Reclamation and Urban
Water Reuse outline strict reclaimed water quality standards to ensure human health and safety.
Demonstrating a treatment process’s ability to meet these requirements is a significant portion of the
permitting application. Table 11 shows Georgia reclaimed water quality standards in conjunction with
typical wastewater influent. In Georgia, there are five parameters by which reclaimed water is judged:
biological oxygen demand, turbidity, total suspended solids, fecal coliform, and pH.
Table 11: Georgia Reclaimed Water Quality Standards
Another area of focus for the state is project awareness and overall system reliability, redundancy and
safety. Guidelines thus outline requirements for public awareness campaigns and general public
support, which usually take place before project approval. Once operating, extensive effluent water
quality testing is required. Georgia guidelines also specify special plumbing and water distribution
procedures to ensure safety in regard to cross-contamination and backflow prevention. Some of these
rules include designating purple colored distribution piping, practicing maximum separation between
reclaimed water and potable water lines, coloring reclaimed water, labeling reclaimed water end-uses
16
Utility process water is commonly referred to as “industrial uses” in most state water reclamation and reuse regulations. According to preliminary meetings held with the EPD, there are a few instances in Georgia of reclaimed water being used for cooling purposes.
Parameter (Analyte) Typical Influent WW Quality GA Reuse Effluent Requirements
Biological Oxygen Demand (BOD) 190 mg/L <5 mg/L
Turbidity 100 NTU <3 NTU
Total Suspended Solids (TSS) 220 mg/L <5 mg/L
Fecal Coliform 104 - 106 <23 per 100 mL monthly geo. mean,
100 per 100 mL maximum daily
pH - 6-9
Blackwater Reclamation & Reuse Feasibility Study 56
May 2013
with proper signage, and providing education programs for operators and end-users of reclaimed
water.
In the spring of 2011, Sustainable Water and McKim & Creed Engineering Consultants held a
preliminary meeting with the Georgia EPD, Watershed Protection Branch to confirm the guidelines
discussed above. Curtis Boswell, the former contact for the Water Reuse Program, was among those
attending on behalf of EPD. This meeting focused on the general application of decentralized water
reuse in urban environments and specific aspects of the permitting process. An additional goal of this
meeting was to familiarize the state permitting agency with hydroponic treatment technology and its
general application as a sewer mining facility. The intent of this meeting was to identify any potential
design issues with ecological treatment technology before the permitting process begins.
Regulators found no general problems with the technology or its application within the Institute
setting. The general assertion was that as long as state requirements are met, issues with the local water
authority may become the largest contingency factor. The overall permitting process is projected to
take 2 to 6 months, depending on project specifics. However, expedited permitting is possible for a set
fee. Preliminary Design Development Reports (DDR) showcasing specific aspects of ecological
treatment technologies were submitted to the EPD. However, no formal comments were received
because state protocol reserves specific feedback for full permit applications that have paid all
permitting fees. This advanced submittal was meant to help further familiarize the state with the
technology.
5.1.3. Local Regulations
Although the treatment permit is officially issued by the state, local municipal governments must
approve a reuse system from a zoning and building code perspective. Allowable land uses, fire code,
building design, and setback requirements are all part of the local approval process. State universities,
however, may be exempt from many of these regulations. In addition, the local water and sewer
authority will need to approve the system, as it interacts with public infrastructure or requires billing
and/or rate adjustments. In some instances, an industrial pre-treatment permit may be required if the
system discharges anything into the municipal sewer system. Additionally, state permit issuers will
look for feedback from the local water and sewer authority to ensure that any proposed reuse system
will not negatively interfere with county-owned infrastructure or resources.
The City of Atlanta’s municipal code was reviewed for any regulatory statutes associated with on-site
water treatment, water reuse, sewerage disposal, sewer connections, and permitting requirements.
Code requirements exist for private water systems and sewerage disposal; however, the City currently
has no regulations specific to blackwater reuse. The municipal code does require plan approval
processes by the City, and outlines protocol with regard to easements, municipal infrastructure
connections, and the application process for wastewater discharge permits. No local restrictions were
uncovered that may prohibit a decentralized water treatment/reuse facility on campus.17
17
Source: City of Atlanta Municipal Code. http://library.municode.com/index.aspx?clientId=10637
Monthly savings from reclaimed water exceed $100K as the plant reaches capacity.
Utility water costs are virtually $0 from September – June.
Blackwater Reclamation & Reuse Feasibility Study 81
May 2013
Chart 27: Annual Savings over 20 Years after Phase II Installation
Chart 28: Cumulative Savings over 20 Years after Phase II Installation
$-
$200,000
$400,000
$600,000
$800,000
$1,000,000
$1,200,000
$1,400,000
$1,600,000
$1,800,000
Year 1 Year 5 Year 10 Year 15 Year 20
Well Savings Reclaimed Water Savings TOTAL SAVINGS (Well + Reclaimed Water)
Annual reclaimed water savings start at $925K and reach $1.5 M in 20 years.
$925,901
$4,713,667
$10,085,219
$16,312,321
$23,531,239
$1,001,450
$5,098,280
$10,908,126
$17,643,330
$25,451,278
$-
$5,000,000
$10,000,000
$15,000,000
$20,000,000
$25,000,000
$30,000,000
Year 1 Year 5 Year 10 Year 15 Year 20
Cumulative Reclaimed Water Savings Total Cumulative Savings (Well + Reclaimed Water) Cumulative Well Savings
Total cumulative savings (including well) reach $25.4 M over 20 years.
Blackwater Reclamation & Reuse Feasibility Study 82
May 2013
6.3. Project Timeline
Based on the level of cost savings available at Georgia Tech, Sustainable Water recommends moving
toward a design and engineering phase to begin project implementation. Before beginning detailed
design, Sustainable Water recommends moving forward with a number of tasks:
1. Perform a detailed flow-measurement study to validate available feedstock for a reclaimed
water facility;
2. Evaluate and validate economic models for various financing scenarios; and
3. Present this project to the City of Atlanta Department of Watershed Management to gain
project approval and confirm economic payback.
Figure 20 provides a proposed timeline outlining milestones for project implementation. If expedited,
the project could begin construction as early as April, 2014.
Figure 21: Proposed Project Timeline
Blackwater Reclamation & Reuse Feasibility Study 83
May 2013
7.0 Appendix Documents (Provided in Digital Format)
Appendix A 1. Feasibility Scope of Work 2. Map – Georgia Tech Campus Map & Focus Area
Appendix B 1. Georgia Tech EBB and Ferst Sector Plan 2. Stormwater Master Plan Flow Diagram 3. 1927 & 1928 Campus Topography 4. Campus Topography and Wastewater Infrastructure, GT Main Campus 5. Georgia Comprehensive State-wide Water Management Plan 6. 2010 Georgia Water Conservation Implementation Plan 7. Map – Sanitary and Stormwater Sewer Infrastructure, Basin A 8. 10th Street Chiller Plant Water Bill (4 inch meter) 9. Undergraduate Living Center Water Bill 10. Baker Building Water Bill 11. Map – Cistern Locations, GT Main Campus 12. Detailed Cistern Summary, GT Main Campus
Appendix C 1. Total Water Usage by Month (2011 – 2012), GT Main Campus 2. Water Usage by Category & Potable vs Non-Potable Demand, GT Main Campus and Basin A 3. Building Water Usage and Wastewater Flow, GT Main Campus 4. Map - Total Water Use by Building, GT Main Campus 5. Irrigation Usage Summary, GT Main Campus 6. Map – Irrigation Usage by Location, GT Main Campus 7. HVAC Usage Summary, GT Main Campus 8. Map – HVAC Usage by Location, GT Main Campus 9. Cooling Tower Usage Summary, GT Main Campus 10. Gas Consuming Boilers Campus Inventory, GT Main Campus 11. Individual Boiler Summary, GT Main Campus 12. Map – Satellite Boilers by Location, GT Main Campus 13. Building Water Usage and Wastewater Flow, Basin A 14. Map – HVAC and Irrigation Usage by Location, Basin A 15. Non-potable Demand by Season, GT Main Campus and Basin A 16. Future Water Demand, Wastewater, and WCTI Make-up Projections, Basin A 17. Map – Future Demand by Location, Basin A 18. Map - Wastewater Flow by Location, GT Main Campus 19. Extraction Points Summary (Wastewater Flow Modeling), GT Main Campus 20. Map – Extraction Points and Wastewater Flow Model, GT Main Campus
Appendix D 1. Garratt Callahan 10th Street Water Laboratory Report 2. 10th Street Well Water Analysis 3. Garratt Callahan Field Service Reports 4. Central Chiller Plant Specifications 5. RMF 10th Street Chiller Plant Expansion Plan 6. SW Utility Water Audit Form – 10th Street Chiller Plant
Blackwater Reclamation & Reuse Feasibility Study 84
May 2013
Appendix E 1. 2012 EPA Guidelines for Water Reuse 2. 2002 Georgia Guidelines for Water Reclamation and Urban Water Reuse 3. Georgia Guidelines for Reclaimed Water Systems for Buildings 4. Map – Potential Facility Siting Locations, Basin A 5. Map – Future and Existing Conditions, Basin A 6. Map – Buried Utilities and Proposed Siting, Basin A 7. Campus Umap & Survey Drawings
Appendix F 1. Phase I Site Plan Layout (Living Machine) 2. Phase I Facility Adjacent to Eco-Commons Lawn 3. Map – Proposed Siting of Phase I Tidal Flow Wetlands 4. Conceptual Rendering of Phase I Tidal Flow Wetlands System 5. Map – Alternative Siting Areas for Phase I tidal Flow Wetlands 6. Hydroponic Floor Plan (1st Story) 7. Hydroponic Floor Plan (2nd Story) 8. Conceptual Rendering of Greenhouse Lamination for Phase II 9. Conceptual Rendering of Complete Phase II Build-out along Hemphill Avenue 11. Map – Proposed Siting for Phase II Hydroponic System 12. Conceptual Rendering looking toward Eco-Commons from Hydroponic System