139
FEASIBILITY STUDY FOR A NEW INDOOR SPORTS CENTER IN VIRGINIA BEACH SUBMITTED : NOVEMBER 2, 2016

FEASIBILITY STUDY FOR A NEW INDOOR
SPORTS CENTER IN VIRGINIA BEACHSUBMITTED: NOVEMBER 2, 2016

DRAFT
TABLE OF CONTENTS
Executive Summary 3
1. Introduction 12
2. Summary of Key Findings - Market Demand Study 16
a) Demographics & Socioeconomics
b) Local Facility Inventory
c) Interviews, Focus Groups & Surveys
d) Preliminary Facility Recommendation
3. Comparable Venue Analysis 63
4. Preliminary Site Analysis 75
5. Building Program Recommendations 91
6. Utilization Estimates & Financial Projections 96
7. Operating Recommendations 106
8. Funding Options Analysis 110
9. Economic & Fiscal Impact Analysis 1272

DRAFT
3
EXECUTIVE SUMMARY
3
DRAFT 4
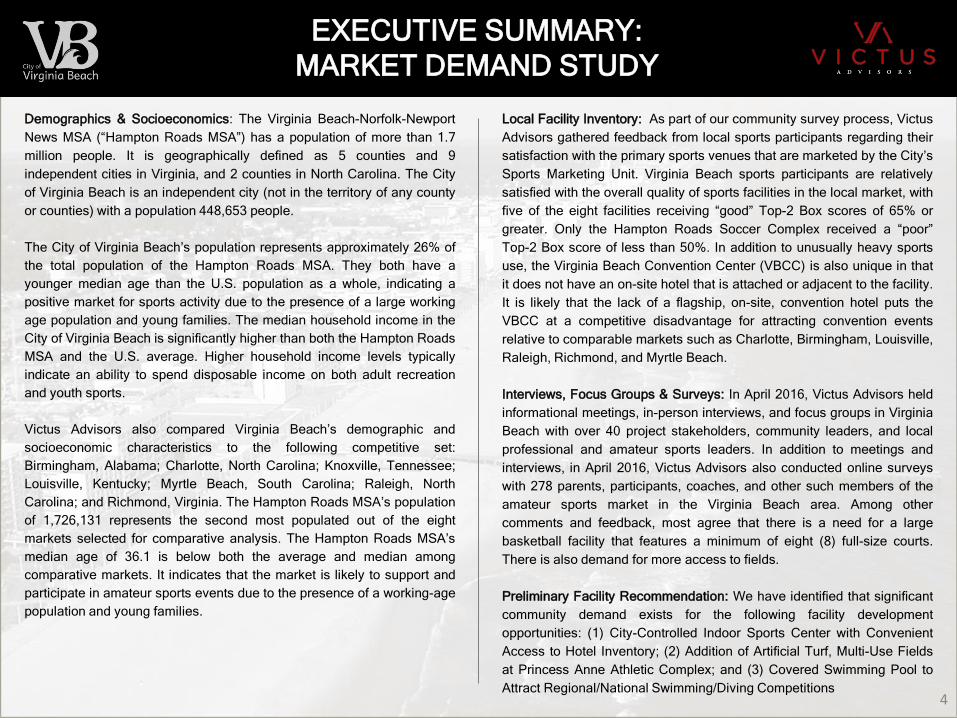
Demographics & Socioeconomics: The Virginia Beach-Norfolk-Newport
News MSA (“Hampton Roads MSA”) has a population of more than 1.7
million people. It is geographically defined as 5 counties and 9
independent cities in Virginia, and 2 counties in North Carolina. The City
of Virginia Beach is an independent city (not in the territory of any county
or counties) with a population 448,653 people.
The City of Virginia Beach’s population represents approximately 26% of
the total population of the Hampton Roads MSA. They both have a
younger median age than the U.S. population as a whole, indicating a
positive market for sports activity due to the presence of a large working
age population and young families. The median household income in the
City of Virginia Beach is significantly higher than both the Hampton Roads
MSA and the U.S. average. Higher household income levels typically
indicate an ability to spend disposable income on both adult recreation
and youth sports.
Victus Advisors also compared Virginia Beach’s demographic and
socioeconomic characteristics to the following competitive set:
Birmingham, Alabama; Charlotte, North Carolina; Knoxville, Tennessee;
Louisville, Kentucky; Myrtle Beach, South Carolina; Raleigh, North
Carolina; and Richmond, Virginia. The Hampton Roads MSA’s population
of 1,726,131 represents the second most populated out of the eight
markets selected for comparative analysis. The Hampton Roads MSA’s
median age of 36.1 is below both the average and median among
comparative markets. It indicates that the market is likely to support and
participate in amateur sports events due to the presence of a working-age
population and young families.
Local Facility Inventory: As part of our community survey process, Victus
Advisors gathered feedback from local sports participants regarding their
satisfaction with the primary sports venues that are marketed by the City’s
Sports Marketing Unit. Virginia Beach sports participants are relatively
satisfied with the overall quality of sports facilities in the local market, with
five of the eight facilities receiving “good” Top-2 Box scores of 65% or
greater. Only the Hampton Roads Soccer Complex received a “poor”
Top-2 Box score of less than 50%. In addition to unusually heavy sports
use, the Virginia Beach Convention Center (VBCC) is also unique in that
it does not have an on-site hotel that is attached or adjacent to the facility.
It is likely that the lack of a flagship, on-site, convention hotel puts the
VBCC at a competitive disadvantage for attracting convention events
relative to comparable markets such as Charlotte, Birmingham, Louisville,
Raleigh, Richmond, and Myrtle Beach.
Interviews, Focus Groups & Surveys: In April 2016, Victus Advisors held
informational meetings, in-person interviews, and focus groups in Virginia
Beach with over 40 project stakeholders, community leaders, and local
professional and amateur sports leaders. In addition to meetings and
interviews, in April 2016, Victus Advisors also conducted online surveys
with 278 parents, participants, coaches, and other such members of the
amateur sports market in the Virginia Beach area. Among other
comments and feedback, most agree that there is a need for a large
basketball facility that features a minimum of eight (8) full-size courts.
There is also demand for more access to fields.
Preliminary Facility Recommendation: We have identified that significant
community demand exists for the following facility development
opportunities: (1) City-Controlled Indoor Sports Center with Convenient
Access to Hotel Inventory; (2) Addition of Artificial Turf, Multi-Use Fields
at Princess Anne Athletic Complex; and (3) Covered Swimming Pool to
Attract Regional/National Swimming/Diving Competitions
EXECUTIVE SUMMARY:
MARKET DEMAND STUDY

DRAFT 5
Overview: Victus Advisors analyzed existing and planned indoor sports
centers located in the comparative markets that were identified by the
Sports Marketing Unit as primary competitors for amateur sports events.
Selection criteria for the facilities we reviewed were:
• At least 80,000 square feet building footprint
• At least six (6) basketball courts
• Opened within the past 10 years
In addition, we also reviewed three other indoor facilities (located in
Round Rock, Texas; Spartanburg, South Carolina; and Gatlinburg,
Tennessee) that all opened in 2014 and may also be viewed as potential
comparable venues for a new indoor sports center in Virginia Beach. In
total, we analyzed the following six (6) indoor sports centers. Unless
otherwise noted, the sources of comparable venue information on the
following pages were facility management:
• Hoover Sports Complex – Hoover, Alabama
• Boo Williams Sportsplex – Hampton, Virginia
• Upward Star Center – Spartanburg, South Carolina
• Myrtle Beach Sports Center – Myrtle Beach, South Carolina
• Round Rock Sports Center – Round Rock, Texas
• Rocky Top Sports World – Gatlinburg, Tennessee
Summary:
Size and Configuration
The comparable indoor sports centers reviewed in this section, as shown
below, range from 82,000 to 155,000 square feet, and include 6 to 9
basketball courts (convertible to 12 to 16 volleyball courts). Two of the
venues also include additional indoor features such as indoor turf or an
indoor track.
Tournaments & Visitors
The comparable indoor facilities we analyzed are all expected to host
anywhere from 25 to 40 weekend tournaments each year, with up to
200,000 annual visitors (including athletes, coaches, spectators, etc.),
and upwards of 15,000 hotel nights generated each year.
Year Square Construction Basketball Volleyball Indoor Indoor
Facility City, State Open Feet Cost ($M) Config. Config. Turf Track
Hoover Sports Complex Birmingham, AL 2017 155,000 76.0 (1) 9 12 1 -
Boo Williams Sportsplex Hampton, VA 2008 135,000 13.5 8 12 - 1
Upward Star Center Spartanburg, SC 2014 120,000 19.0 6 12 - -
Myrtle Beach Sports Center Myrtle Beach, SC 2015 100,000 12.4 8 16 - -
Rocky Top Sports World Gatlinburg, TN 2014 86,000 20.0 (2) 6 12 - -
Round Rock Sports Center Round Rock, TX 2014 82,000 14.5 6 12 - -
Note: Sorted by Square Feet in descending order
Source: Sports Center Administrators, Victus Research
Number of Fields/Courts
(1) Construction cost for Hoover Sports Complex includes both an outdoor field complex and indoor sports center on 120 acres
(2) Construction cost for Rocky Top Sports World includes both an outdoor field complex and indoor sports center on 80 acres
EXECUTIVE SUMMARY:
COMPARABLE VENUE ANALYSIS

DRAFT 6
Overview: During interviews with local stakeholders and sports
community leaders, Victus Advisors requested input regarding potential
areas within Virginia Beach that could be suitable for development of a
new indoor sports center. Based upon these interviews, three general
areas came to the forefront (in no particular order):
• Beachfront Area
• Convention Center Area
• Princess Anne Area
Generally speaking, from the standpoint of both attracting events and
sustaining economic development related to regional tournament activity,
it is also ideal to have convenient access to lodging and retail within a 10-
15 minute drive of an indoor sports center.
AICUZ / APZ: A major consideration for any development (residential or
commercial) in Virginia Beach is the Air Installation Compatible Use Zone
Program (AICUZ) Accident Potential Zones (APZ). The Department of
Defense (DOD) created these programs and designations with the intent
to protect citizens, military personnel, and public and private property
from potential damage due to noise and other hazards from airport
activity. The restrictions associated with these zones could have a
significant impact on the viability of potential locations for a new indoor
sports center in Virginia Beach.
Convention Center Area: The Convention Center Area appears to be the
most favorable site due to its convenient proximity to hotel access. In
addition there are plenty of retail and restaurant options within a short
drive, thanks in large part to the proximity to the oceanfront. In addition,
the current volume of participatory sports activity at the Convention
Center demonstrates that the location is viable as a sports tourism
destination.
Princess Anne Area: The Princess Anne Area is not recommended by
Victus Advisors for a new indoor sports center for several key reasons:
(1) There is an existing indoor fieldhouse located at Princess Anne that
was developed via a public-private partnership between the City and a
private facility operator; (2) Numerous interview respondents indicated
that hotel options were limited within a 10-15 minute drive of Princess
Anne, and therefore it is often more convenient for their athletes and
families to stay at Chesapeake or Norfolk hotels. (3) Development of
additional hotel inventory within the Princess Anne area may be limited by
APZ restrictions.
Beachfront Area: Although several interview respondents indicated that
the Resort Area could be a potential location for a new indoor sports
center, due to proximity to family entertainment, retail, and the majority of
Virginia Beach’s lodging, however it may not be an ideal location due to
traffic issues, lack of parking (which could deter local usage of the venue)
and expensive lodging in the summer months (which could be a deterrent
to tournaments).
Site Analysis Recommendation: In conclusion, Victus Advisors
recommends that the general Convention Center area is the most
suitable and favorable for development of an indoor sports center due to
its convenient access to hotels, food, and retail, as well as a centralized
location with ample parking that appeals to both local use and tournament
use.
EXECUTIVE SUMMARY:
PRELIMINARY SITE ANALYSIS

DRAFT 7
Recommended Amenities: Based upon the results of our market and
facility analysis, Victus Advisors recommends that a new indoor sports
center in Virginia Beach should have:
• Ten (10) basketball courts, which should be convertible to at least 12
(or more) volleyball courts
• One indoor artificial turf area, which could be utilized as one (1) full-
length soccer or lacrosse field, or two (2) shorter fields for youth
soccer, flag football, lacrosse practice, football practice, and/or batting
cages.
• Support areas and amenities, including lobby, concessions, team
rooms, offices, mechanical/electrical rooms, storage, circulation, etc.
Approximate Space Requirements: Based upon Victus Advisors’ industry
experience, as well as preliminary input gathered from sports architects, it
is estimated that the building program described above would require
approximately 175,000 square feet, as follows:
• Basketball/Volleyball Courts – 65,000 sq. ft.
• Indoor Artificial Turf – 90,000 sq. ft.
• Support Areas/Amenities - 20,000 sq. ft
Preliminary Cost Estimate: Based on recent construction costs for
comparable sports centers, Victus Advisors preliminarily estimates that a
new indoor sports center in Virginia Beach could be constructed for a cost
ranging from approximately $100 to $175 per square foot, depending on
level of finish. This range represents approximately $17.5 to $30.6 million
in estimated total construction costs for a 175,000 sq. ft. venue.
As a point of comparison, the average cost per square foot among
comparable indoor sports centers, as shown below, was approximately
$140 per square foot. Therefore, for purposes of our economic impact
analysis (presented in Section 9 of this report) we have assumed
construction costs of approximately $140 per square foot, which
represents total estimated construction costs of approximately $24.5
million for a new 175,000 square foot indoor sports center.
Ultimately, it is recommended that detailed square footages and
construction cost estimates should be developed by project architects and
cost engineers.
Year Square Construction Cost per
Facility City, State Open Feet Cost Sq. Ft.
Boo Williams Sportsplex Hampton, VA 2008 135,000 $13,500,000 $100
Upward Star Center Spartanburg, SC 2014 120,000 $19,000,000 $158
Myrtle Beach Sports Center Myrtle Beach, SC 2015 100,000 $12,400,000 $124
Round Rock Sports Center Round Rock, TX 2014 82,000 $14,500,000 $177
Average: 2013 109,250 $14,850,000 $140
Median: 2014 110,000 $14,000,000 $141
EXECUTIVE SUMMARY:
BUILDING PROGRAM RECOMMENDATIONS

DRAFT 8
Estimated Annual Utilization By Sport: It is estimated that basketball
would account for the majority of utilization at over 50%.
Total Estimated Annual Visits: 189,150 which includes athletes, officials,
coaches, spectators, etc. Represents 141,862 unique daily visits, plus
47,288 out-of-town tournament visitors.
Estimated Annual Utilization By Type: It is estimated that the facility could
host approximately 36 annual tournaments and competitions (26 court
usage and 10 field usage), accounting for over one-quarter of the facility’s
usage hours.
Estimated Seasonality: It is expected that peak usage at the sports center
would be during the winter months, with a considerable decrease in
utilization during the summer months. This seasonal usage pattern could
be ideally suited for attracting tournament activity to Virginia Beach, as
local hotel inventory has significantly lower occupancy and ADR from
October to April.
Financial Projections (Stabilized Year of Operations): In a stabilized year
of operations, it is estimated that the operations of the proposed indoor
sports center in Virginia Beach could approximately break even.Facility
Sport Hours
Basketball 6,255
Volleyball 2,970
Soccer 1,630
Other Sports 1,370
TOTAL 12,225
Facility
Event Hours
Practices/Leagues 8,951
Tournaments 3,274
TOTAL 12,225
Operating Revenues:
Rental Income $1,035,750
Programming (Leagues, Camps, Clinics) $414,000
Concessions (Net of COGS) $99,300
Advertising $74,200
Other $15,000
Total Revenues: $1,638,250
Operating Expenses:
Salaries & Wages $521,500
Program Expenses $289,800
Utilities $437,500
Maintenance/Repair $125,000
Materials/Supplies $125,000
G&A $50,000
Insurance $66,000
Total Expenses: $1,614,800
Net Income Before Debt Service: $23,450
Estimated Operating Margin: 1.4%
Note: Presented in 2016 dollars
EXECUTIVE SUMMARY:
UTILIZATION & FINANCIAL PROJECTIONS

DRAFT 9
Management Options:
Public: Public management of youth and amateur sports facilities is
commonplace within the industry. Facility operational control within a
government is typically accomplished either by creating a separate
department that is responsible for facility management or by designating
responsibility to a department that already exists within the government
(such as the CVB or Parks & Recreation).
• Advantages: The advantages of public management include owner
control, financial support via public funding sources, potential sharing
of public sector staff and support functions (security, waste
management, grounds keeping, maintenance, etc.), and utilization of
governmental purchase power to help reduce the costs of goods and
services.
• Disadvantages: Some disadvantages of public management could
include decision-making and contracting constraints due to public
sector processes, economic and performance inefficiencies related to
lack of profit incentive, or a lack of expertise and relationships in the
sports industry among public staff.
Private: In some cases, the management of a publicly-owned sports
complex could be outsourced to a third-party operator. Comparable public
facilities that we reviewed in this report included a mix of public and
private operators.
• Advantages: The public owner retains rights and privileges of
ownership while the management firm performs assigned functions.
The private firm is motivated by profit incentives to maximize
tournament usage and programming (and other profitable uses) of the
facility. They usually bring a network of relationships to leverage for
event booking, and they often have greater staffing resources and
flexibility in negotiations with events.
• Disadvantages: Some disadvantages of private management could
include lack of owner control over events held or rates set at the
facility, less access to affordable public use, and public costs of paying
facility management fees.
Recommendation for Virginia Beach:
It is recommended that a new indoor sports center should be owned and
operated by the City. As identified in our market study, one of the major
issues that the Sports Marketing Unit faces with booking sports events,
especially indoor events, is the lack of access or control over the booking
calendar for privately-operated venues. Having an indoor sports center
under operating control of the City would enable the Sports Marketing
Unit to more efficiently and effectively book indoor sports events, without
having to rely on placing sports events in the Convention Center to such a
large degree.
EXECUTIVE SUMMARY:
OPERATING RECOMMENDATIONS

DRAFT 10
Overview: The purpose of this analysis is to provide a broad overview of
the various debt vehicles and revenue sources that could potentially be
utilized to fund construction and development costs for a new indoor
sports center in Virginia Beach. This analysis is based upon a review of
comparable venue funding across the country, as well as unique financing
vehicles that may be available within the State of Virginia.
General Obligation Bonds: As of June 30, 2015, the City of Virginia
Beach had total tax-supported long-term debt of approximately $982.5
million, roughly 66% of which is general obligation debt. An indoor sports
center at an estimated cost of $24.5 million that was funded via GO bonds
would only represent an approximately 3.7% increase in GO
indebtedness.
Revenue Bonds: Depending on the interest rate and debt coverage ratio,
it is generally estimated that for every $1M of project income (or tax
revenue) that is applicable to debt service, 30-year revenue bonds could
fund anywhere from $7-14M in project costs.
Tax Increment Financing (TIF): TIF could potentially be a viable option for
Virginia Beach if a new sports center is part of a larger redevelopment
district (for example, if the entire Owl’s Creek site were to be
redeveloped).
Capital Improvement Program: The FY 2016-2021 Capital Improvement
Program (CIP), which was approved by City Council on May 12, 2015, set
forth a program totaling $2.7 billion. The CVB should explore whether a
new indoor sports facility would be eligible for CIP funding.
Development Financing Program: This development financing program is
not likely to be utilized for this indoor sports center project, as it is not
expected to be a public-private partnership with a private developer.
Contractually Obligated Revenue Streams: It is not recommended that
the City utilizes contractually obligated revenue to fund construction
costs, as it would increase the risk of large annual operating losses.
General Funds: According to the Virginia Beach 2015 Comprehensive
Annual Financial Report (CAFR) the City has a fund balance policy goal
to maintain 10% of unassigned funds or one month of the City’s operating
expenses. As a result, it is not likely that general funds would be available
for commitment to this proposed indoor sports center.
Restaurant Meals Tax: Virginia Beach already has one of the highest tax
rates for meals in the United States. As a result, it would be unlikely that
an proposed increase in the tax rate would be approved by City Council
and/or Virginia Beach residents.
Amusement Tax: It is unlikely that the amusement tax rate would be
approved for an increase considering most of the other cities within the
Hampton Roads MSA also have a 10% rate.
Dedicated Revenue Generating Fund (TIP/TAP): The Virginia Beach
CVB should explore whether a new indoor sports facility would be eligible
for TIP and/or TAP funding.
Ad Valorem Taxes: The City has already increased the property tax rate
from .93% to .99% just last year. As a result it would appear unlikely that
an additional increase would be approved by residents. It is also unlikely
that a sales tax increase would be an option for Virginia Beach. The
Virginia Beach sales tax rate is already maxed out at 1.0% local rate, and
6.0% overall.
Hotel-Related Taxes: The lodging tax rate is 8% and is already the
highest rate in the Hampton Roads MSA. It is unlikely that an additional
increase would be favorable to City Council and City residents.
EXECUTIVE SUMMARY:
FUNDING OPTIONS ANALYSIS

DRAFT 11
EXECUTIVE SUMMARY:
ECONOMIC & FISCAL IMPACTS
ECONOMIC & FISCAL IMPACT ANALYSIS
The one-time construction and on-going operations of a new, City-controlled, indoor sports center in Virginia Beach are estimated to generate
significant incremental (or “net new”) direct spending within the City by outside businesses and visitors. Over the course of the estimated
useful life of a sports facility (30 years), it has been estimated that the cumulative incremental economic/fiscal benefits within the City could
include nearly $477 million in total economic output, 141 sustainable annual jobs, over $171 million in wages, more than $30 million in City tax
revenues, and upwards of 638,000 hotel nights, as shown below:
30-Year Net Present
Net New Impacts Cumulative Value (NPV)
Direct Spending: $304,997,000 $179,610,000
Total Output: $476,856,000 $280,309,000
Annual Jobs: 141 n/a
Labor Income: $171,254,000 $101,135,000
City Tax Revenue: $30,029,000 $17,295,000
Hotel Nights: 638,381 n/a
SUMMARY OF NET NEW IMPACTS IN VIRGINIA BEACH OVER 30 YEARS:
ONE-TIME CONSTRUCTION & ON-GOING OPERATIONS

DRAFT
12
SECTION 1
INTRODUCTION
12

DRAFT 13
PROJECT BACKGROUND
Victus Advisors was engaged by the City of Virginia Beach’s Sports Marketing Unit in 2016
to conduct a sports tourism market study, recommend sports facility opportunities, and
analyze the feasibility and economic impacts of a potential new sports facility.
Our initial Sports Tourism Venue Inventory & Market Assessment was completed in July
2016, and we subsequently proceeded with our Feasibility Study for a New Indoor Sports
Center, which includes the following primary project goals:
• Estimate annual activity and event demand for an indoor sports center in Virginia Beach
• Develop a detailed, annual operating pro forma that summarizes the detailed revenues
and expenses that could be associated with the operations of a new indoor sports center
• Develop a summary of various options regarding the management and operations of the
proposed facility
• Analyze the potential project funding methods that could potentially be utilized in Virginia
Beach to construct the new facility
• Prepare estimates of the potential economic and fiscal impacts that could be generated
for the community by facility construction and incremental sports tourism

DRAFT
Facility & ProgramDemand
Demographic & Socioeconomic
Research
Local FacilityInventory &
Review
Comparable Market & Facility
AnalysisLocal Interviews, Focus Groups & Online Surveys
Regional & National Event
Interviews
Program
Recs.
SPORTS TOURISM MARKET STUDY
SPORTS FACILITYOPPORTUNITIES
INDOOR SPORTS CENTER
FEASIBILITY STUDY
PREVIOUS
PHASES:
FEASIBILITY STUDY METHODOLOGY
Utilization
Estimates
Operating
Projections
Funding
Options
Economic
Impacts
14
CURRENT
PHASE:

DRAFT 15
VENUE INVENTORY & MARKET ASSESSMENT
The next section of this report (Section 2) presents key findings from the Sports Tourism
Venue Inventory & Market Assessment that pertain to the feasibility of an indoor sports
center in Virginia Beach. Victus Advisors’ primary project goals the Sports Tourism Venue
Inventory & Market Assessment were:
• Engaged local sports community stakeholders and sports facility user groups
• Assessed the strengths and weaknesses of the local Virginia Beach sports market
• Assessed the strengths and weaknesses of Virginia Beach as a regional/national sports
tourism destination
• Identified and recommended potential improvements to Virginia Beach’s sports tourism
market positioning
• Recommended opportunities for sports venue development in Virginia Beach
Sections 3 through 9 of this report represent new research, analysis and recommendations
related to the Feasibility Study for a New Indoor Sports Center.

DRAFT
16
SECTION 2A
SUMMARY OF KEY FINDINGS –
DEMOGRAPHICS & SOCIOECONOMICS
16

DRAFT
METROPOLITAN STATISTICAL AREA (MSA)
Metro.Statistical
Areas
• MSA’s are defined by U.S. Office of Management & Budget
• Adjacent counties with high degree of social/economic integration with urban core of 50,000 people or more.
Hampton Roads
MSA
• Geographically defined as 5 counties and 9 independent cities in Virginia, and 2 counties in North Carolina.
• Virginia Beach-Norfolk-Newport News MSA (Hampton Roads MSA for the remainder of this report) has a population of more than 1.7 million people.
Source: Esri 17

DRAFT
CITY OF VIRGINIA BEACH
Source: Microsoft MapPoint
The City of Virginia Beach is an
independent city (not in the territory of any
county or counties) with a population
448,653 people.
Chesapeake and Norfolk are the
neighboring cities to the east, while
surrounded by water to the north, south,
and west.
18
DRAFT
POPULATION DATA - AGE
Sources: Esri, Nielsen
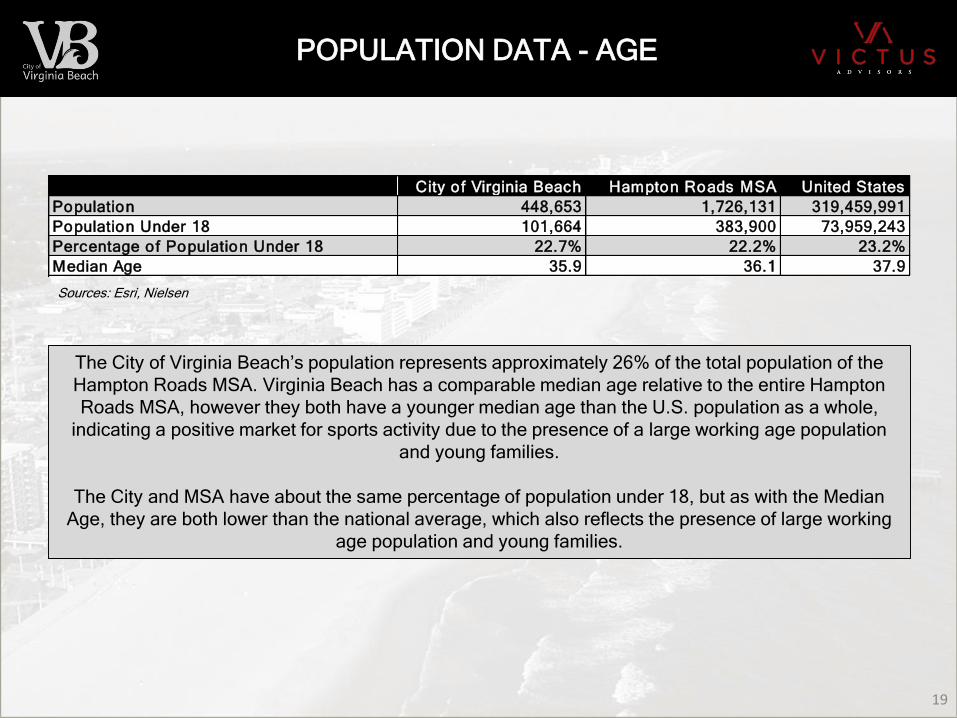
The City of Virginia Beach’s population represents approximately 26% of the total population of the
Hampton Roads MSA. Virginia Beach has a comparable median age relative to the entire Hampton
Roads MSA, however they both have a younger median age than the U.S. population as a whole,
indicating a positive market for sports activity due to the presence of a large working age population
and young families.
The City and MSA have about the same percentage of population under 18, but as with the Median
Age, they are both lower than the national average, which also reflects the presence of large working
age population and young families.
Hampton Roads MSA United States
Population 448,653 1,726,131 319,459,991
Population Under 18 101,664 383,900 73,959,243
Percentage of Population Under 18 22.7% 22.2% 23.2%
Median Age 35.9 36.1 37.9
City of Virginia Beach
19
DRAFT 20
POPULATION DISTRIBUTION
Population by
Zip Code
Source: Microsoft MapPoint
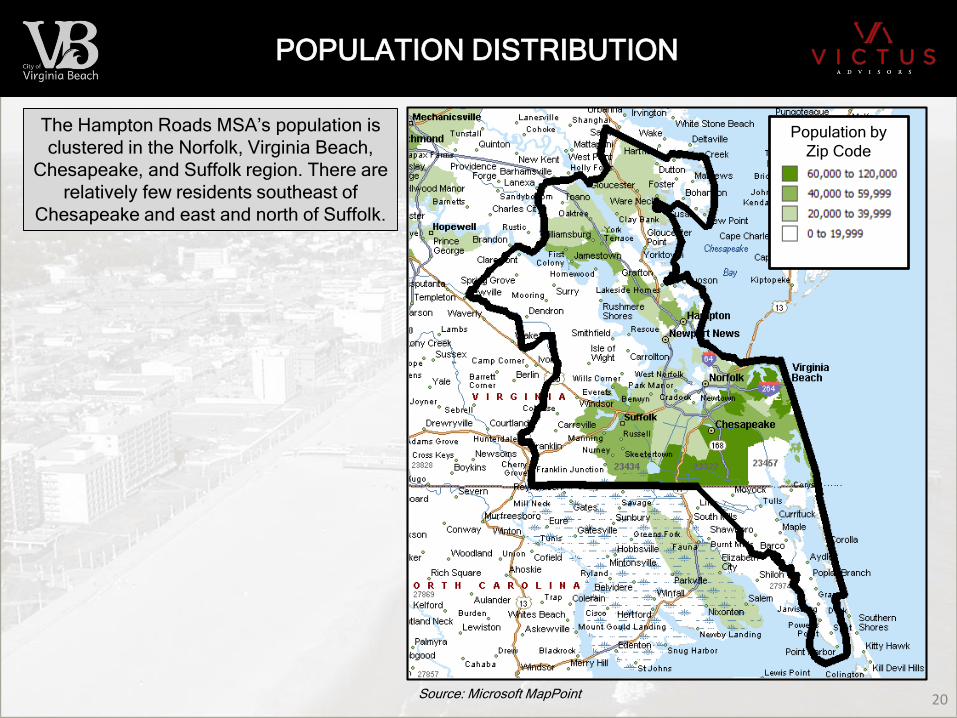
The Hampton Roads MSA’s population is
clustered in the Norfolk, Virginia Beach,
Chesapeake, and Suffolk region. There are
relatively few residents southeast of
Chesapeake and east and north of Suffolk.

DRAFT 21
AGE DISTRIBUTION
Median Age by
Zip Code
Source: Microsoft MapPoint
A lower median age of a population tends
to be a positive market indicator for a
multi-purpose sports venues due to the
presence of a large working age population
and young families.
As with the population distribution, younger
median ages tend to be clustered around
the principal cities of the Hampton Roads
MSA (in particular, Virginia Beach, Norfolk,
and Suffolk).

DRAFT
POPULATION DATA - GROWTH
Sources: Esri, Nielsen
The City of Virginia Beach and the Hampton Roads MSA have seen positive growth over the last 15
years. Over the next five years, a slight increase is projected in the annual growth rate for the City.
Both the City and the MSA have grown at a slower rate than the rest of the United States.
Hampton Roads MSA United States
Population Growth:
Annual Pop. Growth (2000 to 2015) 0.4% 0.6% 0.8%
Annual Pop. Growth (5-year Projection) 0.5% 0.6% 0.7%
Projected Population (2020) 461,108 1,781,561 330,689,365
City of Virginia Beach
22
DRAFT
HOUSEHOLD DATA – CHILDREN & INCOME
Source: Esri, Nielsen
Note: (1) Adjusted for cost of living, according to ACCRA Cost of Living Index and city-data.com
Sources: Esri, Nielsen
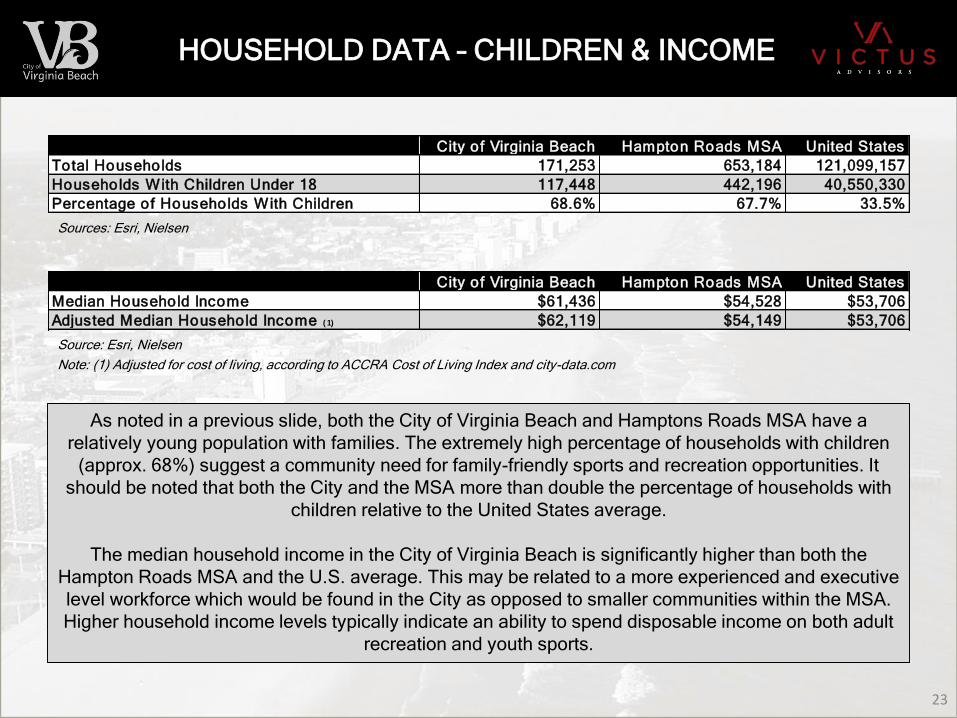
As noted in a previous slide, both the City of Virginia Beach and Hamptons Roads MSA have a
relatively young population with families. The extremely high percentage of households with children
(approx. 68%) suggest a community need for family-friendly sports and recreation opportunities. It
should be noted that both the City and the MSA more than double the percentage of households with
children relative to the United States average.
The median household income in the City of Virginia Beach is significantly higher than both the
Hampton Roads MSA and the U.S. average. This may be related to a more experienced and executive
level workforce which would be found in the City as opposed to smaller communities within the MSA.
Higher household income levels typically indicate an ability to spend disposable income on both adult
recreation and youth sports.
Hampton Roads MSA United States
Median Household Income $61,436 $54,528 $53,706
Adjusted Median Household Income ( 1) $62,119 $54,149 $53,706
City of Virginia Beach
Hampton Roads MSA United States
Total Households 171,253 653,184 121,099,157
Households With Children Under 18 117,448 442,196 40,550,330
Percentage of Households With Children 68.6% 67.7% 33.5%
City of Virginia Beach
23

DRAFT 24
INCOME DISTRIBUTION
Source: Microsoft MapPoint
Median Income by Zip
Code
Median Household income levels within
the MSA tend to be higher in the Virginia
Beach/Chesapeake areas, and lower in
Hampton, Newport News, Norfolk, and
Suffolk.

DRAFT
REGIONAL DRIVE TIME ZONE
MSA’s with 500k+
Population Within
a 3-hour Drive
Raleigh MSA
pop. 1,273,568
Richmond MSA
1,271,334
3 Hours
6 Hours
MSA’s with 500k+
Population Within
a 6-hour DriveNew York MSA
pop. 20,182,305
Washington D.C. MSA
6,097,684
Philadelphia MSA
6,069,875
Baltimore MSA
2,797,407
Charlotte MSA
2,426,363
Allentown MSA
832,327
Columbia, SC MSA
810,068
Greensboro MSA
752,157
Winston-Salem MSA
659,330
Harrisburg MSA
565,006
Durham MSA
552,493
Only Raleigh and
Richmond are within
a three hour drive of
Virginia Beach,
which is the typical
driving range for
single-day events.
However, within a
six hour drive, there
are 11 large markets
ranging from South
Carolina to New
York that could be
attractive targets for
overnight/multi-day
tournaments. Sources: Microsoft MapPoint, Office of Management and Budget (2010)25

DRAFT 26
COMPARATIVE MARKETS – SELECTION CRITERIA
Based upon feedback from the Sports Marketing Unit regarding the markets that
they most often compete against for amateur sports events, Victus Advisors
compared Virginia Beach’s demographic and socioeconomic characteristics to
the following competitive set. Additionally, in later sections of this report, Victus
Advisors has compared Virginia Beach to this same competitive set in terms of
sports marketing/branding best practices and organizational approach:
• Birmingham, Alabama
• Charlotte, North Carolina
• Knoxville, Tennessee
• Louisville, Kentucky
• Myrtle Beach, South Carolina
• Raleigh, North Carolina
• Richmond, Virginia

DRAFT 27
COMPARATIVE MARKETS – POPULATION
MSA
City, State MSA Population
Charlotte, NC Charlotte-Concord-Gastonia 2,366,607
Virginia Beach, VA Hampton Roads 1,726,131
Richmond, VA Richmond 1,261,374
Louisville, KY Louisville/Jefferson County 1,260,980
Raleigh, NC Raleigh 1,241,532
Birmingham, AL Birmingham-Hoover 1,151,476
Knoxville, TN Knoxville 862,269
Myrtle Beach, SC Myrtle Beach-Conway-North Myrtle Beach 415,646
Average 1,285,752
Median 1,251,256
Note: Sorted by MSA Population in descending order
Source: Esri
The Hampton Roads MSA’s population of 1,726,131 represents the second most populated out of the
eight markets selected for comparative analysis.

DRAFT 28
COMPARATIVE MARKETS – GROWTH
Annualized Proj. Annual
Pop. Growth Pop. Growth
City, State MSA (2000-2015) (2015-2020)
Myrtle Beach, SC Myrtle Beach-Conway-North Myrtle Beach 2.9% 2.1%
Raleigh, NC Raleigh 3.0% 2.0%
Charlotte, NC Charlotte-Concord-Gastonia 2.2% 1.6%
Richmond, VA Richmond 1.2% 1.0%
Virginia Beach, VA Hampton Roads 0.6% 0.6%
Knoxville, TN Knoxville 1.0% 0.6%
Louisville, KY Louisville/Jefferson County 0.8% 0.6%
Birmingham, AL Birmingham-Hoover 0.6% 0.5%
Average 1.5% 1.1%
Median 1.1% 0.8%
Note: Sorted by Projected Annual Population Growth in descending order
Source: Esri
The projected growth rate of the Hampton Roads MSA is well below the average and just below the
median among comparative markets.

DRAFT 29
MSA
Median
City, State MSA Age
Raleigh, NC Raleigh 35.8
Virginia Beach, VA Hampton Roads 36.1
Charlotte, NC Charlotte-Concord-Gastonia 37.1
Birmingham, AL Birmingham-Hoover 38.5
Richmond, VA Richmond 38.6
Louisville, KY Louisville/Jefferson County 39.3
Knoxville, TN Knoxville 41.0
Myrtle Beach, SC Myrtle Beach-Conway-North Myrtle Beach 44.3
Average 38.8
Median 38.6
Note: Sorted by MSA Median Age in ascending order
Source: Esri
COMPARATIVE MARKETS – MEDIAN AGE
The Hampton Roads MSA’s median age of 36.1 is below both the average and median among
comparative markets. It indicates that the market is likely to support and participate in amateur sports
events due to the presence of a working-age population and young families.

DRAFT 30
COMPARATIVE MARKETS – YOUTH
Households % of
Total w/ Children Households
City, State MSA Households Under 18 w/ Children
Virginia Beach, VA Hampton Roads 653,184 442,196 68%
Charlotte, NC Charlotte-Concord-Gastonia 906,072 611,546 67%
Birmingham, AL Birmingham-Hoover 451,974 303,279 67%
Raleigh, NC Raleigh 471,065 313,184 66%
Richmond, VA Richmond 490,333 322,076 66%
Knoxville, TN Knoxville 350,408 229,802 66%
Myrtle Beach, SC Myrtle Beach-Conway-North Myrtle Beach 175,807 114,851 65%
Louisville, KY Louisville/Jefferson County 508,316 329,555 65%
Average 500,895 333,311 66.3%
Median 480,699 317,630 66.1%
Note: Sorted by % of Households w/ Children in descending order
Source: Esri
The Hampton Roads MSA ranks first out of the eight comparative markets in terms of the percentage
of households in the market that have children under 18, indicating that significant demand should
continue to exist for youth sports and family recreation.

DRAFT 31
COMPARATIVE MARKETS – CORPORATE BASE
Corporate
City, State MSA Base ( 1)
Charlotte, NC Charlotte-Concord-Gastonia 1,813
Virginia Beach, VA Hampton Roads 1,154
Louisville, KY Louisville/Jefferson County 1,149
Richmond, VA Richmond 1,045
Birmingham, AL Birmingham-Hoover 1,023
Raleigh, NC Raleigh 932
Knoxville, TN Knoxville 663
Myrtle Beach, SC Myrtle Beach-Conway-North Myrtle Beach 203
Average 998
Median 1,034
Note: Sorted by Corporate Base in descending order
Source: Hoovers
(1) Defined as HQs and branch locations with at least 5 employees and $1M+ annual sales.
Among comparative markets, the Hampton Roads MSA has the second largest corporate base,
suggesting ample opportunities for corporate partnerships including sponsorship and advertising of
sports facilities and events.
DRAFT 32
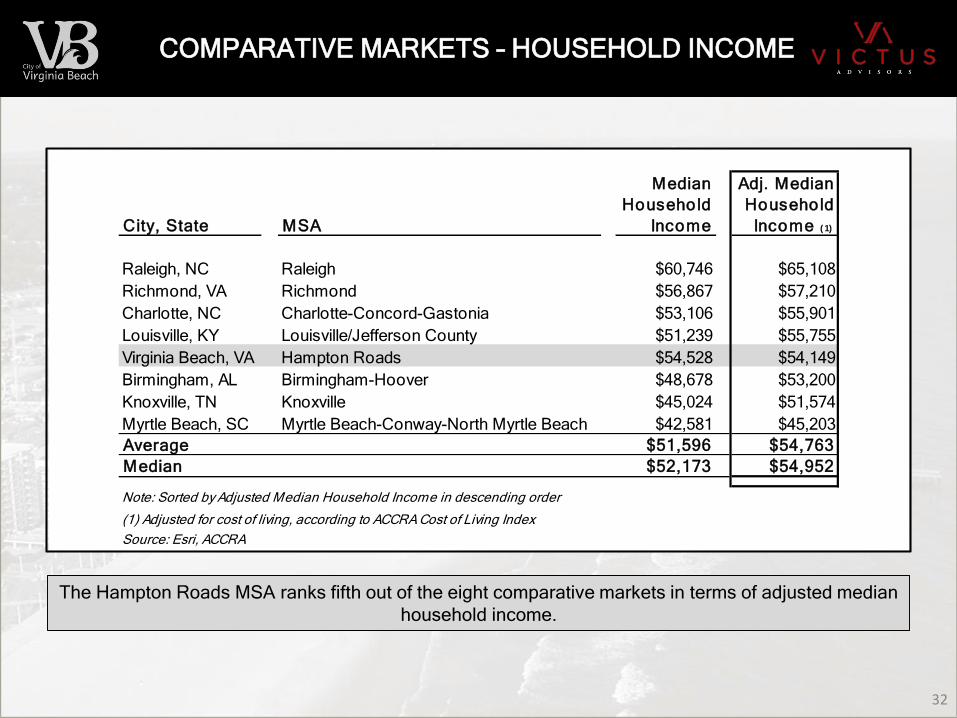
COMPARATIVE MARKETS – HOUSEHOLD INCOME
The Hampton Roads MSA ranks fifth out of the eight comparative markets in terms of adjusted median
household income.
Median Adj. Median
Household Household
City, State MSA Income Income ( 1)
Raleigh, NC Raleigh $60,746 $65,108
Richmond, VA Richmond $56,867 $57,210
Charlotte, NC Charlotte-Concord-Gastonia $53,106 $55,901
Louisville, KY Louisville/Jefferson County $51,239 $55,755
Virginia Beach, VA Hampton Roads $54,528 $54,149
Birmingham, AL Birmingham-Hoover $48,678 $53,200
Knoxville, TN Knoxville $45,024 $51,574
Myrtle Beach, SC Myrtle Beach-Conway-North Myrtle Beach $42,581 $45,203
Average $51,596 $54,763
Median $52,173 $54,952
(1) Adjusted for cost of living, according to ACCRA Cost of Living Index
Note: Sorted by Adjusted Median Household Income in descending order
Source: Esri, ACCRA

DRAFT
33
SECTION 2B
SUMMARY OF KEY FINDINGS – LOCAL
SPORTS FACILITIES & HOTELS
33

DRAFT 34
SPORTS FACILITY SATISFACTION METHODOLOGY
As part of our community survey process, Victus Advisors gathered feedback from local
sports participants regarding their satisfaction with the primary sports venues that are
marketed by the City’s Sports Marketing Unit. Respondents were asked to rate their
satisfaction with each facility on a 7-point scale, in which “7” represents “Very Satisfied”
and “1” represents “Very Dissatisfied”
Results were evaluated using “Top-2 Box” combined scores (“7” + “6”, representing the
highest levels of satisfaction) and “Bottom-3 Box” (“3” + “2” + “1”, representing the lowest
satisfaction levels)
Top-2 Box Rating
(% 7, 6)
Bottom-3 Box Rating
(% 3, 2, 1)

DRAFT
“TOP-2 BOX” METHODOLOGY (CONT’D)
Our Top-2 Box methodology is a best-in-class approach to facility satisfaction
measurement. A similar methodology is utilized by many customer service-oriented
businesses (such as department stores, hotels, banks, etc.).
The focus on Top-2 Box scores places a higher emphasis on the priority of
achieving maximum satisfaction (scores of 6 or 7) from every visitor.
80%+ • Excellent
65-80%• Good
50-65% • Average
< 50% • Poor
General Top-2 Box score
standards for facility
satisfaction analysis
SATISFACTION METHODOLOGY (CONT.)
35

DRAFT 36
SATISFACTION W/ VA BEACH SPORTS FACILITIES
Virginia Beach sports participants are relatively satisfied with the overall quality of sports facilities in
the local market, with five of the eight facilities receiving “good” Top-2 Box scores of 65% or greater.
Only the Hampton Roads Soccer Complex received a “poor” Top-2 Box score of less than 50%.
Note: Sorted by Top-2 Box score in descending order
DRAFT
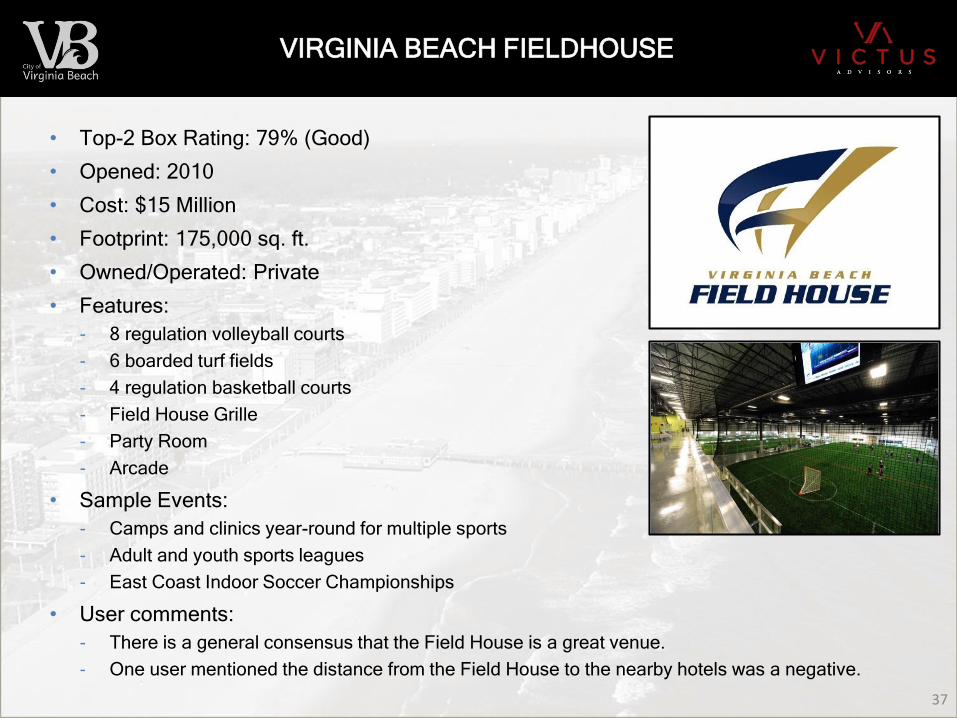
• Top-2 Box Rating: 79% (Good)
• Opened: 2010
• Cost: $15 Million
• Footprint: 175,000 sq. ft.
• Owned/Operated: Private
• Features:
- 8 regulation volleyball courts
- 6 boarded turf fields
- 4 regulation basketball courts
- Field House Grille
- Party Room
- Arcade
• Sample Events:
- Camps and clinics year-round for multiple sports
- Adult and youth sports leagues
- East Coast Indoor Soccer Championships
• User comments:
- There is a general consensus that the Field House is a great venue.
- One user mentioned the distance from the Field House to the nearby hotels was a negative.
37
VIRGINIA BEACH FIELDHOUSE

DRAFT 38
VIRGINIA BEACH SPORTSPLEX
• Top-2 Box Rating: 68% (Good)
• Opened: 1999
• Cost: $6.8 Million
• Footprint: 653,400 sq. ft.
• Owner: City of Virginia Beach
• Operator: Hometown Sports Management
• Features:
- Sportsplex Stadium
o 1 field
o 6,000 seats with ability to expand to 10,000
• Sample Events:
- Turkey Shoot Lacrosse
- Football and rugby events
• User comments:
- One event organizer feels the facility is great, but their event is close to outgrowing the facility.
- “The facility feels cold and grey, nothing inviting. More events such as high school football should
be held there, to make it a great atmosphere to play at.”
DRAFT 39
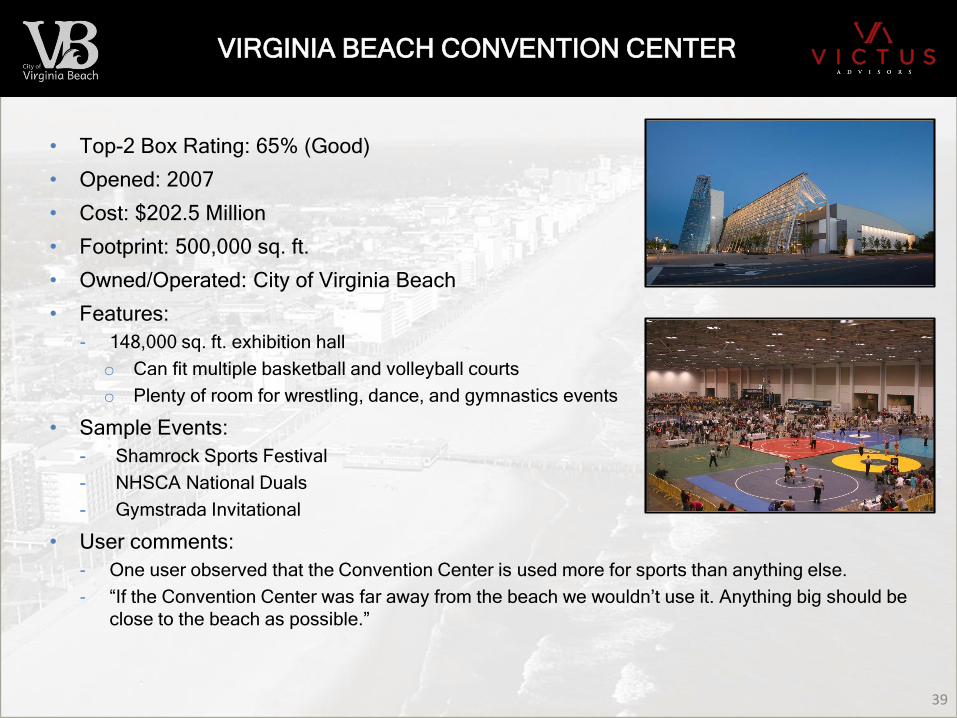
VIRGINIA BEACH CONVENTION CENTER
• Top-2 Box Rating: 65% (Good)
• Opened: 2007
• Cost: $202.5 Million
• Footprint: 500,000 sq. ft.
• Owned/Operated: City of Virginia Beach
• Features:
- 148,000 sq. ft. exhibition hall
o Can fit multiple basketball and volleyball courts
o Plenty of room for wrestling, dance, and gymnastics events
• Sample Events:
- Shamrock Sports Festival
- NHSCA National Duals
- Gymstrada Invitational
• User comments:
- One user observed that the Convention Center is used more for sports than anything else.
- “If the Convention Center was far away from the beach we wouldn’t use it. Anything big should be
close to the beach as possible.”

DRAFT 40
VA BEACH CONVENTION CENTER – SPORTS USAGE
Source: PriceWaterhouseCoopers, Va. Beach Convention Center, FY2015
The Virginia Beach Convention
Center (VBCC) host atypical
levels of participatory sports
events for an upscale convention
and corporate conference
center.
In fiscal year 2015, participatory
sports accounted for 27% of
Convention Center revenues,
the most revenue from any
single event category.
Participatory sports held at the
Convention Center also
accounted for 73% of estimated
room nights generated by the
Convention Center in fiscal year
2015.

DRAFT 41
VA BEACH CONVENTION CENTER – HOTELS
In addition to unusually heavy sports use, the VBCC is also unique in that it does not
have an on-site hotel that is attached or adjacent to the facility. As shown below,
convention centers in comparable markets have at least one, if not two, attached or
adjacent hotels, with an average of 716 total on-site hotel rooms. The majority of these
hotels are flagship brands such as Marriott, Sheraton, Westin, Hyatt and Hilton. It is likely
that the lack of a flagship, on-site, convention hotel puts the VBCC at a competitive
disadvantage for attracting convention events relative to comparable markets such as
Charlotte, Birmingham, Louisville, Raleigh, Richmond, and Myrtle Beach.
Source: Victus Advisors Research
Comparable Market Convention Center On-Site Hotel 1
Guest
Rooms On-Site Hotel 2
Guest
Rooms
TOTAL
ON-SITE
HOTEL
ROOMS
Charlotte Convention Center Westin Charlotte 700 Hilton Charlotte Center City 400 1,100
Birmingham-Jefferson Convention Complex Sheraton Birmingham 757 Westin Birmingham 294 1,051
Kentucky International Convention Center Louisville Marriott Downtown 616 Hyatt Regency Louisville 393 1,009
Raleigh Convention Center Marriott City Center 400 Sheraton Raleigh 353 753
Richmond Convention Center Richmond Marriott 410 n/a 410
Myrtle Beach Convention Center Sheraton Myrtle Beach 400 n/a 400
Knoxville Convention Center Holiday Inn Knoxville Downtown 286 n/a 286
Virginia Beach Convention Center n/a n/a 0
Average - Excluding VBCC: 716
Median - Excluding VBCC: 753

DRAFT 42
PRINCESS ANNE ATHLETIC COMPLEX
• Top-2 Box Rating: 65% (Good)
• Owned/Operated: City of Virginia Beach
• Features:
- 8 baseball/softball fields (grass)
o All lighted
- 7 full-size multi-purpose fields (grass)*
o 2 are lighted, with lights currently being installed at 2 more
• Sample Events:
- US Lacrosse
- ASA Softball
- 3v3 Live Soccer
• User comments:
- “ The fields are in great condition, field size is good, and ample
permanent seating available for spectators.”
- Many users and event organizers cited the need for multiple
artificial turf fields.
*Note: 3 fields are currently being converted to artificial turf and an 8th field,
also artificial turf, is under construction

DRAFT 43
VIRGINIA BEACH OCEANFRONT
• Top-2 Box Rating: 65% (Good)
• Owned/Operated: City of Virginia Beach
• Sample Events:
- USA Ultimate Beach Nationals
- East Coast Surfing Championship
- Rock n Roll ½ Marathon
- Surf’n Santa 10 Miler
- North American Soccer Sand Soccer
• User comments:
- “Make the oceanfront more charming and less of a police state,
I also think having equipment for working out would be fun on
the beach.”
- “Parking is a nightmare at the oceanfront!”
- “An indoor field house near the oceanfront would be
wonderful…”

DRAFT 44
USA REGIONAL FIELD HOCKEY TRAINING CENTER
• Top-2 Box Rating: 62% (Average)
• Opened: 1999
• Cost: $6.8 Million
• Footprint: 653,400 sq. ft.
• Owner: City of Virginia Beach
• Operator: Sportsplex/Hometown Sports Management
• Features:
- 2 fields
o 300 seats per field
• Sample Events:
- High School Field Hockey Regional
- National Field Hockey League
- US Field Hockey Qualifiers
• User comments:
- One event organizer was very satisfied with the Training Center and noted that they had everything
they needed.
- One user rated the facility poorly because there are not enough lighted fields.

DRAFT 45
VIRGINIA BEACH TENNIS & COUNTRY CLUB
• Top-2 Box Rating: 53% (Average)
• Expanded: 2012
• Cost: $6 Million
• Footprint: 94,000 sq. ft.
• Owned/Operated: Private
• Features:
- 28 outdoor tennis courts (25 clay)
- 10 indoor courts
- Fitness Center
- Restaurant
- Pro Shop
• Sample Events:
- USTA Regional and National Events
• User comments:
- A USTA representative mentioned that there is a need for more hard courts rather than clay courts
to be able to host larger national and regional events.
- The sample size of survey respondents who had experience with the Tennis & Country Club was
small relative to other Virginia Beach sports venues.

DRAFT 46
HAMPTON ROADS SOCCER COMPLEX
• Top-2 Box Rating: 49% (Poor)
• Opened: 1990
• Cost: $6.8 Million
• Footprint: 75 acres
• Owner: City of Virginia Beach
• Operator: Hampton Roads Soccer Council
• Features:
- 21 soccer fields
o 12 full-size grass fields
o 7 small fields
o 2 full-size synthetic turf fields
• Sample Events:
- Neptune Soccer Classic
- Veterans Cup
- Virginia beach Sun Cup Soccer Tournament
• User comments:
- “The HRSC needs to do something about their inability to handle even the slightest amount of rain.
I realize the rain isn't their fault but they closed for nearly an entire month this spring.”
- “The HRSC closes at a drop of rain. This is annoying as it extends the season.”
- “The HRSC has no community access, poor rental structure, and poor field maintenance.”

DRAFT 47
PROPOSED NEW MULTI-PURPOSE ARENA
Although it is still in the planning stages, and thus not reviewable by survey respondents, Victus Advisors
has also profiled the potential new arena to be located near the Virginia Beach Convention Center. The
purpose of this review is to highlight the potential synergies, as well as the potential differences, relative
to Virginia Beach’s participatory and amateur sports facilities.
CURRENT ARENA PLAN
• 500,000 sq. ft.
• Up to 18,000 seat capacity
• Estimated to cost approx. $200 Million
• Expected to take two years to build
- Goal is to be completed by Fall 2018
• Expected to be operated by SMG
• Primary types of events:
- Live concerts
- Family shows (Disney on Ice, etc.)
- Flat floor and trade shows
- Collegiate and pro sports events
DIFFERENCES WITH PARTICIPATORY SPORTS
• Due to the larger size and operating costs of the arena,
the primary events held would be ticketed events that
drive significant rental rates and revenue streams.
• SMG is an experienced arena operator with a history of
maximizing arena revenues via large, ticketed events
that drive thousands of ticket-buying attendees and
drive arena profits (concerts, championship
pro/collegiate sporting events, etc.).
• The arena rental rates necessary to drive profitable
operations are likely to far exceed the rental rates that
non-ticketed, participatory sporting events are typically
willing to pay for sports venues.
SYNERGIES WITH PARTICIPATORY SPORTS
• The arena could potentially be the site for the final
rounds or championship games for tournaments in
basketball, volleyball, and other courts sports.
However, only if those events are large enough to
attract 5,000+ ticketed attendees.

DRAFT 48
VENUE OPERATIONS SUMMARY
Only three (3) of the nine (9) sports venues profiled in this section are operated by the City. The majority
of the sports venues in Virginia Beach are operated by private operators, which limits the CVB’s ability to
block off key dates, schedule events, control rental rates, and manage in-venue event services. It
appears that the primary reason for the Convention Center’s heavy usage by participatory sports events
is that the Convention Center is the only indoor sports facility that is operated by the City and thus
convenient for the CVB to book and operate large indoor sports events.
Hampton Roads Soccer Complex
Field Hockey Training Center
Proposed New Multi-Use Arena
Va. Beach Tennis & Country Club
Virginia Beach Fieldhouse
Virginia Beach Sportsplex
Princess Anne Athletic Complex
Virginia Beach Convention Center
Virginia Beach Oceanfront

DRAFT 49
KEY TAKEAWAYS – LOCAL VENUE ANALYSIS
• There are only four (4) dedicated basketball courts available in
Virginia Beach.
• Heavy usage of the VBCC for participatory sports demonstrates the
demand for a publicly-owned indoor sports center that is under the
control of the CVB.
• More volleyball and basketball courts could increase participation in
adult and youth leagues.
• In addition, with a publicly-owned indoor sports center, events and
leagues could be more accessible to the public.
• Participatory sports are played year-round and would benefit from
indoor fields to minimize cancellations due to rain or inclement
weather.
• More access to indoor fields would increase supply for underserved
sports such as lacrosse.

DRAFT
VIRGINIA BEACH HOTEL MAP
Source: Hotels.com, Google MapsNote: Minimum 2-star hotels within Virginia Beach city limits
Victus found that lodging (minimum
2-star rating) within Virginia Beach
city limits is primarily concentrated
near the oceanfront, with a secondary
cluster located at the Virginia Beach
Town Center.
It is also worth noting that:
• There are no hotel options located
at the Princess Anne Athletic
Complex.
• There are numerous hotel options
clustered just outside the Virginia
Beach city limits in both Norfolk
and Chesapeake.
50

DRAFT
VIRGINIA BEACH 2015 HOTEL DATA
Sources: Virginia Beach CVB and National Oceanic and Atmospheric AdministrationNote: Data is for 10,000 rooms in Virginia Beach
Avg. High (°F): 49 53 59 67 75 84 87 86 81 71 62 53
Avg. Low (°F): 34 35 40 48 57 67 72 71 66 56 45 37
Average Daily
Rates are
highest (over
$140) from May
to September .
Occupancy and
Average Daily
Rates peak in
the summer
months, in
particular July
and August.
Occupancy
Rates are
below 60% for
seven months
out of the year,
from October
through April.
51

DRAFT
52
SECTION 2C
SUMMARY OF KEY FINDINGS –
INTERVIEWS, FOCUS GROUPS & SURVEYS
52

DRAFT 53
LOCAL ONE-ON-ONE INTERVIEWS
In April 2016, Victus Advisors held informational meetings and in-person interviews in
Virginia Beach with fifteen (15) project stakeholders and community leaders including:
• Mike Eason, Administrator, City of Virginia Beach
• Doug Smith, Deputy City Manager, City of Virginia Beach
• John Urin, City Councilman, City of Virginia Beach
• Buddy Wheeler, Former Coordinator of Sports Marketing, Virginia Beach CVB
• Kevin Bennington, Sports Management Coordinator, City of Virginia Beach
• Barry Frankenfield, Planning Director, City of Virginia Beach
• Harvey Shiflet, Owner, Virginia Beach Tennis & Country Club
• Linwood Branch, Board Member, Hampton Roads Chamber of Commerce
• Warren Harris, Director, Virginia Beach Department of Economic Development
• Brittany Jeffries, Project Manager, ESG Companies/United States Management
• Courtney Dyer, General Manager, Virginia Beach Convention Center
• Bobby Melatti, BeachEvents
• Aimee Taylor, Virginia Beach Restaurant Association
• Bill Gambrell, Resort Advisory Commission
• Michael Kalvort, Director, Virginia Beach Parks & Recreation
DRAFT 54
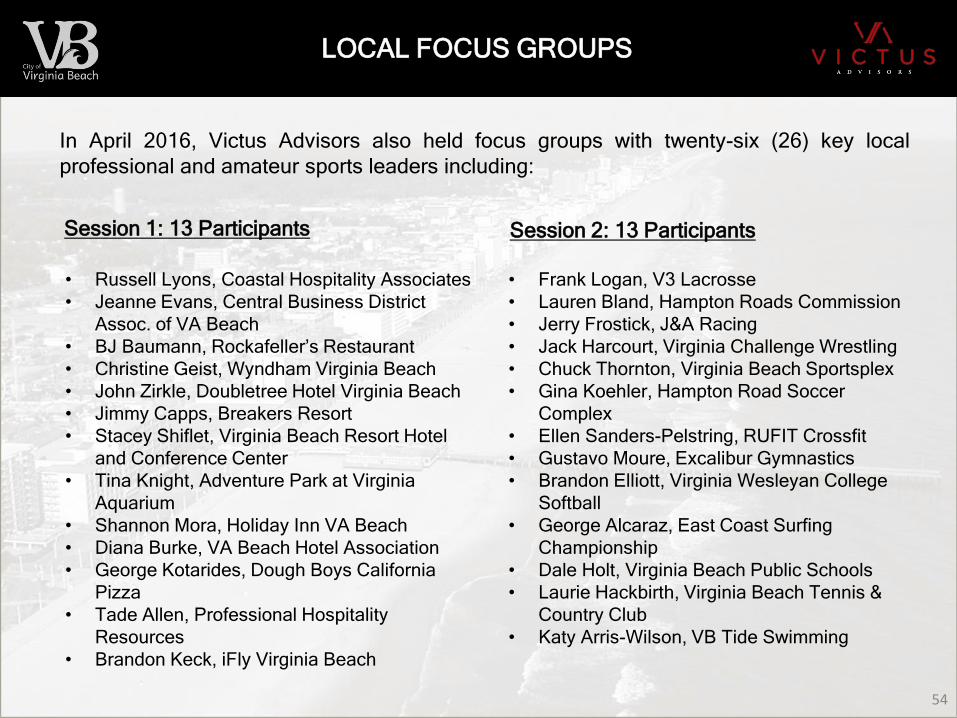
LOCAL FOCUS GROUPS
• Russell Lyons, Coastal Hospitality Associates
• Jeanne Evans, Central Business District
Assoc. of VA Beach
• BJ Baumann, Rockafeller’s Restaurant
• Christine Geist, Wyndham Virginia Beach
• John Zirkle, Doubletree Hotel Virginia Beach
• Jimmy Capps, Breakers Resort
• Stacey Shiflet, Virginia Beach Resort Hotel
and Conference Center
• Tina Knight, Adventure Park at Virginia
Aquarium
• Shannon Mora, Holiday Inn VA Beach
• Diana Burke, VA Beach Hotel Association
• George Kotarides, Dough Boys California
Pizza
• Tade Allen, Professional Hospitality
Resources
• Brandon Keck, iFly Virginia Beach
• Frank Logan, V3 Lacrosse
• Lauren Bland, Hampton Roads Commission
• Jerry Frostick, J&A Racing
• Jack Harcourt, Virginia Challenge Wrestling
• Chuck Thornton, Virginia Beach Sportsplex
• Gina Koehler, Hampton Road Soccer
Complex
• Ellen Sanders-Pelstring, RUFIT Crossfit
• Gustavo Moure, Excalibur Gymnastics
• Brandon Elliott, Virginia Wesleyan College
Softball
• George Alcaraz, East Coast Surfing
Championship
• Dale Holt, Virginia Beach Public Schools
• Laurie Hackbirth, Virginia Beach Tennis &
Country Club
• Katy Arris-Wilson, VB Tide Swimming
In April 2016, Victus Advisors also held focus groups with twenty-six (26) key local
professional and amateur sports leaders including:
Session 1: 13 Participants Session 2: 13 Participants
DRAFT 55
KEY TAKEAWAYS – LOCAL INTERVIEWS
• There is a definite need for a basketball facility or more courts. Often times
events will have to reach out to public and private schools to piece together
enough courts.
• Too many outdoor events and activities are rained out due to lack of
artificial fields.
• “Basketball is huge here.” There is not enough access to basketball courts
to meet demand, even in light of the Boo Williams Sportsplex being nearby.
• At the VBCC, “we are lacking on certain sports center amenities like
flooring/mats. We also don’t have anywhere to store them. We kind of just
pull it together when we need to. That’s what our competition is offering.”
• Relative to the lower costs of a dedicated sports center, “Convention center
costs keep going up - it’s one of the best, but because of operational costs
it’s too much for us - little things like the Wi-Fi costs over $8k.”

DRAFT 56
EVENT INTERVIEWS
• Will Stein, Tidewater Volleyball
• Frank Geers, American Cornhole
Organization
• Tony Staley, AAU Junior Olympic
Games
• Dennis Blackmore, Beach FC
• Jolandie de Clerck, VA Beach Field
House
• Donald Hand, Donald Hand Basketball
• Robert Kyle, Tidewater Volleyball Assoc.
• Neil Malvone, Dream Bowl
• Rob Alesbury, Firefighter Combat
Challenge
• Greg Thomas, International Sr. Softball
Assoc.
• Marti Bevan, Neptune Soccer Classic
• James Spencer, Premier Girls Fastpitch
• Dick Whalen, North American Sand
Soccer
• Steve Cohen, National Small College
Rugby Org.
• Taylor Tolbert, Nived Sports Group
• Susan Smith, Showcase Tournament
Management
• Butch Tiller, Softball Nation
• Sarah Woolsey, US Quidditch
• Kim Rogers, US Lacrosse
• Matthew Robinette, Formerly of VA
Beach CVB
• Beth Porreca, USA Football
• Byron Hicks, USA Ultimate
• Carlos Vigil, Showbiz National Talent
• Karen Collins, USA Field Hockey
• Lindsey Keeler, USTA
• Ed Zebrowski, US Lifesaving Assoc.
• Erin Zellers, Parent of Virginia Beach
athletes
In April/May 2016, Victus Advisors held twenty-seven (27) telephone interviews with sports
event organizers and operators locally, regionally and nationally including:

DRAFT 57
KEY TAKEAWAYS – EVENT INTERVIEWS
• One event organizer feels that an eight to 10 court facility is
necessary. The Field House is adequate, but there is a high
demand for more courts. The organizer would ideally like to host up
to 16 basketball events per year.
• There is an overall demand for more soccer/lacrosse fields, in
particular artificial turf to avoid cancelations due to rain.
• One user stated the need for “…venues that can hold multiple
volleyball courts with a high ceiling. Court space minimum is 40’ x
80’. We have events that need six to eight courts, others 12 or
more.”
• Some event organizers mentioned that they would like to host
events at the Field House, but it can be difficult to secure dates
because the facility appears to give preference and priority to its
own leagues.

DRAFT 58
ONLINE SURVEYS - LOCAL SPORTS PARTICIPANTS
In addition to meetings and interviews, in April 2016, Victus Advisors also
conducted online surveys with 278 parents, participants, coaches, and other
such members of the amateur sports market in the Virginia Beach area.
Survey topics included:
• General demographic information
• Sports and recreation facilities frequented in the Virginia Beach area
• General attitudes toward amateur sports in Virginia Beach
• Ideal features of amateur sports host cities and facilities
• Interest in utilizing a potential new Virginia Beach multi-use facility

DRAFT 59
KEY COMMENTS – SURVEY RESULTS
• “An indoor field house near the oceanfront would be wonderful, as well as
more turf fields.”
• “Need more local access to lacrosse practice fields.”
• “All of the fields need to be the new safe turf to accommodate games in the
rain as we suffer an inordinate amount of cancellation due to wet fields.”
• “Need more turf fields or they need grass fields to drain better. Games get
cancelled too easily.”
• “Lack of turf fields often causes events to be cancelled during rain or in
aftermath of rain to prevent damage to grass fields.”
• “It would be nice to have more turf fields available for practices/games.”
• “More rectangular fields are needed to support various sports. HRSC has
them but they are not available to program. More would allow additional
community use and potential travel tournaments.”

DRAFT
60
SECTION 2D
PRELIMINARY FACILITY
RECOMMENDATION
60

DRAFT 61
INTRODUCTION
Our facility recommendation is based primarily upon the following primary and
secondary research conducted by Victus Advisors over the course of the venue
inventory & market assessment study:
• Analysis of Virginia Beach’s unique market characteristics
• Review of comparative markets
• Community feedback via interviews, focus groups, and online surveys
• Interviews conducted with event organizers and tournament operators
A primary goal of our study was to identify the best opportunities for Virginia
Beach to invest in competitive infrastructure that can both support the growing
local demand for the most popular sports and also generate economic benefit for
the community by attracting competitive regional/national events.
Based on customized research and our extensive industry experience, we
identified that significant community demand exists for a New City-Controlled
Indoor Sports Center with Convenient Access to Virginia Beach Hotel Inventory.

DRAFT 62
CITY-CONTROLLED INDOOR SPORTS CENTER
RECOMMENDATION:
• The City of Virginia Beach should develop a multi-sport, indoor sports center for use by currently
underserved indoor sports, including basketball, volleyball, etc.
• Key components of this facility should include:
- Up to 10 regulation basketball courts, convertible to at least 12 volleyball courts
- Indoor artificial turf with configurations for simultaneous use by up to 2 user groups
- Flexible court layout and use of multi-purpose flooring/mat options so other sports may use
the venue (such as gymnastics, wrestling tournaments, etc.).
- Team rooms, concessions, administrative offices, etc.
• The sports center should be located conveniently to the Virginia Beach hotel inventory in order to
maximize multi-day tournament potential.
RATIONALE:
• The Convention Center was designed as a high-end conference/meeting venue, but is now
heavily used for participatory sports (27% of revenue, 73% of room nights).
• Basketball was identified as the least developed in terms of tournament facilities in Virginia
Beach. There is no centralized facility with more than four (4) courts in Virginia Beach.
• Volleyball is considered by the local community to be a very popular and successful sports in the
area, despite lack of a suitable year-round venue for tournaments and leagues.
• A flexible indoor facility, including artificial turf field space, could also accommodate numerous
other sports that currently lack appropriate indoor space for practices/games.
• October through April has the lowest occupancy rates for Virginia Beach hotels. An indoor facility
could attract more events during the winter months to increase hotel occupancy.

DRAFT
63
SECTION 3
COMPARABLE VENUE CASE STUDIES
63

DRAFT 64
COMPARABLE VENUES
Victus Advisors analyzed existing and planned indoor sports centers located in the
comparative markets that were identified by the Sports Marketing Unit as primary
competitors for amateur sports events. Selection criteria for the facilities we reviewed were:
• At least 80,000 square feet building footprint
• At least six (6) basketball courts
• Opened within the past 10 years
In addition, we also reviewed three other indoor facilities (located in Round Rock, Texas;
Spartanburg, South Carolina; and Gatlinburg, Tennessee) that all opened in 2014 and may
also be viewed as potential comparable venues for a new indoor sports center in Virginia
Beach. In total, we analyzed the following six (6) indoor sports centers. Unless otherwise
noted, the sources of information on the following pages were facility management:
• Hoover Sports Complex – Hoover, Alabama
• Boo Williams Sportsplex – Hampton, Virginia
• Upward Star Center – Spartanburg, South Carolina
• Myrtle Beach Sports Center – Myrtle Beach, South Carolina
• Round Rock Sports Center – Round Rock, Texas
• Rocky Top Sports World – Gatlinburg, Tennessee

DRAFT
Hoover Sports Complex
• Opening: Summer 2017
• Footprint:
- 120 acre indoor/outdoor complex ($76M total cost)
- Indoor facility: 155,000 sq. ft.
- Outdoor fields: 6 multi-use, 8 baseball/softball
• Owner: City of Hoover
• Operator: Sports Facilities Management (Private)
• Configurations (Indoor Facility):
- 12 regulation volleyball courts
- 9 regulation basketball courts
- 6 tennis courts
- 1 artificial turf field
• Anticipated Indoor Events:
- Camps and clinics year-round for multiple sports
- Adult and youth sports leagues
- Non-sports events such as banquets, trade shows, meetings, and graduation ceremonies
• Economic Impact:
- City officials project an annual economic impact of up to $33 million for both the indoor and outdoor
facilities.65
HOOVER, ALABAMA
DRAFT
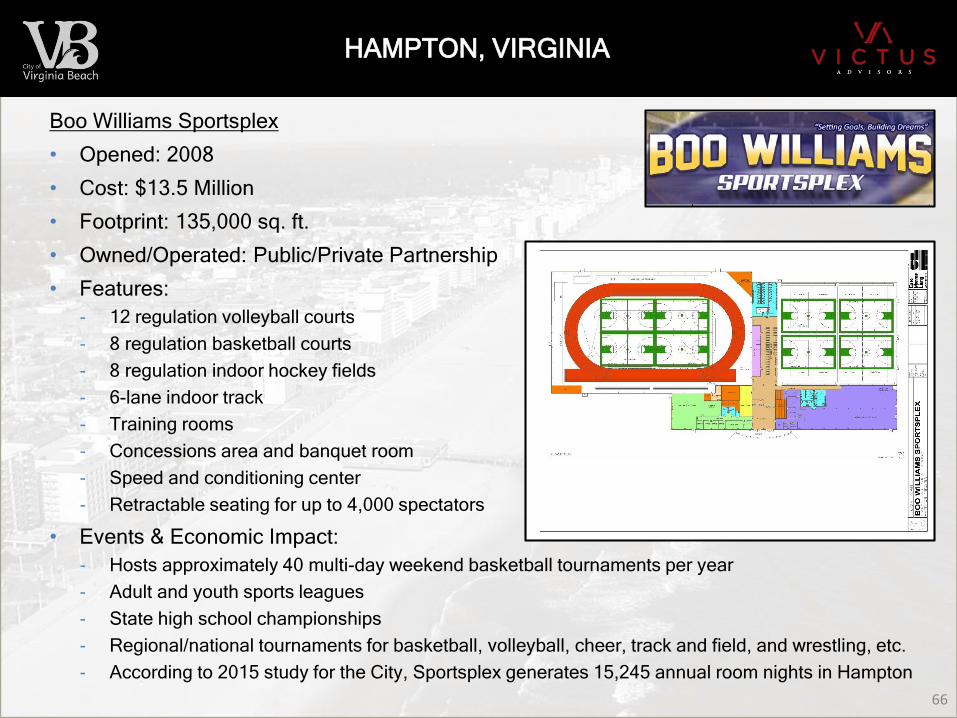
Boo Williams Sportsplex
• Opened: 2008
• Cost: $13.5 Million
• Footprint: 135,000 sq. ft.
• Owned/Operated: Public/Private Partnership
• Features:
- 12 regulation volleyball courts
- 8 regulation basketball courts
- 8 regulation indoor hockey fields
- 6-lane indoor track
- Training rooms
- Concessions area and banquet room
- Speed and conditioning center
- Retractable seating for up to 4,000 spectators
• Events & Economic Impact:
- Hosts approximately 40 multi-day weekend basketball tournaments per year
- Adult and youth sports leagues
- State high school championships
- Regional/national tournaments for basketball, volleyball, cheer, track and field, and wrestling, etc.
- According to 2015 study for the City, Sportsplex generates 15,245 annual room nights in Hampton
66
HAMPTON, VIRGINIA

DRAFT
Myrtle Beach Sports Center
• Opened: 2015
• Cost: $12.4 Million
• Footprint: 100,000 sq. ft.
• Owner: City of Myrtle Beach
• Operator: Sports Facilities Management (Private)
• Features:
- 8 regulation basketball courts (converts to 16 volleyball)
- 4 flex rooms (for locker rooms, etc.)
- Snack bar
• Events:
- National and regional tournaments for basketball, volleyball,
pickleball, wrestling, and gymnastics, etc.
- Initial targets for the facility, which opened in spring 2015, included up to 35 planned tournaments
from March through October. In the past year, facility management reports that they have hosted
32 tournaments and cheer competitions, most occurring on (or overlapping) weekends, with
approximately 115,000 total visitors.
• Economic Impact:
- City officials attribute $22 million of $167 million in total economic impact from sports tourism in
2015 to the new Sports Center
- Facility staff estimates that more than 58,000 room nights were generated in the first 19 months 67
MYRTLE BEACH, SOUTH CAROLINA

DRAFT
Myrtle Beach Sports Center Floor Plans
68
MYRTLE BEACH, SOUTH CAROLINA (CONT.)
The Myrtle
Beach Sports
Center was
designed so
that 8
basketball
courts could
also be utilized
as 16 volleyball
courts (i.e. 2
volleyball courts
per basketball
court)

DRAFT 69
ROUND ROCK, TEXAS
Round Rock Sports Center
• Opened: 2014
• Cost: $14.9 Million
• Footprint: 82,000 sq. ft.
• Owner/Operator: City of Round Rock
• Features:
- 12 regulation volleyball courts
- 6 regulation basketball courts
- 3 flex rooms (for locker rooms, etc.)
- Snack Concessions
• Events:
- Hosts over 35 weekend National and regional tournaments per year for
basketball, volleyball, wrestling, and gymnastics, etc.
- The Sports Center drew 48,000 athletes and an estimated 80,000 or more additional tournament
spectators last year.

DRAFT Round Rock Sports Center Court Configuration Options 70
ROUND ROCK, TEXAS (CONT.)
The Round Rock Sports Center has multiple court configurations. The facility can accommodate up to
three (3) NCAA-sized basketball courts, six (6) high school basketball courts, or 12 volleyball courts,
as shown below.
DRAFT 71
SPARTANBURG, SOUTH CAROLINA
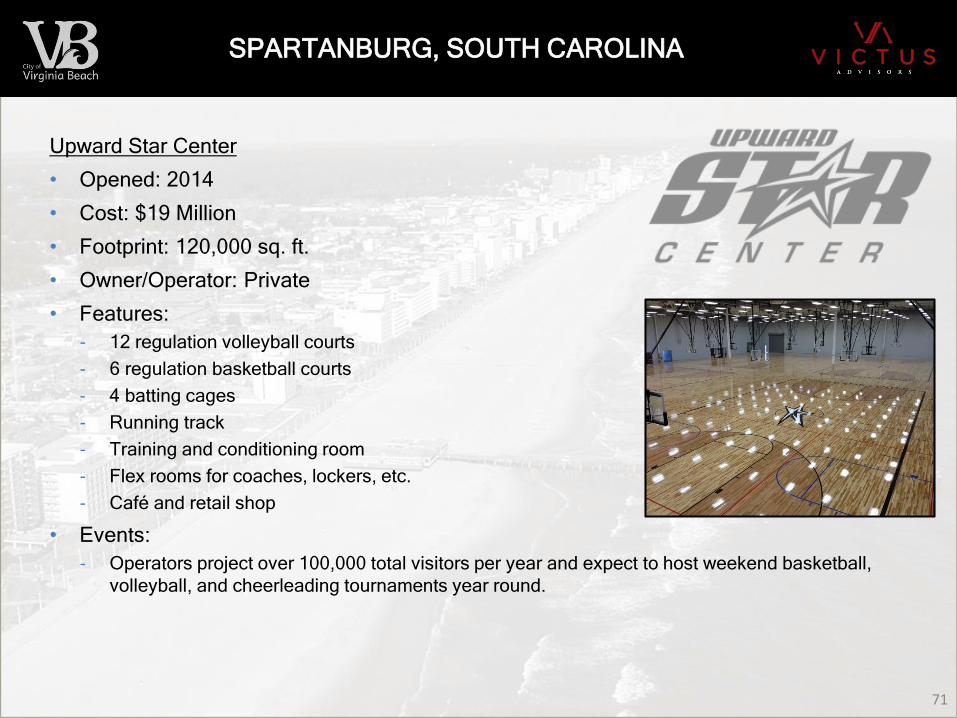
Upward Star Center
• Opened: 2014
• Cost: $19 Million
• Footprint: 120,000 sq. ft.
• Owner/Operator: Private
• Features:
- 12 regulation volleyball courts
- 6 regulation basketball courts
- 4 batting cages
- Running track
- Training and conditioning room
- Flex rooms for coaches, lockers, etc.
- Café and retail shop
• Events:
- Operators project over 100,000 total visitors per year and expect to host weekend basketball,
volleyball, and cheerleading tournaments year round.

DRAFT 72
GATLINBURG, TENNESSEE
Rocky Top Sports World
• Opened: 2014
• Cost: $20 Million
• Footprint:
- Located one hour outside Knoxville (Great Smoky Mountains)
- 80 acre indoor/outdoor complex
- Indoor facility: 86,000 sq. ft.
- Outdoor complex: 7 multi-use fields
• Owners: Sevier County & the City of Gatlinburg
• Operator: Sports Facilities Management (Private)
• Indoor Sports Center Features:
- 12 regulation volleyball courts
- 6 regulation basketball courts
- 3 flex rooms
- Café and grill
• Events & Economic Impacts: (note: includes indoor/outdoor sports)
- The facility hosted over 50 multi-sport tournaments, camps, and clinics for fiscal year 2015-16
- The facility generated approximately 15,000 hotel nights in its first year of operations
- Facility management estimates that they generated a $27.5 million gross economic impact in the
most recent fiscal year
DRAFT 73
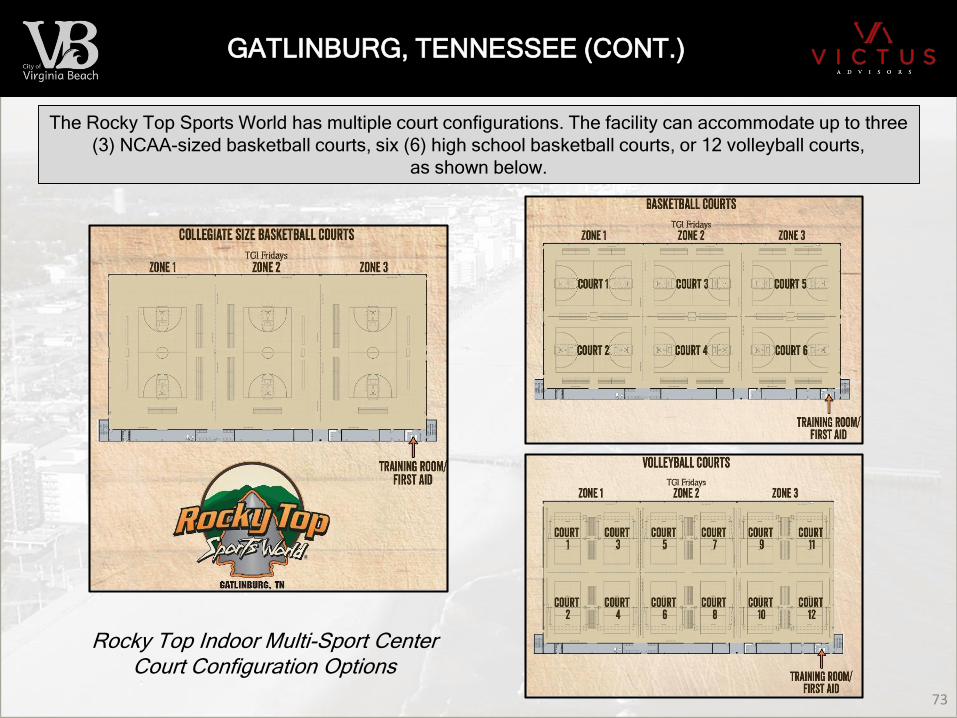
The Rocky Top Sports World has multiple court configurations. The facility can accommodate up to three
(3) NCAA-sized basketball courts, six (6) high school basketball courts, or 12 volleyball courts,
as shown below.
GATLINBURG, TENNESSEE (CONT.)
Rocky Top Indoor Multi-Sport Center Court Configuration Options

DRAFT
Year Square Construction Basketball Volleyball Indoor Indoor
Facility City, State Open Feet Cost ($M) Config. Config. Turf Track
Hoover Sports Complex Birmingham, AL 2017 155,000 76.0 (1) 9 12 1 -
Boo Williams Sportsplex Hampton, VA 2008 135,000 13.5 8 12 - 1
Upward Star Center Spartanburg, SC 2014 120,000 19.0 6 12 - -
Myrtle Beach Sports Center Myrtle Beach, SC 2015 100,000 12.4 8 16 - -
Rocky Top Sports World Gatlinburg, TN 2014 86,000 20.0 (2) 6 12 - -
Round Rock Sports Center Round Rock, TX 2014 82,000 14.5 6 12 - -
Note: Sorted by Square Feet in descending order
Source: Sports Center Administrators, Victus Research
Number of Fields/Courts
(1) Construction cost for Hoover Sports Complex includes both an outdoor field complex and indoor sports center on 120 acres
(2) Construction cost for Rocky Top Sports World includes both an outdoor field complex and indoor sports center on 80 acres
74
SUMMARY – INDOOR SPORTS VENUES
SIZE & CONFIGURATIONS
The comparable indoor sports centers reviewed in this section, as shown below, range from 82,000 to
155,000 square feet, and include 6 to 9 basketball courts (convertible to 12 to 16 volleyball courts). Two of
the venues also include additional indoor features such as indoor turf or an indoor track.
TOURNAMENTS & VISITORS
The comparable indoor facilities we analyzed are all expected to host anywhere from 25 to 40 weekend
tournaments each year, with up to 200,000 annual visitors (including athletes, coaches, spectators, etc.),
and upwards of 15,000 hotel nights generated each year.
DRAFT
75
SECTION 4
PRELIMINARY SITE ANALYSIS
75

DRAFT 76
INTRODUCTION
During interviews with local stakeholders and sports community leaders, Victus
Advisors requested input regarding potential areas within Virginia Beach that
could be suitable for development of a new indoor sports center. Based upon
these interviews, three general areas came to the forefront (in no particular
order):
• Beachfront Area
• Convention Center Area
• Princess Anne Area
As an initial test of site suitability for an indoor sports center, Victus Advisors
analyzed each site’s accessibility to the available hotel inventory within Virginia
Beach. We also considered Accident Potential Zones (APZ), as described on the
next page.
Generally speaking, from the standpoint of both attracting events and sustaining
economic development related to regional tournament activity, it is also ideal to
have convenient access to lodging and retail within a 10-15 minute drive of an
indoor sports center.

DRAFT 77
SITE CONSIDERATION FACTORS – AICUZ / APZ
A major consideration for any development (residential or commercial) in Virginia
Beach is the Air Installation Compatible Use Zone Program (AICUZ). The
Department of Defense (DOD) created this program with the intent to protect
citizens, military personnel, and public and private property from potential
damage due to noise and other hazards from airport activity. The DOD has also
designated Accident Potential Zones (APZ) near military airports where an air
craft accident is likely to occur if one occurs. These zones have restrictions
regarding types of developments that are deemed compatible or incompatible
according to the APZ level (shown on the next page). The restrictions associated
with these zones could have a significant impact on the viability of potential
locations for a new indoor sports center in Virginia Beach.
In addition, the U.S. Navy also owns 3,680 acres in restrictive easements
surrounding the Oceana Naval Air Station (Apollo Soucek Field), in order to to
minimize residential home development and restrict businesses that would attract
groups of people. It is worth noting that the easements may supersede the APZ
compatible uses (shown on the next page). As a result several areas within
Virginia Beach may not be feasible development options for an indoor sports
center.
DRAFT 78
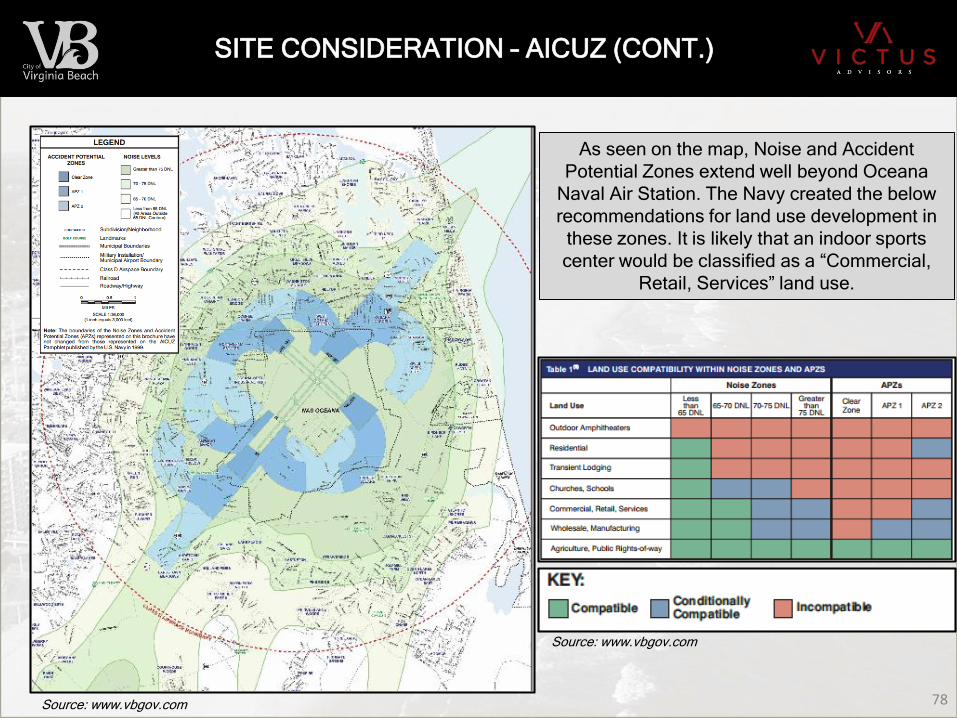
SITE CONSIDERATION – AICUZ (CONT.)
Source: www.vbgov.com
Source: www.vbgov.com
As seen on the map, Noise and Accident
Potential Zones extend well beyond Oceana
Naval Air Station. The Navy created the below
recommendations for land use development in
these zones. It is likely that an indoor sports
center would be classified as a “Commercial,
Retail, Services” land use.
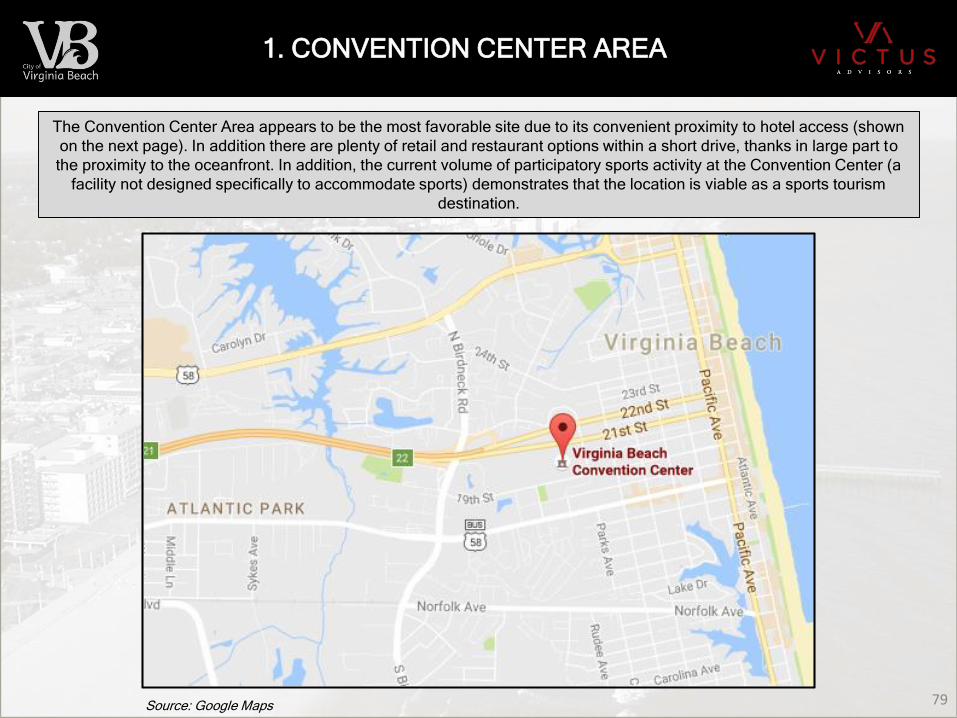
DRAFT 79
1. CONVENTION CENTER AREA
The Convention Center Area appears to be the most favorable site due to its convenient proximity to hotel access (shown
on the next page). In addition there are plenty of retail and restaurant options within a short drive, thanks in large part to
the proximity to the oceanfront. In addition, the current volume of participatory sports activity at the Convention Center (a
facility not designed specifically to accommodate sports) demonstrates that the location is viable as a sports tourism
destination.
Source: Google Maps
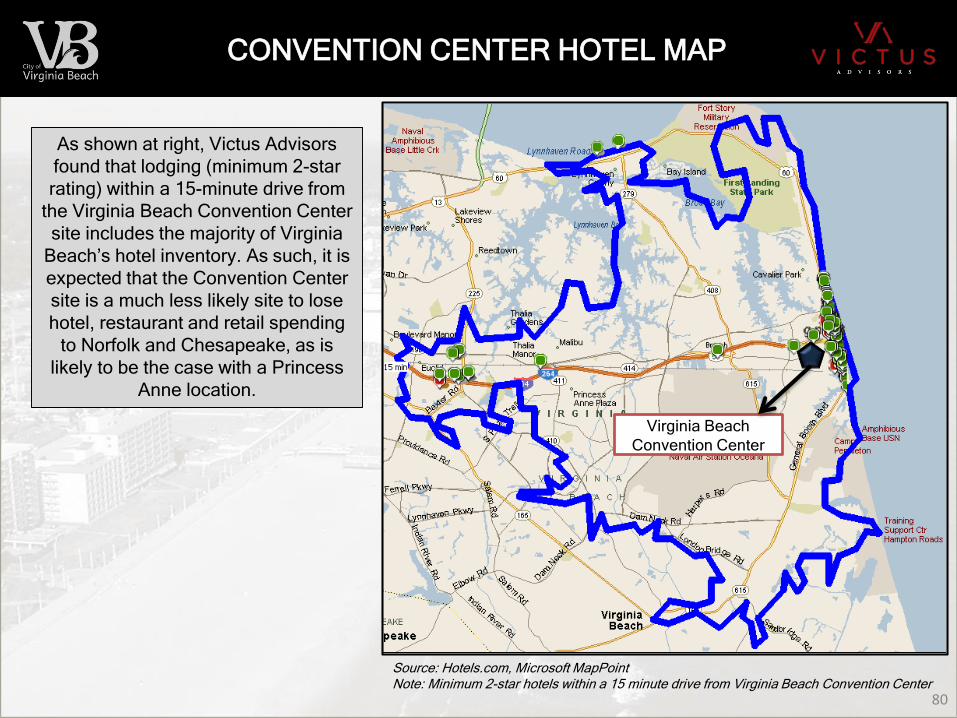
DRAFT
CONVENTION CENTER HOTEL MAP
Source: Hotels.com, Microsoft MapPointNote: Minimum 2-star hotels within a 15 minute drive from Virginia Beach Convention Center
As shown at right, Victus Advisors
found that lodging (minimum 2-star
rating) within a 15-minute drive from
the Virginia Beach Convention Center
site includes the majority of Virginia
Beach’s hotel inventory. As such, it is
expected that the Convention Center
site is a much less likely site to lose
hotel, restaurant and retail spending
to Norfolk and Chesapeake, as is
likely to be the case with a Princess
Anne location.
Virginia Beach
Convention Center
80

DRAFT 81
2. PRINCESS ANNE AREA
The Princess Anne Area is not recommended by Victus Advisors for a new indoor sports center for several key reasons:
• There is an existing indoor fieldhouse located at Princess Anne that was developed via a public-private partnership
between the City and a private facility operator.
• Numerous interview respondents indicated that hotel options were limited within a 10-15 minute drive of Princess Anne,
and therefore it is often more convenient for their athletes and families to stay at Chesapeake or Norfolk hotels.
• Development of additional hotel inventory within the Princess Anne area may be limited by APZ restrictions.
Source: Google Maps

DRAFT
PRINCESS ANNE HOTEL MAP
Source: Hotels.com, Microsoft MapPointNote: Minimum 2-star hotels within a 15 minute drive from Princess Anne
Victus Advisors found that lodging
(minimum 2-star rating) within a 15
minute drive from the Princess Anne
Athletic Complex is limited.
The majority of Virginia Beach hotels
are located at or beyond a 15-minute
drive, and are no more conveniently
located to the PAAC than many of the
Chesapeake and Norfolk hotels that
are clustered just outside of Virginia
Beach city limits.
It is likely that sporting events held at
the PAC, the Sportsplex, and the
Virginia Beach Fieldhouse have a
significant amount of economic
leakage (hotel nights, restaurant and
retail spending) to Chesapeake and
Norfolk, especially in the summer
months when ADR’s for beachfront
hotels can approach $200.
Princess Anne
Athletic Complex
82

DRAFT 83
3. BEACHFRONT AREA
Although several interview respondents indicated that the Resort Area could be a potential location for a new indoor sports
center, due to proximity to family entertainment, retail, and the majority of Virginia Beach’s lodging, however it may not be an
ideal location due to traffic issues, lack of parking (which could deter local usage of the venue) and expensive lodging in the
summer months (which could be a deterrent to tournaments). In terms of highest/best use, Oceanfront land also typically
drives a premium from developers for commercial retail, residential and/or hospitality opportunities.
Source: Google Maps
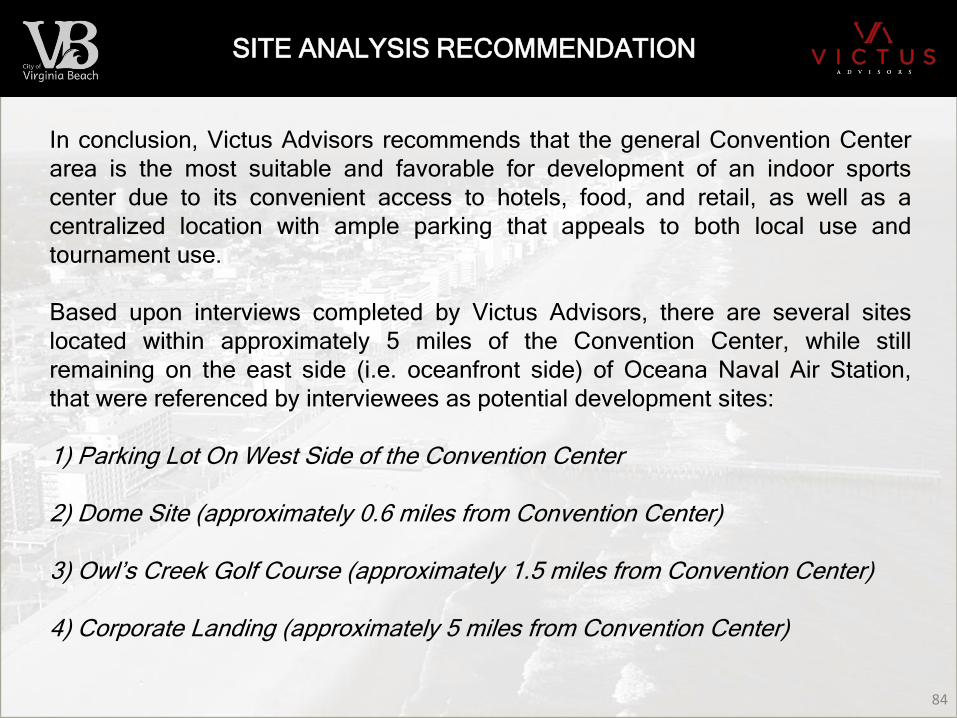
DRAFT 84
SITE ANALYSIS RECOMMENDATION
In conclusion, Victus Advisors recommends that the general Convention Center
area is the most suitable and favorable for development of an indoor sports
center due to its convenient access to hotels, food, and retail, as well as a
centralized location with ample parking that appeals to both local use and
tournament use.
Based upon interviews completed by Victus Advisors, there are several sites
located within approximately 5 miles of the Convention Center, while still
remaining on the east side (i.e. oceanfront side) of Oceana Naval Air Station,
that were referenced by interviewees as potential development sites:
1) Parking Lot On West Side of the Convention Center
2) Dome Site (approximately 0.6 miles from Convention Center)
3) Owl’s Creek Golf Course (approximately 1.5 miles from Convention Center)
4) Corporate Landing (approximately 5 miles from Convention Center)

DRAFT 85
SITES WITHIN 5 MILES OF CONVENTION CENTER
1 2
3
4
1
2
3
4
Convention Center
Dome Site
Owl’s Creek
Corporate Landing
Source: Google Maps

DRAFT 86
WEST SIDE OF THE CONVENTION CENTER
Land to the west side of the Convention Center is currently being used as parking, however it was originally designated as
potential future expansion space if the Convention Center was ever to be expanded. Placing a new indoor sports center on
this land could provide synergies between the Convention Center and the sports center, especially for extremely large sports
events (such as national gymnastics or cheer competitions) that would still be likely to use the Convention Center’s
extensive, column-free, flat floor space. The Convention Center and sports center could also potentially be connected via an
open-air courtyard and consider sharing food/beverage and other operational features under a single City contract. The only
concern with this location would be potential parking issues, especially once the proposed arena is built. However
discussions with City officials indicated that plans are progressing to construct new multi-level parking garages to serve the
arena and Convention Center.
Source: Google Maps

DRAFT 87
DOME SITE
The Virginia Beach Dome was leveled in 1994, and since then this approximately 11-acre site has been converted into
surface parking while Virginia Beach Economic Development has explored opportunities for commercial development on the
site. Over the past decade in particular, Economic Development has considered development proposals from several
different national development firms, however none of the plans have come to fruition. The Dome Site could be an appealing
location for a new sports center, due to it’s proximity to both the beachfront and the Convention Center area. However, in the
summer months in particular, traffic and parking issues could be a concern. It would be imperative for the City to determine
whether both an indoor sports center and dedicated parking for sports center events could be contained on the 11-acre site.
Source: Google Maps

DRAFT 88
OWL’S CREEK SITE
The Owl’s Creek Golf Course ceased business operations in June 2016. The City of Virginia Beach owns approximately 50%
of the property (including the clubhouse, driving range, and four of the 18 holes) with the remaining portion of the 80 acres
belonging to a private business owner. The Owl’s Creek site is currently being considered by the City for alternative usage,
and it should be noted that an indoor sports center can typically be comfortably accommodated on 10 to 15 acres. However,
the Owl’s Creek Golf Course is also located in an APZ 2 area, and therefore initial indications from City staff are that the site
may not be viable for an indoor sports center. If the site were viable, given the City’s control of at least 40 acres (if not more),
Victus Advisors believes that the Owl’s Creek could be a potential opportunity for not only development of an indoor sports
center, but also other compatible commercial uses (outdoor sports fields, family entertainment, retail, restaurants, hotel, etc.).
Source: Google Maps

DRAFT 89
CORPORATE LANDING SITE
The Corporate Landing site is under control of Virginia Beach Economic Development and has been
designated for industry, investment, and job creation. The site is outside of any Accident Potential Zones,
however there is concern that Economic Development would not approve an indoor sports center. During
interviews with Economic Development representatives, it was indicated that their intention for the site
continues to focus on Class A office, light-industrial, research and development, and mixed-use.
Source: Google Maps

DRAFT 90
SITE RANKING
Based on our review of potential sites within 5 miles of the Convention Center (while still East of Naval Air
Station Oceana), Victus Advisors believes that two sites would be the most suitable and viable for
development of a new City-controlled indoor sports center. Those two sites are: 1) the parking lot
immediately west of the Convention Center, and 2) the Dome Site. Victus Advisors believes that the Owl’s
Creek site and Corporate Landing site may not be viable because of the factors highlighted in red below.
Site Ranking APZ Restrictions? Site Owner? Additional Factors
1. Convention Center No City Sports activity at Convention Center has already demonstrated site's viability.
Potential for synergies with existing Convention Center operations.
City plans are progressing to expand parking in the immediate area via garages.
Convenient access to hotels and beachfront.
Future expansion opportunities for the Convention Center would be limited.
2. Dome Site No Economic Development Adjacent to resort area, which could lead to traffic/parking issues, especially in summer.
However, would be convenient access to hotels and beachfront.
Only 11 acres, so architects should be consulted to test ability to fit sports center and dedicated parking.
3. Owl's Creek Yes City (50%) Size and location of the site would be attractive for sports center and potential related development.
APZ restrictions may prevent development of an indoor sports center on the site.
4. Corporate Landing No Economic Development Farthest of the four sites from Virginia Beach hotels and family entertainment.
Economic Development has indicated they will continue to focus on business park development on the site.

DRAFT
91
SECTION 5
BUILDING PROGRAM
RECOMMENDATIONS
91

DRAFT 92
INDOOR SPORTS CENTER RECOMMENDATION
RECOMMENDED AMENITIES:
Based upon the results of our market and facility analysis, Victus Advisors recommends that a new
indoor sports center in Virginia Beach should have:
• Ten (10) basketball courts, which should be convertible to at least 12 (or more) volleyball courts
• One indoor artificial turf area, which could be utilized as one (1) full-length soccer or lacrosse field,
or two (2) shorter fields for youth soccer, flag football, lacrosse practice, football practice, and/or
batting cages.
• Support areas and amenities, including lobby, concessions, team rooms, offices,
mechanical/electrical rooms, storage, circulation, etc.
APPROXIMATE SPACE REQUIREMENTS:
Based upon Victus Advisors’ industry experience, as well as preliminary input gathered from sports
architects, it is estimated that the building program described above would require approximately
175,000 square feet, as follows:
• Basketball/Volleyball Courts – 65,000 sq. ft.
• Indoor Artificial Turf – 90,000 sq. ft.
• Support Areas/Amenities - 20,000 sq. ft
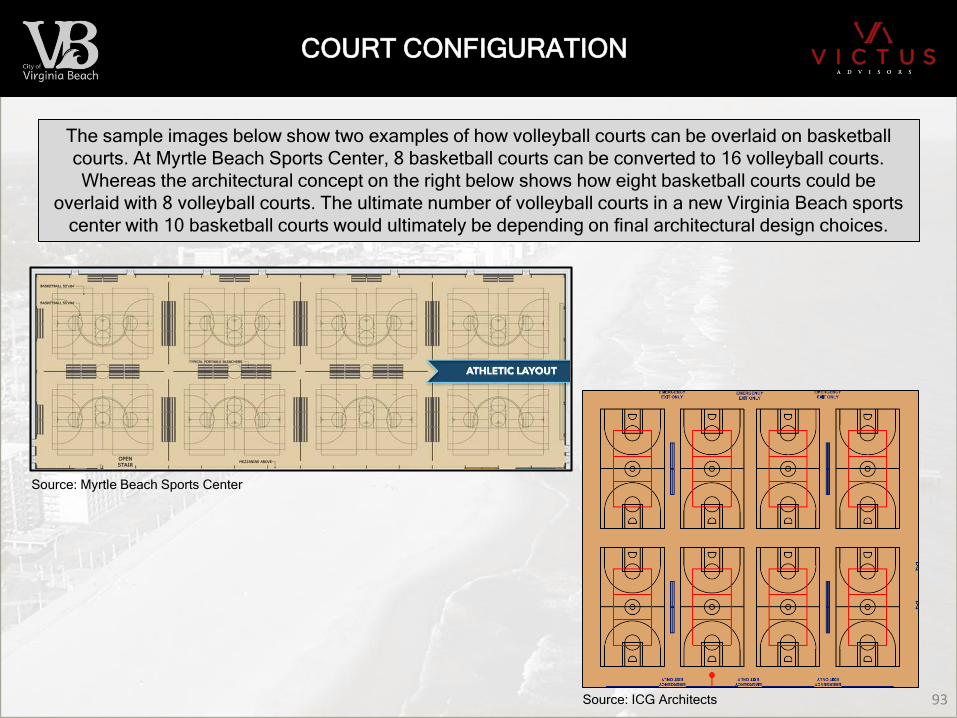
DRAFT 93
COURT CONFIGURATION
The sample images below show two examples of how volleyball courts can be overlaid on basketball
courts. At Myrtle Beach Sports Center, 8 basketball courts can be converted to 16 volleyball courts.
Whereas the architectural concept on the right below shows how eight basketball courts could be
overlaid with 8 volleyball courts. The ultimate number of volleyball courts in a new Virginia Beach sports
center with 10 basketball courts would ultimately be depending on final architectural design choices.
Source: Myrtle Beach Sports Center
Source: ICG Architects
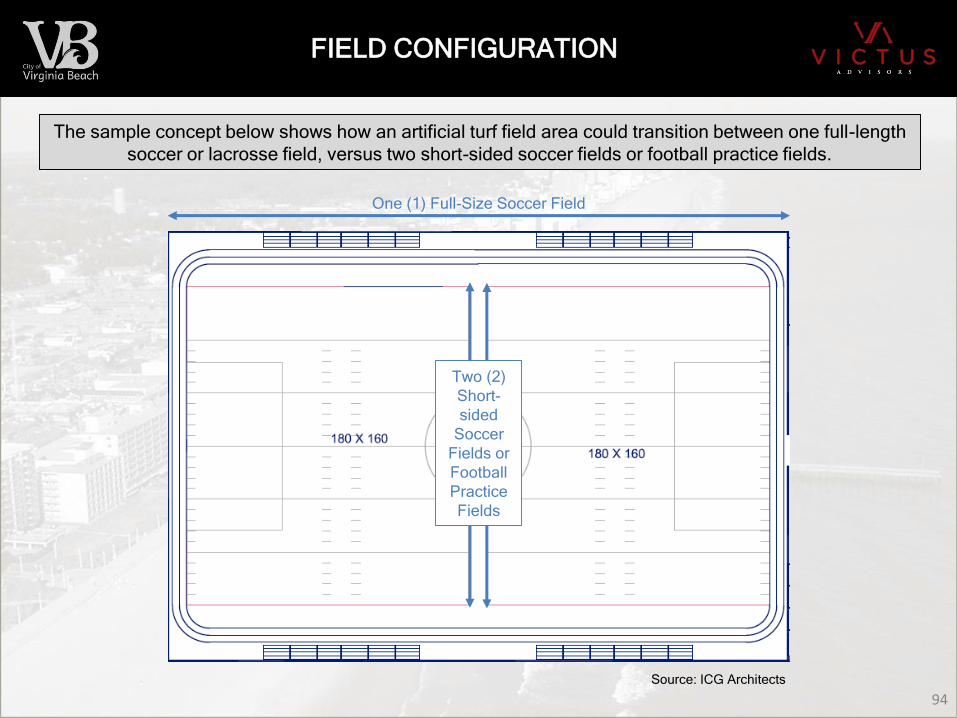
DRAFT 94
FIELD CONFIGURATION
The sample concept below shows how an artificial turf field area could transition between one full-length
soccer or lacrosse field, versus two short-sided soccer fields or football practice fields.
Source: ICG Architects
One (1) Full-Size Soccer Field
Two (2)
Short-
sided
Soccer
Fields or
Football
Practice
Fields

DRAFT 95
PRELIMINARY COST ESTIMATE
Based on recent construction costs for comparable sports centers, Victus Advisors preliminarily estimates
that a new indoor sports center in Virginia Beach could be constructed for a cost ranging from
approximately $100 to $175 per square foot, depending on level of finish. This range represents
approximately $17.5 to $30.6 million in estimated total construction costs for a 175,000 sq. ft. venue.
As a point of comparison, the average cost per square foot among comparable indoor sports centers, as
shown below, was approximately $140 per square foot. Therefore, for purposes of our economic impact
analysis (presented in Section 9 of this report) we have assumed construction costs of approximately $140
per square foot, which represents total estimated construction costs of approximately $24.5 million for a
new 175,000 square foot indoor sports center.
Ultimately, it is recommended that detailed square footages and construction cost estimates should be
developed by project architects and cost engineers.
Year Square Construction Cost per
Facility City, State Open Feet Cost Sq. Ft.
Boo Williams Sportsplex Hampton, VA 2008 135,000 $13,500,000 $100
Upward Star Center Spartanburg, SC 2014 120,000 $19,000,000 $158
Myrtle Beach Sports Center Myrtle Beach, SC 2015 100,000 $12,400,000 $124
Round Rock Sports Center Round Rock, TX 2014 82,000 $14,500,000 $177
Average: 2013 109,250 $14,850,000 $140
Median: 2014 110,000 $14,000,000 $141

DRAFT
96
SECTION 6
UTILIZATION ESTIMATES
& FINANCIAL PROJECTIONS
96

DRAFT 97
ESTIMATED ANNUAL UTILIZATION BY SPORT
Total Estimated Annual Visits: 189,150*
*Note: includes athletes, officials, coaches, spectators, etc. Represents 141,862 unique daily visits, plus 47,288 out-of-town tournament visitors.
It is estimated that basketball would account for the majority of utilization at over 50%.
Facility
Sport Hours
Basketball 6,255
Volleyball 2,970
Soccer 1,630
Other Sports 1,370
TOTAL 12,225
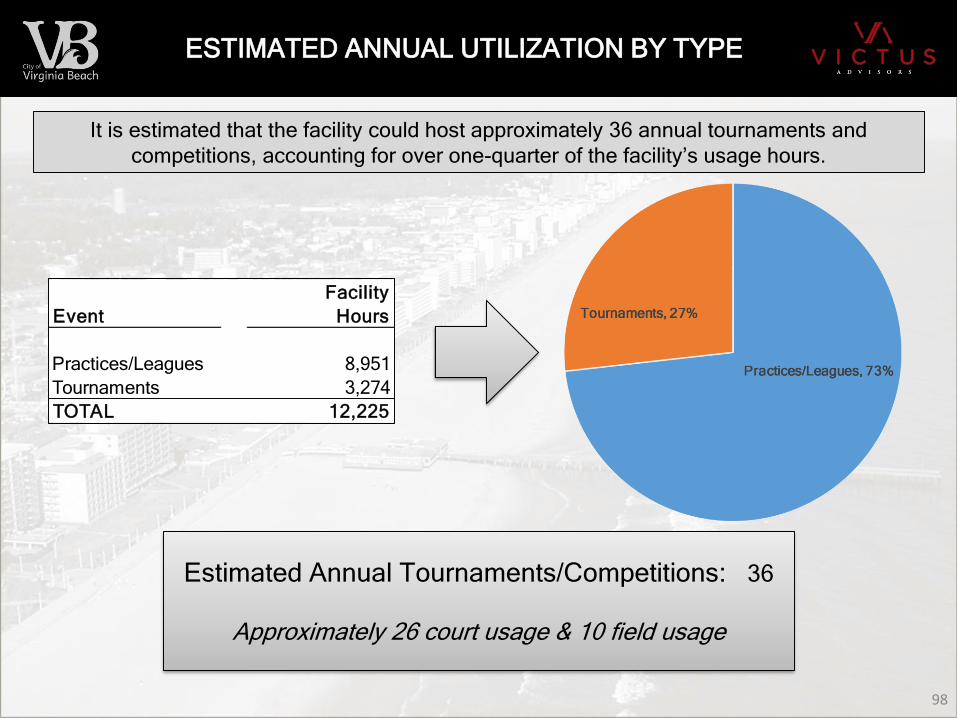
DRAFT 98
ESTIMATED ANNUAL UTILIZATION BY TYPE
Estimated Annual Tournaments/Competitions: 36
Approximately 26 court usage & 10 field usage
Facility
Event Hours
Practices/Leagues 8,951
Tournaments 3,274
TOTAL 12,225
It is estimated that the facility could host approximately 36 annual tournaments and
competitions, accounting for over one-quarter of the facility’s usage hours.

DRAFT 99
ESTIMATED SEASONALITY
Estimated
Hours
per Month
It is expected that peak usage at the sports center would be during the winter months,
with a considerable decrease in utilization during the summer months. This seasonal
usage pattern could be ideally suited for attracting tournament activity to Virginia Beach,
as local hotel inventory has significantly lower occupancy and ADR from October to April.
0
200
400
600
800
1000
1200
1400
Indoor Field Courts

DRAFT 100
FINANCIALS – KEY ASSUMPTIONS
The following key assumptions were utilized by Victus Advisors in order to develop financial
operating projections for a new Virginia Beach indoor sports center:
• The property will be owned by the City of Virginia Beach and thus exempt from property taxes.
• The complex will be operated by the City of Virginia Beach.
• No assumptions have been made yet for debt service or capital improvement funds.
• Revenues and expenses are based upon the recommended building program and estimated
usage presented earlier in this report.
• The facility will offer competitive rental rates and aggressively market to club teams, leagues,
local tournaments, and regional/national tournaments.
• It is has been assumed that the venue would market and operate public sports leagues, camps,
and clinics, such as recreational soccer, lacrosse, basketball, volleyball, etc., in order to
enhance the revenues of the facility.
• These projections are based on current market circumstances, and therefore assume that there
will be no other major changes to the available indoor sports facility inventory within Virginia
Beach and the Hampton Roads MSA.
• The financial projections displayed on the following page utilize a variety of additional
assumptions, including data gathered from 3rd-party sources, information provided by the City
of Virginia Beach, and Victus Advisors’ industry experience. There will be differences between
these projections and actual events, and these differences may be material.

DRAFT 101
FINANCIALS – STABILIZED YEAR OF OPERATIONS
In a stabilized year of
operations, it is
estimated that the
operations of the
proposed indoor
sports center in
Virginia Beach could
approximately break
even.
Please note: this analysis assumes that
the facility would market and operate
it’s own programming. Without income from
programs and leagues, it is
estimated that the facility could require annual subsidies in excess of $100,000.
Operating Revenues:
Rental Income $1,035,750
Programming (Leagues, Camps, Clinics) $414,000
Concessions (Net of COGS) $99,300
Advertising $74,200
Other $15,000
Total Revenues: $1,638,250
Operating Expenses:
Salaries & Wages $521,500
Program Expenses $289,800
Utilities $437,500
Maintenance/Repair $125,000
Materials/Supplies $125,000
G&A $50,000
Insurance $66,000
Total Expenses: $1,614,800
Net Income Before Debt Service: $23,450
Estimated Operating Margin: 1.4%
Note: Presented in 2016 dollars

DRAFT 102
REVENUES
Revenue generated by the proposed indoor sports center is expected to consist primarily of rental
income, program revenue, concessions, and advertising. A brief description of each potential
revenue source is provided below.
Rental Income:
Facility rent typically accounts for the largest revenue source for a multi-sports complex. Rentals
typically occur for practices and league play (primarily local-use within Virginia Beach) and
tournaments (regional/national usage). We have conservatively assumed, based on competitive
rental rates within the market, that average rental rates would be approximately $75 per hour for half
field, $150 per hour for full field, and between $40 to $60 per hour for a court.
Facility Programming (Leagues, etc.):
Programming consist of camps, clinics, and leagues organized by the facility operator, with revenue
primarily consisting of registration fees. If the facility does not generate program revenues, either
because it is operated solely as a sports tourism venue or because responsibility for programs is
retained by another organization (such as Parks & Recreation), it is likely that the facility would
require annual operating subsidies.
Concessions:
Concessions revenue consists of sales of various food and beverage items at the facility. Revenue
assumptions are based on estimated usage and attendance, as well as comparable per capita
spending from similar facilities across the country.
DRAFT 103
REVENUES (CONT.)
Sponsorship & Advertising:
Sponsorship and advertising revenues are assumed to be derived from the sale of wall and board
banners ($500 per banner), permanent signage ($1,000 per sign), scoreboard signage ($2,500 per
scoreboard), and presenting/founding level partnerships ($10,000 per founding partner). Typically,
there is a small group of founding partners (four to six), whereas there could be as many as 60
available scoreboard, banner and signage opportunities available. Overall, we have conservatively
assumed that approximately 70% of the available inventory would be sold.
Other Revenue:
Other revenue opportunities would primarily consist of any equipment rental fees or other special
service charges, any merchandise or apparel sold at the proposed sports complex, as well as any
potential parking fees charged for major tournaments/events. We have conservatively projected
$15,000 in annual other revenues.

DRAFT 104
EXPENSES
Operating expenses expected to be generated by the proposed indoor sports center include salaries,
wages, and benefits, operations/programming costs, utilities, and other expenses. A brief description
of each potential major source of expense is provided below.
Salaries, Wages & Benefits:
Based upon comparable venues, we have assumed that the indoor sports center would have
approximately seven (7) full-time equivalent employees, which includes general management, event
management, sales/marketing, facility maintenance, and custodial. In addition, we have assumed
approximately $125,000 a year in part-time/seasonal hours.
Program Expenses:
Expenses related to operating programs at the facility, including leagues, camps, clinics, etc. have
been assumed to be approximately 70% of facility program revenues, based on costs at comparable
facilities.
Utilities:
Utilities often represent one of the largest expenses incurred by facility operators. Cost estimates for
utilities include use of electricity, gas, water, and steam, and are based upon comparable utility costs
per square foot at similar facilities.

DRAFT 105
EXPENSES (CONT.)
Other Expenses:
Other expenses expected to be incurred by the proposed indoor sports center include general and
administrative expenses, repairs and maintenance, materials and supplies, marketing/advertising
costs, insurance, and other such expenses, as described below:
• Maintenance and repairs for structures, equipment, grounds, etc.
• Materials and supplies for administration and operations of the facility
• General liability insurance to cover the grounds, restrooms, and other such areas (Note: events
and users are typically required to carry their own liability insurance specific to their activities at
the sports center)
• Office and administrative expenses, including but not limited to marketing and advertising,
telecommunications, travel costs, permits, service fees, and other such operating expenses
These expenses have been estimated based upon expenses at comparable venues.

DRAFT
106
SECTION 7
OPERATING RECOMMENDATIONS
106

DRAFT 107
OPERATIONS & MANAGEMENT RECOMMENDATIONS
MANAGEMENT OPTIONS:
• PUBLIC: Public management of youth and amateur sports facilities is
commonplace within the industry. Facility operational control within a
government is typically accomplished either by creating a separate
department that is responsible for facility management or by designating
responsibility to a department that already exists within the government (such
as the CVB or Parks & Recreation).
o ADVANTAGES: The advantages of public management include owner control, financial
support via public funding sources, potential sharing of public sector staff and support
functions (security, waste management, grounds keeping, maintenance, etc.), and
utilization of governmental purchase power to help reduce the costs of goods and
services.
o DISADVANTAGES: Some disadvantages of public management could include decision-
making and contracting constraints due to public sector processes, economic and
performance inefficiencies related to lack of profit incentive, or a lack of expertise and
relationships in the sports industry among public staff.

DRAFT 108
OPERATIONS & MANAGEMENT RECOMMENDATIONS
MANAGEMENT OPTIONS (CONT.):
• PRIVATE: In some cases, the management of a publicly-owned sports
complex could be outsourced to a third-party operator. Comparable public
facilities that we reviewed in this report included a mix of public and private
operators.
o ADVANTAGES: The public owner retains rights and privileges of ownership while the
management firm performs assigned functions. The private firm is motivated by profit
incentives to maximize tournament usage and programming (and other profitable uses)
of the facility. They usually bring a network of relationships to leverage for event
booking, and they often have greater staffing resources and flexibility in negotiations
with events.
o DISADVANTAGES: Some disadvantages of private management could include lack of
owner control over events held or rates set at the facility, less access to affordable public
use, and public costs of paying facility management fees.

DRAFT 109
OPERATIONS & MANAGEMENT RECOMMENDATIONS
MANAGEMENT OPTIONS (CONT.):
• RECOMMENDATION FOR VIRGINIA BEACH: It is recommended that a new indoor
sports center should be owned and operated by the City. As identified in our market
study, one of the major issues that the Sports Marketing Unit faces with booking sports
events, especially indoor events, is the lack of access or control over the booking
calendar for privately-operated venues. Having an indoor sports center under operating
control of the City would enable the Sports Marketing Unit to more efficiently and
effectively book indoor sports events, without having to rely on placing sports events in
the Convention Center to such a large degree.
More specifically, Victus Advisors recommends that the facility should be operated by
the CVB/Sports Marketing in order to provide a smoother user experience for
tournaments and events, whereas Parks & Recreation could partner with the CVB to
provide local-use sports/recreation programming for the facility to help maximize year-
round utilization and local access.
Victus Advisors also recommends that a full-time General Manager should be hired for
the new facility who has significant relevant experience and relationships in the sports
facility industry.

DRAFT
110
SECTION 8
FUNDING OPTIONS ANALYSIS
110

DRAFT 111
FUNDING ANALYSIS – OVERVIEW
The purpose of this analysis is to provide a broad overview of the various debt vehicles and revenue sources
that could potentially be utilized to fund construction and development costs for a new indoor sports center in
Virginia Beach. This analysis is based upon a review of comparable venue funding across the country, as well
as unique financing vehicles that may be available within the State of Virginia. The vast majority of comparable
sports centers that are owned by the public sector are developed via municipal capital project funding (general
obligation bonds, revenue bonds, tax increment financing, general funds, etc.).
The analysis in this section is organized into two primary categories, with debt-related financing vehicles
presented at the beginning, followed by a summary of various revenues streams that are often used to pay
sports complex debt service. Please note, the options in these sections are presented in alphabetical order:
Financing Tools:
• General Obligation Bonds
• Revenue Bonds
• Tax Increment Financing (TIF)
• Capital Improvement Program
• Development Financing Program
Potential Revenue Streams to Pay Debt Service:
• Contractually Obligated Revenue Streams
• General Funds
• Restaurant Meals Tax
• Amusement Tax
• Dedicated Revenue Generating Fund (TIP/TAP)
• Ad Valorem Taxes
• Hotel-Related Taxes
Note: Based on a review of the City's CAFR, the City's outstanding GO bonds that have been issued over the last five years, carry interest rates ranging from 2.0% to 3.2%. In order to be conservative with our funding capacity estimates, we have assumed a 3.2% interest rate, and we have also applied a debt service coverage ratio of 1.25. The funding capacity analyses contained within this section of the report are intended as a preliminary estimate of potential funding capabilities, and it is recommended that the City consult their financial advisors and public finance experts for more detailed projections and analysis.

DRAFT 112
TOOLS – GENERAL OBLIGATION BONDS
Description
The City of Virginia Beach could use the full faith and credit of the City to issue General Obligation (GO)
bonds for all or part of the indoor sports center. GO bonds are secured by the issuing government entity’s
pledge to use all legally available resources, including tax revenues, to pay debt service.
The primary advantage of GO bonds is that they typically carry a lower interest rate than revenue bonds,
assuming the issuing government entity carries a strong credit rating. Generally speaking, the better the
issuer’s credit rating, the lower the interest rate.
The primary disadvantage associated with GO bond financing is that the GO indebtedness could reduce the
available bonding capacity for other capital projects the City may be planning.
Virginia Beach Analysis
As of June 30, 2015, the City of Virginia Beach had total tax-supported
long-term debt of approximately $982.5 million, roughly 66% of which
is general obligation debt. Victus estimates that construction of an indoor
sports center in Virginia Beach could cost approximately $24.5 million.
A project at that cost that was funded via GO bonds would only represent
an approximately 3.7% increase in GO indebtedness.

DRAFT 113
TOOLS – REVENUE BONDS
Description
Revenue Bonds are payable solely from the revenues of the project that is being financed.
Since debt service is tied to the success of the project, revenue bonds are considered to have
a much higher risk of default than GO bonds and thus carry a higher interest rate.
Revenue bonds are typically a funding option for sports facility development projects where the
net operating income (NOI) from the project is conservatively estimated to exceed annual debt
service requirements. As most public indoor sports centers do not generate enough NOI to
cover debt service, public entities will often dedicate other tax revenues to pay debt service.
As shown below, depending on the interest rate and debt coverage ratio, it is generally
estimated that for every $1M of project income (or tax revenue) that is applicable to debt
service, 30-year revenue bonds could fund anywhere from $7-14M in project costs, as shown:
Revenue bonds backed by facility revenues would not be feasible for this project, as the facility
is not expected to generate net operating income sufficient to cover debt service.
Interest Bond
Rate Term (Yr) 1.25x 1.5x 1.75x 2.0x
4% 30 $13,833,627 $11,528,022 $9,881,162 $8,646,017
5% 30 $12,297,961 $10,248,301 $8,784,258 $7,686,226
6% 30 $11,011,865 $9,176,554 $7,865,618 $6,882,416
Debt Coverage Ratio:
Funding Capacity per $1M of Available Project Income

DRAFT 114
TOOLS – TAX INCREMENT FINANCING
Description
Tax increment financing (TIF) involves capturing assessed valuation growth within a specific
area (e.g. “TIF district”) related to a particular development. Tax increment financing often
requires enactment of legislation by a State legislature. Typically, a redevelopment agency
delineates a project area and declares a base year. The additional assessed valuation, added
to the tax rolls over the base year, is taxed at the same rate as the base valuation. However, the
incremental tax revenues attributed to the new valuation are remitted to the redevelopment
agency and used to pay debt service.
Pros & Cons
TIF districts can be a powerful tool for financing sports facilities using incremental tax revenues
resulting from sports-anchored redevelopment, rather than raising tax rates. However, in order
for TIF to be viable, the proposed indoor sports center must be a component of a larger
redevelopment area, and approvals typically must be obtained from the relevant taxing
authorities within the defined district. TIF could potentially be a viable option for Virginia Beach if
a new sports center is part of a larger redevelopment district (for example, if the entire Owl’s
Creek site were to be redeveloped).

DRAFT 115
TOOLS – CAPITAL IMPROVEMENT PROGRAM
Description
The FY 2016-2021 Capital Improvement Program (CIP), which was approved by City Council
on May 12, 2015, set forth a program totaling $2.7 billion. Of this amount, $1.2 billion was
appropriated through FY 2015, $313 million was appropriated in FY 2016 and $1.183 billion
was programmed for years FY2017-2021 of the Capital Improvement Program. Funding for
this program will be from local, state, federal, and private sources, with local debt comprising
56.4% of total funding. The six-year plan provides phased funding for critical public works
infrastructure needs and upgrades that will help ensure compliance with increasingly strict
environmental requirements, funding for roads, facility improvements, and public schools. The
CIP also includes funding for capital investments for recreational activities, leisure programs,
and the preservation and acquisition of open space that enhances the quality of life for the
citizens of Virginia Beach.
Recommendation
The Virginia Beach CVB should explore whether a new indoor sports facility would be eligible
for CIP funding.

DRAFT 116
TOOLS – DEVELOPMENT FINANCING PROGRAM
Description
The Commonwealth of Virginia currently has a financing program for qualifying Virginia tourism
development projects. Its purpose is to provide a gap financing source (not to exceed 30% of
total project cost) for projects that cannot secure 100% funding. There are two tiers: Tier 1
(projects less than $100 million) and Tier 2 (projects greater than $100 million). The program
essentially places debt responsibility on the private developer, but receives assistance in paying
debt service from the state and the locality. Debt service is divided amongst the three partners
and paid quarterly once the project is completed and generating income. 1% of the identified,
quarterly, sales and use tax on the revenue of the project is the amount each partner will
contribute towards debt service on the project, until debt service is fully paid.
Recommendations
This development financing program is not likely to be utilized for this indoor sports center
project, as it is not expected to be a public-private partnership with a private developer.
DRAFT 117
REVENUE – CONTRACTUALLY OBLIGATED REVENUE
Description
Contractually Obligated Revenue is facility-related revenue that is typically generated by multi-
year contracts on naming rights and sponsorships. Private sector corporations frequently
purchase corporate sponsorships and advertising for large public facilities. However, it should
be noted that naming rights revenue is typically vital to the successful annual operations of the
facility.
Pros and Cons
Capitalizing contractually obligated revenue streams for the purpose of funding project
construction costs can be very risky if the indoor sports center is not projected to produce a
large annual operating margin.
Recommendation for Virginia Beach
It is not recommended that the City utilizes contractually obligated revenue to fund
construction costs, as it would increase the risk of large annual operating losses. In addition,
an indoor sports center as analyzed in this report is not likely to generate enough long-term
sponsorship income to fund a significant portion of capital project costs.

DRAFT 118
REVENUE – GENERAL FUNDS
Description
Virginia Beach could choose to support the proposed indoor sports center project with general
funds from the City’s budget. Allocation of general funds typically requires available funds (or
an unexpected revenue windfall) that is free and clear of any other government obligation. In
most cases where general funds have been used to develop comparable sports centers,
general funds have not been used to pay for the entire capital project, but rather used to pay a
portion of development costs and thus reduce the amount of debt that needs to be issued.
Recommendation for Virginia Beach
According to the Virginia Beach 2015 Comprehensive Annual Financial Report (CAFR) the
City has a fund balance policy goal to maintain 10% of unassigned funds or one month of the
City’s operating expenses. In addition, a significant portion of the fund’s revenues is used to
finance the operations of the City’s School Board. As a result, it is not likely that general funds
would be available for commitment to this proposed indoor sports center.
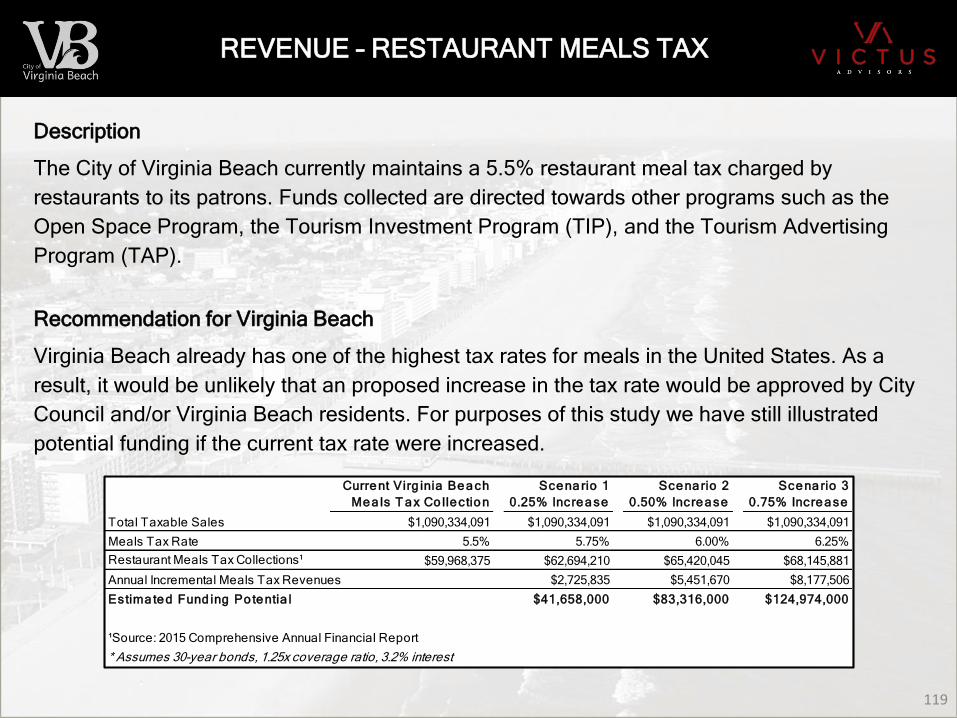
DRAFT
Current Virg inia Beach
Mea ls T ax Co llection
Scenario 1
0.25% Increase
Scenario 2
0.50% Increase
Scenario 3
0.75% Increase
Total Taxable Sales $1,090,334,091 $1,090,334,091 $1,090,334,091 $1,090,334,091
Meals Tax Rate 5.5% 5.75% 6.00% 6.25%
Restaurant Meals Tax Collections¹ $59,968,375 $62,694,210 $65,420,045 $68,145,881
Annual Incremental Meals Tax Revenues $2,725,835 $5,451,670 $8,177,506
Estima ted Fund ing Po tentia l $41,658,000 $83,316,000 $124,974,000
* Assumes 30-year bonds, 1.25x coverage ratio, 3.2% interest
¹Source: 2015 Comprehensive Annual Financial Report
119
REVENUE – RESTAURANT MEALS TAX
Description
The City of Virginia Beach currently maintains a 5.5% restaurant meal tax charged by
restaurants to its patrons. Funds collected are directed towards other programs such as the
Open Space Program, the Tourism Investment Program (TIP), and the Tourism Advertising
Program (TAP).
Recommendation for Virginia Beach
Virginia Beach already has one of the highest tax rates for meals in the United States. As a
result, it would be unlikely that an proposed increase in the tax rate would be approved by City
Council and/or Virginia Beach residents. For purposes of this study we have still illustrated
potential funding if the current tax rate were increased.
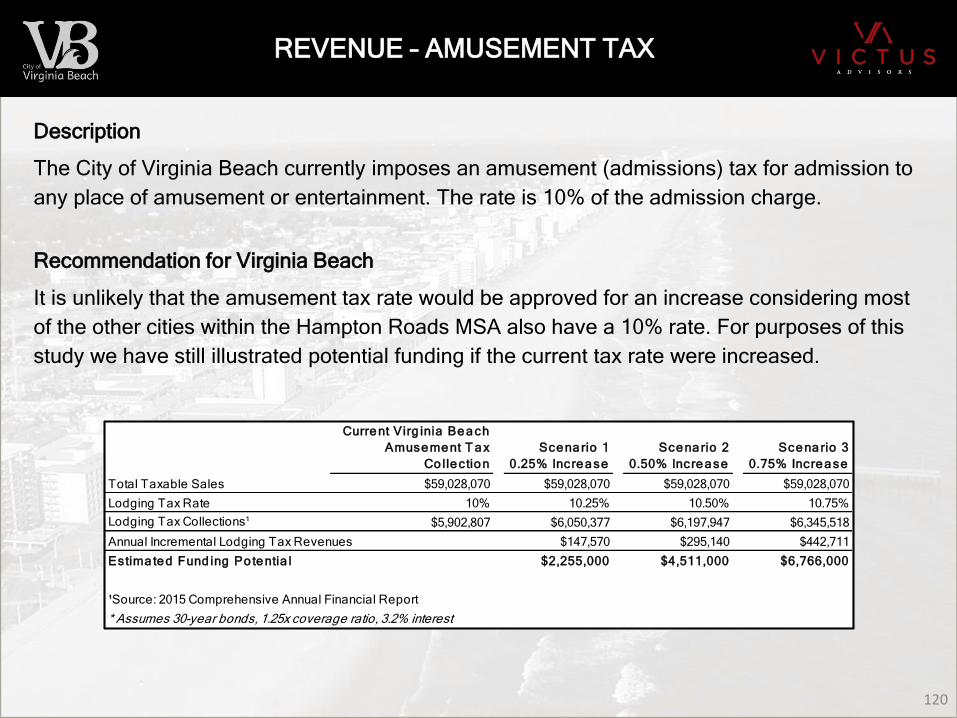
DRAFT
Current Virg inia Beach
Amusement T ax
Co llection
Scenario 1
0.25% Increase
Scenario 2
0.50% Increase
Scenario 3
0.75% Increase
Total Taxable Sales $59,028,070 $59,028,070 $59,028,070 $59,028,070
Lodging Tax Rate 10% 10.25% 10.50% 10.75%
Lodging Tax Collections¹ $5,902,807 $6,050,377 $6,197,947 $6,345,518
Annual Incremental Lodging Tax Revenues $147,570 $295,140 $442,711
Estima ted Fund ing Po tentia l $2,255,000 $4,511,000 $6,766,000
* Assumes 30-year bonds, 1.25x coverage ratio, 3.2% interest
¹Source: 2015 Comprehensive Annual Financial Report
120
REVENUE – AMUSEMENT TAX
Description
The City of Virginia Beach currently imposes an amusement (admissions) tax for admission to
any place of amusement or entertainment. The rate is 10% of the admission charge.
Recommendation for Virginia Beach
It is unlikely that the amusement tax rate would be approved for an increase considering most
of the other cities within the Hampton Roads MSA also have a 10% rate. For purposes of this
study we have still illustrated potential funding if the current tax rate were increased.

DRAFT 121
REVENUE – DEDICATED REVENUE GENERATING FUND
Description
Somewhat similar to tax increment financing districts, a dedicated revenue generating fund for
an indoor sports center could be created by the City. Two recent examples in Virginia Beach
include the Tourism Investment Program (TIP) and the Tourism Advertising Program (TAP).
The TIP was created to fund tourism related capital projects and expenditures on the
oceanfront. Funding is from 100% of the City’s amusement tax, 63% of the lodging tax, and
20% of the meal tax.
The TAP was created to fund revenue and expenses related to tourism advertising. Funding is
from a mix of hotel room (one cent of lodging tax and one dollar of transient occupancy tax)
and meal (one half cent) taxes.
Recommendation
The Virginia Beach CVB should explore whether a new indoor sports facility would be eligible
for TIP and/or TAP funding.

DRAFT 122
REVENUE – AD VALOREM TAXES
Description
Ad valorem taxes are taxes collected on the value of a transaction or property, typically in the form of
property taxes or sales taxes. The current Virginia Beach Property Tax is .99% and the current Virginia
Beach Sales Tax is 6%. According to the City’s 2015 CAFR, approximately 63% of the City’s tax revenues
came from Property Tax (56%) and Local Option Sales Tax (7%).
Property Taxes
The table below shows current City property tax rates within the Hampton Roads MSA.
City /T o wnCity /T o wn
Pro p e rty T a x Ra te
Portsmouth 1.3000%
Hampton 1.2400%
Newport News 1.2200%
Norfolk 1.1500%
Suffolk 1.0700%
Poquoson 1.0700%
Chesapeake 1.0500%
Virginia Beach 0.9900%
Williamsburg 0.4200%
Average 1.0567%
Median 1.0700%
Note: Sorted by tax rate, in descending order
City Property Tax Rates within Hampton Roads MSA

DRAFT 123
REVENUE – AD VALOREM TAXES (CONT.)
Property Taxes (cont’d)
The City could consider a ballot measure to increase the local property tax rate in order to develop a
dedicated revenue stream to pay the debt service on any type of bonds, including project costs for a new
indoor sports center.
Pursuing a property tax increase would be dependent on the City’s assessment of voter interest in adding a
sales tax for a indoor sports center project, as well as the City’s appetite for moving forward with such a
ballot initiative. However, it should be noted that the City has already increased the tax rate from .93% to
.99% just last year. As a result it would appear unlikely that an additional increase would be approved by
residents. For purposes of this study we have still illustrated potential funding if the current tax rate were
increased.
Fisca l 2015 Virg inia Beach
Prope rty T ax Co llection
Est. New Virg inia Beach
Prope rty T ax Co llection
Scenario :
.03% Increase
Total Taxable Property Value¹ $51,803,676,559 $51,803,676,559 $51,803,676,559
Property Tax Rate 0.9300% 0.9600% 1.0200%
Property Tax Collections¹ $481,774,192 $497,315,295 $528,397,501
Annual Incremental Property Tax Revenues $31,082,206
Estima ted Fund ing Po tentia l $475,018,000
* Assumes 30-year bonds, 1.25x coverage ratio, 3.2% interest
¹Source: 2015 Comprehensive Annual Financial Report

DRAFT
City /T o wn Ove ra ll Sa le s T a x Lo ca l Ra te
Virginia Beach 6.00% 1.00%
Hampton 6.00% 1.00%
Newport News 6.00% 1.00%
Norfolk 6.00% 1.00%
Poquoson 6.00% 1.00%
Portsmouth 6.00% 1.00%
Suffolk 6.00% 1.00%
Chesapeake 6.00% 1.00%
Williamsburg 6.00% 1.00%
Average 6.00% 1.00%
Median 6.00% 1.00%
Note: Sorted by City/Town, in descending order
124
REVENUE – AD VALOREM TAXES (CONT.)
Sales Tax
In theory, the City could consider a referendum to increase the local sales tax to be a dedicated revenue
stream to pay the debt service on any type of bonds, including potential development of a new sports center.
The general sales tax rate for Virginia is 5.3% (4.3% state tax and 1% local tax). There is an additional 0.7%
state tax imposed in the localities that make up Northern Virginia and Hampton Roads, making the rate in
these areas 6% (5 % state tax and 1% local tax).
It is unlikely that a sales tax increase would be an option for Virginia Beach. A shown below, the Virginia
Beach sales tax rate is already maxed out at 1.0% local rate, and 6.0% overall.
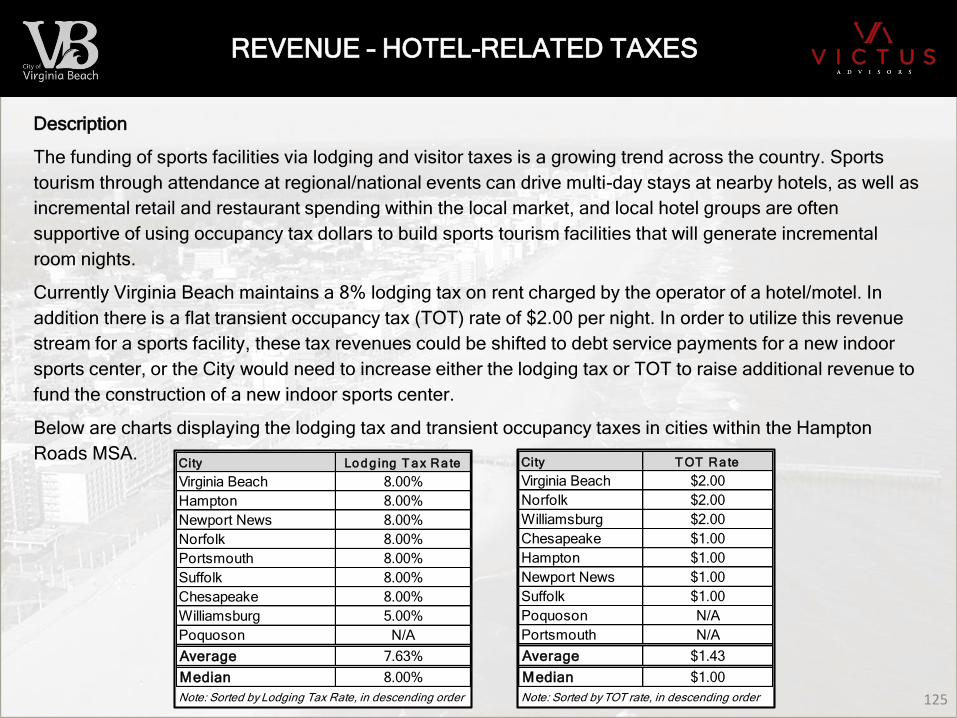
DRAFT
City T OT Ra te
Virginia Beach $2.00
Norfolk $2.00
Williamsburg $2.00
Chesapeake $1.00
Hampton $1.00
Newport News $1.00
Suffolk $1.00
Poquoson N/A
Portsmouth N/A
Average $1.43
Median $1.00
Note: Sorted by TOT rate, in descending order
City Lo d g ing T a x Ra te
Virginia Beach 8.00%
Hampton 8.00%
Newport News 8.00%
Norfolk 8.00%
Portsmouth 8.00%
Suffolk 8.00%
Chesapeake 8.00%
Williamsburg 5.00%
Poquoson N/A
Average 7.63%
Median 8.00%
Note: Sorted by Lodging Tax Rate, in descending order 125
REVENUE – HOTEL-RELATED TAXES
Description
The funding of sports facilities via lodging and visitor taxes is a growing trend across the country. Sports
tourism through attendance at regional/national events can drive multi-day stays at nearby hotels, as well as
incremental retail and restaurant spending within the local market, and local hotel groups are often
supportive of using occupancy tax dollars to build sports tourism facilities that will generate incremental
room nights.
Currently Virginia Beach maintains a 8% lodging tax on rent charged by the operator of a hotel/motel. In
addition there is a flat transient occupancy tax (TOT) rate of $2.00 per night. In order to utilize this revenue
stream for a sports facility, these tax revenues could be shifted to debt service payments for a new indoor
sports center, or the City would need to increase either the lodging tax or TOT to raise additional revenue to
fund the construction of a new indoor sports center.
Below are charts displaying the lodging tax and transient occupancy taxes in cities within the Hampton
Roads MSA.
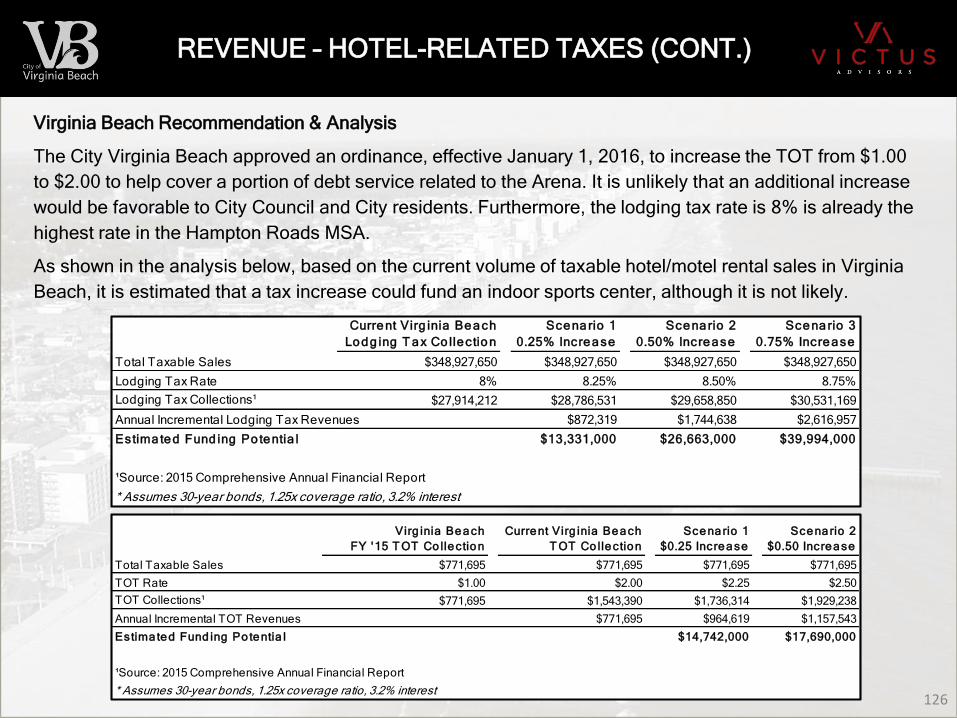
DRAFT
Current Virg inia Beach
Lodg ing T ax Co llection
Scenario 1
0.25% Increase
Scenario 2
0.50% Increase
Scenario 3
0.75% Increase
Total Taxable Sales $348,927,650 $348,927,650 $348,927,650 $348,927,650
Lodging Tax Rate 8% 8.25% 8.50% 8.75%
Lodging Tax Collections¹ $27,914,212 $28,786,531 $29,658,850 $30,531,169
Annual Incremental Lodging Tax Revenues $872,319 $1,744,638 $2,616,957
Estima ted Fund ing Po tentia l $13,331,000 $26,663,000 $39,994,000
* Assumes 30-year bonds, 1.25x coverage ratio, 3.2% interest
¹Source: 2015 Comprehensive Annual Financial Report
126
REVENUE – HOTEL-RELATED TAXES (CONT.)
Virginia Beach Recommendation & Analysis
The City Virginia Beach approved an ordinance, effective January 1, 2016, to increase the TOT from $1.00
to $2.00 to help cover a portion of debt service related to the Arena. It is unlikely that an additional increase
would be favorable to City Council and City residents. Furthermore, the lodging tax rate is 8% is already the
highest rate in the Hampton Roads MSA.
As shown in the analysis below, based on the current volume of taxable hotel/motel rental sales in Virginia
Beach, it is estimated that a tax increase could fund an indoor sports center, although it is not likely.
Virg inia Beach
FY '15 T OT Co llection
Current Virg inia Beach
T OT Co llection
Scenario 1
$0.25 Increase
Scenario 2
$0.50 Increase
Total Taxable Sales $771,695 $771,695 $771,695 $771,695
TOT Rate $1.00 $2.00 $2.25 $2.50
TOT Collections¹ $771,695 $1,543,390 $1,736,314 $1,929,238
Annual Incremental TOT Revenues $771,695 $964,619 $1,157,543
Estima ted Fund ing Po tentia l $14,742,000 $17,690,000
* Assumes 30-year bonds, 1.25x coverage ratio, 3.2% interest
¹Source: 2015 Comprehensive Annual Financial Report

DRAFT
127
SECTION 9
ECONOMIC & FISCAL IMPACT ANALYSIS
127

DRAFT 128
1. ESTIMATE GROSS DIRECT SPENDING
The first step in projecting the potential economic and fiscal impacts of a new
indoor sports center is estimating the Gross Direct Spending activity that could
occur due to both the one-time construction and on-going operations of the
facility.
Gross Direct Spending represents all of the direct spending that could be
associated with the project, regardless of income source or spending location.
One-Time
Construction Expenditures
Supplies & Materials In-Facility Revenues: Visitor Spending:
Labor Costs Program Fees Lodging
Service Fees Event Revenues
(Tournaments, etc.)
Restaurants/Bars
Concessions/Merchandise
Entertainment
Sponsorships/Advertising
Retail
Transportation
Primary Sources of Direct Spending
from Sports Center Development
On-Going Facility Operations

DRAFT 129
2. IDENTIFY “LOCAL” ECONOMY
For purposes of this study,
Victus Advisors has been
tasked with identifying the
potential economic and
fiscal impacts on Virginia
Beach. Therefore, the local
economy studied in this
analysis is the physical area
solely within the City limits of
Virginia Beach (as shown at
right).
As described on the next
page, “Net” Direct Spending
only occurs when the
spending source originates
outside of City limits and
occurs within the City’s
limits.
VIRGINIA BEACH
Source: Microsoft MapPoint
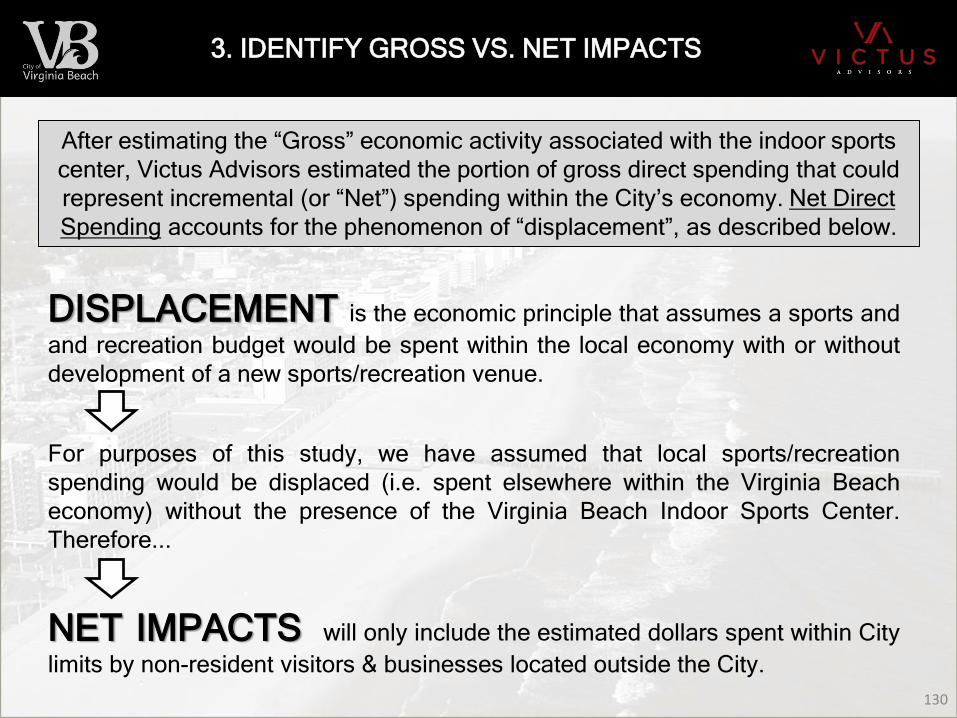
DRAFT 130
3. IDENTIFY GROSS VS. NET IMPACTS
After estimating the “Gross” economic activity associated with the indoor sports
center, Victus Advisors estimated the portion of gross direct spending that could
represent incremental (or “Net”) spending within the City’s economy. Net Direct
Spending accounts for the phenomenon of “displacement”, as described below.
DISPLACEMENT is the economic principle that assumes a sports and
and recreation budget would be spent within the local economy with or without
development of a new sports/recreation venue.
For purposes of this study, we have assumed that local sports/recreation
spending would be displaced (i.e. spent elsewhere within the Virginia Beach
economy) without the presence of the Virginia Beach Indoor Sports Center.
Therefore...
NET IMPACTS will only include the estimated dollars spent within City
limits by non-resident visitors & businesses located outside the City.

DRAFT 131
4. THE MULTIPLIER EFFECT
Net Direct Spending that is captured in Virginia Beach is subsequently re-spent,
both inside and outside the local economy. The cumulative impact of the re-
spending cycles that occur within Virginia Beach City limits is called the
“Multiplier Effect”.
Construction Facility Revenues & Visitor SpendingFees, Concessions, Sponsorships, Lodging,
Restaurants, Entertainment, Retail, etc.
Manufacturing, Wholesalers (Food & Beverage, Merchandise),
Shipping/Freight, Utilities, etc.
Additional spending by businesses, households, government
entities, and other economic sectors.
Initial
Direct
Spending
Indirect
Spending
Induced
Spending
Labor, Materials,
Services, etc.

DRAFT 132
4. THE MULTIPLIER EFFECT (CONT.)
Victus Advisors utilized IMPLAN Multipliers specific to Virginia Beach (as shown below)
to estimate the following Net Economic Impacts:
• TOTAL OUTPUT (direct, indirect & induced spending in Virginia Beach)
• EMPLOYMENT (full-time & part-time jobs in Virginia Beach)
• LABOR INCOME (salaries & wages associated with Virginia Beach jobs)
• CITY TAX REVENUES (associated with the net total output)
Total Output Employment Labor Income
Multiplier Multiplier Multiplier
Construction - Non Residential
Retail Stores
Transit & Ground Passenger Transportation
Fitness & Recreational Sports Centers
Hotels & Motels, Including Casino Hotels
Food Service & Drinking Places
IMPLAN MULTIPLIERS - VIRGINIA BEACH, VA
Industry
Multipliers
range from
1.50 to 1.67
per industry
Ranging from
1.4 x 10⁻⁵
to
3.7 x 10⁻⁵
per
industry
Ranging from
0.49 to 0.74
per industry
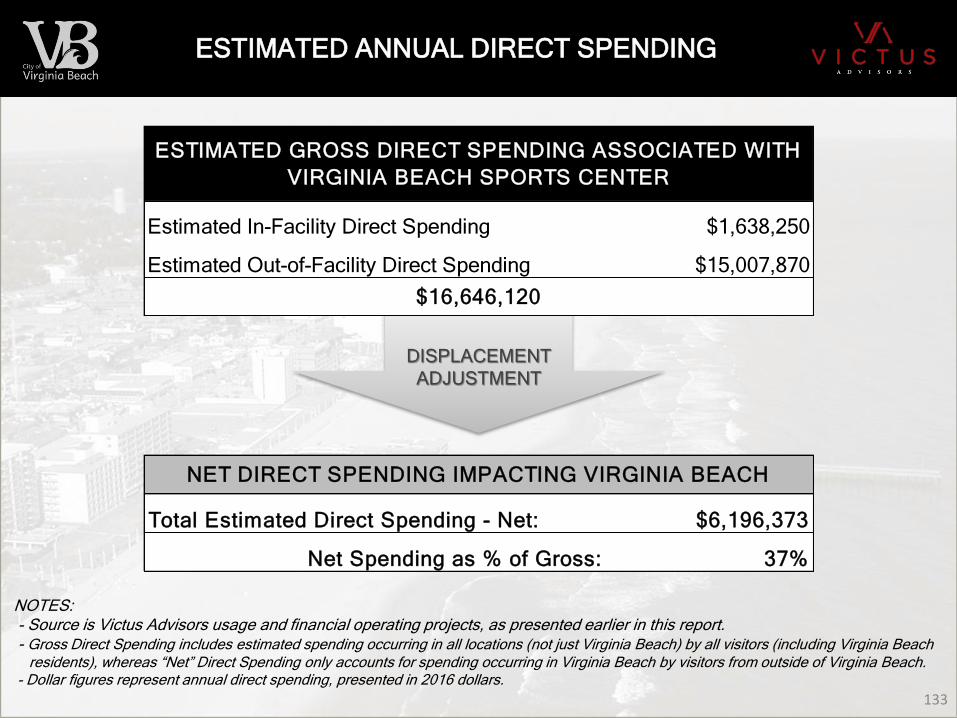
DRAFT 133
ESTIMATED ANNUAL DIRECT SPENDING
NOTES:- Source is Victus Advisors usage and financial operating projects, as presented earlier in this report.- Gross Direct Spending includes estimated spending occurring in all locations (not just Virginia Beach) by all visitors (including Virginia Beach
residents), whereas “Net” Direct Spending only accounts for spending occurring in Virginia Beach by visitors from outside of Virginia Beach.- Dollar figures represent annual direct spending, presented in 2016 dollars.
DISPLACEMENT
ADJUSTMENT
Estimated In-Facility Direct Spending $1,638,250
Estimated Out-of-Facility Direct Spending $15,007,870
ESTIMATED GROSS DIRECT SPENDING ASSOCIATED WITH
VIRGINIA BEACH SPORTS CENTER
$16,646,120
Total Estimated Direct Spending - Net: $6,196,373
Net Spending as % of Gross: 37%
NET DIRECT SPENDING IMPACTING VIRGINIA BEACH

DRAFT 134
ESTIMATED ANNUAL ECONOMIC IMPACTS
NET ANNUAL IMPACTS
MULTIPLIER
EFFECT
It is estimated that Net Direct Spending resulting from a new indoor sports center would
generate over $9.7 million in annual economic output and create more than 140 new jobs.
GROSS ANNUAL IMPACTS
MULTIPLIER
EFFECT

DRAFT 135
NET ANNUAL ECONOMIC IMPACTS BY INDUSTRY
NET ANNUAL IMPACTS
It is estimated that the Lodging industry in Virginia Beach would benefit the most from a
new indoor sports center (44% of incremental output), followed by Food/Beverage (30%).
TOTAL OUTPUT:
Sports $682,000 7%
Lodging $4,290,000 44%
Food & Beverage $2,881,000 30%
Shopping $710,000 7%
Entertainment $788,000 8%
Transportation $364,000 4%
TOTAL: $9,715,000 100%
EMPLOYMENT:
Sports 14 10%
Lodging 44 31%
Food & Beverage 43 31%
Shopping 15 10%
Entertainment 16 11%
Transportation 9 6%
TOTAL: 141 100%
LABOR INCOME:
Sports $303,000 9%
Lodging $1,335,000 39%
Food & Beverage $990,000 29%
Shopping $340,000 10%
Entertainment $350,000 10%
Transportation $146,000 4%
TOTAL: $3,464,000 100%
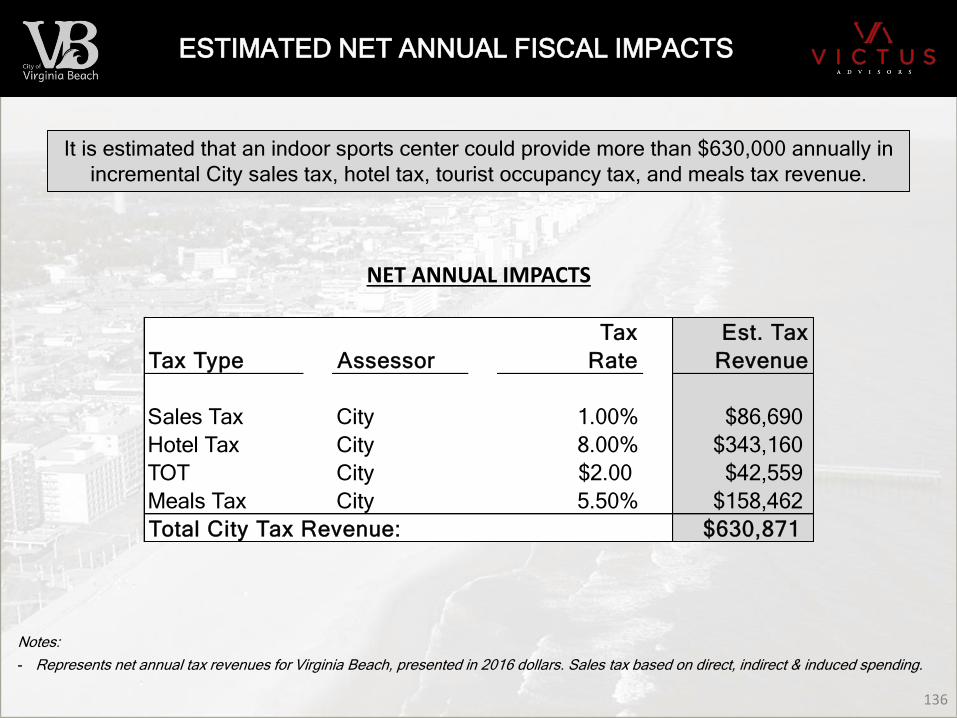
DRAFT 136
ESTIMATED NET ANNUAL FISCAL IMPACTS
Notes:
- Represents net annual tax revenues for Virginia Beach, presented in 2016 dollars. Sales tax based on direct, indirect & induced spending.
NET ANNUAL IMPACTS
It is estimated that an indoor sports center could provide more than $630,000 annually in
incremental City sales tax, hotel tax, tourist occupancy tax, and meals tax revenue.
Tax Est. Tax
Tax Type Assessor Rate Revenue
Sales Tax City 1.00% $86,690
Hotel Tax City 8.00% $343,160
TOT City $2.00 $42,559
Meals Tax City 5.50% $158,462
Total City Tax Revenue: $630,871

DRAFT 137
HOTEL/MOTEL – NET ANNUAL DIRECT IMPACTS
Current Indoor Sports Impacts
Even without the benefit of a City-controlled indoor sports center, the Sports Marketing Unit has already
been somewhat effective in generating hotel/motel room nights via indoor sports activity. For example, in
fiscal year 2015-16, the Sports Marketing Unit hosted 28 indoor sports events in Virginia Beach that
generated 33,081 room nights (source: Virginia Beach CVB).
Estimated Incremental Impacts of an Indoor Sports Center
Victus Advisors estimates that a new indoor sports center could generate approximately 21,279 incremental
annual hotel nights in Virginia Beach, as shown below, which would represent approximately 54,360 in total
annual room nights (current + incremental) in Virginia Beach due to indoor sports events.
Notes:
(1) Overnight Visitors estimate developed by Victus Advisors as part of our Utilization & Attendance Estimates
(2) People per Room and Nights per Room are based on post-event data for participatory sports events held in Virginia Beach within the past two years
(3) ADR represents median monthly ADR for Virginia Beach according to the Virginia Beach CVB
(4) Total Hotel Room Spending represents direct hotel room spending only in 2016 dollars, and does not include indirect or induced impacts
Visitors Staying in Hotel/Motel: 31,919
Estimated People per Room: 3.0
Total Rooms Utilized: 10,640
Average Nights per Room: 2.0
Total - Incremental Annual Room Nights: 21,279
Average Daily Room Rate (ADR): $127.50
Total - Incremental Hotel Room Spending: $2,713,120
Estimated Incremental Annual Hotel Impacts - City of Virginia Beach

DRAFT 138
SUMMARY OF NET IMPACTS OVER TIME
ESTIMATED NET IMPACTS OVER 30 YEARS*
Over a 30 year
period, a new
indoor sports
center is
estimated to
produce net
impacts of
nearly $477
million in total
economic
output, 141
sustainable
jobs, more
than $30
million in City
tax revenues,
and over
638,000 hotel
nights.
Hotel City
Year Direct Spending Total Output Employment Wages Nights Tax Revenue
0* $10,201,800 $14,660,736 116 $6,452,841 n/a $15,606
1 6,196,373 9,715,000 141 3,464,000 21,279 630,869
2 6,382,264 10,006,450 141 3,567,920 21,279 649,795
3 6,573,732 10,306,644 141 3,674,958 21,279 669,288
4 6,770,944 10,615,843 141 3,785,206 21,279 689,367
5 6,974,072 10,934,318 141 3,898,763 21,279 710,048
6 7,183,294 11,262,348 141 4,015,725 21,279 731,350
7 7,398,793 11,600,218 141 4,136,197 21,279 753,290
8 7,620,757 11,948,225 141 4,260,283 21,279 775,889
9 7,849,379 12,306,671 141 4,388,092 21,279 799,165
10 8,084,861 12,675,871 141 4,519,734 21,279 823,140
11 8,327,406 13,056,148 141 4,655,326 21,279 847,835
12 8,577,229 13,447,832 141 4,794,986 21,279 873,270
13 8,834,546 13,851,267 141 4,938,836 21,279 899,468
14 9,099,582 14,266,805 141 5,087,001 21,279 926,452
15 9,372,569 14,694,809 141 5,239,611 21,279 954,245
16 9,653,746 15,135,653 141 5,396,799 21,279 982,873
17 9,943,359 15,589,723 141 5,558,703 21,279 1,012,359
18 10,241,660 16,057,415 141 5,725,464 21,279 1,042,730
19 10,548,909 16,539,137 141 5,897,228 21,279 1,074,012
20 10,865,377 17,035,311 141 6,074,145 21,279 1,106,232
21 11,191,338 17,546,371 141 6,256,369 21,279 1,139,419
22 11,527,078 18,072,762 141 6,444,060 21,279 1,173,601
23 11,872,890 18,614,945 141 6,637,382 21,279 1,208,809
24 12,229,077 19,173,393 141 6,836,504 21,279 1,245,074
25 12,595,949 19,748,595 141 7,041,599 21,279 1,282,426
26 12,973,828 20,341,053 141 7,252,847 21,279 1,320,899
27 13,363,043 20,951,284 141 7,470,432 21,279 1,360,526
28 13,763,934 21,579,823 141 7,694,545 21,279 1,401,341
29 14,176,852 22,227,217 141 7,925,381 21,279 1,443,382
30 14,602,158 22,894,034 141 8,163,143 21,279 1,486,683
Cumulative Total: $304,997,000 $476,856,000 141 $171,254,000 638,381 $30,029,000
Net Present Value: $179,610,000 $280,309,000 n/a $101,135,000 n/a $17,295,000
* Year 0 represents the one-time impacts of facility construction spending. Annual impacts of operations begin in Year 1 and are adjusted annually for inflation.
Note: Assumes annual inflation of 3.0% and discount rate of 3.2%.

DRAFT
VICTUS ADVISORS LLC
2720 Homestead Rd. #130
Park City, Utah 84098
(435) 604-0874
www.victusadvisors.com
CONTACT INFORMATIONCONTACT INFORMATION
139


