FEASIBILITY STUDY FOR DEVELOPMENT OF AN 81-UNIT SINGLE-FAMILY RESIDENTIAL SUBDIVISION Russell Craig Robinson B.S., California State University, Sacramento, 2005 PROJECT Submitted in partial satisfaction of the requirements for the degree of MASTER OF SCIENCE in URBAN LAND DEVELOPMENT at CALIFORNIA STATE UNIVERSITY, SACRAMENTO FALL 2011
Transcript
FEASIBILITY STUDY FOR DEVELOPMENT OF AN 81-UNIT SINGLE-FAMILY RESIDENTIAL SUBDIVISION
Russell Craig Robinson B.S., California State University, Sacramento, 2005
PROJECT
Submitted in partial satisfaction of the requirements for the degree of
MASTER OF SCIENCE
in
URBAN LAND DEVELOPMENT
at
CALIFORNIA STATE UNIVERSITY, SACRAMENTO
FALL 2011
ii
FEASIBILITY STUDY FOR DEVELOPMENT OF AN 81-UNIT SINGLE-FAMILY RESIDENTIAL SUBDIVISION
A Project
by
Russell Craig Robinson Approved by: __________________________________, Committee Chair Nuriddin Ikromov, Ph. D. __________________________________, Second Reader Robert W. Wassmer, Ph. D. ____________________________ Date
iii
Student: Russell Craig Robinson I certify that this student has met the requirements for format contained in the University format
manual, and that this Project is suitable for shelving in the Library and credit is to be awarded for
the Project.
______________________________, Department Chair _____________________ Robert W. Wassmer, Ph. D. Date Department of Public Policy and Administration
iv
Abstract
of
FEASIBILITY STUDY FOR DEVELOPMENT OF AN 81-UNIT SINGLE-FAMILY RESIDENTIAL SUBDIVISION
by
Russell Craig Robinson
This Project was prepared to analyze the feasibility of investment in an 81-unit single-family
residential subdivision site located in the City of Lemoore, California. The site is substantially
improved with infrastructure in place and appears to be ready for near-term construction at a cost
savings unavailable through the purchase and development of a raw land parcel. The site was
subdivided and partially completed by an undercapitalized developer who was unable to complete
the subdivision due to the recent economic downturn. A site analysis, market study, marketability
analysis, and investment analysis was conducted to determine if immediate construction of the
site is profitable. Despite current economic conditions, the results of this Project indicate that the
development of the site is an exceptionally lucrative investment opportunity and investors should
consider immediate development.
______________________, Committee Chair Nuriddin Ikromov, Ph. D. ______________________ Date
v
ACKNOWLEDGMENTS Special thanks to Dr. Ikromov for his guidance and valuable input that helped me produce
this Project. I would also like to thank Dr.Wassmerfor his exceptional commitment to his
students, the Urban Land Development Program, and the Public Policy and Administration
Department.
vi
TABLE OF CONTENTS Page
List of Tables .......................................................................................................................... vii
List of Figures ............................................................................................................................ x
610-084. The site is partially complete with infrastructure and grading; however, additional site
improvements are required in order to construct homes. A summary of the remaining
improvements is presented in Table 1.
11
Table 1 Remaining Site Improvements
Current Zoning/Conformity
Current zoning is R-1-7 with a Planned Unit Development (PUD) overlay. The zoning
designation allows for up to seven dwelling units to be constructed on one acre of land.
Moreover, the PUD overlay is a special set of development standards that apply to a particular
geographic area and gives local governments and developers the flexibility to create zoning
standards appropriate to the project. I have assumed that the subject is in conformance with the
City of Lemoore’s zoning code since the City has approved a recorded a final subdivision map..
Easements, Covenants, Conditions, and Restrictions
The easements affecting the individual lots are for utility or drainage purposes only. All
easements are standard for a tract development and should not affect the subject.
1 Storm drain installation2 Park landscaping and concrete work3 Outlot grading4 Street improvements5 Remaining sewer improvements6 Remaining water line improvements7 Concrete for sidewalks8 Dry utilities9 Lift station, pump, and sump pump
10 Storm drain extension to City lift station11 Clean storm drain system12 Pads import and recertification13 Air test repair porential sewer locations14 Mail boxes15 Outlots A, B
Remaining Site Improvements
12
Soils, Geology, and Wetlands Issues
A geotechnical report dated September 22, 2004 prepared by Krazan& Associates, Inc. concluded
that the subject site and soil conditions are conducive of the proposed development. An
environmental site assessment report was not available for review. I assume that adverse
geotechnical or environmental conditions do not negatively affect the site. Furthermore, I assume
that hazardous materials do not exist in the soil and subsoil regions of the site.
Environmental Hazard Issues
The subject is within Flood Zone X, according to the Federal Emergency Management Agency
(FEMA) flood insurance rate maps, Community Panel No. 060089-0167C effective June 16,
2009. This zone is determined to be in areas outside the 0.2% annual chance of flood plain.
Furthermore, the site is not in an identified earthquake hazard area based on the Alquist-Priolo
special studies.
13
Property Taxes
All of the lots are recorded and assessed. Table 2 below is a summary for the 2010/11 property
tax of a representative lot within the subdivision (Assessor 2011). Figure 5 is a copy of the
Assessor’s parcel map.
Table 2 Assessor’s Information
Figure 5 Assessor’s Parcel Map
Item/APN 023-610-003Assessment Land Value $12,887 Assessed Improvement Value $0 Assessed Other Value $0Total Assessed Value $12,887 Property Tax $134.83 Tax Rate 1.046215%Tax Rate Area 003-001
Assessor's Information
14
Tax Increases/Decreases
Under current California law, real estate taxes in the event of a sale of the property or completion
of new construction are based on an appraisal by the Assessor at the current value utilizing the
current tax rate. Taxes are limited to two percent maximum per annum increase if the property is
not sold or no new improvements are constructed. The property is encumbered by a 1.046215%
tax rate (2011). No bonds or other assessments are levied against the property.
Conclusion of Site Analysis
The site is best suited for single-family residential development based on the legally permissible
uses according to the zoning code. Furthermore, it is physically conducive of residential
development and existing plans as prepared by the previous developer and as approved by the
City of Lemoore offers a functional design that is commensurate of residential subdivision
development. No adverse issues associated with the site were observed.
15
Chapter 3
MARKET STUDY
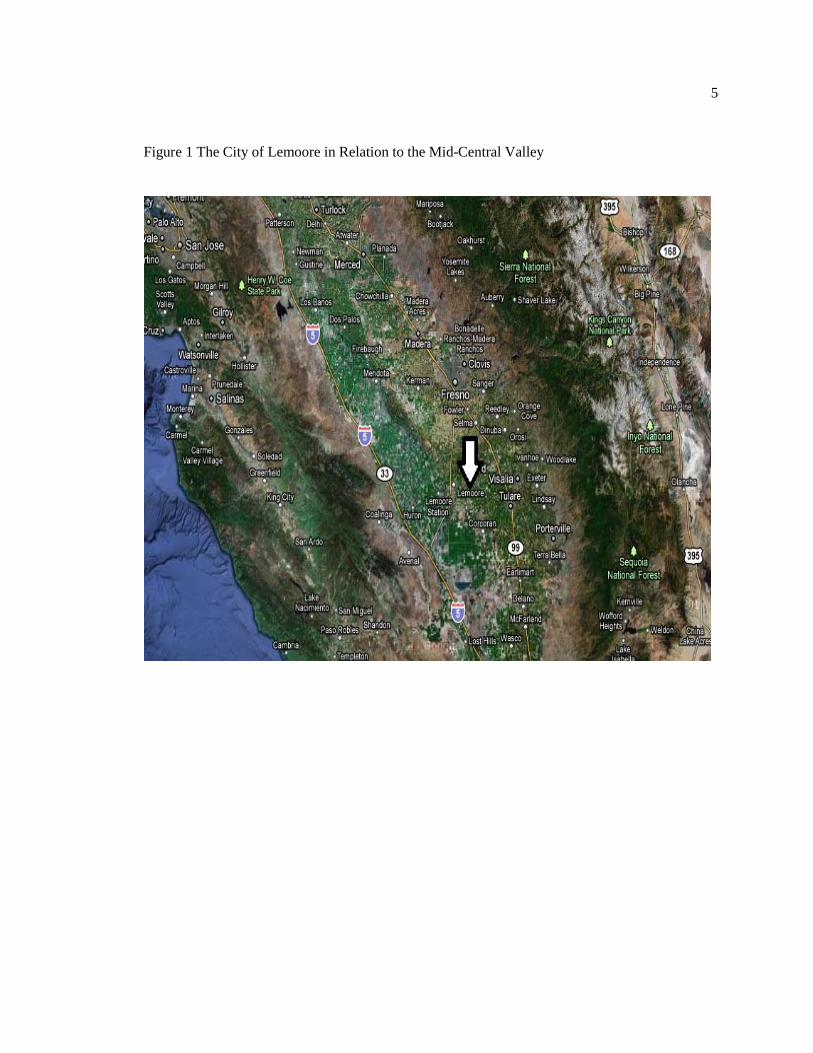
As mentioned in the Chapter 2, the site is located in the eastern side of the City of Lemoore,
which is within Kings County.The U.S.Census Bureau defines Kings County as encompassing
the entire Hanford–Corcoran Metropolitan Statistical Area. The subject site is influenced by the
both the broader market area as well as the immediate neighborhood. In this chapter, I define the
broader market area as Kings County and offer a description and analysis of its economic and
demographic characteristics. I also describe the immediate area surrounding the site and discuss
the economics and demographics of the neighborhood.
The County is primarily a rural area consisting of smaller sized cities and towns that are
economically dependent on each other to varying extents. It is a rich agricultural district and hosts
the
Kings County Market Area Description
Naval Air Station Lemoore, which is the U.S. Navy's newest and largest jet air station and
serves as a significant employer. The county seat is the City of Hanford which is by far the largest
city in the County with approximately 59,967 residents (Census Bureau 2010). The County’s
population is 152,982 (2010).As illustrated in Figure 6 below, the County is bordered by Fresno
County to the north, Kern County to the south, Tulare County to the east, and Monterey County
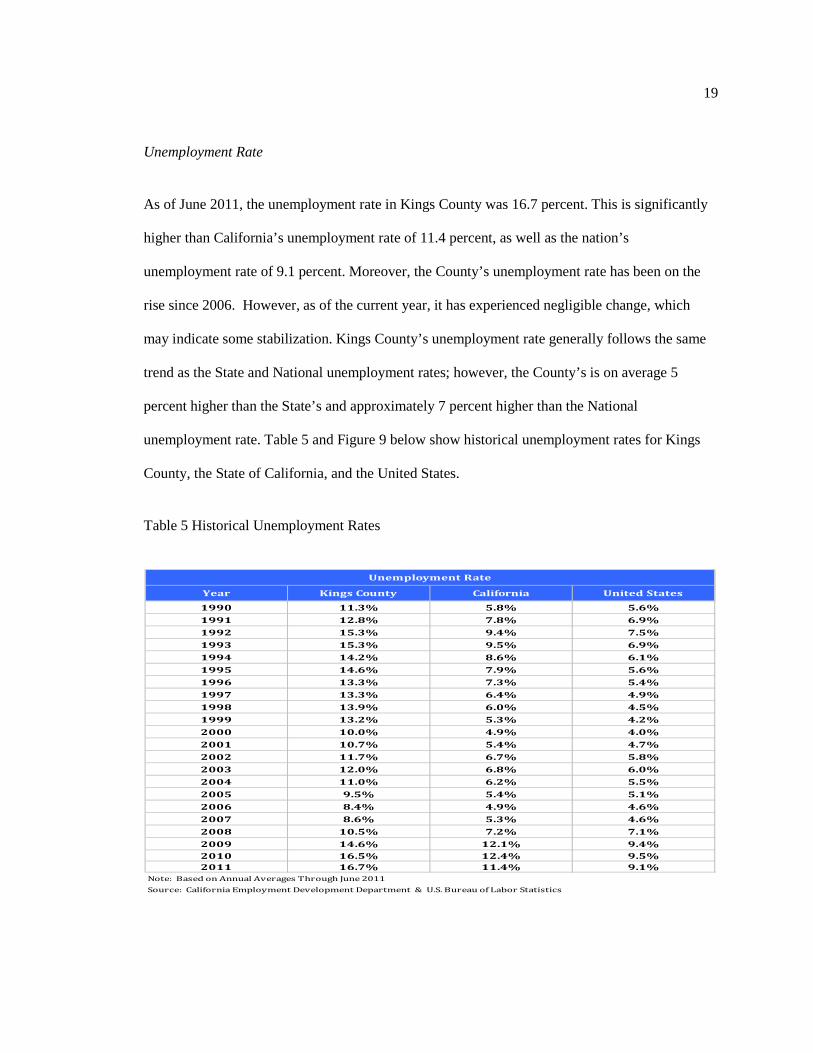
Note: Based on Annual Averages Through June 2011Source: California Employment Development Department & U.S. Bureau of Labor Statistics
Unemployment Rate
20
Figure 9 Historical Unemployment Rates
0.0%
2.0%
4.0%
6.0%
8.0%
10.0%
12.0%
14.0%
16.0%
18.0%
1990 1993 1996 1999 2002 2005 2008 2011
Unemployment Rate
Kings County California United States
21
Employment by Industry
Table 6 below indicates a large percentage of the County’s workforce, 35.2 percent, is employed
by the government sector. Other industries prominent in Kings County include gaming (18.4
percent), trade, transportation & utilities (11.9 percent), and educational & business services (10.3
percent). Although the County’s employment base lacks the diversity of a major metropolitan
region, it is situated within a 30 – 40 minute drive of City of Fresno which offers more diverse
economic base and has an overall more stable economy.
Table 6 Employment by Industry
IndustryNumber Employed
2011% of Total
Total All Industries * 42,900 100.0%
Total Farm 7,900 18.4%
Mining, Logging, and Construction 900 2.1%
Manufacturing 3,600 8.4%
Trade, Transportation & Utilities 5,100 11.9%
Information 200 0.5%
Financial Activities 900 2.1%
Professional Business Services 1,500 3.5%
Educational & Business Services 4,400 10.3%
Leisure & Hospitality 2,800 6.5%
Other Services 500 1.2%Government 15,100 35.2%
* Industry Employment is by place of work; excludes self-employed individuals.Note: Based on June 2011 preliminary data. Data not seasonally adjusted.Source: California Employment Development Department
Employment by Industry
22
Industry Employment Growth
Overall, the County’s employment base has contracted by 2.1 percent over the course of the last
year with Professional Business Services experiencing the sharpest decline at -16.7 percent from
2010 levels. In addition, manufacturing and farming experienced significant decline since last
year, while mining, logging & construction experienced a healthy gain of 12.5percent. All other
industries exhibited negligible change. Table 7 and Figure 10 show industry employment from
Government 15,000 15,100 0.7%* Industry Employment is by place of work; excludes self-employed individuals.Note: Based on June 2011 preliminary data. Data not seasonally adjusted.Source: California Employment Development Department
Industry Employment Growth
23
Figure 10 Industry Employment Growth
-20% -15% -10% -5% 0% 5% 10% 15%
Total All Industries
Total Farm
Mining, Logging, and Construction
Manufacturing
Trade, Transportation & Utilities
Information
Financial Activities
Professional Business Services
Educational & Business Services
Leisure & Hospitality
Industry Employment Growth
24
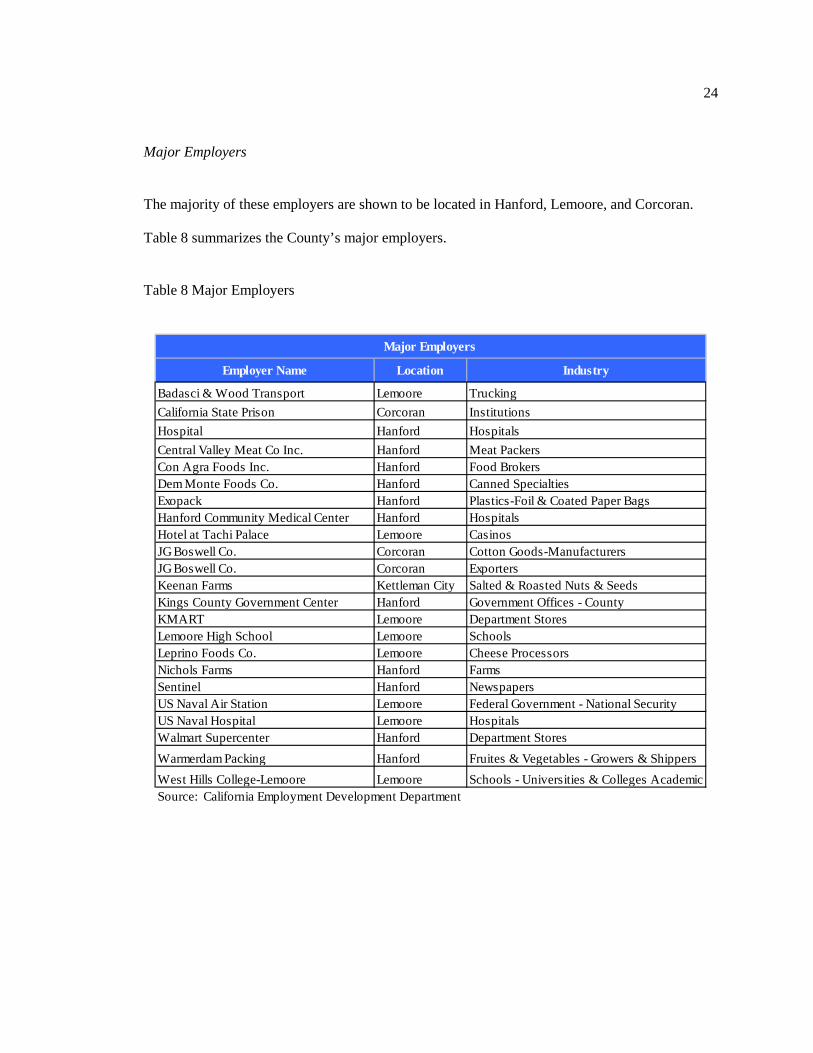
Major Employers
The majority of these employers are shown to be located in Hanford, Lemoore, and Corcoran.
Table 8 summarizes the County’s major employers.
Table 8 Major Employers
Employer Name Location Industry
Badasci & Wood Transport Lemoore TruckingCalifornia State Prison Corcoran InstitutionsHospital Hanford HospitalsCentral Valley Meat Co Inc. Hanford Meat PackersCon Agra Foods Inc. Hanford Food BrokersDem Monte Foods Co. Hanford Canned SpecialtiesExopack Hanford Plastics-Foil & Coated Paper BagsHanford Community Medical Center Hanford HospitalsHotel at Tachi Palace Lemoore CasinosJG Boswell Co. Corcoran Cotton Goods-ManufacturersJG Boswell Co. Corcoran ExportersKeenan Farms Kettleman City Salted & Roasted Nuts & SeedsKings County Government Center Hanford Government Offices - CountyKMART Lemoore Department StoresLemoore High School Lemoore SchoolsLeprino Foods Co. Lemoore Cheese ProcessorsNichols Farms Hanford FarmsSentinel Hanford NewspapersUS Naval Air Station Lemoore Federal Government - National SecurityUS Naval Hospital Lemoore HospitalsWalmart Supercenter Hanford Department StoresWarmerdam Packing Hanford Fruites & Vegetables - Growers & ShippersWest Hills College-Lemoore Lemoore Schools - Universities & Colleges AcademicSource: California Employment Development Department
Major Employers
25
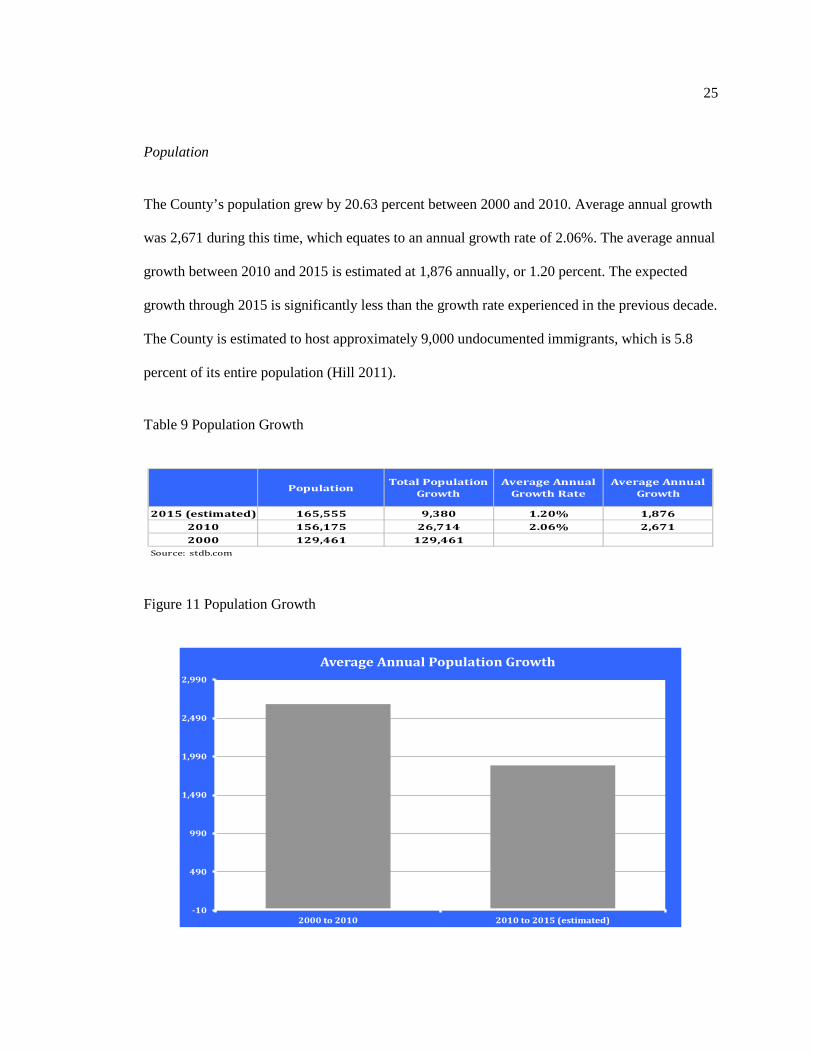
Population
The County’s population grew by 20.63 percent between 2000 and 2010. Average annual growth
was 2,671 during this time, which equates to an annual growth rate of 2.06%. The average annual
growth between 2010 and 2015 is estimated at 1,876 annually, or 1.20 percent. The expected
growth through 2015 is significantly less than the growth rate experienced in the previous decade.
The County is estimated to host approximately 9,000 undocumented immigrants, which is 5.8
percent of its entire population (Hill 2011).
Table 9 Population Growth
Figure 11 Population Growth
PopulationTotal Population
GrowthAverage Annual
Growth RateAverage Annual
Growth
2015 (estimated) 165,555 9,380 1.20% 1,876
2010 156,175 26,714 2.06% 2,671
2000 129,461 129,461Source: stdb.com
-10
490
990
1,490
1,990
2,490
2,990
2000 to 2010 2010 to 2015 (estimated)
Average Annual Population Growth
`
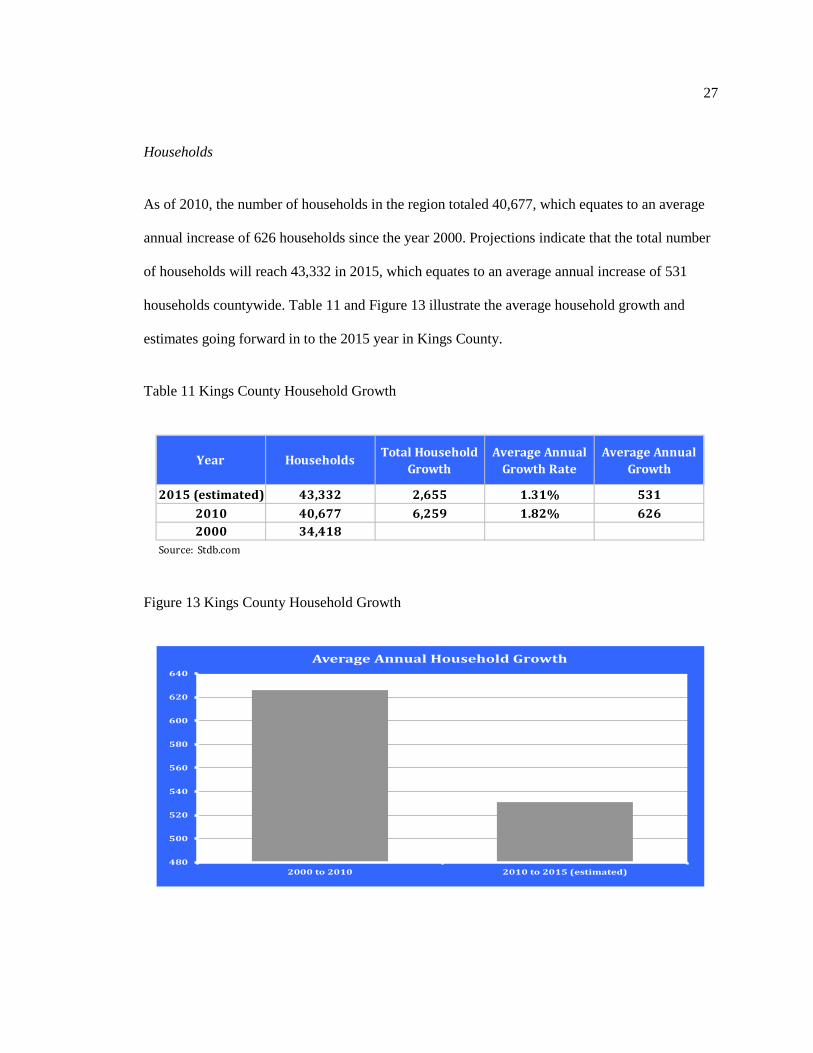
26
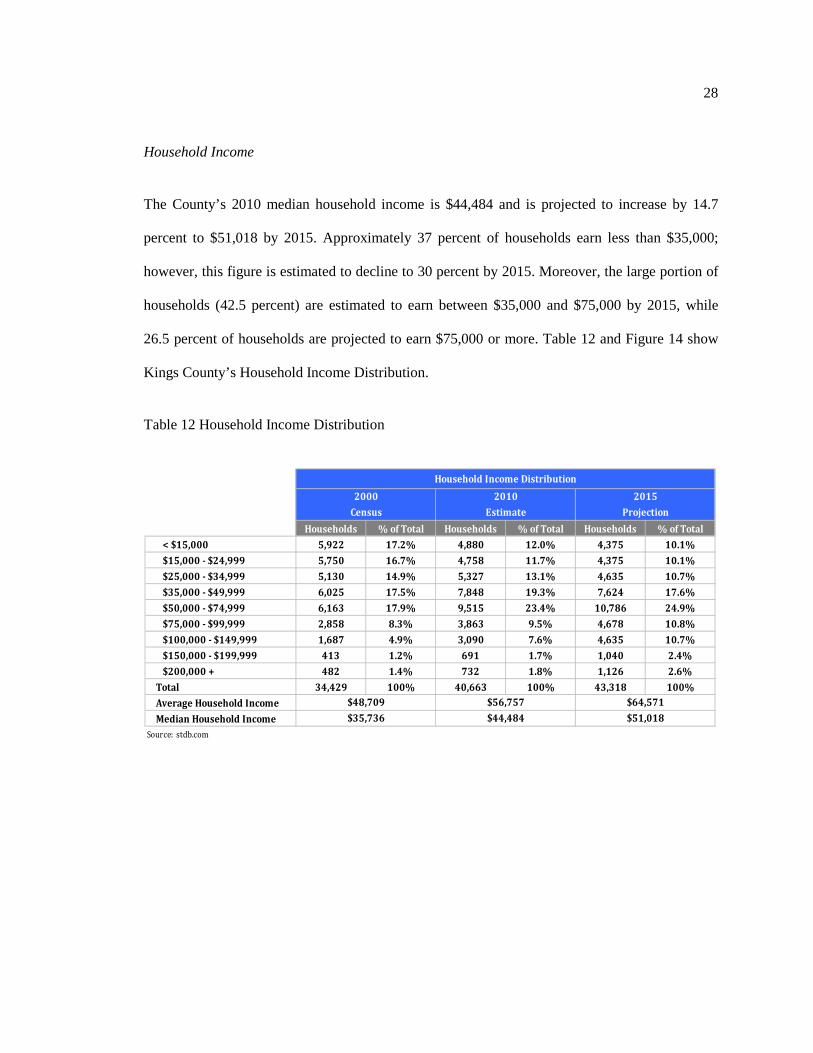
Population by Age
A concentrated share of the region’s population (18.8 percent) is between 25 and 34 years old as
of the 2010 year. The majority of the region’s population is between the ages of 25 and 54. This
trend is expected to continue as suggested by the 2015 estimates presented in Table 10 and Figure
12 below.
Table 10 Distribution of Population by Age
Figure 12 Distribution of Population by Age
People % of Total People % of Total People % of Total
Age 0 - 4 10,486 8.1% 13,275 8.50% 14,238 8.60%
Age 5 - 9 10,875 8.4% 12,025 7.70% 13,079 7.90%
Age 10 - 14 10,227 7.9% 10,308 6.60% 11,589 7.00%
Age 15 - 19 9,968 7.7% 11,869 7.60% 11,258 6.80%
Age 20 - 24 11,263 8.7% 14,524 9.30% 14,734 8.90%
Age 25 - 34 23,174 17.9% 29,361 18.80% 31,621 19.10%
Age 35 - 44 22,138 17.1% 22,802 14.60% 24,171 14.60%
Age 45 - 54 13,982 10.8% 18,116 11.60% 17,383 10.50%
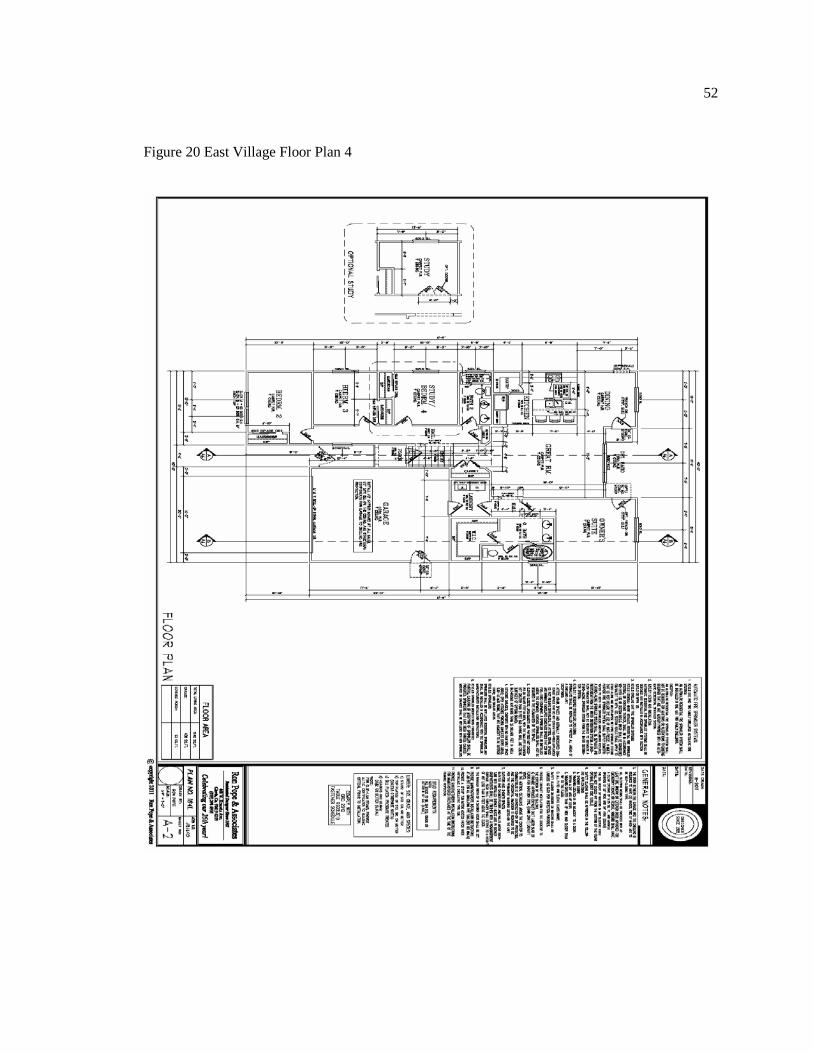
Style California Contemporary Stories One and two Quality, Design, and Appeal Average, commensurate with competing developments.
Floors and Foundations Concrete slab, footings, and driveways. Structural Framing Wood frame exterior and interior walls. The floor plates are 9’ 1”. Exterior/Interior Walls Stucco exterior. Interior walls are gypsum wallboard, taped,
textured and painted. Roofs The roofing structure is factory roof truss system with plywood
sheathing and composition shingle covering. Windows Windows are energy efficient, dual-pane in vinyl frames Doors Exterior doors are to be solid core, raised panel doors. The front
door is a 7’ raised panel fiberglass door. Interior doors are assumed hollow core. Hardware is good.
Plumbing Average plumbing to good fixtures. It is assumed that each unit offers tankless water heater with on-demand hot water.
Electrical Service to each home will be 200-amps: 110/220 volt. Light fixtures are of average to good quality.
HVAC Central heat and air system. Kitchens Finished wood cabinetry, pantry, double sink with faucet, and
granite or tile throughout.Good appliances: microwave/oven combo, gas cook top with hood, oven, kitchen island, dishwasher, and garbage disposal.
Baths Single or dual sinks with ceramic tile or granite countertops. Combination tub/shower inserts in typical bathroom. Separate shower and oversized tub in the master bathroom.
Laundry Room Inside the living areas. Floor Coverings Finish flooring typically include tile in the kitchen, foyer,
bathrooms, and laundry room, and wall-to-wall carpeting elsewhere. Insulation Insulation is a combination of foam wrapped around all exterior
walls in insulation on the interior walls. Optional Features Many options and upgrades will be offered. As a result, many
different configurations will be available with all above information dependent upon selected options.
59
Pricing
A multivariate regression analysis is typically employed to forecast new home sales prices for
proposed subdivisions. This approach is meaningful when adequate market data are available, but
is less meaningful when little data exists due to reductions in the degrees of freedom. In light of
the aforementioned limitations, I have elected to prepare an adjustment analysis of comparable
properties, which is described in further detail later in this section. This approach involves the
comparing, on a model-by-model basis, the proposed homes with homes that are for sale or have
been sold in competing subdivisions in the market area.
I conducted primary market research and gathered data from four independent investigations of
single-family sales activity in the Cities of Lemoore and Hanford to determine pricing
opportunities and general product recommendations for the subject site. Additionally, I inspected
the models of competing subdivisions and have summarized the floor plan characteristics of each
subdivision in Table 25 below. Tables 26 thru 29offer more detailed information associated with
each subdivision I inspected.
60
Table 25 Subdivision Survey Results
No. Project Name/Bui lder Plan No.Base Sale
Price Price/SF Incentives Net PriceNet
Price/SFLiving
Area (SF) BR/BANo. of
StoriesGarage Spaces
Meridian 1 $179,990 $132.64 $7,500 $172,490 $127.11 1,357 3/2 1 2Fargo Avenue & North Fitzgerald Lane 2 $199,990 $131.83 $7,500 $192,490 $126.89 1,517 3/2 1 2Hanford 3 $212,990 $117.74 $7,500 $205,490 $113.59 1,809 3/2 1 2M cM illin Homes 4 $227,990 $113.54 $7,500 $220,490 $109.81 2,008 3/2.5 2 3
Independence - The Tradi tions 1 $251,000 $149.05 $7,530 $243,470 $144.58 1,684 3/2 1 212th & Grangevi lle Road 2 $271,000 $144.38 $8,130 $262,870 $140.05 1,877 4/2 1 3Hanford, CA 3 $276,000 $138.00 $8,280 $267,720 $133.86 2,000 4/2 1 2LennarLegacy - The Classics 1 $225,000 $132.82 $6,000 $219,000 $129.28 1,694 3/2 1 2SWQ Bush Street and 19th Street 2 $240,000 $125.98 $6,000 $234,000 $122.83 1,905 4/3 1 2Lemoore 3 $250,000 $125.00 $8,000 $242,000 $121.00 2,000 4/2 1 2Lennar 4 $273,000 $122.81 $8,000 $265,000 $119.21 2,223 4/3 1 2Divante Vi l las 1 $212,000 $113.07 $0 $212,000 $113.07 1,875 3/2 1 2SWQ of Cornelia and Shields 2 $248,000 $116.38 $0 $248,000 $116.38 2,131 3/2 1 3Lemoore 3 $285,000 $111.50 $0 $285,000 $111.50 2,556 4/3 1 3Silver Oaks Land Co.
4
Subdivision Survey
3
2
1
61
Table 26 Meridian Subdivision Data
MeridianFargo Avenue & North Fitzgerald LaneHanfordM cM illin HomesEntry level/move up6,800AverageLevelAverage
Fee Premium Detai ls Sale Condi tion Detai lsDate Opened for Sale Jun-07 Lot Premiums None Cash Equivalent YesNumber of Sales 44 Incentives $7,500 Terms Incentives
3-4 monthly HOA Fee $0.00 Sale Condi tions At M arketAssess Dist Fees $217.00 Property Rights Fee Simple
Plan NameBase Sale
PricePrice per SF Incentives Net Price Net Price/SF
Per discussions with a property representative, the homes in this subdivision have been selling at a rate of 3-4 homes per month since the turn of the 2011 year. Incentives reported averaged $7,500. Activi ty was reported to be slower this year than last year; however, over the past couple months, sales have been fairly consistent.
Typical Lot Size (SF)LocationTopographyLayout
62
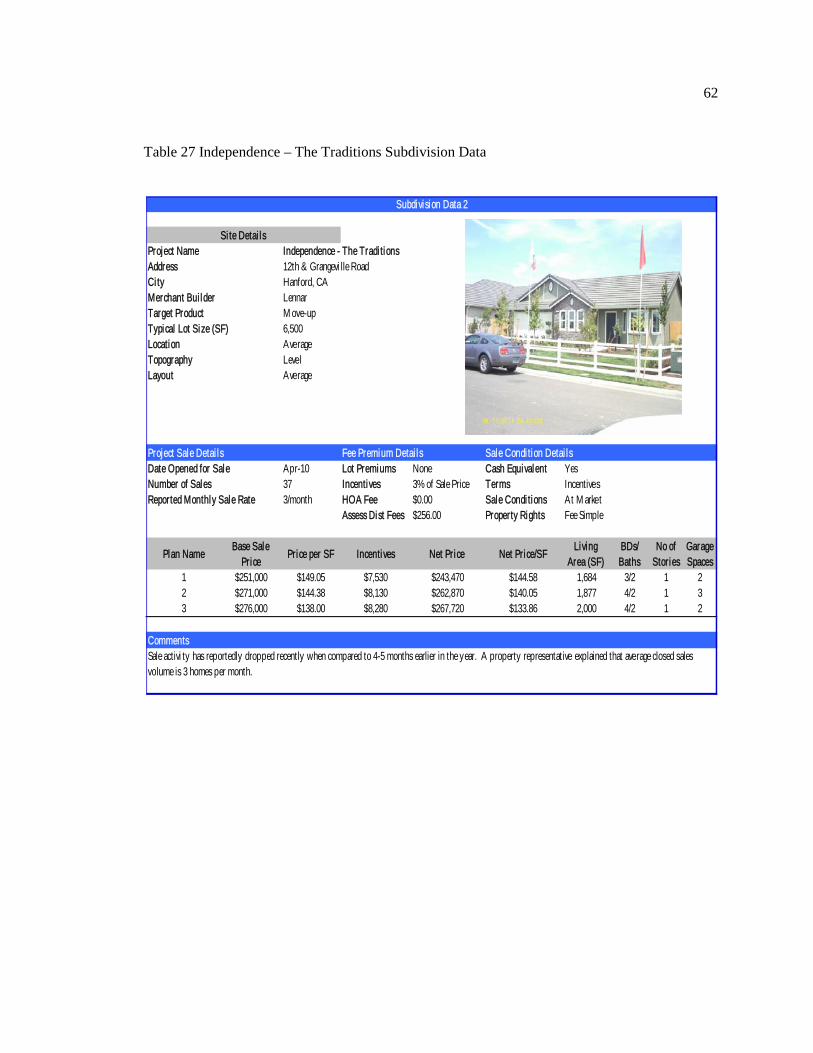
Table 27 Independence – The Traditions Subdivision Data
Independence - The Tradi tions12th & Grangevi lle RoadHanford, CALennarM ove-up6,500AverageLevelAverage
Fee Premium Detai ls Sale Condi tion Detai lsDate Opened for Sale Apr-10 Lot Premiums None Cash Equivalent YesNumber of Sales 37 Incentives 3% of Sale Price Terms Incentives
3/month HOA Fee $0.00 Sale Condi tions At M arketAssess Dist Fees $256.00 Property Rights Fee Simple
Plan NameBase Sale
PricePrice per SF Incentives Net Price Net Price/SF
Sale activi ty has reportedly dropped recently when compared to 4-5 months earlier in the year. A property representative explained that average closed sales volume is 3 homes per month.
LayoutTopographyLocation
Project Sale Detai ls
Reported Monthly Sale Rate
63
Table 28 The Legacy Classics Subdivision Data
Legacy - The ClassicsSWQ Bush Street and 19th StreetLemooreLennarEntry level/move up6,000AverageLevelAverage
Fee Premium Detai ls Sale Condi tion Detai lsDate Opened for Sale Jun-11 Lot Premiums Yes Cash Equivalent YesNumber of Sales 3 Incentives $6,000 - $8,000 Terms Incentives
5/month HOA Fee $0.00 Sale Condi tions At M arketAssess Dist Fees $715.00 Property Rights Fee Simple
Plan NameBase Sale
PricePrice per SF Incentives Net Price Net Price/SF
This subdivision opened in June of this year and has sold eight homes with three closing as of the date of inspection. Incentives include closing costs ranging from $6,000 - $8,000. Premium lots achieve an additional $6,500 above base price.
Typical Lot Size (SF)LocationTopographyLayout
Subdivision Data 3
Si te Detai lsProject NameAddressCi ty
64
Table 29 Divante Villas Subdivision Data
Divante Vi l lasSWQ of Cornelia and ShieldsLemooreSilver Oaks Land Co.Entry Level/M ove up8,000AverageLevelAverage
Fee Premium Detai ls Sale Condi tion Detai lsDate Opened for Sale Jun-05 Lot Premiums N/Av. Cash Equivalent YesNumber of Sales 51 Incentives None Terms Incentives
0.50 HOA Fee $0.00 Sale Condi tions At M arketAssess Dist Fees $0.00 Property Rights Fee Simple
Plan NameBase Sale
PricePrice per SF Incentives Net Price Net Price/SF
Per conversations with a property representative, 5 homes have sold this year and 7 homes sold last year. The subdivision offeres several more floor plans and are being sold vi a offers from prospective buyers. Base pricing was not available. No incentives were reported. The property representative explained that the subdivision achieves sale prices from $200,000 to $320,000.
Typical Lot Size (SF)LocationTopographyLayout
Subdivision Data 4
Si te Detai lsProject NameAddressCi ty
65
The salient characteristics of these four subdivisions are illustrated in the Table 30 below.
Table 30 Salient Subdivision Characteristics
Three of the four projects within the subject’s competitive market area are achieving acceptable
sales performance. The Legacy Classics subdivision is achieving greater sales performance
relative to the Divante Villas, which is also located in Lemoore. Per information provided by a
market participant, Divante Villas is nearly sold-out and all that remains are several models and
four or five retail homes. Conversations with the subdivision representative at Divante Villas
explained that this subdivision suffered as the builder was undercapitalized and its lender
subsequently took over operations, which could be the reason for the disparity in absorption when
compared to The Legacy Classics subdivision. Upon inspection of Divante Villas, it was
apparent that the marketing efforts were vastly inferior compared to other subdivisions surveyed.
The typical lot size of the four projects ranked by sales performance (fastest selling to slowest
selling) is as follows:
1. 6,000 square feet
2. 6,500 square feet
Project City Builder Price Range Monthly Sales Rate
Legacy - The Classics
Lemoore Lennar $219,000 - $265,000
> 5
Divante Villas Lemoore Silver Oak $212,000 - $285,000
0.5
Independence - The Traditions
Hanford Lennar $243,470 - $267,720
3
Meridian Hanford McMillin $172,490 - $242,490
3-4
66
3. 6,800 square feet
4. 8,000 square feet
The data indicates that sales performance is inversely related to lot size and is presumably a
function of positioning the project to achieve lower base prices. The average lot size associated
within the subject is 5,566 square feet, which should bode well for lower base prices.
The Legacy Classics subdivision will be the subject’s greatest competition given its close
proximity. It is currently selling five homes per month and is experiencing relatively healthy
market activity. Considering that the subject offers lots smaller than that of the Legacy Classics,
and that the market appears to be particularly sensitive to price, the proposed homes should be of
similar quality to the Classics, but be priced slightly lower until the competing subdivision sells
out. The Legacy Classics will be sold out by March 2011 given current absorption rates.
In the next section, I arrange the characteristics of each comparable subdivision floor plan against
the proposed plans of the subject site and make adjustments for their differences. This will help
estimate the value of each proposed floor plan.
Description of Adjustments
The adjustment analysis of comparable properties to the subject is not an exact science.
Adjustments can be based on market-derived information (matched pairs) and/or on a "best fit"
analysis. The "best fit" technique involves making adjustments that are qualified, but consistent
across all sales, and which in the end tend to support each other. The results of the analysis of
each comparable sale are not necessarily absolute; therefore, I will consider the strengths and
weaknesses of the individual sale analysis in a reconciliation process by giving more or less
weight to one or more specific properties.
67
In the analysis of the individual comparable sales, property characteristics identified that could
have an impact on value is considered. The most significant property characteristics are as
follows:
Property Rights Transferred Home Size Financing Bedrooms/Bathrooms Conditions of Sale Garage Spaces Market Conditions Construction Quality Location Design/Appeal Lot Size Community Amenities
The following is an explanation of the more pertinent adjustments utilized.
Property Rights Transferred
The homes will be transferred with a fee simple interest, also known as fee simple absolute,
which is a freehold estate that represents the most complete form of ownership of real estate. A
holder of a fee simple estate is free to divide the fee into lesser states and sell, lease, or borrow
against them as he or she wishes, subject to the laws of the state in which the property is located.
All of the comparable sales have the same property rights; therefore, no adjustments are applied.
Financing
The comparable data vary with regard to incentives offered. All comparable sales were analyzed
based on their net selling price. The net selling price is determined by deducting any incentives
provided from the base price.
In addition, projects in Lemoore benefit from the availability of USDA financing, which may
have an influence on the sale prices of homes. However, the value contribution was
unquantifiable given the limited availability of data. Discussions with market participants
68
indicated that USDA financing does have a positive influence on prices achieved and absorption
rates of new home product. I have given qualitative consideration to the availability of USDA
financing in the overall reconciliation of my pricing recommendations.
Market Conditions
The prices quoted reflect prices as of August 2011. This study analyzes the value of the homes as
of the date of inspection, which is August 12, 2011. Changes in market conditions were not
apparent at this time and, therefore, adjustmentsare not merited in this regard.
Location
Visibility, accessibility, surrounding uses and economic characteristics of the immediate area as
well as demographics and proximity to commercial services are considered. Analysis of the price
points being achieved within the subdivisions as well as discussions with market participants
revealed that premiums are paid for location in some instances. Based upon information provided
by representatives of the subdivisions surveyed, appropriate adjustments were applied for
observed differences in location. Specifically, the City of Hanford was reported to be a superior
location when compared to the City of Lemoore. Realtors active in both Hanford and Lemoore
suggested price differential of approximately 10-20 percent in favor of Hanford. As such, I have
applied 15 percent location adjustment.
Lot Size
All else being equal, market participants will typically pay a premium for a larger lot given
additional yard area available, albeit at a decreasing rate as the lot size increases. The average lot
size of the subject is 5,566 square feet. The comparable data reflects lots sizes ranging from 6,000
69
square feet to 8,000 square feet. Considering the relatively narrow range of lots sizes, I have
assumed a linear relationship exists between the amount a buyer is willing to pay for additional
lot square footage and the size of the lots. Adjustments are applied based on $3 per square foot
difference in average lot size, which was supported by subdivision representatives actively selling
homes in Lemoore and Hanford.
Home Size
The proposed floor plans range in size from 1,380 square feet to 2,202 square feet. The
construction cost estimates provided by a perspective buyer of the subject indicated the average
cost to build the proposed floor plans is $52 per square foot of living space. For further support, I
researched comparable costs of subdivisions throughout the Mid-Central Valley area as illustrated
in Table 31 below. The costs indicated a range from approximately $50 per square foot to over
$70 per square foot.
70
Table 31 Direct Cost Comparables of Subdivision Homes throughout the Mid Central Valley
I compared the price differentials of floor plans of the comparable sales that were of similar
quality to that of the subject and found that additional square footage costs from $50 to $60 per
square foot. This method is referred to as paired-sales analysis.
per SFCapr i Cour t at Har lan Ranch Tuscan Bluffs @ Copper River Ranch
Direct Cost per SF
Green Park @ Sunnyside
Bella Vista @ Br ightonViscaya in Dinuba, CA
Foxton Chase
Canterbury at Har lan Ranch
Kingston at Har lan Ranch
Elev8tions
Ivy Gate at Har lan Ranch
Ter ra Bella
Camden Place
71
Based on the paired sales analysis as well as the cost comparable data, an adjustment factor of
$55 per square foot was applied for observed differences greater than 50 square feet between the
subject’s floor plans and that reflected in the comparable data.
Bedroom/Bathrooms
Based on price differentials between floor plans offered by the comparable subdivision sales, and
per discussions with subdivision representatives, the comparable sales are adjusted $5,000 for a
full bathroom. This figure is approximate and may not reflect actual costs. Adjustments are not
made for differences in bedroom count as this is accounted for in the square footage adjustments.
Garage Spaces
The project offers two- and three-car garages. Based on price differentials between floor plans,
the comparable data are adjusted $5,000 for each additional garage space. Again, this is an
approximate figure and may not reflect actual costs or value recognized by the market.
Construction Quality
The proposed homes have an average to good construction quality and are equipped with good
finishes and fixtures. Based upon the floor plans and elevations retrieved through the City of
Lemoore’s planning commission, several of the comparable subdivision sales are of inferior
quality and offer relatively inferior construction amenities. Data supporting these adjustments
were not available in the immediate area; however, sales from subdivisions within the City of
Dinuba, located approximately 35 miles northeast of the subject, indicated similar differences in
construction quality. The disparity in base prices achieved generally ranged between $7,500 to
72
over $15,000. Considering this, I have adjusted the comparable subdivision sales by $10,000 for
observed differences in construction quality.
Design and Appeal
Similar to construction quality, the choice in design and appeal is typically reflected in the sales
price. The subject will offer a similar design and appeal to that of the homes offered at the Legacy
Classics subdivision. I compared the Legacy Classics subdivision with Independence –The
Traditions subdivision as the floor plans offered by the Independence- The Traditions subdivision
were more aesthetically pleasing and overall more functional with regard to design. An
appropriate adjustment of $12,000 was applied to Independence – The Traditions. Moreover, this
adjustment was further supported by my conversation with an MAI (Member of the Appraisal
Institute) designated appraiser familiar with both subdivisions. The MAI designation is the most
highly regarded designation in the appraisal industry and is achieved through successfully
completing rigorous real estate valuation courses and passing a two-day comprehensive
examination with emphasis in real estate valuation matters. In addition, an MAI candidate must
complete a compressive demonstration appraisal report that scientifically proves a particular
property’s market value by using the income, cost, and sales comparison approaches to real estate
valuation.
Community Amenities
The subject will offer a park as a community amenity equipped with bar-b-ques and playground
equipment. The comparable subdivisions also offer these amenities. No other amenities were
observed within the comparable subdivisions; therefore, adjustments are not merited in this
regard.
73
Model-by-Model Comparison
A model-by-model comparison is used to arrive at the market value of the base units of each floor
plan. Tables 32 thru 38 that follow present adjustment grids for the seven base units followed by a
discussion of the concluded values for each floor plan.
Table 32 Floor Plan 1 Adjustment Analysis
Base Value Conclusion – Plan 1
Three houses from the data set were compared to this plan. The data set had prices before
adjustment ranging from a low of $172,490 to a high of $243,470. After adjustment, the sales had
home price indications ranging from a low of $165,053 to a high of $200,428. Based upon the
range observed in the market, the availability of USDA financing within the City of Lemoore, the
SubjectProject Name Tract 791Ci ty Lemoore Hanford Hanford, CA LemooreMerchant Bui lder Wathen Castanos
Base Sales Price ~ $172,490 $243,470 $219,000Price per SF ~ $127.11 $144.58 $129.28Sale Date Appraisal Aug-11 Aug-11 Aug-11Terms Cash EquivalentSale Condi tions At M arket At M arket At M arket At M arketProperty Rights Fee Simple Fee Simple Fee Simple Fee SimpleAdjusted Price ~ $172,490 $243,470 $219,000Adjust. Price/SqFt ~ $127.11 $144.58 $129.28Living Area (SF) 1,380 1,357 $1,265 1,684 -$16,720 1,694 -$17,270Bed/Bath 3/2 3/2 3/2 3/2No of Stories 1 1 1 1Garage Spaces 2 2 2 2Construction Qual i ty Average Inferior $10,000 Similar SimilarDesign/Appeal Good Good Superior -$12,000 GoodYear Bui l t ~ 2011 2011 2011Location Average Superior -$15,000 Superior -$15,000 SimilarSi te Size (SF) 5,566 6,800 -$3,702 6,500 -$2,802 6,000 -$1,302Net Adjustments -$7,437 -$46,522 -$18,572Comparison Value $165,053 $196,948 $200,428Value Per SqFt $121.63 $116.95 $118.32
Cash Equivalent Cash Equivalent Cash Equivalent
Sale 2 Sale 3Plan 1
M cM illin Homes Lennar Lennar
M eridian Independence - The Legacy - The ClassicsSale 1
74
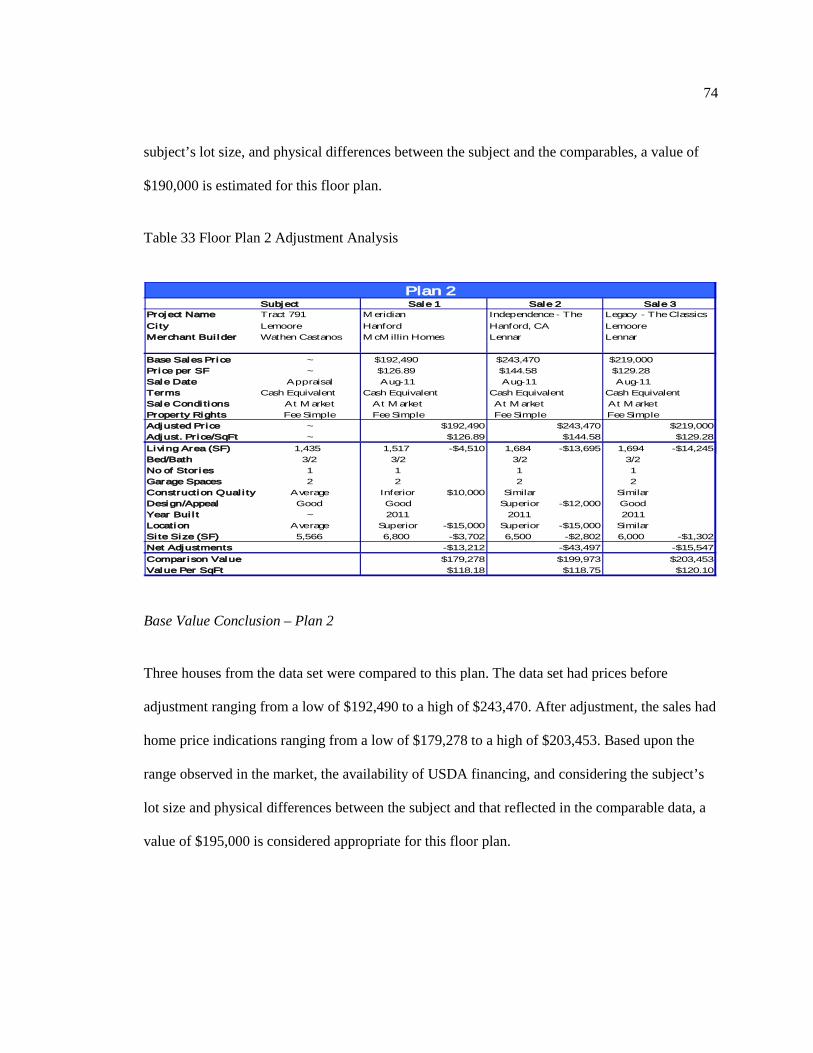
subject’s lot size, and physical differences between the subject and the comparables, a value of
$190,000 is estimated for this floor plan.
Table 33 Floor Plan 2 Adjustment Analysis
Base Value Conclusion – Plan 2
Three houses from the data set were compared to this plan. The data set had prices before
adjustment ranging from a low of $192,490 to a high of $243,470. After adjustment, the sales had
home price indications ranging from a low of $179,278 to a high of $203,453. Based upon the
range observed in the market, the availability of USDA financing, and considering the subject’s
lot size and physical differences between the subject and that reflected in the comparable data, a
value of $195,000 is considered appropriate for this floor plan.
SubjectProject Name Tract 791Ci ty Lemoore Hanford Hanford, CA LemooreMerchant Bui lder Wathen Castanos
Base Sales Price ~ $192,490 $243,470 $219,000Price per SF ~ $126.89 $144.58 $129.28Sale Date Appraisal Aug-11 Aug-11 Aug-11Terms Cash EquivalentSale Condi tions At M arket At M arket At M arket At M arketProperty Rights Fee Simple Fee Simple Fee Simple Fee SimpleAdjusted Price ~ $192,490 $243,470 $219,000Adjust. Price/SqFt ~ $126.89 $144.58 $129.28Living Area (SF) 1,435 1,517 -$4,510 1,684 -$13,695 1,694 -$14,245Bed/Bath 3/2 3/2 3/2 3/2No of Stories 1 1 1 1Garage Spaces 2 2 2 2Construction Qual i ty Average Inferior $10,000 Similar SimilarDesign/Appeal Good Good Superior -$12,000 GoodYear Bui l t ~ 2011 2011 2011Location Average Superior -$15,000 Superior -$15,000 SimilarSi te Size (SF) 5,566 6,800 -$3,702 6,500 -$2,802 6,000 -$1,302Net Adjustments -$13,212 -$43,497 -$15,547Comparison Value $179,278 $199,973 $203,453Value Per SqFt $118.18 $118.75 $120.10
Plan 2
M cM illin Homes Lennar Lennar
M eridian Independence - The Legacy - The ClassicsSale 1
Cash Equivalent Cash Equivalent Cash Equivalent
Sale 2 Sale 3
75
Table 34 Floor Plan 3 Adjustment Analysis
Base Value Conclusion – Plan 3
Four houses from the data set were compared to this plan. The data revealed prices before
adjustment ranging from a low of $192,490 to a high of $243,470. After adjustment, the sales had
home price indications ranging from a low of $189,068 to a high of $213,243. Considering the
range observed in the market, and considering the subject’s lot size and physical differences
between the subject and the comparables, a value of $205,000 is considered appropriate for this
floor plan.
SubjectProject Name Tract 791Ci ty Lemoore Hanford, CA Hanford Lemoore LemooreMerchant Bui lder Wathen Castanos
Base Sales Price ~ $243,470 $192,490 $219,000 $212,000Price per SF ~ $144.58 $126.89 $129.28 $113.07Sale Date Appraisal Aug-11 Aug-11 Aug-11 Aug-11Terms Cash EquivalentSale Condi tions At M arket At M arket At M arket At M arket At M arketProperty Rights Fee Simple Fee Simple Fee Simple Fee Simple Fee SimpleAdjusted Price ~ $243,470 $192,490 $219,000 $212,000Adjust. Price/SqFt ~ $144.58 $126.89 $129.28 $113.07Living Area (SF) 1,613 1,684 -$3,905 1,517 $5,280 1,694 -$4,455 1,875 -$14,410Bed/Bath 3/2 3/2 3/2 3/2 3/2No of Stories 1 1 1 1 1Garage Spaces 2 2 2 2 2Construction Qual i ty Average Similar Inferior $10,000 Similar SimilarDesign/Appeal Good Superior -$12,000 Good Good GoodYear Bui l t ~ 2011 2011 2011 2011Location Average Superior -$15,000 Superior -$15,000 Similar AverageSi te Size (SF) 5,566 6,500 -$2,802 6,800 -$3,702 6,000 -$1,302 8,000 -$7,302Net Adjustments -$33,707 -$3,422 -$5,757 -$21,712Comparison Value $209,763 $189,068 $213,243 $190,288Value Per SqFt $124.56 $124.63 $125.88 $101.49
Plan 3
Lennar M cM illin Homes Lennar Silver Oaks Land Co.
Independence - The M eridian Legacy - The Classics Divante VillasSale 1
Three houses from the data set were compared to this plan. The data set had prices before
adjustment ranging from a low of $190,328 to a high of $262,870. After adjustment, the sales had
home price indications ranging from a low of $185,913 to a high of $214,728. Considering the
range observed in the market, availability of USDA financing, and considering the subject’s lot
size and physical differences between the subject and the comparables, a value of $210,000 is
considered appropriate for this floor plan.
SubjectProject Name Tract 791Ci ty Lemoore Hanford Hanford, CA LemooreMerchant Bui lder Wathen Castanos
Base Sales Price ~ $190,490 $262,870 $219,000Price per SF ~ $121.72 $140.05 $129.28Sale Date Appraisal Aug-11 Aug-11 Aug-11Terms Cash EquivalentSale Condi tions At M arket At M arket At M arket At M arketProperty Rights Fee Simple Fee Simple Fee Simple Fee SimpleAdjusted Price ~ $190,490 $262,870 $219,000Adjust. Price/SqFt ~ $121.72 $140.05 $129.28Living Area (SF) 1,640 1,565 $4,125 1,877 -$13,035 1,694 -$2,970Bed/Bath 4/2 4/2 4/2 3/2No of Stories 1 1 1 1Garage Spaces 2 2 3 -$5,000 2Construction Qual i ty Average Inferior $10,000 Superior -$13,000 SimilarDesign/Appeal Good Good Good GoodYear Bui l t 2011 2011 2011 2011Location Average Superior -$15,000 Superior -$15,000 SimilarSi te Size (SF) 5,566 6,800 -$3,702 6,500 -$2,802 6,000 -$1,302Net Adjustments -$4,577 -$48,837 -$4,272Comparison Value $185,913 $214,033 $214,728Value Per SqFt $118.79 $114.03 $126.76
Cash Equivalent Cash Equivalent Cash Equivalent
Sale 1 Sale 2 Sale 3Plan 4
M cM illin Homes Lennar Lennar
M eridian Independence - The Legacy - The Classics
77
Table 36 Floor Plan 5 Adjustment Analysis
Base Value Conclusion – Plan 5
Three houses from the data set were compared to this plan. The data set had prices before
adjustment ranging from a low of $202,290 to a high of $262,870. After adjustment, the sales had
home price indications ranging from a low of $194,393 to a high of $222,868. Considering the
range observed in the market, and considering the subject’s lot size and physical differences
between the subject and the comparables, a value of $215,000 is considered appropriate for this
floor plan.
SubjectProject Name Tract 791Ci ty Lemoore Lemoore Hanford Hanford, CAMerchant Bui lder Wathen Castanos
Base Sales Price ~ $219,000 $202,490 $262,870Price per SF ~ $129.28 $113.95 $140.05Sale Date Appraisal Aug-11 Aug-11 Aug-11Terms Cash EquivalentSale Condi tions At M arket At M arket At M arket At M arketProperty Rights Fee Simple Fee Simple Fee Simple Fee SimpleAdjusted Price ~ $219,000 $202,490 $262,870Adjust. Price/SqFt ~ $129.28 $113.95 $140.05Living Area (SF) 1,788 1,694 $5,170 1,777 $605 1,877 -$4,895Bed/Bath 4/2 3/2 4/2 4/2No of Stories 1 1 1 1Garage Spaces 2 2 2 3 -$5,000Construction Qual i ty Average Similar Inferior $10,000 SimilarDesign/Appeal Good Good Good Superior -$13,000Year Bui l t 2011 2011 2011 2011Location Average Similar Superior -$15,000 Superior -$15,000Si te Size (SF) 5,566 6,000 -$1,302 6,800 -$3,702 6,500 -$2,802Net Adjustments $3,868 -$8,097 -$40,697Comparison Value $222,868 $194,393 $222,173Value Per SqFt $131.56 $109.39 $118.37
Plan 5
Lennar M cM illin Homes Lennar
Legacy - The Classics M eridian Independence - The Sale 1
Cash Equivalent Cash Equivalent Cash Equivalent
Sale 2 Sale 3
78
Table 37 Floor Plan 6 Adjustment Analysis
Base Value Conclusion – Plan 6
Three houses from the data set were compared to this plan. The data set had prices before
adjustment ranging from a low of $202,490 to a high of $267,720. After adjustment, the sales had
home price indications ranging from a low of $202,693 to a high of $233,558. Considering the
range observed in the market, the availability of USDA financing, and considering the subject’s
lot size and physical differences between the subject and the comparables, a value of $225,000 is
considered appropriate for this floor plan.
SubjectProject Name Tract 791Ci ty Lemoore Hanford Hanford, CA LemooreMerchant Bui lder Wathen Castanos
Base Sales Price ~ $202,490 $267,720 $234,000Price per SF ~ $113.95 $133.86 $122.83Sale Date Appraisal Aug-11 Aug-11 Aug-11Terms Cash EquivalentSale Condi tions At M arket At M arket At M arket At M arketProperty Rights Fee Simple Fee Simple Fee Simple Fee SimpleAdjusted Price ~ $202,490 $267,720 $234,000Adjust. Price/SqFt ~ $113.95 $133.86 $122.83Living Area (SF) 1,848 1,777 $3,905 2,000 -$8,360 1,905 -$3,135Bed/Bath 4/3 4/2 $5,000 4/2 $5,000 4/3No of Stories 2 1 1 1Garage Spaces 2 2 2 2Construction Qual i ty Average Inferior $10,000 Similar SimilarDesign/Appeal Good Good Superior -$13,000 GoodYear Bui l t 2011 2011 2011 2011Location Average Superior -$15,000 Superior -$15,000 SimilarSi te Size (SF) 5,566 6,800 -$3,702 6,500 -$2,802 6,000 -$1,302Net Adjustments $203 -$34,162 -$4,437Comparison Value $202,693 $233,558 $229,563Value Per SqFt $114.06 $116.78 $120.51
Cash Equivalent Cash Equivalent Cash Equivalent
Sale 1 Sale 2 Sale 3Plan 6
M cM illin Homes Lennar Lennar
M eridian Independence - The Legacy - The Classics
79
Table 38 Floor Plan 7 Adjustment Analysis
Base Value Conclusion – Plan 7
Three houses from the data set were compared to this plan. The data set had prices before
adjustment ranging from a low of $162,593 to a high of $285,000. After adjustment, the sales had
home price indications ranging from a low of $205,646 to a high of $267,543. Considering the
range observed in the market, the availability of USDA financing, and considering the subject’s
lot size and physical differences between the subject and the comparables, a value of $255,000 is
considered appropriate for this floor plan.
The proposed homes should be priced as set forth in Table 39 below.
SubjectProject Name Tract 791Ci ty Lemoore Lemoore Hanford, CA LemooreMerchant Bui lder Wathen Castanos
Base Sales Price ~ $285,000 $267,720 $265,000Price per SF ~ $111.50 $133.86 $119.21Sale Date Appraisal Aug-11 Aug-11 Aug-11Terms Cash EquivalentSale Condi tions At M arket At M arket At M arket At M arketProperty Rights Fee Simple Fee Simple Fee Simple Fee SimpleAdjusted Price ~ $285,000 $267,720 $265,000Adjust. Price/SqFt ~ $111.50 $133.86 $119.21Living Area (SF) 2,202 2,556 -$19,470 2,000 $11,110 2,223 -$1,155Bed/Bath 4/3 4/3 4/2 $5,000 4/3No of Stories 2 1 1 1Garage Spaces 3 3 2 $4,000 2 $5,000Construction Qual i ty Average Similar Similar SimilarDesign/Appeal Good Good Superior -$13,000 GoodYear Bui l t 2011 2011 2011 2011Location Average Similar Superior -$15,000 SimilarSi te Size (SF) 5,566 8,000 -$7,302 6,500 -$2,802 6,000 -$1,302Net Adjustments -$26,772 -$10,692 $2,543Comparison Value $258,228 $257,028 $267,543Value Per SqFt $101.03 $128.51 $120.35
Plan 7
Silver Oaks Land Co. Lennar Lennar
Divante Villas Independence - The Legacy - The Classics
In this section, I first discuss the base assumptions that will be used in the investment analysis.
Specifically, I address absorption, discount rates, cost estimates, and construction financing.
Next, I offer a cash flow analysis of the project and measures of the project’s anticipated financial
performance.
The subdivision is marketed for sale for $300,000, or roughly $3,704 per lot. The analysis
assumes the site acquisition cost is financed with owner’s equity. The estimated remaining cost to
complete the lots is $1,555,260, or $19,200 per lot, and is assumed to be partially financed by a
construction loan. The cost to complete the subdivision in addition to the land acquisition price
equates to nearly $23,000 per lot, which falls into the range of $20,000 to $30,000 per finished lot
value indicated in the market participant discussion section presented earlier in this report.
Several construction bids were submitted from various contractors to estimate the remaining site
development cost. The bids were aggregated to determine the total site work cost assumption for
the analysis and are summarize in Table 40 below.
82
Table 40 Remaining Site Work Costs
Based on information provided from contractors, construction of the site improvements can be
completed within two months after starting. After completion, model and retail homes will be
constructed. Per conversations an interested homebuilder, four model homes should be
constructed at an estimated additional cost of $65,000 on average to build than the average base
floor plan. The model homes are more costly to build since they are constructed with superior
upgrades to lure and entice homebuyers to purchase retail homes. I have assumed that the model
homes will sell for $245,000 on average during the last quarter of the project’s life since they are
equipped with significant upgrades.
Storm Drain, Park $19,017Outlots C Park landscaping $135,607Outlots A, B, C Grading $7,000Outlots C Park Concrete $8,008Street Improvements $342,335Sewer repair &services $72,544Sewer Dewater $72,000Storm Drain $60,643Water $23,767Concrete $182,234Dry Utilities $388,053Lift station Pump and sump( with dewatering) $119,500Storm Drain extention to City lift station $25,000Pads import and recertification afer stripping $25,000Clean Storm drain system $5,000Air test and repair potential sewer locations (T&M) $3,000Mail boxes $10,000Out lots A, B $56,553
Total Improvement Cost $1,555,260
Descr iption of Work
83
Direct Costs, Indirect Costs, Permits & Fees
Over the past year, my observations have revealed that construction costs of houses have been
steadily decreasing. Direct costs for the construction of houses include the materials and labor.
Indirect costs include expenses such as engineering, architecture, general conditions, insurance,
model cleaning, overhead, warranty expenses, and management fees. Moreover, regulatory
permits and fees include development impact fees as well as building permit costs and other
charges and factored into the analysis.
Direct cost estimates for each floor plan were provided a builder that is interested in purchasing
the lots. These costs will be employed in the analysis. Indirect costs are estimated to amount to 30
percent of hard costs, which is a conservative estimate. My conversations with homes builders
suggested indirect costs generally range from 20% to 30% of hard costs. I also included the cost
of permits and fees, whichwere provided by the City of Lemoore Public Works Department. The
developer’s costs of constructing each anticipated floor plan is illustrated in Table 41 below.
Table 41 Construction Cost Estimates for 7 Floor Plans
Plan No. 1 2 3 4 5 6 7 Average x 81 LotsLiving Area (SF) 1,380 1,435 1,613 1,640 1,788 1,848 2,202 1,701Direct Costs
Direct Construction 72,453$ 82,643$ 88,784$ 81,372.31 94,027$ 90,606$ $115,661 89,364$ 7,238,461$ Subtotal Direct Costs 72,453$ 82,643$ 88,784$ 81,372$ 94,027$ 90,606$ $115,661 89,364$ 7,238,461$ Indirect Costs
Building Permits and Other Fees 11,533$ 11,533$ 12,782$ 12,782$ 12,782$ 14,768$ 14,768$ 12,993$ 1,052,398$ Other Indirect Costs (30% of Direct Costs) $21,736 $24,793 $26,635 $24,412 $28,208 $27,182 $34,698 $26,809 $2,171,538
The financial feasibility of the subdivision is determined from the developer’s perspective based
on whether the sales revenue will exceed the acquisition and construction costs of the project in
addition to interest and other costs as indicated above. To explore the project’s profitability, a
statement of cash flows has been prepared. I estimated the inflow based on the average sale price
of the floor plans and loan draws while the outflows includes the development and construction
costs, site acquisition, closing costs, financing costs, administrative expenses, marketing, etc.
A prospective developer will have a negative cash flow during the first two quarters. However,
the stream of estimated cash flows generates a 145.52 percent IRR. The net present value
discounted at the required rate of return of 25 percent is $1,503,353, which suggests that the
project is exceptionally profitable. This section of the analysis is considered to be the “most-
likely” scenario as it relies on assumptions that are substantiated by the market analysis and
marketability analysis in Chapters 2 and 3, respectively. Additionally, the lender’s yield is
estimated to be 11.25 percent which is also indicative of a financially feasibility project.
Sensitivity Analysis
Although the project appears to be financially feasible under reasonably conservative
assumptions, I have prepared a sensitivity analysis whichaccounts for changes market conditions.
In addition to the “most likely” scenario, I offer a pessimistic scenario and an optimistic scenario,
as demonstrated in Tables 47 and 48, respectively, that employs several different assumptions in
the analysis. Specifically, for the pessimistic scenario, I assumed absorption is three homes per
month and the average base price is reduced to $200,000 per home. The slower absorption rate
added an additional 2 quarters to the life of the project. In the optimistic scenario, I assumed
absorption of six units per month and maintained the average estimated selling price. The
increased absorption reduced the project’s life by 2 quarters.
95
Table 47 Pessimistic Scenario
Table 47 shows a significant decline in the IRR and net present value when compared to the
previous scenarios; however, it still reflects a highly profitable investment opportunity. The IRR
is estimated to be 74.77 percent and the net present value is $886,740 when using a discount rate
Quarter0
12
34
56
78
910
Inflow:Sales
$0$600,000
$1,800,000$1,800,000
$1,800,000$1,800,000
$1,800,000$1,800,000
$1,870,000$1,905,000
$1,340,000Loan Draw
700,0001,700,000
00
00
00
00
0Interest Draw
032,408
47,2660
00
00
00
0Total Inflow
$700,000$2,332,408
$1,847,266$1,800,000
$1,800,000$1,800,000
$1,800,000$1,800,000
$1,870,000$1,905,000
$1,340,000
Outflows:Site Purch.
$300,000Cost to Finish
777,630777,630
Closing9,000
Construction Costs1,551,654
$ 1,162,489
$ 1,162,489
$ 1,162,489
$ 1,162,489
$ 1,162,489
$ 1,162,489
$ 1,162,489
$ 1,162,489
$ 774,992
$ Property Tax
10,4628,912
6,5874,262
1,9370
Loan Fee36,237
Loan Pmt.0
174,114522,343
522,343522,343
522,343295,485
00
00
Interest Cost0
32,40847,266
00
00
00
00
Admin10,000
10,00010,000
10,00010,000
10,00010,000
10,00010,000
10,00010,000
Sales Exp.30,000
90,00090,000
90,00090,000
90,00090,000
93,50095,250
67,000Total Outflow
$1,143,329$2,575,806
$1,841,010$1,784,831
$1,791,419$1,784,831
$1,562,235$1,262,489
$1,267,926$1,267,739
$851,992
Net Cash($443,329)
($243,398)$6,257
$15,169$8,581
$15,169$237,765
$537,511$602,074
$637,261$488,008
Net Present Value886,740
25%discount rate
Internal Rate of Return74.77%
DEVELOPER'S CASH FLOW, NPV AND IRR (Pessimistic)
96
of 25%. The IRR fell significantlyin this scenario compared to the “most likely” scenario because
the recovery of the investment and profit is realized over a longer period. The NPV also declined
as the majority of the cash flows are realized later in the life of the project and are more heavily
discounted. Under this scenario, the equity investment required is the sum of the negative cash
flows, which is $686,727. Moreover, this scenario indicates that the project will generate minimal
cash flow for the first 5 quarters, which may be difficult for a prospective developer to endure.
Because of the increased absorption period, the scenario suggests a greater interest carry expense.
However, my conversations with a professional in the lending industry suggested that this project
may achieve a loan to cost ratio of 60 percent to 65 percent. I have underwritten the loan well
below this loan to cost range, which suggests debt financing can be structured to offer greater
proceeds during the first 5 quarters of the project. Next, I present the optimistic scenario.
97
Table 48 Optimistic Scenario
Table 48 shows a gain in the IRR and net present value when compared to the previous scenarios
and reflect an even more profitable investment opportunity. The IRR is estimated to be 219.43
percent and the net present value is $1,763,446 when using a discount rate of 25%. The total
Quarter0
12
34
56
Inflow:Sales
$0$1,260,000
$3,780,000$3,780,000
$3,780,000$3,815,000
$735,000Loan Draw
700,0001,700,000
00
00
0Interest Draw
015,789
00
00
0Total Inflow
$700,000$2,975,789
$3,780,000$3,780,000
$3,780,000$3,815,000
$735,000
Outflows:Site Purch.
$300,000Cost to Finish
777,630777,630
Closing9,000
Construction Costs2,068,316
$ 2,324,977
$ 2,324,977
$ 2,324,977
$ 2,324,977
$ 387,496
$ Property Tax
10,4627,362
2,7120
Loan Fee36,237
Loan Pmt.262,160
786,481786,481
676,2130
0Interest Cost
015,789
00
00
0Admin
10,00010,000
10,00010,000
10,00010,000
10,000Sales Exp.
63,000189,000
189,000189,000
190,75036,750
Total Outflow$1,143,329
$3,196,895$3,317,821
$3,310,458$3,202,902
$2,525,727$434,246
Net Cash($443,329)
($221,106)$462,179
$469,542$577,098
$1,289,273$300,754
Net Present Value1,763,446
25%discount rate
Internal Rate of Return219.43%
DEVELOPER'S CASH FLOW, NPV AND IRR (Optimistic)
98
equity investment is estimated to be the sum of the negative cash flow, which is $664,435. The
IRR is significantly higher in this scenario largely because the analysis assumes that the
investment and profit is recovered faster than in the previous scenarios. Moreover, the NPV is
also higher since the positive cash flows are realized earlier in the life of the project and are not
discounted as heavily as in previous scenarios. This concludes the investment analysis.
Investment Summary
A summary of the results of from the investment analysis is provided in Table 49 below.
Table 49 Investment Summary
Measure Most Likely Pessimistic Optimistic
NPV $1,503,353 $886,740 $1,763,446
IRR 145.52% 74.77% 219.43%
99
Chapter 6
CONCLUSION
The project is an 81- unit subdivision located in the City of Lemoore, California. It has all public
approvals and has been substantially improved, though additional infrastructure improvements
are needed prior to constructing vertical improvements. The lots range from 4,362 square feet to
9,914 square feet in size with an average lot size measured at 5,566 square feet one and are
approved to host seven different floor plans ranging in size from 1,380 square feet to 2,200 square
feet. The subject site can be purchased for $300,000. This study took into account the remaining
site costs, the utility of the site, the market area, the marketability of the proposed subdivision
homes, and analyzed the profitability of investment in the site.
Based on my site analysis, the physical characteristics of the site appear to be adequate for
subdivision development and offers utility commensurate with competing subdivisions.
Moreover, the site benefits from convenient access to commercial amenities and freeways, and is
well servedby other public amenities. It is also within close proximity to the City of Fresno,
which will serve as a significant employment base for the subject future residents. Bids for the
remaining site work were collected from several contractors and were aggregated to determine
the total remaining site costs, which is approximately $1.5 million. No adverse environmental
issues were observed and soils are reported to be supportive of the proposed floor plans. Based on
my observations and due diligence undertaken, the site is adequate for subdivision development.
After analyzing the site, I provided a market analysis that looked at the economic and
demographic trends in Kings County as well as the subject site’s immediate areas. Data revealed
100
moderate-income levels countywide; however, economic and demographic data associated with
the subject’s immediate area was indicative of characteristics that are more favorable.
Specifically, current household income, estimated income growth, and median home values were
higher on average when compared to Kings County as a whole. Additionally, the number of
vacant housing units is relatively lower in the immediate area than in the County as well as the
State, which may be a result more economic stability afforded by the Naval Air Base.
Next, I prepared a marketability study that analyzed the competitive market area. I underwent
numerous interviews of market participants, inspected competing subdivisions, collected data
related to competing subdivisions, and gathered absorption data. With the results of my
interviews and by observations of competing subdivision, I was able to prepare a well-honed
valuation of the proposed floor plans and determine appropriate pricing relative to absorption.
My findings from the market study, marketability study, and site analysis offered a solid basis for
the assumptions used in my investment analysis. In this analysis, I explored the financial
feasibility of investing in the subject site while considering changes in market conditions. Three
cash flow summaries were provided: a pessimistic scenario, a “most-likely” scenario, and an
optimistic scenario. All three scenarios indicated that investing in the subject site would be
lucrative and all offered NPVs significantly higher than 0 when discounted at 25 percent.
Moreover, these NPVs and were supported by IRRs ranging from approximately 75 percent to
nearly 220 percent.Based upon my findings, I recommend that a qualified builder/developer
invest in the remaining site improvements and construction of retail homes.
101
BIBLIOGRAPHY Assessor, Kings County.(2011). Assessors Tax Roll. December 2009. http://www.countyofkings.com/acr/assessor/index.html U. S. Census Bureau. (2010). Population Quickfacts:City of Hanford, CA. Retrieved November 16, 2011, from http://quickfacts.census.gov/qfd/states/06/0631960.html Brueggeman, William E., and Jeffrey Fisher.Real Estate Finance and Investments. 12nd edition. McGraw-Hill Higher Education, 2005. California Employment Development Department.(2011). Labor Market Information. June 2011. Retrieve from:http://www.labormarketinfo.edd.ca.gov/cgi/dataanalysis/areaselection.asp?tablename=labforce; http://www.calmis.ca.gov/file/lfmonth/calpr.pdf; http://www.labormarketinfo.edd.ca.gov/majorer/majorer.asp California Department of Finance. (2011). Demographic, Economic, and Financial Research. October 10, 2011. Retrieve from:http://www.dof.ca.gov/Research/Research.php Case Schiller.(2011). S&P/Case Schiller Home Price Indices. July 31, 2011. Retrieve: http://www.standardandpoors.com/indices/sp-case-shiller-home-price-indices/en/us/?indexId=spusa-cashpidff--p-us---- Federal Emergency Management Agency.(2009). Flood Insurance Rate Maps, Community Panel No. 060089-0167C effective June 16, 2009. Retrieved: http://msc.fema.gov/webapp/wcs/stores/servlet/FemaWelcomeView?storeId=10001&catalogId=10001&langId=-1 Google Maps. (2011). October 13, 2011. Retrieve:http://maps.google.com/maps Hill, Laura and Johnson, Hans.(2011). “Unauthorized Immigrants in California.”Estimates for Counties.Public Policy Institute of California. Retrieve: http://www.ppic.org/content/pubs/report/R_711LHR.pdf Krazan& Associates.(2004). Geotechnical Engineering Division.Study of Proposed East Villages Subdivision. September 22, 2004 MoneyCafe.com. (2011).Prime Rate. November 2011. http://www.moneycafe.com/library/prime.htm
Multiple Listing Service1. (2011). Survey, July 2011. Retrieve from:http://www.prospector.metrolist.net/ Realty Rates1.(2011). Developers Survey, May 2011. www.realtyrates.com STDB.com1.(2011). August 20, 2011.http://www.stdb.com The Gregory Group1.(2011). Community Profile Report. August 20, 2011. Retrieve from: http://www.thegregorygroup.com WathenCastanos. (2011). East Villages in Lemoore. August 2011. Retrieve from: http://www.wathen-castanos.com 1Access to this website requires a paid subscription