Feasibility Study for Small-Scale Ethanol Production in Minnesota Submitted To: AURI Jennifer Wagner-Lahr 1501 State Street Marshall, MN 56528 Date Submitted: April 9, 2009 PREPARED BY: BBI International Engineering & Consulting 300 Union Blvd., Suite 325 Lakewood, CO 80228 www.bbiinternational.com CONTACT PERSON: Jeff Coombe Manager of Technical Studies Ph. (303) 526-5655 [email protected]This report is the property of AURI and cannot be disclosed or reproduced in whole or in part without the written permission AURI.
Transcript
Feasibility Study for Small-Scale Ethanol Production in Minnesota
Submitted To: AURI Jennifer Wagner-Lahr
1501 State Street Marshall, MN 56528
Date Submitted: April 9, 2009
PREPARED BY: BBI International Engineering & Consulting 300 Union Blvd., Suite 325 Lakewood, CO 80228 www.bbiinternational.com
CONTACT PERSON: Jeff Coombe Manager of Technical Studies Ph. (303) 526-5655 [email protected]
This report is the property of AURI and cannot be disclosed or reproduced in whole or in part without the written permission AURI.
AURI SMALL-SCALE ETHANOL STUDY FINAL REPORT APRIL 09
NOTICE
This report was prepared as an account of work sponsored by AURI. Neither BBI International, nor any of their employees, makes any warranty, expressed or implied, or assumes any legal liability or responsibility for the accuracy, completeness, or usefulness of any information, apparatus, product, or process disclosed, or represents that its use would not infringe privately owned rights. Reference herein to any specific commercial product, process, or service by trade name, trademark, manufacturer, or otherwise does not constitute or imply its endorsement, recommendation, or favoring by BBI International.
BBI INTERNATIONAL ii
AURI SMALL-SCALE ETHANOL STUDY FINAL REPORT APRIL 09
TABLE OF CONTENTS I. EXECUTIVE SUMMARY ............................................................................................. 1 II. PROJECT OVERVIEW ............................................................................................... 5
Purpose of Study ...................................................................................................................... 5 Scope of Work ......................................................................................................................... 5
III. PERMITTING AND REGULATORY COMPLIANCE ................................................. 6 Federal Regulations ................................................................................................................. 7 Minnesota State Regulations ................................................................................................... 9
IV. TRANSPORTATION AND SAFETY CONCERNS .................................................. 12 Safety Recommendations ...................................................................................................... 12 Process Safety Management .................................................................................................. 13 Transportation Safety and Considerations ............................................................................. 13
V. ETHANOL AND CO-PRODUCTION MARKET ANALYSIS ..................................... 15 International Markets ............................................................................................................. 15 Renewable Fuel Standard ...................................................................................................... 16
Farm Bill Provisions ......................................................................................................... 18 Current Industry ..................................................................................................................... 18 Ethanol Pricing ...................................................................................................................... 25 Small-Scale Ethanol Sales ..................................................................................................... 27 Co-Products ........................................................................................................................... 27 Distillers Grains ..................................................................................................................... 27 Carbon Dioxide ...................................................................................................................... 28 Ethanol and Co-Product Market Summary ............................................................................ 28
VI. SMALL-SCALE TECHNOLOGY PROVIDERS ....................................................... 30 VII. PLANT DESIGN, LAYOUT AND COSTS .............................................................. 32
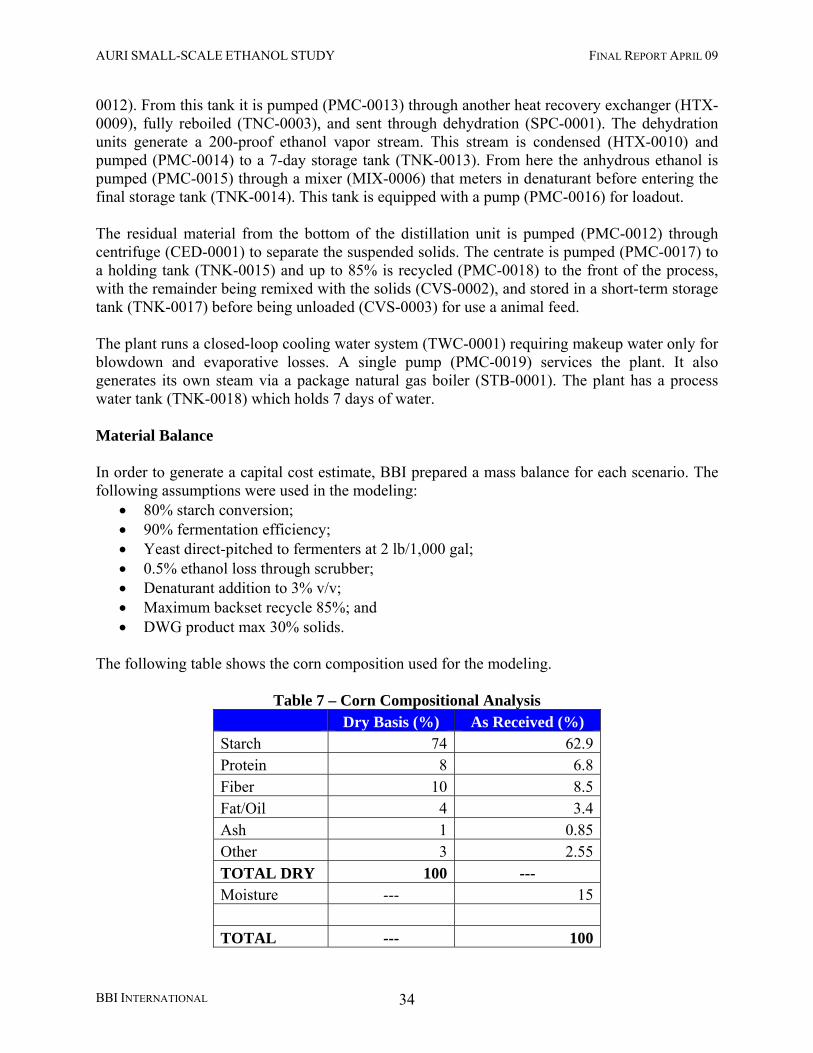
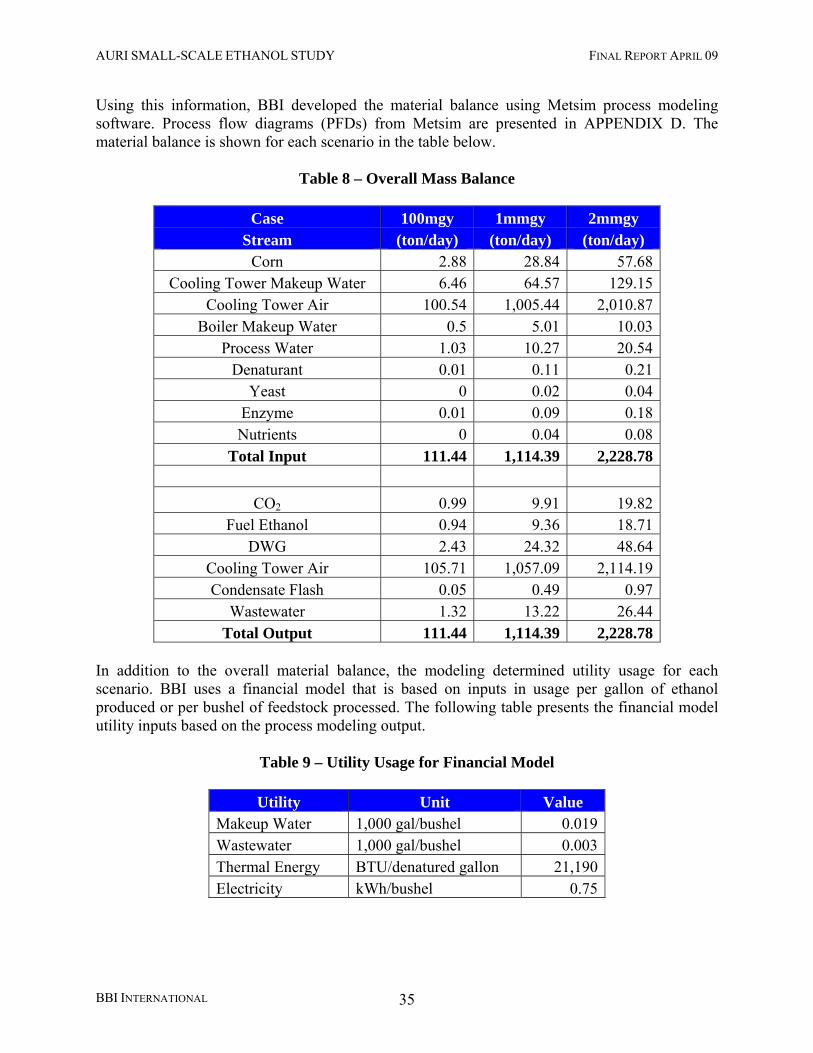
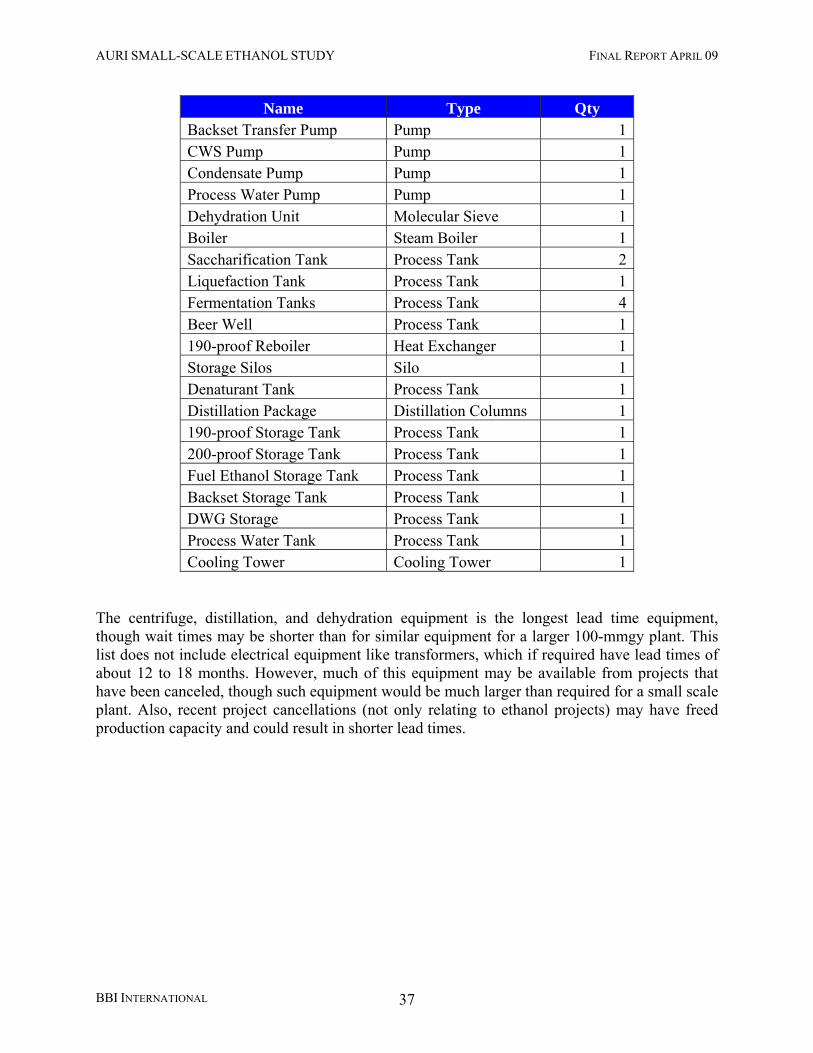
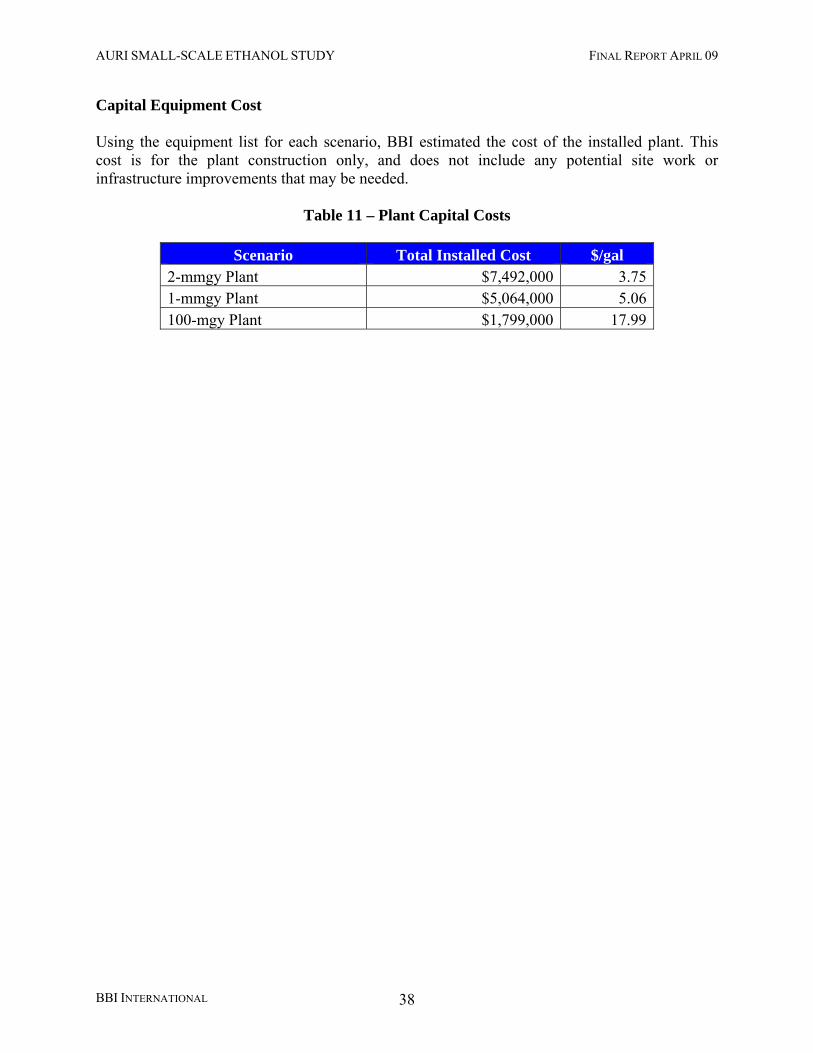
Process Description ............................................................................................................... 32 Design Basis .......................................................................................................................... 33 Material Balance .................................................................................................................... 34 Equipment List ....................................................................................................................... 36 Capital Equipment Cost ......................................................................................................... 38
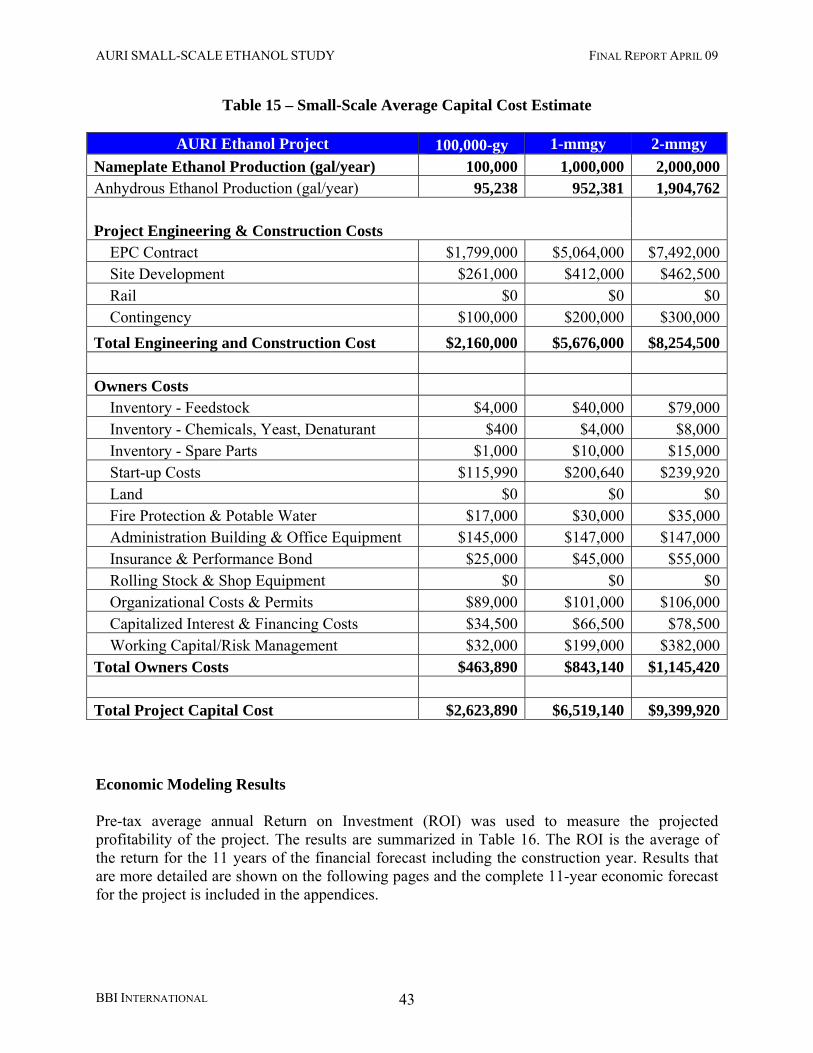
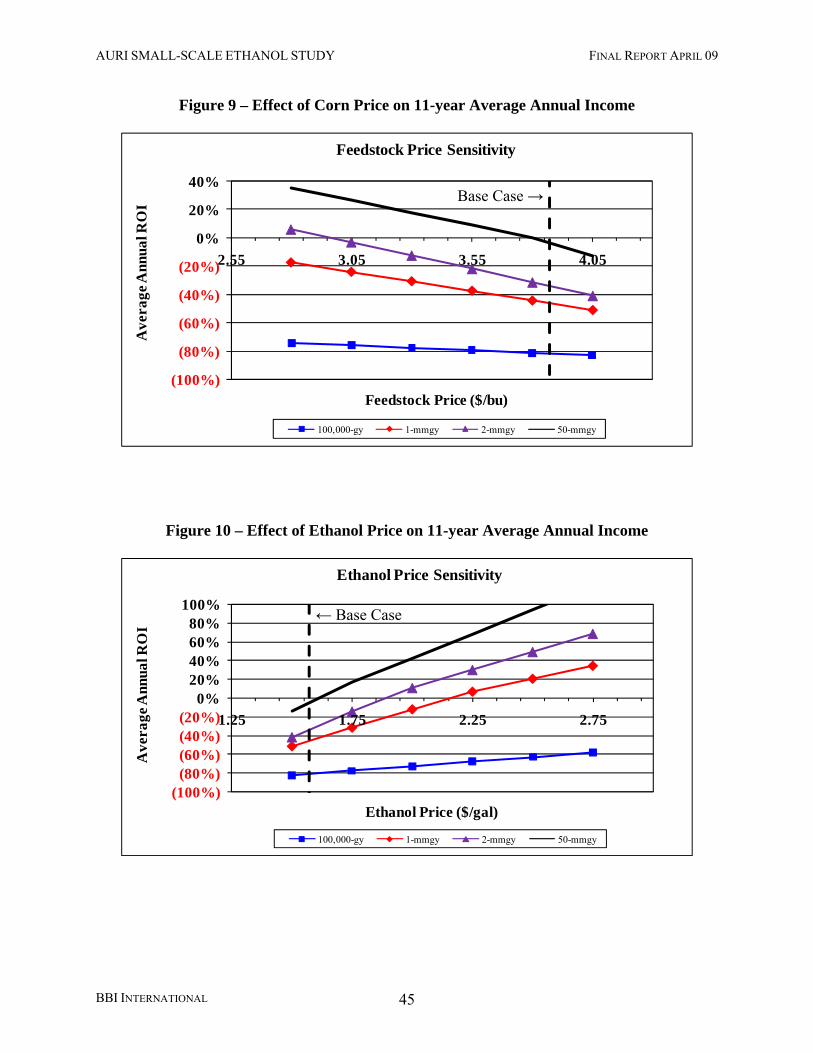
IX. REVENUE OUTLOOK AND FINANCIAL ANALYSIS ............................................. 41 Assumptions Used in the Financial Forecast ......................................................................... 41 Economic Modeling Results .................................................................................................. 43 Sensitivity and Breakeven Analysis ...................................................................................... 44 Financial Summary ................................................................................................................ 49
AURI SMALL-SCALE ETHANOL STUDY FINAL REPORT APRIL 09
BBI INTERNATIONAL iv
LIST OF TABLES Table 1 – Financial Modeling Results, Pre-tax ..................................................................................... 3 Table 2 – Air Emissions from Proposed Facilities ............................................................................... 6 Table 3 – Wastewater Discharge from Proposed Facilities .................................................................. 6 Table 4 – Ethanol Shipment Analysis ................................................................................................. 14 Table 5 – Renewable Fuels Standard Volumes (Billions of Gallons) ................................................ 17 Table 6 – Octane Ratings of Various Compounds.............................................................................. 22 Table 7 – Corn Compositional Analysis ............................................................................................. 34 Table 8 – Overall Mass Balance ......................................................................................................... 35 Table 9 – Utility Usage for Financial Model ...................................................................................... 35 Table 10 – Major Equipment List ....................................................................................................... 36 Table 11 – Plant Capital Costs ............................................................................................................ 38 Table 12 – Ethanol Plant Statistics ..................................................................................................... 39 Table 13 – Personnel Requirements for Plants ................................................................................... 40 Table 14 – Assumptions Used In the Financial Forecast .................................................................... 42 Table 15 – Small-Scale Average Capital Cost Estimate ..................................................................... 43 Table 16 – Financial Modeling Results—Fractionation ..................................................................... 44 Table 17 – Sensitivity and Breakeven Analysis for 100,000 Plant ..................................................... 48 Table 18 – Sensitivity and Breakeven Analysis for 1-mmgy Plant .................................................... 48 Table 19 – Sensitivity and Breakeven Analysis for 2-mmgy Plant .................................................... 49
LIST OF FIGURES
Figure 1 – Worldwide Ethanol Production by Continent ................................................................... 15 Figure 2 – Fuel Ethanol Plants in the U.S. (2/22/09) .......................................................................... 20 Figure 3 – H.R. 6 RFS Volumes by Year ........................................................................................... 21 Figure 4 – BBI Projected Ethanol Demand by Use ............................................................................ 24 Figure 5 – Historical Chicago Ethanol Pricing ................................................................................... 25 Figure 6 – Historic Relationship between Prices of Oil, Gas, and Ethanol (USD) ............................ 26 Figure 7 – 10 Year Monthly Price History of Corn & Ethanol .......................................................... 26 Figure 8 – Flow Diagram for Small Scale Dry Mill Ethanol Plant .................................................... 32 Figure 9 – Effect of Corn Price on 11-year Average Annual Income ................................................ 45 Figure 10 – Effect of Ethanol Price on 11-year Average Annual Income .......................................... 45 Figure 11 – Effect of DWG Price on 11-year Average Annual Income ............................................. 46 Figure 12 – Effect of Natural Gas Price on 11-year Average Annual Income ................................... 46 Figure 13 – Effect of Electricity Price on 11-year Average Annual Income ...................................... 47 Figure 14 – Effect of Capital Costs on 11-year Average Annual Income .......................................... 47
AURI SMALL-SCALE ETHANOL STUDY FINAL REPORT APRIL 09
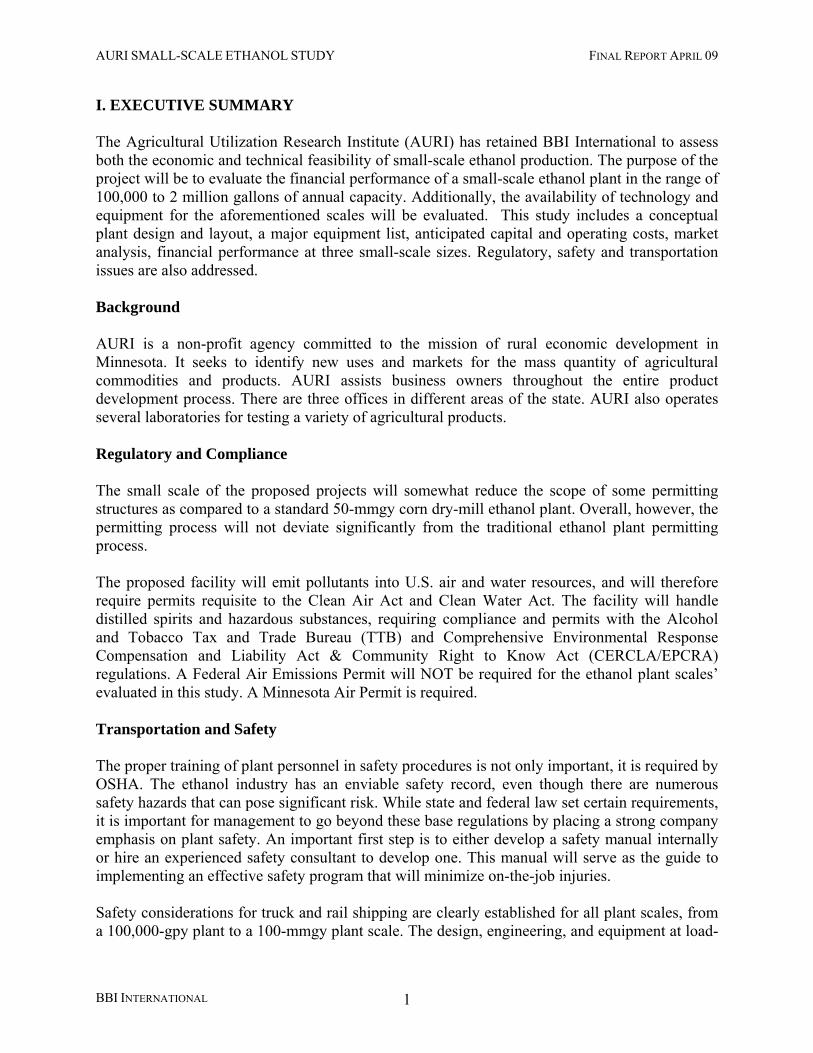
I. EXECUTIVE SUMMARY The Agricultural Utilization Research Institute (AURI) has retained BBI International to assess both the economic and technical feasibility of small-scale ethanol production. The purpose of the project will be to evaluate the financial performance of a small-scale ethanol plant in the range of 100,000 to 2 million gallons of annual capacity. Additionally, the availability of technology and equipment for the aforementioned scales will be evaluated. This study includes a conceptual plant design and layout, a major equipment list, anticipated capital and operating costs, market analysis, financial performance at three small-scale sizes. Regulatory, safety and transportation issues are also addressed. Background AURI is a non-profit agency committed to the mission of rural economic development in Minnesota. It seeks to identify new uses and markets for the mass quantity of agricultural commodities and products. AURI assists business owners throughout the entire product development process. There are three offices in different areas of the state. AURI also operates several laboratories for testing a variety of agricultural products. Regulatory and Compliance The small scale of the proposed projects will somewhat reduce the scope of some permitting structures as compared to a standard 50-mmgy corn dry-mill ethanol plant. Overall, however, the permitting process will not deviate significantly from the traditional ethanol plant permitting process. The proposed facility will emit pollutants into U.S. air and water resources, and will therefore require permits requisite to the Clean Air Act and Clean Water Act. The facility will handle distilled spirits and hazardous substances, requiring compliance and permits with the Alcohol and Tobacco Tax and Trade Bureau (TTB) and Comprehensive Environmental Response Compensation and Liability Act & Community Right to Know Act (CERCLA/EPCRA) regulations. A Federal Air Emissions Permit will NOT be required for the ethanol plant scales’ evaluated in this study. A Minnesota Air Permit is required. Transportation and Safety The proper training of plant personnel in safety procedures is not only important, it is required by OSHA. The ethanol industry has an enviable safety record, even though there are numerous safety hazards that can pose significant risk. While state and federal law set certain requirements, it is important for management to go beyond these base regulations by placing a strong company emphasis on plant safety. An important first step is to either develop a safety manual internally or hire an experienced safety consultant to develop one. This manual will serve as the guide to implementing an effective safety program that will minimize on-the-job injuries. Safety considerations for truck and rail shipping are clearly established for all plant scales, from a 100,000-gpy plant to a 100-mmgy plant scale. The design, engineering, and equipment at load-
BBI INTERNATIONAL 1
AURI SMALL-SCALE ETHANOL STUDY FINAL REPORT APRIL 09
BBI INTERNATIONAL 2
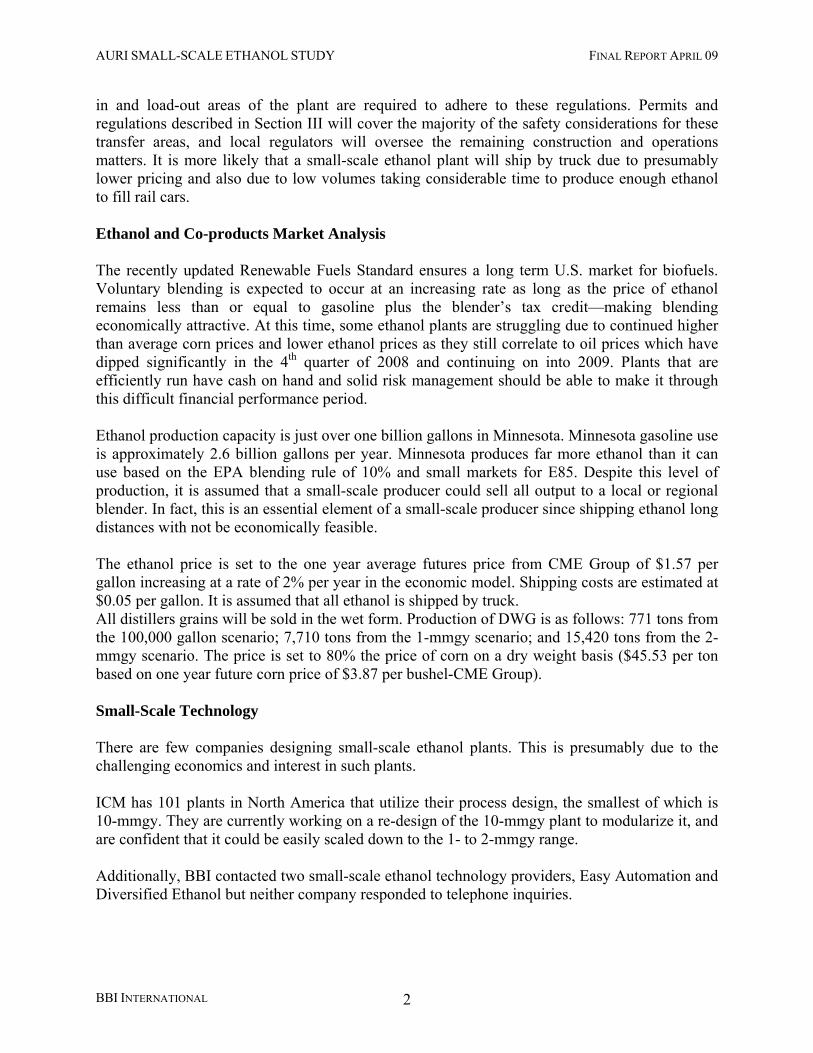
in and load-out areas of the plant are required to adhere to these regulations. Permits and regulations described in Section III will cover the majority of the safety considerations for these transfer areas, and local regulators will oversee the remaining construction and operations matters. It is more likely that a small-scale ethanol plant will ship by truck due to presumably lower pricing and also due to low volumes taking considerable time to produce enough ethanol to fill rail cars. Ethanol and Co-products Market Analysis The recently updated Renewable Fuels Standard ensures a long term U.S. market for biofuels. Voluntary blending is expected to occur at an increasing rate as long as the price of ethanol remains less than or equal to gasoline plus the blender’s tax credit—making blending economically attractive. At this time, some ethanol plants are struggling due to continued higher than average corn prices and lower ethanol prices as they still correlate to oil prices which have dipped significantly in the 4th quarter of 2008 and continuing on into 2009. Plants that are efficiently run have cash on hand and solid risk management should be able to make it through this difficult financial performance period. Ethanol production capacity is just over one billion gallons in Minnesota. Minnesota gasoline use is approximately 2.6 billion gallons per year. Minnesota produces far more ethanol than it can use based on the EPA blending rule of 10% and small markets for E85. Despite this level of production, it is assumed that a small-scale producer could sell all output to a local or regional blender. In fact, this is an essential element of a small-scale producer since shipping ethanol long distances with not be economically feasible. The ethanol price is set to the one year average futures price from CME Group of $1.57 per gallon increasing at a rate of 2% per year in the economic model. Shipping costs are estimated at $0.05 per gallon. It is assumed that all ethanol is shipped by truck. All distillers grains will be sold in the wet form. Production of DWG is as follows: 771 tons from the 100,000 gallon scenario; 7,710 tons from the 1-mmgy scenario; and 15,420 tons from the 2-mmgy scenario. The price is set to 80% the price of corn on a dry weight basis ($45.53 per ton based on one year future corn price of $3.87 per bushel-CME Group). Small-Scale Technology There are few companies designing small-scale ethanol plants. This is presumably due to the challenging economics and interest in such plants. ICM has 101 plants in North America that utilize their process design, the smallest of which is 10-mmgy. They are currently working on a re-design of the 10-mmgy plant to modularize it, and are confident that it could be easily scaled down to the 1- to 2-mmgy range. Additionally, BBI contacted two small-scale ethanol technology providers, Easy Automation and Diversified Ethanol but neither company responded to telephone inquiries.
AURI SMALL-SCALE ETHANOL STUDY FINAL REPORT APRIL 09
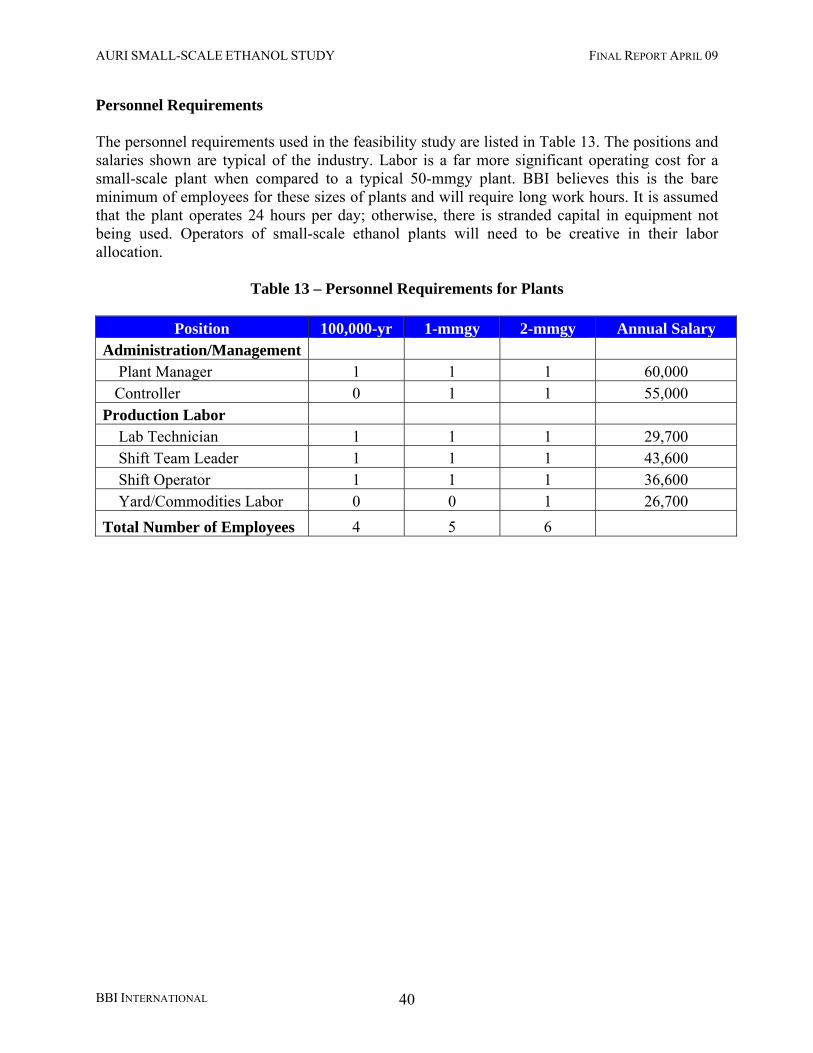
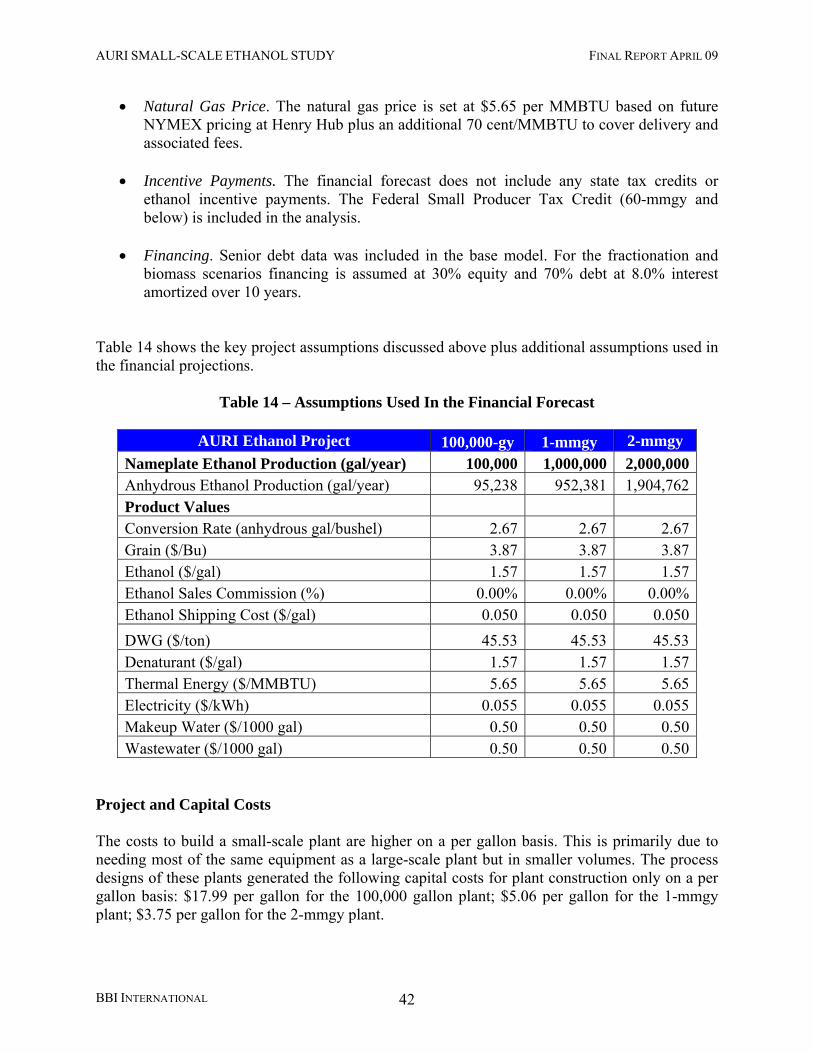
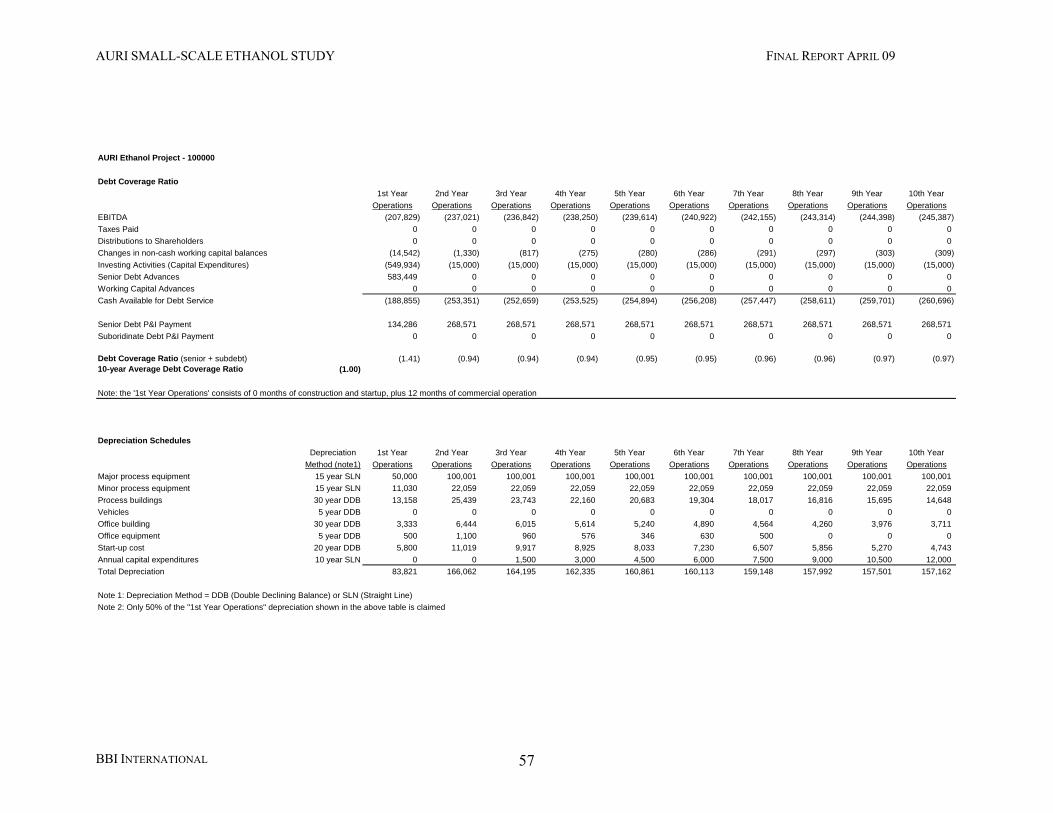
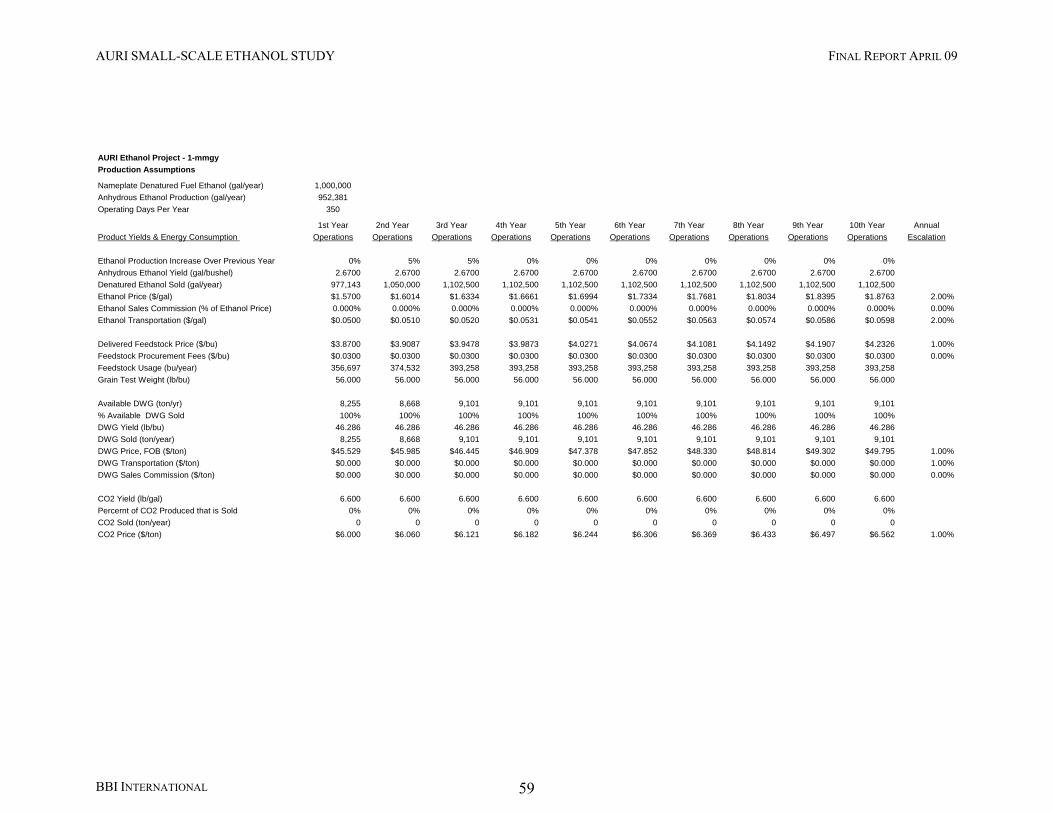
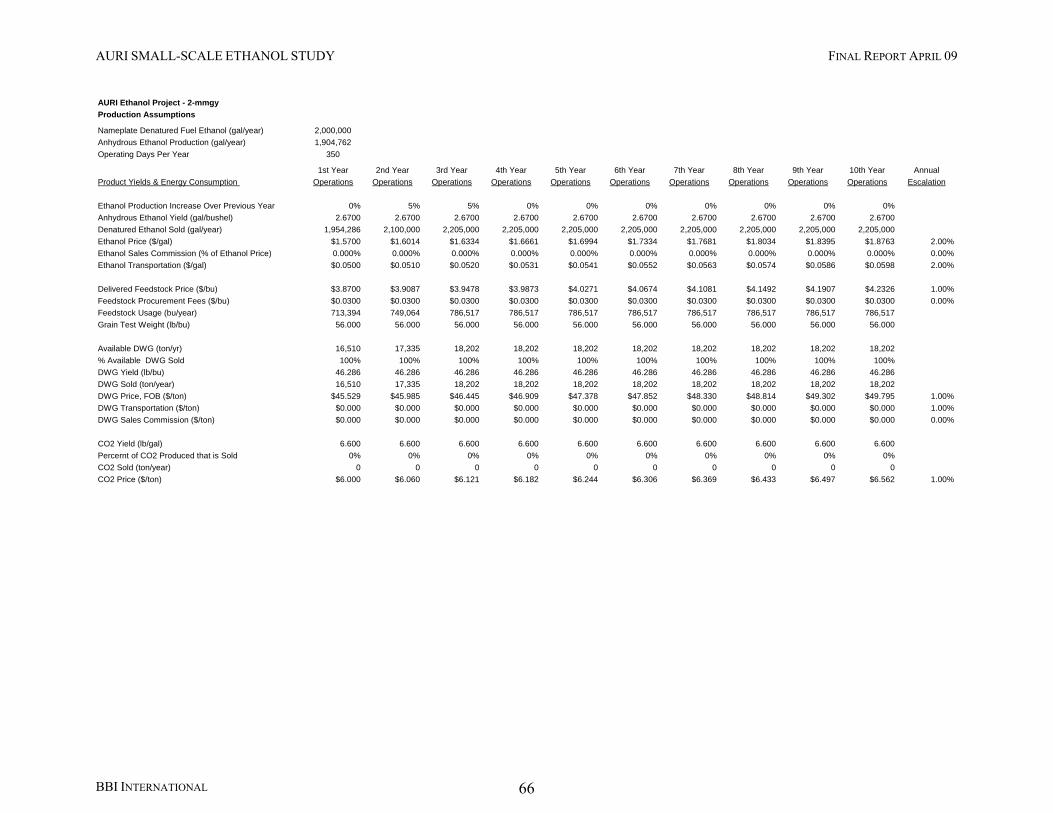
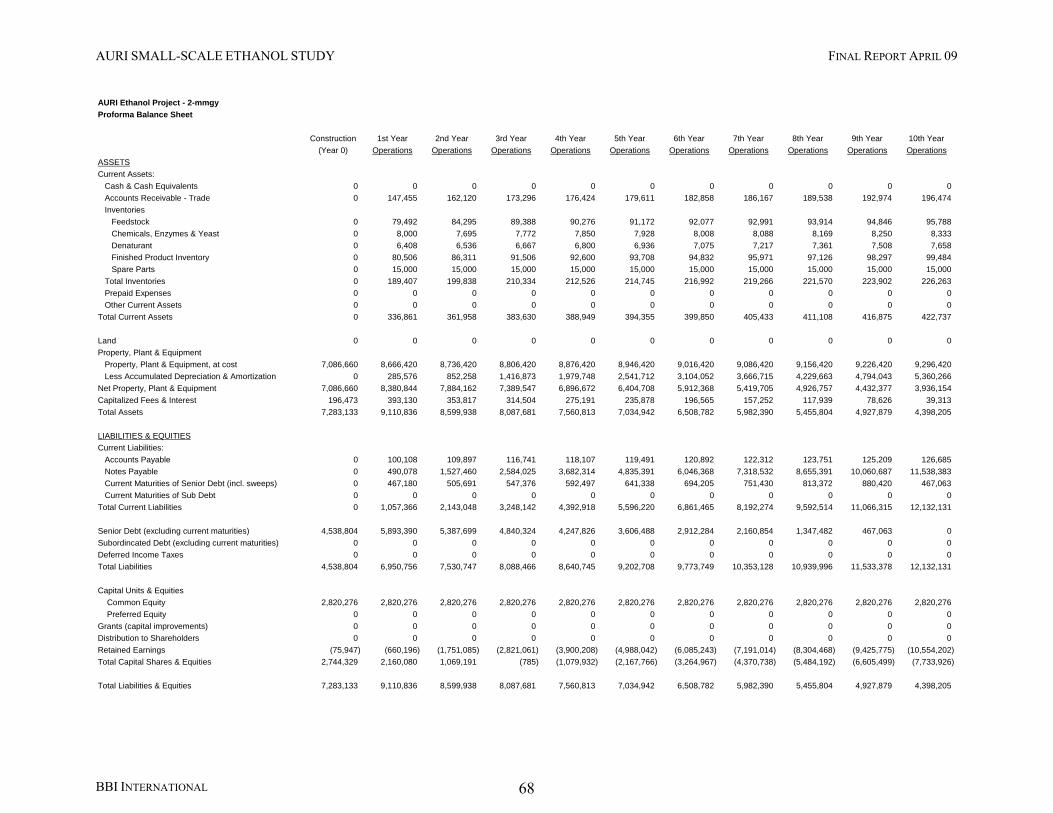
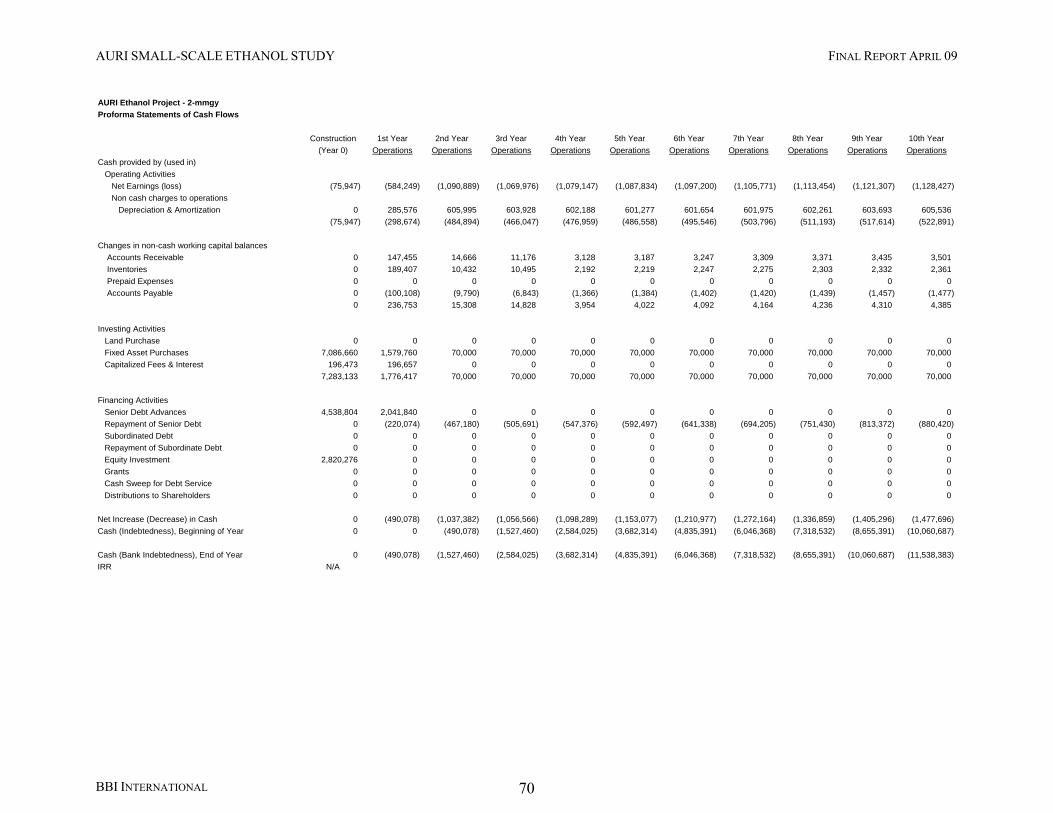
Financial Feasibility BBI prepared three financial scenarios to evaluate the performance of small-scale ethanol production at three scales. The three scales are 100,000 gallons, 1,000,000 gallons and 2,000,000 gallons of ethanol production per year. Additionally, a fourth scenario was created to observe if there was a benefit to producing 1,000,000 per year but for only half the year—this involves building a 2,000,000 gallon plant and operating it half the time. The key model inputs include product and co-product yields, product and raw material pricing, shipping costs, labor costs, energy consumption and pricing, capital costs including engineering, procurement and construction of the ethanol plant and all supporting facilities and systems, project development costs, financing costs, start-up costs, working capital and inventory costs. The BBI model produces a ten-year operating forecast for the project including a balance sheet, income statement, and cash flow statement. The complete 11-year proforma for the dry mill ethanol plants for all three scenarios are included in the appendices. The impact of critical project variables will be determined and the viability of the project with regard to each will be evaluated.
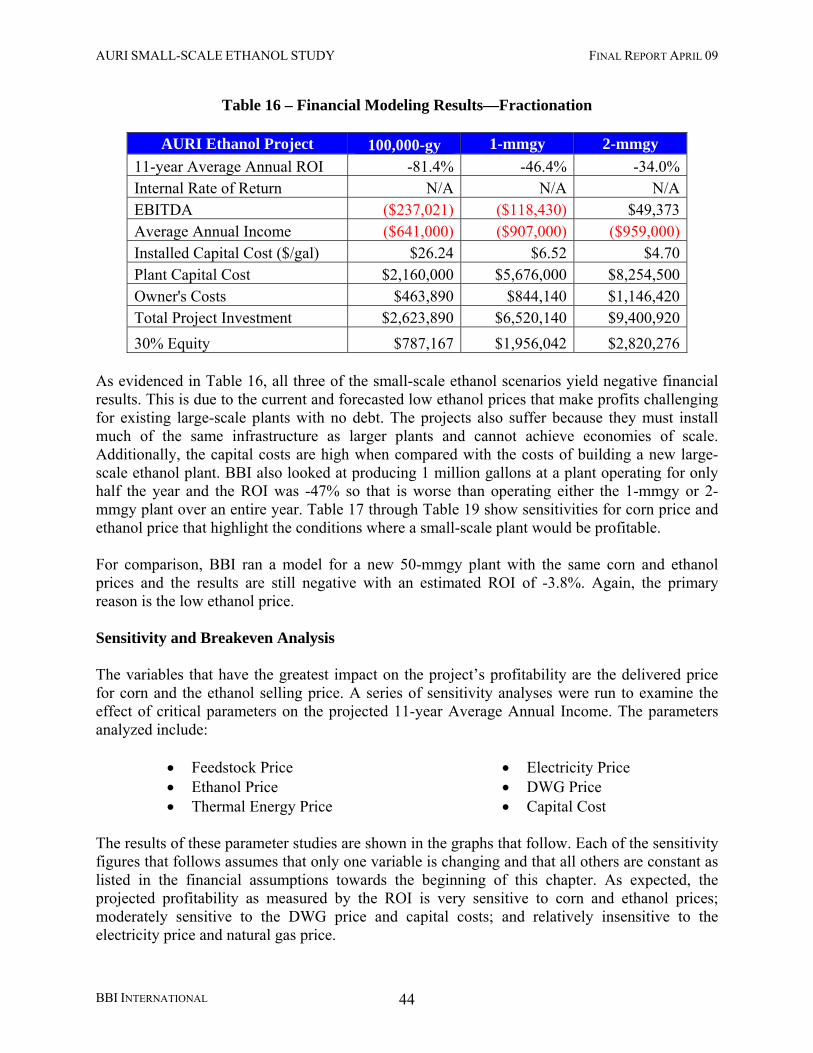
Table 1 – Financial Modeling Results, Pre-tax
AURI Ethanol Project 100,000-gy 1-mmgy 2-mmgy 11-year Average Annual ROI -81.4% -46.4% -34.0%Internal Rate of Return N/A N/A N/AEBITDA ($237,021) ($118,430) $49,373 Average Annual Income ($641,000) ($907,000) ($959,000)Installed Capital Cost ($/gal) $26.24 $6.52 $4.70 Plant Capital Cost $2,160,000 $5,676,000 $8,254,500 Owner's Costs $463,890 $844,140 $1,146,420 Total Project Investment $2,623,890 $6,520,140 $9,400,920 30% Equity $787,167 $1,956,042 $2,820,276
As evidenced in Table 1, all three of the small-scale ethanol scenarios yield negative financial results. This is due to the current and forecasted low ethanol prices that make profits challenging for existing large-scale plants with no debt. The projects also suffer because they must install much of the same infrastructure as larger plants and cannot achieve economies of scale. BBI also looked at producing 1 million gallons at a plant operating for only half the year and the ROI was -47%, which is worse than operating either the 1-mmgy or 2-mmgy plant over an entire year. Additionally, the capital costs are high per installed gallon when compared with the costs of building a new large-scale ethanol plant. For comparison, a new 50-mmgy using the same corn and ethanol prices results in a -3.8% ROI.
BBI INTERNATIONAL 3
AURI SMALL-SCALE ETHANOL STUDY FINAL REPORT APRIL 09
BBI INTERNATIONAL 4
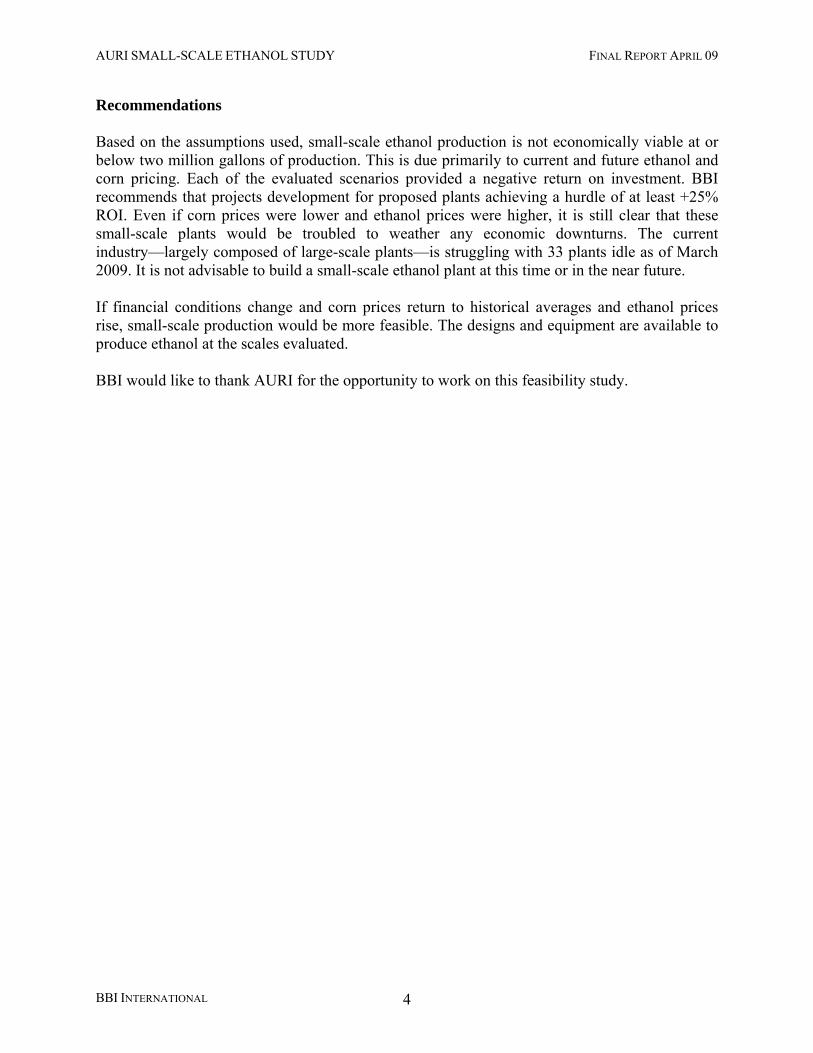
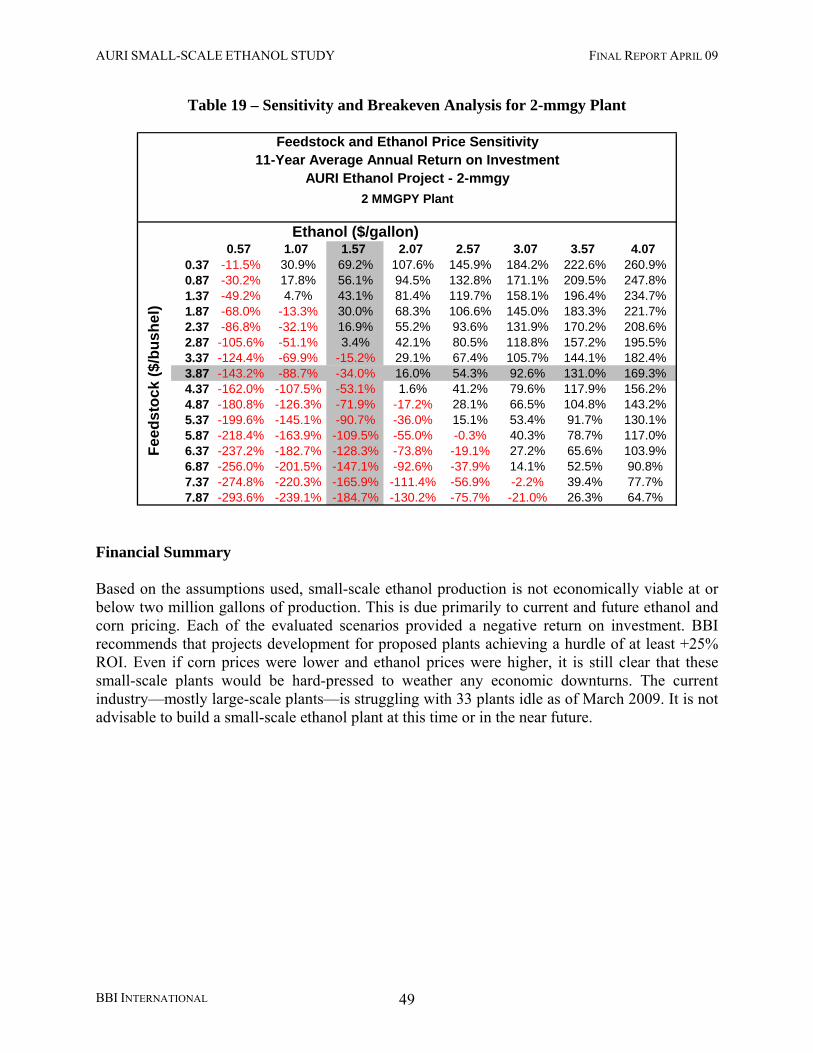
Recommendations Based on the assumptions used, small-scale ethanol production is not economically viable at or below two million gallons of production. This is due primarily to current and future ethanol and corn pricing. Each of the evaluated scenarios provided a negative return on investment. BBI recommends that projects development for proposed plants achieving a hurdle of at least +25% ROI. Even if corn prices were lower and ethanol prices were higher, it is still clear that these small-scale plants would be troubled to weather any economic downturns. The current industry—largely composed of large-scale plants—is struggling with 33 plants idle as of March 2009. It is not advisable to build a small-scale ethanol plant at this time or in the near future. If financial conditions change and corn prices return to historical averages and ethanol prices rise, small-scale production would be more feasible. The designs and equipment are available to produce ethanol at the scales evaluated. BBI would like to thank AURI for the opportunity to work on this feasibility study.
AURI SMALL-SCALE ETHANOL STUDY FINAL REPORT APRIL 09
II. PROJECT OVERVIEW Purpose of Study AURI is assessing the technical and economic feasibility of small-scale ethanol production. These plants would likely be sited on farms or in other rural settings near corn production. This study includes a technology review of small-scale ethanol design companies as well as plant designs and layouts prepared by BBI at three scales (100,00; 1,000,000 and 2,000,000 gallons per year). Regulatory and permitting issues are reviewed as well as safety concerns. Plant and operating costs are evaluated at the small-scale as well as costs to transport ethanol to the market. This report will highlight the most feasible size of small-scale production based on the scenarios evaluated. BBI is an independent consulting firm with no stake in the proposed project. The information detailed in this report reflects to the best of our ability, a true and accurate evaluation of the current ethanol industry, applicable markets, and the feasibility of the project. Scope of Work This feasibility evaluates three small-scale capacities for ethanol production. This full feasibility study makes an evaluation of the following areas:
• Regulatory and Compliance Issues o TTB o Permitting
• Transportation and Safety o Safety o Transportation logistics
• Ethanol and Co-Product Market Analysis o Ethanol Markets and Pricing o Co-Products Market and Pricing
Distillers Grains Carbon Dioxide
• Small-scale Technology Providers • Plant Design and Layout • Plant Costs • Operation Costs • Financial Analysis and Revenue Outlook
o Sensitivity Analysis • Summary and Recommendations
BBI INTERNATIONAL 5
AURI SMALL-SCALE ETHANOL STUDY FINAL REPORT APRIL 09
III. PERMITTING AND REGULATORY COMPLIANCE This section details the permitting and regulatory requirements for constructing and operating an ethanol production facility. The following permits are normally required for an ethanol project. However, the size and design of the ethanol plant, the method of steam and power generation, and local permitting requirements ultimately affect the actual permits required. Without knowing the emissions characteristics of the final production facility, it cannot be determined which permits and regulatory obligations will need to be met. The following is meant for guidance only. Below are estimated emissions profiles for the proposed facilities at all three plant scales. The figures are calculated based on existing facilities and emissions. The air emissions are based on Land O’ Lakes’ Melrose Dairy Proteins facility in Melrose, MN. The wastewater discharge figures are based on internal figures resulting from BBI’s extensive ethanol plant modeling history.
Table 2 – Air Emissions from Proposed Facilities
Pollutant PM PM10 SO2 NOx VOCs CO Lead Emissions Scenario tons per year 2-mmgy Facility (estimated) 4.07 2.13 19.00 12.40 6.93 53.33 0.000131-mmgy Facility (estimated) 2.03 1.07 9.50 6.20 3.47 26.67 0.00007100,000-gpy Facility (estimates) 0.20 0.11 0.95 0.62 0.35 2.66 0.00001Permitted Emissions (3mmgy)* 6.10 3.20 28.50 18.60 10.40 80.00 0.00020* Based on emissions characteristics of MPCA Permit No. 14500003-06
Table 3 – Wastewater Discharge from Proposed Facilities
The small scale of the proposed projects will somewhat reduce the scope of some permitting structures as compared to a standard 50-mmgy corn dry-mill ethanol plant. Overall, however, the permitting process will not deviate significantly from the traditional ethanol plant permitting process. The following permitting guidelines were created with the special input of Mergent, a Minneapolis-based environmental compliance consulting firm. It is recommended that a qualified environmental consulting firm be hired to assist with the facility permitting process.
BBI INTERNATIONAL 6
AURI SMALL-SCALE ETHANOL STUDY FINAL REPORT APRIL 09
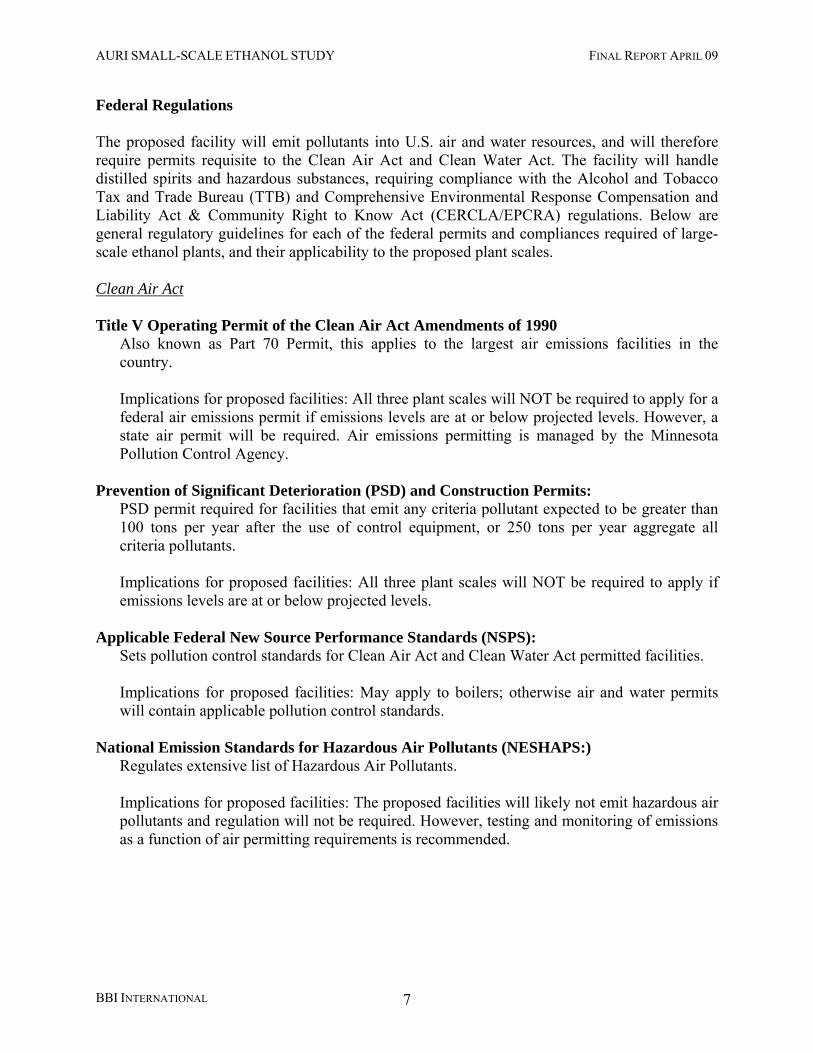
Federal Regulations The proposed facility will emit pollutants into U.S. air and water resources, and will therefore require permits requisite to the Clean Air Act and Clean Water Act. The facility will handle distilled spirits and hazardous substances, requiring compliance with the Alcohol and Tobacco Tax and Trade Bureau (TTB) and Comprehensive Environmental Response Compensation and Liability Act & Community Right to Know Act (CERCLA/EPCRA) regulations. Below are general regulatory guidelines for each of the federal permits and compliances required of large-scale ethanol plants, and their applicability to the proposed plant scales. Clean Air Act Title V Operating Permit of the Clean Air Act Amendments of 1990
Also known as Part 70 Permit, this applies to the largest air emissions facilities in the country. Implications for proposed facilities: All three plant scales will NOT be required to apply for a federal air emissions permit if emissions levels are at or below projected levels. However, a state air permit will be required. Air emissions permitting is managed by the Minnesota Pollution Control Agency.
Prevention of Significant Deterioration (PSD) and Construction Permits: PSD permit required for facilities that emit any criteria pollutant expected to be greater than 100 tons per year after the use of control equipment, or 250 tons per year aggregate all criteria pollutants. Implications for proposed facilities: All three plant scales will NOT be required to apply if emissions levels are at or below projected levels.
Applicable Federal New Source Performance Standards (NSPS):
Sets pollution control standards for Clean Air Act and Clean Water Act permitted facilities. Implications for proposed facilities: May apply to boilers; otherwise air and water permits will contain applicable pollution control standards.
National Emission Standards for Hazardous Air Pollutants (NESHAPS:)
Regulates extensive list of Hazardous Air Pollutants. Implications for proposed facilities: The proposed facilities will likely not emit hazardous air pollutants and regulation will not be required. However, testing and monitoring of emissions as a function of air permitting requirements is recommended.
BBI INTERNATIONAL 7
AURI SMALL-SCALE ETHANOL STUDY FINAL REPORT APRIL 09
Clean Water Act National Pollutant Discharge Elimination System (NPDES)
Under the NPDES Program, all facilities which discharge pollutants from any point source into waters of the United States are required to obtain an NPDES permit. The level of permitting will vary based on the volume of discharge and concentration of pollutants. Implications for proposed facilities: All three plant scales will need to acquire NPDES permitting coverage if waters are discharged. Permitting is managed by the Minnesota Pollution Control Agency.
Oil Spill Prevention and Control Countermeasures (SPCC) Plan
Required for all facilities storing over 1,320 gallons of oil total at the facility. Implications for proposed facilities: Proposed facilities will likely NOT have to fill out an SPCC plan unless use of a generator or other petroleum-based fuel equipment requires fuel storage in excess of 1,320 gallons.
Other Federal Agencies and Regulations Alcohol and Tobacco Tax and Trade Bureau (TTB)
Producers of distilled spirits for fuel use need to apply for an Alcohol Fuel Permit (AFP) and post bond. Distilleries below 10,000 ‘proof gallons’ (gallon of 100 proof alcohol) are ‘eligible’ or ‘small’ distilleries and do not require bonding. 10,000-500,000 proof gallons produced annually categorizes a facility as a medium distillery, and more than that is a large distillery.
Implications for proposed facilities: The 100,000 gpy facility is labeled a medium distillery and is subject to reduced bonding and requirements. The 1mmgy and 2mmgy plant scales are large distilleries. All facilities will need to apply for an AFP.
Comprehensive Environmental Response Compensation and Liability Act & Community Right to Know Act (CERCLA/EPCRA), EPCRA Section 313 and 304 and CERCLA Section 103:
Commonly known as the Superfund law; tracks use and release of regulated substances above threshold and/or designated quantities annually. Any release of a Hazardous Substance above that substance’s reportable quantity (RQ) is subject to reporting to the National Response Center. Releases to both air and water are subject to the regulations. Federal Tier II forms must be filed for all hazardous materials stored in excess of the Threshold Planning Quantity (TPQ) which is 500lbs for most substances.
Implications for proposed facilities: All three plant scales will be required to submit annual Tier II forms for storage of hazardous substances. All facilities with reportable release must report.
BBI INTERNATIONAL 8
AURI SMALL-SCALE ETHANOL STUDY FINAL REPORT APRIL 09
OSHA Process Safety Management of Highly Hazardous Chemicals standard (29 CFR 1910.119)
Occupational Safety and Health Administration (OSHA) Management Plan required for all facilities handling over 10,000 lbs of flammable liquid/vapor in a process (100 proof ethanol and higher, denatured ethanol, denaturant), or over 10,000 lbs of anhydrous ammonia, or over 15,000 lbs of aqueous ammonia (>44% concentration). Implications for proposed facilities: All three plant scales will likely store over 10,000lbs of ethanol and other flammable materials, and will need to comply with the guidelines set forth in the standard.
EPA Risk Management Plan: EPA’s Risk Management Plan (RMP) standard is tripped when a facility has over 10,000 lbs of anhydrous ammonia or 20,000 lbs of aqueous ammonia (>20%) in a process. Ethanol facilities also commonly trip RMP when the denaturant used contains pentane in excess of 10,000 lbs.
Department of Transportation Security Plan:
DOT’s Security Plan requirement is usually tripped at ethanol facilities when hazardous material in bulk packaging (bulk sulfuric acid, ammonia, ethanol, etc.) is transported (sent or received) in quantities greater than 3,500 gallons. Implications for proposed facilities: All three plant scales will all likely trip this requirement, as a standard tanker truck exceeds the 3,500 gallon threshold.
Minnesota State Regulations
Minnesota Pollution Control Agency (MPCA) Air Quality Permits
MPCA oversees state and federal air pollution monitoring and compliance efforts. All facilities must receive an air permit. Implications for proposed facilities: All facilities are required to apply for air emissions permit, likely synthetic minor air permits. The facilities could potentially remain a natural minor source or qualify for a Registration permit if the facility emissions are below applicability thresholds. Additional details on the process and controls would be needed to determine the appropriate permit for each option. Also note, the MPCA has the authority to request a dispersion modeling analysis verifying that the proposed facility meets both State and National Ambient Air Quality Standards.
Air Emissions Risk Analysis and Environmental Assessment Worksheet An Environmental Assessment Worksheet (EAW) and Air Emissions Risk Analysis (AERA) are required for ethanol facilities increasing production by 5mmgy or with air emissions of
BBI INTERNATIONAL 9
AURI SMALL-SCALE ETHANOL STUDY FINAL REPORT APRIL 09
any criteria pollutant expected to be greater than 100 tons per year after the use of control equipment (MN Rules Ch. 4410). An EAW is also required for a facility capable of storing 1mm gallons or more of hazardous material (denatured ethanol and denaturant are included). Implications for proposed facilities: All three plant scales will likely be underneath threshold limits for air emissions. Ethanol and other materials storage for the largest plant scale may trip EAW requirements. Please note that if an EAW is deemed necessary, an Air Emissions Risk Analysis (AERA) evaluation would likely need to be completed.
Water Quality Permits MPCA oversees state and federal water discharge monitoring and compliance efforts, under the authority of the federal NPDES program. Separate permits are required for process wastewater and non-contact process water, unless the two are blended prior to discharge. Implications for proposed facilities: All facilities require an NPDES/SDS permit to discharge industrial process/non-contact cooling water. The specific type of permit would depend on the facility’s discharge plans—whether the facility would like to discharge to surface water or land-apply the water. Use of a sanitary sewer for industrial wastewater would require pretreatment, the approval of the local wastewater treatment authority and application for a pretreatment permit. The facility’s anticipated SIC code (2869—Industrial Organic Chemicals) would require that the facility also obtain stormwater coverage for industrial activities (operation stage). In Minnesota, stormwater discharges are most often authorized in the facility’s NPDES/SDS permit.
Stormwater Permit A permit separate from the wastewater discharge permit is required for water falling onto the facility site and leaving the premises as surface water. Construction stormwater permits are required as the facility is being built if more than 1 acre is disturbed and an industrial facility permit after commission. Note that the MPCA can still require that permit coverage is necessary if a facility disturbs less than 1 acre but may pose a risk to water resources. Permits involve developing an effective Stormwater Pollution Prevention Plan (SWPPP) which contains your Stormwater Control Measures, described as Best Management Practices (BMPs). Implications for proposed facilities: All facilities are required to apply for applicable stormwater permits unless a ‘condition of No Exposure’ can be certified. The operations stormwater permit will be contained within the facility’s NPDES/SDS permit.
Wetlands
Any facilities that will impact wetlands through water discharges or construction filling require a U.S. Army Corps of Engineers 401 permit to do so. MPCA oversees these activities. Implications for proposed facilities: Permitting will be required if facility site impacts wetlands.
BBI INTERNATIONAL 10
AURI SMALL-SCALE ETHANOL STUDY FINAL REPORT APRIL 09
BBI INTERNATIONAL 11
Minnesota Department of Natural Resources (MNDNR) Water Appropriation Permit
MNDNR requires water appropriation permits for uses of surface or groundwater that exceed 10,000 gallons per day or 1mmgy. Implications for proposed facilities: The 100,000gpy ethanol plant will not need a state water appropriations permit. The facility could potentially be exempt from permitting requirements if it drew its water from a municipal water system. The two larger plant sizes will require permits.
Additional State and Local Permits and Regulations
Storage Tank Permits Local Building Code Regulations State Liquor License State Department of Motor Fuels Permit State Department of Transportation
- Highway Access Permit - Possible Easement rights
State Department of Public Service - Boiler License
AURI SMALL-SCALE ETHANOL STUDY FINAL REPORT APRIL 09
IV. TRANSPORTATION AND SAFETY CONCERNS The proper training of plant personnel in safety procedures is not only important, it is required by OSHA. The ethanol industry has an enviable safety record, even though there are numerous safety hazards that can pose significant risk. While state and federal laws set certain requirements, it is important for management to go beyond these base regulations by placing a strong company emphasis on plant safety. No matter what the size of the plant, a Safety Director, responsible for encouraging and enforcing safety procedures, needs to be appointed. An important first step is to either develop a safety manual internally or hire an experienced safety consultant to develop one. This manual will serve as the guide to implementing an effective safety program that will minimize on-the-job injuries. In addition, a well-developed safety manual will also reduce the number of OSHA violations by pointing out problem areas in advance. It is important to establish an environment of “safety first” right from the start. Safety Recommendations The plant safety manual should cover basic safety expectations, enforcement provisions and other critical operational procedures, including: • Lockout/Tagout • Confined space entry • Use of personal protective equipment • Emergency response • Hazard communication (employee right-to-know) • Hot works • Respiratory protection • Fall protection • Other related management issues affecting the facility Train employees at the time of initial employment about the safety program, safety expectations and how employees will be held accountable for the implementation of the plant’s safety program. All personnel should have an understanding of hazardous materials present in the plant. This includes training them on how to work with those hazardous materials safely (prior to use) and the use of any appropriate personal protective equipment. Points to Consider: • Bring a safety professional on board in the earliest possible stages of plant construction to not
only begin program development, but also to consult on safety deficiencies with plant and equipment design and installation. This can often avoid costly changes or retrofits after construction is completed.
BBI INTERNATIONAL 12
AURI SMALL-SCALE ETHANOL STUDY FINAL REPORT APRIL 09
• Conduct a wall-to-wall inspection of the facility with an eye to all of the OSHA regulations. Quite often, only the most obvious regulations are implemented early on, leaving lesser regulations to be brought up to speed at a later date. OSHA requires that all regulations be complied with from the start.
• A strong show of commitment by plant management is paramount in establishing buy-in at the grass roots level. This commitment can be shown by support of the program by all levels of management, and by consistent insistence on adherence to established safety rules – no exceptions.
• Encourage employee participation in the safety process to the furthest extent possible. This helps establish “ownership” of the safety program by the employees, making the safety program “our” safety program.
Process Safety Management The Process Safety Management (PSM) standard is very specific in what must be in place to comply with the standard. There are 13 elements that clearly state what is expected. • Process Safety Information • Process Hazard Analysis • Pre-startup Safety Review • Employee Participation • Standard Operating Procedures • Employee Training • Contractor Management • Special Permits and Practices • Mechanical Integrity • Management of Change • Incident Investigation • Emergency Planning and Response • Compliance Audits Due to the in-depth nature of each of these elements, it is usually necessary to employ a consultant, at least in the early stages, to assist in developing the PSM program. Also, since each facility generally has conditions and hazards unique to that facility, a good PSM program is not “one-size-fits-all” in nature. Care should be taken in the selection of a consultant to ensure that they have experience not only with PSM, but also with the ethanol industry. Transportation Safety and Considerations Safety considerations for truck and rail shipping are clearly established for all plant scales, from a 100,000-gpy plant to a 100-mmgy plant scale. The design, engineering, and equipment at load-
BBI INTERNATIONAL 13
AURI SMALL-SCALE ETHANOL STUDY FINAL REPORT APRIL 09
BBI INTERNATIONAL 14
in and load-out areas of the plant are required to adhere to these regulations. Permits and regulations described in Section III will cover the majority of the safety considerations for these transfer areas, and local regulators will oversee the remaining construction and operations matters. The major variations in design and safety will be whether the facility utilizes truck and/or rail infrastructure for acquiring raw materials and selling finished products. At the initial impression, the transportation logistics will likely be truck-based for all three proposed ethanol plant scales. Under the right circumstances, the 2-mmgy and possibly the 1-mmgy plant scales can benefit from rail shipping of materials into and out of the facility. Both the cost of equipment construction and the potential for additional sales revenue will factor into the final decision. The primary markets for ethanol and distillers grains from any of the proposed plant scales will be local, and likely easily accessible by truck. The entire ethanol output of the proposed plants can be easily absorbed by the nearest fuel distribution rack with the ability to blend ethanol, and it will not take many grain distributors to accept the plant’s distillers grains production. As Table 4 indicates, the 100,000-gpy plant scale will only produce 2,000 gallons of ethanol per week, or roughly one tanker truck per month. It would take this plant scale nearly four months to fill one rail car for shipment. At the smallest scale for the proposed plant, truck-based loading and unloading is the only viable option.
Table 4 – Ethanol Shipment Analysis
Shipping Stats 100,000-gpy 1-mmgy 2-mmgy Annual ethanol production, gal 100,000 1,000,000 2,000,000 Production days per year 353 Weekly ethanol production, gal 2,000 20,000 40,000 Tanker truck capacity, gal 8,000
Tankers per WEEK 0.25 2.5 5.3 Tankers per MONTH 1 10 21
Rail car capacity, gal 30,000 Rail cars per MONTH 0.26 2.6 5.3
The larger two plant scale scales may benefit from access to railroad shipping in addition to truck-based shipping. The ability to access broader markets allowed by rail-based shipping may be worth building at a site with existing rail access. However, the cost of building new rail switches and spurs, and the challenges working a deal with the large rail interests, are likely too high to justify new construction at any of the three proposed plant scales. The 2-mmgy scale is the most likely to profit from rail access; the plant will fill a rail car with less than a week’s worth of production. If rail access is determined to be viable, it will still be secondary to truck transport with the small volumes of materials that will be going in and out of the plants. Shipping cost is not as significant of a factor as the capital cost of rail access construction. Shipping single rail car loads of fuel does not save much as compared to local truck delivery, especially if a long-term contract for the truck shipping can be reached. As well, rail car shipping will likely access the more distant markets, increasing the shipping charge.
AURI SMALL-SCALE ETHANOL STUDY FINAL REPORT APRIL 09
V. ETHANOL AND CO-PRODUCTION MARKET ANALYSIS World ethanol markets are comprised of three distinct segments: fuel, industrial, and beverage (in decreasing order of production and use). At present, world economics as well as environmental and oil dependency concerns are providing enormous opportunities for world fuel ethanol growth while population growth will offer modest growth opportunities for the much smaller industrial and beverage segments. Worldwide fuel ethanol production reached approximately 17.3 billion gallons in 2008. That is four billion gallons above worldwide production in 2007. Of the world’s total ethanol production, approximately 80% is now fuel ethanol. Even though the bulk of the world’s fuel ethanol production still comes from Brazil and the U.S., there are significant developments in other countries as well. Some of these could result in the establishment of new production centers in addition to the traditional ones in the western hemisphere. International Markets Brazil had long been the world's number one fuel alcohol producer, making three to five billion gallons of anhydrous alcohol each year. The United States began challenging this prominence with bipartisan support for the alcohol fuel industry and the phase out of MTBE as a fuel oxygenate. U.S. ethanol production first exceeded Brazilian production in 2005. Figure 1 shows fuel ethanol production by continent.
Figure 1 – Worldwide Ethanol Production by Continent
Fuel Ethanol Production by Continent
01,000
2,0003,000
4,0005,0006,000
7,0008,000
9,00010,000
2007 2008
(Mill
ion
gallo
ns)
North America South America Europe Asia Oceania
(Source: Renewable Fuels Association)
North and South America are the world’s leading ethanol production regions, with no indication of change in the near future. Total production in the Americas in 2008 reached 16 billion gallons, or about 93% of the world ethanol output. Total U.S. ethanol production in 2008 was 9 billion gallons.
BBI INTERNATIONAL 15
AURI SMALL-SCALE ETHANOL STUDY FINAL REPORT APRIL 09
Renewable Fuel Standard The 2007 Energy Bill was signed into law on December 19, 2007. The legislation included a revised Renewable Fuels Standard. The bill established a 36 billion gallon renewable fuels standard (RFS), headlining several important provisions for biofuels. H.R. 6 will take effect on January 1, 2009 – with the exception of the 9.0 billion gallon requirement for the current RFS program that will take effect in 2008. The 36 billion gallon RFS has several different provisions for assorted types of biofuels. They are conventional biofuels, advanced biofuels, cellulosic biofuels, and biomass-based diesel. H.R. 6 defines these categories as follows:
Conventional biofuels is ethanol derived from corn starch. Conventional ethanol facilities that commence construction after the date of enactment must achieve a 20 percent greenhouse gas (GHG) emissions reduction compared to baseline lifecycle GHG emissions. The 20 percent GHG emissions reduction requirement may be adjusted to a lower percentage (but not less than 10 percent) by the U.S. Environmental Protection Agency (EPA) Administrator if it is determined the requirement is not feasible for conventional biofuels. Advanced biofuels is a renewable fuel other than ethanol derived from corn starch, which is derived from renewable biomass, and achieves a 50 percent GHG emissions reduction requirement. The definition – and the schedule – of advanced biofuels include cellulosic biofuels and biomass-based diesel. The 50 percent GHG emissions reduction requirement may be adjusted to a lower percentage (but not less than 40 percent) by the Administrator if it is determined the requirement is not feasible for advanced biofuels. (Cellulosic biofuels that do not meet the 60 percent threshold, but do meet the 50 percent threshold, may qualify as an advanced biofuel.) Cellulosic biofuels is renewable fuel derived from any cellulose, hemicellulose, or lignin that is derived from renewable biomass, and achieves a 60 percent GHG emission reduction requirement. The 60 percent GHG emissions reduction requirement may be adjusted to a lower percentage (but not less than 50 percent) by the Administrator if it is determined the requirement is not feasible for cellulosic biofuels. The feedstocks under consideration in this study fall under this category of advanced biofuels. Biomass-based diesel is renewable fuel that is biodiesel as defined in section 312(f) of the Energy Policy Act of 1992 (42 U.S.C. 13220(f)) and achieves a 50 percent GHG emission reduction requirement. Notwithstanding the preceding sentence, renewable fuel derived from co-processing biomass with a petroleum feedstock is considered an advanced biofuel if it meets advanced biofuel requirements, but is not biomass-based diesel.
H.R. 6 sets the following targets for each of these biofuel types. The following table shows RFS volumes from 2008 to 2022.
BBI INTERNATIONAL 16
AURI SMALL-SCALE ETHANOL STUDY FINAL REPORT APRIL 09
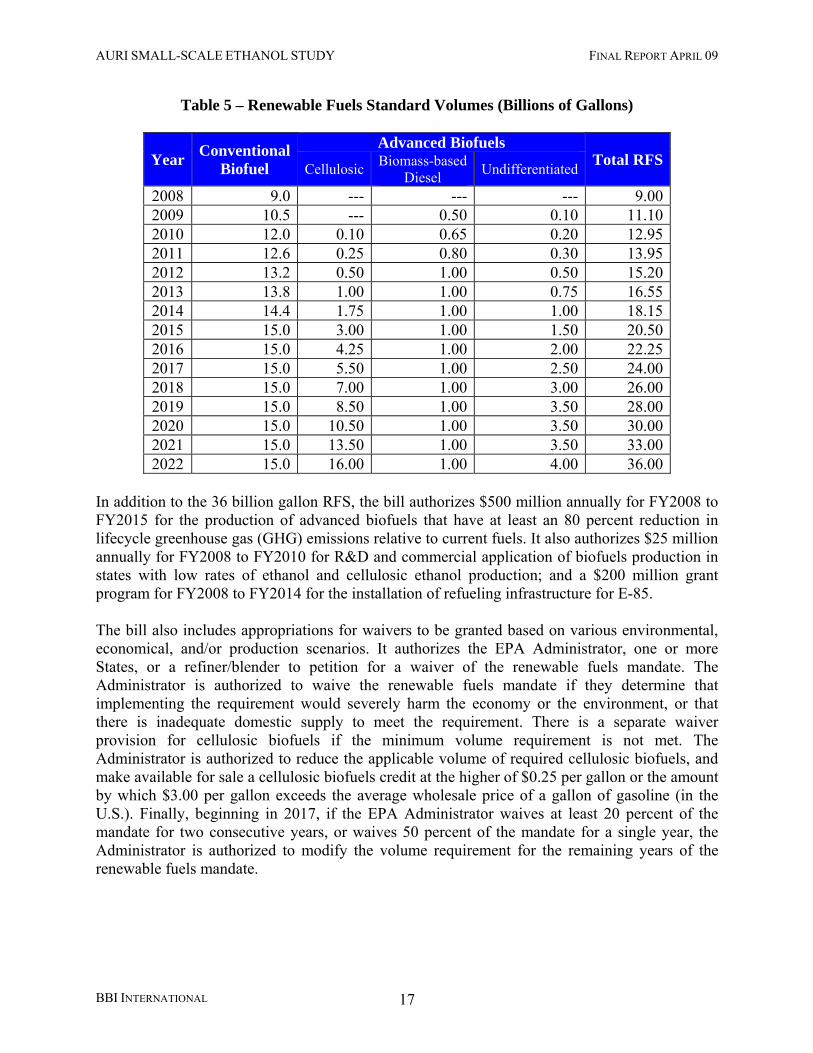
Table 5 – Renewable Fuels Standard Volumes (Billions of Gallons)
In addition to the 36 billion gallon RFS, the bill authorizes $500 million annually for FY2008 to FY2015 for the production of advanced biofuels that have at least an 80 percent reduction in lifecycle greenhouse gas (GHG) emissions relative to current fuels. It also authorizes $25 million annually for FY2008 to FY2010 for R&D and commercial application of biofuels production in states with low rates of ethanol and cellulosic ethanol production; and a $200 million grant program for FY2008 to FY2014 for the installation of refueling infrastructure for E-85. The bill also includes appropriations for waivers to be granted based on various environmental, economical, and/or production scenarios. It authorizes the EPA Administrator, one or more States, or a refiner/blender to petition for a waiver of the renewable fuels mandate. The Administrator is authorized to waive the renewable fuels mandate if they determine that implementing the requirement would severely harm the economy or the environment, or that there is inadequate domestic supply to meet the requirement. There is a separate waiver provision for cellulosic biofuels if the minimum volume requirement is not met. The Administrator is authorized to reduce the applicable volume of required cellulosic biofuels, and make available for sale a cellulosic biofuels credit at the higher of $0.25 per gallon or the amount by which $3.00 per gallon exceeds the average wholesale price of a gallon of gasoline (in the U.S.). Finally, beginning in 2017, if the EPA Administrator waives at least 20 percent of the mandate for two consecutive years, or waives 50 percent of the mandate for a single year, the Administrator is authorized to modify the volume requirement for the remaining years of the renewable fuels mandate.
BBI INTERNATIONAL 17
AURI SMALL-SCALE ETHANOL STUDY FINAL REPORT APRIL 09
Farm Bill Provisions The 2008 Farm Bill extended the current small producer tax credit but lowered the Volumetric Ethanol Excise Tax Credit (VEETC) blender’s credit from 51¢/gal to 45¢/gal in January 2009. This reduction has not appeared to impact ethanol pricing. The recent stimulus package includes $800 million for the Biomass Program of the Department of Energy Office of Energy Efficiency and Renewable Energy. Biofuels spending will be increased by an additional $500 million although specifics on what the money will be used for are not yet known. Current Industry In the U.S., ethanol’s primary purpose is to serve as an octane enhancer for gasoline, a clean air additive in the form of an oxygenate, and as an aid in reducing dependence on imported oil – thereby reducing the balance of trade. In order to accomplish these tasks in the face of resistance from the oil industry, Congress established an incentive in the form of a tax credit during the mid-1970s to encourage the oil industry to blend ethanol. The tax incentive is still in place, but set to expire in 2010. New restrictions on automobile emissions, reductions in carbon monoxide, smog mitigation programs in major cities, and a general trend toward the reduction of greenhouse gas emissions, continue to drive the demand for ethanol. Ethanol plays a key role in helping refiners extend their product by as much as 10%. The slightest upset in refining capacity (fire, shutdown, closure) sends gasoline prices soaring. U.S. refining capacity operates extremely close to capacity. Corn is not the sole provider, but it accounts for 95% of U.S. fuel ethanol and it follows that the majority of production capacity and use of fuel ethanol is in the Midwest Corn Belt. Every state uses ethanol-blended fuel; 50% of U.S. gasoline use in 2007 was ethanol-blended fuel. While corn has been the primary feedstock for fuel ethanol in the U.S., other feedstocks including wheat, milo and various waste starch and sugar streams are also used. Grain-based ethanol will likely continue to be the major contributor to ethanol production in the years ahead. The industry has entered a period of consolidation driven by tight margins and the desire for some early-stage investors to exit the sector. The recent volatility in corn and ethanol prices has also exposed risk management shortcomings at many plants and some companies need additional capital to maintain liquidity. As of December 2008, most publicly traded ethanol companies had enterprise valuations that were lower than the construction price for a new project in today’s dollars, and some even traded below the price it originally took to construct the plant. Additionally, some plants may be in an “upside down” position—locked into old ethanol contracts at low prices with expiring corn contracts which could lead to such plants going idle until corn prices decline. There are 28 idle plants with capacity of 1.8 billion gallons. Nearly half the idle plants are the result of the VeraSun bankruptcy which was primarily a result of locking into corn contracts well above current corn prices.
BBI INTERNATIONAL 18
AURI SMALL-SCALE ETHANOL STUDY FINAL REPORT APRIL 09
BBI INTERNATIONAL 19
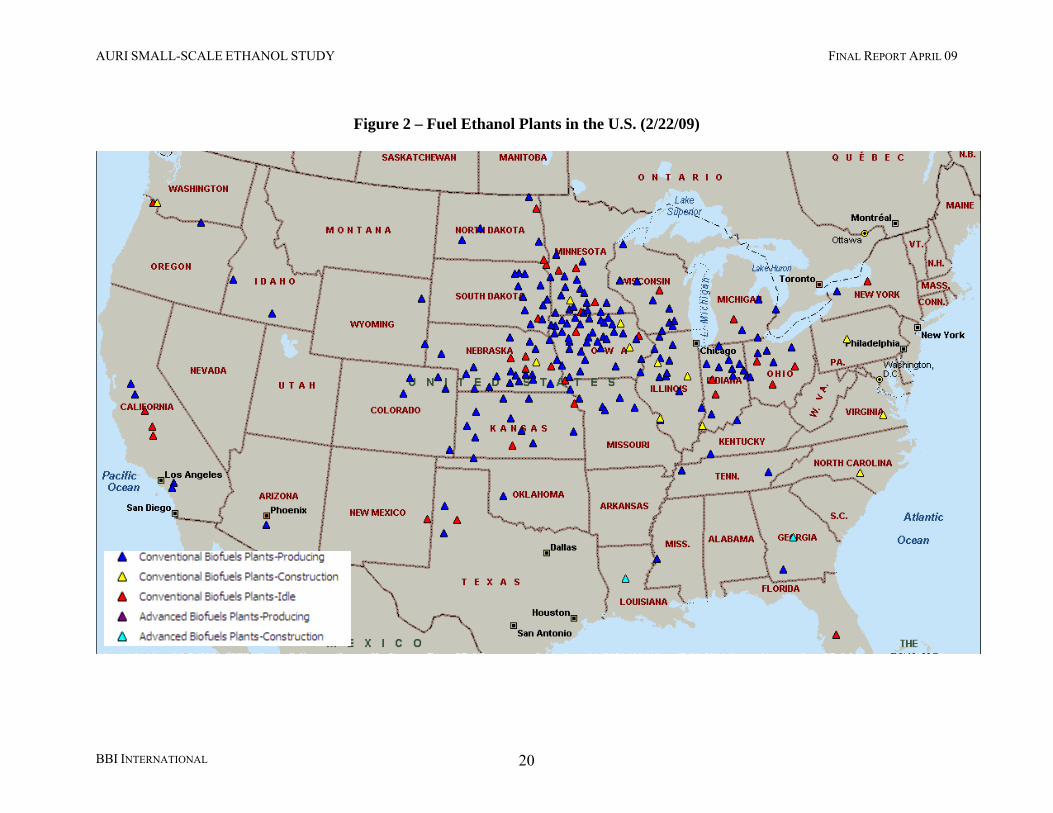
There are currently 171 commercial fermentation ethanol production facilities in operation in the U.S. with a combined production capacity of about 10.6 billion gallons per year (Figure 2). Verenium Biofuels is the only small-scale commercial cellulosic producer. There are 15 new plants under construction, adding about 1.5 billion gallons of annual production capacity. At this time, 33 plants are idle largely due to high corn prices, low ethanol prices and other risk management issues. These plants represent over 2 billion gallons of capacity. There are 17 operating plants with capacities of less than 12-mmgy. Of plants with less than 5-mmgy of capacity, only three use corn as the feedstock. These three small-scale plants using corn as a feedstock are idle.
AURI SMALL-SCALE ETHANOL STUDY FINAL REPORT APRIL 09
Figure 2 – Fuel Ethanol Plants in the U.S. (2/22/09)
BBI INTERNATIONAL 20
AURI SMALL-SCALE ETHANOL STUDY FINAL REPORT APRIL 09
Several factors have and will continue driving the U.S. fuel ethanol industry’s growth. They are:
• Federal Renewable Fuels Standard • Ethanol price relative to crude oil (or gasoline) • Clean octane • Oxygenate for RFG program • Gasoline extender (refinery capacity) • Local economic development
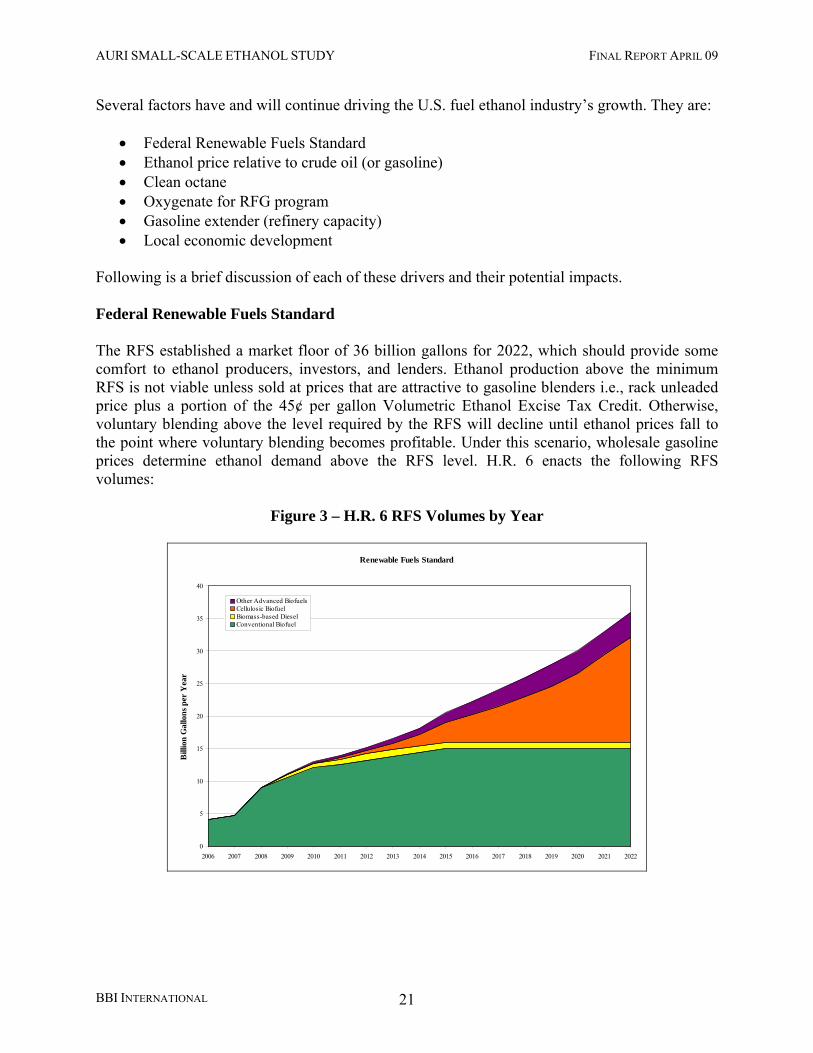
Following is a brief discussion of each of these drivers and their potential impacts. Federal Renewable Fuels Standard The RFS established a market floor of 36 billion gallons for 2022, which should provide some comfort to ethanol producers, investors, and lenders. Ethanol production above the minimum RFS is not viable unless sold at prices that are attractive to gasoline blenders i.e., rack unleaded price plus a portion of the 45¢ per gallon Volumetric Ethanol Excise Tax Credit. Otherwise, voluntary blending above the level required by the RFS will decline until ethanol prices fall to the point where voluntary blending becomes profitable. Under this scenario, wholesale gasoline prices determine ethanol demand above the RFS level. H.R. 6 enacts the following RFS volumes:
Other Advanced BiofuelsCellulosic BiofuelBiomass-based DieselConventional Biofuel
BBI INTERNATIONAL 21
AURI SMALL-SCALE ETHANOL STUDY FINAL REPORT APRIL 09
Ethanol Price Relative to Crude Oil or Gasoline Regardless of any potential RFS, any ethanol production in excess has to be competitive with gasoline. Voluntary blending of ethanol is profitable when the price of ethanol is less than or equal to the price of gasoline plus the VEETC, which is a blender’s tax credit. This means that with the current 45¢ per gallon VEETC, if a blender can sell a gallon of gasoline for $2.00, they will pay up to $2.45 per gallon for ethanol. Clean Octane Octane is a measurement of gasoline’s auto-ignition resistance. The octane number gives the percentage by volume of iso-octane in a mixture of iso-octane and n-heptane that has the same anti-knocking characteristics as the fuel under consideration. For example, gasoline with a 90 octane rating has the same ignition characteristics as a mixture of 90% iso-octane and 10% heptane. Table 6 shows the octane rating of several compounds in pure form. Frequently referred to as “Dirty Octane,” Benzene, Toluene, and Xylene, have toxic human and environmental effects; in many cases, they have been strictly limited in the amount allowed in fuels.
This leaves ethanol as the highest-octane compound that does not have negative human or environmental effects. It is a great source for “Clean Octane” and this provides another incentive for its use in transportation fuels. Oxygenate For RFG Program & MTBE Phase-out In 2006, the EPA eliminated the 2.0% oxygen by weight requirement from the Reformulated Gasoline (RFG) program. The interesting part here is that MTBE was a very popular oxygenate, but also an extremely serious environmental and human health problem. Regardless, it was widely used because of the oxygenate requirement. The most current EIA data (from 2003) indicates that 17 states should have MTBE bans by now; even so, the EPA regulation change effectively eliminated its use. It is true that not all areas use RFG fuel, but it is required in non-attainment areas like Denver, most of California, and New England. Even with the oxygenate requirement gone, RFG fuels
BBI INTERNATIONAL 22
AURI SMALL-SCALE ETHANOL STUDY FINAL REPORT APRIL 09
still must meet certain VOC control requirements, and the easiest way to do this is with an oxygenate. This provides as excellent market area for ethanol, although the MTBE oxygenate replacement is nearly complete, and any future growth in this sector is most likely dependent on population growth. Gasoline Extender (Refinery Capacity) There is some potential for ethanol, or any fuel-blending agent, to extend the supply of transportation fuels. Simply put, if someone uses 10 gallons of gasoline with no blended agents, they use 10 gallons of gasoline; however, if they use 10 gallons of gasoline blended at 10% ethanol to do the same work, they only consume 9 gallons of gasoline. Multiply this by billions of gallons, and the savings are appreciable. Local Economic Development An ethanol plant can re-invigorate a rural community. A typical 50-mmgy dry mill facility creates about 36 new direct jobs, the majority of them being skilled positions requiring special training or education. Repeatedly, near-ghost town communities have re-grown thanks to the new plant in town. In addition to the jobs working at the plant, a new ethanol plant creates hundreds of indirect jobs. In 2008, the ethanol industry contributed the following to the U.S. economy:1
• The industry spent $22 billion on raw materials, other inputs and goods and services • Combination of spending for operations, ethanol transportation capital for new plants and
R&D added $65.6 billion GDP • Supported the creation of 494,000 jobs in all sectors of the economy, including nearly
46,000 jobs in the manufacturing sector; • Put an additional $19.9 billion into the pockets of American consumers; and • Added $11.9 billion (federal subsidies were $4.7 billion) in new tax revenue for the
federal government and $9 billion for state and local governments BBI Projected Ethanol Demand BBI has projected the demand for ethanol in the U.S. using the following assumptions:
• Ethanol production in the U.S. will not exceed demand less the full import allowance under the Caribbean Basin Initiative (CBI);
• Complete oxygenate demand is met using ethanol; • Displacement/discretionary blending will create demand up to 9.5% of the total gasoline
demand; • E85 use accounts for all of the ethanol demand beyond the oxygenate and 9.5% blend
demands; and
1 From: “Contribution of the Ethanol Industry to the Economy of the United States,” LECG, LLC, February 2009
BBI INTERNATIONAL 23
AURI SMALL-SCALE ETHANOL STUDY FINAL REPORT APRIL 09
• Adequate infrastructure – beyond plant production capacity (i.e. with blenders and distributors, E85 pumps) – exists or will exist to meet the demand.
• There is also an assumption that the EPA will allow blending rates above E10 in the future
Figure 4 shows BBI’s projections for ethanol demand by use category. By the end of 2006 the 4.5 billion gallon oxygenate market in the U.S. was essentially served, with the only increases in this market due to changes in gasoline demand. One assumption here is that the EPA designates no new Ozone/Air Quality Non-Attainment areas during the projected period. This may be a moot point though as the displacement blending projections increase to nearly 9.5% of gasoline demand by 2012. Displacement blending is an estimate of how much discretional blending will occur. Finally, E85 demand comes from Renewable Fuels Association (RFA) projections for number of E85 vehicles and their potential demand, factored by BBI estimates on the market penetration and accessibility that these vehicles will have. The most important note is that BBI assumes no infrastructure limits on demand, such as refiners/blenders capacity to store/use ethanol or distribution of the blended product.
Ethanol used in E85 Displacement Blending Oxygenate RFS (excluding biodiesel)
BBI INTERNATIONAL 24
AURI SMALL-SCALE ETHANOL STUDY FINAL REPORT APRIL 09
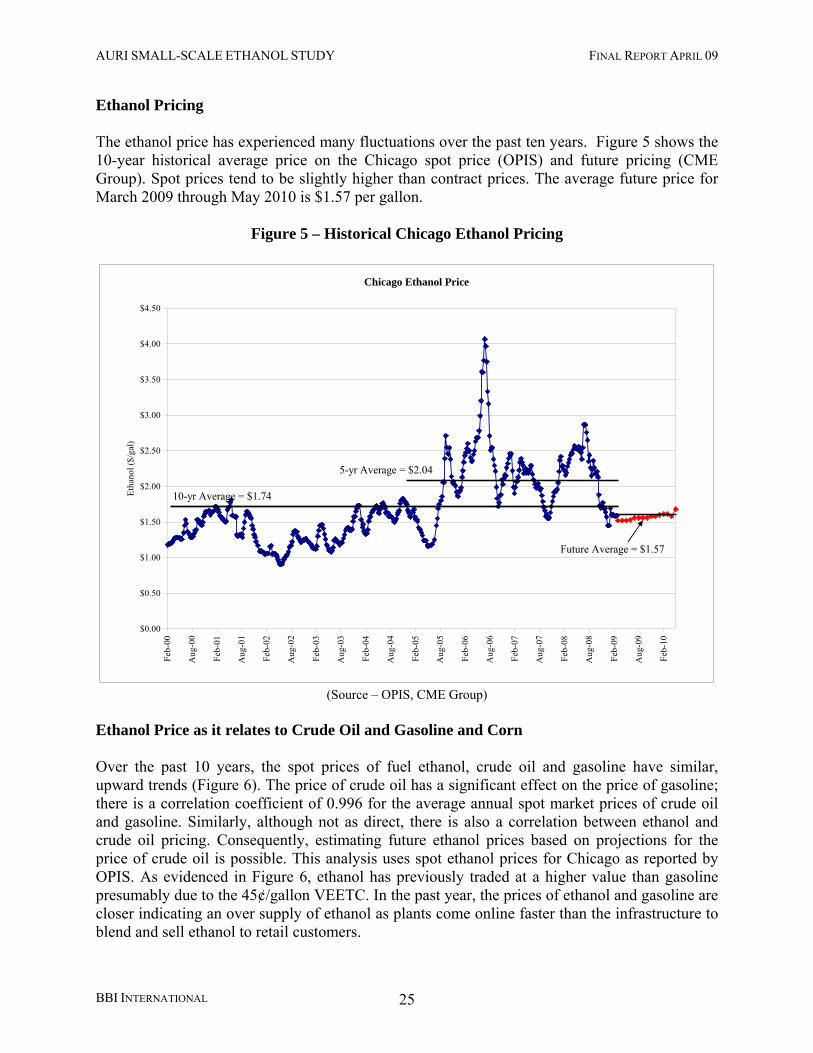
Ethanol Pricing The ethanol price has experienced many fluctuations over the past ten years. Figure 5 shows the 10-year historical average price on the Chicago spot price (OPIS) and future pricing (CME Group). Spot prices tend to be slightly higher than contract prices. The average future price for March 2009 through May 2010 is $1.57 per gallon.
Figure 5 – Historical Chicago Ethanol Pricing
Chicago Ethanol Price
$0.00
$0.50
$1.00
$1.50
$2.00
$2.50
$3.00
$3.50
$4.00
$4.50
Feb-
00
Aug
-00
Feb-
01
Aug
-01
Feb-
02
Aug
-02
Feb-
03
Aug
-03
Feb-
04
Aug
-04
Feb-
05
Aug
-05
Feb-
06
Aug
-06
Feb-
07
Aug
-07
Feb-
08
Aug
-08
Feb-
09
Aug
-09
Feb-
10
Etha
nol (
$/ga
l)
10-yr Average = $1.74
5-yr Average = $2.04
Future Average = $1.57
(Source – OPIS, CME Group)
Ethanol Price as it relates to Crude Oil and Gasoline and Corn Over the past 10 years, the spot prices of fuel ethanol, crude oil and gasoline have similar, upward trends (Figure 6). The price of crude oil has a significant effect on the price of gasoline; there is a correlation coefficient of 0.996 for the average annual spot market prices of crude oil and gasoline. Similarly, although not as direct, there is also a correlation between ethanol and crude oil pricing. Consequently, estimating future ethanol prices based on projections for the price of crude oil is possible. This analysis uses spot ethanol prices for Chicago as reported by OPIS. As evidenced in Figure 6, ethanol has previously traded at a higher value than gasoline presumably due to the 45¢/gallon VEETC. In the past year, the prices of ethanol and gasoline are closer indicating an over supply of ethanol as plants come online faster than the infrastructure to blend and sell ethanol to retail customers.
BBI INTERNATIONAL 25
AURI SMALL-SCALE ETHANOL STUDY FINAL REPORT APRIL 09
Figure 6 – Historic Relationship between Prices of Oil, Gas, and Ethanol (USD) Historic Ethanol, Gasoline and Crude Oil Prices
0.00
0.50
1.00
1.50
2.00
2.50
3.00
1999 2000 2001 2002 2003 2004 2005 2006 2007 2008
Etha
nol a
nd G
asol
ine
($/g
al)
10
30
50
70
90
110
130
Cru
de O
il ($
/bbl
)
Gas in $/gal Historic Ethanol Price Historic Crude Oil Price
(Source – OPIS, US DOE Energy Information Administration)
One of the major risks to an ethanol plant has traditionally been the lack of correlation between ethanol and corn prices. Prior to 2007, ethanol and corn prices were generally uncorrelated with each other (Figure 7). As the prices of the two commodities moved independent of one another, plants could realize large profits or be forced to shut down. In the past three years, ethanol’s demand for corn has increased from under 15 percent of the total U.S. consumption to an expected level of 32 percent for the 2008-09 marketing year. This shift in demand has been accompanied with increased correlation between the prices of ethanol and corn. Since October 2007, ethanol and corn prices have moved almost in tandem with correlation of 0.94 between the daily nearby CME prices for the two commodities. While prices in most commodities have moved in sync over the past few years, such high degree of correlation may reflect a new operating environment for ethanol plants. The increased consumption of corn in the biofuels sector may change the pricing environment for the crop to new patterns not previously considered.
Figure 7 – 10 Year Monthly Price History of Corn & Ethanol
$-
$0.50
$1.00
$1.50
$2.00
$2.50
$3.00
$3.50
1999 2000 2001 2002 2003 2004 2005 2006 2007 2008
$ pe
r Gal
lon
(Eth
anol
)
$-
$1.00
$2.00
$3.00
$4.00
$5.00
$6.00
$7.00
$8.00
$ pe
r Bus
hel (
Cor
n)
EthanolCorn
(Source: USDA, OPIS)
BBI INTERNATIONAL 26
AURI SMALL-SCALE ETHANOL STUDY FINAL REPORT APRIL 09
Small-Scale Ethanol Sales Ethanol production capacity is just over one billion gallons in Minnesota. This includes three plants that are idle (137-mmgy combined) and one plant under construction (55-mmgy). Minnesota gasoline use is approximately 2.6 billion gallons per year. Minnesota produces far more ethanol than it can use based on the EPA blending rule of 10% and small markets for E85. Despite this level of production, it is assumed that a small-scale producer could sell all output to a local or regional blender. In fact, this is an essential element of a small-scale producer since shipping ethanol long distances with not be economically feasible. It is assumed that a small-scale ethanol producer can enter into a long term supply contract with an area blender and therefore avoid marketing fees—typically 1% of ethanol sales price for large plants. The economic model uses an estimated shipping cost of $0.05 per gallon. It is assumed that all ethanol is shipped by truck. Co-Products Distillers Grains Distillers grains are the residues that remain after high quality cereal grains have been fermented by yeast. In the fermentation process, nearly all of the starch in the grain is converted to ethanol and carbon dioxide, while the remaining nutrients (proteins, fats, minerals, and vitamins) undergo a three-fold concentration in the beer, which after distillation and centrifugation of the still bottoms, yields DWG and “thin stillage.” Distillers Wet Grain (DWG) is the wet cake that comes directly from the centrifuge. It has approximately 65% moisture. The syrup that is centrifuged out is evaporated and returned back into the wet cake. The primary market for DWG is local dairy and beef cattle. Cattle perceive DWG as sweet and readily eat it without any added sweeteners. Wet distillers grain is nutritionally superior compared to dry distillers grain (drying reduces digestibility). An ethanol plant produces 46.3 pounds per bushel of corn processed. Distillers grain market price is determined through a number of factors that include the market value of local feed grain, the market value of soybean meal and other competitive protein ingredients, the performance or value of distillers grain in a particular feed formulation, the supply and demand within the market, and, most importantly, acceptance by animal producers. While pricing is localized, DWG generally sell for 80% the price of corn on a dry weight basis. This results in a price of $45.53 per ton (based on one year future corn price of $3.87 per bushel-CME Group). DWG are collected by area cattle and dairy farmers so there are no marketing or transportation fees. Minnesota law requires DWG to be sold within three days of it being produced.
BBI INTERNATIONAL 27
AURI SMALL-SCALE ETHANOL STUDY FINAL REPORT APRIL 09
Carbon Dioxide Dry ice and liquid carbon dioxide (CO2) are principally used as expendable refrigerants in the food industry. Carbon dioxide, whether solid, liquid, or gaseous, is recognized as safe for use in foods. Food applications include:
• Beef, pork, and poultry slaughter operations • Frozen food storage and transportation • Supplemental cooling for refrigerated products • Meat, sausage and bakery processing • Airline catering • Gift food packaging • Carbonation of beverages
Non-food applications include:
• Various chemical processes • Oil extraction via CO2 injection • Dermatologists • Blood banks • Pharmaceutical manufacturing • pH control
Currently in the U.S. about 20% of the CO2 produced by ethanol plants is captured and the rest vented to the atmosphere. In most cases, the carbon dioxide captured is from very large ethanol plants. Capture of CO2 from medium sized and smaller plants is usually not justified unless special market conditions are present. If justified, the ethanol plant can easily capture raw carbon dioxide. However, further processing is necessary if it is to be used for commercial purposes. At most, the revenue potential from the sale of CO2 is approximately 3% of total plant revenues. Typically, a CO2 processing company will construct a processing facility next to the ethanol plant. The raw CO2 is piped to the processing facility for finishing. In order for the processing facility to be economically viable, there must be a close market for the finished CO2. If all the produced CO2 is sold, it can add about 3% to revenues. Due to the low production levels of carbon dioxide from small-scale ethanol plants, it is unlikely that it will be captured and sold. Carbon dioxide sales are not included in the economic model. Ethanol and Co-Product Market Summary The recently updated Renewable Fuels Standard ensures a long term U.S. market for biofuels. Voluntary blending is expected to occur at an increasing rate as long as the price of ethanol remains less than or equal to gasoline plus the blender’s tax credit—making blending economically attractive. At this time, some ethanol plants are struggling due to continued higher than average corn prices and lower ethanol prices as they still correlate to oil prices which have dipped significantly in the 4th quarter of 2008 and continuing on into 2009. Plants that are
BBI INTERNATIONAL 28
AURI SMALL-SCALE ETHANOL STUDY FINAL REPORT APRIL 09
BBI INTERNATIONAL 29
efficiently run, have no debt and have a solid risk management strategy should be able to make it through this difficult financial period. Ethanol production capacity is just over one billion gallons in Minnesota. Minnesota gasoline use is approximately 2.6 billion gallons per year. Minnesota produces far more ethanol than it can use based on the EPA blending rule of 10% and small markets for E85. Despite this level of production, it is assumed that a small-scale producer could sell all output to a local or regional blender. In fact, this is an essential element of a small-scale producer since shipping ethanol long distances with not be economically feasible. The ethanol price is set to the one year average futures price from CME Group of $1.57 per gallon increasing at a rate of 2% per year in the economic model. Shipping costs are estimated at $0.05 per gallon. It is assumed that all ethanol is shipped by truck. All distillers grains will be sold in the wet form. Production of DWG is as follows: 771 tons from the 100,000 gallon scenario; 7,710 tons from the 1-mmgy scenario; and 15,420 tons from the 2-mmgy scenario. The price is set to 80% the price of corn on a dry weight basis ($45.53 per ton based on one year future corn price of $3.87 per bushel-CME Group).
AURI SMALL-SCALE ETHANOL STUDY FINAL REPORT APRIL 09
VI. SMALL-SCALE TECHNOLOGY PROVIDERS The project sponsor should ensure that reputable design and construction firms are engaged throughout the development, design, and construction of the project. The construction firm should guarantee the completion of the project within a fixed budget and time schedule and must warrant all workmanship for a period of not less than a year following startup. The firm should be capable of posting performance, materials, and labor bonds and should be willing and financially able to accept liquidated damages provisions in their contract, if it is required by the sources of debt financing for the project. The supplier of the ethanol process technology and the designer of the process should be experienced and well regarded, to guarantee the performance of the plant so long as the construction firm builds it to the designer’s specifications. This guarantee should include a minimum yield requirement, and specific quality requirements of products. The guarantee should also include quality and quantity requirements of feedstock (usually a bushel of #2 yellow dent corn). Requirements for energy and utility consumption for the use of chemicals and enzymes, and for the process water, with respect to consumption, should be stated in the process guarantee. The volume and characteristics of wastewater should also be addressed in this guarantee, and all requirements should be presented on a per bushel basis. The guarantee is normally considered satisfied if a successful performances test of several days duration is completed after plant startup. In some cases, the same firm may be both the designer and the constructor. In such cases, the General Constructor (GC) will provide the performance guarantees and the process designer will act as a subcontractor to the GC. In cases where separate contracts are held for both the designer and the construction contractor, the process and construction guarantees would be in separate documents. BBI recommends that there be a single “turnkey” contract providing the strongest possible financial resources to back the design and construction scope of work. What follows is a list and short description of firms that BBI knows to be successful and reliable in the ethanol industry. Fagen, Inc. (Granite Falls, MN) Fagen Inc. has been the design-build contractor, E.P.C. contractor, general contractor, or subcontractor for at least 77 ethanol plant projects, both new construction and expansion jobs, and claims more ethanol industry experience than any other U.S. firm during the past decade. With the addition of Fagen Engineering LLC and Fagen Management LLC, Fagen now performs the civil, structural, mechanical, and electrical engineering aspects for ethanol projects and provides management services after construction and startup. They typically utilize the ethanol process design of ICM, Inc. Fagen, Inc. is located at 501 West Highway 212, Granite Falls, MN 56241 Telephone (320) 564-3324. Web address: http://www.fageninc.com/
BBI INTERNATIONAL 30
AURI SMALL-SCALE ETHANOL STUDY FINAL REPORT APRIL 09
BBI INTERNATIONAL 31
ICM, Inc. (Colwich, KS) ICM, Inc. of Colwich, KS, serves the agricultural industry by developing and implementing innovative and practical processing solutions. ICM, Inc. employs people in all aspects of ethanol project development and operation including cash and commodity trading of corn, marketing of ethanol and distillers grain, process consulting, engineering, equipment fabrication, field installation, and plant start-up. The former technology leader of High Plains Corporation formed ICM. High Plains operates plants in Nebraska, Kansas, and New Mexico. ICM does own and operate a facility in Russell, Kansas, which acts as both a training and research facility for their technology. Six of the latest ethanol plants in the United States have utilized ICM technology. ICM has 101 plants in North America that utilize their process design, the smallest of which is 10-mmgy. They are currently working on a re-design of the 10-mmgy plant to modularize it, and are confident that it could be easily scaled down to the 1- to 2-mmgy range. ICM Inc. is located at 310 N. First Street, Colwich, KS 67030 Telephone (316) 796-0900. Web address: http://www.icminc.com/ There are several other ethanol technology providers that have contributed to the current industry, including: POET, Katzen, Lurgi, Vogelbusch, although it is unclear as to their involvement in currently providing small-scale ethanol technology. Attempts to reach these firms were unsuccessful. Additionally, BBI contacted two small-scale ethanol technology providers, Easy Automation (800-397-9736) and Diversified Ethanol (800-689-3544) but neither company responded to telephone inquiries.
AURI SMALL-SCALE ETHANOL STUDY FINAL REPORT APRIL 09
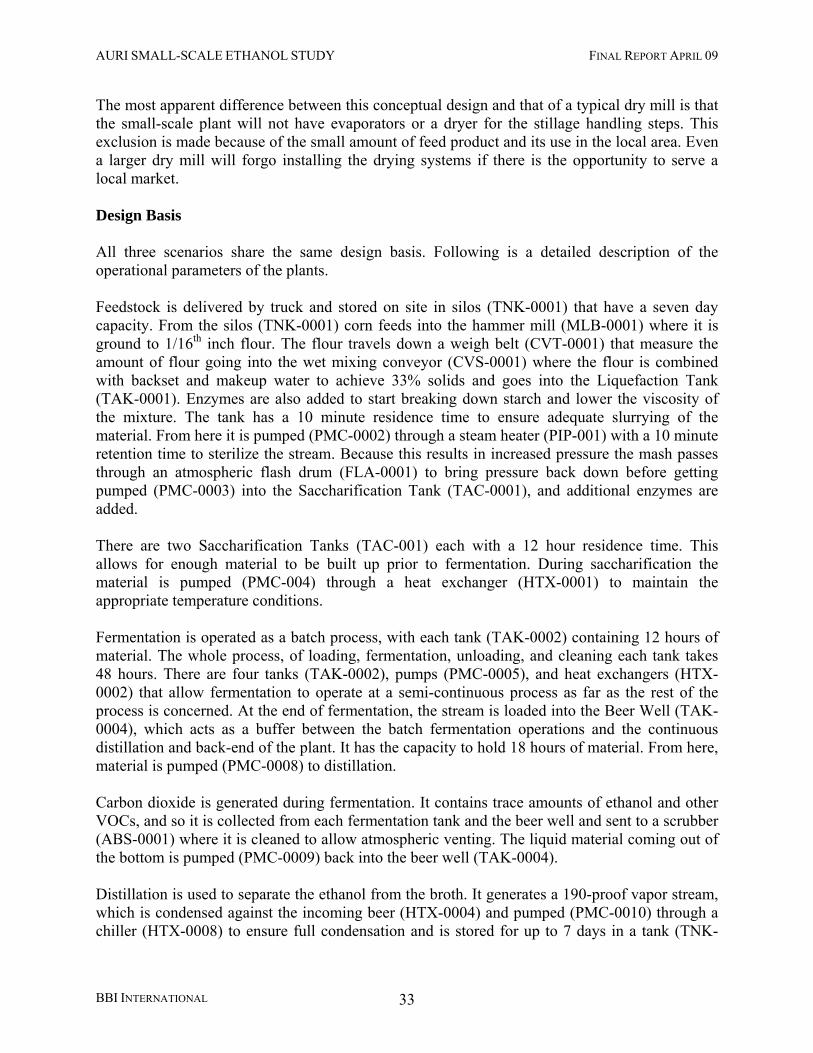
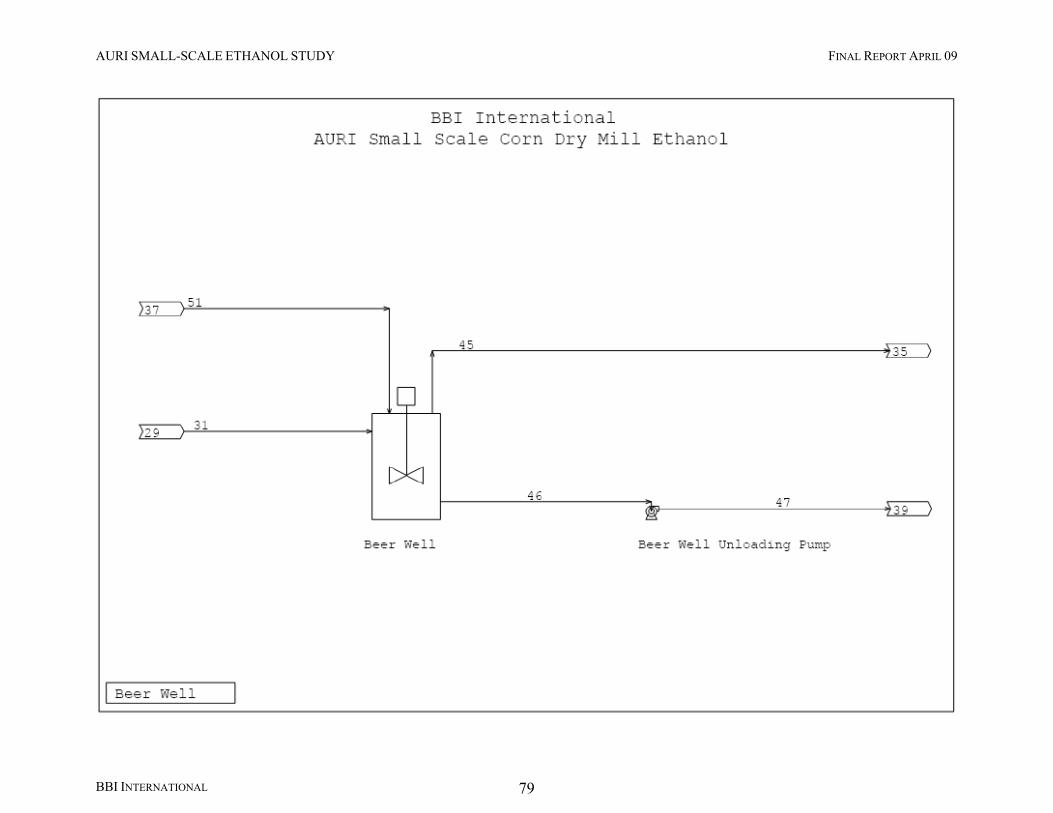
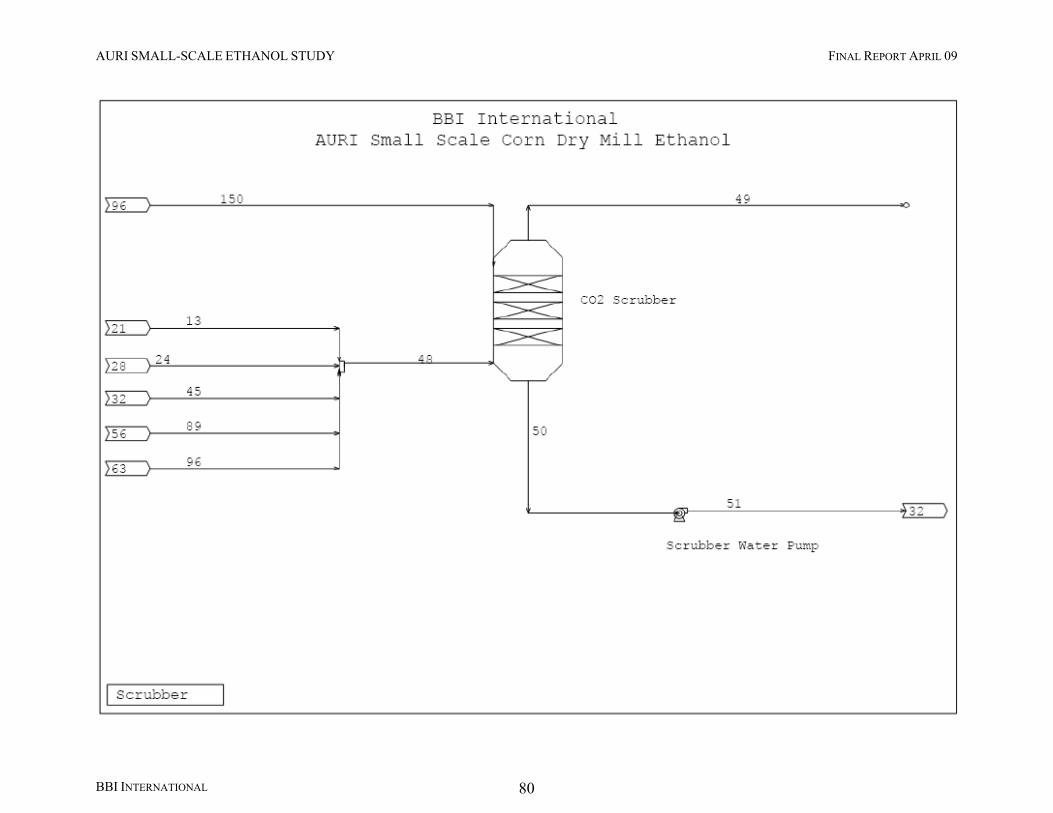
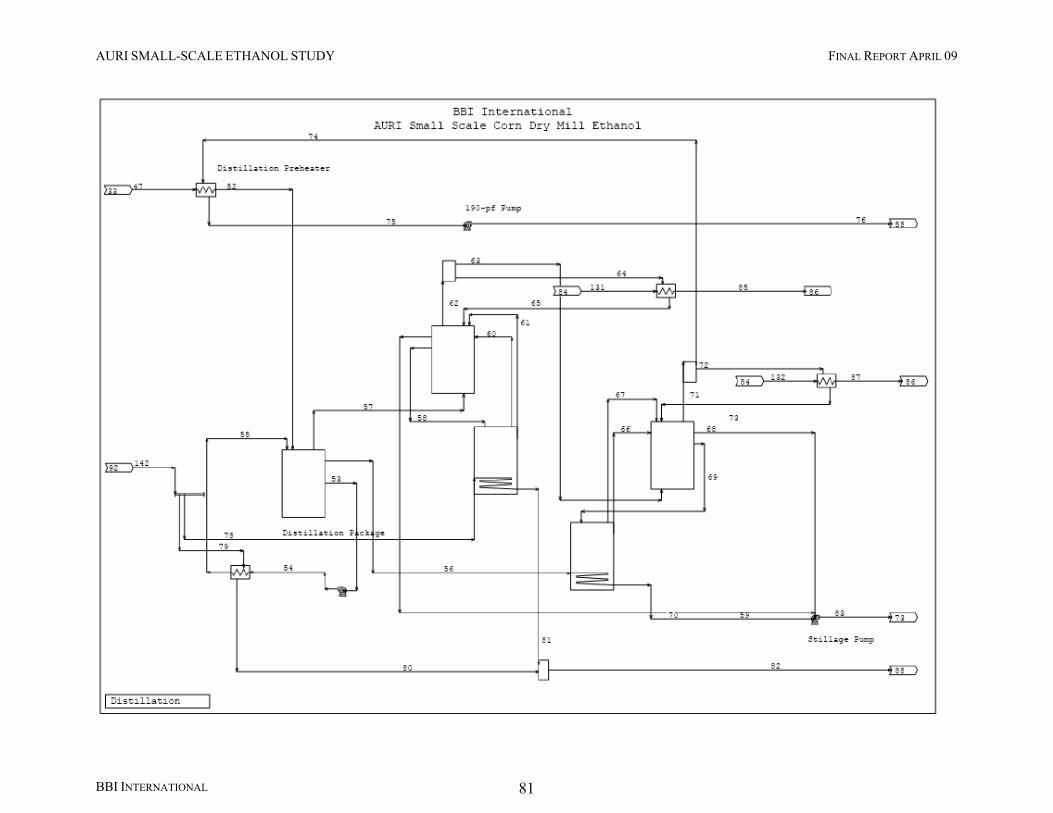
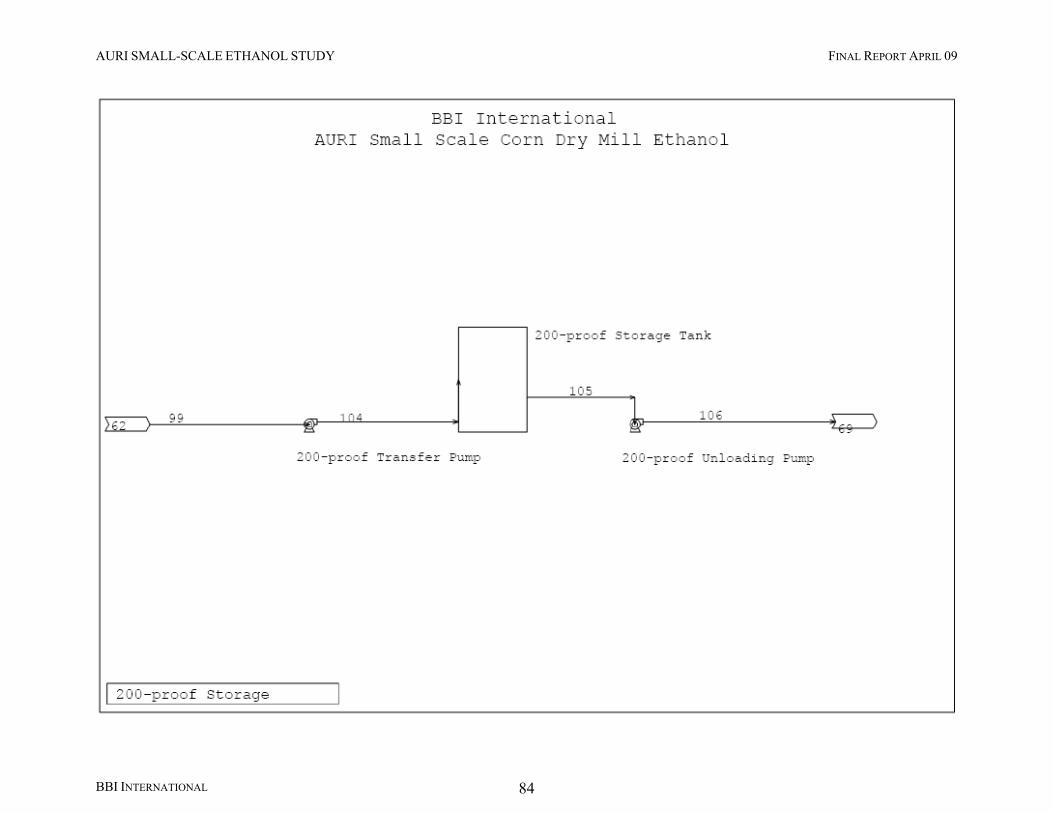
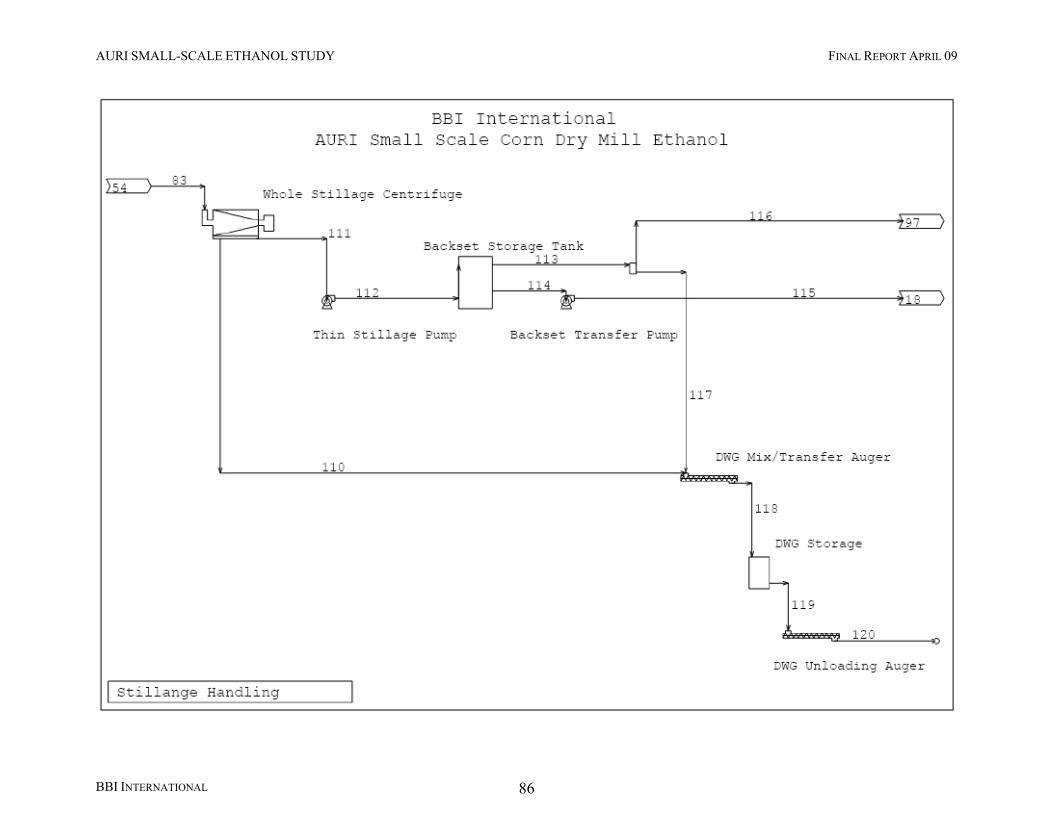
VII. PLANT DESIGN, LAYOUT AND COSTS The production of ethanol or ethyl alcohol from starch or sugar-based feedstocks has been practiced for thousands of years. While the basic process steps remain the same, the process has been considerably refined in recent years, leading to a highly efficient process that now yields more energy in the ethanol and co-products than is required to make the products. Process Description In the small-scale dry milling process, corn is ground into meal and slurried with water to form a mash. Enzymes are added to the mash to convert the starch to glucose. Ammonia is added for pH control and as a nutrient for the yeast. The mash is processed through a high temperature cook step, which reduces bacteria levels prior to fermentation. The mash is cooled and transferred to the fermenters where yeast is added and the conversion of sugar to ethanol and carbon dioxide (CO2) begins. After fermentation, the resulting beer goes to distillation where the ethanol is separated from the mixture; this step also produces a high solids stillage stream. The ethanol is concentrated to 190-proof via conventional distillation and then is dehydrated to approximately 200-proof in a molecular sieve system. The anhydrous ethanol is blended with about 5% denaturant (usually gasoline) and is ready for use. The stillage is separated into a coarse grain fraction and a soluble fraction by centrifugation. Some of the soluble fraction is recycled to the front of the process, and the remainder is blended with the solids to produce a modified wet distiller’s grain (WDG) product that is about 30% solids. A block diagram of this small scale process is shown in Figure 8.
Figure 8 – Flow Diagram for Small Scale Dry Mill Ethanol Plant
BBI INTERNATIONAL 32
AURI SMALL-SCALE ETHANOL STUDY FINAL REPORT APRIL 09
The most apparent difference between this conceptual design and that of a typical dry mill is that the small-scale plant will not have evaporators or a dryer for the stillage handling steps. This exclusion is made because of the small amount of feed product and its use in the local area. Even a larger dry mill will forgo installing the drying systems if there is the opportunity to serve a local market. Design Basis All three scenarios share the same design basis. Following is a detailed description of the operational parameters of the plants. Feedstock is delivered by truck and stored on site in silos (TNK-0001) that have a seven day capacity. From the silos (TNK-0001) corn feeds into the hammer mill (MLB-0001) where it is ground to 1/16th inch flour. The flour travels down a weigh belt (CVT-0001) that measure the amount of flour going into the wet mixing conveyor (CVS-0001) where the flour is combined with backset and makeup water to achieve 33% solids and goes into the Liquefaction Tank (TAK-0001). Enzymes are also added to start breaking down starch and lower the viscosity of the mixture. The tank has a 10 minute residence time to ensure adequate slurrying of the material. From here it is pumped (PMC-0002) through a steam heater (PIP-001) with a 10 minute retention time to sterilize the stream. Because this results in increased pressure the mash passes through an atmospheric flash drum (FLA-0001) to bring pressure back down before getting pumped (PMC-0003) into the Saccharification Tank (TAC-0001), and additional enzymes are added. There are two Saccharification Tanks (TAC-001) each with a 12 hour residence time. This allows for enough material to be built up prior to fermentation. During saccharification the material is pumped (PMC-004) through a heat exchanger (HTX-0001) to maintain the appropriate temperature conditions. Fermentation is operated as a batch process, with each tank (TAK-0002) containing 12 hours of material. The whole process, of loading, fermentation, unloading, and cleaning each tank takes 48 hours. There are four tanks (TAK-0002), pumps (PMC-0005), and heat exchangers (HTX-0002) that allow fermentation to operate at a semi-continuous process as far as the rest of the process is concerned. At the end of fermentation, the stream is loaded into the Beer Well (TAK-0004), which acts as a buffer between the batch fermentation operations and the continuous distillation and back-end of the plant. It has the capacity to hold 18 hours of material. From here, material is pumped (PMC-0008) to distillation. Carbon dioxide is generated during fermentation. It contains trace amounts of ethanol and other VOCs, and so it is collected from each fermentation tank and the beer well and sent to a scrubber (ABS-0001) where it is cleaned to allow atmospheric venting. The liquid material coming out of the bottom is pumped (PMC-0009) back into the beer well (TAK-0004). Distillation is used to separate the ethanol from the broth. It generates a 190-proof vapor stream, which is condensed against the incoming beer (HTX-0004) and pumped (PMC-0010) through a chiller (HTX-0008) to ensure full condensation and is stored for up to 7 days in a tank (TNK-
BBI INTERNATIONAL 33
AURI SMALL-SCALE ETHANOL STUDY FINAL REPORT APRIL 09
0012). From this tank it is pumped (PMC-0013) through another heat recovery exchanger (HTX-0009), fully reboiled (TNC-0003), and sent through dehydration (SPC-0001). The dehydration units generate a 200-proof ethanol vapor stream. This stream is condensed (HTX-0010) and pumped (PMC-0014) to a 7-day storage tank (TNK-0013). From here the anhydrous ethanol is pumped (PMC-0015) through a mixer (MIX-0006) that meters in denaturant before entering the final storage tank (TNK-0014). This tank is equipped with a pump (PMC-0016) for loadout. The residual material from the bottom of the distillation unit is pumped (PMC-0012) through centrifuge (CED-0001) to separate the suspended solids. The centrate is pumped (PMC-0017) to a holding tank (TNK-0015) and up to 85% is recycled (PMC-0018) to the front of the process, with the remainder being remixed with the solids (CVS-0002), and stored in a short-term storage tank (TNK-0017) before being unloaded (CVS-0003) for use a animal feed. The plant runs a closed-loop cooling water system (TWC-0001) requiring makeup water only for blowdown and evaporative losses. A single pump (PMC-0019) services the plant. It also generates its own steam via a package natural gas boiler (STB-0001). The plant has a process water tank (TNK-0018) which holds 7 days of water. Material Balance In order to generate a capital cost estimate, BBI prepared a mass balance for each scenario. The following assumptions were used in the modeling:
• 80% starch conversion; • 90% fermentation efficiency; • Yeast direct-pitched to fermenters at 2 lb/1,000 gal; • 0.5% ethanol loss through scrubber; • Denaturant addition to 3% v/v; • Maximum backset recycle 85%; and • DWG product max 30% solids.
The following table shows the corn composition used for the modeling.
Table 7 – Corn Compositional Analysis Dry Basis (%) As Received (%)
Starch 74 62.9 Protein 8 6.8 Fiber 10 8.5 Fat/Oil 4 3.4 Ash 1 0.85 Other 3 2.55 TOTAL DRY 100 --- Moisture --- 15 TOTAL --- 100
BBI INTERNATIONAL 34
AURI SMALL-SCALE ETHANOL STUDY FINAL REPORT APRIL 09
Using this information, BBI developed the material balance using Metsim process modeling software. Process flow diagrams (PFDs) from Metsim are presented in APPENDIX D. The material balance is shown for each scenario in the table below.
Table 8 – Overall Mass Balance
Case 100mgy 1mmgy 2mmgy Stream (ton/day) (ton/day) (ton/day)
Wastewater 1.32 13.22 26.44 Total Output 111.44 1,114.39 2,228.78
In addition to the overall material balance, the modeling determined utility usage for each scenario. BBI uses a financial model that is based on inputs in usage per gallon of ethanol produced or per bushel of feedstock processed. The following table presents the financial model utility inputs based on the process modeling output.
Table 9 – Utility Usage for Financial Model
Utility Unit Value Makeup Water 1,000 gal/bushel 0.019 Wastewater 1,000 gal/bushel 0.003 Thermal Energy BTU/denatured gallon 21,190 Electricity kWh/bushel 0.75
BBI INTERNATIONAL 35
AURI SMALL-SCALE ETHANOL STUDY FINAL REPORT APRIL 09
Equipment List The process modeling also generates an equipment list for the plant. Each scenario run for this study has the same equipment, so the following equipment list is valid for all scenarios.
AURI SMALL-SCALE ETHANOL STUDY FINAL REPORT APRIL 09
Name Type Qty Backset Transfer Pump Pump 1 CWS Pump Pump 1 Condensate Pump Pump 1 Process Water Pump Pump 1 Dehydration Unit Molecular Sieve 1 Boiler Steam Boiler 1 Saccharification Tank Process Tank 2 Liquefaction Tank Process Tank 1 Fermentation Tanks Process Tank 4 Beer Well Process Tank 1 190-proof Reboiler Heat Exchanger 1 Storage Silos Silo 1 Denaturant Tank Process Tank 1 Distillation Package Distillation Columns 1 190-proof Storage Tank Process Tank 1 200-proof Storage Tank Process Tank 1 Fuel Ethanol Storage Tank Process Tank 1 Backset Storage Tank Process Tank 1 DWG Storage Process Tank 1 Process Water Tank Process Tank 1 Cooling Tower Cooling Tower 1
The centrifuge, distillation, and dehydration equipment is the longest lead time equipment, though wait times may be shorter than for similar equipment for a larger 100-mmgy plant. This list does not include electrical equipment like transformers, which if required have lead times of about 12 to 18 months. However, much of this equipment may be available from projects that have been canceled, though such equipment would be much larger than required for a small scale plant. Also, recent project cancellations (not only relating to ethanol projects) may have freed production capacity and could result in shorter lead times.
BBI INTERNATIONAL 37
AURI SMALL-SCALE ETHANOL STUDY FINAL REPORT APRIL 09
BBI INTERNATIONAL 38
Capital Equipment Cost Using the equipment list for each scenario, BBI estimated the cost of the installed plant. This cost is for the plant construction only, and does not include any potential site work or infrastructure improvements that may be needed.
AURI SMALL-SCALE ETHANOL STUDY FINAL REPORT APRIL 09
VIII. PROJECT STATISTICS The project statistics shown in the following tables are general guidelines only and may change with the specific plant design and other project variables. Refer to the Appendices for specific statistics. Ethanol Plant Statistics The following table shows the project statistics for each scenario. In the case of 100,000 gallon per year plant, it is likely that smaller fuel trucks will be used in order to ship the product to market more quickly.
AURI SMALL-SCALE ETHANOL STUDY FINAL REPORT APRIL 09
BBI INTERNATIONAL 40
Personnel Requirements The personnel requirements used in the feasibility study are listed in Table 13. The positions and salaries shown are typical of the industry. Labor is a far more significant operating cost for a small-scale plant when compared to a typical 50-mmgy plant. BBI believes this is the bare minimum of employees for these sizes of plants and will require long work hours. It is assumed that the plant operates 24 hours per day; otherwise, there is stranded capital in equipment not being used. Operators of small-scale ethanol plants will need to be creative in their labor allocation.
Table 13 – Personnel Requirements for Plants
Position 100,000-yr 1-mmgy 2-mmgy Annual Salary Administration/Management
AURI SMALL-SCALE ETHANOL STUDY FINAL REPORT APRIL 09
IX. REVENUE OUTLOOK AND FINANCIAL ANALYSIS BBI prepared three financial scenarios to evaluate the performance of small-scale ethanol production at three scales. The three scales are 100,000 gallons, 1,000,000 gallons and 2,000,000 gallons of ethanol production per year. Additionally, a fourth scenario was created to observe if there was a benefit to producing 1,000,000 per year but for only half the year—this involves building a 2,000,000 gallon plant and operating it half the time. The key model inputs include product and co-product yields, product and raw material pricing, shipping costs, labor costs, energy consumption and pricing, capital costs including engineering, procurement and construction of the ethanol plant and all supporting facilities and systems, project development costs, financing costs, start-up costs, working capital and inventory costs. The BBI model produces a ten-year operating forecast for the project including a balance sheet, income statement, and cash flow statement. The complete 11-year proforma for the dry mill ethanol plants for all three scenarios are included in the appendices. The impact of critical project variables will be determined and the viability of the project with regard to each will be evaluated. Assumptions Used in the Financial Forecast The major variables for the financial analysis are ethanol price, feedstock price, distillers grains price, and energy costs. In addition to these issues, various financial model input sensitivities were analyzed and are described below. The assumptions used in the financial forecasts that have the greatest impact on the project risk and return are:
• Ethanol Price. The ethanol price used in the financial forecast is $1.57 per gallon of denatured ethanol. This price is based on one year average forward ethanol pricing from CME Group. Shipping costs are 5¢/gallon.
• Ethanol Yield. The ethanol yield is an important variable for profitable ethanol
production. The ethanol yield is set at 2.67 gallons of anhydrous ethanol for each 56-pound bushel of #2 yellow corn (at 15% moisture or less) processed.
• Feedstock Price. Corn is priced at $3.87 per bushel based on one year future corn pricing
from the CME Group.
• Wet Distillers Grains. The selling price for DWG is set at 80% of the price of corn on a dry weight basis resulting in a price of $45.53/ton.
• Electricity Price. The electric rate is 5.5¢ per kWh based on average EIA Minnesota
industrial rate.
• Water Usage. 19.0 gallons per bushel.
BBI INTERNATIONAL 41
AURI SMALL-SCALE ETHANOL STUDY FINAL REPORT APRIL 09
• Natural Gas Price. The natural gas price is set at $5.65 per MMBTU based on future NYMEX pricing at Henry Hub plus an additional 70 cent/MMBTU to cover delivery and associated fees.
• Incentive Payments. The financial forecast does not include any state tax credits or
ethanol incentive payments. The Federal Small Producer Tax Credit (60-mmgy and below) is included in the analysis.
• Financing. Senior debt data was included in the base model. For the fractionation and
biomass scenarios financing is assumed at 30% equity and 70% debt at 8.0% interest amortized over 10 years.
Table 14 shows the key project assumptions discussed above plus additional assumptions used in the financial projections.
Table 14 – Assumptions Used In the Financial Forecast
Project and Capital Costs The costs to build a small-scale plant are higher on a per gallon basis. This is primarily due to needing most of the same equipment as a large-scale plant but in smaller volumes. The process designs of these plants generated the following capital costs for plant construction only on a per gallon basis: $17.99 per gallon for the 100,000 gallon plant; $5.06 per gallon for the 1-mmgy plant; $3.75 per gallon for the 2-mmgy plant.
BBI INTERNATIONAL 42
AURI SMALL-SCALE ETHANOL STUDY FINAL REPORT APRIL 09
Table 15 – Small-Scale Average Capital Cost Estimate
AURI Ethanol Project 100,000-gy 1-mmgy 2-mmgy Nameplate Ethanol Production (gal/year) 100,000 1,000,000 2,000,000Anhydrous Ethanol Production (gal/year) 95,238 952,381 1,904,762 Project Engineering & Construction Costs
Total Project Capital Cost $2,623,890 $6,519,140 $9,399,920 Economic Modeling Results Pre-tax average annual Return on Investment (ROI) was used to measure the projected profitability of the project. The results are summarized in Table 16. The ROI is the average of the return for the 11 years of the financial forecast including the construction year. Results that are more detailed are shown on the following pages and the complete 11-year economic forecast for the project is included in the appendices.
BBI INTERNATIONAL 43
AURI SMALL-SCALE ETHANOL STUDY FINAL REPORT APRIL 09
AURI Ethanol Project 100,000-gy 1-mmgy 2-mmgy 11-year Average Annual ROI -81.4% -46.4% -34.0%Internal Rate of Return N/A N/A N/AEBITDA ($237,021) ($118,430) $49,373 Average Annual Income ($641,000) ($907,000) ($959,000)Installed Capital Cost ($/gal) $26.24 $6.52 $4.70 Plant Capital Cost $2,160,000 $5,676,000 $8,254,500 Owner's Costs $463,890 $844,140 $1,146,420 Total Project Investment $2,623,890 $6,520,140 $9,400,920 30% Equity $787,167 $1,956,042 $2,820,276
As evidenced in Table 16, all three of the small-scale ethanol scenarios yield negative financial results. This is due to the current and forecasted low ethanol prices that make profits challenging for existing large-scale plants with no debt. The projects also suffer because they must install much of the same infrastructure as larger plants and cannot achieve economies of scale. Additionally, the capital costs are high when compared with the costs of building a new large-scale ethanol plant. BBI also looked at producing 1 million gallons at a plant operating for only half the year and the ROI was -47% so that is worse than operating either the 1-mmgy or 2-mmgy plant over an entire year. Table 17 through Table 19 show sensitivities for corn price and ethanol price that highlight the conditions where a small-scale plant would be profitable. For comparison, BBI ran a model for a new 50-mmgy plant with the same corn and ethanol prices and the results are still negative with an estimated ROI of -3.8%. Again, the primary reason is the low ethanol price. Sensitivity and Breakeven Analysis The variables that have the greatest impact on the project’s profitability are the delivered price for corn and the ethanol selling price. A series of sensitivity analyses were run to examine the effect of critical parameters on the projected 11-year Average Annual Income. The parameters analyzed include:
• Feedstock Price • Ethanol Price • Thermal Energy Price
• Electricity Price • DWG Price • Capital Cost
The results of these parameter studies are shown in the graphs that follow. Each of the sensitivity figures that follows assumes that only one variable is changing and that all others are constant as listed in the financial assumptions towards the beginning of this chapter. As expected, the projected profitability as measured by the ROI is very sensitive to corn and ethanol prices; moderately sensitive to the DWG price and capital costs; and relatively insensitive to the electricity price and natural gas price.
AURI SMALL-SCALE ETHANOL STUDY FINAL REPORT APRIL 09
Figure 9 – Effect of Corn Price on 11-year Average Annual Income
(100%)
(80%)
(60%)
(40%)
(20%)2.0%
20%
40%
55 3.05 3.55 4.05
Ave
rage
Ann
ual R
OI
Feedstock Price ($/bu)
Feedstock Price Sensitivity
100,000-gy 1-mmgy 2-mmgy 50-mmgy
Figure 10 – Effect of Ethanol Price on 11-year Average Annual Income
(100%)(80%)(60%)(40%)(20%)1.
0%20%40%60%80%
100%
25 1.75 2.25 2.75
Ave
rage
Ann
ual R
OI
Ethanol Price ($/gal)
Ethanol Price Sensitivity
100,000-gy 1-mmgy 2-mmgy 50-mmgy
Base Case →
← Base Case
BBI INTERNATIONAL 45
AURI SMALL-SCALE ETHANOL STUDY FINAL REPORT APRIL 09
Figure 11 – Effect of DWG Price on 11-year Average Annual Income
(90%)(80%)(70%)(60%)(50%)(40%)(30%)(20%)(10%)
0%20 30 40 50 60 70 80 90
Ave
rage
Ann
ual R
OI
DWG Price ($/ton)
DWG Price Sensitivity
100,000-gy 1-mmgy 2-mmgy
Figure 12 – Effect of Natural Gas Price on 11-year Average Annual Income
(90%)(80%)(70%)(60%)(50%)(40%)(30%)(20%)(10%)1.
0%00 3.00 5.00 7.00 9.00
Ave
rage
Ann
ual R
OI
Thermal Energy Price ($/MMBTU)
Natural Gas Price Sensitivity
100,000-gy 1-mmgy 2-mmgy
BBI INTERNATIONAL 46
AURI SMALL-SCALE ETHANOL STUDY FINAL REPORT APRIL 09
Figure 13 – Effect of Electricity Price on 11-year Average Annual Income
(90%)(80%)(70%)(60%)(50%)(40%)(30%)(20%)(10%)0.
0%020 0.040 0.060 0.080
Ave
rage
Ann
ual R
OI
Electricity Price ($/kWh)
Electricity Price Sensitivity
100,000-gy 1-mmgy 2-mmgy
Figure 14 – Effect of Capital Costs on 11-year Average Annual Income
(120%)
(100%)
(80%)
(60%)
(40%)
(20%)
0%
20%
0.0 1.0 2.0 3.0 4.0 5.0 6.0
Ave
rage
Ann
ual R
OI
Capital ($MM)
Plant Capital Cost Sensitivity
100,000-gy 1-mmgy 2-mmgy
The following table shows the change in the projected average annual ROI for the project for changes in both ethanol and corn price.
BBI INTERNATIONAL 47
AURI SMALL-SCALE ETHANOL STUDY FINAL REPORT APRIL 09
Table 17 – Sensitivity and Breakeven Analysis for 100,000 Plant
Feedstock and Ethanol Price Sensitivity11-Year Average Annual Return on Investment
AURI Ethanol Project - 2-mmgy2 MMGPY Plant
Financial Summary Based on the assumptions used, small-scale ethanol production is not economically viable at or below two million gallons of production. This is due primarily to current and future ethanol and corn pricing. Each of the evaluated scenarios provided a negative return on investment. BBI recommends that projects development for proposed plants achieving a hurdle of at least +25% ROI. Even if corn prices were lower and ethanol prices were higher, it is still clear that these small-scale plants would be hard-pressed to weather any economic downturns. The current industry—mostly large-scale plants—is struggling with 33 plants idle as of March 2009. It is not advisable to build a small-scale ethanol plant at this time or in the near future.
AURI SMALL-SCALE ETHANOL STUDY FINAL REPORT APRIL 09
X. SUMMARY OF FEASIBILITY ASSESSMENT There are no technical issues or barriers to building a small-scale ethanol plant. There is, however, a significant economic barrier to building a small-scale plant. The process requires a certain amount of equipment to process corn into ethanol and economies of scale cannot be reached at small plants as they still need much of the same infrastructure as larger plants. There are very few examples of existing operating small-scale plants. Most of the small-scale plants are idle due to current economic conditions of high corn and low ethanol prices. At this time, it is not advisable to build a small-scale plant and it is certainly not a project a bank would consider financing. If conditions change and corn returns to historical levels and ethanol prices increase, then it may be possible for a small-scale plant of at least 1-mmgy to be financially viable. There does not appear to be a situation whereby a 100,000 gallon plant can be financially successful.
BBI INTERNATIONAL 50
AURI SMALL-SCALE ETHANOL STUDY FINAL REPORT APRIL 09
Nameplate Denatured Fuel Ethanol (gal/year) 100,000Anhydrous Ethanol Production (gal/year) 95,238Operating Days Per Year 350
1st Year 2nd Year 3rd Year 4th Year 5th Year 6th Year 7th Year 8th Year 9th Year 10th Year AnnualProduct Yields & Energy Consumption Operations Operations Operations Operations Operations Operations Operations Operations Operations Operations Escalation
CO2 Yield (lb/gal) 6.600 6.600 6.600 6.600 6.600 6.600 6.600 6.600 6.600 6.600Percernt of CO2 Produced that is Sold 0% 0% 0% 0% 0% 0% 0% 0% 0% 0%CO2 Sold (ton/year) 0 0 0 0 0 0 0 0 0 0CO2 Price ($/ton) $6.000 $6.060 $6.121 $6.182 $6.244 $6.306 $6.369 $6.433 $6.497 $6.562 1.00%
BBI INTERNATIONAL 52
AURI SMALL-SCALE ETHANOL STUDY FINAL REPORT APRIL 09
AURI Ethanol Project - 100000Production Assumptions, continued 1st Year 2nd Year 3rd Year 4th Year 5th Year 6th Year 7th Year 8th Year 9th Year 10th Year Annual
Construction 1st Year 2nd Year 3rd Year 4th Year 5th Year 6th Year 7th Year 8th Year 9th Year 10th Year(Year 0) Operations Operations Operations Operations Operations Operations Operations Operations Operations Operations
AURI SMALL-SCALE ETHANOL STUDY FINAL REPORT APRIL 09
AURI Ethanol Project - 100000Proforma Income Statement
Construction 1st Year 2nd Year 3rd Year 4th Year 5th Year 6th Year 7th Year 8th Year 9th Year 10th Year(Year 0) Operations Operations Operations Operations Operations Operations Operations Operations Operations Operations
Net Earnings (Loss) for the Year (29,842) (364,510) (580,566) (611,592) (646,778) (685,196) (727,448) (772,814) (821,586) (874,904) (932,542)
Pre-Tax Return on Investment -3.8% -46.3% -73.8% -77.7% -82.2% -87.0% -92.4% -98.2% -104.4% -111.1% -118.5%11-Year Average Annual Pre-Tax ROI -81.4%
BBI INTERNATIONAL 55
AURI SMALL-SCALE ETHANOL STUDY FINAL REPORT APRIL 09
AURI Ethanol Project - 100000Proforma Statements of Cash Flows
Construction 1st Year 2nd Year 3rd Year 4th Year 5th Year 6th Year 7th Year 8th Year 9th Year 10th Year(Year 0) Operations Operations Operations Operations Operations Operations Operations Operations Operations Operations
Cash provided by (used in) Operating Activities Net Earnings (loss) (29,842) (364,510) (580,566) (611,592) (646,778) (685,196) (727,448) (772,814) (821,586) (874,904) (932,542) Non cash charges to operations Depreciation & Amortization 0 83,821 179,516 177,649 175,789 174,315 173,567 172,602 171,446 170,955 170,617
Note 1: Depreciation Method = DDB (Double Declining Balance) or SLN (Straight Line)Note 2: Only 50% of the "1st Year Operations" depreciation shown in the above table is claimed
AURI SMALL-SCALE ETHANOL STUDY FINAL REPORT APRIL 09
APPENDIX B: FINANCIAL FORECAST 1-MMGY PLANT
BBI INTERNATIONAL 58
AURI SMALL-SCALE ETHANOL STUDY FINAL REPORT APRIL 09
Nameplate Denatured Fuel Ethanol (gal/year) 1,000,000Anhydrous Ethanol Production (gal/year) 952,381Operating Days Per Year 350
1st Year 2nd Year 3rd Year 4th Year 5th Year 6th Year 7th Year 8th Year 9th Year 10th Year AnnualProduct Yields & Energy Consumption Operations Operations Operations Operations Operations Operations Operations Operations Operations Operations Escalation
CO2 Yield (lb/gal) 6.600 6.600 6.600 6.600 6.600 6.600 6.600 6.600 6.600 6.600Percernt of CO2 Produced that is Sold 0% 0% 0% 0% 0% 0% 0% 0% 0% 0%CO2 Sold (ton/year) 0 0 0 0 0 0 0 0 0 0CO2 Price ($/ton) $6.000 $6.060 $6.121 $6.182 $6.244 $6.306 $6.369 $6.433 $6.497 $6.562 1.00%
BBI INTERNATIONAL 59
AURI SMALL-SCALE ETHANOL STUDY FINAL REPORT APRIL 09
AURI Ethanol Project - 1-mmgyProduction Assumptions, continued 1st Year 2nd Year 3rd Year 4th Year 5th Year 6th Year 7th Year 8th Year 9th Year 10th Year Annual
Construction 1st Year 2nd Year 3rd Year 4th Year 5th Year 6th Year 7th Year 8th Year 9th Year 10th Year(Year 0) Operations Operations Operations Operations Operations Operations Operations Operations Operations Operations
AURI SMALL-SCALE ETHANOL STUDY FINAL REPORT APRIL 09
AURI Ethanol Project - 1-mmgyProforma Income Statement
Construction 1st Year 2nd Year 3rd Year 4th Year 5th Year 6th Year 7th Year 8th Year 9th Year 10th Year(Year 0) Operations Operations Operations Operations Operations Operations Operations Operations Operations Operations
Net Earnings (Loss) for the Year (58,746) (526,582) (931,085) (942,723) (971,169) (1,001,554) (1,034,845) (1,069,791) (1,106,540) (1,146,408) (1,188,773)
Pre-Tax Return on Investment -3.0% -26.9% -47.6% -48.2% -49.6% -51.2% -52.9% -54.7% -56.6% -58.6% -60.8%11-Year Average Annual Pre-Tax ROI -46.4%
BBI INTERNATIONAL 62
AURI SMALL-SCALE ETHANOL STUDY FINAL REPORT APRIL 09
AURI Ethanol Project - 1-mmgyProforma Statements of Cash Flows
Construction 1st Year 2nd Year 3rd Year 4th Year 5th Year 6th Year 7th Year 8th Year 9th Year 10th Year(Year 0) Operations Operations Operations Operations Operations Operations Operations Operations Operations Operations
Cash provided by (used in) Operating Activities Net Earnings (loss) (58,746) (526,582) (931,085) (942,723) (971,169) (1,001,554) (1,034,845) (1,069,791) (1,106,540) (1,146,408) (1,188,773) Non cash charges to operations Depreciation & Amortization 0 201,069 429,883 428,077 426,433 425,468 425,652 425,650 425,492 426,369 427,555
Note 1: Depreciation Method = DDB (Double Declining Balance) or SLN (Straight Line)Note 2: Only 50% of the "1st Year Operations" depreciation shown in the above table is claimed
AURI SMALL-SCALE ETHANOL STUDY FINAL REPORT APRIL 09
APPENDIX C: FINANCIAL FORECAST 2-MMGY PLANT
BBI INTERNATIONAL 65
AURI SMALL-SCALE ETHANOL STUDY FINAL REPORT APRIL 09
Nameplate Denatured Fuel Ethanol (gal/year) 2,000,000Anhydrous Ethanol Production (gal/year) 1,904,762Operating Days Per Year 350
1st Year 2nd Year 3rd Year 4th Year 5th Year 6th Year 7th Year 8th Year 9th Year 10th Year AnnualProduct Yields & Energy Consumption Operations Operations Operations Operations Operations Operations Operations Operations Operations Operations Escalation
CO2 Yield (lb/gal) 6.600 6.600 6.600 6.600 6.600 6.600 6.600 6.600 6.600 6.600Percernt of CO2 Produced that is Sold 0% 0% 0% 0% 0% 0% 0% 0% 0% 0%CO2 Sold (ton/year) 0 0 0 0 0 0 0 0 0 0CO2 Price ($/ton) $6.000 $6.060 $6.121 $6.182 $6.244 $6.306 $6.369 $6.433 $6.497 $6.562 1.00%
BBI INTERNATIONAL 66
AURI SMALL-SCALE ETHANOL STUDY FINAL REPORT APRIL 09
AURI Ethanol Project - 2-mmgyProduction Assumptions, continued 1st Year 2nd Year 3rd Year 4th Year 5th Year 6th Year 7th Year 8th Year 9th Year 10th Year Annual
Construction 1st Year 2nd Year 3rd Year 4th Year 5th Year 6th Year 7th Year 8th Year 9th Year 10th Year(Year 0) Operations Operations Operations Operations Operations Operations Operations Operations Operations Operations
AURI SMALL-SCALE ETHANOL STUDY FINAL REPORT APRIL 09
AURI Ethanol Project - 2-mmgyProforma Income Statement
Construction 1st Year 2nd Year 3rd Year 4th Year 5th Year 6th Year 7th Year 8th Year 9th Year 10th Year(Year 0) Operations Operations Operations Operations Operations Operations Operations Operations Operations Operations
Net Earnings (Loss) for the Year (75,947) (584,249) (1,090,889) (1,069,976) (1,079,147) (1,087,834) (1,097,200) (1,105,771) (1,113,454) (1,121,307) (1,128,427)
Pre-Tax Return on Investment -2.7% -20.7% -38.7% -37.9% -38.3% -38.6% -38.9% -39.2% -39.5% -39.8% -40.0%11-Year Average Annual Pre-Tax ROI -34.0%
BBI INTERNATIONAL 69
AURI SMALL-SCALE ETHANOL STUDY FINAL REPORT APRIL 09
AURI Ethanol Project - 2-mmgyProforma Statements of Cash Flows
Construction 1st Year 2nd Year 3rd Year 4th Year 5th Year 6th Year 7th Year 8th Year 9th Year 10th Year(Year 0) Operations Operations Operations Operations Operations Operations Operations Operations Operations Operations
Cash provided by (used in) Operating Activities Net Earnings (loss) (75,947) (584,249) (1,090,889) (1,069,976) (1,079,147) (1,087,834) (1,097,200) (1,105,771) (1,113,454) (1,121,307) (1,128,427) Non cash charges to operations Depreciation & Amortization 0 285,576 605,995 603,928 602,188 601,277 601,654 601,975 602,261 603,693 605,536
Note 1: Depreciation Method = DDB (Double Declining Balance) or SLN (Straight Line)Note 2: Only 50% of the "1st Year Operations" depreciation shown in the above table is claimed
AURI SMALL-SCALE ETHANOL STUDY FINAL REPORT APRIL 09
APPENDIX D: DESIGN PFD
BBI INTERNATIONAL 72
AURI SMALL-SCALE ETHANOL STUDY FINAL REPORT APRIL 09
BBI INTERNATIONAL 73
AURI SMALL-SCALE ETHANOL STUDY FINAL REPORT APRIL 09
BBI INTERNATIONAL 74
AURI SMALL-SCALE ETHANOL STUDY FINAL REPORT APRIL 09
BBI INTERNATIONAL 75
AURI SMALL-SCALE ETHANOL STUDY FINAL REPORT APRIL 09
BBI INTERNATIONAL 76
AURI SMALL-SCALE ETHANOL STUDY FINAL REPORT APRIL 09
BBI INTERNATIONAL 77
AURI SMALL-SCALE ETHANOL STUDY FINAL REPORT APRIL 09
BBI INTERNATIONAL 78
AURI SMALL-SCALE ETHANOL STUDY FINAL REPORT APRIL 09
BBI INTERNATIONAL 79
AURI SMALL-SCALE ETHANOL STUDY FINAL REPORT APRIL 09
BBI INTERNATIONAL 80
AURI SMALL-SCALE ETHANOL STUDY FINAL REPORT APRIL 09
BBI INTERNATIONAL 81
AURI SMALL-SCALE ETHANOL STUDY FINAL REPORT APRIL 09
BBI INTERNATIONAL 82
AURI SMALL-SCALE ETHANOL STUDY FINAL REPORT APRIL 09
BBI INTERNATIONAL 83
AURI SMALL-SCALE ETHANOL STUDY FINAL REPORT APRIL 09
BBI INTERNATIONAL 84
AURI SMALL-SCALE ETHANOL STUDY FINAL REPORT APRIL 09
BBI INTERNATIONAL 85
AURI SMALL-SCALE ETHANOL STUDY FINAL REPORT APRIL 09
BBI INTERNATIONAL 86
AURI SMALL-SCALE ETHANOL STUDY FINAL REPORT APRIL 09
BBI INTERNATIONAL 87
AURI SMALL-SCALE ETHANOL STUDY FINAL REPORT APRIL 09
BBI INTERNATIONAL 88
AURI SMALL-SCALE ETHANOL STUDY FINAL REPORT APRIL 09