NCHRP PROJECT 25-25 TASK 64 FEASIBILITY STUDY OF USING SOLAR OR WIND POWER FOR TRANSPORTATION INFRASTRUCTURE Prepared for the AASHTO Standing Committee on the Environment Prepared by: The Louis Berger Group Inc. Morristown, NJ March 2011 The information contained in this report was prepared as part of NCHRP Project 25-25, Task 64, National Cooperative Highway Research Program, Transportation Research Board. SPECIAL NOTE : This report IS NOT an official publication of the National Cooperative Highway Research Program, Transportation Research Board, National Research Council, or The National Academies.
Transcript
NCHRP PROJECT 25-25 TASK 64
FEASIBILITY STUDY OF USING SOLAR OR WIND POWER FOR
TRANSPORTATION INFRASTRUCTURE
Prepared for the AASHTO Standing Committee on the Environment
Prepared by:
The Louis Berger Group Inc. Morristown, NJ
March 2011
The information contained in this report was prepared as part of NCHRP Project 25-25, Task 64, National Cooperative Highway Research Program, Transportation Research Board.
SPECIAL NOTE: This report IS NOT
an official publication of the National Cooperative Highway Research Program, Transportation Research Board, National Research Council, or The National Academies.
Acknowledgements
This study was requested by the American Association of State Highway and Transportation Officials (AASHTO), and conducted as part of National Cooperative Highway Research Program (NCHRP) Project 25-25. The NCHRP is supported by annual voluntary contributions from the state Departments of Transportation. Project 25-25 is intended to fund quick response studies on behalf of the AASHTO Standing Committee on Environment. The report was prepared by Laura Sliker of The Louis Berger Group, Inc. with assistance from Nathan Guedalia of Equidex Energy, LLC. The work was guided by a task group which included Ms. Mia Waters and Mr. Timothy V. Sexton both of Washington State DOT, Mr. James Gates, Ohio DOT; Mr. Steven M. Lund, Minnesota DOT, Mr. Steven Miller, Massachusetts DOT; Dr. Jonathan Rubin, University of Maine; Dr. John Zamurs, New York State DOT; Mr. Bruce H. Bradley, FHWA and Ms. Caroline Paulsen, AASHTO. The project was managed by Nanda Srinivasan, NCHRP Senior Program Officer.
Disclaimer
The opinions and conclusions expressed or implied are those of the research agency that performed the research and are not necessarily those of the Transportation Research Board or its sponsors. The information contained in this document was taken directly from the submission of the author(s). This document is not a report of the Transportation Board or of the National Research Council. NOTE: The Transportation Research Board of the National Academies, the National Research Council, the Federal Highway Administration, the American Association of State Highway and Transportation Officials, and the individual states participating in the National Cooperative Highway Research Program do not endorse products or manufacturers. Trade or manufacturers’ names appear herein solely because they are considered essential to the object of this report.
NCHRP Project 25-25 Task 64
Feasibility Study of Using Solar or Wind Power for Transportation Infrastructure
TOC-1
Table of Contents I. Introduction ........................................................................................................................1
A. Objective of the Research ............................................................................................................ 1 B. Purpose of this Practitioners Handbook ....................................................................................... 1
II. Technological Review and Analysis ......................................................................................2
A. First Source References................................................................................................................. 2 B. Sources of information ................................................................................................................. 4
C. Matrix of REI DOT Project Related Innovative and Readily Reproducible Methods and Procedures ................................................................................................................. 8
III. State DOT Survey , Interviews and Manufacturer Interviews .............................................. 13
A. Methodology and Overall Screener Survey Participation ........................................................... 13 B. Screener Survey Results .............................................................................................................. 14
C. DOT Interviews ............................................................................................................................ 21 1. Methodology .............................................................................................................. 21 2. Summary of Interviews .............................................................................................. 21
D. Manufacturer/Installer Interview Results ................................................................................... 25 1. Methodology .............................................................................................................. 25 2. Summary of Interviews by Topic ................................................................................ 25 3. Conclusions ................................................................................................................ 28
IV. General Design Approach .................................................................................................. 30
A. Introduction ................................................................................................................................ 30 B. Roadside Design and REIs ........................................................................................................... 30 C. Initial Concepts............................................................................................................................ 31 D. Design Criteria ............................................................................................................................. 32
1. Fixed/Permanent Applications .................................................................................. 32 2. Portable Changeable Message Signs .......................................................................... 33 3. Temporary Application and Work Zones ................................................................... 34
E. Summary ..................................................................................................................................... 35
NCHRP Project 25-25 Task 64
Feasibility Study of Using Solar or Wind Power for Transportation Infrastructure
TOC-2
F. Case Study: Carver, Massachusetts ............................................................................................ 35 V. Life Cycle Cost Analysis ...................................................................................................... 37
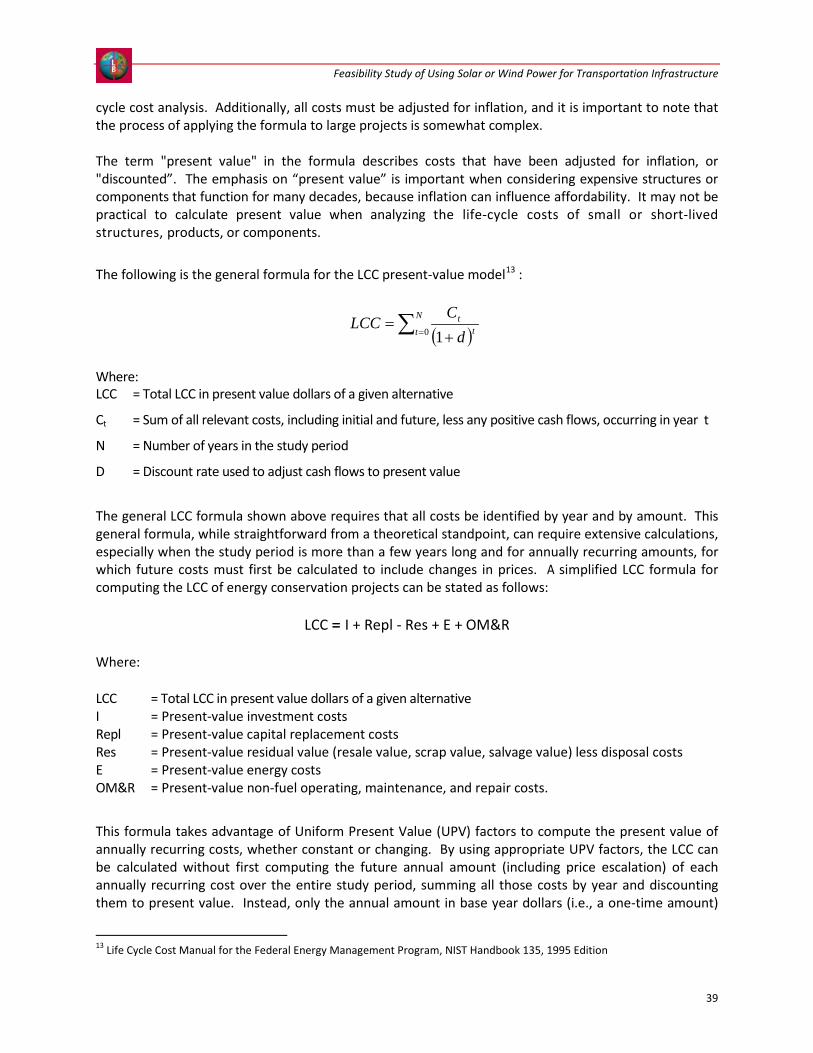
A. Introduction ................................................................................................................................ 37 B. Basics of Life Cycle Cost Analysis ................................................................................................ 38
C. DOT LCCA Tool and its Usage ...................................................................................................... 42 D. Representative Examples ............................................................................................................ 44
1. Example 1 – REI Based Variable Message Sign .......................................................... 47 2. Roof Mounted Solar PV Example ............................................................................... 51 3. Example 3 - REI Based Lighting Example .................................................................... 55
E. Conclusions ................................................................................................................................. 60 F. Future Research .......................................................................................................................... 61 G. LCCA Glossary of Terms .............................................................................................................. 61
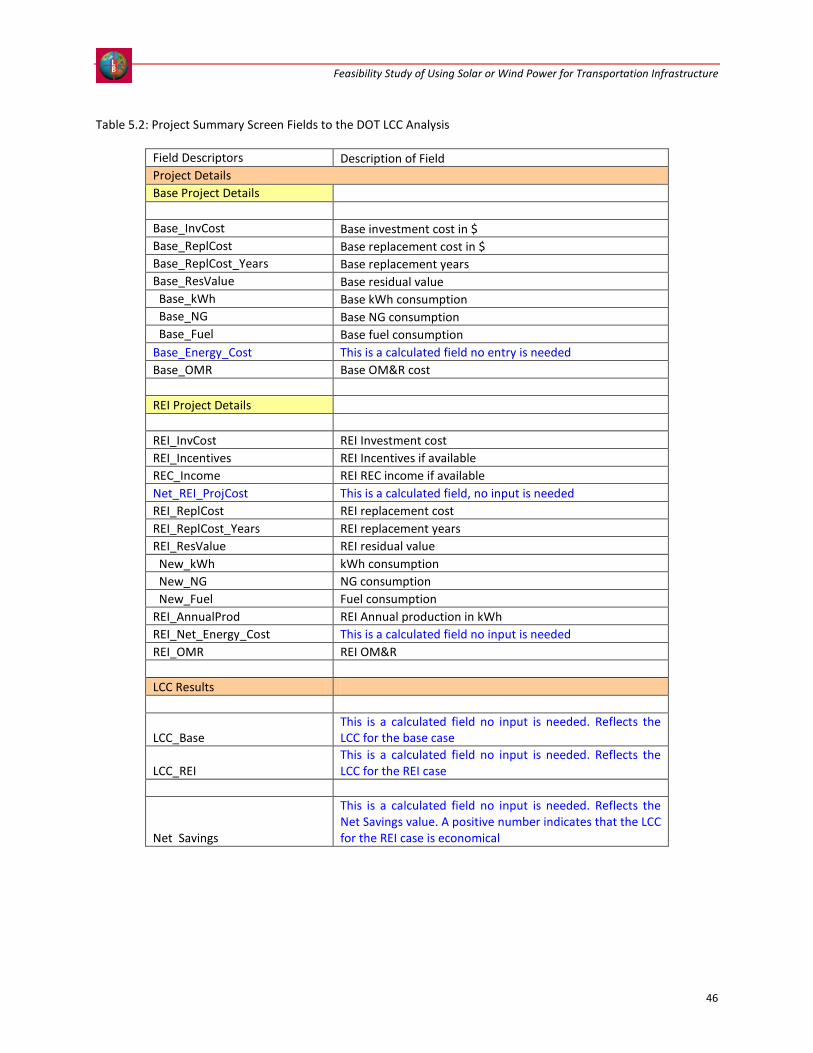
List of Tables Table 2.1 First Source Reference List for Small Solar or Wind Applications ...................................... 4 Table 2.2 First Source Reference List for Small Solar or Wind Resource Analysis ............................. 5 Table 2.3 First Source Reference List for Initial Wind and Solar System Evaluation .......................... 6 Table 2.4 First Source Reference List for Wind and Solar System Applications and Relevant Research for DOT REI Projects in the Near Future .............................................. 6 Table 2.5 Matrix of REI DOT Project Related Innovative and Readily Reproducible Methods and Procedures ................................................................................................................... 9 Table 3.1 State DOT Interviews ........................................................................................................ 21 Table 4.1 Summary of General Design Approach for REI ................................................................. 35 Table 5.1 User inputs screen Fields to the DOT LCC Analysis ........................................................... 45 Table 5.2 Project Summary Screen Fields to the DOT LCC Analysis ................................................. 46 Table 5.3 Example 1 Alternative 1 .................................................................................................... 52 Table 5.4 Example 1 Alternative 2 (REI based VMS)......................................................................... 55 Table 5.5 Example 2 Energy Displacement Problem Setup .............................................................. 56 Table 5.6 Sensitivity Analysis on Initial Investment and Energy Costs ............................................. 57 Table 5.7 Example 3 Alternative 1 (Base Case) ................................................................................ 47 Table 5.8 Example 3 Alternative2 (Solar PV Lights) .......................................................................... 48
NCHRP Project 25-25 Task 64
Feasibility Study of Using Solar or Wind Power for Transportation Infrastructure
TOC-3
Appendices
I. Annotated Bibliography (hyperlinked) II. Online Screener Survey
III. State DOT Questionnaire and Interviews IV. Manufacturer/Installer Questions and Interviews
NCHRP Project 25-25 Task 64
Feasibility Study of Using Solar or Wind Power for Transportation Infrastructure
1
NCHRP Project 25-25 Task 64
Feasibility Study of Using Solar or Wind Power for Transportation Infrastructure
I. Introduction
A. Objective of the Research The objective of this research is to develop technical and case study data on the use of solar or wind power as an alternative power source for a wide variety of transportation infrastructure settings and to present this data in a handbook for use by State Departments of Transportation (DOTs) that are considering the use of Renewable Energy Installations. Renewable energy installations (REIs) have numerous applications and benefits, however, the success of their implementation is dependent on a detailed assessment of a variety of factors. An understanding of the physical, economic, and institutional feasibility factors for implementing various existing and emerging technologies was a core component of this research project. The objective was to provide a framework for identifying and developing innovative tools and techniques for transportation agencies to successfully select and implement appropriate REIs.
B. Purpose of this Practitioners Handbook This tool is intended to be a resource for local, regional, state and federal transportation agencies in their work to integrate existing and emerging technologies into innovative transportation applications, focusing on REIs as a net alternative power source. This Practitioners Handbook reflects the findings of five research tasks under NCHRP 25-25(64). The objective of Task 1 was to conduct an online survey of State DOTs in order to develop and maintain technical and case study data on the use of solar or wind power as an alternative power source in transportation infrastructure settings. The second part of Task 1 involved interviewing manufacturers and/or installers of REIs that work with the State DOTs, to understand the technologies in demand and any new pending technologies that may be used by State DOTs. The purpose of Task 2 was to identify sources of information available that need to be accessed when evaluating viability of possible solar or wind applications. Task 3 involved in-depth telephone interviews with selected state DOTs that participated in the Task 1 online survey, where more detail was sought with regards to how they are using solar and/or wind in transportation infrastructure in their state and what their experiences have been. Task 4 describes a general design approach for locating REIs along the roadside, including what guidelines exist for locating structures within the actual right of way according to FHWA and AASHTO design manuals and guides. And finally, Task 5 explains how to apply Life Cycle Cost Analysis (LCCA) to DOT related REI systems, provides example cases and includes information on using the LCCA calculator that is provided as an attachment to this Handbook as a Microsoft Excel file.
NCHRP Project 25-25 Task 64
Feasibility Study of Using Solar or Wind Power for Transportation Infrastructure
2
II. Technological Review and Analysis Reference information for small wind and solar applications is available from a variety of different sources including:
- scientific research organizations and educational institutions that produce unbiased technical analyses,
- industry-leading trade organizations that provide support for the industry through information and advocacy, and
- government and private blogsites that are open to general input. Taken in combination, this pool of available information is well suited to build a customized reference database for evaluating existing or new project opportunities. Appendix I Bibliography includes the reference material that was used to develop the information guidelines that are presented in this section. Sources are separated into the following categories: solar or wind resource assessment, software analysis tools, internet resources, independent organizations, and books or reports. Some references appear on more than one list because of their multi-purpose content. These references provide helpful information to DOTs and other transportation agencies planning to develop small, on- or off grid renewable energy resources. Each resource provides value in the different aspects of the selection and installation process. In the following sections however, a selection of “First Source References” is presented which provides a short-list of resources to regularly track and use in evaluating and installing REIs.
A. First Source References The science and technology of micro- and small wind or solar methods for specific power supply needs has been an ongoing area of applied research for more than three decades. NGOs such as the American Wind Energy Association (www.awea.org) and the American Solar Energy Society (www.ases.org) are examples of two organizations that work hard to provide information on active and new renewable energy technologies. The federal government through the National Renewable Energy Laboratory (www.nrel.gov/solar or www.nrel.gov/wind), the Solar Energy Technologies Program (www.eere.energy.gov/solar), and Wind Power Today (www1.eere.gov/windandhydro) also strive to meet the need for reliable information about current and new technologies. This collection of websites provides an excellent starting point to review technologies and applications for transportation REI questions. The Energy Information Administration (US DOE) (http://www.eia.doe.gov/fuelrenewable.htm) offers official renewable energy statistics from the U.S. government and individual states. Sun Lab of the Sandia National Laboratories in partnership with the National Renewable Energy Laboratory (US DOE) http://photovoltaics.sandia.gov/ provides information on U.S. Department of Energy Concentrating Solar Power Program. The technology for small renewable energy has evolved as the interest in new types of installations has developed. New applications though bring new challenges, particularly for trying to ensure that technological limitations are identified during development or soon after deployment. Like anything else, experience with solar and wind energy has demonstrated implementation issues that can make or
Feasibility Study of Using Solar or Wind Power for Transportation Infrastructure
3
break a project. For example, the wind may blow everywhere, and the sun might shine sufficiently but if the technology is not specifically suited to local conditions the deployment may prove to be disappointing. There are organizations that continue to provide research to resolve questions important to successful use of solar or wind technologies. The Power from the Sun (www.powerfromthesun.net) for example, tracks developments in solar technology and provides consumer advice. The Energy Savings Trust (http://www.energysavingtrust.org.uk/Generate-your-own-energy), a UK non-for-profit, addressed the importance of micro-scale location of small wind turbines relative to their efficiency and productivity. Their report, Location, Location, Location (see reference list), is a primer on the importance of proper siting. The importance of micro-location also applies to solar panels where sun blockages may be more of an issue to power production than expected. The report made the following conclusions:
a. Wind turbines for urban environment are viable provided proper wind conditions exists and proper siting procedures are applied;
b. General wind maps do not represent well urban conditions where wind can come from varying directions and of speed. As a result wind logging using an anemometer and wind vane are necessary;
c. In order to avoid issues such as noise generated by turbines, ones should consider VAWT which are quieter, work well on structures, and some shapes has good performance at low wind speeds while others has the ability to withstand hurricane force winds;
d. Turbines power curves should be certified by an independent lab in order to avoid ambiguity in reporting of its expected performance;
Several states provide valuable information for evaluating technologies, and even though they are typically focused on one region, methods, approaches, and information may be fundamental to applications located anywhere. The California Solar Center (http://www.californiasolarcenter.org) and Permitting a Small Wind Turbine, A Handbook, Learning from the California Experience, 2003 (www.awea.org) are two examples of source for specific siting models. Practitioners may want to review these sources as a guide for building their own library. The Northeast Sustainable Energy Association is another source for information and networking at http://www.nesea.org/about/. Associations, advocacy, or trade groups often track issues as they develop and promote clarification or response to questions that influence the implementation of technologies. They can also be a vehicle for encouraging new topics for funded research. The Center for Renewable Energy and Sustainable Technology (www.crest.org/solar) is just one group that addresses policy developments in the solar field supported by reports and technologies. Power from the Sun (www.powerfromthesun.net) is continuously updated with solar energy information. Small Wind Systems (www.awea.org/smallwind.html) provides similar support to issues facing wind energy utilization. Using these reference sites as a starting point, DOT agencies or authorities can build a reference database that meets their current project development and advisory needs. Additional reference sites are provided in Appendix I. These include government, commercial business, association, and related groups each of which will have a general approach dependent on their stated mission.
Feasibility Study of Using Solar or Wind Power for Transportation Infrastructure
4
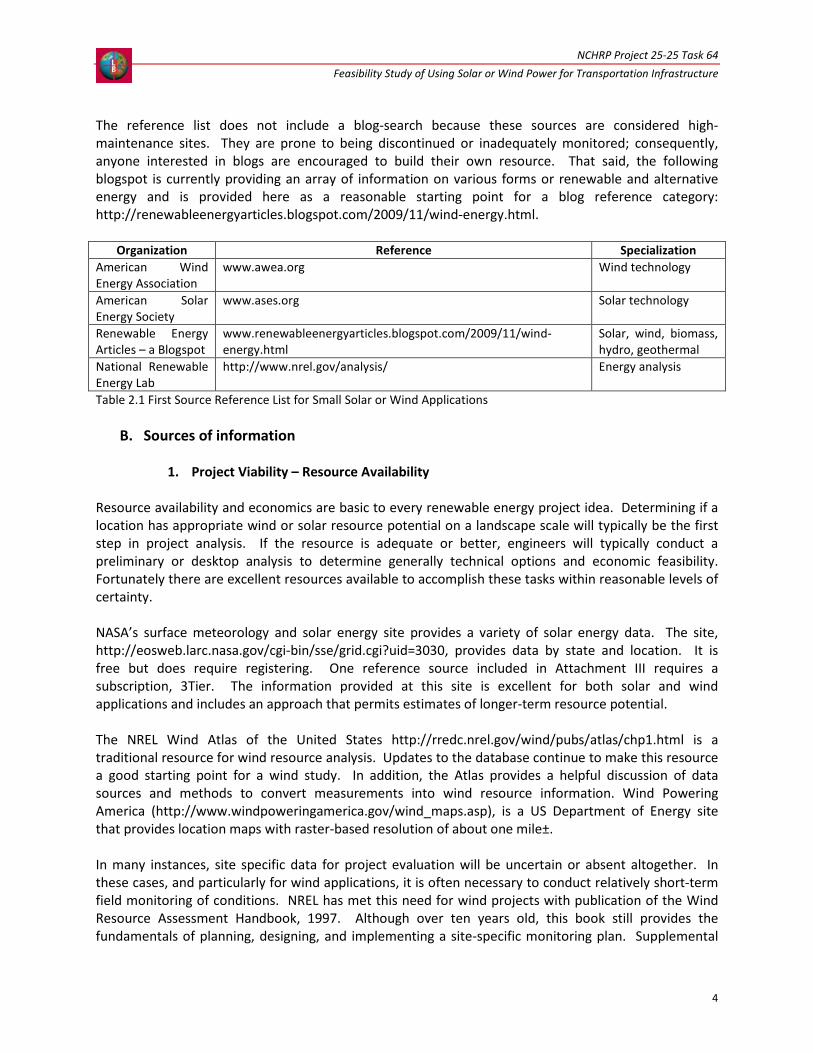
The reference list does not include a blog-search because these sources are considered high-maintenance sites. They are prone to being discontinued or inadequately monitored; consequently, anyone interested in blogs are encouraged to build their own resource. That said, the following blogspot is currently providing an array of information on various forms or renewable and alternative energy and is provided here as a reasonable starting point for a blog reference category: http://renewableenergyarticles.blogspot.com/2009/11/wind-energy.html.
Organization Reference Specialization American Wind Energy Association
Table 2.1 First Source Reference List for Small Solar or Wind Applications
B. Sources of information
1. Project Viability – Resource Availability Resource availability and economics are basic to every renewable energy project idea. Determining if a location has appropriate wind or solar resource potential on a landscape scale will typically be the first step in project analysis. If the resource is adequate or better, engineers will typically conduct a preliminary or desktop analysis to determine generally technical options and economic feasibility. Fortunately there are excellent resources available to accomplish these tasks within reasonable levels of certainty. NASA’s surface meteorology and solar energy site provides a variety of solar energy data. The site, http://eosweb.larc.nasa.gov/cgi-bin/sse/grid.cgi?uid=3030, provides data by state and location. It is free but does require registering. One reference source included in Attachment III requires a subscription, 3Tier. The information provided at this site is excellent for both solar and wind applications and includes an approach that permits estimates of longer-term resource potential. The NREL Wind Atlas of the United States http://rredc.nrel.gov/wind/pubs/atlas/chp1.html is a traditional resource for wind resource analysis. Updates to the database continue to make this resource a good starting point for a wind study. In addition, the Atlas provides a helpful discussion of data sources and methods to convert measurements into wind resource information. Wind Powering America (http://www.windpoweringamerica.gov/wind_maps.asp), is a US Department of Energy site that provides location maps with raster-based resolution of about one mile±. In many instances, site specific data for project evaluation will be uncertain or absent altogether. In these cases, and particularly for wind applications, it is often necessary to conduct relatively short-term field monitoring of conditions. NREL has met this need for wind projects with publication of the Wind Resource Assessment Handbook, 1997. Although over ten years old, this book still provides the fundamentals of planning, designing, and implementing a site-specific monitoring plan. Supplemental
Feasibility Study of Using Solar or Wind Power for Transportation Infrastructure
5
information can be obtained from equipment manufacturers, some of which have web-based protocols and equipment that produces nearly real-time data and analysis. The Solar Energy Industries Association (http://www.seia.org) maintains a list of industry service providers and manufacturers. The State-by-State: AWEA, small wind turbine equipment providers (http://www.awea.org/smallwind/smsyslst.html) provides a list of wind manufacturers and supplier of wind turbines.
Organization Reference Specialization National Aeronautical and Space Administration
http://eosweb.larc.nasa.gov/cgi-bin/sse/grid.cgi?uid=3030 Solar resources
Table 2.2 First Source Reference List for Small Solar or Wind Resource Analysis
2. Project Viability – Preliminary Feasibility Estimating power generation and options for siting small wind and/or solar systems is an excellent way to formulate plans for renewable energy infrastructure. Currently there are several web-bases software tools that allow for excellent, desktop project analyses to be completed. These tools are welcome additions as reference sources for project evaluators. Among the opportunities included in Appendix I are those that permit analysis of renewable systems but also provide training and support to users.
RETScreen (http://www.retscreen.net/ang/home.php) is an internationally accessible site that provides software for both wind and solar project evaluations. All the information needed for use of the free tools is embedded in the site except for some power curves for specific products. These data should be available from the manufacturers. Decision makers use this system to evaluate the financial viability of a renewable project, along with air-quality, emission reduction potentials.
HOMER Energy (http://homerenergy.com/index.html) is a corporation that was formed to commercialize the Hybrid Optimization Model for Electric Renewables (HOMER) that was developed by the National Renewable Energy Laboratory. A helpful and user-friendly software component is available for free. This product specializes in hybrid renewable energy system evaluation. It is designed to help determine which combination of renewable energy production can be optimized for a specific site. For example, some locations are best suited to either solar or wind systems; whereas, some sites benefit from having both technologies installed. Homer provides key data and site analysis to facilitate that determination in rather significant detail. Like RETScreen, HOMER was brought to the public to help establish renewable energy systems around the world, which explains efforts to make both sites user friendly and practical. Other supporting software systems are included in Appendix I and some of them are more sophisticated. The two highlighted here though would provide an excellent basis for anyone wishing to conduct preliminary renewable project evaluation.
Feasibility Study of Using Solar or Wind Power for Transportation Infrastructure
6
3. Related Applications – Staying Current It can be challenging to stay current in ongoing, applied research of technologies such as renewable energy applications. Technological developments related to implementation is further complicated by the fact that improvements may be made for non-DOT systems that still can have direct application for remote infrastructure projects. Trade associations like those in the above tables are useful for tracking developments in the industry and are able to provide assistance to those seeking information.
Organization Reference Specialization RETScreen http://www.retscreen.net/ang/home.php Wind and Solar project evaluation HOMER http://homerenergy.com/index.html Hybrid wind and solar projects F-Chart software http://www.fchart.com/pvfchart/ Software tools for the solar
thermal and solar PV field T*SOL http://www.solardesign.co.uk/ simulation software for solar
thermal and solar PV markets Table 2.3 First Source Reference List for Initial Wind and Solar System Evaluation There are internet sites available to help the practitioner stay current on developments that may be helpful to their renewable energy issues. The Office of Scientific and Technical Information (http://www.osti.gov) manages an information rich website that does list research projects that are currently active as well as those completed over the last 10 years. The site also houses the OSTIblog, a reference tool, which may be used to track current developments. The Solar Energy Technologies Program of the US Department of Energy (DOE) (http://www1.eere.energy.gov/solar/research_development.html) works with stakeholders to provide updates on research needs in the solar area. The site also provides summaries on ongoing research and studies that are planned for the next five years. Research areas are divided into: photovoltaic, concentration power, system integration, and other topics. The DOE also provides research summaries for small wind energy technologies at http://www1.eere.energy.gov/windandhydro/wind_dist_tech.html.
Organization Reference Specialization DOE, Solar Energy Technologies Program
http://www1.eere.energy.gov/solar/research_development.html Solar
Table 2.4 First Source Reference List for Wind and Solar System Applications and Relevant Research for DOT REI Projects in the Near Future
4. Funding Public agencies including DOTs are frequently turning to Public-Private Partnerships (PPPs or P3s) to fund many types of projects, including those that involve renewable energy. A public-private partnership is an agreement between a government agency and non-government organization to work together to accomplish a goal that benefits both the taxpaying public and the private partner. The National Council for Public-Private Partnerships http://www.ncppp.org/index.shtml lists several state
Feasibility Study of Using Solar or Wind Power for Transportation Infrastructure
7
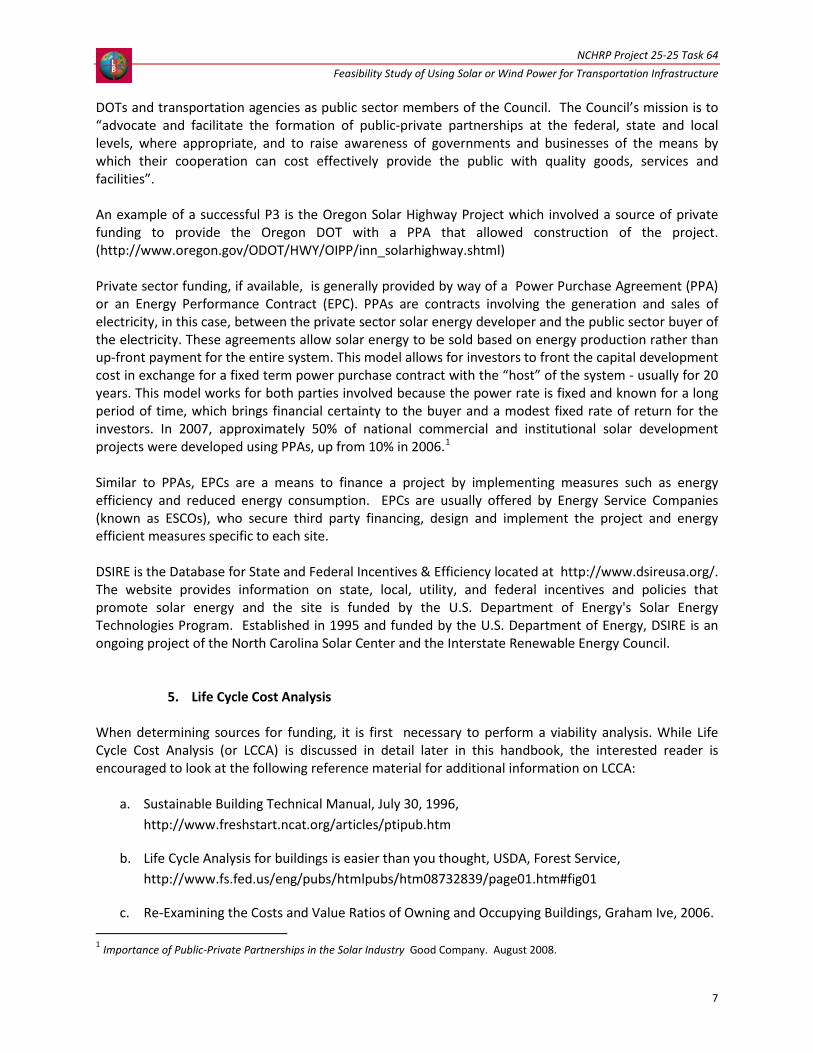
DOTs and transportation agencies as public sector members of the Council. The Council’s mission is to “advocate and facilitate the formation of public-private partnerships at the federal, state and local levels, where appropriate, and to raise awareness of governments and businesses of the means by which their cooperation can cost effectively provide the public with quality goods, services and facilities”. An example of a successful P3 is the Oregon Solar Highway Project which involved a source of private funding to provide the Oregon DOT with a PPA that allowed construction of the project. (http://www.oregon.gov/ODOT/HWY/OIPP/inn_solarhighway.shtml) Private sector funding, if available, is generally provided by way of a Power Purchase Agreement (PPA) or an Energy Performance Contract (EPC). PPAs are contracts involving the generation and sales of electricity, in this case, between the private sector solar energy developer and the public sector buyer of the electricity. These agreements allow solar energy to be sold based on energy production rather than up-front payment for the entire system. This model allows for investors to front the capital development cost in exchange for a fixed term power purchase contract with the “host” of the system - usually for 20 years. This model works for both parties involved because the power rate is fixed and known for a long period of time, which brings financial certainty to the buyer and a modest fixed rate of return for the investors. In 2007, approximately 50% of national commercial and institutional solar development projects were developed using PPAs, up from 10% in 2006.1
Similar to PPAs, EPCs are a means to finance a project by implementing measures such as energy efficiency and reduced energy consumption. EPCs are usually offered by Energy Service Companies (known as ESCOs), who secure third party financing, design and implement the project and energy efficient measures specific to each site. DSIRE is the Database for State and Federal Incentives & Efficiency located at http://www.dsireusa.org/. The website provides information on state, local, utility, and federal incentives and policies that promote solar energy and the site is funded by the U.S. Department of Energy's Solar Energy Technologies Program. Established in 1995 and funded by the U.S. Department of Energy, DSIRE is an ongoing project of the North Carolina Solar Center and the Interstate Renewable Energy Council.
5. Life Cycle Cost Analysis When determining sources for funding, it is first necessary to perform a viability analysis. While Life Cycle Cost Analysis (or LCCA) is discussed in detail later in this handbook, the interested reader is encouraged to look at the following reference material for additional information on LCCA:
a. Sustainable Building Technical Manual, July 30, 1996, http://www.freshstart.ncat.org/articles/ptipub.htm
b. Life Cycle Analysis for buildings is easier than you thought, USDA, Forest Service, http://www.fs.fed.us/eng/pubs/htmlpubs/htm08732839/page01.htm#fig01
c. Re-Examining the Costs and Value Ratios of Owning and Occupying Buildings, Graham Ive, 2006. 1 Importance of Public-Private Partnerships in the Solar Industry Good Company. August 2008.
Feasibility Study of Using Solar or Wind Power for Transportation Infrastructure
8
d. NIST Handbook 135, Life Cycle Costing Manual for the Federal Energy Management Program, and the Annual Supplement to NIST Handbook 135 and NBS special Publication 709, May 2010, http://www1.eere.energy.gov/femp/information/download_blcc.html
C. Matrix of REI DOT Project Related Innovative and Readily Reproducible Methods and
Procedures Table 2.5 highlights different categories of REI applications and procedures that are necessary in selecting and successfully implementing transportation related REIs. This information was gathered from the technological review and analysis which enabled a description of the pros and cons to be prepared for each application and procedure with the identification of available and emerging technologies. Highlighted applications include: highway signage and construction projects applications, intelligent transportation applications, outdoor lighting, accident management and mitigation, reduction in energy consumption in remote locations and provision of new power source. Table 2.6 recommends procedures for the feasibility analysis of new REIs include: assess geographic and climate factors, assess physical feasibility factors, assess financial feasibility factors, and determine maintenance requirements.
Technologies Highway signage and construction projects applications
Arrow boards, message boards, automated traffic management at construction projects
Effective use of REIs coupled with LED technology; Replacement of diesel generator based applications; reduce DOT or Authority need for capital
This is a more common application of REI technology; effective method of building relationships with small disadvantaged businesses and meeting federal or state contracting goals
Cost control for rented equipment needs reliable management system; ensuring installation, monitoring, rapid-maintenance responsibilities
Rules and regulations governing use change frequently, so equipment, performance and applications also change regularly; trade associations and DOT websites are good sources of updates
Intelligent transportation applications including security
Speed control, traffic queue monitoring; school zone warnings and temporary traffic management; security and site monitoring
Effective way to expand coverage where grid-access is unavailable; low energy use, often provides flexibility for user
New opportunities are developing to help with community traffic congestion alerts, security, and monitoring; support driving route optimization bringing significant benefits for lowered emissions and safe driving management
Continuous improvements needed in quality of radio or TV signal to operations and management facility
TV or video coverage is improving; use industry websites for updates
Outdoor lighting applications
Solar or solar/wind outdoor and street lighting in remote areas where grid access is either scarce or
lighting is not suitable for areas where sand storms are prevalent unless special protection is provided to solar panels or turbine blades;
Effective and energy efficient lighting solutions will expand options to use REI powered highway lighting, some new
Requires different type of maintenance for panels or turbines and blades
Follow companies that are providing equipment for current capabilities; trade associations are good sources
NCHRP Project 25-25 Task 64
Feasibility Study of Using Solar or Wind Power for Transportation Infrastructure
Technologies nonexistent or too costly to provide grid power
lighting using battery backed solar is not suitable for areas where winter temperatures may drop below -40F, unless battery heating is provided;
applications include bridge lighting
for new technology; new battery capabilities will enhance application
Accident management and mitigation
Wind turbines in rest stops attract drivers and encourage drivers to stop and refresh; good educational opportunities for renewable energy applications
Deployment of wind turbine solutions is an attraction to drivers; remote management is essential in such applications; cannot rely on skill set of local personnel to manage complex energy projects;
There are many areas in the nation where wind is available which can justify deployment of a turbine
Update local and state regulations regarding installation of wind turbines; explore small and efficient wind turbine topologies for deployment in DOT application;
Educational and outreach opportunities can be learned on government and NGO websites; trade associations will be good source of battery technology updates.
Reduce energy consumption in remote locations or provide a new power source
Use of wind and solar technologies for energy conservation or to meet energy needs.
If designed properly wind and solar technologies will reduce or eliminate facility grid-powered energy consumption.
Deployment of REIs in rest-stop facilities or pull-over lanes
Requires management attention to design efficient maintenance operations and provide skilled personnel
New applications are common; use trade associations and industry advocates to stay current on new case studies
NCHRP Project 25-25 Task 64
Feasibility Study of Using Solar or Wind Power for Transportation Infrastructure
11
Table 2.6 Matrix of Procedures Recommended for the Feasibility Analysis of New REIs
Technologies Assessing Geographic and Climate Factors for Choosing Most Appropriate Application
Initial feasibility analysis to determine renewable energy resource availability
Available analytical tools provide reliable starting point for determining if suitable resources are available; free sites should be adequate for preliminary analysis
Procedure allows numerous sites to be evaluated concurrently and efficiently expand options for consideration
Site specific measurements may still be needed particularly at sites with marginal or average resource potential; output may not consider local or micro-climatic features
Bibliographic references for methods have websites with current content; trade associations will provide updates on new or modified feasibility systems
Assessing Physical Feasibility Factors for Remote Application (off the grid)
Suitability of locations for specific project types; may be related to geography, topography or ecosystem
Initial regional characteristics of a location are appropriate for preliminary analysis but site visits are needed to ensure adequate understanding of physical variability at different project scales
Initial analysis can be done at low cost; experience with siting on regional scales will improve efficiency of site specific analyses
No specific standards so each DOT needs to develop their own criteria and evaluation method; this can change as DOTs share experiences
DOT, trade associations and industry websites provide case studies and sources of information including contacts
Assessing Financial Feasibility Factors for Remote Application (off the grid)
Siting and project development for REI installations
Many applications beyond routine construction other signage are new so analysis may require the input of larger stakeholder group initially; as experience grows financial feasibility will become more efficient and less risky; some projects have been
Individual agencies use their own financial analysis tools; techniques with wider applicability will emerge in the future
Realistic financial analysis may be difficult because of complications with REI systems including variable incentives, interagency complications, and the need for union and non-union labor on the same
Case studies on DOT websites and trade association representatives are sources that should be used for new projects
NCHRP Project 25-25 Task 64
Feasibility Study of Using Solar or Wind Power for Transportation Infrastructure
needed for interagency coordination and permitting and by specific labor rules
project;
Determining Maintenance Requirements for REI
REI installations and project management beyond installation
All systems require some maintenance, e.g. cleaning, recharging, replacement; skilled professionals may be involved with portions of systems; performance requirements of each job will dictate maintenance planning
Installers and manufacturers will provide details of maintenance, life-cycle, and servicing of REI equipment; specific handbooks for project specification may become available
Project locations are variable so servicing and life cycle issues will vary; selection of best technology may have a maintenance component that suggests different product or model
Industry providers and manufacturers are best source of servicing and maintenance information; trade associations may provide case history information related to performance
Feasibility Study of Using Solar or Wind Power for Transportation Infrastructure
13
III. State DOT Survey , Interviews and Manufacturer Interviews
A. Methodology and Overall Screener Survey Participation To accomplish the task of determining what states are using in terms of REI technology, it was determined that a screener survey sent to all State DOTs via email would be the most efficient method. Prior to the development of the online screener survey, the research team and the NCHRP Panel discussed the fact that since the use of solar and wind in transportation infrastructure is a fairly new technology in many states, there may not be only one contact who would be appropriate to complete the screener survey at each DOT. Instead, the survey may require the input of more than one person, and that those persons might be best determined by reaching out to the Maintenance staff and the Systems Operation and Management staff at the DOTs via Ken Kobetsky and the Standing Committee on Highways. With assistance from Mr. Kobetsky’s office the link to the online screener survey was forwarded via email to these DOT departments on July 9, 2010. The DOTs were asked to complete the survey by August 1, 2010. During this time, a total of 23 states participated in the online screener survey as shown in the figure below. The figure indicates which type of renewable energy the state DOT indicated they were using in the survey. Two states: Vermont and Indiana each had two DOT staff complete the survey. Their responses were compared, and since some of the responses varied their responses were compiled into one survey each, so as not to duplicate any of the data and skew survey results.
Figure 1: Online Screener Survey Participation
Feasibility Study of Using Solar or Wind Power for Transportation Infrastructure
14
B. Screener Survey Results
1. Summary The results of the online screener survey indicate that solar is the predominant renewable resource being used in transportation infrastructure among the 23 states that completed the survey. The most common use of REIs was in highway infrastructure, however a few states indicated their use in facilities and even in aviation. REIs were reported to be used in a variety of applications; message boards and signage being the most popular, followed by temporary use traffic control equipment, flashing beacons, weather information systems and traffic counters. Many other applications were also mentioned. The states that completed the survey reported that “saving on infrastructure cost” was the factor that most encouraged REI development in their state. Supporting “green industry” and the “availability of a good solar resource” within the state were also factors that encouraged development. Most states that completed the survey reported an estimated number of projects/roadways that utilize solar technology in their state to be between 10 and 100. Four states reported that they had between 100 and 500 projects/roadways. However, some indicated that they were not sure, or provided a non-numerical response. Six states responded to the question asking for an estimated number of wind projects/roadways. The responses indicated that there were solar/wind combination sites, and that there were rest areas, a truck station and traffic counters that utilized wind. One state was unable to provide an answer. When the states were asked to estimate the total size of their DOT program in terms of power generation, more than half of the respondents indicated that they did not have an answer to provide. The majority of those that did provide an estimate, said that the total size was less than 100kw. Nearly half of the states that completed the survey volunteered to participate in a telephone interview to examine their program more in-depth. Eight states were selected for participation in detailed telephone interviews in the following part of this Task.
2. Detailed Survey Report The following section provides a look at the screener survey in detail and the resulting data report, processed in late August 2010. Data is displayed in the chart and the table that accompanies each survey question. The original screener survey sent to the State DOTs can be found in Appendix II.
Feasibility Study of Using Solar or Wind Power for Transportation Infrastructure
15
1. Does your state DOT currently use Renewable Energy Installations (REIs) in the form of solar or wind units for transportation infrastructure? REIs include grid connected and off-grid applications such as lighting and signage at intersections and interchanges, rest areas, illuminated rights of way / bridges, and variable message signs, including mobile operations, portable arrow boards and similar message systems.
Yes
No (please explain) 2. Which renewable resource do you utilize? (check all that apply)
Solar
Wind
Other (please specify)
Value Count Percent Solar 22 81.5 Total Responses
Wind 5 18.5 23
Value Count Percent
Yes 23 100
Feasibility Study of Using Solar or Wind Power for Transportation Infrastructure
16
3. In what types of transportation settings do you use REIs? (check all that apply)
Highway
Rail
Other, please specify
Value Count Percent
Highway 23 85.2
Other 4 14.8
“Other” responses to this question, in addition to highway, included; Marine, maintenance stations, stockpile buildings, ITS and aviation. 4. What types of applications do you use renewable energy for? (check all that apply)
Highway lighting
Signage
Traffic signals
Temporary-use traffic control equipment
Message boards
Emergency roadside phones
Rest/service area
Other, please specify
Total Responses 23
Feasibility Study of Using Solar or Wind Power for Transportation Infrastructure
17
Value Count Percent
Message Boards 18 26.5
Signage 16 23.5
Other Applications (see pie chart below) 14 20.6
Temporary-use traffic control equipment 10 14.7
Rest/service area 4 5.9
Traffic signals 3 4.4
Emergency roadside phones 3 4.4
hazard/flashing beacons, 4
Weather Info, 4
traffic counters/recorde
rs, 4
speed limit/speed
sensor, 2traffic detector, 1
buildings/stations, 3
advisory radio, 1
cameras, 1
remote signage, 1
marine lighting, 1
over height vehicle detection,
1Other Applications
Total Responses 23
Feasibility Study of Using Solar or Wind Power for Transportation Infrastructure
18
5a. How many projects/roadways associated with your state DOT utilize this technology? (please estimate if you are not sure)
Solar
A total of 19 states responded to the question regarding how many solar projects/ roadways associated with your state DOT utilize solar technology. Four states chose to respond with the following statements:
• “All construction jobs utilize solar/arrow message boards” • “many” • “limited remote signage” • “Not sure”
5b. How many projects/roadways associated with your state DOT utilize this technology? (please estimate if you are not sure)
Wind Six states responded to this question. One state reported three wind/solar combination sites, one state noted that there were “two safety rest areas”, and the remaining three states reported one wind site in their state. One of those three it was noted that one is a “truck station”, and one state elaborated to say that there would be “more traffic counters soon”. One state noted that the question was not applicable.
0
2
4
6
8
1-9 10-100 101 -500 other
Solar
Number of projects and/or roadways
# of states
Total Responses 19
Total Responses 6
Feasibility Study of Using Solar or Wind Power for Transportation Infrastructure
19
6. Please make an approximate estimate of the total size of your DOT program in terms of annual power generation. This estimate is for all solar or wind applications used by your DOT last year.
Less than 100kW
Between 100kW and 1000kW
Over 1000kW
Do not know 7. Please check the factors that encourage REI development by your DOT. (check all that apply)
Carbon Footprint reduction mandate or plan
Renewable energy portfolio standard
State Climate Action Plan
Save infrastructure cost
Support “Green Industry” in your state
High wind resource in your state
Good solar resource in your state
Support REI demonstration project in your state
Livable and Sustainable Communities Initiative
Renewable energy state statute/legislation
Generation of renewable credits
Value Count Percent
Do not know 12 57.1
Less than 100kw 7 33.3
Between 100 kw and 1000 kw 1 4.8
Over 1000kw 1 4.8
Total Responses
21
Feasibility Study of Using Solar or Wind Power for Transportation Infrastructure
20
8. Would you be willing to speak with us further on this topic? If not yourself, is there someone else at your State DOT who may be willing and available within the next few months for a brief discussion? We will also want to discuss and learn how your state does its cost-benefit or other financial analysis of REI infrastructure projects.
Yes, provided below
No, thank you
Value Count Percent
Save infrastructure cost 19 35.8
Support “Green Industry” in your state 9 17
Good solar resource in your state 9 17
Carbon Footprint reduction mandate or plan 4 7.5
Support REI demonstration project in your state 3 5.7
High wind resource in your state 3 5.7
Livable and Sustainable Communities initiative 2 3.8
State Climate Action Plan 2 3.8
Generation of renewable credits 1 1.9
Renewable energy/portfolio standard 1 1.9
Total Responses 23
Value Count Percent
Yes 13 56.5
No 10 43.5
Total Responses 23
Feasibility Study of Using Solar or Wind Power for Transportation Infrastructure
21
C. DOT Interviews
1. Methodology
State DOTs were selected for interview based on their participation in, and responses to, the online screener survey presented above. The following factors were used as criteria in determining which states would make the best candidates for case study interviews: use of solar and wind power systems, geographical diversity, solar and wind resource diversity, size of program or number of projects, range of infrastructure, advancement of equipment and use of emerging technology, and financial and technical success. Interview questions were developed, commented on, and revised per Task 64 Panel input in early September 2010. A copy of the interview questions is attached in Appendix III. The telephone interviews usually involved several participants and averaged about 60 minutes each. Interview participants included maintenance and electrical engineers usually in cooperation with a representative of the state’s Intelligent Transportation Systems (ITS) department or a similar department or division. In some cases, the person who completed the online survey was not the appropriate person with which to conduct the interview, and other arrangements needed to be made. In some cases, even the person(s) who the interview was conducted with, were not able to gather all of the information needed to answer the interview questions sufficiently. However, many people participated in contributing to these interviews, whether directly or indirectly, and their efforts in contributing to this research are greatly appreciated. A total of ten states attempted to participate in the interviews. However, only eight states were able to provide enough information to report in this study. The full results of those eight complete interviews are found in Appendix III. The states that participated and some of the applications they use are as follows:
State Interviewed Renewable Application
WI ITS Engineer & ITS R&D Rep Solar PCMS, microwave detectors VT ConnectVermont Director Solar VMS TX DOT Engineer & DOT Electrician Solar Flashing beacons, navigational lighting IA ITS Rep & 2 Transdata Reps Solar /Wind PCMS, cameras, advisory radio, speed
sensors (wind and solar) SD DOT Maint. Engineer Solar / Wind RWIS PA DOT Director Maint/Ops &
Div. Chief Facilities Mgmt Solar Stockpile buildings (pilot projects), VMS,
flashers UT DOT Maintenance Engineer Solar/Wind Maintenance Station ME ITS Manager & ITS Comm. Tech Solar VMB, RWIS
Table 3.1 State DOT Interviews
2. Summary of Interviews Consistent with the results of the online screener survey, solar is the predominant renewable resource being used in transportation infrastructure among the eight states interviewed as well as across the country as reflected in the results of the online screener survey. Six of the eight states interviewed have been using solar panels in transportation infrastructure for over 10 years. Vermont and Utah have been
Feasibility Study of Using Solar or Wind Power for Transportation Infrastructure
22
using solar for just over 5 years now. A few of the states indicated that they have tested out wind applications, or are considering doing so, but are still in the learning stages of how to economically capture and convert the potential of wind energy. The following sections summarize the results of the interviews by common themes, while full notes from each interview can be found in Appendix III.
a. Common Applications Most of the states interviewed explained that they utilize solar to run ITS program signage along state highways. These signs are referred to by a number of names including portable changeable message signs (PCMS), variable message signs (VMS) and variable message boards (VMB). States also explained that they use solar to power flashing beacons, which warn drivers of several different types of situations in the road ahead including; road curves, school zones, signal ahead, flooded roads, and trucks entering the roadway. States are also using solar to power road weather information systems (RWIS). It was indicated that a combination of these applications would sometimes be used together, to form one unit, powered by solar. These applications may be temporary or permanent. Traffic counters and cameras were also being powered by solar. In Texas, solar is being used to power navigational lighting on bridges. Two of the states interviewed, Pennsylvania and Utah, have installed roof mounted solar panels in association with their DOT facilities. Both of these projects were supported by State energy grants, which considering the low cost of electricity in Utah (approximately .08 per kwh), is what made the project practical to pursue for Utah DOT. Both projects were pursued as pilot projects to allow the states to gain more experience with solar and demonstrate its feasibility. The facilities associated with Utah and Pennsylvania’s roof mounted projects remain grid-connected due to the critical function of these facilities, especially during bad weather. While they have not experienced any difficulties with the solar units yet, the risk of the building being completely dependent on solar is too high.
b. Advantages of REIs The common theme among all DOTs was that solar makes locating signage not only more convenient due to portability, but practical for remote locations. Interviewees explained that there is sometimes an immediate need to locate a sign whether associated with an increase in accidents in a specific location, or associated with road construction. Solar is extremely practical because it allows the portability needed to quickly place a sign where it is needed within the ROW. Solar is also safer in construction zones because it eliminates the need for diesel generators which are not only an added liability to motorists, they contribute to poor air quality. The availability of solar powered signage has made it possible to locate signs in critical remote locations, where running electricity to such remote locations was formerly very cost prohibitive or impossible due to terrain. Most DOTs expressed that this was their main reason for using solar REIs and that they were very happy with the results. The units were described as relatively self sufficient and allowing the DOT the opportunity to make the roadway safer for travelers.
c. Zoning and Regulations In most states, the DOT owns the ROW and subsequently they are exempt from local zoning. However, this may not be the case in all states, such as Vermont, where the Transportation Agency does not own the right of way (ROW), and instead it is locally owned. In this type of situation, it may be necessary to work closely with local authorities with regards to property issues and/or aesthetics. For example, one
Feasibility Study of Using Solar or Wind Power for Transportation Infrastructure
23
issue arose where Vtrans and ConnectVermont needed to place a VMS at a railroad crossing and it was necessary for Vtrans to work with the town in order to get permission from the landowners for the sign to encroach onto private property. Vtrans also had to deal with some state regulations with regards to locating their VMS in the ROW. The State of Vermont does not allow billboards to be placed in the ROW, and Vtrans had to convince the legislature that VMS are not akin to billboards. It took over 2 years, but eventually Vtrans succeeded. No issues were reported at the federal level, but states such as Texas, which locates navigational lighting on bridges, must comply with U.S. Coast Guard and FAA regulations.
d. Energy Storage and Weather The only major maintenance issue with the solar units as described by the states during the interviews was the need to maintain the batteries. With proper battery maintenance, it was reported that backup power could be provided by the battery for anywhere from 3 to 14 days. Some states take care of this battery maintenance issue in-house, while other states have this maintenance issue worked into the contract with a vendor that supplied the solar unit. Maine DOT reported that it has been able to experience significant cost savings by handling the maintenance of the solar units in-house, which is possible due to the high level of expertise of their ITS staff. Weather was not considered to be an issue or a concern for the states interviewed, except that for some states that experience extreme winters, the cold may drain the batteries faster. There are some different options available for choice of battery, and Iowa ITS personnel noted they have had success with absorbed glass mat (AGM) batteries, which tend to have a longer life span. Solar panels were either tilted to avoid snow accumulation or snow removal was dealt with by the DOT or the contracted maintenance vendor as necessary. States did not report issues with snow or ice affecting the capabilities of the panels. Most of the states interviewed have also had to deal with vandalism or theft of the actual solar panels at some point in their program. This is expected to decrease as the public becomes more accustomed to seeing these units and because the cost of solar panels is constantly decreasing. In each case the panel and affected equipment was replaced and additional steps were taken to prevent future incidences from occurring- for example, placing the panels higher off the ground or using protective fencing.
e. Feasibility Among the states interviewed, there were different ways of defining a payback or return on investment when considering the use of REIs. Maine ITS personnel explained that if they can defer one crash because of the proper placement of a sign and communication of its message to drivers, then the cost of the REI has already been recovered. In terms of dollars (discussed in detail under Task 5) the cost of running utilities to a remote location is no longer feasible for DOTs when there is a need to place signage considering the falling costs of solar. With advancements in technology and falling costs of equipment and panels, solar has now become the most practical option and formal cost-benefit evaluations are rarely done by the DOTs because it is known that the cost of solar is much less than the costs associated with the placement of utilities. Beyond the cost of initial grid-connection, the cost of monthly utilities or meter fees is also not practical for some units that only need to be operating during certain hours of the day (school zones) or under certain environmental conditions (flooded roadway). The varying cost of electricity throughout the country ultimately determines how quickly a state will recover the cost of investing in REIs. However, with the availability of state energy incentives and federal subsidies, the return on investment can be even more quickly realized.
Feasibility Study of Using Solar or Wind Power for Transportation Infrastructure
24
At this time, none of the states were pursuing Renewable Energy Credits (RECs) for their projects. Most states did not think that these small scale projects would qualify for such credits. The REIs that are being used are not measured for energy output. They are designed for a specific purpose and perform as such.
f. Looking Ahead Several states mentioned that they are looking into adding solar powered traffic counting devices that use Bluetooth to track vehicles times between one point and another. Nearly all of the states interviewed confirmed that they will be expanding their solar programs and considering the use of wind in their transportation infrastructure, alone and in combination with solar. Pennsylvania DOT is considering more wind projects, and have been approached by companies that are interested in harvesting the wind created by passing trucks on the highway, and selling the electricity generated back to the grid. PennDOT is also looking at potential highway lighting projects and designing a new district office which will be LEED certified using solar and wind to generate electricity. Wisconsin DOT is looking at using fuel cells which involve a methanol powered generator as an emergency backup for some of their solar units, however it may be cost prohibitive. They are also looking at solar/wind hybrid units and gaining more experience with locating wind units at lower elevations. Utah DOT mentioned that they are exploring a green technology that is neither solar or wind, but instead “harvests mechanical energy imparted to roadways, railways and runways from passing vehicles, trains and pedestrian traffic and converts it into green electricity. The system, based on a new breed of piezoelectric generators, harvests energy that ordinarily goes to waste and can be installed without changing the habitat.” This technology involves placing sensors in the paved roadway to harvest the energy of passing vehicles to power any roadside electricity needs. With this technology the roadway and its infrastructure can essentially be self-sufficient.
g. Conclusions In general, the states interviewed were pleased with performance of the REIs that they use and are excited to expand their programs. There were few barriers to successful implementation encountered by the States, and the expectation is that there will be even fewer barriers as the technology continues to improve. Maine ITS personnel recommended that for states that are new to REIs, they should start with a simple pilot project to gain experience. They also stressed that the engineering of the REI must remain conservative, and the project needs to be considered from the DOT perspective (what the DOT needs to get out of it) rather than the vendor’s perspective. Pennsylvania and Utah both pursued pilot projects in order to gain experience with REIs. Some important lessons learned by Utah as a result of their facility roof-mounted solar project were that energy efficiency needs to be considered as a whole, combining the solar project with other measures such as energy efficient lighting in order to obtain the best value. Utah explained that another important aspect is raising the awareness level of the users of the building so that they can change their
Feasibility Study of Using Solar or Wind Power for Transportation Infrastructure
25
behaviors as well, and to share the progress of the renewable energy project with the building occupants so that they can see that how their habits affect the energy use of the building. PennDOT’s REI experience has led them to caution that the procurement process may require a lot of coordination and that upper level support is needed for such projects.
D. Manufacturer/Installer Interview Results
1. Methodology As part of this research, telephone Interviews were also conducted with several manufacturers/installers of REIs. The purpose of the interviews was to ask industry members directly about the technologies that they are being asked to provide or install at DOT facilities and to learn from them about pending technologies that were being prepared for DOT applications. A questionnaire to help obtain these results and targeting specific manufacturers and installers of REI equipment and systems for DOT applications was developed and revised per NCHRP Task 64 Panel input and can be found in Appendix IV. One of the questions that was included in the online screener survey asked DOTs to provide contact information for a manufacturer or installer that they work with on REIs in their state. Based on this identification of specific manufacturers used by DOT agencies, as well as industry knowledge, six interviews were conducted with manufacturers in this field. Manufacturers chosen were representative providers of products and systems that DOTs use in traffic, construction activities, and in facilities to either displace energy consumption (such as lighting) or focus on alternative power. Interviewees were initially contacted to explain the purpose of the survey and study. If there was mutual interest in preceding a phone interview was scheduled. Prior to the phone interview the list of questions (Appendix IV) was sent to each organization to enable them to prepare for the interview. The interview lasted an average of 30 minutes. The results are summarized below and were also used as input to Table 2.5 REI DOT Project Related Innovative and Readily Reproducible Methods and Procedures, as presented earlier in this handbook.
2. Summary of Interviews by Topic
a. Signalization , Temporary Road Signage, Highway Advisory Signs One of the manufacturing companies interviewed specializes in off-grid, solar powered transportation support units that are used for temporary purposes. Components design, deployment, maintenance, and battery technology has advanced to the point where these systems are becoming common; and hence, able to meet many needs. This is a relatively recent development though, so data and performance information related to equipment life-expectancy and associated Life Cycle Cost analysis is pending a longer data history. DOT and transportation engineers are able to determine the requirements for each job and prepare specifications for temporary project support using solar-powered applications. These are typically associated with small electric-load requirements or where access to electricity is limited. Physical or logistical factors favoring the use of this type of equipment includes 1) a quick or short-term need and 2) deployment where there can be little site disturbance. Examples include: school zone signs,
Feasibility Study of Using Solar or Wind Power for Transportation Infrastructure
26
signalization where LED technology is used, highway advisory signs connected to radio alerts, temporary radar units to inform drivers of their speed, and road construction signage. There are no specific standards so currently specifications are based on individual state requirements. The small, solar PV panels used for these purposes vary in size and output. They are specified according to need and often are rated in watts or kilowatts. Equipment has simple mounting brackets for the panels. Energy is used to charge batteries, which also vary in capacity to meet the requirements of the application. Project engineers are specifying battery-only power for anywhere from 7-30 days and the technology is available to meet this range. Component maintenance is small. Generally the solar panels are manually cleaned only periodically depending on the site conditions. Batteries are serviced with water or easily replaced as needed. Equipment warranties are provided by the manufacturer, and therefore, vary. Engineers determine warranty requirements based on each project and work with their contractors to be sure that manufacturer guarantees are appropriate to the project assignment. Future innovations and new applications will follow low-load transportation lighting needs, for example, where LED or magnetic induction light applications are being developed for the transportation industry. Examples of new developments of this type are found in highway lighting and even in roadway TV applications for congestion or security purposes.
b. Portable, LED-Powered Solar Panel Road Signage Portable, trailer-mounted roadway signage equipment is an application that has a history extending back 20 years. One manufacturer specialized in directional arrow and message boards along with radar speed trailers. The only physical limitation to installation of these temporary units is having ongoing access. The units need appropriate sunlight but experience has shown that ambient sunlight is almost always adequate. They have been deployed in northern Ontario where temperatures have reached -40 degrees F. Battery power is usually required for a 10 day period. Unit operational duration though is dependent on the number of batteries specified. As many as 12 batteries can be provided, which would provide almost enough power to last 60 days. The solar systems built by this manufacturer have the same maintenance requirements as other types of solar units; namely, manual cleaning every few months and a distilled water charge for the batteries. Glass-mat or gel-cell batteries with no maintenance needs are available. The trailers require standard maintenance as well, such as lubrication and tire care. A five-year warranty is provided on products or two-years in the case of the battery charger. The equipment adheres to the Manual on Uniform Traffic Control Devices and national HSWA guidelines (Health and Safety Work Act) for features like the appropriate wavelength of light (amber) and height/size of letters based on speed and visibility needs. Each state has its own regulations, so efforts are made to have this equipment placed on the “approved products list.” Monitoring features are provided with the equipment for the purpose of not overcharging or otherwise damaging the batteries. The on-board EMS measures solar panel voltage and amperage and the same for the batteries. Data is displayed on the LCD screen so it is easy to check.
Feasibility Study of Using Solar or Wind Power for Transportation Infrastructure
27
Innovations involving these systems are often related to the benefits of limited or no manpower needs, no odor, and no noise. From a health and environmental standpoint, vehicle collision accidents do not lead to the problematic spill response that exists when diesel is the fuel. Safety related to diesel filling is also no longer a factor.
c. Fixed-Mounted, Grid-Connected Solar Power Solar panels that are permanently mounted provide an entirely different set of options and approaches than available with mobile units. In the manufacturer’s experience, the use of solar power to displace utility service at a major highway exchange was found to be successful and also flexible. Small solar capacity panels can be interconnected in any practical way to generate as little as tens of watts or to more than 100 kW of power. Transformers designed to support fixed-based systems can be sized to handle expansion, so experimental or trial systems can be upgraded more easily. In the particular project examined for this report, the purpose of displacing electric utility was matched by an interest in earning renewable energy credits for the project. This was accomplished by selling the RECs over the long-term to a state energy trust. The project owner retained RECs from years 0-5 and 20-35 years, (a process that has to be determined on a case-by-case basis). System monitoring requirements are greater for installations that have a REC component. The project reviewed here included monitoring of solar irradiance, solar energy production, and weather conditions. Ground mounted systems require more extensive engineering analysis. Systems are mounted according to local weather and soil conditions. In areas prone to high winds, precautionary needs may require special installation features or may even negate the ability to use a certain type of solar power installation. Typically, equipment performance standards are higher than mobile units. Components with UL listing or comparable are specified along with local engineering standards. Maintenance requirements for these systems are the same as other PV products. Panels need to be checked and manually cleaned 1 -2 times each year. In most installations, security fencing is a must. This project, Oregon Super Highway, may spawn a lot of innovation and refinement to fixed-mounted PV arrays. Logistically, the project developers learned to allow more project time for interagency coordination, special construction needs like directional borings and separation of labor needs for AC versus DC construction work. Lessons learned with interagency activities illustrate the need to allow sufficient time for reviews and permits. Importantly, the success of the project was partly the result of individuals within each stakeholder group becoming “champions”. Cooperation among stakeholders should lead to other projects of this type and an increasing database of successful process and procedures. The compatibility of incentives and regulatory requirements also developed into a lesson for others. Projects and funding can be delayed where incentives do not line up well with regulations.
d. Grid-Connected Highway Lights There is a relatively new small-solar powered technology that is designed to offset electricity provided by utilities for highway lights. These solar panels are easily mounted directly to the light poles and provide power to the grid. Each unit has a “smart grid” feature to monitor feed-in loads. There is an inverter with each unit to convert DC to AC. The life expectancy of one of these systems is about 20 years.
Feasibility Study of Using Solar or Wind Power for Transportation Infrastructure
28
Maintenance is limited because the panels are mounted with a pre-designed tilt angle that minimizes effects of wind and ice, whereas, rain acts as a cleaning agent. Each unit is monitored remotely so any change on production would lead to a field check and repair if necessary. The monitoring function also provides energy usage in a form that is appropriate for REC valuation. RECs for the units are currently purchased by a state utility. Units meet standards for UL 1741, IEEE 1547, NEC, and NESC. Innovation needs that led to the development of this product included lower energy use and lower energy infrastructure cost. Continued innovation in the industry is expected as distributed energy becomes more popular and economical. Currently, payback periods are 5-15 years based on location, financial incentives, and electric rates. In addition, these units provide power on an individual, light pole basis, so there is no limit to the number of units that can be installed. The smart grid communication network can be used to monitor and control the assets, which is another innovation provided by this technology.
e. Solar/Wind Hybrid Power Units One manufacturer of highway lighting solutions has small, wind units that can work with solar panels when the location has both resources. The solar panels are typically 50-250 W and the wind turbine 300 W. The turbines are horizontal axis and sit on top of the lighting poles. A higher capacity turbine, for example, 600W would generally require a separate pole for mounting. The renewable power from the solar or solar/hybrid systems is used to charge batteries. Standard batteries can operate 3-5 days without a charge. These can be upgraded if necessary. Maintenance for the hybrid systems is the same as needed for solar panels. The turbine blades are small and do not need special maintenance. Batteries need normal water fills. The light sources do not need much attention although LED lights will need replacement before magnetic induction lights. The life expectancy of the solar and wind units is about 10 years. Batteries will need to be replaced every 3-5 years. The turbines are small and stand alone, so environmental concerns may be minor. High wind-borne sand areas were the only conditions that raised a concern. Potential damage in arid or semi-arid regions could damage both solar panels and wind turbines. Protective surfaces may be available depending on the severity of a location. Very high wind speeds of >50m/s could also damage the installations just as it would any structure. The value of solar/hybrid systems in the industry is evolving. Like pure fixed solar, these units can be monitored for output and calibration to earn renewable energy credits. The fact that the pole and base specifications are the same with or without the REI is a pricing, logistic, and specification advantage. Different installation settings are expected to emerge as the wind technology becomes more familiar. The fact that daytime solar and evening wind is available for energy production can reduce the cost of single solar-panel projects; hence, providing the potential for cost savings.
3. Conclusions Continued innovation in the REI industry is creating new products and applications that are overcoming many of the limitations that traditional applications incurred. Interviews with manufacturers provided insight into distinguishing factors that still exist between REIs. The largest differentiation is between grid connected and mobile REIs. Mounted, grid connected applications provide a different set of
Feasibility Study of Using Solar or Wind Power for Transportation Infrastructure
29
options and approaches than mobile units provide. Grid connection enables applications to generate large amounts of power which can offset other areas of DOT energy use. There is an overall level of assurance with the continued power that grid connection provides. Alternatively, batteries for mobile sources are rapidly improving allowing backup power of up to 60 days and beyond. These applications have been used on DOT signage for more than 20 years but with improved batteries the opportunities are becoming endless for low-load transportation infrastructure particularly lighting needs and TV applications. Other distinguishing factors include the valuation of RECs for the application, the equipment life-expectancy and the data to confirm life-expectancy for new products, ability to combine solar and wind into the application, maintenance requirements, design requirements for weather impacts, and conformance with state and local regulations and national guidelines.
Feasibility Study of Using Solar or Wind Power for Transportation Infrastructure
30
IV. General Design Approach A. Introduction
In order to provide for the safe and efficient flow of traffic along a transportation facility it is necessary to identify a general design approach for alternatively powered systems or renewable energy installations (REI) used by state Departments of Transportation (DOTs) that may need to be located near the roadway. The design of alternatively powered systems must take into account the safety of the public using the roadway, including both motorists and pedestrians. In consideration of these concerns, two of the most widely used manuals in design of roadway facilities were consulted in order to provide a discussion on a general design approach for REIs in transportation. The Manual on Uniform Traffic Control Devices (MUTCD) approved by the Federal Highway Administrator is the national standard for all traffic control devices installed on any street, highway, or bicycle trail open to public travel in accordance with 23 U.S.C. 109(d) and 402(a). The national MUTCD is specifically approved by the FHWA for application on any highway project in which Federal highway funds participate and on projects in federally administered areas where a Federal department or agency controls the highway or supervises the traffic operations.2
In addition, many state and local agencies adopt the same standards for their facilities.
Also consulted was The AASHTO Roadside Design Guide (2002) including updates from 2006. The document is to be considered a guide, not a standard or a design policy, but is intended to aid in individual highway agencies developing their own policies and standards that are best suited to their particular location and projects. AASHTO does provide Standard Specifications for Structural Supports for Highway Signs, Luminaires and Traffic Signals with which highway agencies must comply, however the specifics of this document were not consulted for this task since it specifically addresses supports. To further illustrate some of the concerns associated with locating REIs in the ROW, a case study is included highlighting a project located in Massachusetts, where a large solar installation is proposed to be located in the DOT ROW, to provide electricity for a local water treatment plant. The case study looks at some of the issues that arose between the town in which the project is located and the DOT that owns the ROW.
B. Roadside Design and REIs As the Roadside Design Guide (RSDG) notes, “roadside safety policy, criteria and technology is a rapidly changing field of study” and this has been found to be true as it relates to locating renewable energy installations (REIs) in the right of way (ROW). The RSDG itself does not mention REI installations, but assumptions can be made based on guidance provided for locating units that REIs are commonly associated with, such as portable changeable message signs (PCMS) and street lights. However, new and increased utilizations of REIs are inevitable and the issue of locating REIs alongside roadways will need to eventually be addressed by some standard source.
2 23 CFR Part 655, Subpart F Sec. 655.603
Feasibility Study of Using Solar or Wind Power for Transportation Infrastructure
31
C. Initial Concepts
The idea of limiting objects alongside the road comes from the “Forgiving Roadside Concept” which is intended to allow for errant vehicles leaving the roadway and “supports a roadside design where the serious consequences of such an incident are reduced”. This concept is an integral part of transportation design criteria, and provides the following options (in order of preference):
1. Remove the obstacle 2. Redesign the obstacle so it can be safely traversed. 3. Relocate the obstacle to a point where it is less likely to be struck. 4. Reduce impact severity by using an appropriate breakaway device. 5. Shield the obstacle with a longitudinal traffic barrier designed for redirection or use a crash
cushion 6. Delineate the obstacle if the above alternatives are not appropriate.
Closely related to the “forgiving roadside” concept is the term “clear zone” and its associated recovery area. The clear zone is defined by the RSDG as “the total roadside border area, starting at the edge of the traveled way, that is available for an errant driver to stop or regain control of a vehicle. This area might consist of a shoulder, a recoverable slope, and/or a non-recoverable, traversable slope with a clear run-out area at its toe.” More specifically, the clear zone may include “shoulders, bike lanes, or auxiliary lanes, except those auxiliary lanes that function like through lanes.” Most highway agencies try to provide at least a 30ft clear zone (traversable and unobstructed roadside area) for high-volume, high-speed roadways. It is noted that for low-speed, low-volume roadways this may be excessive. However, the RSDG suggests that even for low volume roads, if post-mounted sign supports are located within a clear zone, they shall be yielding, breakaway, or shielded with a longitudinal barrier or crash cushion. While criteria 1 and 2 under the “Forgiving Roadside Concept” are not practical for highway signing and lighting, which must remain near the roadway to serve their intended functions, practitioners should refer to option 4, which has become a “cornerstone of the forgiving roadside concept” since its inception in the mid 1960s. Option 4 suggests reducing impact severity by using an appropriate breakaway device or support. The term “breakaway support” refers to all types of sign, luminaire, and traffic signal supports that are designed to yield when impacted by a vehicle. The release mechanism may be a slip plane, plastic hinge, fracture element or a combination of these. AASHTO Standard Specifications for Structural Supports for Highway Signs, Luminaires and Traffic Signals and NCHRP Report 350 lists criteria which require that a breakaway support fail in a predictable manner when struck head-on by an 1800 lb vehicle or its equivalent, at speeds of 20mph and 60mph. Breakaway designs are intended to reduce the severity of an accident rather than to reduce the frequency. Supports should not be placed in drainage ditches where erosion and freezing might affect the proper operation of the breakaway mechanism or where vehicles entering the ditch might be inadvertently guided into the support, or where a vehicle could become airborne and not impact the support at the bumper height. The use of breakaway supports however, may be a concern in some pedestrian concentrated areas such as near bus shelters. Only when the use of breakaway supports is not practicable should a traffic barrier or crash cushion be used exclusively to shield sign supports.
Feasibility Study of Using Solar or Wind Power for Transportation Infrastructure
32
“Crash cushions” are systems that mitigate the effects of errant vehicles that strike obstacles, either by smoothly decelerating the vehicle to a stop when hit head-on, or by redirecting the errant vehicle. More specific information on the use of crash cushions can be found in Section 1A.11 of the RSDG.
D. Design Criteria
1. Fixed/Permanent Applications Sign, luminaire, and similar supports must first be structurally adequate to support the device mounted on them and to resist ice and wind loads as specified in AASHTO Standard Specifications for Structural Supports for Highway Signs, Luminaires and Traffic Signals. Whenever possible, signs should be placed behind existing roadside barriers (beyond the design deflection distance), on existing structures, or in similar non-accessible areas. If this cannot be achieved, then breakaway supports should be used. Chapter 4 of the RSDG discusses specific guidance on the location of fixed and/or permanent applications along the roadside.
a. Roadway Signs
i. Overhead signs
including cantilevered signs generally require massive support and cannot be made breakaway. For those that cannot be relocated to overpasses or other existing structures, RSDG suggests they be shielded with a crashworthy barrier.
ii. Large roadside signs
(greater than 50 sq ft) typically have two support posts. They should be have breakaway mechanisms that are either fracture or a slip-base type, keeping in mind the necessity to design for wind load. RSDG still suggests that large signs be located outside the clear zone, even if they are breakaway.
iii. Small roadside signs
are 50sq ft or less and may still cause substantial damage to vehicles during an accident. The breakaway mechanisms for small signs supports consist of either a base-bending, a fracture, or a slip base design.
The MUTCD3
provides specific guidance to consider when locating permanent changeable message signs (CMS). This guidance can be interpreted to be applicable regardless of whether the unit was grid connected or solar powered. The Manual explains that CMS should be located sufficiently upstream of bottlenecks, high crash locations, and major decision points so that the message can effectively reach drivers and allow them enough time to react and plan accordingly. It cautions against locating CMS in interchanges or in areas where the information load on drivers is already high or where they perform lane changing maneuvers.
b. Luminaires Luminaire supports should also be designed with breakaway features and the height of the pole should not exceed 60 feet. RSDG suggests using the maximum height and the fewest luminaires possible to eliminate obstacles in the clear zone. 3 MUTCD (2009) Chapter 2L Section 2L.06 on p.329
Feasibility Study of Using Solar or Wind Power for Transportation Infrastructure
33
c. Signals Traffic signals installed on high speed roadways (50mph or greater) the signal supports and the signal support box should be placed as far away from the roadway as practicable. Breakaway support on traffic signals may not be practical due to the danger of loss of signalization if an accident does occur. RSDG suggests considering shielding these supports if they are within the clear zone and also to consider breakaway supports for post mounted signals installed in wide medians.
d. Utilities The RSDG suggests burying utility lines when possible to avoid the need to locate poles near the roadway and/or locating poles as far from the traveled way as practical to avoid accidents altogether. Additionally, there are 2 AASHTO publications on the subject- A Policy on the Accommodation of Utilities within Freeway Right-of-Way (1989) and A Guide for Accommodating Utilities within Highway Right-of-Way (1994) which may be consulted for more specific information on utilities. According to Guidance from the FHWA Office of Real Estate Services4, which complements the FHWA’s Program Guide: Utility Relocation and Accommodation on Federal-Aid Highway Projects (2003)5
, in order to locate utility facilities within the ROW, it must first be determined whether the utility is in the public interest. Non-highway, private uses of the Interstate ROW are subject to the airspace leasing requirements of 23 CFR 710.405 and there are requirements that the utility companies must follow in order to longitudinally occupy the ROW. A key issue with locating utilities in the ROW is “ensuring that the non-highway use does not impact the DOT’s ability to maintain and operate the highway in a safe manner”. The Guidance notes that as large-scale renewable energy projects in the highway ROW become more common, careful consideration of each project will be necessary to determine its use.
2. Portable Changeable Message Signs Portable Changeable Message Signs (PCMS) may be used by the state DOTs for a variety of applications. Many PCMS are used to convey weather related information referred to as road weather information systems (RWIS) or to indicate seasonal road conditions such as flooding. They may also be seasonally located in areas of high wildlife vehicles collisions or have other temporary uses that are not work zone related. The MUTCD6
provides a standard that “portable changeable message signs shall be equipped with a power source and a battery back-up to provide continuous operation when failure of the primary power source occurs”. The section provides guidance on locating PCMS similar to the guidance for locating permanent CMS with regards to allowing appropriate time for drivers to respond to the message being relayed. Additionally, it states that:
“Portable changeable message signs should be placed off the shoulder of the roadway and behind a traffic barrier, if practical. Where a traffic barrier is not available to shield the portable changeable message sign, it should be placed off the shoulder and outside of the clear zone. If a portable changeable message sign has to be placed on the shoulder of the roadway or within the clear zone, it
4 Guidance on Utilization of Highway Right-of-Way (2003) http://www.fhwa.dot.gov/realestate/guidutil_a.htm. 5 http://www.fhwa.dot.gov/reports/utilguid/index.htm 6 Chapter 6F, Section 6F.60
Feasibility Study of Using Solar or Wind Power for Transportation Infrastructure
34
should be delineated with retro reflective TTC devices.” The MUTCD also recommends that trailers associated with the PCMS be affixed with retro reflective material “in a continuous line on the face of the trailer as seen by oncoming road users”.
3. Temporary Application and Work Zones The majority of solar applications that the states reported to be using are temporary changeable message signs, frequently used during construction. One of the main advantages to using these solar powered units is the fact that they are portable. They also allow for an extra safety measure by eliminating the need for diesel powered generators to run lighting for signs. The Manual on Uniform Traffic Control Devices (MUTCD) Part VI, establishes the principles to be observed in the design, installation and maintenance of traffic control devices in work zones and prescribes standards where possible. With regards to PCMS7
, it is noted that when portable changeable message signs are used in TTC zones, they should display only TTC messages and “when portable changeable message signs are not being used to display TTC messages, they should be relocated such that they are outside of the clear zone or shielded behind a traffic barrier and turned away from traffic. If relocation or shielding is not practical, they should be delineated with retro reflective TTC devices”.
Chapter 9 of the RSDG explains that the clear zone concept still applies to work zones, even though motorists may have a heightened awareness in these zones. Engineering judgment must be used in applying the “clear zone” to work zones and the width of the zone may be determined on a case by case basis. Depending on site restrictions, it may only be feasible to provide an operational clearance. Where roadside space is available, the width of commonly used work-zone clear zone ranges from 12ft to 18ft. The location of collateral hazards such as equipment and material storage can be controlled and should be subject to greater clear-zone widths such as 30ft. The RSDG describes the two types of crash cushions that are used in Temporary Traffic Control (TTC) zones; 1) stationary crash cushions and 2) truck-mounted attenuators. Crash cushions in TTC zones help protect the drivers from the exposed ends of barriers, fixed objects, shadow vehicles, and other obstacles. Work zone signs may be mounted on fixed, temporary, or portable supports. Fixed supports are preferable for long term projects and should meet the breakaway requirements for permanent installations in RSDG Chapter 4.
• Long/Intermediate-Term Work-Zone Sign Supports should be used for signs that are in place at night or for less than 2 weeks.
• Short-Term Work-Zone Sign Supports- signs mounted on portable low-level supports are suitable for short term operations or changing activities. Such supports should be crash tested and include: mounts on skids or metal legs, x-base sign supports, “roll up signs”, fiberglass chevron signs bolted to the top of plastic drums.
• Trailer -Mounted Devices include arrow panels and changeable message signs and portable traffic signals, which are often used in work zones. Since they are often located in the roadway,
7 MUTCD (2009) Chapter 6F, Section 6F.60
Feasibility Study of Using Solar or Wind Power for Transportation Infrastructure
35
they should be crashworthy. A good design would be lightweight with the center of gravity of the unit, such as a unit with a self-contained power source, near or below the center of gravity of impacting vehicles. When not in operation, they should be stored outside the clear zone and delineated with traffic control devices to reduce the probability of impact by errant vehicles.
E. Summary
In adhering to the “forgiving roadside” concept and in consideration of the clear zone, every attempt should be made to locate objects outside of the clear zone. However, there are situations which require that objects be located immediately adjacent to the roadway. Since REIs are used to power existing systems that are already addressed in guidance and design manuals, they may follow the basic rules as noted in the explanations above and summarized in the table below, with the additional benefit of being safer due to the absence of grid connection and in certain cases, diesel generators. Table 4.1 Summary of General Design Approach for REI
Most Common Systems
General Design Approach
Locate outside of Clear Zone
Make Breakaway
Protect with Guiderail
Provide crash cushion or
barrier
Delineate with reflective devices
Permanent VMS/RWIS X X X
Temporary VMS/PCMS and RWIS
X X X
Traffic data collection (speed, counters, etc)
X X
Luminaires X X
Call boxes X X
Traffic signals X * X X
Utility poles or other poles used to mount solar units
X
Overhead signs X X
Large roadside signs X X X X
Small roadside signs X
* in wide medians
F. Case Study: Carver, Massachusetts An additional issue to consider is that roadside locations are sometimes ideal areas in which to locate solar or wind units that may power facilities that are independent of transportation functions as well. Several states including California, Oregon and Florida have begun to take advantage of land in the ROW to locate solar projects. The town of Carver, Massachusetts for example, is in the process of acquiring approvals necessary to locate a 25,000 square foot solar photo voltaic (PV) installation along Route 44. The Route 44 embankment was found to have a nearly ideal geo-orientation for placement of a solar PV
Feasibility Study of Using Solar or Wind Power for Transportation Infrastructure
36
system. The Town is in the process of finalizing an agreement to acquire an easement of 1.26 acres of the northerly embankment along Route 44 on which an installation generating approximately 140,000 kWh/year will be installed to supply power to the adjacent water supply and treatment plant and any subsequent expansions. The project has been awarded to a New England energy company. According to Mr. Jack Hunter, Director of Planning and Community Development for the Town of Carver, the project idea was not initially well-received by the Highway Division (MHD) of the Massachusetts DOT, District 5. The District had many concerns including vandalism, control, cleanup, construction. The Town of Carver sensed much hesitation from the DOT with regards to the uncommon request to locate this type of facility within the ROW. The project caught the attention of the Massachusetts Highway Commissioner, as well as the Department of Energy, and this helped the project to gain momentum and move through the approval process. The easement agreement established between the Town of Carver and DOT contains several provisions with regards to maintenance. Originally, the DOT wanted the Town to maintain the ROW from the easement to the Interchange which is ½ mile away. However this point was negotiated and eventually removed. Other provisions dictate that the Town is responsible for being sure that the site is returned to a natural state following construction, trash pickup and maintenance of the chain link fence that will be installed to protect the panels. According to the terms of the easement, the Town will be responsible for mowing in the ROW where there are no panels. There will be riprap located directly beneath the panels to eliminate the need for maintenance within the fencing. In order to address the concerns associated with vandalism of the solar installation, the DOT insisted on the placement of the chain link fence around the solar panels. The potential for vandalism also caused apprehension from the projects lenders in terms of the financing/funding aspects of the project. However, because of the State of Massachusetts’s current initiatives on solar which include tax credits and grants, lenders are now more familiar with solar projects and have fewer hesitations. Although the installation is located outside of the clear zone, there were several concerns. The potential for the solar installation to be damaged or affected by snow removal on the highway was a major concern, but the Town was able to prove that because of the slope of the easement and its distance from the edge of the highway (45 feet) snow removal will not affect the project. This distance was also determined to be far enough away that the panels would not be damaged by rocks being kicked up from tractor trailers on the highway. The potential glare and/or driver distraction was determined to not be an issue since the installation will be placed on a south facing slope, and the highway runs east to west. The Town of Carver pointed out that the state of Massachusetts has many highways running east to west and that other states of similar shape may find potential in south facing slopes along the right of way as well. The Town of Carver is very excited about this project and is hoping to have other opportunities to explore the use of solar. Special thanks to Mr. Jack Hunter, Director of Planning and Community Development for the Town of Carver Massachusetts for taking the time to participate via telephone interview.
Feasibility Study of Using Solar or Wind Power for Transportation Infrastructure
37
V. Life Cycle Cost Analysis
A. Introduction
This section provides background information about LCCA, explains how to apply LCCA for State Department of Transportation (DOT) related Renewable Energy Installations (REI), and includes information on using the LCCA calculator that is provided for this project. Life-cycle cost analysis (LCCA) is a method of determining the entire cost of a structure, product, or component over its expected useful life. The cost of operating, maintaining, and using the item is added to the purchase price. For energy related items that last longer than a couple of years, LCCA is a more realistic way of evaluating cost than simply looking at the purchase price. The LCCA should be performed early in the design process while there is still a chance to refine the design to ensure a reduction in life-cycle costs (LCC). In general the project alternative with the lowest LCCA cost is the preferred one8
.
For DOTs and other transportation agencies, life-cycle cost analysis can be used to determine whether it makes economic sense to invest in a particular REI technology, component or system or whether one design will be more cost effective than another over time. LCCA is particularly useful for comparing the costs of several options for equipment and systems, so that the most economical choice can be made for a particular situation. With continued improvements in technology and the increased availability of choices in REI equipment for DOTs to use in transportation infrastructure, LCCA is a practical and necessary tool. For the most part, REI applications used by DOTs in this research were found to fall into two areas: 1. REIs as a means to reduce grid-supplied, fossil fuel energy consumption in buildings; 2. REIs as a means to reduce grid-supplied, fossil fuel energy consumption in individual DOT systems
such as lighting or signage. Traditionally, facilities managers and designers have focused on minimizing the initial cost of a system rather than looking at its overall LCCA performance. Unfortunately, this practice often runs the risk of building inefficient systems with unnecessarily high operation and maintenance (O&M) costs. Figure 29
shows that over the life of a building (typically 30 years) the average construction costs are lower than Operations & Maintenance costs, how much depends on the building type and its location.
The 2006 study, “Re-examining the Costs and Value Ratios of Owning and Occupying Buildings” by
8 Life Cycle Cost Manual for the Federal Energy Management Program, NIST Handbook 135, 1995 Edition. 9 (http://www.fs.fed.us/eng/pubs/htmlpubs/htm08732839/page01.htm#fig01)
Figure 2: Building Construction Costs vs. Operations & Maintenance Costs
Feasibility Study of Using Solar or Wind Power for Transportation Infrastructure
38
Graham Ive have found that the cost of office buildings Operations & Maintenance is one and half (1.5) times the cost of construction. The largest expenditure in office buildings are the salaries and benefits for employees who work there. Recent USDA publication cites the cost of salaries to be about 18 times the initial cost of construction. Figure 310
provides an illustration of the relative magnitude of the various cost components.
While Figure 3 indicates that personnel salaries are the largest expenditures over time for office buildings, the chart also illustrates that operation and maintenance costs are higher than initial design and construction costs. The same is true both for new REI construction or major renovation projects, so it makes sense to include operation and maintenance costs when evaluating cost effectiveness. Not only is it smart to use LCCA rather than just considering initial cost when evaluating design, lease, and purchase options, in some situations it is also required. All federal buildings are required to perform LCCA for every project considered. Life-cycle cost analysis rules are promulgated at 10 CFR 436 A, Life Cycle Cost Methodology and Procedures conform to requirements in the National Energy Conservation Policy Act (NECPA) and subsequent energy conservation legislation as well as Executive Order 1342311. The LCC discount rates and energy price projections are determined annually by the Federal Energy Management Program (FEMP) and the Energy Information Administration. FEMP provides guidance on the LCC requirements under Executive Order 1312312
.
ASTM International, originally known as the American Society for Testing and Materials, develops and publishes technical standards for materials, products, systems, and services. ASTM standard E917- 02 "Standard Practice for Measuring Life-Cycle Costs of Buildings and Building Systems” is the standard industry procedure for analyzing life-cycle costs. More detailed information about applying LCCA to Federal projects is contained in the National Institute of Standards and Technology Handbook 135, Life-Cycle Costing Manual (http://www1.eere.energy.gov/femp/information/download_blcc.html).
B. Basics of Life Cycle Cost Analysis LCCA is a well-defined procedure for estimating the overall costs of project alternatives and it is commonly accepted throughout the business and engineering communities. Basically, LCCA consists of adding all the initial and ongoing costs of the structure, product, or component over the amount of time it is expected to be used, subtracting the value that can be obtained at the end of that time (residual value), and adjusting for inflation. Large amounts of information must be assembled and manipulated to accomplish a life-
10 (http://www.fs.fed.us/eng/pubs/htmlpubs/htm08732839/page01.htm#fig01) 11 Strengthening Federal Environmental, Energy, and Transportation Management (2007) 12 Greening the Government Through Efficient Energy Management (1999)
Figure 3: Illustration of Cost of Salaries vs. Other Building Costs
Feasibility Study of Using Solar or Wind Power for Transportation Infrastructure
39
cycle cost analysis. Additionally, all costs must be adjusted for inflation, and it is important to note that the process of applying the formula to large projects is somewhat complex. The term "present value" in the formula describes costs that have been adjusted for inflation, or "discounted”. The emphasis on “present value” is important when considering expensive structures or components that function for many decades, because inflation can influence affordability. It may not be practical to calculate present value when analyzing the life-cycle costs of small or short-lived structures, products, or components.
The following is the general formula for the LCC present-value model13
( )∑ = +=
N
t tt
dC
LCC0 1
:
Where: LCC = Total LCC in present value dollars of a given alternative
Ct = Sum of all relevant costs, including initial and future, less any positive cash flows, occurring in year t
N = Number of years in the study period
D = Discount rate used to adjust cash flows to present value
The general LCC formula shown above requires that all costs be identified by year and by amount. This general formula, while straightforward from a theoretical standpoint, can require extensive calculations, especially when the study period is more than a few years long and for annually recurring amounts, for which future costs must first be calculated to include changes in prices. A simplified LCC formula for computing the LCC of energy conservation projects can be stated as follows:
LCC = I + Repl - Res + E + OM&R
Where:
LCC = Total LCC in present value dollars of a given alternative I = Present-value investment costs Repl = Present-value capital replacement costs Res = Present-value residual value (resale value, scrap value, salvage value) less disposal costs E = Present-value energy costs OM&R = Present-value non-fuel operating, maintenance, and repair costs.
This formula takes advantage of Uniform Present Value (UPV) factors to compute the present value of annually recurring costs, whether constant or changing. By using appropriate UPV factors, the LCC can be calculated without first computing the future annual amount (including price escalation) of each annually recurring cost over the entire study period, summing all those costs by year and discounting them to present value. Instead, only the annual amount in base year dollars (i.e., a one-time amount)
13 Life Cycle Cost Manual for the Federal Energy Management Program, NIST Handbook 135, 1995 Edition
Feasibility Study of Using Solar or Wind Power for Transportation Infrastructure
40
and the corresponding UPV factor need to be identified. The various components of this formulation will be further explained in the following sections.
1. Costs There are numerous costs associated with acquiring, operating, maintaining, and disposing of a DOT related REI system. Project related costs usually fall into the following categories: Initial Costs- (Purchase, Acquisition, Construction Costs)
Fuel Costs
Operation, Maintenance, and Repair Costs
Replacement Costs
Residual Values-Resale or Salvage Values or Disposal Costs (operations, maintenance and repair)
Finance Charges-Loan Interest Payments
Non-Monetary Benefits or Costs
Only those costs within each category that are relevant to the decision and significant in amount are needed to make a valid investment decision. Costs are relevant when they are different for one alternative compared with another; costs are significant when they are large enough to make a credible difference in the LCC of a project alternative. All costs are entered as base-year amounts in current dollars; the LCCA method escalates all amounts to their future year of occurrence and discounts them back to the base date to convert them to present values.
a. Initial Costs Initial costs may include capital investment costs for land acquisition, construction, or renovation and for the equipment needed to operate a facility. Land acquisition costs need to be included in the initial cost estimate if they differ among design alternatives. This would be the case, for example, when comparing the cost of renovating an existing facility with new construction on purchased land. Construction costs should be included in the initial costs of a project.
b. Energy Costs Operational expenses for energy and other utilities are based on consumption, current rates, and price projections. Because energy, building configuration and building envelope are interdependent, energy costs are usually assessed for the building/project as a whole rather than for individual building systems or components, unless the REI is for a single facility or component. Energy usage: Data can be obtained for existing structures or systems energy usage. In the case of new construction, energy costs may often be difficult to predict accurately. Assumptions must be made about use profiles, occupancy rates, and power-on schedules, all of which impact energy consumption. Energy prices: Quotes of current energy prices from local suppliers should take into account the rate type, the rate structure, summer and winter differentials, time of use, block rates, and demand charges to obtain an estimate as close as possible to the actual energy cost. It is also possible to consider fully loaded energy prices rather than modeling the detailed tariff structure.
Feasibility Study of Using Solar or Wind Power for Transportation Infrastructure
41
Energy price projections: Energy prices are assumed to increase or decrease at a rate different from general price inflation. This differential energy price escalation needs to be taken into account when estimating future energy costs. Energy price projections can be obtained either from the supplier or from energy price escalation rates published annually on April 1 by DOE in Discount Factors for Life-Cycle Cost Analysis, Annual Supplement to NIST Handbook 135.
c. Operation, Maintenance, and Repair Costs Non-fuel operating costs, maintenance and repair (OM&R) costs are often more difficult to estimate than other project expenditures. Operating schedules and standards of maintenance vary from project to project and there is great variation in these costs even for projects or buildings of the same type and age. It is therefore especially important to use proper engineering judgment when estimating these costs.
d. Replacement Costs The number and timing of capital replacements of building or project systems depends on the estimated life of the system and the length of the study period. It is recommended to use the same sources that provide cost estimates for initial investments to obtain estimates of replacement costs and expected useful lives. A good starting point for estimating future replacement costs is to use replacement costs cost on the initial date of the study period (base date). The LCCA method will escalate base-year amounts to their future time of occurrence.
e. Residual Values The residual value of a system (or component) is its remaining value at the end of the study period, or at the time it is replaced during the study period. Residuals can be based on value in place, resale value, salvage value, or scrap value, net of any selling, conversion, or disposal costs. As a rule of thumb, the residual value of a system with remaining useful life in place can be calculated by linearly prorating its initial costs. For example, for a system with an expected useful life of 15 years, which was installed 5 years before the end of the study period, the residual value would be approximately 2/3 (=(15-10)/15) of its initial cost.
2. Parameters for Present-Value Analysis
a. Discount Rate In order to be able to add and compare cash flows that are incurred at different times during the life cycle of a project, they have to be made time-equivalent. To make cash flows time-equivalent, the LCC method converts them to present values by discounting them to a common point in time, usually the base date. The interest rate used for discounting is a rate that reflects an investor's opportunity cost of money over time, meaning that an investor wants to achieve a return at least as high as that of the next best investment. Hence, the discount rate represents the investor's Minimum Acceptable Rate of Return (MARR). The discount rate for federal energy and water conservation projects is determined annually by FEMP; for other federal projects, those not primarily concerned with energy or water conservation, the
Feasibility Study of Using Solar or Wind Power for Transportation Infrastructure
42
discount rate is determined by the Office of Management and Budget (OMB). These discount rates are real discount rates, not including the general rate of inflation.
b. Cost Period(s) The study period begins with the base date, the date to which all cash flows are discounted. The study period includes any planning/construction/implementation period and the service or occupancy period. The study period has to be the same for all alternatives considered. The service period begins when the completed project or building is occupied or when a system is taken into service. This is the period over which operational costs and benefits are evaluated. In FEMP analyses, the service period is limited to 25 years.
c. Discounting Convention In OMB and FEMP studies, all annually recurring cash flows (e.g., operational costs) are discounted from the end of the year in which they are incurred. All single amounts (e.g., replacement costs, residual values) are discounted from their dates of occurrence.
d. Treatment of Inflation An LCCA can be performed in constant dollars or current dollars14
. Constant-dollar analyses exclude the rate of general inflation, and current-dollar analyses include the rate of general inflation in all dollar amounts, discount rates, and price escalation rates. Both types of calculation result in identical present-value life-cycle costs.
Constant-dollar analysis is recommended for all federal projects, except for projects financed by the private sector (e.g. Energy Performance Contract). The constant-dollar method has the advantage of not requiring an estimate of the rate of inflation for the years in the study period. Alternative financing studies are usually performed in current dollars if the analyst wants to compare contract payments with actual operational or energy cost savings from year to year.
3. Supplementary Measures Supplementary measures of economic evaluation are Net Savings (NS), Savings-to-Investment Ratio (SIR), Adjusted Internal Rate of Return (AIRR), and Simple Payback (SPB) or Discounted Payback (DPB). They are sometimes needed to meet specific regulatory requirements. The DOT analysis will use only the NS method as it reflects the situation of lowest LCCA case.
C. DOT LCCA Tool and its Usage Under Task 3 of this NCHRP 25-25 (64) research, interviews were conducted with state DOT staff including engineers, planners and program mangers in order to collect information on how they use renewable energy in their transportation infrastructure. Based on these interviews and knowledge in the REI field the following generic categories for DOT applications can be defined:
14 Guide to Energy Management, William Kennedy, Fairmont Press, Fifth Edition 2006.
Feasibility Study of Using Solar or Wind Power for Transportation Infrastructure
43
Solar and/or wind for portable applications - Variable message signs (VMS), road weather information systems (RWIS), flashing beacons and data collection can be either temporary or permanent units. In the case of temporary units, such as in construction zones, portability is key and grid connection is not usually considered.
Solar and/or wind for lighting and dedicated stationary applications – These applications use REI to displace possible grid-powered systems. This may include VMS, RWIS, flashing beacons, data collection or a combination of several systems that may include cameras and/or sensors. They may be remote, situated in locations where power is difficult to access, or meet other preferred usage goals.
Solar Photovoltaic (PV) and/or wind for existing structures – This category involves two
possible cases: (1) application involves using solar PV or wind to displace grid-powered, energy consumption of an existing facility. The solar PV can be roof mounted, ground mounted, pole mounted with or without tracking capability, (2) Using solar PV or wind to power a facility that is currently not connected to the grid. In this case the alternatives may be to either bring grid power to the facility or to use an REI with possible energy storage to provide the energy needed to power the facility;
The LCCA tool consists of the following sheets:
a. User Inputs – worksheet used for entry project general parameters b. Project Summary – worksheet containing the parameters for base and alternative case,
including LCCA summary c. Region 1 – worksheet containing region 1 FEMP UPV factors (from handbook
supplement 135) d. Region 2 – worksheet containing region 2 FEMP UPV factors (from handbook
supplement 135) e. Region 3 – worksheet containing region 3 FEMP UPV factors (from handbook
supplement 135) f. Region 4 – worksheet containing region 4 FEMP UPV factors (from handbook
supplement 135) g. US Average – worksheet containing US Average FEMP UPV factors (from handbook
supplement 135) h. Cash Flow Analysis – This sheet is for information only and cannot be changed or
modified. The fields containing values are already calculated to present value and column B provides an overall LCCA summary which is afterwards reflected into the Project Summary screen.
i. Amortization table – independent worksheet performing amortization schedule j. Carbon Calculator – independent worksheet performing carbon calculation for
electricity savings Only the User Inputs and Project Summary sheets require that the user contribute information, while items a-g are directly related to the LCCA tool. The FEMP UPV factors must be updated on an annual basis as they are re-published by NIST. The last two worksheets, the Amortization table and the Carbon Calculator are independent sheets which have been added as additional tools for the DOT designer.
Feasibility Study of Using Solar or Wind Power for Transportation Infrastructure
44
The LCCA tool uses the same methodology as provided in Handbook 135 and previously explained in the Basics of Life Cycle Cost analysis portion of this handbook. It has been adapted for DOT applications addressing two general cases:
a. Energy Displacement – This case involves installing REI in an already existing facility for the purpose of displacing some of the energy consumed using renewable energy, see example 1 for an illustration;
b. Optimal Selection – This case compares several alternatives to determine which one has the lowest LCC. This case examines two DOT application areas, Example 2 - the possibility of using solar/wind powered street lights in areas where there is a grid connection and also in areas where there is no grid connection, and Example 3 – variable message signs for such cases where there may be a choice between grid connection or the use of an REI. Example 3 further illustrates replacement schedule of the base case.
Each one of these general cases will be addressed by the tool, Example 1 for “Energy Displacement” and Examples 2 & 3 for “Optimal Selection”.
D. Representative Examples
The following three examples are based on scenarios that were discussed with the state DOTs during the interviews in Task 3. However, some of the details and data were adjusted in order to illustrate the differences in return on investment based on local electricity costs, government subsidies, incentives and other factors. Table 5.1 and Table 5.2 describes all the fields associated with the user inputs and project summary worksheets within the LCCA tool. A field whose color is “blue” is a calculated field and does not require any input.
Feasibility Study of Using Solar or Wind Power for Transportation Infrastructure
45
Table 5.1: User inputs screen Fields to the DOT LCC Analysis
Field Descriptors Description of Field Project Title Enter the project title as well as a few descriptive
sentences about the project Location Enter the state where the project is located Base Date Project starting date Service Date Project end date Expected_Life Length in years of the study period Discount_Rate Default 3.00% Project Type: This is a drop down menu with two options
a. Energy_Displacement b. Optimal Selection
Fuels Prices: NG_Price Natural Gas price per Therm Fuel_Price Fuel price per gallon Electricity_Price Electricity price per kWh UPV Factors The information on the UPV factors is needed in order to
locate the proper entry in Tables Ba1-4 of Handbook 135 Supplement. For simplicity and ease of compiling the information, the tables are provided in Appendix A – FEMP UPV* Discount Factors of this report.
DOE Region Department of Energy Region, this is a drop down menu allowing user to choose between DOE region 1-4
Rate Type_Energy Three possible choices, Residential, Commercial, Industrial. This is a drop down menu allowing user to choose between residential, commercial and Industrial sectors.
FEMP UPV Factors Electricity_Factor The FEMP Electricity factor NG_Factor The FEMP NG factor Fuel_Factor The Fuel Electricity factor
Feasibility Study of Using Solar or Wind Power for Transportation Infrastructure
46
Table 5.2: Project Summary Screen Fields to the DOT LCC Analysis
Field Descriptors Description of Field Project Details Base Project Details Base_InvCost Base investment cost in $ Base_ReplCost Base replacement cost in $ Base_ReplCost_Years Base replacement years Base_ResValue Base residual value Base_kWh Base kWh consumption Base_NG Base NG consumption Base_Fuel Base fuel consumption Base_Energy_Cost This is a calculated field no entry is needed Base_OMR Base OM&R cost REI Project Details REI_InvCost REI Investment cost REI_Incentives REI Incentives if available REC_Income REI REC income if available Net_REI_ProjCost This is a calculated field, no input is needed REI_ReplCost REI replacement cost REI_ReplCost_Years REI replacement years REI_ResValue REI residual value New_kWh kWh consumption New_NG NG consumption New_Fuel Fuel consumption REI_AnnualProd REI Annual production in kWh REI_Net_Energy_Cost This is a calculated field no input is needed REI_OMR REI OM&R LCC Results
LCC_Base This is a calculated field no input is needed. Reflects the LCC for the base case
LCC_REI This is a calculated field no input is needed. Reflects the LCC for the REI case
Net Savings
This is a calculated field no input is needed. Reflects the Net Savings value. A positive number indicates that the LCC for the REI case is economical
Feasibility Study of Using Solar or Wind Power for Transportation Infrastructure
47
1. Example 1 – REI Based Variable Message Sign In this scenario, a State DOT is considering installing new Variable Message Signs (VMS) equipped with cameras and wireless control. For this example, it is assumed that the project is located in Maine, a state that reported having a frequent need to locate remote VMS to accommodate a large number of touring motorists throughout the year. The following are two alternatives that can be evaluated using this example of REI based VMS:
1) Base Case Alternative – Install a VMS that will be grid connected. The DOT uses a wireless modem to communicate messages to the sign. The VMS with a camera uses 25w;
2) REI based Alternative – Install a solar powered VMS equipped with a camera and wireless modem.
Tables 5.3 and Table 5.4 depict the Example 1 base and alternative cases input data. Table 5.3: Example 1 Alternative 1 (Base Case) Initial Cost We assume the cost of a VMS equipped with a wireless
modem is $6,800 (including an $800 wireless modem). Overall cost of project: $6800
Cost of grid connection The electric utility will need to bring a power line from a distance of 2 miles at a cost of $7/ft. No crossing of ROW or boring are needed.$73,920
Available funding/incentives None Base Date 2010 Service Date 2030 Expected Life 20 DOE discounted rate 3% (real) Capital Replacement schedule None Capital Replacement cost $0 Residual value Zero Electricity price (kWh) $0.18 Location ME, DOE region 1 Rate type for energy Commercial FEMP UPV* factor for electricity 14.40 (Table Ba4 Annual Supplement to NIST Handbook
135) Annual energy usage w/o REI 25wx8760=219,000w=219kW OM&R $12/month for wireless connection and $15/month
minimum electric utility charge. Overall annual OM&R costs are $324.
Feasibility Study of Using Solar or Wind Power for Transportation Infrastructure
48
Table 5.4: Example 1 Alternative2 (REI Based VMS) Initial Cost We assume the cost of an REI based VMS equipped with
a wireless modem is $10,000. Cost of grid connection $0 Available funding/incentives None Base Date 2010 Service Date 2030 Expected Life 20 DoE discounted rate 3% (real) Capital Replacement schedule Batteries will need to be replaced every 5 years at a
cost of Capital Replacement cost (inverter) $0 Residual value 500 Electricity price (kWh) $0.18 Location MA, DOE region 1 Rate type for energy Commercial FEMP UPV* factor for electricity N/A Annual energy N/A, VMS uses solar power with battery backup
providing up to 14 days of power with no sun. OM&R $1,000 per year maintenance costs per VMS Figure 4 (below) depicts the User Input screen and the project summary screens including the LCCA results are depicted in Figures 5 and 6.
Feasibility Study of Using Solar or Wind Power for Transportation Infrastructure
49
Figure 4: Example 1 - User Inputs Screen
NCHRP Project 25-25 Task 64
Feasibility Study of Using Solar or Wind Power for Transportation Infrastructure
50
Figure 5: Example 1 - Base Project Screen
Figure 6: Example 1 – REI Screen and LCCA Summary
NCHRP Project 25-25 Task 64
Feasibility Study of Using Solar or Wind Power for Transportation Infrastructure
51
The results of the LCCA are depicted at the bottom of Figure 6. Based on the input parameters provided in Figure 4 and 5, the analysis shows the following: Alternative 1 – Base case LCCA is $86,101
Alternative 2 – REI case LCCA is $29,431
Net Savings - $56,670
The LCCA analysis shows that the Alternative 2 (solar based VMS) presents an $56,670 savings in present value over the 20 year study period, over and above the 3% minimum acceptable real rate of return already taken into account through the discount rate. This LCCA example, unlike the first example, shows the REI to be a viable project option. Since project cost is $10,000 even if the distance required for grid connection is shorter, the project will still be economically viable.
2. Roof Mounted Solar PV Example This example illustrates a project in Utah where a 3.6kW solar PV unit is to be installed on the roof of a DOT maintenance facility located in the vicinity of Salt Lake City. In this particular area of Utah, the cost of on kilowatt hour (kWh) is 7.2 cents. Table 5.3 lists information pertaining to this example. The user input screen is depicted in Figure 7 and the project summary screens including the LCCA results are depicted in Figures 8 and 9. Based on the input parameters, the analysis shows that that the base case LCC cost is $50,256 and the cost of the REI alternative is $57,639. The “Net Savings” are defined as the difference between the base LCC and the REI LCC. In our case REI PV system does not present a Net Savings but instead presents a loss of $7,383 in present value over the 20 year study period. This amount of loss is in addition to the 3% minimum acceptable real rate of return already taken into account through the discount rate.
NCHRP Project 25-25 Task 64
Feasibility Study of Using Solar or Wind Power for Transportation Infrastructure
52
Table 5.5: Example 2- Energy Displacement Problem Setup Initial Cost $21,000
Available funding/incentives Project was funded 50% by a federal grant,
Base Date 2010
Service Date 2030
Expected Life 25
DOE discounted rate 3% (real)
Capital Replacement schedule (inverter) Inverter replacement at the end of year 15
Capital Replacement cost (inverter) $5,000
Residual value Zero
Electricity price (kWh) $0.072
Location Utah, DOE region 4
Rate type for energy Commercial
FEMP UPV* factor for electricity 17.45 (Table Ba4 Annual Supplement to NIST Handbook 135)
Annual building energy usage w/o REI 40,000 kWh/year (estimated)
Annual PV production (kWh) 5,035 kWh
OM&R Zero
NCHRP Project 25-25 Task 64
Feasibility Study of Using Solar or Wind Power for Transportation Infrastructure
53
Figure 7: Example 2 – User Inputs Screen
NCHRP Project 25-25 Task 64
Feasibility Study of Using Solar or Wind Power for Transportation Infrastructure
54
Figure 8: Example 2 - Base Project Screen
Figure 9: Example 2 – REI and LCCA Summary
NCHRP Project 25-25 Task 64
Feasibility Study of Using Solar or Wind Power for Transportation Infrastructure
55
In this particular example, the results are dependent on the values of all parameters entering the LCCA. However, the main parameters influencing the outcome are:
a. Initial cost –This example illustrates that without incentives, REI systems are not economically viable in this particular situation. The degree of incentives and energy cost can affect the LCC outcome;
b. Energy costs – energy costs also affect the LCC outcome. The higher the energy costs the better outcome will be
A sensitivity analysis was performed to determine the effect of varying the degrees of incentives and energy costs on the example defined above. The results are summarized in Table 5.6.
Table 5.6: Sensitivity Analysis on Initial Investment and Energy Costs Initial Investment Energy cost (per kWh) LCC Base LCC REI Net Savings $10,500 (50% subsidy)
$0.072 $50,256 $57,639 ($7,383)
$5,250 (75% subsidy)
$0.072 $50,256 $52,389 ($2,133)
$3,117 (85% subsidy)
$0.072 $50,256 $50,255 $0.16
$10,500 (50% subsidy)
$0.16 $111,680 $111,331 $349
Table 5.6 shows that for this example net savings are not realized unless there is an 85% or higher subsidy. If the original parameters are used (where the subsidy provided was 50%) and increase energy cost to $0.16 the project shows a net savings of $349. If in the future, the cost of REIs decrease, then their viability will be improved accordingly. This situation is typical in that without heavy incentives (or Renewable Energy Credit income) from state or federal sources, many Solar PV or wind implementations currently do not exhibit a positive LCC.
3. Example 3 - REI Based Lighting Example For example 3, consider a new facility that needs to be lighted but is located in an area where there is no grid access in Massachusetts. Grid connection cost is a function of how far the facility to be connected is from the nearest grid access. For this example we will assume a minimum grid access cost of $5,000 (one time fee) which was found to be a typical access fee for an area located in the vicinity of grid access. The facility requires 10 Cobra head lights operating 4,368 hours per year. The facility is located in a remote area in Massachusetts where cost per kWh is $0.18. The following are two alternatives that can be evaluated using this example of REI based lighting;
1) Base Case Alternative – Connect the facility to the grid and install ten (10) 85w Cobra-head induction lamps.
NCHRP Project 25-25 Task 64
Feasibility Study of Using Solar or Wind Power for Transportation Infrastructure
56
Induction lamps are electrodless fluorescent lamps. The technology has several advantages over traditional and new technologies such as LED lighting including the following:
Lamp life of 100,000 hours (11 years at 365 x 24); High color temperature (3500-6500K) provides brighter lights over HID and fluorescent; Instant start and no flicker; Insensitivity to turning lamp on/off; Dimming using special ballast CRI of 85-90+; Induction lamp will maintain 80% of its lumen over 90% of the lamp life (90,000 hours); Power Factor > 0.92; Lower maintenance costs by as much as 400% over HID or Fluorescent; Lower recycling costs - induction lamps use Amalgam Mercury slugs. At the end of life just
clip the slug and recycle it as opposed to the whole lamp for fluorescent; Insensitivity to temperature variations, i.e. no light loss at cold temperatures.
This installation is considered an energy efficient installation where new lamps will save 30-40% of energy over traditional HID technology. Each luminary with ballast consumes 90w, @4,368 hours per year, annual consumption per lamp is 393,120w or 393 kWh. Ten lamps consume 3,930 kWh per year;
2) REI Alternative – The facility owner will install ten 85w solar powered lights Table 5.7 and Table 5.8 depicts the input fields associated with each alternative. Figure 10 depicts the User Input screen and the project summary screens including the LCCA results are depicted in Figure 11 and Figure 12. Table 5.7: Example 3 Alternative 1 (Base Case) Initial Cost Assume the cost of ten lights plus poles is $6,050 for
luminaries, $3,000 for the poles and $12,000 for the labor. Overall initial cost $21,050
Cost of grid connection $5,000 Available funding/incentives None Base Date 2010 Service Date 2030 Expected Life 20 DOE discounted rate 3% (real) Capital Replacement schedule (lamps and ballasts) None, lamps life is 100,000 hours, at 4,368 hours per
year it will take 22 years for replacement Capital Replacement cost (inverter) $0 Residual value Zero Electricity price (kWh) $0.18 Location MA, DOE region 1 Rate type for energy Commercial FEMP UPV* factor for electricity 14.40 (Table Ba4 Annual Supplement to NIST Handbook
135) Annual energy usage w/o REI 3,930 kWh/year Annual PV production (kWh) N/A
NCHRP Project 25-25 Task 64
Feasibility Study of Using Solar or Wind Power for Transportation Infrastructure
57
Table 5.8: Example 3 Alternative 2 (Solar PV lights) Initial Cost Assume the cost of ten lights plus poles is $23,000
for luminaries & poles and $12,000 for the labor. Overall initial cost $35,000
Cost of grid connection $0
Available funding/incentives Assume that the state of MA will provide $10,000 in incentives
Base Date 2010
Service Date 2030
Expected Life 20
DoE discounted rate 3% (real)
Capital Replacement schedule (lamps and ballasts) None, lamps life is 100,000 hours, at 4,368 hours per year it will take 22 years for replacement
Capital Replacement cost (inverter) $0
Residual value $500
Electricity price (kWh) $0.18
Location MA, DOE region 1
Rate type for energy Commercial
FEMP UPV* factor for electricity 14.40 (Table Ba4 Annual Supplement to NIST Handbook 135)
Annual building energy usage w/o REI N/A
Annual PV production (kWh) N/A
NCHRP Project 25-25 Task 64
Feasibility Study of Using Solar or Wind Power for Transportation Infrastructure
58
Figure 10: Example 3 - User Inputs Screen
NCHRP Project 25-25 Task 64
Feasibility Study of Using Solar or Wind Power for Transportation Infrastructure
59
Figure 11: Example 3 - Base Project Screen
Figure 12: Example 3 – REI Screen and LCCA Summary
NCHRP Project 25-25 Task 64
Feasibility Study of Using Solar or Wind Power for Transportation Infrastructure
60
The results of the LCCA are depicted at the bottom of Figure 12. Based on the input parameters provided in Figures 10 and 11, the analysis shows the following: Alternative 1 – Base case LCCA is $36,236
Alternative 2 – REI case LCCA is $24,723
Net Savings - $11,513
The LCCA analysis shows that the Alternative 2 (REI based solar lights) presents an $11,513 savings in present value over the 20 year study period, over and above the 3% minimum acceptable real rate of return already taken into account through the discount rate.
E. Conclusions LCCA is highly encouraged by FHWA and can be considered to be the preferred way to evaluate the viability of projects in the Federal sector. The use of a consistent methodology among DOT based projects to evaluate the feasibility of REIs in transportation infrastructure can be extremely useful. LCCA has a distinct advantage over the simple payback model by taking cost of money into account in a systematic and consistent fashion. LCCA provides the user with insight into the behavior and effect of all components associated with the project and means to perform sensitivity analysis to determine which area needs more attention in terms of costing and performance. Furthermore, DOTs can use this tool to highlight areas that requires better costing and to search for ways to improve performance in these areas. There may be, in many cases, projects that will not be economically viable yet they will be considered as a viable project. The following three examples were provided in this report:
1) Example 1 - Installation of REI based Variable Message Sign (VMS) equipped with battery backup and wireless modem for control.
2) Example 2 - Solar PV installation on a roof of maintenance facility;
3) Example 3 - Installation of solar powered outdoor lights;
The first and third examples illustrate REI based lighting and VMS examples. When run through the LCCA, both of these examples turn out to be economically viable. Because of the high grid connection costs, and with higher maintenance costs as in the base cases, these examples are viable projects. Such insights are not available when performing simple payback analysis. The second example turned out not to be economically viable under the conditions set by the example. However if a state DOT were to implement the same project in an area where higher energy costs are present then LCCA of such project may be viable. In this example the whole cost of the REI project had to be offset by electrical savings only, illustrating the sensitivity to energy costs. This example also illustrates that without subsidies, REIs for energy displacement types of projects may not be economically viable.
NCHRP Project 25-25 Task 64
Feasibility Study of Using Solar or Wind Power for Transportation Infrastructure
61
In Example 1, the base case, induction lighting was intentionally chosen to reflect the current state of the art in energy efficient lighting versus the REI case of solar powered lighting. Application of induction lighting can pose energy savings of higher than 50% depending on the base alternative and whether dimming controls are applied. Such applications can reduce maintenance cost and increase energy savings. In cases where DOTs install such new technology it is also recommended to increase public awareness by placing informative signage at the site. By increasing awareness of energy saving measures, DOTs may experience additional cost savings by helping to influence and encourage energy efficient behavior. In the course of this research there was also an example where REIs had been used for a different type of project referred to as “kinetic attraction”. In this case, TxDOT placed wind turbines at a rest stop in order to attract drivers to the site (see Texas manufacturer interviews). In this case a simple payback analysis shows that the turbine will return its investment in 45 years if one evaluates only electrical savings. However, these turbines were constructed as part of the Texas “accident management” program to pose a kinetic attraction that would encourage drivers to stop, rest and hopefully cause less accidents. The payback, in this case, cannot be measured accurately. Similar to the results of the interview with Maine DOT, where Maine ITS personnel explained that if they can defer one crash because of the proper placement of a sign and communication of its message to drivers, the cost of the REI has already been recovered. REIs are making it possible for DOTs to locate critical signage in remote areas where previously this may have not been feasible.
F. Future Research As many DOTs realize the potential of the land that lies within the highway ROW as an excellent location for larger-scale renewable energy projects, such as the Oregon Solar Highway and the Carver, Massachusetts project, it is suggested that additional follow-up research to Task 64 be conducted on this topic. Such research could provide further insight into public-private partnerships and financing while exploring the perspectives of State DOTs, local municipalities and utility companies in terms of coordination and regulatory issues that may have been encountered during the course of the project. Lessons learned could be of value to the state transportation agencies as they inevitably develop more specific guidance on how to accommodate these types of utilities in the highway ROW in the future.
G. LCCA Glossary of Terms The following terms and definitions may be useful for the practitioner that is interested in learning more about LCCA. These terms were adapted from Handbook 13515
to reflect terminology used in this handbook.
Base Case - The building system against which an Alternative Building System is compared.
Base Date - The beginning of the first year of the Study Period, generally the date on which the Life-Cycle-Cost analysis is conducted.
Feasibility Study of Using Solar or Wind Power for Transportation Infrastructure
62
Base Year - The first year of the Study Period, generally the year in which the Life-Cycle-Cost Analysis is conducted.
Base-Date Price - The price of a good or service as of the Base Date.
Capital Investment Costs – Investment cost associated with the project. For projects subject to the FEMP Rules, these include initial investment, capital replacements, and residual values.
Cash Flow - The stream of costs and savings (expressed for the purpose of this requirement in Constant Dollars) resulting from a project investment.
Constant Dollars - Dollars of uniform purchasing power tied to a reference year (usually the Base Year) and exclusive of general price inflation or deflation.
Cost Effective - The condition in which an Alternative project or a Building System saves more than it costs over the Study Period, where all Cash Flows are discounted to their equivalent value at a common point in time.
Current Dollars - Dollars of non-uniform purchasing power, including general price inflation or deflation, in which actual prices are stated. (With zero inflation or deflation, current dollars are identical to constant dollars.)
Discount Factor - A multiplicative number used to convert a Cash Flow occurring at a given point in time (usually in the future) to its equivalent value at a common point in time (usually the Base Date).
Discount Rate - The rate of interest, reflecting the investor's Time Value of Money (or opportunity cost), that is used in Discount Formulas.
Discounted Payback (DPB) Period - The time required for the cumulative savings from an investment to pay back the Investment Costs and other accrued costs, taking into account the Time Value of Money.
Discounting - A technique for converting Cash Flows occurring over time to time-equivalent values, at a common point in time, adjusting for the Time Value of Money.
Energy Conservation Measure (ECM) - An installation or modification of an installation in a Building or a system which is primarily intended to reduce energy consumption cost, operational costs or allow the use of a renewable energy source.
Energy Cost - The annual cost of fuel or energy used to operate a building or a system, as billed by the utility or supplier (including Demand Charges, if any). Energy Costs are incurred during the Service Period only. Energy consumed in the construction or installation of a new facility or system is not included in this cost.
NCHRP Project 25-25 Task 64
Feasibility Study of Using Solar or Wind Power for Transportation Infrastructure
63
Federal Energy Management Program (FEMP) Uniform Present Value (UPV*) Factor indicates a discount factor published in the Annual Supplement to Handbook 135 for use in computing present-value energy costs, based on energy price escalation rates provided for this purpose by DOE's Energy Information Administration.
Initial Investment Costs - The initial costs of design, engineering, purchase and installation, exclusive of "Sunk Costs," all of which are assumed to occur as a lump sum at the beginning of the Base Year or phased in during the Planning/Construction Period.
Investment Costs- The Initial Investment Cost of a building or building system and capital Replacement Costs, less Residual Value, plus Disposal Cost, if any.
Life-Cycle Cost (LCC) - The total discounted dollar costs of owning, operating, maintaining, and disposing of a building or building system over the appropriate Study Period (see Life-Cycle Cost Analysis).
Life-Cycle Cost Analysis (LCCA) - A general approach to economic evaluation that encompasses several related economic evaluation measures, including Life-Cycle Cost (LCC) , Net Benefits (NB) or Net Savings (NS), all of which take into account all dollar costs related to owning, operating, maintaining, and disposing of a project over the appropriate Study Period.
Liquid Petroleum Gas (LPG) - Propane, butane, ethane, pentane, or natural gasoline.
Modified Uniform Present Value (Worth) (UPV*) Factor - A discount factor used to convert an annual amount, changing from year to year at a given escalation rate, to a time-equivalent Present Value. The Net Savings (NS) or Net Benefits (NB) - Time-adjusted savings or benefits less time adjusted differential costs taken over the Study Period, for an Alternative Building System relative to the Base Case.
Operational Costs - See Operating, Maintenance, and Repair Costs
Operating, Maintenance, and Repair (OM&R) Costs - Non-investment costs related to the use of a building or building system, including energy and water costs.
Present Value (Present Worth) - The time-equivalent value of past, present or future Cash Flows as of the beginning of the Base Year.
Present Value (Present Worth) Factor - A discount factor by which a future dollar amount may be multiplied to find its equivalent Present Value as of the Base Date. Single Present Value Factors are used to convert single future amounts to Present Values. Uniform Present Value Factors and Modified Present Value Factors are used to convert Annually Recurring amounts to Present Values.
NCHRP Project 25-25 Task 64
Feasibility Study of Using Solar or Wind Power for Transportation Infrastructure
64
Renewable Energy - Energy obtained from sources that are essentially inexhaustible (unlike, for instance, fossil fuels of which there is a limited supply). Renewable sources of energy include wind energy, geothermal energy, hydroelectric energy, photovoltaic and solar energy, biomass, and waste.
Replacement Costs- Capital costs incurred to replace the project during the Study Period. Sometimes referred to as Capital Replacement Costs. Replacement costs as used in this handbook do not include the cost of replacing system components that are paid out of current operating budgets; these are considered to be Operation-Related Costs.
Residual Value/Salvage Value - The estimated value, net of any Disposal Costs, of any building or building system removed or replaced during the Study Period, or remaining at the end of the Study Period, or recovered through resale or reuse at the end of the Study Period (also called Resale Value, Salvage Value, or Retention Value).
Simple Payback (SPB) Period - A measure of the length of time required for the cumulative savings from a project to recover its Initial Investment Cost and other accrued costs, without taking into account the Time Value of Money. SPB is usually measured from the Service Date of a project.
Single Present Value (Worth) (SPV or SPW) Factor - The discount factor used to convert single future benefit and cost amounts to Present Value.
Study Period - The length of the time period covered by the economic evaluation. This includes both the Planning/Construction Period and the Service Period.
Sunk Costs - Costs which have been incurred or committed to prior to the Life-Cycle Cost analysis. These costs should not be considered in making a current project decision.
Time-Value of Money - The time-dependent value of money, reflecting the opportunity cost of capital to the investor during that time period. See Discount Rate.
Uniform Present Value (Worth) (UPV or UPW) Factor - The discount factor used to convert uniform annual values to a time-equivalent Present Value.
Useful Life - The period of time over which a Building or Building System continues to generate benefits or savings.