448 LOW-TEMP HEATING OF PINK SAPPHIRE FROM MADAGASCAR GEMS & GEMOLOGY WINTER 2020
Heat treatment has been used to improve the color and/or clarity of corundum for more than a thousand years. Various parameters
such as temperature, heating and cooling time, and ox-idizing or reducing atmosphere will affect the final color (Emmett and Douthit, 1993; Emmett et al., 2003; Hughes et al., 2017). The border between high- and low-temperature heat treatment has been defined by Emmett (in Hughes et al., 2017) as the temperature needed to dissolve second-phase microcrystals, which is somewhere between 1200° and 1350°C. Heating at high temperatures will damage most inclusions in ruby and sapphire and is often detectable by trained gemologists. In contrast, heating corundum at low temperatures, sometimes below 700°C, will only subtly affect their internal inclusions, making the treatment much more challenging to detect without advanced instrumentation (figure 1).
Previous studies on the effect of low-temperature heat treatment on inclusions have focused on rubies from Mozambique (Pardieu et al., 2015; Sripoonjan et
al., 2016; Saeseaw et al., 2018) and blue sapphires from Madagascar (Krzemnicki, 2010; Hughes and Perkins, 2019). In these studies, rubies showed slight inclusion alterations when heated to 900°C and developed clear
LOW-TEMPERATURE HEAT TREATMENT OF PINK SAPPHIRES FROM ILAKAKA, MADAGASCAR Sudarat Saeseaw, Charuwan Khowpong, and Wim Vertriest
FEATURE ARTICLES
Low-temperature heat treatment is often applied to gem corundum to improve its appearance. Pink sapphires from Madagascar, one of the most important sapphire-producing countries, are no exception. Therefore, charac-terizing Madagascan pink sapphire before and after heat treatment helps laboratories develop criteria for treat-ment detection. This study showed that after heat treatment at 800ºC, a subtle blue tint was removed, making the color a purer pink. Only slight alterations of monazite inclusions and iron stains in fissures were observed following these heating conditions. Other common inclusions such as needles, particles, etch tubes, and mica and zircon crystals remained unaffected. Interestingly, the monazite crystal inclusions changed color from or-ange-brown to near-colorless after heat treatment. Raman spectroscopy was used to detect the effect of heat treatment on zircon and monazite crystals. While the Raman spectra of zircon remained unchanged, except in the region of 1000 cm–1 after heating at 1000°C, the Raman peaks of monazite crystals became sharper with in-creasing temperature. We measured full width half maximum at ~976 cm–1 (ν1, related to the PO4 group of mon-azite) after all annealing steps. The results showed that the width decreased around 5 cm–1 after heating at 1000°C. This study also showed that Fourier-transform infrared (FTIR) spectroscopy, specifically the peak at 3232 cm–1, is a useful technique to detect low-temperature heat treatment in pink sapphires from Madagascar.
In Brief • The subtle blue tint in many pink sapphires from Mad-
agascar can be lightened or removed by heating at 800°C for 120 minutes in air.
• FTIR spectroscopy is a crucial technique to detect low-temperature heat treatment. The presence of the 3232 cm–1 peak is an indicator of heat treatment in Madagascan pink sapphire.
• Careful observation of monazite crystal inclusions showed a change in color from orange-brown to near-colorless after low-temperature heat treatment.
• Raman spectroscopy can be used to detect the anneal-ing of monazite during low-temperature treatment.
FTIR signatures after heat treatment. This article fo-cuses on the effects of low-temperature heat treat-ment on inclusions, such as zircon and monazite, and the FTIR spectra of pink sapphire from Madagascar. This is the first study to report the use of Raman spec-troscopy to analyze monazite inclusions in corundum during heat treatment experiments.
MATERIALS AND METHODS Samples and Instruments. Fourteen samples re-portedly from Ilakaka, Madagascar, were selected and polished with at least two windows for data analysis. Sample sizes ranged from 0.41 to 2.15 ct. The first set of samples (PS01–PS11) consisted of 11 pink sap-phires (table 1). Samples PS01–PS08 and PS11 were purchased directly from the miner, but not at the mine site near the Taheza River in Ilakaka. These samples are classified as C-type samples in GIA’s col-ored stone reference collection (Vertriest et al., 2019). Sample PS09 was acquired from a trader in the Ila-kaka market and was reportedly from the Ambala-
LOW-TEMP HEATING OF PINK SAPPHIRE FROM MADAGASCAR GEMS & GEMOLOGY WINTER 2020 449
Figure 1. These pink sapphires from Ilakaka, Madagascar, underwent low-temperature heat treat-ment. From top to bottom, they weigh 1.16 ct, 1.17 ct, and 1.06 ct. Photo by Robert Weldon/GIA; courtesy of Jeff Hapeman, Earth’s Treasury.
TABLE 1. Color-calibrated photos of samples PS01–PS11 before (left) and after (right) heat treatment at 800°C for 160 minutes.
PS01
Before heating After heating
PS02
PS03
PS04
PS05
PS06
PS07
PS08
PS09
PS10
PS11
Sample ID
450 LOW-TEMP HEATING OF PINK SAPPHIRE FROM MADAGASCAR GEMS & GEMOLOGY WINTER 2020
vihy mining area. This sample is classified as an E-type sample. PS10 was purchased from miners at the Sakameloka washing site, which makes it a B-type sample.
A second set of three pink sapphires, containing zircon and monazite inclusions (PS21–PS23), was used for a follow-up heating experiment (table 2). Sample PS21 was purchased from the miners at the Ambarazy mine; therefore, it is C-type. GIA field gemologists witnessed the mining of samples PS22 and PS23 in the Esoki and Besatra areas, respectively. These samples are classified as B-type (Vertriest et al., 2019).
To compare the true color of the samples before and after treatment, we used a Canon EOS 5D camera with a Canon Macro MP-E 65 mm lens to produce consistent results. Photographs were taken under identical lighting conditions, with the reference sam-ples placed in a Logan Electric Tru-View 810 color-cor-rected lightbox (5000 K lamp). A neutral-density filter was used to calibrate the camera/lightbox combina-tion to produce a neutral gray background.
Photomicrographs of internal inclusions were captured at different magnifications with a Nikon SMZ18 system and under different types of illumi-nation, together with a fiber-optic light source.
Non-polarized FTIR spectra were collected using a Thermo Fisher Nicolet 6700 FTIR spectrometer equipped with an XT-KBr beam splitter and a mer-cury-cadmium-telluride (MCT) detector operating
with a 4× beam condenser accessory. The resolution was set at 4 cm–1 with 1.928 cm–1 data spacing. In-frared spectra were collected in the same area of each sample before and after heat treatment.
Raman spectra were obtained using a Renishaw inVia Raman microscope fitted with a Stellar-REN Modu Ar-ion laser producing highly polarized light at 514 nm. For internal inclusion analysis, the sys-tem was operated in confocal mode with 20× and 50× objectives. Calibration using neon emission lines and the silicon signal at 520 cm–1 provided wavenumber accuracy within ±0.5 cm–1. Spectra were collected in the 1500–200 cm–1 region.
Heating Experiment. The pink sapphires were sep-arated into two experimental groups. First, 11 sam-ples (PS01–PS11) were subjected to heat treatment in air at 800°C for 160 minutes to study the effect on color, inclusions, and infrared spectroscopy. The sec-ond set consisted of three samples (PS21–PS23) that were heated at 200°, 400°, 600°, 800°, and 1000°C for 120 minutes at each step to study the changes in monazite and zircon inclusions using Raman spec-troscopy.
Samples were placed on an alumina ceramic felt (99.8% Al2O3) in a Thermo Scientific FB1400 Thermo-lyne benchtop 1100°C muffle furnace and heated to the desired temperature at a rate of 5°C/min. At the end of each heating cycle, the furnace was switched off. When the temperature of the furnace dropped
TABLE 2. Color-calibrated photos of samples PS21–PS23 for the secondary experiment (samples were kept at the maximum temperature for 120 minutes).
PS21a
PS22
PS23
Before heating After heating at 200°C
After heating at 400°C
After heating at 600°C
After heating at 800°C
After heating at 1000°C
aSample PS21 is not zoned. The darker part is the reflection of a polished window on the side of the stone to improve observation of the inclusions.
Sample ID
LOW-TEMP HEATING OF PINK SAPPHIRE FROM MADAGASCAR GEMS & GEMOLOGY WINTER 2020 451
below 600°C, the samples were removed and allowed to cool to room temperature. Samples were analyzed at room temperature after each heating cycle.
RESULTS AND DISCUSSIONS Color Appearance and Gemological Properties. Before heating, most of the samples in the first set were pur-plish pink. After the heat treatment process, they changed to a purer pink (table 1). These sapphires showed a significant reduction in the blue color com-ponent when heated at 800°C for 160 minutes, which had also been observed in rubies from Mozambique. Gemological properties were consistent for corundum and did not change during the heating experiment. Fluorescence was strong to medium red under long-wave and medium to weak under short-wave UV light, both pre- and post-treatment. Chalky white flu-orescence is sometimes observed in heated sapphire, caused by a charge transfer between O2– and Ti4+ ions (Emmett et al., 2017); however, none of the samples studied showed chalky fluorescence after treatment.
Infrared Spectroscopy. Previous studies on Mozam-bican rubies (Pardieu et al., 2015; Saeseaw et al., 2018) have shown that only samples with a single peak at 3309 cm–1 will develop a 3309 series (3309, 3232, and/or 3185 cm–1), which can be used as an in-dication of heat treatment. This criterion is effective for some blue sapphires (Hughes and Perkins, 2019) but is not valid for basalt-related blue sapphires.
In this study, we selected Ilakaka samples that had an obvious peak at 3309 cm–1. All samples in the first set showed a decreased 3309 cm–1 peak after heating, while 9 out of 11 samples developed a peak at 3232 cm–1, as shown in figure 2 and table 3. No 3185 cm–1 peak was observed in this experiment. This observation has been previously reported (Sae-seaw and Khowpong, 2019). The strength of the OH absorption bands at 3309, 3232, and 3185 cm–1 is re-
Figure 2. Comparison of non-polarized FTIR spectra before (blue) and after (orange) heat treatment at 800°C for 160 minutes on an un-oriented pink sapphire from Madagascar. Spec-tra are offset vertically for clarity.
AB
SOR
PTIO
N C
OEF
FIC
IEN
T (c
m–1
)FTIR SPECTRA
WAVENUMBER (cm–1)
0.95
1.10
1.05
1.00
3400
1.15
0.90
1.20
3000320032503350 3100 305031503300
After heating at 800°C
3309
3232
Before heating
TABLE 3. Comparison of FTIR peak heights before and after heat treatment at 800°C for 160 minutes.
PS01
PS02
PS03
PS04
PS05
PS06
PS07
PS08
PS09
PS10
PS11
0.04
0.04
0.07
0.07
0.04
0.05
0.05
0.06
0.06
0.06
0.04
3309 cm–1
nd
0.02
0.04
0.04
0.02
0.02
0.03
0.03
0.03
0.03
0.01
3309 cm–1 3232 cm–1
nd
0.005
0.01
0.01
nd
0.01
0.01
0.01
0.01
0.01
0.005
After heatingBefore heatingSample ID
Abbreviation: nd = not detected
lated to the orientation of the crystal and the polar-ization of the light used to analyze the sample. They are strongest when collected perpendicular to the c-axis and are related to the presence of certain trace elements. The peak height absorption coefficient of the 3185 cm–1 peak is only one-third that of the peak at 3232 cm–1; therefore, it rarely presents on small stones (Beran, 1991).
However, it is worth noting that only when the peak height absorption coefficient of the 3309 cm–1
peak is greater than or equal to 0.04 cm–1 before heat-ing will it develop a 3232 cm–1 peak after treatment. Absorption coefficient or cm–1 is related to the thick-ness of a sample. Therefore, a small sample might not show the 3232 cm–1 peak since the path length of the light through the stone is much shorter. This means that the feature is easier to detect in larger stones, while smaller stones will have “no indication of heat treatment” based on FTIR spectra.
We also collected FTIR spectra on 250 additional unheated pink sapphires reportedly from Madagas-car. The results showed 130 samples with only the single 3309 cm–1 peak, and none of these samples showed a 3309 series. Therefore, it is important to ensure that spectra are either collected perpendicular to the c-axis, taken in multiple directions, or col-lected using a diffuse reflectance (DRIFT) accessory to obtain high sensitivity of the 3232 cm–1 peak.
Internal Features. Visual Observations. Pink sap-phires from Madagascar commonly contain numer-ous zircon crystals (figure 3A). Zircon crystals typically have a rice grain shape and can occur as clusters or single crystals (figure 3B), sometimes with tension halos, similar to discoid fractures that de-velop around crystals after heat treatment (figure 3C). Needles, particles, thin films, etch tubes, and twin-ning can also be observed (figure 3D and 3E), as can
452 LOW-TEMP HEATING OF PINK SAPPHIRE FROM MADAGASCAR GEMS & GEMOLOGY WINTER 2020
Figure 3. Typical inclusion scenes in pink sapphire from Madagascar before (left) and after (right) heat treatment at
800°C for 160 minutes. Numerous zircon crystals (A) and clusters of zircon crystals (B). C: Zircon with tension
halos; the fracture expanded slightly after heating. D: Mi-nute particles, needles, and platelets. E: Etch tubes with natural fractures. F: Large mica crystal and smaller iso-lated zircon crystals. G: Monazite crystals that altered
from orange-brown to near-colorless, some developing ten-sion fractures after heat treatment (see arrows). H: Zircon
and fracture with iron stains. Photomicrographs by Charu-wan Khowpong. Fields of view 2.85 mm (A), 1.05 mm (B–
C, H), 1.75 mm (D, F–G), and 3.65 mm (E).
A
B
C
D
E
F
G
H
LOW-TEMP HEATING OF PINK SAPPHIRE FROM MADAGASCAR GEMS & GEMOLOGY WINTER 2020 453
crystals of mica (figure 3F) and monazite (figure 3G). The monazite crystals typically have an orangy color; this is due to natural radiation damage caused by a relative enrichment in radioactive elements such as uranium and thorium (Ruschel et al., 2012). A few stones featured inclusions within inclusions, with zircon crystals embedded in monazite or mica crys-tals (figure 3F).
During the first experiment with samples PS01–PS11, most of the inclusions, including zircon, showed no change when heated at 800°C for 160 mi-nutes. After treatment, orange epigenetic iron stains in surface-reaching fissures became darker due to the oxidation and dehydration of iron minerals at higher temperatures (figure 3H). Typically the orange iron stains consist of limonite (α-FeO(OH)) and convert to brownish red hematite (α-Fe2O3) during heat treat-ment (Koivula, 2013; Sripoonjan et al., 2016). The other observed change was seen in monazite crystals, which changed color from orange-brown to near-col-orless after heat treatment. In some cases, tension fractures also formed (figure 3G).
Focus on Monazite and Zircon. The most likely ex-planation for the change of color in the monazite in-clusion is the annealing of the radiation damage caused by radioactive elements that substituted in the crystal lattice. Monazite is a phosphate mineral rich in rare earth elements such as cerium, lantha-
num, and neodymium (Clavier et al., 2011). It is ra-dioactive due to the presence of thorium and, to a lesser degree, uranium. Other minerals such as zir-con and baddeleyite can also contain radioactive ele-ments. These elements are of great interest in geological studies since they can be used to date min-erals based on the radioactive decay of those trace elements. Age dating research is mostly focused on zircon, where small amounts of uranium are com-mon in the lattice (Dickin, 2018).
A side effect of radioactivity is the slow damage to the crystal structure, which is seen as the orange-brown color in the monazite inclusions. The term metamict indicates that a gem (most often zircon) has strongly altered properties (RI, SG, toughness, etc.) be-cause of its internal radiation damage. Such radiation damage can distort the crystalline structure to such a degree that it becomes non-crystalline (amorphous). An example is “low” zircon from Sri Lanka.
The initial heat treatment experiment strongly suggests that heat treatment can undo this radiation damage, healing the crystal lattice to its original un-damaged state (Meldrum et al., 1998; Nasdala et al., 2002).
To further study the potential healing of radiation damage in inclusions, we continued our heating ex-periment on selected samples (table 2) containing monazite and zircon inclusions. Both of these min-erals commonly include radioactive elements and
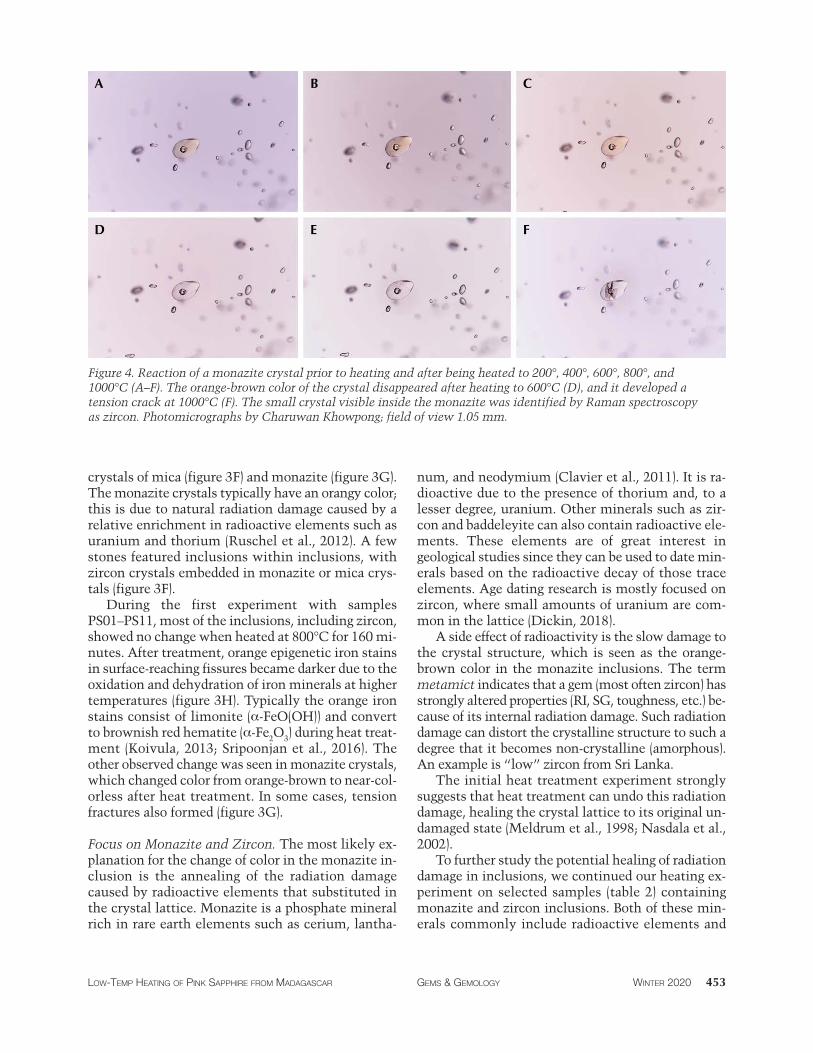
Figure 4. Reaction of a monazite crystal prior to heating and after being heated to 200°, 400°, 600°, 800°, and 1000°C (A–F). The orange-brown color of the crystal disappeared after heating to 600°C (D), and it developed a tension crack at 1000°C (F). The small crystal visible inside the monazite was identified by Raman spectroscopy as zircon. Photomicrographs by Charuwan Khowpong; field of view 1.05 mm.
A B C
D E F
454 LOW-TEMP HEATING OF PINK SAPPHIRE FROM MADAGASCAR GEMS & GEMOLOGY WINTER 2020
potentially have crystal structure damage induced by radioactivity. They may also be annealed at higher temperatures.
In this heating experiment, the temperature was increased from 200°C to 1000°C at 200°C intervals with a two-hour heating duration. Data was collected between every step. Results showed that the color of a monazite crystal did not change when heated at 200°C and 400°C, but started to fade after heating above 600°C (figure 4D). A tension fracture devel-oped after heating at 1000°C (figure 4F).
Raman spectroscopy was introduced in 1995 as a method to estimate the degree of radiation damage in minerals, such as in zircon and monazite (Nas-dala et al., 1995). In this study, we used Raman to
analyze zircon and monazite inclusions in Madagas-can pink sapphires. The results will be discussed separately.
Zircon. We analyzed 31 randomly chosen zircon in-clusions with and without tension halos from the three sapphires in the second set. Raman spectra (fig-ure 5) showed characteristic zircon peaks at 201.3, 223.8, 364.5, 442.2 (ν2), 984.0 (ν1), and 1016.8 (ν3) cm–1. It is well known that the three main peaks at 442.2, 984.0, and 1016.8 cm–1 are related to internal SiO4 vibration modes, and the three other peaks at 201.3, 223.8, and 364.5 cm–1 are lattice vibrational modes involving interactions between SiO4 tetrahedra and the Zr atom. The peak at 1016.8 cm–1 or ν3 (SiO4) is
Figure 5. Stacked Raman spectra of a zir-con inclusion in sample PS23 before and after heat treatment at each step. Peaks in the 1000–1100 cm–1 region are due to luminescence observed in the sample after heating to 1000°C. FWHM measured by GRAMS software.
RAMAN SPECTRA
RAMAN SHIFT (cm–1)550 750150 350 1150950
INTE
NSI
TY
Before heating
After heating at 200˚C
After heatingat 600˚C
After heatingat 1000˚C
After heatingat 400˚C
After heatingat 800˚C
ν3 (1017 cm–1)
ν1 (984 cm–1 )ν2 (442 cm–1)
TABLE 4. Results of Raman analyses of zircon inclusions or ν3 (SiO4) in pink sapphire, reported in average ± SD (n = number of analyzed crystals).
–
200
400
600
800
1000
1009.9 ± 1.7
1009.7 ± 1.9
1009.5 ± 1.9
1009.6 ± 1.5
1010.1 ± 1.2
1010.2 ± 1.3
Peak position (cm–1)
Measured FWHM (cm–1)
11.3 ± 2.5
11.2 ± 2.7
10.8 ± 2.8
9.9 ± 1.8
8.6 ± 1.0
10.4 ± 2.3
1011.8 ± 3.1
1012.0 ± 2.2
1010.8 ± 2.8
1011.7 ± 2.1
1009.0 ± 1.5
1008.8 ± 1.0
Sample PS21 (n = 15)
10.4 ± 1.5
9.9 ± 1.7
9.4 ± 1.3
9.4 ± 2.0
9.8 ± 1.6
8.6 ± 2.0
Peak position (cm–1)
Measured FWHM (cm–1)
Sample PS22 (n = 8)
1016.8 ± 3.0
1016.0 ± 3.1
1015.5 ± 4.1
1015.6 ± 3.1
1015.4 ± 3.3
1014.6 ± 1.1
10.4 ± 1.5
9.9 ± 1.7
9.4 ± 1.3
9.4 ± 2.0
9.8 ± 1.6
8.2 ± 1.3
Peak position (cm–1)
Measured FWHM (cm–1)
Sample PS23 (n = 8)Annealing temperature (°C)
LOW-TEMP HEATING OF PINK SAPPHIRE FROM MADAGASCAR GEMS & GEMOLOGY WINTER 2020 455
the most sensitive to the accumulation of radiation damage, and therefore it is commonly used to com-pare the structural state of radiation.
Before heating, ν3 peak positions were at about 1009.9 and 1011.8 cm–1 on average for samples PS21 and PS22, respectively. The peak of zircon crystals in sample PS23 was at a slightly higher wavenumber, around 1016.8 cm–1; see table 4. The differences in peak position are affected by many factors, such as chemical composition, pressure, and temperature. Ho-wever, those differences are beyond the scope of this study.
After heating, we found insignificant changes to Raman peaks where FWHM of the ν3 peak ranged from 8.6 to 11.3 cm–1. These numbers were reported as a partially metamict state (Nasdala et al., 1995; Palenik et al., 2003). At 1000°C, we found 10 out of 31 zircons developed peaks in the range of 950 and 1150 cm–1 (which might be luminescence features (Krzemnicki, 2010). However, these features were not observed when the Raman spectra were col-lected using a laser with 488 nm wavelength instead of 514 nm.
Significant changes in the Raman spectra of these inclusions have been reported when heated at higher temperatures (Rankin and Edwards, 2003; Wang et
al., 2006). When heated above 1400°C, the Raman spectra of these inclusions start to show baddeleyite peaks, indicating that zircon becomes unstable in these conditions and breaks down into oxides.
Monazite. Fifteen monazite inclusions from the three sapphires in the second set were studied. The Raman spectrum of monazite is presented in figure 6 and shows distinct vibrational bands in the ranges 970–1075 cm–1 and below 620 cm–1. The former is as-signed to the internal PO4 stretching vibrations, whereas the latter is due to the PO4 bending and ex-ternal vibrations of the Ce3+ ions and the [PO4]
3– units, respectively (Ruschel et al., 2012). The most prominent peak in the Raman spectrum of monazite is at about 976 cm–1 or ν1 (PO4). We measured the peak position and FWHM, as shown in table 5.
The results showed the effect of heat treatment on the peak position to be insignificant in all sam-ples. Samples PS21 and PS22 showed a lower wave-number of peak position and narrower peaks than those of the monazite crystals in sample PS23.
All samples showed sharper ~976 cm–1 peaks dur-ing progressive heating at higher temperatures. Sam-ple PS21 displayed decreasing width, from 14.2 ± 0.5 cm–1 unheated to 8.8 ± 0.2 cm–1 after heating at
Figure 6. Stacked Raman spectra of one monazite crystal in sample PS23 before and after heat treatment. FWHM was measured by GRAMS software.
RAMAN SPECTRA
RAMAN SHIFT (cm–1)550 750150 350 1150950
INTE
NSI
TYν1 (976 cm–1)
Before heating
After heating at 200˚C
After heatingat 600˚C
After heatingat 1000˚C
After heatingat 400˚C
After heatingat 800˚C
456 LOW-TEMP HEATING OF PINK SAPPHIRE FROM MADAGASCAR GEMS & GEMOLOGY WINTER 2020
1000°C. Sample PS23 also decreased in width from 18.4 ± 0.1 cm–1 unheated to 13.3 ± 0.4 cm–1 after heat-ing at 800°C. The width did not change during the heating step from 800°C to 1000°C (see figure 7). The differences between these two sets of results may be caused by chemical composition or differen-tial degrees of initial radiation damage (which is not included in this study). Our results corresponded with previous work in which Raman spectra showed distinctly narrower bands on annealed monazite than on untreated monazite (Seydoux-Guillaume et al., 2002).
CONCLUSIONS It has long been known that heat treatment at low temperatures helps to improve color in pink sap-phires. Detecting this treatment remains challeng-ing since inclusions such as zircon, needles, and particles are often not affected by low-temperature
heat treatment. Using advanced analytical instru-ments such as FTIR spectrometers is necessary to help gemologists detect heat treatment. In this study on Madagascar pink sapphire, we have shown that the presence of the 3232 cm–1 peak is related to heat treatment. While this peak is only found in heated stones, its absence is not an indicator of an unheated stone. This peak will only develop if the initial 3309 cm–1 peak is strong enough. This is ex-actly the same behavior that has been observed in rubies from Montepuez, Mozambique.
Another possible indicator of heat treatment is the observation of monazite crystals, even though they are less common in pink sapphire than zircon crystals. Monazite typically has an orange-brown color that will fade to near-colorless after heat treat-ment at relatively low temperatures. This alteration can be explained by annealing radiation damage to monazite inclusions due to the increasing tempera-ture. This also results in narrower peaks in the
Figure 7. The relative difference between FWHM of monazite at ν1 (PO4) at ~974–976 cm–1 and heating tempera-ture on sample PS22 (n = 6; left) and sample PS23 (n = 2; right). Different dots represent different monazite inclu-sions analyzed in each sample (n=number of analyzed crystals).
0
HEATING TEMPERATURE (°C)
FHW
M A
T ~9
76 c
m–1
6
20
16
14
18
10
8
12
HEATING TEMPERATURE (°C)
FHW
M A
T ~9
74 c
m–1
6
18
20
14
16
8
10
12
200 400 600 800 1000 0 200 400 600 800 1000
TABLE 5. Results of Raman analyses of monazite inclusions or ν1 (PO4) in pink sapphire, reported in average ± SD (n = number of analyzed crystals).
–
200
400
600
800
1000
974.0 ± 0.8
973.9 ± 0.8
974.0 ± 0.5
974.1 ± 0.3
974.6 ± 0.2
974.8 ± 0.3
Peak position (cm–1)
Measured FWHM (cm–1)
14.2 ± 0.5
14.3 ± 0.3
12.5 ± 1.1
11.2 ± 0.5
9.6 ± 0.2
8.8 ± 0.2
974.0 ± 1.3
974.1 ± 1.3
974.0 ± 1.1
974.6 ± 0.8
973.9 ± 0.5
974.5 ± 0.5
Sample PS21 (n = 6)
15.9 ± 0.3
15.8 ± 0.4
14.9 ± 0.2
12.9 ± 0.2
11.4 ± 0.3
9.8 ± 0.4
Peak position (cm–1)
Measured FWHM (cm–1)
Sample PS22 (n = 6)
976.5 ± 0.3
976.2 ± 0.5
976.2 ± 0.4
976.9 ± 0.4
975.9 ± 0.1
975.8 ± 0.2
18.4 ± 0.1
18.1 ± 0.5
17.5 ± 0.4
15.4 ± 0.6
13.3 ± 0.4
13.3 ± 0.4
Peak position (cm–1)
Measured FWHM (cm–1)
Sample PS23 (n = 2)Annealing temperature (°C)
LOW-TEMP HEATING OF PINK SAPPHIRE FROM MADAGASCAR GEMS & GEMOLOGY WINTER 2020 457
Raman spectrum. The presence of a near-colorless monazite inclusion suggests the gem has been heated, but its color is sometimes masked by the bodycolor of the host.
In order to use FWHM and other Raman spectra features as an indication of low-temperature heat treatment, more samples will be required to com-plete a statistically relevant analysis.
ACKNOWLEDGMENTS The authors would like to give thanks to GIA’s Bangkok lab staff, especially Suwasan Wongchacree for photomicrography, Pol-thep Sukpanish for FTIR data, and Sasithorn Engniwat for photo calibration. Also, thanks to Aaron Palke and Shane McClure for their useful suggestions. We also thank the peer reviewers for valuable comments that improved this article.
ABOUT THE AUTHORS Ms. Saeseaw is senior manager of colored stone identification, Ms. Khowpong is an analytics technician, and Mr. Vertriest is super visor of field gemology, at GIA in Bangkok.
Beran A. (1991) Trace hydrogen in Verneuil-grown corundum and its colour varieties: An IR spectroscopic study. European Journal of Mineralogy, Vol. 3, No. 6, pp. 971–976, http://dx.doi.org/10.1127/ejm/3/6/0971
Clavier N., Podor R., Dacheux N. (2011) Crystal chemistry of the monazite structure. Journal of the European Ceramic Society, Vol. 31, No. 6, pp. 941–976, http://dx.doi.org/10.1016/j.jeurcer-amsoc.2010.12.019
Emmett J.L., Douthit T.R. (1993) Heat treating the sapphires of Rock Creek, Montana. G&G, Vol. 29, No. 4, pp. 250–272, http://dx.doi.org/10.5741/GEMS.29.4.250
Emmett J.L., Scarratt K., McClure S.F., Moses T., Douthit T.R., Hughes R., Novak S., Shigley J.E., Wang W., Bordelon O., Kane R.E. (2003) Beryllium diffusion of ruby and sapphire. G&G, Vol. 39, No. 2, pp. 84–135, http://dx.doi.org/10.5741/GEMS.39.2.84
Emmett J.L., Dubinsky E.V., Hughes R.W., Scarratt K. (2017) Color, spectra & luminescence. In R.W. Hughes, Ed., Ruby & Sap-phire: A Gemologist’s Guide. Bangkok, pp. 107–163.
Hughes E.B., Perkins R. (2019) Madagascar sapphire: Low-tempera-ture heat treatment experiments. G&G, Vol. 55, No. 2, pp. 184–197, http://dx.doi.org/10.5741/GEMS.55.2.184
Hughes R.W., Manorotkul W., Hughes E.B. (2017) Ruby & Sap-phire: A Gemologist’s Guide. RWH Publishing/Lotus Publish-ing, Bangkok.
Krzemnicki M.S. (2010) How to get the “blues” out of the pink: Detection of low-temperature heating of pink sapphires. SSEF Facette, No. 17, p 12.
Meldrum A., Boatner L.A., Weber W.J., Ewing R.C. (1998) Radia-tion damage in zircon and monazite. Geochimica et Cosmo -chimica Acta, Vol. 62, No. 14, pp. 2509–2520, http://dx.doi.org/10.1016/S0016-7037(98)00174-4
Nasdala L., Irmer G., Wolf D. (1995) The degree of metamictiza-tion in zircon: A Raman spectroscopic study. European Jour-nal of Mineralogy, Vol. 7, No. 3, pp. 471–478, http://dx.doi.org/10.1127/ejm/7/3/0471
Nasdala L., Lengauer C.L., Hanchar J.M., Kronz A., Wirth R., Blanc P., Kennedy A.K., Seydoux-Guillaume A.-M. (2002) Annealing radiation damage and the recovery of cathodoluminescence. Chemical Geology, Vol. 191, No. 1-3, pp. 121–140,
zircon. American Mineralogist, Vol. 88, No. 5-6, pp. 770–781, http://dx.doi.org/10.2138/am-2003-5-606
Pardieu V., Saeseaw S., Detroyat S., Raynaud V., Sangsawong S., Bhusrisom T., Engniwat S., Muyal J. (2015) “Low temperature” heat treatment of Mozambique ruby. GIA Research News, https://www.gia.edu/gia-news-research-low-temperature-heat-treatment-mozambique-ruby
Rankin A.H., Edwards W. (2003) Some effects of extreme heat treatment on zircon inclusions in corundum. Journal of Gem-mology, Vol. 28, No. 5, pp. 257–264.
Ruschel K., Nasdala L., Kronz A., Hanchar J.M., Többens D.M., Škoda R., Finger F., Möller A. (2012) A Raman spectroscopic study on the structural disorder of monazite–(Ce). Mineral-ogy and Petrology, Vol. 105, No. 1-2, pp. 41–55, http://dx.doi.org/10.1007/s00710-012-0197-7
Saeseaw S., Khowpong C. (2019) Gem News International: The ef-fect of low-temperature heat treatment on pink sapphire. G&G, Vol. 55, No. 2, pp. 290–291.
Saeseaw S., Kongsomart B., Atikarnsakul U., Khowpong C., Ver-triest W., Soonthorntantikul W. (2018) Update on “low-tem-perature” heat treatment of Mozambican ruby: A focus on inclusions and FTIR spectroscopy. GIA Research News, https://www.gia.edu/ongoing-research/update-low-tempera-ture-heat-treatment-mozambican-ruby-focus-on-inclusions-and-ftir-spectroscopy
Seydoux-Guillaume A.M., Wirth R., Nasdala L., Gottschalk M., Montel J.M., Heinrich W. (2002) An XRD, TEM and Raman study of experimentally annealed natural monazite. Physics and Chemistry of Minerals, Vol. 29, No. 4, pp. 240–253, http://dx.doi.org/10.1007/s00269-001-0232-4
Sripoonjan T., Wanthanachaisaeng B., Leelawatanasuk T. (2016) Phase transformation of epigenetic iron staining: Indication of low-temperature heat treatment in Mozambique ruby. Jour-nal of Gemmology, Vol. 35, No. 2, pp. 156–161.
Vertriest W., Palke A.C., Renfro N.D. (2019) Field gemology: Build-ing a research collection and understanding the development of gem deposits. G&G, Vol. 55, No. 4, pp. 490–511, http://dx.doi.org/10.5741/GEMS.55.4.490
Wang W., Scarratt K., Emmett J.L., Breeding C.M., Douthit T.R. (2006) The effects of heat treatment on zircon inclusions in Madagascar sapphires. G&G, Vol. 42, No. 2, pp. 134–150, http://dx.doi.org/10.5741/GEMS.42.2.134