pts 0.1 pts –0.2 64.9 65.1 Participation rate (%) pts –0.5 pts –0.2 5.8 6.0 Unemployment rate (%) % –5.9 –27.3 732.6 759.9 Unemployed persons ('000) % 2.1 0.3 11 884.0 11 883.8 Employed persons ('000) Seasonally Adjusted pts 0.3 pts 0.0 65.1 65.1 Participation rate (%) pts –0.4 pts 0.0 5.8 5.8 Unemployment rate (%) % –4.1 –0.7 736.6 737.3 Unemployed persons ('000) % 2.3 11.4 11 903.1 11 891.8 Employed persons ('000) Trend Feb 15 to Feb 16 Jan 16 to Feb 16 Feb 2016 Jan 2016 KEY FIGURES TREND ESTIMATES (MONTHLY CHANGE) Employment increased 11,400 to 11,903,100. Unemployment decreased 700 to 736,600. Unemployment rate remained steady at 5.8%. Participation rate remained steady at 65.1% from a revised January 2016 estimate. Monthly hours worked in all jobs increased 2.5 million hours to 1,653.6 million hours. SEASONALLY ADJUSTED ESTIMATES (MONTHLY CHANGE) Employment increased 300 to 11,884,000. Full-time employment increased 15,900 to 8,192,600 and part-time employment decreased 15,600 to 3,691,500. Unemployment decreased 27,300 to 732,600. The number of unemployed persons looking for full-time work decreased 18,200 to 525,200 and the number of unemployed persons only looking for part-time work decreased 9,100 to 207,400. Unemployment rate decreased 0.2 pts to 5.8%. Participation rate decreased 0.2 pts to 64.9%. Monthly hours worked in all jobs decreased 2.0 million hours to 1,652.6 million hours. LABOUR UNDERUTILISATION (QUARTERLY CHANGE) Trend estimates: The labour force underutilisation rate decreased 0.1 pts to 14.2%. Seasonally adjusted estimates: The labour force underutilisation rate decreased 0.1 pts to 14.2%. The male labour force underutilisation rate decreased 0.1 pts to 12.3%. The female labour force underutilisation rate decreased 0.3 pts to 16.4%, based on unrounded estimates. KEY POINTS E M B A R G O : 1 1 . 3 0 A M ( C A N B E R R A T I M E ) T H U R S 1 7 M A R 2 0 1 6 LABOUR FORCE AUSTRALIA 6202.0 F E B R U A R Y 2 0 1 6 For further information about these and related statistics, email [email protected]> or contact the National Information and Referral Service on 1300 135 070. Employed Persons Feb 2015 May Aug Nov Feb 2016 '000 11450 11562 11674 11786 11898 12010 Trend Seas adj. Unemployment Rate Feb 2015 May Aug Nov Feb 2016 % 5.6 5.8 6.0 6.2 6.4 6.6 Trend Seas adj. INQUIRIES www.abs.gov.au
Transcript
pts0.1 pts–0.264.965.1Participation rate (%)
pts–0.5 pts–0.25.86.0Unemployment rate (%)
%–5.9–27.3732.6759.9Unemployed persons ('000)
%2.10.311 884.011 883.8Employed persons ('000)
Seasonally Adjusted
pts0.3 pts0.065.165.1Participation rate (%)
pts–0.4 pts0.05.85.8Unemployment rate (%)
%–4.1–0.7736.6737.3Unemployed persons ('000)
%2.311.411 903.111 891.8Employed persons ('000)
Trend
Feb 15 toFeb 16
Jan 16 toFeb 16Feb 2016Jan 2016
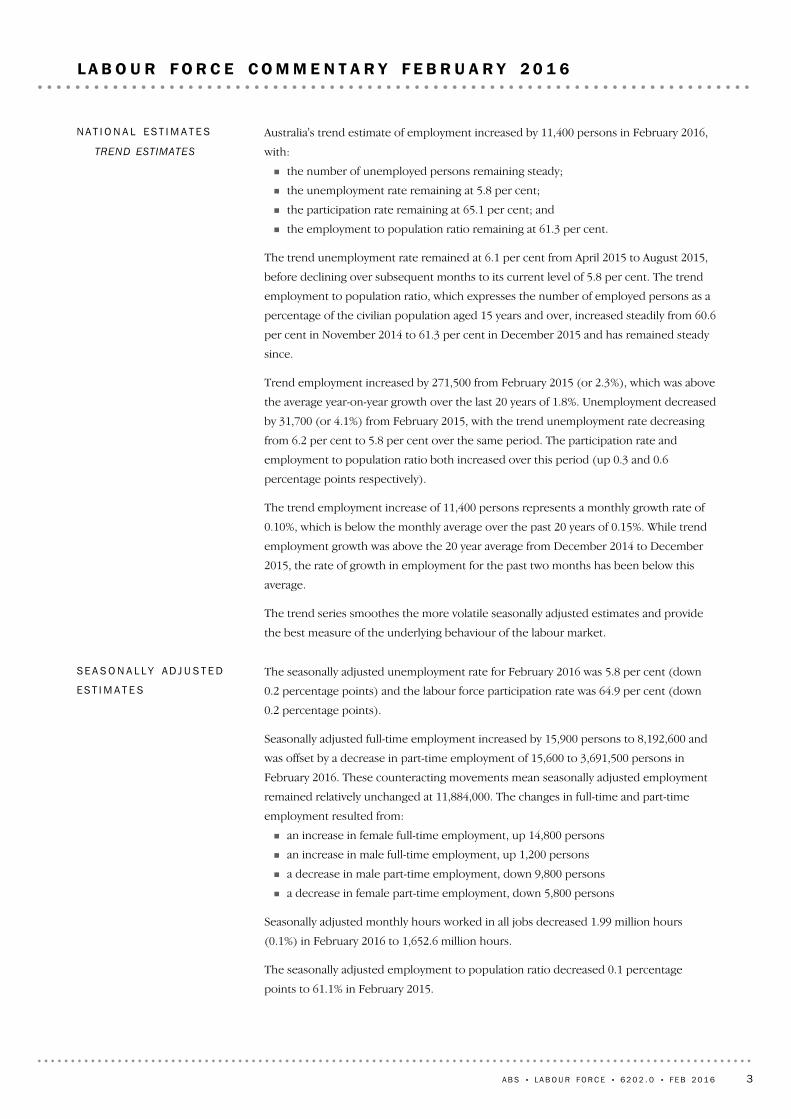
K E Y F I G U R E S
T R E N D E S T I M A T E S ( M O N T H L Y C H A N G E )
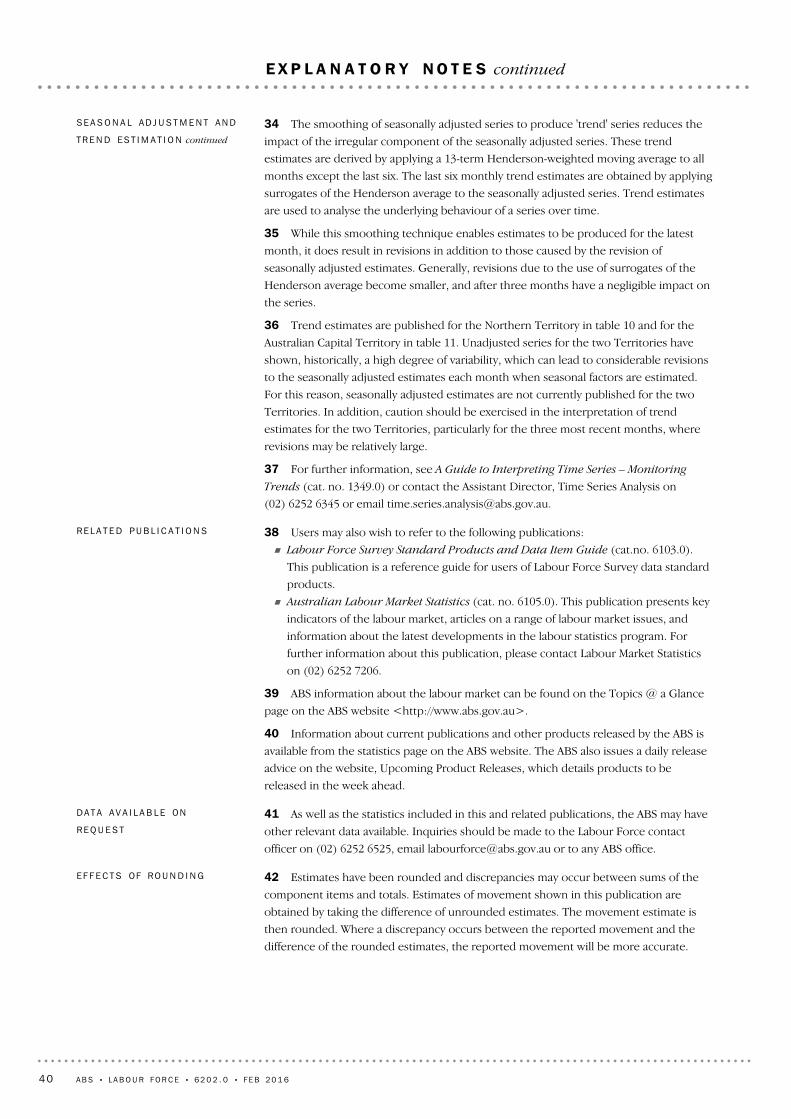
Employment increased 11,400 to 11,903,100.
Unemployment decreased 700 to 736,600.
Unemployment rate remained steady at 5.8%.
Participation rate remained steady at 65.1% from a revised January 2016 estimate.
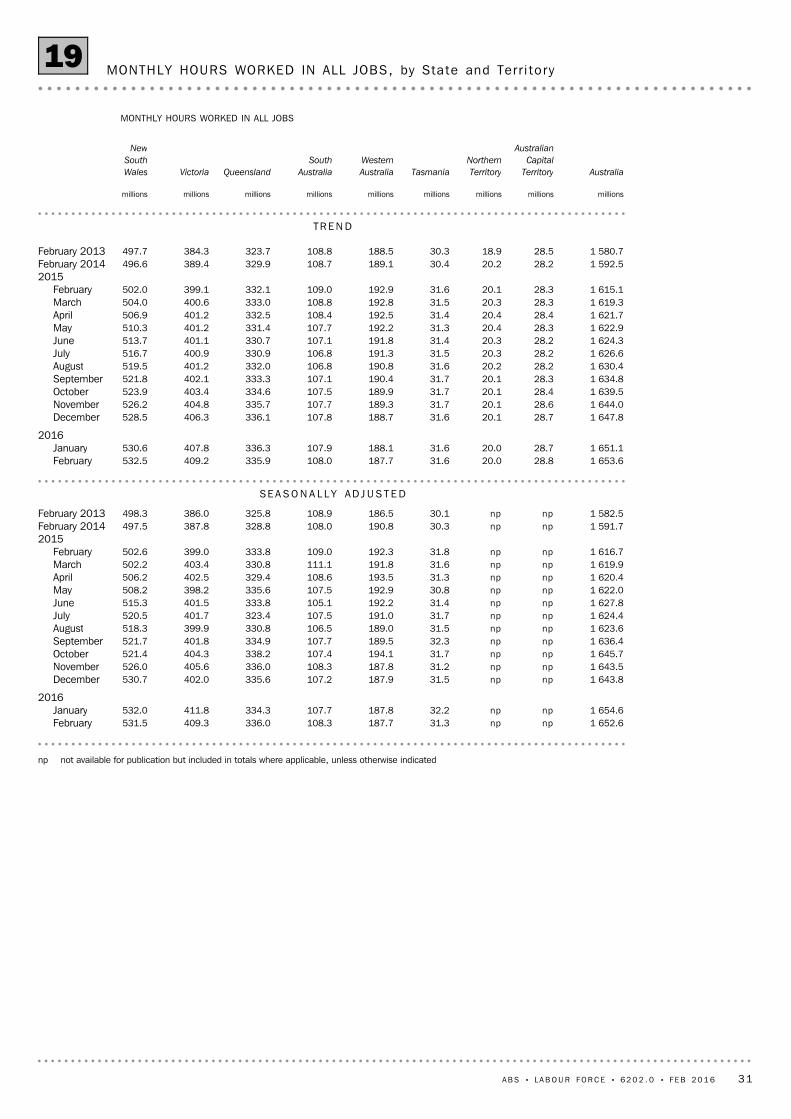
Monthly hours worked in all jobs increased 2.5 million hours to 1,653.6 million hours.
S E A S O N A L L Y A D J U S T E D E S T I M A T E S ( M O N T H L Y C H A N G E )
Employment increased 300 to 11,884,000. Full-time employment increased 15,900 to
8,192,600 and part-time employment decreased 15,600 to 3,691,500.
Unemployment decreased 27,300 to 732,600. The number of unemployed persons
looking for full-time work decreased 18,200 to 525,200 and the number of unemployed
persons only looking for part-time work decreased 9,100 to 207,400.
Unemployment rate decreased 0.2 pts to 5.8%.
Participation rate decreased 0.2 pts to 64.9%.
Monthly hours worked in all jobs decreased 2.0 million hours to 1,652.6 million hours.
L A B O U R U N D E R U T I L I S A T I O N ( Q U A R T E R L Y C H A N G E )
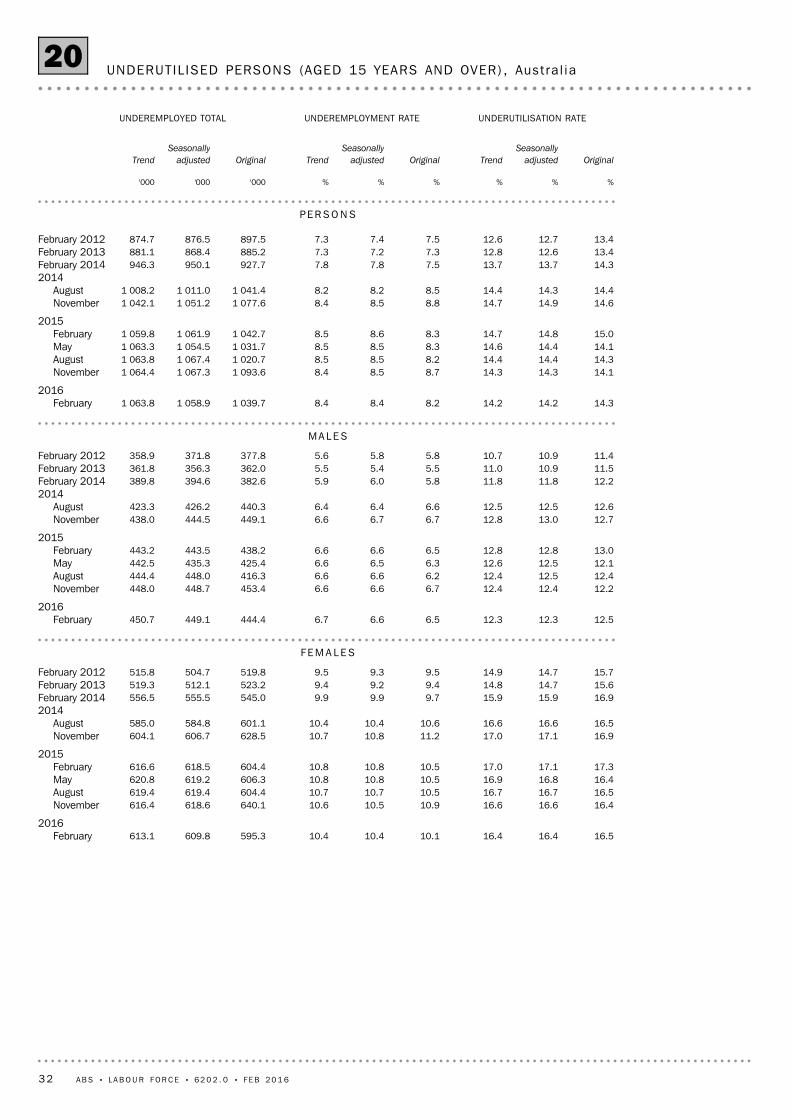
Trend estimates: The labour force underutilisation rate decreased 0.1 pts to 14.2%.
Seasonally adjusted estimates: The labour force underutilisation rate decreased 0.1 pts to
14.2%. The male labour force underutilisation rate decreased 0.1 pts to 12.3%. The
female labour force underutilisation rate decreased 0.3 pts to 16.4%, based on
unrounded estimates.
K E Y P O I N T S
E M B A R G O : 1 1 . 3 0 A M ( C A N B E R R A T I M E ) T H U R S 1 7 M A R 2 0 1 6
LABOUR FORCE A U S T R A L I A
6202.0F E B R U A R Y 2 0 1 6
For further informationabout these and relatedstatistics, [email protected]> or contact the NationalInformation and ReferralService on 1300 135 070.
MOVEMENTS IN SEASONALLY ADJUSTED SERIES BETWEEN JANUARY 2016 AND FEBRUARY 2016
The estimates in this publication are based on a sample survey. Published estimates and
movements are subject to sampling variability. Standard errors give a measure of
sampling variability. The interval bounded by two standard errors is the 95% confidence
interval, which provides a way of looking at the variability inherent in estimates. There is
a 95% chance that the true value of the estimate lies within that interval.
SA M P L I N G ER R O R
Estimates of changes shown on the front cover and used in the commentary have been
calculated using unrounded estimates, and may be different from, but are more accurate
than, movement obtained from the rounded estimates. The graphs on the front cover
also depict unrounded estimates.
RO U N D I N G
For details regarding the regular update of seasonal adjustment processes and the
publication of quarterly rebenchmarked data, refer to the "What's new in the Labour
Force" on page 8. This issue also provides an update on online collection in the Labour
Force Survey.
WH A T ' S NE W IN TH E
LA B O U R FO R C E
2 A B S • L A B O U R FO R C E • 6 2 0 2 . 0 • F E B 2 0 1 6
N O T E S
The seasonally adjusted unemployment rate for February 2016 was 5.8 per cent (down
0.2 percentage points) and the labour force participation rate was 64.9 per cent (down
0.2 percentage points).
Seasonally adjusted full-time employment increased by 15,900 persons to 8,192,600 and
was offset by a decrease in part-time employment of 15,600 to 3,691,500 persons in
February 2016. These counteracting movements mean seasonally adjusted employment
remained relatively unchanged at 11,884,000. The changes in full-time and part-time
employment resulted from:
an increase in female full-time employment, up 14,800 persons
an increase in male full-time employment, up 1,200 persons
a decrease in male part-time employment, down 9,800 persons
a decrease in female part-time employment, down 5,800 persons
Seasonally adjusted monthly hours worked in all jobs decreased 1.99 million hours
(0.1%) in February 2016 to 1,652.6 million hours.
The seasonally adjusted employment to population ratio decreased 0.1 percentage
points to 61.1% in February 2015.
SE A S O N A L L Y AD J U S T E D
ES T I M A T E S
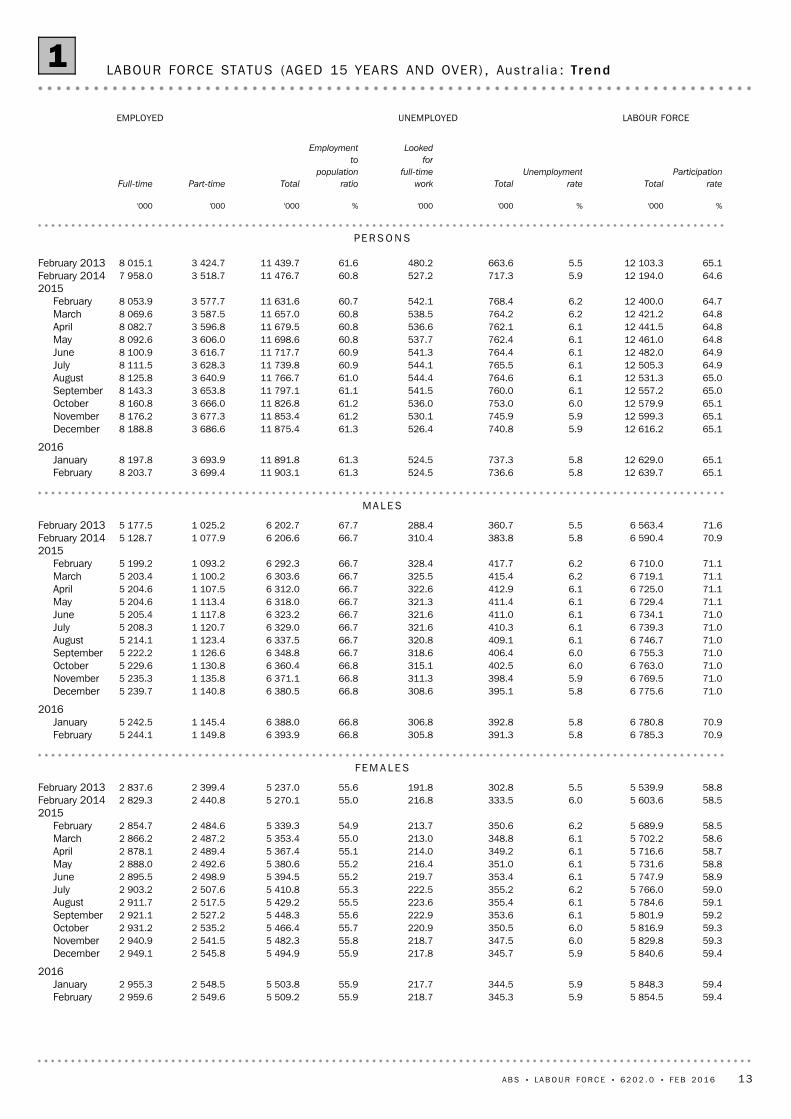
Australia's trend estimate of employment increased by 11,400 persons in February 2016,
with:
the number of unemployed persons remaining steady;
the unemployment rate remaining at 5.8 per cent;
the participation rate remaining at 65.1 per cent; and
the employment to population ratio remaining at 61.3 per cent.
The trend unemployment rate remained at 6.1 per cent from April 2015 to August 2015,
before declining over subsequent months to its current level of 5.8 per cent. The trend
employment to population ratio, which expresses the number of employed persons as a
percentage of the civilian population aged 15 years and over, increased steadily from 60.6
per cent in November 2014 to 61.3 per cent in December 2015 and has remained steady
since.
Trend employment increased by 271,500 from February 2015 (or 2.3%), which was above
the average year-on-year growth over the last 20 years of 1.8%. Unemployment decreased
by 31,700 (or 4.1%) from February 2015, with the trend unemployment rate decreasing
from 6.2 per cent to 5.8 per cent over the same period. The participation rate and
employment to population ratio both increased over this period (up 0.3 and 0.6
percentage points respectively).
The trend employment increase of 11,400 persons represents a monthly growth rate of
0.10%, which is below the monthly average over the past 20 years of 0.15%. While trend
employment growth was above the 20 year average from December 2014 to December
2015, the rate of growth in employment for the past two months has been below this
average.
The trend series smoothes the more volatile seasonally adjusted estimates and provide
the best measure of the underlying behaviour of the labour market.
NA T I O N A L ES T I M A T E S
TREND ESTIMATES
A B S • L A B O U R FO R C E • 6 2 0 2 . 0 • F E B 2 0 1 6 3
L A B O U R F O R C E C O M M E N T A R Y F E B R U A R Y 2 0 1 6
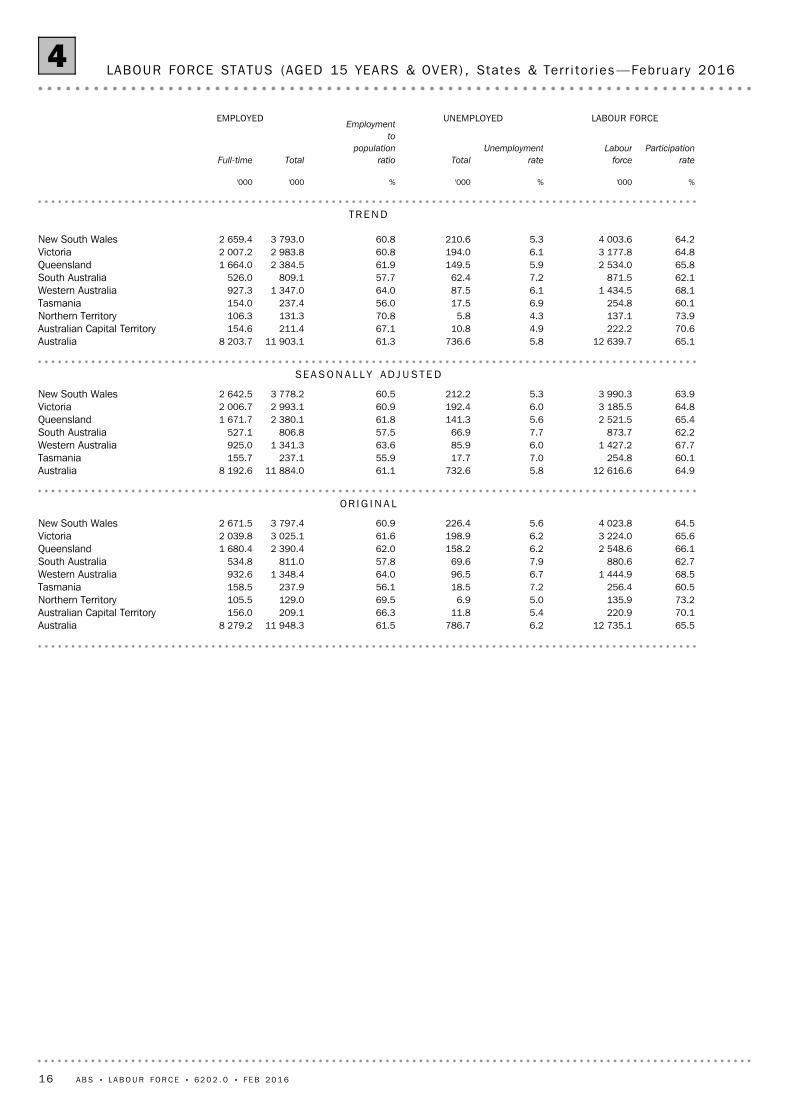
Trend employment growth in February 2016 was strongest in absolute terms in Victoria
and Queensland (up 3,900 persons in each State), but strongest in relative terms in
Queensland (up 0.2%). The largest year-on-year growth rates in trend employment were
in New South Wales (4.2%) and Queensland (2.8%).
In seasonally adjusted terms, the largest absolute increase in employment in February
2016 was in Victoria (up 30,300 persons). The largest absolute decrease in seasonally
adjusted employment was in Queensland (down 5,800 persons).
The trend unemployment rates decreased slightly in Queensland, Western Australia and
the Australian Capital Territory and increased in Victoria and Tasmania.
The largest increases in the seasonally adjusted unemployment rates were in South
Australia (up 0.9 percentage points) and Tasmania (up 0.4 percentage points). The
largest decrease was in Queensland (down 0.8 percentage points), with decreases also
seen in New South Wales and Victoria (both down 0.2 percentage points).
The trend participation rate decreased in Western Australia (down 0.1 percentage
points), Tasmania (down 0.2 percentage points) and the Northern Territory (down 0.2
percentage points) and was relatively unchanged in the other State and Territories.
The largest increases in the seasonally adjusted participation rates were in Victoria (up
0.4 percentage points) and Queensland (up 0.3 percentage points). The largest
decreases in the seasonally adjusted participation rates were in Queensland (down 0.8
percentage points) and Western Australia (down 0.5 percentage points).
Seasonally adjusted estimates are not published for the territories and the ABS
recommends using trend estimates to analyse the underlying behaviour of the series.
ST A T E ES T I M A T E S
Feb2006
Feb2007
Feb2008
Feb2009
Feb2010
Feb2011
Feb2012
Feb2013
Feb2014
Feb2015
Feb2016
%
59.0
59.6
60.3
60.9
61.6
62.2
62.9
63.5TrendSeasonally adjusted
EMPLOYMENT TO POPULAT ION RATIO , PERSONS, February 2006 toFebruary 2016
SE A S O N A L L Y AD J U S T E D
ES T I M A T E S continued
4 A B S • L A B O U R FO R C E • 6 2 0 2 . 0 • F E B 2 0 1 6
L A B O U R F O R C E C O M M E N T A R Y F E B R U A R Y 2 0 1 6 continued
np not available for publication but included in totals where applicable, unlessotherwise indicated
5.86.05.85.8Australianpnp4.94.9Australian Capital Territorynpnp4.34.3Northern Territory7.06.66.96.8Tasmania6.05.96.16.1Western Australia7.76.87.27.2South Australia5.66.45.95.9Queensland6.06.36.16.1Victoria5.35.55.35.3New South Wales
%%%%
FebruaryJanuaryFebruaryJanuary
SEASONALLYADJUSTEDTREND
UNEMPLOYMENT RATE, STATES AND TERRITORIES, January 2016 andFebruary 2016
ST A T E ES T I M A T E S continued
A B S • L A B O U R FO R C E • 6 2 0 2 . 0 • F E B 2 0 1 6 5
L A B O U R F O R C E C O M M E N T A R Y F E B R U A R Y 2 0 1 6 continued
In original terms the rotation group which was new to the sample in February 2016 (the
incoming rotation group) displayed a stronger tendency towards both employment and
participation than the group it replaced (the outgoing rotation group in January), with a
higher employment to population ratio (60.5% for the incoming group, compared to
60.1% for the outgoing group) and a higher participation rate (65.3% for the incoming
group, compared to 64.8% for the outgoing group). An increased employment to
population ratio was observed across all survey rotation groups, with an average increase
of 1.1 percentage points seen for the seven common rotation groups.
I N C O M I N G RO T A T I O N
GR O U P
The Labour Force Survey sample can be thought of as comprising eight sub-samples (or
rotation groups), with each sub-sample remaining in the survey for eight months, and
one rotation group "rotating out" each month and being replaced by a new group
"rotating in". This sample rotation is important in ensuring that seven-eighths of the
sample are common from one month to the next, to ensure that changes in the
estimates reflect real changes in the labour market, rather than the sample. In addition,
the replacement sample is generally selected from the same geographic areas as the
outgoing one, as part of a representative sampling approach.
When considering movements in the original estimates, it is possible to decompose the
sample into three components:
the matched common sample (survey respondents who responded in both January
and February),
the unmatched common sample (respondents in February but who did not respond
in January, or vice versa), and
the incoming rotation group (who replaced respondents who rotated out in
January).
The matched common sample made the largest contribution towards the movement in
original terms from January 2016 to February 2016 for both employment and not in the
labour force estimates. The unmatched common sample made the largest contribution
towards the movement in unemployment in original terms. The detailed decomposition
of each of these movements is included in the data cube 'Insights From the Original
Data'.
In considering the three components of the sample, it is important to remember that the
matched common sample describes the change observed for the same respondents
between January and February, while the other two components reflect differences
between the aggregate labour force status of different groups of people.
While the rotation groups are designed to be representative of the population, the
outgoing and incoming rotation groups will almost always have somewhat different
characteristics, as a result of the groups representing a sample of different households
and people. The design of the survey, including the weighting and estimation processes,
ensures that these differences are generally relatively minor and seeks to ensure that
differences in characteristics of rotation groups do not affect the representativeness of
the survey and its estimates. Monthly estimates are always designed to be representative
of their respective months, regardless of the relative contribution of the three
components of the sample.
SA M P L E CO M P O S I T I O N
6 A B S • L A B O U R FO R C E • 6 2 0 2 . 0 • F E B 2 0 1 6
I N S I G H T S F R O M T H E O R I G I N A L D A T A
As the gross flows and rotation group data are presented in original terms they are not
directly comparable to the seasonally adjusted and trend data discussed elsewhere in the
commentary, and are included to provide additional information for the original data.
Since the original data are unadjusted, they have a considerable level of inherent
sampling variability, which is specifically adjusted for in the trend series. The trend data
provide the best measure of the underlying behaviour of the labour market and are the
focus of the commentary in this publication.
TH E IM P O R T A N C E OF
TR E N D DA T A
In looking ahead to the March 2016 estimates, the outgoing rotation group in February
2016, which will be replaced by a new incoming rotation group in March 2016, had a
lower employment to population ratio (60.5% in February) compared to other rotation
groups (61.5% for all rotation groups in February 2016). If the incoming group in March
2016 has an employment to population ratio that is more similar to, or is relatively higher
than the average, this rotation group change considered in isolation is likely to
contribute towards employment growth. This will be summarised in the March 2016
issue.
The outgoing rotation group in February 2016 also had an unemployment rate (5.9% in
February 2016), which was similar to the other rotation groups (6.2% for all rotation
groups in February 2016) and a participation rate (64.3% in February 2016), which was
lower than the other rotation groups (65.5% in February 2016). If the incoming group in
March 2016 has an unemployment rate which is equally similar to the average, there is
unlikely to be a significant contribution to the unemployment rate from this rotation
group change. Similarly if the incoming group in March 2016 has a participation rate
which is more similar to, or is relatively higher than the average, this rotation group
change is likely to contribute towards participation growth.
OU T G O I N G RO T A T I O N
GR O U P
The incoming rotation group in February 2016 further displayed a slightly stronger
tendency towards unemployment than the group it replaced, with the unemployment
rate for the incoming group 7.3%, compared to a rate of 7.2% for the outgoing group and
the average of all rotation groups for February 2016 of 6.2%.
I N C O M I N G RO T A T I O N
GR O U P continued
A B S • L A B O U R FO R C E • 6 2 0 2 . 0 • F E B 2 0 1 6 7
I N S I G H T S F R O M T H E O R I G I N A L D A T A continued
As advised in previous issues of this publication, the ABS will publish results of the
annual seasonal reanalysis of Labour Force series with the March 2016 issue. This will
revise seasonally adjusted and trend estimates for key Labour Force series to the
commencement of the series in February 1978. While seasonal factors for the complete
time series are estimated every month, they are reviewed annually at a more detailed
level than is possible in the monthly processing cycle to ensure that the estimates are of
the highest quality.
In response to the independent technical review into the Labour Force Survey in late
2014, the ABS introduced time series correction factors to account for the changed
supplementary survey program. Relevant prior corrections over the entire series were
introduced with the 2015 annual seasonal reanalysis, and these will also be reviewed as
part of the 2016 process. The March 2016 issue will include information on the impact of
the annual seasonal reanalysis on seasonally adjusted and trend estimates.
AN N U A L SE A S O N A L
RE A N A L Y S I S
The Participation, Job Search and Mobility supplementary survey was conducted for the
second time in February 2016. As a result, the time series correction factors that were
initially introduced with October 2014 data to remove the effect of this and other
supplementary surveys on seasonally adjusted and trend estimates have been
re-estimated. This is part of an ongoing process that ensures they reflect the most up to
date original data (as subsequent data become available), to ensure a high level of time
series coherence in Labour Force data.
CO R R E C T I O N FA C T O R S
FO R EF F E C T S OF
SU P P L E M E N T A R Y SU R V E Y
PR O G R A M ON
SE A S O N A L L Y AD J U S T E D
AN D TR E N D ES T I M A T E S
The latest available Estimated Resident Population data has been incorporated into
revised population benchmarks which underpin the compilation of the Labour Force
series. Labour Force series from April 2014 to January 2016 have been revised in original
terms, with related revisions to seasonally adjusted and trend data. Revised series
(including data up to the January 2016 reference month but prior to the inclusion of the
February 2016 data), were released on 10 March 2016 in the January 2016 issue of Labour
Force, Australia - Rebenchmarked Estimates (cat. no. 6202.0.55.003). The inclusion of the
February 2016 data in this issue will result in further revisions to the seasonally adjusted
and trend data as a result of the usual concurrent seasonal adjustment process.
RE V I S E D PO P U L A T I O N
RE B E N C H M A R K S
8 A B S • L A B O U R FO R C E • 6 2 0 2 . 0 • F E B 2 0 1 6
W H A T ' S N E W I N T H E L A B O U R F O R C E
Online collection take up rates have been relatively consistent since January 2014 (as can
be seen in Graph 1). The lowest take up rate during this period was 17.4% in January
2014 (when only 81% of the sample was offered the online option), and the highest was
24.1% in June 2015. The annual average online collection response rate in 2015 was
22.0%, which was slightly higher than 2014 (21.1%) and 2013 (17.5%).
ON L I N E CO L L E C T I O N TA K E
UP
Households selected in the Labour Force Survey are sent a letter and brochure informing
them that they have been selected to participate in the survey. Since February 2014,
survey respondents have been asked to use the unique user name and password
provided in the letter to register an email address and other contact details for the
household, or to contact the ABS if they are unable to participate in the survey online. A
notification is then sent to respondents who have registered their contact details
electronically to advise that the survey questionnaire is available for completion online
within a specified one week period.
Respondents who are unable to participate in the survey online, along with respondents
who register contact details for the household electronically but do not complete the
survey questionnaire online within the specified one week period, are subsequently
contacted by an ABS interviewer to complete the survey questionnaire either via
telephone or face-to-face. This represents an "opt out" approach to online data
collection, and encourages survey participants to complete the survey online where
possible at a time which is convenient to them.
CU R R E N T CO L L E C T I O N
PR O C E D U R E S
From December 2012 to April 2013, the ABS conducted a trial of online data collection.
During this time, households in one rotation group (i.e. one-eighth of the survey
sample) were offered the option of self completing their Labour Force Survey (LFS)
questionnaire online instead of via a telephone or face-to-face interview. From May 2013,
the ABS expanded the offer of online collection to 50% of each new incoming rotation
group. This coincided with the introduction of the current sample, based on the 2011
Census of Population and Housing. From September 2013, online collection has been
offered to 100% of households in each incoming rotation group and by April 2014, 100%
of households were being offered online collection. Interviewer collection (both
telephone and face-to-face) continues to be available for households.
The ABS used the initial trial of offering online data collection to one rotation group and
the progressive introduction of the offer to other rotation groups, to measure the impact
on the Labour Force series of the move to online data collection. Statistical analysis
during this period concluded there was no evidence of any reporting bias due to the
introduction of online collection. Ongoing monitoring and analysis of online responses
has not identified a significant impact from the move to online self completion data
collection.
BA C K G R O U N D
This note updates analysis provided in the August issue of Labour Force, Australia (cat.
no. 6202.0) and provides new insights into the take up of online collection, and the
characteristics of responses by survey mode: telephone interview, face-to-face interview,
and online collection.
I N T R O D U C T I O N
A B S • L A B O U R FO R C E • 6 2 0 2 . 0 • F E B 2 0 1 6 9
O N L I N E C O L L E C T I O N I N T H E L A B O U R F O R C E S U R V E Y
Graph 3 shows there was also a higher take up of online collection in some states and
territories than in others. In 2015, Australian Capital Territory average take up rates were
the highest in Australia (32.1%), while take up was lowest in the Northern Territory
(11.2%).
100% of sample offered online collection from April 2014
Apr 2014 Aug 2014 Dec 2014 Apr 2015 Aug 2015 Dec 2015
%
0
6
12
18
23
29
35Capital cityRest of state
GRAPH 2 - ONLINE COLLECT ION TAKE UP RATES, BY CAPITAL CITY /REST OF STATE
Graph 2 shows that capital city respondents had a stronger preference for online
collection when compared with respondents in the regions in the rest of the state.
100% of sample offered online collection from April 2014
Jan 2014 July 2014 Jan 2015 Jul 2015
%
0
6
12
18
23
29
35
GRAPH 1 - MONTHLY ONLINE COLLECT ION TAKE UP RATE
The monthly electronic collection response rate has only been below 20% once since
online collection was offered to the entire sample, in August 2015. This respondent
behaviour is consistent with changing respondent behaviour across all modes during
August, when the Characteristics of Employment supplementary survey is collected.
ON L I N E CO L L E C T I O N TA K E
UP continued
10 A B S • L A B O U R FO R C E • 6 2 0 2 . 0 • F E B 2 0 1 6
O N L I N E C O L L E C T I O N I N T H E L A B O U R F O R C E S U R V E Y continued
Another notable feature of online collection take up was that it was highest for
respondents in their second month in survey, and gradually reduces over the following
months (as can be seen in Graph 5). This behaviour was seen across new rotation groups
between July 2014 and June 2015, with self-completed online response increasingly
replaced by Interviewer-administered modes (telephone and face-to-face interviewing),
with a greater degree of interviewer non-response follow up.
1 2 or more
%
0
6
12
18
23
29
35
GRAPH 4 - HOUSEHOLD SIZE AND ONLINE COLLECT ION TAKE UPRATE, 2015
Take up rates by household size show that households with 2 people or more have a
stronger preference for online collection, compared with single person households (as
can be seen in Graph 4).
Note: 2015 is the first full year calendar year of online collection available to all survey participants
NSW VIC QLD SA WA TAS NT ACT TOTAL
%
0
6
12
18
23
29
35
GRAPH 3 - AVERAGE ONLINE COLLECT ION TAKE UP RATE BY STATE,2015
ON L I N E CO L L E C T I O N TA K E
UP continued
A B S • L A B O U R FO R C E • 6 2 0 2 . 0 • F E B 2 0 1 6 11
O N L I N E C O L L E C T I O N I N T H E L A B O U R F O R C E S U R V E Y continued
Analysis of the characteristics of respondents who choose to respond through online
collection (compared with respondents who favour telephone or face-to-face
interviews), shows that:
They were more likely to be female,
They had a relatively higher participation rate,
They were more likely to be employed, and
Were more likely to work in higher skilled occupations (especially professionals).
The ABS will publish another feature on electronic collection in the August 2016 issue,
52.517.766.334.811.84.13.0*1.158.530.713.816.8Australian Capital Territory32.712.063.120.67.41.50.31.258.419.17.012.1Northern Territory65.221.267.444.017.67.73.04.755.636.318.317.9Tasmania
339.393.772.4245.612.731.214.017.263.2214.4112.8101.6Western Australia217.870.867.5147.014.721.78.912.857.5125.367.657.7South Australia645.3185.071.3460.312.758.623.135.562.2401.7200.7200.9Queensland791.5256.967.5534.613.471.732.739.058.5462.9251.4211.4Victoria994.4332.866.5661.611.878.031.146.958.7583.7290.8292.8New South Wales
21.42.289.719.2*6.0*1.2*0.4*0.884.418.14.313.8Australian Capital Territory21.44.778.116.77.71.3*0.31.072.115.43.611.8Northern Territory32.96.480.526.412.23.2*0.23.070.723.26.117.1Tasmania
177.021.587.9155.612.319.24.115.177.0136.443.992.4Western Australia98.812.287.686.613.711.9*1.310.575.674.723.451.3South Australia
339.649.485.4290.111.332.8*3.329.575.8257.379.7177.7Queensland360.147.186.9313.111.636.36.230.176.9276.881.9194.9Victoria471.866.485.9405.410.743.3*5.038.376.7362.1102.4259.7New South Wales
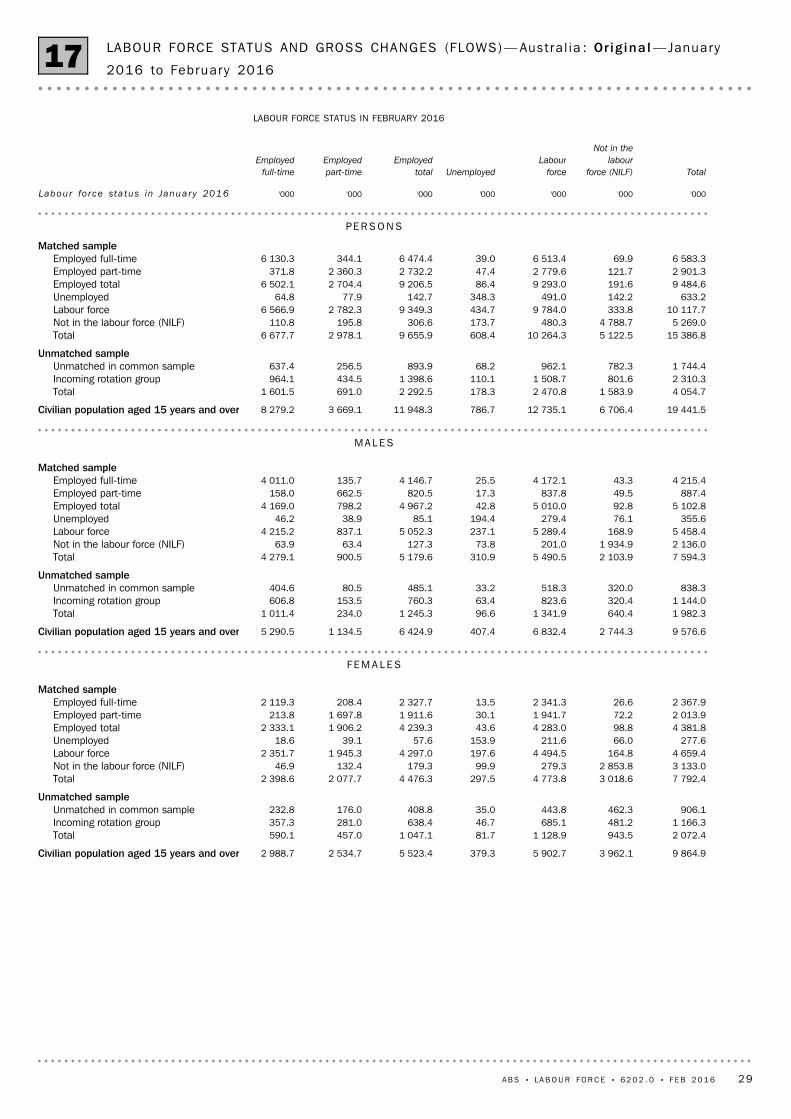
NO T AT T E N D I N G FU L L - T I M E ED U C A T I O N
31.115.550.115.618.92.92.6*0.340.712.69.63.0Australian Capital Territory11.37.434.93.9*6.3*0.2*0.1*0.232.73.73.40.3Northern Territory32.414.854.217.525.74.52.81.740.313.012.2*0.8Tasmania
162.272.255.590.013.312.09.8*2.148.178.068.99.1Western Australia119.058.650.860.416.29.87.6*2.242.550.644.26.4South Australia305.7135.655.7170.215.225.819.86.047.2144.4121.123.3Queensland431.4209.951.3221.516.035.426.58.943.1186.1169.516.6Victoria522.6266.449.0256.213.534.726.08.742.4221.5188.433.1New South Wales
AT T E N D I N G FU L L - T I M E ED U C A T I O N
'000'000%'000%'000'000'000%'000'000'000
Part.
rateTotal
Unemp.
rateTotal
Looked
for part-
time
only
Looked
for full-
time
Emp.
to
pop.
ratioTotal
Part-
time
Full-
time
Civ.
pop.
aged
15-24
Not
in the
labour
force
(NILF)
LABOUR FORCEUNEMPLOYEDEMPLOYED
LABOUR FORCE STATUS (AGED 15- 24 YEARS) , by State , Ter r i to r y and Educat iona l
attendance (fu l l - t ime) —February 201616
28 A B S • L A B O U R FO R C E • 6 2 0 2 . 0 • F E B 2 0 1 6
9 864.93 962.15 902.7379.35 523.42 534.72 988.7Civilian population aged 15 years and over
2 072.4943.51 128.981.71 047.1457.0590.1Total1 166.3481.2685.146.7638.4281.0357.3Incoming rotation group
906.1462.3443.835.0408.8176.0232.8Unmatched in common sampleUnmatched sample
7 792.43 018.64 773.8297.54 476.32 077.72 398.6Total3 133.02 853.8279.399.9179.3132.446.9Not in the labour force (NILF)4 659.4164.84 494.5197.64 297.01 945.32 351.7Labour force
9 576.62 744.36 832.4407.46 424.91 134.55 290.5Civilian population aged 15 years and over
1 982.3640.41 341.996.61 245.3234.01 011.4Total1 144.0320.4823.663.4760.3153.5606.8Incoming rotation group
838.3320.0518.333.2485.180.5404.6Unmatched in common sampleUnmatched sample
7 594.32 103.95 490.5310.95 179.6900.54 279.1Total2 136.01 934.9201.073.8127.363.463.9Not in the labour force (NILF)5 458.4168.95 289.4237.15 052.3837.14 215.2Labour force
355.676.1279.4194.485.138.946.2Unemployed5 102.892.85 010.042.84 967.2798.24 169.0Employed total
UNDERUTILISATION RATEUNDEREMPLOYMENT RATEUNDEREMPLOYED TOTAL
UNDERUT IL ISED PERSONS (AGED 15 YEARS AND OVER) , Aust ra l i a20
32 A B S • L A B O U R FO R C E • 6 2 0 2 . 0 • F E B 2 0 1 6
np not available for publication but included in totals where applicable, unless otherwise indicated
16.516.416.410.110.410.4595.3609.8613.1Australia
10.8np10.46.1np6.36.7np6.9Australian Capital Territory12.2np9.46.4np5.34.1np3.4Northern Territory16.718.118.29.711.311.611.613.513.8Tasmania18.117.818.311.712.312.174.878.877.7Western Australia19.819.019.211.911.311.949.447.049.0South Australia16.416.015.99.710.09.9115.6118.2117.1Queensland17.117.117.710.710.811.4157.4157.2167.2Victoria15.415.214.99.39.79.4175.8180.6175.5New South Wales
FE M A L E S
12.512.312.36.56.66.7444.4449.1450.7Australia
10.6np10.84.6np4.95.1np5.5Australian Capital Territory8.9np8.84.5np4.43.2np3.2Northern Territory
13.314.615.05.87.17.78.09.710.6Tasmania13.412.212.26.66.56.653.051.252.3Western Australia15.216.016.47.38.48.834.138.640.6South Australia12.711.611.86.96.46.593.785.486.8Queensland12.913.413.47.07.37.3121.8126.2124.8Victoria11.111.010.95.96.05.9125.6127.7127.1New South Wales
10.7np10.65.3np5.611.8np12.5Australian Capital Territory10.4np9.15.4np4.87.3np6.6Northern Territory14.816.216.57.69.19.519.623.224.4Tasmania15.514.715.08.89.19.1127.7130.1130.0Western Australia17.417.517.79.59.810.283.585.689.6South Australia14.413.713.78.28.18.1209.3203.6203.9Queensland14.815.115.38.78.99.2279.2283.4291.9Victoria13.112.912.77.57.77.5301.4308.3302.6New South Wales
PE R S O N S
%%%%%%'000'000'000
Original
Seasonally
adjustedTrendOriginal
Seasonally
adjustedTrendOriginal
Seasonally
adjustedTrend
UNDERUTILISATION RATEUNDEREMPLOYMENT RATEUNDEREMPLOYED TOTAL
UNDERUT IL ISED PERSONS (AGED 15 YEARS AND OVER) , by State and Ter r i to ry —February
201621
A B S • L A B O U R FO R C E • 6 2 0 2 . 0 • F E B 2 0 1 6 33
EF F E C T OF NE W SE A S O N A L L Y AD J U S T E D ES T I M A T E S ON TR E N D ES T I M A T E S
5.85.95.8February5.85.95.8January
2016
5.95.95.9December5.95.95.9November
2015
(2) 5.7 i.e.
falls by 2.20%
(1) 5.9 i.e.
rises by 2.20%
WHAT IF NEXT MONTH'S SEASONALLYADJUSTED ESTIMATE IS:
1.01.31.45.21.53.92.42.82.42.11.7ptsTotal1.01.31.66.11.04.12.62.92.32.21.8ptsLooking for p/t work2.23.72.69.23.07.75.16.45.05.13.7ptsLooking for f/t work
Unemployment rate14.79.710.51.30.81.14.02.97.75.89.4'000Not in labour force11.58.38.20.80.31.03.42.25.54.47.4'000Labour force
8.15.55.90.60.10.82.31.64.54.14.4'000Total6.04.34.20.6—0.51.81.23.03.23.2'000Looking for p/t work5.33.34.20.30.10.61.51.03.22.42.9'000Looking for f/t work
Unemployed
10.57.77.50.70.30.83.12.04.93.96.7'000Total9.17.16.20.60.20.72.61.74.13.55.8'000Part time5.73.94.90.40.20.51.81.12.72.14.0'000Full time
0.20.20.20.60.70.60.40.40.40.30.3ptsTotal0.30.30.51.41.30.90.70.70.70.50.5ptsLooking for p/t work0.20.30.20.70.70.70.50.60.50.40.3ptsLooking for f/t work
Unemployment rate42.135.630.83.13.23.511.98.222.420.924.2'000Not in labour force44.933.735.93.02.83.512.68.920.423.628.6'000Labour force
19.613.413.91.41.01.56.14.09.39.911.1'000Total10.48.06.40.80.30.83.02.25.25.75.8'000Looking for p/t work16.310.612.21.10.81.25.33.58.28.09.4'000Looking for f/t work
Unemployed
44.032.735.03.02.73.412.48.620.022.828.3'000Total26.521.313.71.90.72.18.35.511.712.318.4'000Part time38.823.532.02.82.32.911.37.417.418.625.8'000Full time
EmployedAged 15 years and over
PersonsFemalesMales
AUSTRALIA
ACTNTTas.WASAQldVic.NSW
To illustrate, let us say the published level estimate for employed persons aged
15–19 years is 700,000 and the associated standard error is 9,000. The standard error is
then used to interpret the level estimate of 700,000. For instance, the standard error of
9,000 indicates that:
There are approximately two chances in three that the real value falls within the
range 691,000 to 709,000 (700,000 + or – 9,000)
There are approximately nineteen chances in twenty that the real value falls within
the range 682,000 to 718,000 (700,000 + or – 18,000).
The real value in this case is the result we would obtain if we could enumerate the total
population.
The following table shows the standard errors for this month's level estimates.
LEVEL ESTIMATES
The estimates in this publication are based on information gained from the occupants of
a sample survey of dwellings. Because the entire population is not surveyed, the
published original, seasonally adjusted and trend estimates are subject to sampling error.
The most common way of quantifying such sampling error is to calculate the standard
error for the published estimate or statistic. For more information, see paragraphs 25 to
27 of the Explanatory Notes.
ST A N D A R D ER R O R S
42 A B S • L A B O U R FO R C E • 6 2 0 2 . 0 • F E B 2 0 1 6
S T A N D A R D E R R O R S
0.40.50.61.20.71.71.21.21.00.80.7ptsUnemployment to population ratio –
1.11.41.64.92.73.92.63.22.62.32.0ptsTotal1.11.41.85.93.34.22.73.12.52.32.1ptsLooking for p/t work2.43.93.09.24.08.05.57.65.35.84.2ptsLooking for f/t work
Unemployment rate9.06.46.80.70.90.72.71.83.74.85.8'000Not in labour force7.55.75.50.60.50.72.31.53.33.94.9'000Labour force
8.75.76.60.70.30.82.61.84.24.35.3'000Total6.34.34.70.70.20.51.91.22.83.33.8'000Looking for p/t work6.03.84.60.30.10.62.01.33.02.73.5'000Looking for f/t work
Unemployed
6.85.35.00.60.50.62.21.43.03.64.5'000Total6.04.84.30.50.40.51.91.22.63.33.9'000Part time4.13.03.40.30.30.41.30.81.91.92.7'000Full time
0.20.20.20.70.70.60.40.50.40.30.3ptsTotal0.30.30.61.41.30.90.70.80.70.60.5ptsLooking for p/t work0.20.30.20.70.80.70.50.60.50.40.4ptsLooking for f/t work
Unemployment rate29.622.118.02.32.02.28.85.913.515.318.1'000Not in labour force30.319.721.32.22.02.39.16.013.715.618.8'000Labour force
19.913.314.51.40.91.46.34.39.510.211.7'000Total10.38.06.61.00.40.83.12.24.65.66.1'000Looking for p/t work16.810.612.81.20.81.25.53.78.28.59.8'000Looking for f/t work
Unemployed
29.219.020.62.12.02.28.65.512.915.118.2'000Total15.312.78.71.10.81.34.32.85.98.49.7'000Part time23.713.818.61.81.81.86.63.99.412.215.1'000Full time
EmployedAged 15 years and over
PersonsFemalesMales
AUSTRALIA
ACTNTTas.WASAQldVic.NSW
The following example illustrates how to use the standard error to interpret a movement
estimate. Let us say that one month the published level estimate for females employed
part-time in Australia is 1,890,000; the next month the published level estimate is
1,900,000 and the associated standard error for the movement estimate is 11,900. The
standard error is then used to interpret the published movement estimate of 10,000. For
instance, the standard error of 11,900 indicates that:
There are approximately two chances in three that the real movement between the
two months falls within the range – 1,900 to 21,900 (10,000 + or – 11,900)
There are approximately nineteen chances in twenty that the real movement falls
within the range – 13,800 to 33,800 (10,000 + or – 23,800).
The following table shows the standard errors for this month's movement estimates.
MOVEMENT ESTIMATES
A B S • L A B O U R FO R C E • 6 2 0 2 . 0 • F E B 2 0 1 6 43
S T A N D A R D E R R O R S continued
All persons aged 15 years and over who met one of the following criteria during theEmployed
The estimation methodology used in the Labour Force Survey. Composite Estimationuses sample responses from nearby months as well as from the reference month toderive estimates for the reference month. This approach achieves gains in efficiency byexploiting the high similarity between the responses provided by the same respondent inprevious months. For details see Information Paper: Forthcoming Changes to LabourForce Statistics, 2007 (cat. no. 6292.0).
Composite Estimation
All usual residents of Australia aged 15 years and over except members of the permanentdefence forces, certain diplomatic personnel of overseas governments customarilyexcluded from census and estimated population counts, overseas residents in Australia,and members of non-Australian defence forces (and their dependants) stationed inAustralia.
Civilian population aged 15years and over
Persons aged 15-24 years enrolled full time at a TAFE college, university, or othereducational institution in the reference week, except those persons aged 15-19 yearswho were still attending school.
Attending tertiary educationalinstitution full time
Persons aged 15-19 years enrolled at secondary or high school in the reference week.Attending school
Persons aged 15-24 years enrolled at secondary or high school or enrolled as a full timestudent at a Technical and Further Education (TAFE) college, university, or othereducational institution in the reference week.
Attending full time education
Actual hours of work refers to a specified reference period (e.g. a week) and includes:hours actually worked during normal periods of work;time spent in addition to hours worked during normal periods of work (includingovertime);time spent at the place of work on activities such as the preparation of the workplace,repairs and maintenance, preparation and cleaning of tools, and the preparation ofreceipts, time sheets and reports;time spent at the place of work waiting or standing by due to machinery or processbreakdown, accident, lack of supplies, power or internet access, etc;time corresponding to short rest periods (resting time) including tea and coffeebreaks or prayer breaks;travel time connected to work (excluding commuting time); andtraining and skills enhancement related to the job or employer.
Excluded are:hours paid for but not worked, such as paid annual leave, public holidays or paid sickleave;meal breaks (e.g. lunch breaks);paid and unpaid time 'on call';time spent on travel to and from work when no productive activity for the job isperformed (e.g. commuting time); andtime off during working hours to attend outside educational activities, even if it isauthorised, e.g. those not connected to the job or employer.
For multiple job holders the LFS collects a separate measure of actual hours worked inmain job and in all jobs.
Actual hours of work
Actively looked for work includes:written, telephoned or applied to an employer for work;had an interview with an employer for work;answered an advertisement for a job;checked or registered with an employment agency;taken steps to purchase or start your own business;advertised or tendered for work; andcontacted friends or relatives in order to obtain work.
Actively looked for work
44 A B S • L A B O U R FO R C E • 6 2 0 2 . 0 • F E B 2 0 1 6
G L O S S A R Y
For any group, persons who were employed or unemployed, as defined.Labour force
The matching of respondents who report in consecutive months enables analysis of thetransition of individuals between the different labour force status classifications, referredto as the matched sample. The transition counts between the different labour forcestatus classifications from one point in time to the next are commonly referred to asgross flows.
The figures presented in gross flows are presented in original terms only and do notalign with published labour force estimates. The gross flows figures are derived from thematched sample between consecutive months, which after taking account of the samplerotation and varying non-response in each month is approximately 80 percent of thesample.
Caution should be exercised when analysing these gross flows data due to:the figures presented sum to approximately 80 percent of the population values as thegross flows data are based on the matched sample only;there is no adjustment applied to account for changes due to seasonal patterns(referred to commonly as seasonal adjustment); andthe estimates of relative sizes of each transition class are subject to bias due to thematched sample being a non-representative sample.
Gross flows
Flow estimates are a measure of activity over a given period. For example, monthly hoursworked in all jobs is a measure of the total number of hours worked in a calendar month.
Flow estimates
Estimated resident population (ERP), is Australia's official measure of the population ofAustralia and is based on the concept of usual residence. It refers to all people,regardless of nationality, citizenship or legal status, who usually live in Australia, with theexception of foreign diplomatic personnel and their families. It includes usual residentswho are overseas for fewer than 12 months. It excludes overseas visitors who are inAustralia for fewer than 12 months. Refer to Australian Demographic Statistics (cat. no.3101.0).
Estimated resident population(ERP)
For any group, the number of employed persons expressed as a percentage of thecivilian population in the same group.
Employment to populationratio
Includes employed persons who usually worked less than 35 hours a week (in all jobs)and either did so during the reference week, or were not at work in the reference week.
Employed part-time
Includes employed persons who usually worked 35 hours or more a week (in all jobs)and those who, although usually working less than 35 hours a week, worked 35 hours ormore during the reference week.
Employed full-time
reference week:Worked for one hour or more for pay, profit, commission or payment in kind, in a jobor business or on a farm (employees and owner managers of incorporated orunincorporated enterprises).Worked for one hour or more without pay in a family business or on a farm(contributing family workers).Were employees who had a job but were not at work and were:
away from work for less than four weeks up to the end of the reference week; or
away from work for more than four weeks up to the end of the reference week and
received pay for some or all of the four week period to the end of the reference
week; or
away from work as a standard work or shift arrangement; or
on strike or locked out; or
on workers' compensation and expected to return to their job.
Were owner managers who had a job, business or farm, but were not at work.
Employed continued
A B S • L A B O U R FO R C E • 6 2 0 2 . 0 • F E B 2 0 1 6 45
G L O S S A R Y continued
Stock estimates are a measure of certain attributes at a point in time and can be thoughtof as stocktakes. For example, the total number of employed persons is an account ofthe number of people who were considered employed in the Labour Force Surveyreference week.
Stock estimates
A time series of estimates with the estimated effects of normal seasonal variationremoved. See Explanatory Notes for more detail.
Seasonally adjusted series
The number of fully responding dwellings expressed as a percentage of the total numberof dwellings excluding sample loss. Examples of sample loss include: dwellings where allpersons are out of scope and/or coverage; vacant dwellings; dwellings underconstruction; dwellings converted to non-dwellings; derelict dwellings; and demolisheddwellings.
Response rate
For any group, the labour force expressed as a percentage of the civilian population aged15 years and over in the same group.
Participation rate
Persons who were not in the categories employed or unemployed, as defined. Theyinclude people who undertook unpaid household duties or other voluntary work only,were retired, voluntarily inactive and those permanently unable to work.
Not in labour force
Monthly hours worked in all jobs measures the total number of actual hours worked byemployed persons in a calendar month. It differs from the actual hours worked estimates(and the usual hours worked estimates) since these refer only to the hours worked inthe reference week.
The methodology used to produce monthly hours worked in all jobs means that theseare synthetic estimates. Seasonally adjusted and trend estimates of monthly hoursworked in all jobs are available for the period July 1978 onwards.
Further information on the methodology used to produce the monthly hours worked inall jobs estimates is available on the ABS website in Information Paper: Expansion ofHours Worked Estimates from the Labour Force Survey (cat. no. 6290.0.55.001).
Actual and usual hours worked cannot be aggregated across time to produce eitherquarterly or annual estimates as they relate to only a single week in the month. Incontrast, monthly hours worked in all jobs estimates are a true monthly measure, andmay be aggregated across time to produce both quarterly and annual estimates.
Monthly hours worked in alljobs
The non-market sector is an industry grouping comprising the following industries:Education and training; Public administration & safety; and Health care and socialassistance. Refer to Australian National Accounts: Concepts, Sources and Methods (cat.no. 5216.0).
Non-market Sector
The market sector is an industry grouping comprising the following industries:Agriculture, forestry and fishing; Mining; Manufacturing; Electricity, gas, water and wasteservices; Construction; Wholesale trade; Retail trade; Accommodation and food services;Transport, postal and warehousing; Information media and telecommunications; Financeand insurance services; Rental, hiring and real estate services; Professional, scientific andtechnical services; Administrative and support services; Arts and recreation services; andOther services. Refer to Australian National Accounts: Concepts, Sources and Methods (cat. no. 5216.0).
Market sector
The number of long-term unemployed persons, expressed as a percentage of the totalunemployed population.
Long-term unemploymentratio
The number of persons unemployed for 52 weeks or over.Long-term unemployed
A classification of the civilian population aged 15 years and over into employed,unemployed or not in the labour force, as defined. The definitions conform closely tothe international standard definitions adopted by the International Conferences ofLabour Statisticians.
Labour force status
46 A B S • L A B O U R FO R C E • 6 2 0 2 . 0 • F E B 2 0 1 6
G L O S S A R Y continued
Usual hours of work refers to a typical period rather than the hours worked in a specifiedreference period. The concept of usual hours applies both to persons at work and topersons temporarily absent from work, and is defined as the hours worked during atypical week or day. Actual hours worked (for a specific reference period) may differfrom usual hours worked due to illness, vacation, strike, overtime work, a change of job,or similar reasons.
Usual hours of work
For any group, the number of unemployed persons expressed as a percentage of thelabour force in the same group.
Unemployment rate
Unemployed persons who:actively looked for part time work only; orwere waiting to start a new part time job.
Unemployed looked for onlypart time work
Unemployed persons who:actively looked for full time work; orwere waiting to start a new full time job.
Unemployed looked for fulltime work
Persons aged 15 years and over who were not employed during the reference week, and:had actively looked for full time or part time work at any time in the four weeks up tothe end of the reference week and were available for work in the reference week; orwere waiting to start a new job within four weeks from the end of the reference weekand could have started in the reference week if the job had been available then.
Unemployed
The sum of the number of persons unemployed and the number of persons inunderemployment, expressed as a proportion of the labour force.
Underutilisation rate
Employed persons aged 15 years and over who want, and are available for, more hours ofwork than they currently have. They comprise:
persons employed part time who want to work more hours and are available to startwork with more hours, either in the reference week or in the four weeks subsequentto the survey; orpersons employed full time who worked part time hours in the reference week foreconomic reasons (such as being stood down or insufficient work being available). Itis assumed that these people wanted to work full time in the reference week andwould have been available to do so.
Underemployed workers
The number of underemployed workers expressed as a percentage of total employedpersons.
Underemployment ratio(proportion of employed)
The number of underemployed workers expressed as a percentage of the labour force.Underemployment rate(proportion of labour force)
A smoothed seasonally adjusted series of estimates. See Explanatory Notes for moredetail.
Trend series
A B S • L A B O U R FO R C E • 6 2 0 2 . 0 • F E B 2 0 1 6 47
G L O S S A R Y continued
www.abs.gov.auWEB ADDRESS
All statistics on the ABS website can be downloaded freeof charge.
F R E E A C C E S S T O S T A T I S T I C S
Client Services, ABS, GPO Box 796, Sydney NSW 2001POST
Our consultants can help you access the full range ofinformation published by the ABS that is available free ofcharge from our website. Information tailored to yourneeds can also be requested as a 'user pays' service.Specialists are on hand to help you with analytical ormethodological advice.
I N F O R M A T I O N A N D R E F E R R A L S E R V I C E
www.abs.gov.au the ABS website is the best place fordata from our publications and information about the ABS.


![OpAccess AnkappraisalkofjIndonesia’skimmensek ......Jambi 54.5 Warrenet al.[15] Lampung 65.1 Averageliteraturevalue Riau 69.8 Brady[47],Neuzil[44] WestSumatra 65.1 Averageliteraturevalue](https://static.documents.pub/doc/80x56/60917d7d0e1b007b7d410a54/opaccess-ankappraisalkofjindonesiaaskimmensek-jambi-545-warrenet-al15.jpg)


