76
Edelman Intelligence / general electric GE Global Innovation Barometer 2018 Japan Report February 2018 1

Edelman Intelligence / general electric
GE Global Innovation Barometer 2018
Japan Report
February 2018
1
Edelman Intelligence / general electric
ONE:Methodology
TWO:Global Summary From Chaos to Confidence
THREE:Japan Executive Summary
FOUR:Narratives in Detail
Contents
2

Methodology
3

This year’s method and scope
4
Innovation Business Executives
2,090 Business Executives in total across 20 markets
Each respondent’s line of work involves taking part in their company’s innovation
process/policies
Responsible for making decisions related to innovation, product development or
research and development (R&D) activities in their company
In Japan, we talked to 100 Innovation Business Executives
All answered a 30 minute interview
Fieldwork dates:12th of October – 1st of December 2017

Edelman Intelligence / general electric
From Chaos to Confidence:Emerging Players,
Emerging Technologies, Emerging Challenges
5
Global Summary
Edelman Intelligence / general electric
2018 Key FindingsFrom Chaos to Confidence: Emerging Players, Emerging Technologies, Emerging Challenges
Emerging Confidence: While the United States (-8) and Germany (-7) see a drop in championship status from 2014, Japan (+8) and China (+4) take more share. Asia (34+ since 2014) and emerging markets are gaining confidence, viewing themselves as more innovative than they did in 2014.
New Actors Driving Innovation: Multinationals are now leading the innovation pack (+4 since 2014), while SMEs (-11 since 2014) and entrepreneurs (-2 since 2014) seem to have lost some of their innovation drive. In the Middle East and Asia especially, the private sector is becoming a more important driver of innovation while there is a decrease in governments driving innovation.
Working in a Protectionist World: Global executives want the best of both worlds: on one hand they want the benefits of protectionist policies on domestic businesses and jobs, and on the other hand, they want the benefits of globalization and open markets. A small majority of global executives (55%) believe protectionist policies benefit businesses within their country and 73% believe it is good for the workforce. However, 68% globally believe their government cannot keep up with the pace of change and 22% (of those that prefer protectionism) see multinationals as the drivers of innovation.
1
2
3

The Potential of Additive: Global executives are excited about the potential of 3D printing, saying it will have a positive impact (63%), increase creativity (91%) and get goods to market faster (89%). At the same time, 53% believe 3D printing has yet to reach its full potential, requiring more education and reassurance.
Maximizing the Return on Innovation: Globally, 40% of innovations are having a positive impact on the bottom line. What’s the secret to success for these “innovation achievers”? They’re taking a more measured approach. Businesses are waiting to perfect and test their innovation before launch rather than getting to market quickly—a 10-point jump since 2016 (now 65%). Innovation achievers also are more willing to wait for long-term ROI for breakthrough innovation (84%) and have a clear structure and process in place to measure that return (50% vs. 43%). Hype vs Reality of Impact: Hype around certain technologies does not always equate to transformative impact. In fact, global executives believe that many under-hyped technologies will have a transformative impact, including energy grids (74% say it will bring transformative change to their country), virtual healthcare (68%) and smart cities (71%).
4
5
6
Future of Work: The workforce is considered the most crucial element to innovation success in most markets, yet skills gaps continue to be a top concern among businesses. Nearly 3 in 4 (74%) global executives believe a lack of skills is an issue facing their industry—a challenge that has increased over time (64% say a lack of talent/inadequate skills is a key challenge today, up from 56% in 2014).
7
2018 Key FindingsFrom Chaos to Confidence: Emerging Players, Emerging Technologies, Emerging Challenges
More Challenging Environment: The challenges confronting innovative businesses are tough – and getting tougher – both externally and internally. There is a 13-point increase (now 67%) since 2014 in lack of sufficient funding, a 6-point increase (now 65%) in the inability to scale innovations to a wider market, an 8-point increase (now 64%) in lack of adequate talent/ skillsets, and a 14-point increase (now 64%) in the inability of businesses to take risks. Emerging markets such as Poland, South Africa, Malaysia and Saudi Arabia are experiencing the greatest increase in challenges.
8

Edelman Intelligence / general electric
Japan Executive Summary
8

Key findings
Japan continues its upward trend towards innovation-championship status. With 21% in 2018, an increase of 4 percentage points since 2016, Japan now sits in the second position. Japan is establishing itself as an alternative hotspot for global innovation.
Japan’s business executives are not as enthusiastic about multinational companies (MNCs) as the global community, with MNCs only scoring 13%. Large enterprises are taking the top spot as the main innovation driver (21%), which is in line with the last three GE GIBs. Similar to the global narrative, small and medium size enterprises (SMEs) have lost considerable share, and are now scoring 12% compared to 24% in the 2014 GE GIB.Japan represents an interesting case regarding its approach to innovation with Japanese business executives wanting to focus on protecting their core business 10 percentage points less than in 2016 (from 65% in 2016 to 55% in 2018). At the same time, more business executives choose to wait to perfect and test innovations before launch, with a 15 percentage point increase since 2016 (from 34% in 2016 to 49% in 2018).
In Japan there is less enthusiasm for 3D printing than in other Asian countries. In Japan, only 36% of business executives think 3D printing will have a positive impact on businesses, compared to 63% globally. Yet, only 28% state that they are very familiar with the technology, which is 13% percentage points less than the global average.
Similar to the global narrative, 53% of Japanese business executives think that protectionism would be beneficial for businesses. Yet, Japanese business executives who are in favor of protectionist policies under-index when asked if protectionist policies would be beneficial for domestic trade. Only 26% confirm this, compared to 41% globally.
9

10
- In Japan, large enterprises headquartered in the country are taking the top spot as the main innovation driver (21%), which is in line with the last three GE GIBs. Yet, this lead is less commanding than in 2016 (31%) or 2014 (25%).
- When it comes to SMEs, Japan confirms the global narrative, with SMEs having lost 12 percentage points since the 2014 GE GIB, now standing at 12%.
- Though, individual entrepreneurs and start-ups go against the global narrative, as they have gained momentum showing a 7 percentage point increase from 2014 to 2018 (10% vs. 17%, respectively).
New Actors Driving Innovation:
Multinationals are now leading the innovation pack (+4 since 2014), while SMEs (-11 since 2014) and entrepreneurs (-2 since 2014) seem to have lost some of their innovation drive. In the Middle East and Asia especially, the private sector is becoming a more important driver of innovation while there is a decrease in governments driving innovation.

11
- Compared to the 2016 GE GIB, Japan remains in the second spot after the United States, with 21% of business executives choosing Japan as the innovation champion.
- Business executives’ self assessment differs from the global narrative of substantially increased confidence in one’s innovation environment. In 2014, 41% of Japan’s business executives confirmed their country has an innovation conducive environment. In 2016, this number grew to 60%, but has now fallen significantly to 38%. This is 10 percentage points lower than the global average of 48%.
- On the international scale, there is an observed aspirational relationship between Japan and the US, with 49% of Japan’s business executives naming the US as the innovation champion.
Emerging Confidence:
While the United States (-8) and Germany (-7) see a drop in championship status from 2014, Japan (+8) and China (+4) take more share. Asia (34+ since 2014) and emerging markets are gaining confidence, viewing themselves as more innovative than they did in 2014.

12
- Aligning with the global narrative, a small majority (53%) of Japanese business executives sees protectionist policies as beneficial to businesses.
- Japanese business executives who are in favor of protectionist policies under-index when asked if protectionist policies would be beneficial for domestic trade. Only 26% confirm this, compared to 41% globally.
- Furthermore, a majority of Japanese business executives (77%) agree that the government is not able to regulate innovation, which is 9 percentage pointshigher than the global average (68%).
Working in a Protectionist World:
Global executives want the best of both worlds: on one hand they want the benefits of protectionist policies on domestic businesses and jobs, and on the other hand, they want the benefits of globalization and open markets. A small majority of global executives (55%) believe protectionist policies benefit businesses within their country and 73% believe it is good for the workforce. However, 68% globally believe their government cannot keep up with the pace of change and 22% (of those that prefer protectionism) see multinationals as the drivers of innovation.
13
- Japan’s business executives seem less enthusiastic about 3D printing than other Asian markets. Only 36% (compared to 63% globally) think that 3D printing will have a positive impact on businesses.
- This lessened enthusiasm is also shown in the 81% of Japanese business executives thinking that 3D printing would lead to more fake and counterfeit products, which is 12 percentage points more than the global average (69%).
- Another concern is found in the regulation of 3D printing. 84% of business executives state that 3D printing would be hard to regulate and to ensure proper safety testing, which is 19 percentage points higher than the global average (65%).
- Japan’s business executives also differ from the global narrative when it comes to the environmental benefits of 3D printing. Only 66% think 3D printing would be beneficial in this regard, compared to 80% globally.
The Potential of Additive:
Global executives are excited about the potential of 3D printing, saying it will have a positive impact (63%), increase creativity (91%) and get goods to market faster (89%). At the same time, 53% believe 3D printing has yet to reach its full potential, requiring more education and reassurance.

14
Maximizing the Return on Innovation:
Globally, 40% of innovations are having a positive impact on the bottom line. What’s the secret to success for these “innovation achievers”? They’re taking a more measured approach. Businesses are waiting to perfect and test their innovation before launch rather than getting to market quickly—a 10-point jump since 2016 (now 65%). Innovation achievers also are more willing to wait for long-term ROI for breakthrough innovation (84%) and have a clear structure and process in place to measure that return (50% vs. 43%).
- Japan differs from the global average when it comes to the return on innovation. Japanese business executives state that 31% of their innovations have had a positive impact their bottom line and improved their position in the market (compared to a global average of 40%).
- Japan also under-indexes in the choice ‘to protect the core business as much as possible, so it continues to generate the profitability needed to support Research & Innovation efforts’. Japanese executives only score 55% (compared to 69% globally). In this aspect, there has been a decrease of 10 percentage points since 2016 (65%).
- In the GE GIB 2018, there is also a decrease in business executives wanting to get to market as soon as possible. Where in 2016, 66% chose this option, it is now down by 15 percentage points to 51% in 2018.
- To summarize, there seems to be a contradiction of less Japanese business executives wanting to protect the core business, but at the same time also increasingly choosing to wait to perfect and test the innovation before launch.
- Furthermore, 71% of Japanese business executives want to create innovations that conform to ‘innovation hype’ and current trends to keep up with the market. This is 12 percentage points more than the global average (59%).

15
- The top three innovations creating the most hype in Japan are Fintech (65%), IoT (64%) and Big Data and Analytics (59%), which is similar to the global averages. Yet, all three of the ‘top hyped technologies’ are below the global average for hype.
- This under-indexing is also reflected in the transformative potential/ impact ranking, where the bottom six innovations under-index (Smart Cities: 58%, AR/VR: 57%, Smart Energy Grids: 56%, IoT: 56%, Electrification of the Transport System: 54%, Nanotechnology: 52%).
- Big Data (67%), Artificial Intelligence (64%) and Driverless Cars (63%) are seen as the most transformative innovations in Japan.
Hype vs. Reality of Impact:
Hype around certain technologies does not always equate to transformative impact. In fact, global executives believe that many under-hyped technologies will have a transformative impact, including energy grids (74% say it will bring transformative change to their country), virtual healthcare (68%) and smart cities (71%).
16
- For Japan’s business executives, one of the main challenges for innovating efficiently is the lack of talent/ inadequate skillset (67% in 2018).
- Compared to 2014, there has been a 15 percentage point increase in Japanese business executives stating a lack of talent / inadequate skillset as a challenge, moving from 52% in 2014 to 67% in 2018.
Future of Work:
The workforce is considered the most crucial element to innovation success in most markets, yet skills gaps continue to be a top concern among businesses. Nearly 3 in 4 (74%) global executives believe a lack of skills is an issue facing their industry—a challenge that has increased over time (64% say a lack of talent/inadequate skills is a key challenge today, up from 56% in 2014).

17
More Challenging Environment:
The challenges confronting innovative businesses are tough –and getting tougher – both externally and internally. There is a 13-point increase (now 67%) since 2014 in lack of sufficient funding, a 6-point increase (now 65%) in the inability to scale innovations to a wider market, an 8-point increase (now 64%) in lack of adequate talent/ skillsets, and a 14-point increase (now 64%) in the inability of businesses to take risks. Emerging markets such as Poland, South Africa, Malaysia and Saudi Arabia are experiencing the greatest increase in challenges.
- Japanese business executives see the increased pressure to conform to ‘innovation hype’ and trends around certain innovations (67%) as a key challenge.
- Compared to the global narrative, Japan’s business executives see less of a challenge in the lack of sufficient investment and financial support. With 57%, Japan scores 10 percentage points less than the global average of 67%.
- When looking at the GE GIB 2018 for Japan, the number of business executives who cite the lack of sufficient funding as a challenge has remained the same, also scoring 57% in 2016. Yet, compared to 2014 (43%), this challenge has seen a 14 percentage points increase.
- This more challenging environment for businesses can also be observed in Japan’s business executives answers in 2018, compared to 2014. Out of the eight presented challenges Japan’s business executives score higher for every single one in 2018 than in 2016.

Narratives in Detail
18

19
Section One: Emerging Players• New Actors Driving Innovation• Emerging Confidence• Working in a Protectionist World
Section Two: Emerging Technologies• The Potential of Additive• Maximizing the Return on Innovation (ROI)• Hype vs. Reality of Impact
Section Three: Emerging Challenges • Future of Work• More Challenging Environment
Contents

Edelman Intelligence / © 2017 20
section one:
Emerging Players

Edelman Intelligence / general electric
New Actors Driving Innovation
21
Executive Summary
• Multinationals are now leading the innovation pack (+4 since 2014), while SMEs (-11 since 2014) and entrepreneurs (-2 since 2014) seem to have lost some of their innovation drive. In the Middle East and Asia especially, the private sector is becoming a more important driver of innovation while there is a decrease in governments driving innovation.

22%20%
19%
14%
11%9%
3%1%
11%
18%
23%
18%
12%
9%
2%
5%
Small and medium companies (10 to 250
employees)
Individual entrepreneurs and start-ups
Multinational companies investing in your country
Large enterprises (more than 250 employees)
headquartered in your country
Universities and research labs
Government and public authorities at national
level
Public authorities at local level (region / city)
State owned enterprises in your country (SoE)
2014 2018
Q3. Who do you think is driving innovation the most today in your country? Base business executives 2014: 3,309, business executives 2018: 2,090 [Full base sizes listed in the appendix]
Who is the main driver for innovation in your country?(Historical tracking data at a global level)
Multinational companies are indeed back in the driving seat for innovation, while SMEs seem to lose some of their innovation drive.
22

25% 24%
12% 11% 11% 10%
7%
0%
21%
12%
4%
10%
13%
17%
10%
13%
Large enterprises (more than 250 employees)
headquartered in your country
Small and medium companies (10 to 250
employees)
Public authorities at local level (region / city)
Universities and research labs
Multinational companies investing in your country
Individual entrepreneurs and start-ups
Government and public authorities at national
level
State owned enterprises in your country (SoE)
2014 2018
Q3. Who do you think is driving innovation the most today in your country? Base business executives in Japan 2014: 100, Japan business executives 2018: 100 [Full base sizes listed in the appendix]
Who is the main driver for innovation in your country?(Historical tracking data at a global level)
In Japan, SMEs and large enterprises have lost share since 2014, but large enterprises are still taking the lead.
23
Q3. Who do you think is driving innovation the most today in your country? Base business executives 2014: 3,309, business executives 2018: 2,090 [Full base sizes listed in the appendix]
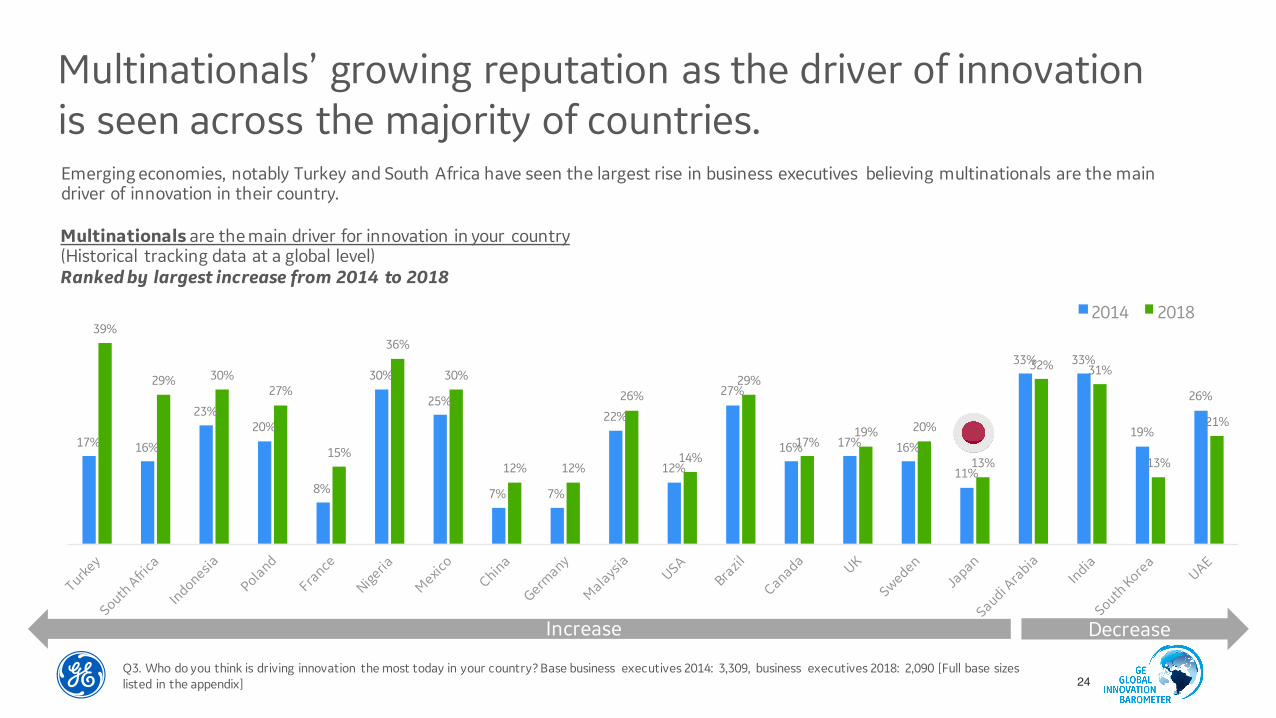
Multinationals are the main driver for innovation in your country(Historical tracking data at a global level)Ranked by largest increase from 2014 to 2018
Multinationals’ growing reputation as the driver of innovation is seen across the majority of countries.
17% 16%
23%20%
8%
30%
25%
7% 7%
22%
12%
27%
16% 17% 16%
11%
33% 33%
19%
26%
39%
29% 30%27%
15%
36%
30%
12% 12%
26%
14%
29%
17%19% 20%
13%
32% 31%
13%
21%
2014 2018
Emerging economies, notably Turkey and South Africa have seen the largest rise in business executives believing multinationals are the main driver of innovation in their country.
24
Increase Decrease
Q3. Who do you think is driving innovation the most today in your country? Base business executives 2014: 3,309, business executives 2018: 2,090 [Full base sizes listed in the appendix]
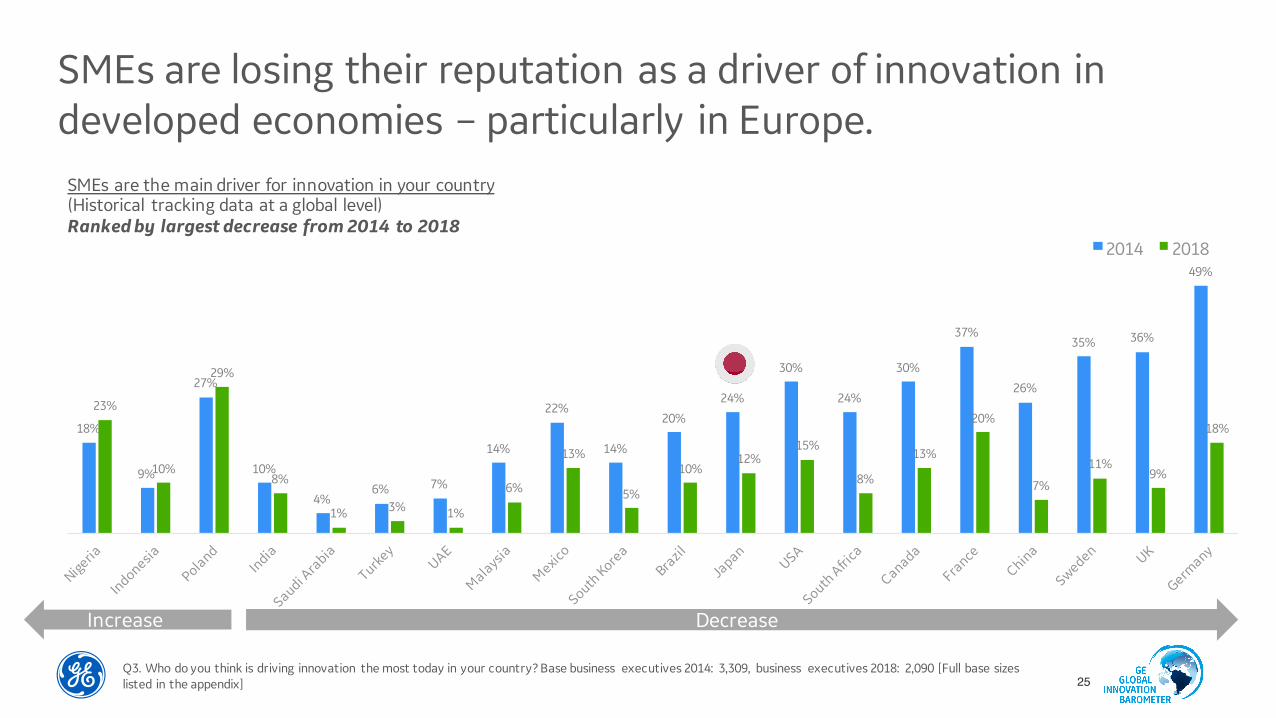
SMEs are the main driver for innovation in your country(Historical tracking data at a global level)Ranked by largest decrease from 2014 to 2018
SMEs are losing their reputation as a driver of innovation in developed economies – particularly in Europe.
18%
9%
27%
10%
4%6% 7%
14%
22%
14%
20%
24%
30%
24%
30%
37%
26%
35% 36%
49%
23%
10%
29%
8%
1% 3% 1%
6%
13%
5%
10%12%
15%
8%
13%
20%
7%
11%9%
18%
2014 2018
25
Increase Decrease

In emerging economies, governments are now not seen to be driving innovation as much as they were in 2014.
Decrease
21%
33%
23% 24% 25%
13%
26%
12% 11%9%
Malaysia UAE China Turkey Saudi Arabia
2014 2018
Q3. Who do you think is driving innovation the most today in your country? Base Base business executives 2014: 3,309, business executives 2018: 2,090 [Full base sizes listed in the appendix]
-7
-8 -11 -13 -16
26
Governments are the main driver for innovation in your country(Historical tracking data at a global level)Ranked by 2014 – 2018 growth
7% in 2014
10% in 2018
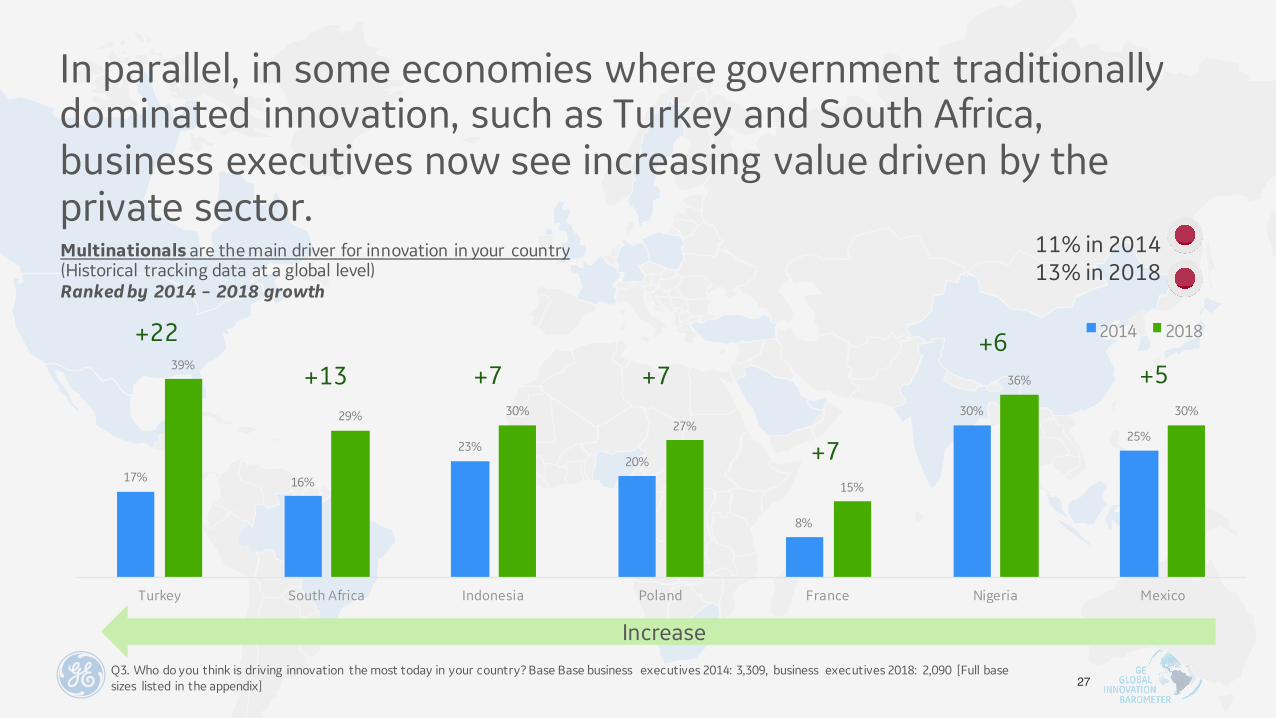
In parallel, in some economies where government traditionally dominated innovation, such as Turkey and South Africa, business executives now see increasing value driven by the private sector.
Increase Q3. Who do you think is driving innovation the most today in your country? Base Base business executives 2014: 3,309, business executives 2018: 2,090 [Full base sizes listed in the appendix]
Multinationals are the main driver for innovation in your country(Historical tracking data at a global level)Ranked by 2014 – 2018 growth
17% 16%
23%20%
8%
30%
25%
39%
29% 30%27%
15%
36%
30%
Turkey South Africa Indonesia Poland France Nigeria Mexico
2014 2018+22
+13 +7 +7
+7
+6 +5
27
11% in 201413% in 2018

Edelman Intelligence / © 2017
Emerging Confidence
28
Executive Summary
• While the United States (-8) and Germany (-7) see a drop in championship status from 2014, Japan (+8) and China (+4) take more share. Asia (34+ since 2014) and emerging markets are gaining confidence, viewing themselves as more innovative than they did in 2014.

Countries that traditionally dominated global innovation leadership, notably the U.S. and Germany, are stalling, ceding ground to emerging and developed Asia. Emerging markets catch up aggressively, and China and Japan have become an alternative hotspot for global Innovation—confirming that innovation is disrupting the global competitive landscape at the regional as well as industry level. Previous GE Global Innovation Barometers had already highlighted stronger innovation momentum in emerging markets.
What is the country that you consider to be the leading innovation champion?Ranked by 2018 data
38%
12% 13%15%
1%4%
3%1%
3%1%
36%
13%10%
16%
1%4% 3%
0%2% 1%
33%
17%
10%10%
2%4% 4%
1%3% 3%
28%
21%
14%
9%
3% 3% 3% 2% 2% 2%
USA Japan China Germany Sweden South Korea UK Canada India UAE
2013 2014 2016 2018
Q1. What is THE country that you consider to be the leading innovation champion? Base business executives 2013: 3,100, business executives 2014: 3,309, business executives 2016: 2,748, business executives 2018: 2,090, business executives in Indonesia 2014: 101, business executives in Indonesia 2016: 101, business executives in Indonesia 2018: 80 [Full base sizes listed in the appendix] 29

This shift in innovation is also felt internally, with many countries recognizing their own market as being a more innovation conducive environment than it was in 2014.
30
For your own market, how far would you say that you have developed an Innovation conducive environment?Percentage that feel they have a strong innovation conducive environment (top 3 box)
Q2. For each of the following markets, how far would you say that they have developed an Innovation conducive environment? [Top 3 Box 8-10] Base business executives 2014: 3,309, business executives 2018: 2,090 [Full base sizes listed in the appendix]
24% 28%
14%7%
32%23%
18%7%
21%
73%67%
43%35%
58%49%
44%
30%
44%
China India Brazil Malaysia Canada Mexico Indonesia Poland Turkey
2014 2018
40% 40% 36%30%
11%
72%
53%
20%26%
7%
41%
77%
61% 61% 56%48%
28%
85%
59%
24% 27%
8%
38%
65%
UAE UK France Global Total Saudi Arabia USA Sweden South Africa South Korea Nigeria Japan Germany

Asian markets have seen the biggest increase in the way they evaluate how innovation conducive their country is.
For your own market, how far would you say that you have developed as an innovation conducive environment?Percentage that have a strong innovation conducive environment (top 3 box)
Q2. For each of the following markets, how far would you say that they have developed as an Innovation conducive environment? [Top 3 Box 8-10] Base business executives 2014: 3,309, business executives 2016: 2,748, business executives 2018: 2,090 [Full base sizes listed in the appendix]
49%
39%
29% 28% 26%
China India Brazil Malaysia Indonesia
Top 5 increases 2014 to 2018
On average Asian countries see a 34% increase in how they evaluate
their ability to foster innovation
31
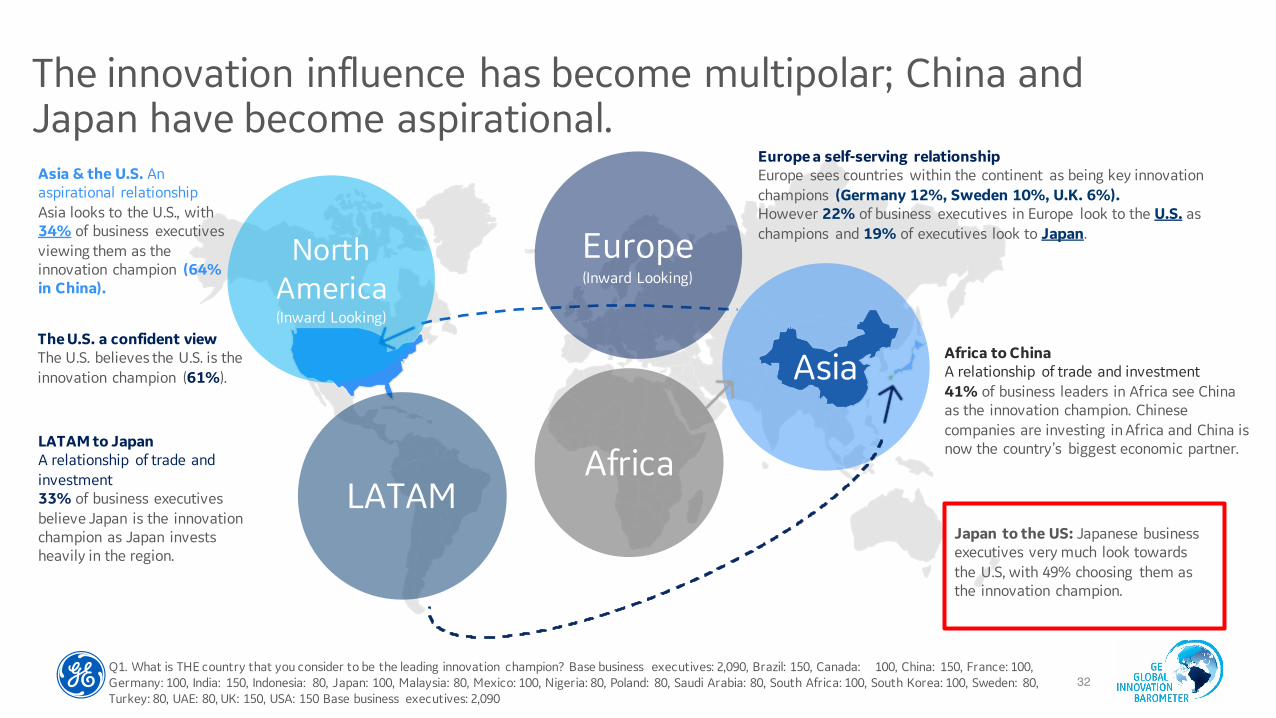
The innovation influence has become multipolar; China and Japan have become aspirational.
32
Asia
LATAMAfrica
Q1. What is THE country that you consider to be the leading innovation champion? Base business executives: 2,090, Brazil: 150, Canada: 100, China: 150, France: 100, Germany: 100, India: 150, Indonesia: 80, Japan: 100, Malaysia: 80, Mexico: 100, Nigeria: 80, Poland: 80, Saudi Arabia: 80, South Africa: 100, South Korea: 100, Sweden: 80, Turkey: 80, UAE: 80, UK: 150, USA: 150 Base business executives: 2,090
Africa to ChinaA relationship of trade and investment41% of business leaders in Africa see China as the innovation champion. Chinese companies are investing in Africa and China is now the country’s biggest economic partner.
Europe (Inward Looking)
North America(Inward Looking)
LATAM to JapanA relationship of trade and investment33% of business executives believe Japan is the innovation champion as Japan invests heavily in the region.
Asia & the U.S. An aspirational relationshipAsia looks to the U.S., with 34% of business executives viewing them as the innovation champion (64% in China).
Europe a self-serving relationship Europe sees countries within the continent as being key innovation champions (Germany 12%, Sweden 10%, U.K. 6%).However 22% of business executives in Europe look to the U.S. as champions and 19% of executives look to Japan.
The U.S. a confident viewThe U.S. believes the U.S. is the innovation champion (61%).
Japan to the US: Japanese business executives very much look towards the U.S, with 49% choosing them as the innovation champion.

Working in a Protectionist World
33
Executive Summary
• Global executives want the best of both worlds: on one hand they want the benefits of protectionist policies on domestic businesses and jobs, and on the other hand, they want the benefits of globalization and open markets.
• A small majority of global executives (55%) believe protectionist policies benefit businesses within their country and 73% believe it is good for the workforce. However, 68% globally believe their government cannot keep up with the pace of change and 22% (of those that prefer protectionism) see multinationals as the drivers of innovation.

A slightly more defensive approach to innovating (defending against international competition) is reflected in the contrasted views that global business leaders have of protectionist policies. A small majority of them depict protectionism as potentially conducive for innovation success.
55% of business executives think that if their government had protectionist policies towards innovation it would benefit the business sector.
55%45%
Pro-protectionism
Anti-protectionism
Q6. There have recently been discussions about the potential impact of protectionist politics and policy on innovation and businesses. Out of the statements below related to protectionism, which do you agree with the most? Base business executives: 2,090, Business executive in Japan: 100
If the government had a political protectionist stance on innovation in my country it would be beneficial to businesses.
71%65% 63% 63% 63% 61% 60% 58% 57% 56% 56% 55% 53% 53% 51% 51% 51% 49% 47% 43% 39%
Only 4 countries had a majority that felt a protectionist stance to
innovation would not be beneficial to business.
34
47%53%

The majority of business executives agree that regulations around privacy and data are stifling innovation.
69%
29%
2%
Regulations around privacy and data protection are preventing businesses from adopting more
radical/transformative innovations
Q5. How much do you agree or disagree with the following statements? Regulations around privacy and data protection are preventing businesses from adopting more radical / transformative innovations. Base business executives: 2,090, Business executives in Indonesia; 80, Pro-protectionism: 1,153, Anti-protectionism: 937, Protectionism base sizes too small to report on in Japan
Agree
Disagree
Pro-protectionism
Anti-protectionism
70%
28%2%
68%30%
2%
Agree
Disagree
Don’t know
Don’t know
Agree
Disagree
35
27%
73%
0%

And business leaders feel regulations around privacy and data protection are stifling innovation more so than two years ago.
49%
55%
65%
60% 61%63%
61%65%
55%
66%
74%
61%
69%65%
73%76%
79%
85%
69%
79%
70%
60%
80%
73% 73%75%
67%
74%
61%
69%
75% 75%
60%
70%66%
69%71% 72%
77%
56%
65%
2016 2018
Q5. How much do you agree or disagree with the following statements? Base business executives 2016: 2,748, business executives 2017: 2,090 [Full base sizes listed in the appendix]
Regulations around privacy and data protection are preventing businesses from adopting more radical / transformative innovationsNET: Agree
2016
dat
a no
t ava
ilabl
e
Increase Decrease

Private sector is seen as driving innovation as governments can’t cope with the pace of innovation.
37
68%
31%
2%
In my country, the government is not able to regulate innovation as the system cannot
keep up with the pace of innovation
Q5.4 How much do you agree or disagree with the following statements? In my country the government is not able to regulate innovation as the system cannot keep up with the pace of innovation. Base business executives: 2,090, Business executives in Indonesia: 80, Pro-protectionism: 1,153, Anti-protectionism: 937 // Protectionism base sizes too small to report on in Japan
Agree
Disagree
Don’t know
Pro-protectionism
Anti-protectionism
64%34%
2%
72%
26%2%
Agree
Disagree
Don’t know
Don’t know
Agree Disagree
21%
77%
2%
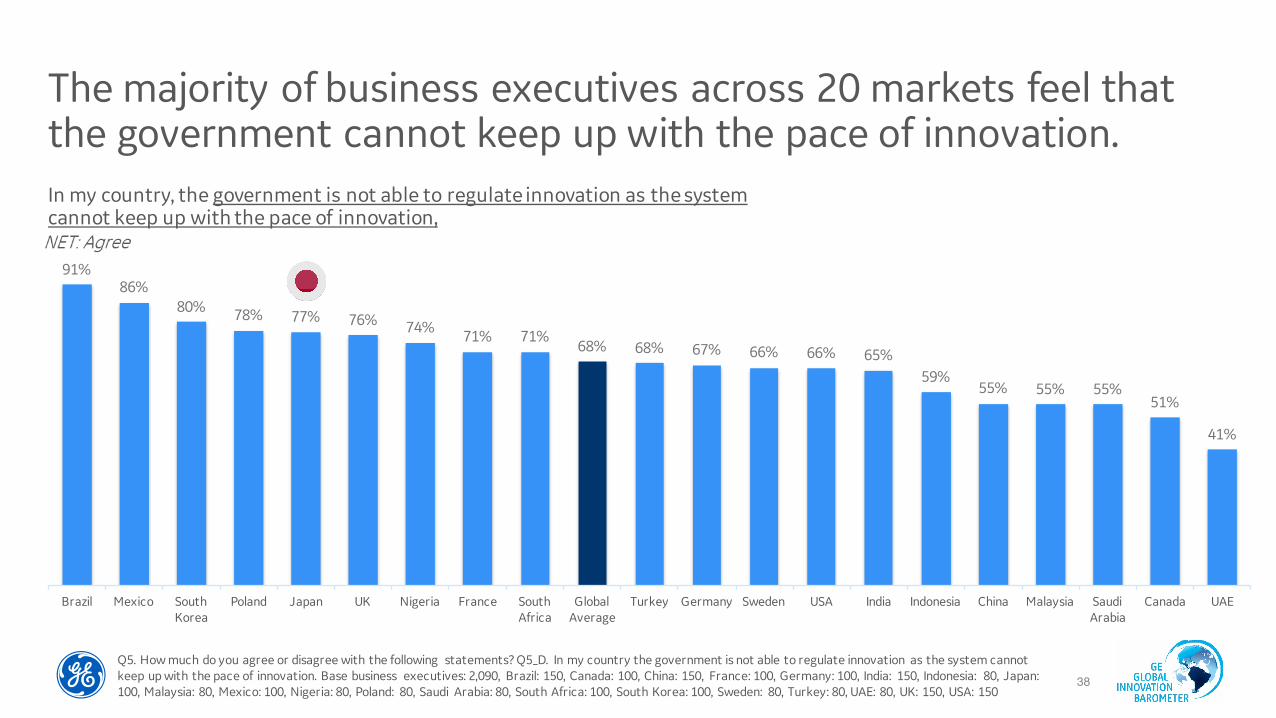
The majority of business executives across 20 markets feel that the government cannot keep up with the pace of innovation.
Q5. How much do you agree or disagree with the following statements? Q5_D. In my country the government is not able to regulate innovation as the system cannot keep up with the pace of innovation. Base business executives: 2,090, Brazil: 150, Canada: 100, China: 150, France: 100, Germany: 100, India: 150, Indonesia: 80, Japan: 100, Malaysia: 80, Mexico: 100, Nigeria: 80, Poland: 80, Saudi Arabia: 80, South Africa: 100, South Korea: 100, Sweden: 80, Turkey: 80, UAE: 80, UK: 150, USA: 150
91%86%
80% 78% 77% 76% 74% 71% 71%68% 68% 67% 66% 66% 65%
59%55% 55% 55%
51%
41%
Brazil Mexico South Korea
Poland Japan UK Nigeria France South Africa
Global Average
Turkey Germany Sweden USA India Indonesia China Malaysia Saudi Arabia
Canada UAE
In my country, the government is not able to regulate innovation as the system cannot keep up with the pace of innovation,
38

Edelman Intelligence / © 2017 39
section two:
Emerging Technologies

Edelman Intelligence / general electric
The Potential of Additive
40
Executive Summary: The Potential of Additive
• There is excitement from global executives around the potential of 3D printing with 63% believing it will have a positive impact (91% saying it increases creativity and 89% saying it lets goods get to market faster), but more education and reassurance is needed.
• While there is real excitement, 53% believe 3D printing has yet to realize its full potential.

The majority of business executives believe 3D printing’s impact will be mostly positive for businesses in their country.
41Q13. We would now like to ask you about 3D (3-dimensional) printing and the impact you think this might have on businesses in your country. Do you think 3D (3-dimensional) printing is beneficial or could have a negative impact on businesses? Base Business Executives: 2,090, Business Executives in Japan: 100
63%
31%
4%3%I think 3D printing will have a positive impact on businesses in my country
I think 3D printing will have both a positive and negative impact on businesses in my country
I think 3D printing will have a negative impact on businesses in my country
Don't know
36%
48%
7%9%

Benefits include increased creativity, speed to market, lower costs, competitive advantage and improved CO2 footprint.
42Q14. Imagine 3D printing has become a reality in your country with business and industries adopting it. How far do you agree or disagree with the following statements? Base Business Executives: 2,090, Business Executives in Japan: 100
=80%
81%
83%
89%
91%
Beneficial for the environment and reduce CO2 in manufacturing
Businesses that invest in 3D printing will leave other businesses behind
Reduce the costs of goods making them more affordable
Enable goods to get to market faster
Allow businesses to be more creative in the products and goods they can create
84%
78%
80%
78%
66%

South Africa (73%), Sweden (70%)
However, the benefits of 3D printing vary at a country level.
43
Reduce the costs of goods making them more affordable
(83%)
Turkey (96%), Brazil (95%), India (90%)
Beneficial for the environment and reduce CO2 in
manufacturing (80%)
Indonesia (95%), China (93%), Malaysia (93%), Brazil (89%), India (89%)
Germany (68%), South Korea (67%), Japan
(66%)
Businesses that invest in 3D printing will leave other
businesses behind (81%)
Saudi Arabia (94%), China (91%), Malaysia (89%), Turkey (89%)
Germany (72%), Sweden (71%), Indonesia (71%), Canada (69%)
Q14. Imagine 3D printing has become a reality in your country with business and industries adopting it. How far do you agree or disagree with the following statements? [Net: Agree] Base business executives: 2,090, Brazil: 150, Canada: 100, China: 150, France: 100, Germany: 100, India: 150, Indonesia: 80, Japan: 100, Malaysia: 80, Mexico: 100, Nigeria: 80, Poland: 80, Saudi Arabia: 80, South Africa: 100, South Korea: 100, Sweden: 80, Turkey: 80, UAE: 80, UK: 150, USA: 150

Only 4 in 10 business executives are very familiar with 3D printing.
44Q11. Are you familiar with 3D (3-dimensional) printing and what it is? Base Business Executives: 2,090
41%Are very familiar with 3D printing
Yes, I am very familiar with 3D printing (41%)
Yes, but I am only somewhat familiar
with 3D printing (52%)
No, I am not familiar with 3D printing (6%)
Don’t know (1%)
With only 4 in 10 business executives being very familiar with 3D printing, there is work to be done to encourage the majority of business executives to become more familiar and therefore adopt 3D printing.
9% 2%
28%61%

However, a majority of business executives believe 3D printing has yet to realize its full potential
45Q12. How mature would you say the 3D (3-dimensional) printing industry is in your country. Base Business Executives: 2,090, Business Executives in Japan: 100
5%14%
3D printing has already had an
impact on businesses
21%
3D printing is talked about, but isn't a
reality yet
3D printing isn't being talked about
27% 32%
3D printing is starting to become a reality but
won't impact businesses for several
years
3D printing has become a realitythat is impacting
businesses
53% say 3D printing hasn’t reached its full potential yet
5% 29% 23% 32% 9%
55%
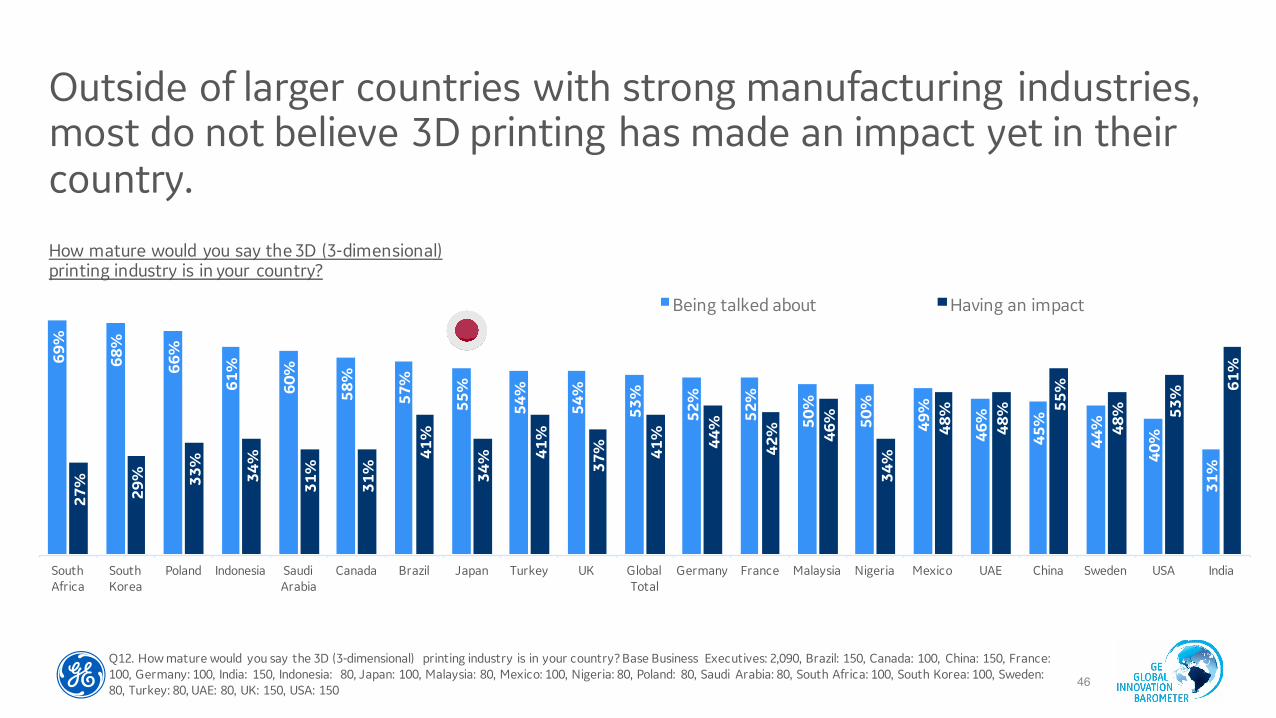
Outside of larger countries with strong manufacturing industries, most do not believe 3D printing has made an impact yet in their country.
69%
68%
66%
61%
60%
58%
57%
55%
54%
54%
53%
52%
52%
50%
50%
49%
46%
45%
44%
40%
31%
27%
29% 33
%
34%
31%
31%
41%
34% 41
%
37% 41
% 44%
42% 46
%
34%
48%
48% 55
%
48% 53
% 61%
South Africa
South Korea
Poland Indonesia Saudi Arabia
Canada Brazil Japan Turkey UK Global Total
Germany France Malaysia Nigeria Mexico UAE China Sweden USA India
Being talked about Having an impact
Q12. How mature would you say the 3D (3-dimensional) printing industry is in your country? Base Business Executives: 2,090, Brazil: 150, Canada: 100, China: 150, France: 100, Germany: 100, India: 150, Indonesia: 80, Japan: 100, Malaysia: 80, Mexico: 100, Nigeria: 80, Poland: 80, Saudi Arabia: 80, South Africa: 100, South Korea: 100, Sweden: 80, Turkey: 80, UAE: 80, UK: 150, USA: 150
How mature would you say the 3D (3-dimensional) printing industry is in your country?
46

Globally, the high-tech /IT and manufacturing sectors are most likely to see the impact of 3D printing.
47
52%
43% 43% 42% 41% 40% 40% 39%36% 35% 34%
High-tech / IT Manufacturing (Other)
Fast Moving Consumer
Goods
Electronics Total Industrial Products
Energy related Health related Professional services / Business services
Telecoms / Internet
Automotive / transport /
logistics
3D Printing is having an impact in my country
Sectors above average Sectors below average
Q12. How mature would you say the 3D (3-dimensional) printing industry is in your country. Base Business Executives: 2,090

Edelman Intelligence / general electric
Maximizing the Return on Innovation
48
Executive Summary
• Globally, 40% of innovations are having a positive impact on the bottom line. What’s the secret to success for these “innovation achievers”? They’re taking a more measured approach.
• Businesses are waiting to perfect and test their innovation before launch rather than getting to market quickly—a 10-point jump since 2016 (now 65%). Innovation achievers also are more willing to wait for long-term ROI for breakthrough innovation (84%) and have a clear structure and process in place to measure that return (50% vs. 43%).
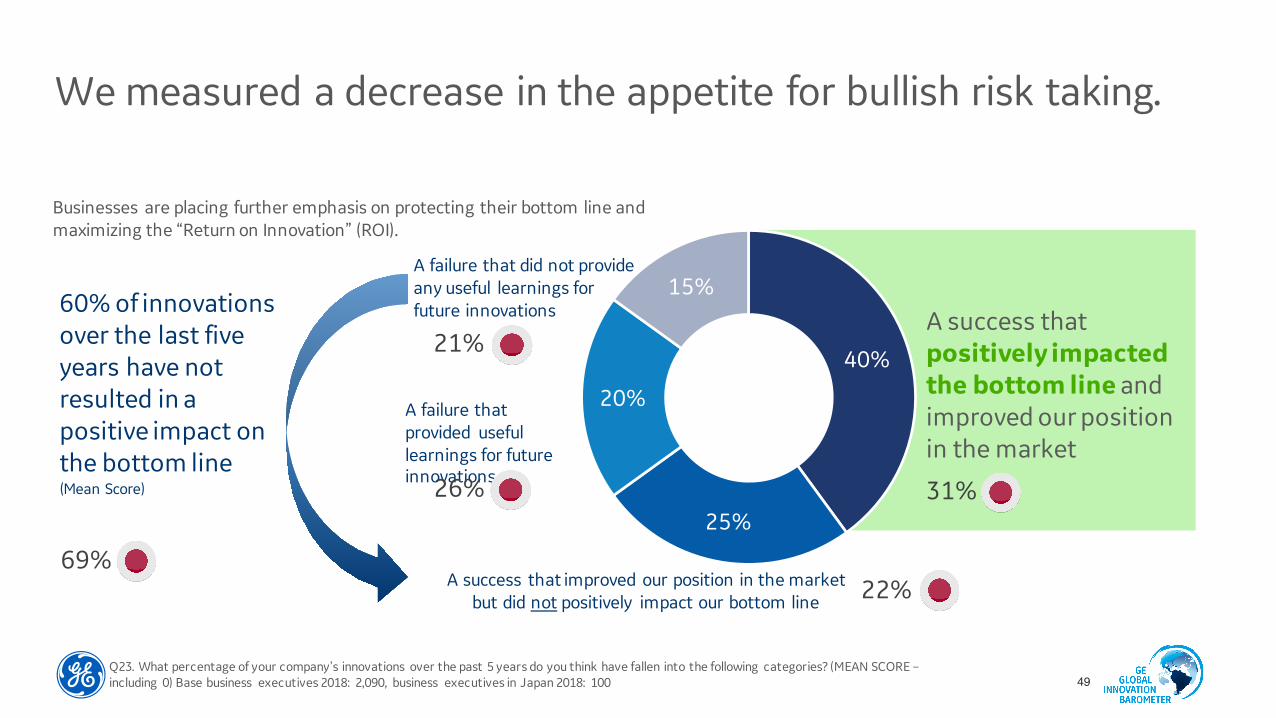
We measured a decrease in the appetite for bullish risk taking.
Q23. What percentage of your company’s innovations over the past 5 years do you think have fallen into the following categories? (MEAN SCORE –including 0) Base business executives 2018: 2,090, business executives in Japan 2018: 100
40%
25%
20%
15%60% of innovations over the last five years have not resulted in a positive impact on the bottom line (Mean Score)
A success that positively impacted the bottom line and improved our position in the market
A success that improved our position in the market but did not positively impact our bottom line
A failure that provided useful learnings for future innovations
A failure that did not provide any useful learnings for future innovations
Businesses are placing further emphasis on protecting their bottom line and maximizing the “Return on Innovation” (ROI).
49
31%
69%22%
26%
21%

Already challenged in their ability to disrupt themselves and keep up with the innovation race, business executives re-emphasize the basic and fundamental recipes for success.
Know how key digitalization is to innovation success
Focus on measurement
Think about long-term strategies
Be more cautiousin their approach to innovation
Business executives who say 51-100% of
their company’s innovations have
positively impacted their bottom line over
the last 5 years are more likely to…
Businesses are choosing their battles, with an emphasis on digital transformation; focusing on a properly measured ROI and being more measured in their go-to-market strategy.
50
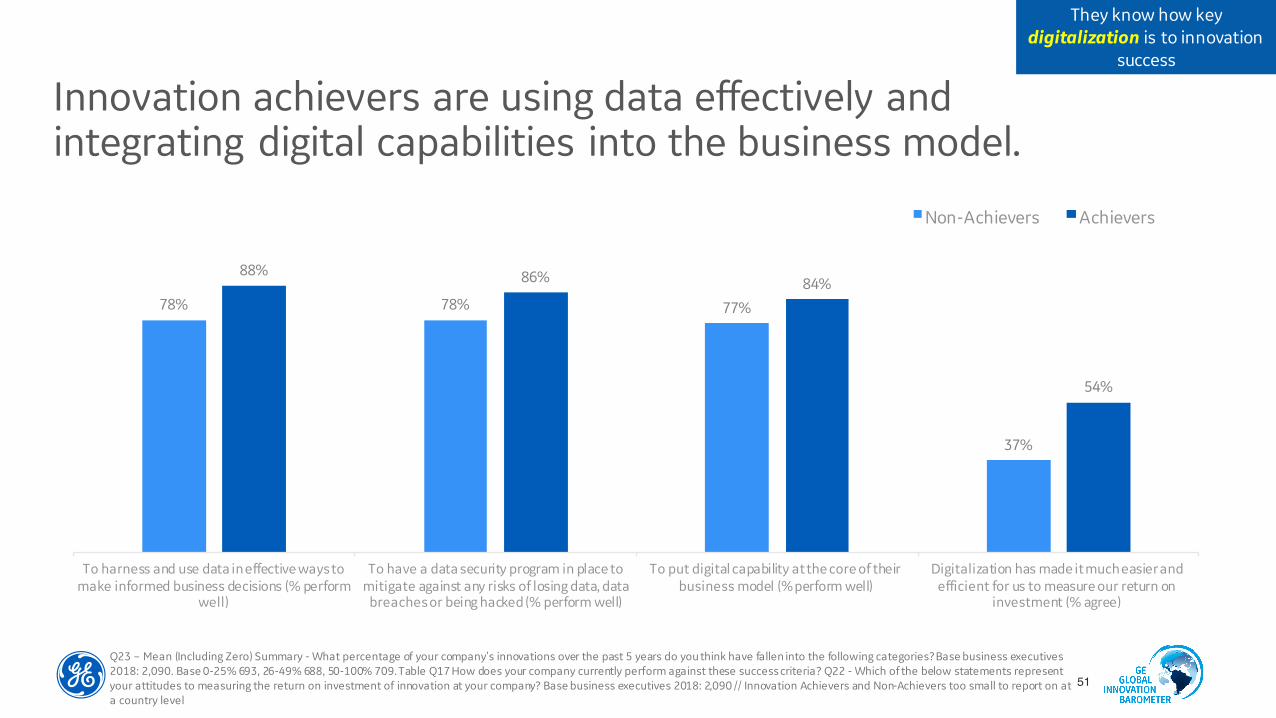
Innovation achievers are using data effectively and integrating digital capabilities into the business model.
They know how key digitalization is to innovation
success
78% 78% 77%
37%
88% 86% 84%
54%
To harness and use data in effective ways to make informed business decisions (% perform
well)
To have a data security program in place to mitigate against any risks of losing data, data
breaches or being hacked (% perform well)
To put digital capability at the core of their business model (% perform well)
Digitalization has made it much easier and efficient for us to measure our return on
investment (% agree)
Non-Achievers Achievers
Q23 – Mean (Including Zero) Summary - What percentage of your company’s innovations over the past 5 years do you think have fallen into the following categories? Base business executives 2018: 2,090. Base 0-25% 693, 26-49% 688, 50-100% 709. Table Q17 How does your company currently perform against these success criteria? Q22 - Which of the below statements represent your attitudes to measuring the return on investment of innovation at your company? Base business executives 2018: 2,090 // Innovation Achievers and Non-Achievers too small to report on at a country level
51

Achievers are more likely to focus on demonstrating the value to investors, clients and users, and measure the successes of their innovations.
They know how key measurement is to innovation
success
80%
40%35%
88%
46%41%
To demonstrate the value of their innovations to clients and users (% perform well)
We have to measure the impact of innovation on business performance to get further investment and
funding (% agree)
We have measurement frameworks in place to keep our investors happy (% agree)
Non-Achievers Achievers
Q23 – Mean (Including Zero) Summary - What percentage of your company’s innovations over the past 5 years do you think have fallen into the following categories? Base business executives 2018: 2,090. Base 0-25% 693, 26-49% 688, 50-100% 709. Q17 How does your company currently perform against these success criteria? Q22 - Which of the below statements represent your attitudes to measuring the return on investment of innovation at your company? Base business executives 2018: 2,090 // Innovation Achievers and Non-Achievers too small to report on at a country level
52

Achievers are more cautious and measured in their approach to innovation.
They know how key being cautious is to innovation
success
63%58%
74% 72%
To protect the core business as much as possible, so it continues to generate the profitability needed to support Research & Innovation efforts (% agree)
To wait to perfect and test the innovation before launch, in order to make sure the customer is completely satisfied from the start (% agree)
Non-Achievers Achievers
Q23 – Mean (Including Zero) Summary - What percentage of your company’s innovations over the past 5 years do you think have fallen into the following categories? Base business executives 2018: 2,090. Base 0-25% 693, 26-49% 688, 50-100% 709. Q16. On a scale from 1 to 10, how crucial do you think the following elements are for a company to be able to innovate successfully? Q24A - Now we are going to present different views on the ideal innovation process. For each you will be shown two options. We would like you to pick the one you feel is the truest or the most relevant in driving successful innovation. Base business executives 2018: 2,090c // Innovation Achievers and Non-Achievers too small to report on at a country level
When innovating, it is best… When innovating, it is best…
53

With decreased emphasis on speed and more emphasis on protecting their core business, executives are undergoing a reality check.
54
Q24. Now we are going to present different views on the ideal innovation process. For each you will be shown two options. We would like you to pick the one you feel is the truest or the most relevant in driving successful innovation. Sometimes you may feel your opinion sits in the middle, but please try to select the one which you believe is the most critical. [Top 3 Box 8 - 10] Base business executives 2016: 2,748, business executives 2018 2,090
When innovating, it is best...(19 markets no UK)
65%
35%
69%
31%
To protect the core business as much as possible, so it continues to generate the profitability needed to support Research & Innovation efforts
To bring innovative products and/or services to market as fast as possible without worrying about the short-term impact it can have on the core business
2016 2018 2016 2018
-4
+4
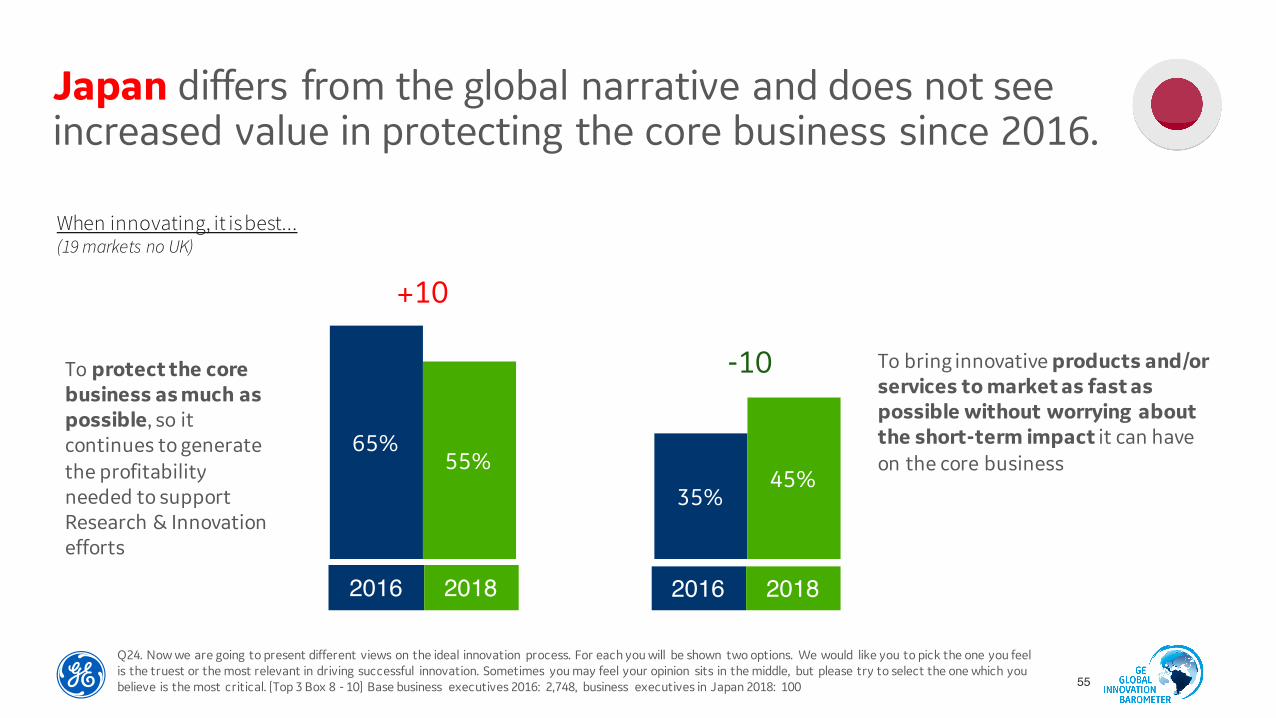
Japan differs from the global narrative and does not see increased value in protecting the core business since 2016.
55
Q24. Now we are going to present different views on the ideal innovation process. For each you will be shown two options. We would like you to pick the one you feel is the truest or the most relevant in driving successful innovation. Sometimes you may feel your opinion sits in the middle, but please try to select the one which you believe is the most critical. [Top 3 Box 8 - 10] Base business executives 2016: 2,748, business executives in Japan 2018: 100
When innovating, it is best...(19 markets no UK)
65%
35%
55%45%
To protect the core business as much as possible, so it continues to generate the profitability needed to support Research & Innovation efforts
To bring innovative products and/or services to market as fast as possible without worrying about the short-term impact it can have on the core business
2016 2018 2016 2018
+10
-10
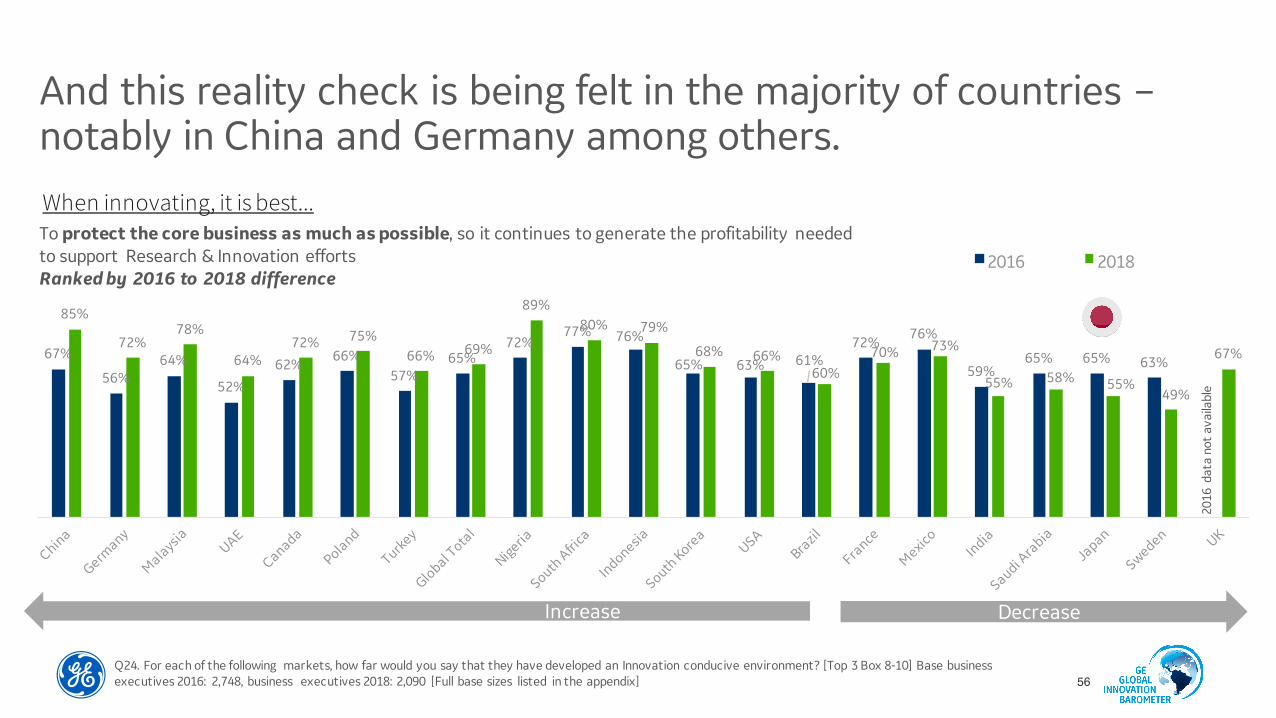
And this reality check is being felt in the majority of countries –notably in China and Germany among others.
Q24. For each of the following markets, how far would you say that they have developed an Innovation conducive environment? [Top 3 Box 8-10] Base business executives 2016: 2,748, business executives 2018: 2,090 [Full base sizes listed in the appendix]
67%
56%64%
52%
62%66%
57%65%
72%77% 76%
65% 63% 61%72%
76%
59%65% 65% 63%
85%
72%78%
64%72% 75%
66% 69%
89%80% 79%
68% 66%60%
70% 73%
55% 58% 55%49%
67%
2016 2018
When innovating, it is best...To protect the core business as much as possible, so it continues to generate the profitability needed to support Research & Innovation effortsRanked by 2016 to 2018 difference
Increase Decrease
2016
dat
a no
t av
aila
ble
56

In 2018, fully testing new products and solutions before bringing them to market emerges as a preferred strategy, rather than charging ahead with minimum viable products.
Q24.Now we are going to present different views on the ideal innovation process. For each you will be shown two options. We would like you to pick the one you feel is the truest or the most relevant in driving successful innovation. Sometimes you may feel your opinion sits in the middle, but please try to select the one which you believe is the most critical. [Top 3 Box 8 - 10] Base business executives 2016: 2,748, business executives 2018 2,090
When innovating, it is best...(19 markets no UK)
45%55%
35%
65%To get to market as quickly as possible to keep an edge on competition, even if this means having an imperfect product or service and improving it along the way
To wait to perfect and test the innovation before launch, in order to make sure the customer is completely satisfied from the start
2016 2018 2016 2018
-10
+10
57

At the same time, Japan continues to favor a more cautious approach to innovation.
Q24.Now we are going to present different views on the ideal innovation process. For each you will be shown two options. We would like you to pick the one you feel is the truest or the most relevant in driving successful innovation. Sometimes you may feel your opinion sits in the middle, but please try to select the one which you believe is the most critical. [Top 3 Box 8 - 10] Base business executives in Indonesia 2016: 101, business executives in China 2018: 150
When innovating, it is best...(19 markets no UK)
66%
34%51% 49%
To get to market as quickly as possible to keep an edge on competition, even if this means having an imperfect product or service and improving it along the way
To wait to perfect and test the innovation before launch, in order to make sure the customer is completely satisfied from the start
2016 2018 2016 2018
-15
58
+15

Edelman Intelligence / general electric
Hype vs. Reality of Impact
59
Executive Summary
• Hype around certain technologies does not always equate to transformative impact. In fact, global executives believe that many under-hyped technologies will have a transformative impact, including energy grids (74% say it will bring transformative change to their country), virtual healthcare (68%) and smart cities (71%).

The latest wave of innovation hype is comprehensive, spanning a number of disruptive forces, from Artificial Intelligence (AI) to robotics to advanced manufacturing.
Q9.When we talk about innovation “hype”, we mean hot topics or trends that are being widely discussed but aren’t necessarily having an impact yet. Out of the innovations listed below, please rate each based on how much “hype” they are creating in your country today. Base Business Executives: 2,090
71%70%
69%68%
67%66%
65% 64%
62% 62%61%
57%
Artificial and machine
intelligence
Internet of Things
Financial technology and
currency
3D printing Augmented Reality/ Virtual
reality
Big data and analytics
Smart energy grids
Nanotechnology Driverless transport
Smart cities Electrification of the transport
system
Virtual healthcare diagnosis
How much “hype” are they are creating in your country today? (NET hype)
65% average hype
60

In Japan, there is much less hype surrounding innovation, with financial technology and IoT coming out on top.
Q9.When we talk about innovation “hype”, we mean hot topics or trends that are being widely discussed but aren’t necessarily having an impact yet. Out of the innovations listed below, please rate each based on how much “hype” they are creating in your country today. Base Business Executives: 2,090. Base Business Executives in Japan: 100
65%64%
59%58% 58%
56%
53% 52%51%
48%46% 46%
Financial technology and
currency
Internet of Things
Big data and analytics
Artificial and machine
intelligence
3D printing Driverless transport
NanotechnologyElectrification of the transport
system
Virtual healthcare diagnosis
Smart cities Augmented Reality/ Virtual
reality
Smart energy grids
How much “hype” are they are creating in your country today? (NET hype)
55% average hype
61

The transformative impact of macro innovation still generates excitement from business executives around the world.
Q9.When we talk about innovation “hype”, we mean hot topics or trends that are being widely discussed but aren’t necessarily having an impact yet. Out of the innovations listed below, please rate each based on how much “hype” they are creating in your country today. Base Business Executives: 2,090. Q10. Next, please rate each of these innovations in terms of how much impact and transformative change they will bring to your country. Base Business Executives: 2,090
How much “hype” are they are creating in your country today? (NET hype)
How much impact and transformative change will they bring to your county? (NET impact)
71% 70% 69% 68% 67% 66% 65% 64%62% 62% 62%
57%
74%
71% 70% 69% 68%
71%
74%72%
68%
71% 72%
68%
Artificial and machine
intelligence
Internet of Things
Financial technology and
currency
3D printing Augmented Reality/ Virtual
reality
Big data and analytics
Smart energy grids
Nanotechnology Driverless transport
Smart cities Electrification of the transport
system
Virtual healthcare diagnosis
In particular, innovations such as AI, IoT and the development of Fintech, produce interest both in terms of hype (being talked about) and actually having impact on their industries and their economies.
62

Augmented reality and smart cities see the greatest hype to impact discrepancy in Japan.
Q9.When we talk about innovation “hype”, we mean hot topics or trends that are being widely discussed but aren’t necessarily having an impact yet. Out of the innovations listed below, please rate each based on how much “hype” they are creating in your country today. Base Business Executives in Indonesia: 80. Q10. Next, please rate each of these innovations in terms of how much impact and transformative change they will bring to your country. Base Business Executives in Japan: 100
How much “hype” are they are creating in your country today? (NET hype)
How much impact and transformative change will they bring to your county? (NET impact)
65% 64%
59% 58% 58%56%
53% 52% 51%48%
46% 46%
62%
56%
67%
61%64% 63%
52%54%
61%58%
56% 57%
Financial technology and
currency
Internet of Things
Big data and analytics
3D printing Artificial and machine
intelligence
Driverless transport
NanotechnologyElectrification of the transport
system
Virtual healthcare diagnosis
Smart cities Smart energy grids
Augmented Reality/ Virtual
reality
The difference between hype and Impact is generally lower in Indonesia than the global average, as innovations are perceived to be delivering the impacted they were perceived to give (hype).
63

3D printing
Artificial and machine intelligence
Augmented Reality/ Virtual reality
Big data and analytics
Driverless transport
Electrification of the transport system Financial technology and
currencyInternet of ThingsNanotechnology
Smart cities
Smart energy grids
Virtual healthcare diagnosis
This being said, business executives report that transformation in transport, city-planning and infrastructure are “under-hyped” considering the benefits they could bring to their countries.
Less Hype, Stronger Impact
INN
OV
ATI
ON
IM
PAC
T
INNOVATION HYPE
Q9. When we talk about innovation “hype”, we mean hot topics or trends that are being widely discussed but aren’t necessarily having an impact yet. Out of the innovations listed below, please rate each based on how much “hype” they are creating in your country today. Base Business Executives: 2,090. Q10. Next, please rate each of these innovations in terms of how much impact and transformative change they will bring to your country. Base Business Executives: 2,090
Less Hype, Weaker Impact
More Hype, Stronger Impact
More Hype, Weaker Impact
64
Edelman Intelligence / © 2017 65
section three:
Emerging Challenges

Edelman Intelligence / general electric
Future of Work
66
Executive Summary• The workforce is considered the most crucial element to innovation success in most markets, yet skills gaps
continue to be a top concern among businesses. Nearly 3 in 4 (74%) global executives believe a lack of skills is an issue facing their industry—a challenge that has increased over time (64% say a lack of talent/inadequate skills is a key challenge today, up from 56% in 2014).

67
5%
19%
43%
31%
Strongly disagree Somewhat disagree Somewhat agree Strongly agree
2018Q5B. How much do you agree or disagree with the following statements? There is currently a skills gap in my industry. Base business executives: 2,090, business executives in Japan: 100
There is currently a skills gap in my industry
Level of agreement is consistent across sectors (74%)
9%
29%
45%
16%
61%
In Japan, the skills gap is felt but not as strong as globally.

68Q25.Do you consider any of the following as key challenges to be restricting your business’s ability to innovate efficiently? Base business executives 2014: 3,309, business executives 2016: 2,748, business executives 2018: 2,090
56%
60%
64%Do you consider the following a key
challenge restricting your business’s ability to innovate efficiently?
A lack of talent / inadequate skillset
2016
2018
2014
NET: A challenge
+8 ppt
This challenge only seems to be growing for business executives - finding the right talent and skillsets is apparently restricting business’s ability to innovate efficiently.
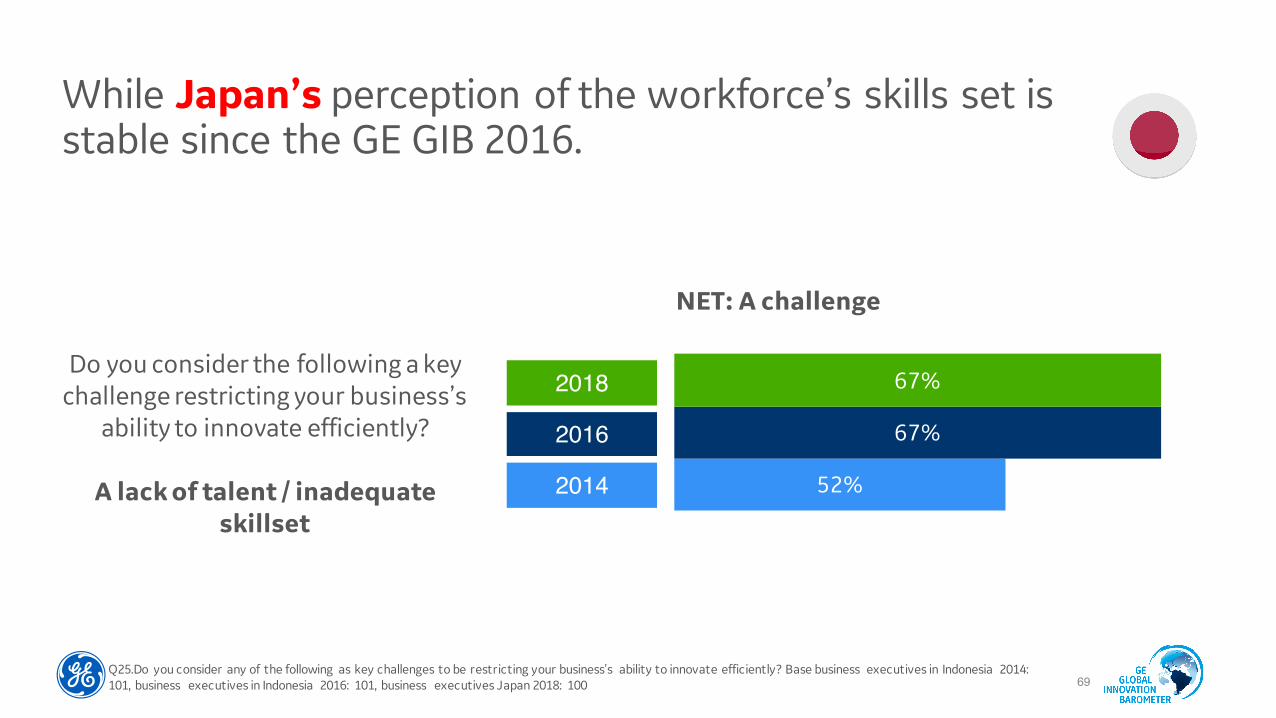
While Japan’s perception of the workforce’s skills set is stable since the GE GIB 2016.
69Q25.Do you consider any of the following as key challenges to be restricting your business’s ability to innovate efficiently? Base business executives in Indonesia 2014: 101, business executives in Indonesia 2016: 101, business executives Japan 2018: 100
52%
67%
67%Do you consider the following a key
challenge restricting your business’s ability to innovate efficiently?
A lack of talent / inadequate skillset
2016
2018
2014
NET: A challenge

Edelman Intelligence / general electric
More Challenging Environment
70
Executive Summary• The challenges confronting innovative businesses are tough – and getting tougher – both externally and internally.
There is a 13-point increase (now 67%) since 2014 in lack of sufficient funding, a 6-point increase (now 65%) in the inability to scale innovations to a wider market, an 8-point increase (now 64%) in lack of adequate talent/ skillsets, and a 14-point increase (now 64%) in the inability of businesses to take risks. Emerging markets such as Poland, South Africa, Malaysia and Saudi Arabia are experiencing the greatest increase in challenges.

Businesses are struggling to scale up, investment is not available and it is a challenge to convert ideas into action.
71
67%
65% 64% 64% 64% 64% 64%
62%
60%
57%
The lack of sufficient investment and financial support
The incapacity to scale up successful
innovations, to a wider or
international market
A lack of talent / inadequate skillset
The difficulty to define an effective business model to support new ideas
and make them profitable
The incapacity of the business to take
risks
The increased pressure to conform to ‘innovation hype’ and trends around certain innovations
The difficulty to come up with
radical and disruptive ideas
The internal inertia and the incapacity to be nimble, failing
at rapidly converting ideas into actions
The lack of internal support from the
leadership team/top management
The overwhelming amount of
information
2018
Q25.Do you consider any of the following as key challenges to be restricting your business’s ability to innovate efficiently? Not a challenge at all (1), not a real challenge (2), a bit of a challenge (3), a critical challenge (4) Base business executives 2018: 2,090
Do you consider any of the following as key challenges restricting your business’s ability to innovate efficiently?NET: Top 2 / A Challenge

In Japan, it’s the lack of talent and increased pressure to conform to ‘innovation hype’ that scores highly.
72
67% 67%63% 62% 61% 60% 59% 57%
54%51%
A lack of talent / inadequate skillset
The increased pressure to conform to ‘innovation hype’ and trends around certain innovations
The difficulty to define an effective business model to support new ideas
and make them profitable
The lack of internal support from the
leadership team/top management
The internal inertia and the incapacity to be nimble, failing at rapidly converting ideas into actions
The incapacity of the business to take
risks
The incapacity to scale up successful innovations, to a
wider or international market
The lack of sufficient investment and financial support
The overwhelming amount of information
The difficulty to come up with radical and disruptive ideas
2018
Q25.Do you consider any of the following as key challenges to be restricting your business’s ability to innovate efficiently? Not a challenge at all (1), not a real challenge (2), a bit of a challenge (3), a critical challenge (4) Base business executives in Japan 2018: 100
Do you consider any of the following as key challenges restricting your business’s ability to innovate efficiently?NET: Top 2 / A Challenge

And these key issues have become even bigger challenges than they were four years ago.
73Q25.Do you consider any of the following as key challenges to be restricting your business’s ability to innovate efficiently? Not a challenge at all (1), not a real challenge (2), a bit of a challenge (3), a critical challenge (4) Base business executives 2014: 3,309, business executives 2018: 2,090
Do you consider any of the following as key challenges restricting your business’s ability to innovate efficiently?NET: Top 2 / A Challenge
50%54%
59%56%
59%
64%67%
65%62%
64%
The incapacity of the business to take risks
The lack of sufficient investment and financial support
The incapacity to scale up successful innovations, to a wider
or international market
The internal inertia and the incapacity to be nimble, failing at
rapidly converting ideas into actions
The difficulty to define an effective business model to support new ideas and make them profitable
2014 2018
+14 +13 +6 +6 +5

43% 43%
50%
60% 59%60%57%
59%61%
63%
The incapacity of the business to take risks
The lack of sufficient investment and financial support
The incapacity to scale up successful innovations, to a wider
or international market
The internal inertia and the incapacity to be nimble, failing at
rapidly converting ideas into actions
The difficulty to define an effective business model to support new ideas and make them profitable
2014 2018
This is a trend that can also be observed in Japan.
74Q25.Do you consider any of the following as key challenges to be restricting your business’s ability to innovate efficiently? Not a challenge at all (1), not a real challenge (2), a bit of a challenge (3), a critical challenge (4) Base business executives in 2014: 3,309, business executives in Japan 2018: 100
Do you consider any of the following as key challenges restricting your business’s ability to innovate efficiently?NET: Top 2 / A Challenge
+17 +14 +9 +1 +14

Thank youJanuary 2018
75

Historical data has been used from 2013, 2014, 2016 and this year’s 2018 data.
The only question that is comparable across all four years is Q1 - Innovation Champions.• To compare scoring from previous years we have reweighted the previous total scores, so that countries that
are not included in this year’s GE GIB are removed, so only including the 20 countries that we have this year. This ensures all data is directly comparable. • The UK was not included in GE GIB 2016 so an average score from 2018 data and from 2014 was created at act as a
proxy. • In 2013 France was not included so a proxy from looking at 2014 and 2016 data has been used. • In 2016 Nigeria was not included so an average score from 2018 data and from 2014 was created to act as a proxy.
This method (of reweighting the total scores and creating proxies) has been used consistently across all questions where we have compared historical data.
Where tracking questions have been used for only 2016 and 2018 (because these questions were not tracked in 2013 or 2014), data for these questions is based on a 19 market total only as no proxy could be created for the UK in 2016.
Historical data tracking
76


