The BCEC Monthly Labour Market Update is based on estimates from the ABS monthly labour force survey. These estimates are subject to sampling variability. BCEC Bankwest Curtin Economics Centre February 2019 LABOUR MARKET UPDATE Providing monthly updates and expert insights and analysis around key labour market indicators. How much should employment grow over the next five years? One million is the magic number… Much has been made of Prime Minister Scott Morrison’s pledge to create 1.25 million new jobs over the next five years. Sounds impressive, for sure, but can we look forward to a lower unemployment rate if Mr Morrison achieves his target? Employment necessarily needs to rise in the face of a growing working age population or rising labour force participation, just to keep unemployment rates stable. This begs the question – how much employment growth do we need over the next five years to drive down the unemployment rate? Are enough jobs being created? Around 12.8 million people were in work in Feb 2019. That’s 2 million more than were employed at the start of 2009. Yet the latest trend unemployment rate, at 5%, is the same as it was a decade ago. Employment has grown by 1.25 million since Feb 2014, over a period that has seen unemployment fall by 0.8ppt from 5.8%. On current projections, 1.25 million new jobs over the next five years will drive down unemployment. Anything less than 1 million won’t be enough. Twitter: @Alan_S_Dunc Email: [email protected]Mining sector gaining pace….are we on the cusp of another boom? The main industry story to emerge from latest national employment trends is one of continued upswing in the Mining sector. Mining has driven ahead strongly, with 21,700 more people employed in the sector in Feb 2019 compared to a year ago - a rise of almost 10%. And Mining was in the top three industry performers in four states over the last year, with WA adding almost 14,000 workers. There are a number of signals now pointing towards Australia being on the cusp of a mining resurgence. Investment in mining projects has picked-up with several large-scale projects being rolled out this year. Australia will soon become the biggest exporter of LNG, is currently the biggest exporter of iron ore to India and now one of the biggest producers of lithium. While the Mining sector won’t deliver for Australia what it did in the 2000s – it will deliver more than it has in recent years and has already fattened up government coffers. Global market turbulence could see this upswing come tumbling down. However, we’ve also seen that a country’s response to a downturn can be a windfall for Australia. China’s response to a slowdown has been to invest in major infrastructure projects – many of which require Australian commodities. And there are new players to watch – India’s growth prospects have remained high at 7.75%, despite downgrades elsewhere. How well we’re able to capture and distribute the gains from this reinvigorated mining activity is a question worth pursuing. Twitter: @BeckCassells Email: [email protected]WA needs to solve its skills shortage to meet the rising demand for workers. Fewer advertised vacancies in lower skilled occupations, coupled with more service sector jobs, reflects a changing labour market landscape for many Australian workers. WA is the only state to show an increase in new job vacancies, with 16,000 new positions advertised online in Feb 2019. The growth in new vacancies for technology and trades workers has been particularly strong in the West, rising 8.8% compared to the same time last year. Yet despite this, the stock of unfilled job vacancies in WA continues to rise - by 32% in the year to Feb 2019 alone. Mining and Manufacturing are leading the way in driving jobs growth in WA, but businesses have been struggling to recruit to fill new positions – especially in the resources sector. The West needs to find solutions to resolve the skills shortage it currently faces. This is key to converting stronger economic opportunity into employment growth. Twitter: @Yashar_Tarverdi Email: [email protected]Dr Yashar Tarverdi Professor Alan Duncan Associate Professor Rebecca Cassells 1
Transcript
The BCEC Monthly Labour Market Update is based on estimates from the ABS monthly labour force survey. These estimates are subject to sampling variability.
BCECBankwest Curtin Economics Centre
February 2019
LABOUR MARKET UPDATE Providing monthly updates and expert
insights and analysis around key labour market indicators.
How much should employment grow over the next five years? One million is the magic number…
Much has been made of Prime Minister Scott Morrison’s pledge to create 1.25 million new jobs over the next five years. Sounds impressive, for sure, but can we look forward to a lower unemployment rate if Mr Morrison achieves his target?
Employment necessarily needs to rise in the face of a growing working age population or rising labour force participation, just to keep unemployment rates stable. This begs the question – how much employment growth do we need over the next five years to drive down the unemployment rate? Are enough jobs being created?
Around 12.8 million people were in work in Feb 2019. That’s 2 million more than were employed at the start of 2009. Yet the latest trend unemployment rate, at 5%, is the same as it was a decade ago. Employment has grown by 1.25 million since Feb 2014, over a period that has seen unemployment fall by 0.8ppt from 5.8%.
On current projections, 1.25 million new jobs over the next five years will drive down unemployment. Anything less than 1 million won’t be enough.
Mining sector gaining pace….are we on the cusp of another boom?
The main industry story to emerge from latest national employment trends is one of continued upswing in the Mining sector. Mining has driven ahead strongly, with 21,700 more people employed in the sector in Feb 2019 compared to a year ago - a rise of almost 10%. And Mining was in the top three industry performers in four states over the last year, with WA adding almost 14,000 workers.
There are a number of signals now pointing towards Australia being on the cusp of a mining resurgence. Investment in mining projects has picked-up with several large-scale projects being rolled out this year. Australia will soon become the biggest exporter of LNG, is currently the biggest exporter of iron ore to India and now one of the biggest producers of lithium.
While the Mining sector won’t deliver for Australia what it did in the 2000s – it will deliver more than it has in recent years and has already fattened up government coffers. Global market turbulence could see this upswing come tumbling down. However, we’ve also seen that a country’s response to a downturn can be a windfall for Australia. China’s response to a slowdown has been to invest in major infrastructure projects – many of which require Australian commodities. And there are new players to watch – India’s growth prospects have remained high at 7.75%, despite downgrades elsewhere.
How well we’re able to capture and distribute the gains from this reinvigorated mining activity is a question worth pursuing.
WA needs to solve its skills shortage to meet the rising demand for workers.
Fewer advertised vacancies in lower skilled occupations, coupled with more service sector jobs, reflects a changing labour market landscape for many Australian workers. WA is the only state to show an increase in new job vacancies, with 16,000 new positions advertised online in Feb 2019. The growth in new vacancies for technology and trades workers has been particularly strong in the West, rising 8.8% compared to the same time last year. Yet despite this, the stock of unfilled job vacancies in WA continues to rise - by 32% in the year to Feb 2019 alone. Mining and Manufacturing are leading the way in driving jobs growth in WA, but businesses have been struggling to recruit to fill new positions – especially in the resources sector.
The West needs to find solutions to resolve the skills shortage it currently faces. This is key to converting stronger economic opportunity into employment growth.
The BCEC Monthly Labour Market Update is based on estimates from the ABS monthly labour force survey. These estimates are subject to sampling variability.
The number of people employed in Australia rose to just under 12.8 million in Feb 2019, an increase of 290,700 over the year (up 2.3%) and up 20,600 since Jan 2019 on trend measures. Around 8,200 of the extra jobs nationally over the last month were part-time, with 12,300 more people taking up full-time employment. SA and WA were the only states to register a decline in employment in the month to Feb 2019, with falls of 200 and 1,600 respectively.
Rising employment in the two largest states of NSW and Vic added most to strengthening national trends, with 8,800 and 8,300 more jobs respectively over the month to Feb 2019. Employment numbers declined by 3.0%, 1.2% and 0.4% in the NT, ACT and Tas over the year.
The number of part-time jobs rose in the month to Feb 2019 in all regions bar the ACT, with the largest growth in NSW (up 5,100) and Vic (up 3,600). Full-time employment grew by 4,700 over the month in Vic, with strong growth in Qld (up 3,900). WA recorded 1,800 fewer full-time workers during the last month, but the numbers in full-time work in the West is still up 2.9% over the year.
Table 1: Employment changes - states and territories
LFPR changes are a critical part of any labour market update. Participation rates can provide a good indication of confidence in jobs markets, and can drive shifts in unemployment rates every bit as much as the number of people employed.
The national labour force participation rate (LFPR) remained stable at 65.6% compared to the same time last year. Yet these conceal some contrasting LFPR patterns across states and territories since Feb 2018. Female LFPR grew in NSW and Vic by 0.9ppt and 0.5ppt over the year to Feb 2019, but fell in all other jurisdictions during the same period. Declining female LFPR has been most pronounced in the two territories of the ACT (down 2ppt) and NT (down 1.5ppt), with strong falls also in Tas and WA (down 1.3ppt and 1.1ppt respectively). Male LFPR has recorded modest growth over the last year in SA (+0.6ppt), WA (+0.3ppt), Vic (+0.3%) and NSW (+0.1ppt). At the same time, male LFPR has declined substantially in Qld and the two territories - by 1.2ppt in the mining state, 2,2ppt in the NT and fully 3.4ppt in the capital state.
Figure 1: Growth in labour force participation – states and territories
Table 2: Unemployment changes – states and territories
Source: BANKWEST CURTIN ECONOMICS CENTRE | Australian Bureau of Statistics Cat No 6202.0
Notes: Trend values are used. Figures show growth from February 2018 to February 2019.
2
Bankwest Curtin Economics Centre MONTHLY LABOUR MARKET UPDATE February 2019
The national trend unemployment rate (u/e rate) remained unchanged at 5.0% in Feb 2019 compared with the previous month, but is 0.5ppt lower than a year ago with 53,200 fewer people now unemployed than in Feb 2018. The drive towards lower unemployment has come mainly from the two states of NSW and Vic. Each has recorded more than 24,000 fewer unemployed over the last year, reflecting strong employment growth of more than 3.2% and 3.8% respectively. Qld has seen its u/e rate fall by 0.4ppt since Feb 2018. This comes on the back of some growth in employment but also a drop in LFPR of 1.2ppt. WA’s u/e rate remained at 6.2% in Feb 2019, with Tas now recording the highest u/e rate at 6.3%.
Source: BANKWEST CURTIN ECONOMICS CENTRE | Australian Bureau of Statistics Cat No 6202.0
Notes: Trend values are used.
Source: BANKWEST CURTIN ECONOMICS CENTRE | Australian Bureau of Statistics Cat No 6202.0
Notes: Trend values are used. Numbers may not sum to totals due to rounding.
Figure 2: Unemployment rate by gender – states and territories
Table 3: Annual percentage growth in Internet Vacancy Index (IVI)
Figure 3: Yearly growth in full-time and part-time employment by gender
National u/e rates have tracked pretty evenly between men and women, with both falling by 0.5ppt to 5.0% over the year to Feb 2019. But these national figures again conceal some contrasting patterns by gender at state and territory level. Male u/e rates rose substantially in the NT over the year to Feb 2019 (up 1.3ppt to 5.7%) and marginally in WA and SA (both up 0.2ppt, to 6.5% and 6.2% respectively).
Lower male u/e rates have been the story elsewhere over the last year, particularly in Qld (down 0.9ppt) and NSW (down 0.7ppt). Tas recorded the largest annual u/e rate increase among women, rising 1.5ppt over the year to 6.9% - the largest across all jurisdictions. But this is very much the exception rather than the norm. Female u/rates have been falling in pretty much every other jurisdiction, and most strongly in NSW and Vic by 0.7ppt and 1.2ppt respectively.
There are divergent explanations for what’s been driving lower trend u/e rates for men in NSW and Vic over the year to Feb 2019. For NSW, the reason is more to do with the growth in part-time work compared to last year (up 38,200 or 10% since Feb 2018). For Vic, lower u/e rates have stemmed from stronger growth in male full-time work (up by 68,300 or 4.9% over the year) reflecting the State’s improving economy.
Part-time employment in WA has fallen over the last year for women (down 11,880 or 3.9%) with a partially offsetting rise in full-time work (up by 9,170 since Feb 2018). Growth in male full-time employment in WA (up by 16,370) has more than offset the lower number of part-time male workers (down 11,240 or 8.6% of the male part-time workforce). However, with LFPR rising by 0.3ppt over the year, the net effect has been a small increase in WA’s male u/e rate.
Source: BANKWEST CURTIN ECONOMICS CENTRE | Australian Bureau of Statistics Cat No 6202.0
Notes: Trend values are used. Figures show growth from February 2018 to February 2019.
Source: BANKWEST CURTIN ECONOMICS CENTRE | Australian Bureau of Statistics Cat No 6202.0Notes: Trend values are used.
Source: BANKWEST CURTIN ECONOMICS CENTRE | Australian Bureau of Statistics Cat No 6202Notes: Trend values are used – Figures show growth from February 2018 to February 2019.
2 3
Source: BANKWEST CURTIN ECONOMICS CENTRE | Australian Bureau of Statistics Cat No 6202.0
Notes: Trend values are used.
The Internet Vacancy Index captures trends in newly-advertised online job vacancies each month, and provides a useful indication of changing labour demands across Australia as well as potential skills shortages for different occupations. The general trend across the country is towards fewer advertised vacancies in lower skilled occupations, particularly for Labourers, Sales Workers, and Machinery Operators and Drivers. However, there has also been a strong and consistent increase in advertised online vacancies for Community and Personal Service Workers, particularly in Vic, SA and the ACT, with health workers, carers and aides driving much of sector’s growth – emphasising the growing demand for service sector roles. Job vacancies for Technicians and Trades Workers fell nationally by 4.9% in Feb 2019, with fewer advertised vacancies in all bar one jurisdiction compared to the same time last year. Only WA bucks this trend, with growth of 8.8% in advertised positions compared to the same time last year – particularly for electrotechnology and telecommunications trades workers (+32.5%) and engineering trades workers (+13.9%).
Source: BANKWEST CURTIN ECONOMICS CENTRE | Australian Government, Department of Jobs and Small Business – Labour Market Information PortalNotes: Trend Indices are used. The IVI is constructed using counts of new online job advertisements posted on SEEK, CareerOne and Australian JobSearch each month.
The BCEC Monthly Labour Market Update is based on estimates from the ABS monthly labour force survey. These estimates are subject to sampling variability.
Source: BANKWEST CURTIN ECONOMICS CENTRE | Australian Bureau of Statistics Cat No 6202.0Notes: Values are smoothed using 13-month rolling average. Underemployment ratio is the number of persons that worked part-time hours and wanted to work more hours as a proportion of the no. employed.
140.1
148.3
136.3
142.4
137.9
130.8
137.7
133.8
-0.7%
-0.1%
-0.8%
-1.2%
-2.8%
+0.4%
+1.4%
+0.8%
Total Monthly Hours of work per employed
Yearly growth
138.4 -0.4%
Australia
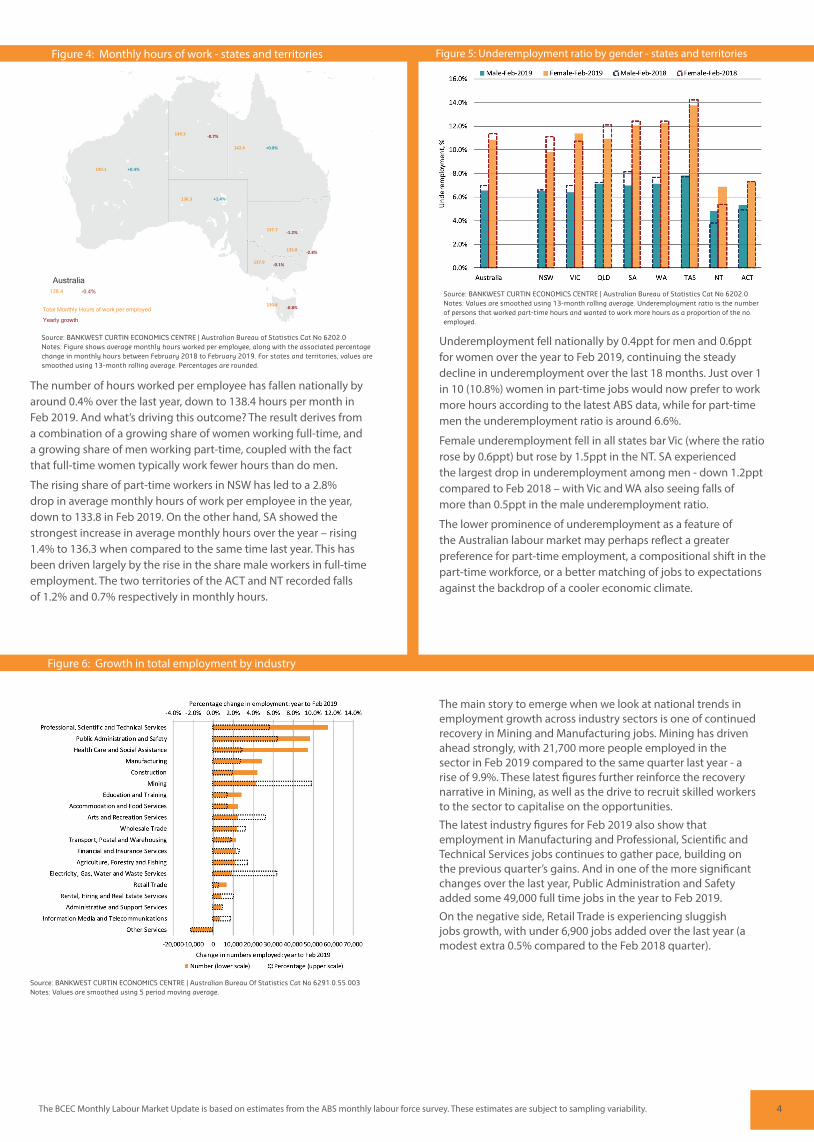
The number of hours worked per employee has fallen nationally by around 0.4% over the last year, down to 138.4 hours per month in Feb 2019. And what’s driving this outcome? The result derives from a combination of a growing share of women working full-time, and a growing share of men working part-time, coupled with the fact that full-time women typically work fewer hours than do men.
The rising share of part-time workers in NSW has led to a 2.8% drop in average monthly hours of work per employee in the year, down to 133.8 in Feb 2019. On the other hand, SA showed the strongest increase in average monthly hours over the year – rising 1.4% to 136.3 when compared to the same time last year. This has been driven largely by the rise in the share male workers in full-time employment. The two territories of the ACT and NT recorded falls of 1.2% and 0.7% respectively in monthly hours.
Source: BANKWEST CURTIN ECONOMICS CENTRE | Australian Bureau of Statistics Cat No 6202.0Notes: Figure shows average monthly hours worked per employee, along with the associated percentage change in monthly hours between February 2018 to February 2019. For states and territories, values are smoothed using 13-month rolling average. Percentages are rounded.
Figure 4: Monthly hours of work - states and territories Figure 5: Underemployment ratio by gender - states and territories
Underemployment fell nationally by 0.4ppt for men and 0.6ppt for women over the year to Feb 2019, continuing the steady decline in underemployment over the last 18 months. Just over 1 in 10 (10.8%) women in part-time jobs would now prefer to work more hours according to the latest ABS data, while for part-time men the underemployment ratio is around 6.6%.
Female underemployment fell in all states bar Vic (where the ratio rose by 0.6ppt) but rose by 1.5ppt in the NT. SA experienced the largest drop in underemployment among men - down 1.2ppt compared to Feb 2018 – with Vic and WA also seeing falls of more than 0.5ppt in the male underemployment ratio.
The lower prominence of underemployment as a feature of the Australian labour market may perhaps reflect a greater preference for part-time employment, a compositional shift in the part-time workforce, or a better matching of jobs to expectations against the backdrop of a cooler economic climate.
Figure 6: Growth in total employment by industry
Source: BANKWEST CURTIN ECONOMICS CENTRE | Australian Bureau Of Statistics Cat No 6291.0.55.003Notes: Values are smoothed using 5 period moving average.
The main story to emerge when we look at national trends in employment growth across industry sectors is one of continued recovery in Mining and Manufacturing jobs. Mining has driven ahead strongly, with 21,700 more people employed in the sector in Feb 2019 compared to the same quarter last year - a rise of 9.9%. These latest figures further reinforce the recovery narrative in Mining, as well as the drive to recruit skilled workers to the sector to capitalise on the opportunities.
The latest industry figures for Feb 2019 also show that employment in Manufacturing and Professional, Scientific and Technical Services jobs continues to gather pace, building on the previous quarter’s gains. And in one of the more significant changes over the last year, Public Administration and Safety added some 49,000 full time jobs in the year to Feb 2019.
On the negative side, Retail Trade is experiencing sluggish jobs growth, with under 6,900 jobs added over the last year (a modest extra 0.5% compared to the Feb 2018 quarter).
4
Figure 5: Underemployment ratio by gender - states and territories Figure 7: Full-time and part-time employment by public/private sector
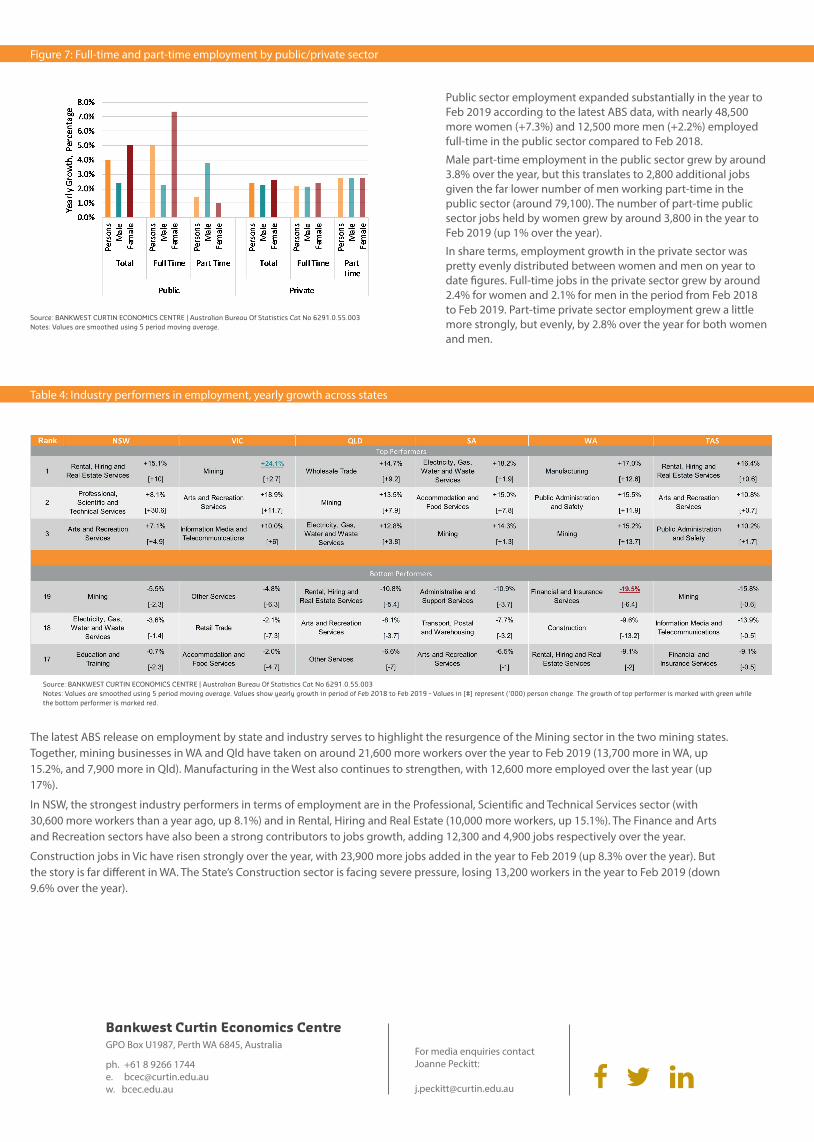
The latest ABS release on employment by state and industry serves to highlight the resurgence of the Mining sector in the two mining states. Together, mining businesses in WA and Qld have taken on around 21,600 more workers over the year to Feb 2019 (13,700 more in WA, up 15.2%, and 7,900 more in Qld). Manufacturing in the West also continues to strengthen, with 12,600 more employed over the last year (up 17%).
In NSW, the strongest industry performers in terms of employment are in the Professional, Scientific and Technical Services sector (with 30,600 more workers than a year ago, up 8.1%) and in Rental, Hiring and Real Estate (10,000 more workers, up 15.1%). The Finance and Arts and Recreation sectors have also been a strong contributors to jobs growth, adding 12,300 and 4,900 jobs respectively over the year.
Construction jobs in Vic have risen strongly over the year, with 23,900 more jobs added in the year to Feb 2019 (up 8.3% over the year). But the story is far different in WA. The State’s Construction sector is facing severe pressure, losing 13,200 workers in the year to Feb 2019 (down 9.6% over the year).
Source: BANKWEST CURTIN ECONOMICS CENTRE | Australian Bureau Of Statistics Cat No 6291.0.55.003Notes: Values are smoothed using 5 period moving average. Values show yearly growth in period of Feb 2018 to Feb 2019 - Values in [#] represent (‘000) person change. The growth of top performer is marked with green while the bottom performer is marked red.
Table 4: Industry performers in employment, yearly growth across states
Source: BANKWEST CURTIN ECONOMICS CENTRE | Australian Bureau Of Statistics Cat No 6291.0.55.003Notes: Values are smoothed using 5 period moving average.
Public sector employment expanded substantially in the year to Feb 2019 according to the latest ABS data, with nearly 48,500 more women (+7.3%) and 12,500 more men (+2.2%) employed full-time in the public sector compared to Feb 2018.
Male part-time employment in the public sector grew by around 3.8% over the year, but this translates to 2,800 additional jobs given the far lower number of men working part-time in the public sector (around 79,100). The number of part-time public sector jobs held by women grew by around 3,800 in the year to Feb 2019 (up 1% over the year).
In share terms, employment growth in the private sector was pretty evenly distributed between women and men on year to date figures. Full-time jobs in the private sector grew by around 2.4% for women and 2.1% for men in the period from Feb 2018 to Feb 2019. Part-time private sector employment grew a little more strongly, but evenly, by 2.8% over the year for both women and men.