Accelerating the Mission: Recommendations for Optimizing Federal Technology Cost and Value in the Age of FITARA A Report from the Federal Commission on IT Cost, Opportunity, Strategy, and Transparency
What Private Sector IT Leaders Are Saying About Technology Business Management
“ Technology Business Management — or TBM — helps companies across industries realize their full potential. The advent of digital, the Internet of Things and mainstream cloud are bringing new innovative capabilities to the forefront. TBM brings the business translation to these technological advances so you and your people can quickly decide on tradeoffs and new investments to improve competitiveness, customer engagement and the bottom line.”
— Mike Brady, Global CTO, AIG
“ IT has shifted from being an order taker to an originator of ideas to win in the marketplace. A new partnership between IT and business is crucial to drive innovation. Technology Business Management (TBM) — a framework that provides IT cost transparency, benchmarks, operational trends — enables a different conversation.”
— Mike Brown, VP, IT, ExxonMobil
“ Forget big data, social, mobile, and cloud. The real change in the past decade is that technology is no longer a business enabler; it IS the business. When your business is on the line and your function is front and center, you need a method and system born in technology and designed for technology leaders. TBM is that method and system.”
— Ralph Loura, Global CTO, Rodan + Fields
“ Every CIO and finance leader is challenged to ensure their budget and resources are driving efficiency and creating value for the business. Increasingly, the oversight of those resources and governance of IT is both within and outside the traditional IT structure. TBM helps connect the supply and demand of IT, making transparent the consumption of IT.”
— Jim DuBois, Corporate CIO, Microsoft Corporation
Improving Taxpayer Value from Federal IT Spending With the Clinger-Cohen Act of 1996, the federal government made a concerted effort to rein in and better
manage its technology spending while reducing
the risk and failures of major IT investments.
Clinger-Cohen paved the way for a key piece of
legislation in 2014 that breathed new life into
the efforts to control spending: The Federal IT
Acquisition Reform Act (FITARA).
FITARA creates requirements for improving the
acquisition and operation of IT assets. These
include authority enhancements for
department-level CIOs, enhanced transparency
and risk management of IT investments, regular
reviews of IT portfolios, and a renewed emphasis
on federal data center consolidation and
strategic sourcing. FITARA not only seeks to
succeed where Clinger-Cohen failed, it exploits
the fact that when CIOs are more engaged in IT
investments throughout their agencies, those investments tend to be more successful.
Congress enacted FITARA to reduce waste and duplication in the acquisition and management of federal
information technologies. In doing so, FITARA seeks to enhance taxpayer value. As such, the act represents
a potential turning point for federal IT departments and the agencies who depend on them. However,
taken alone, FITARA is not enough.
A major impediment to taxpayer value remains: higher spending on running the business of government
stands in the way of federal programs that depend on new or modernized IT systems. According to the
Government Accountability Office (GAO), the federal government spent more than 75 percent of its total
IT budget on operations and maintenance (O&M) in fiscal year 2015. This O&M spending has increased
over the past seven years, resulting in a $7.3 billion decline in development, modernization, and
enhancement (DME) spending over that same period. In other words, O&M, or the government’s run-the-
business spending, is crowding out its change-the-business spending.
Figure 1: Increasing O&M spending by federal agencies has crowded out
DME investments by $7.3 billion since 2010
The challenge represented by continuously increasing O&M spending is not unique to the public sector.
Indeed, private sector CIOs, CFOs, and CEOs have been tackling this problem for years, providing valuable
lessons for federal leaders. Of those lessons, none is more salient than the need for better transparency.
FITARA’s Power Depends on Better Transparency FITARA grants department-level CIOs greater authority over IT resources employed by their agencies, not
just those managed directly by their IT departments. Experience in the private sector, where CIOs have
had broad authority for acquisition, development, and operation, shows that authority is not enough.
Agency CIOs must be able to manage and demonstrate value for the money spent on what they deliver.
“These decisions are not just good for IT; they are good for the business. They are instrumental in our
ability to shift spending from run-the-business to change-the-business investments, in turn helping us
execute on our business strategy. My goal is to reduce the cost of running IT services 5 to 10 percent
per year on a sustainable basis — funds that Cisco can choose to deploy to strategically change the
business.”
— Rebecca Jacoby, Chief Operating Officer, Cisco Source: Tucker, Todd. Technology Business Management: The Four Value Conversations CIOs Must Have With Their Businesses. Bellevue, WA: Technology Business Management Council, 2016. 226. Print.
In their book The Real Business of IT, Richard Hunter and George Westerman show that transparency is
an essential force for demonstrating value for the money spent on IT. By being clear about cost and
performance, CIOs can take charge of the value conversation. They can show their capabilities as IT
leaders, help business leaders to improve their processes, and then take on new strategic roles.1
But transparency is about more than credibility. According to Hunter and Westerman, “When the CIO
successfully communicates value for money, the enterprise knows it is getting a competitive price for the
right balance of quality…and performance. It also knows that the way to reduce IT cost is not simply to
cut the IT budget but rather to adjust quality or consumption of IT services where excess quality or
consumption doesn’t improve business performance.”
Agency CIOs tend to agree with the need for better transparency. Department of Transportation CIO
Richard McKinney asks, “How do we begin to use the three foundational authorities of FITARA, namely
HR, budget, and acquisition approval that you have wisely laid out in this legislation? I’m sure that we can
all agree that in order to chart a course to where you want to go, you must begin by understanding where
you are. I have been frustrated by the lack of good data, both technical and financial, that we have to
measure our IT spend and performance.”2
“I know how we assemble the IT portfolio for the government — it's a very imperfect process where a lot
of the numbers are self-reported,” said Department of Interior CIO Sylvia Burns. “In terms of having fidelity
around the true value of the portfolio and where the organization wants to make tradeoffs or make
certain decisions, it's very hard to use the portfolio for business decisions because the accuracy of the
data is suspect.”3
Transparency provides many benefits for a business. Cost transparency helps IT leaders optimize cost and
business demand.4 Operational transparency, or revealing one’s operating processes to customers, can
lead to improved customer satisfaction and speed of service. 5 While not without shortcomings,
transparency is a powerful tool for applying the economic forces of supply and demand to IT.
1 Hunter, Richard, and George Westerman. The Real Business of IT: How CIOs Create and Communicate
Business Value. Boston, MA: Harvard Business, 2009. 12. Print. 2 Hearing before the House Subcommittee on Information Technology, Subcommittee on Government
Operations, November 4, 2015. 3 Boyd, Aaron. "Feds, Industry Work to Improve Reporting on IT Spending." Federal Times. N.p., 20 May 2015. 4 A 2014 McKinsey & Company study revealed that cost transparency improved existing infrastructure
efficiency by 15 to 20 percent over three years, with an immediate 10 to 15 percent improvement for new investments. (Source: Agarwal, Himanshu, Leandro Santos, and Irina Starikova. "Managing the Demand for IT Infrastructure." McKinsey & Company, Apr. 2014. Web. 17 Dec. 2015.)
5 Buell, Ryan W. and Kim, Tami and Tsay, Chia-Jung. “Creating Reciprocal Value Through Operational Transparency.” (May 20, 2015). Harvard Business School Technology & Operations Mgt. Unit Working Paper No. 14-115. Available at SSRN: http://ssrn.com/abstract=2449029
Transparency in IT is not a vague standard to which many IT leaders aspire. It is the very act of empowering
IT leaders and their stakeholders to make decisions with data. To make data useful, it needs to be relevant
and actionable for decision makers. The problem with many data-driven reports about IT cost,
performance, and value — in both the private and public sectors — is they obscure the relevant facts for
decision makers rather than illuminate them.
Take, for example, the cost of IT. Many federal reports break down IT costs by program and by projects,
with the major emphasis on new investments and their total costs. The costs to deliver services on an
ongoing basis in the context of the value provided (e.g., mission objectives supported, civilians served)
remain elusive. Furthermore, the lack of common terminology, cross-agency reporting, and per-unit
measures hinders cost comparisons for commodity IT services across the federal government.
This is analogous to a carmaker that reports on how much it spends on steel, labor, components, and
other inputs, and also discloses investments in new equipment, but fails to cost the cars it sells. As a result,
those who benefit from the products — i.e., the car buyers — cannot compare cost (price) to value.
By limiting transparency to program investments, there is little emphasis on driving continuously greater
value from the the 75% of spending on O&M. It is no longer sufficient to report program and project costs
alone; federal IT leaders and their constituents need better measures for comparing cost to value for all
spending, O&M included. And they need them across all departments and agencies.
Federal technology leaders need the ability to generate accurate, reliable, and benchmarkable IT cost data
that is consistent across the federal government. Without referenceable data based on a common
taxonomy, any efforts to overhaul how the government buys and consumes technology will be frustrated.
Furthermore, without giving agency CIOs better tools to evaluate all IT spending, the enhanced authority
they have been given will represent a missed opportunity to improve value.
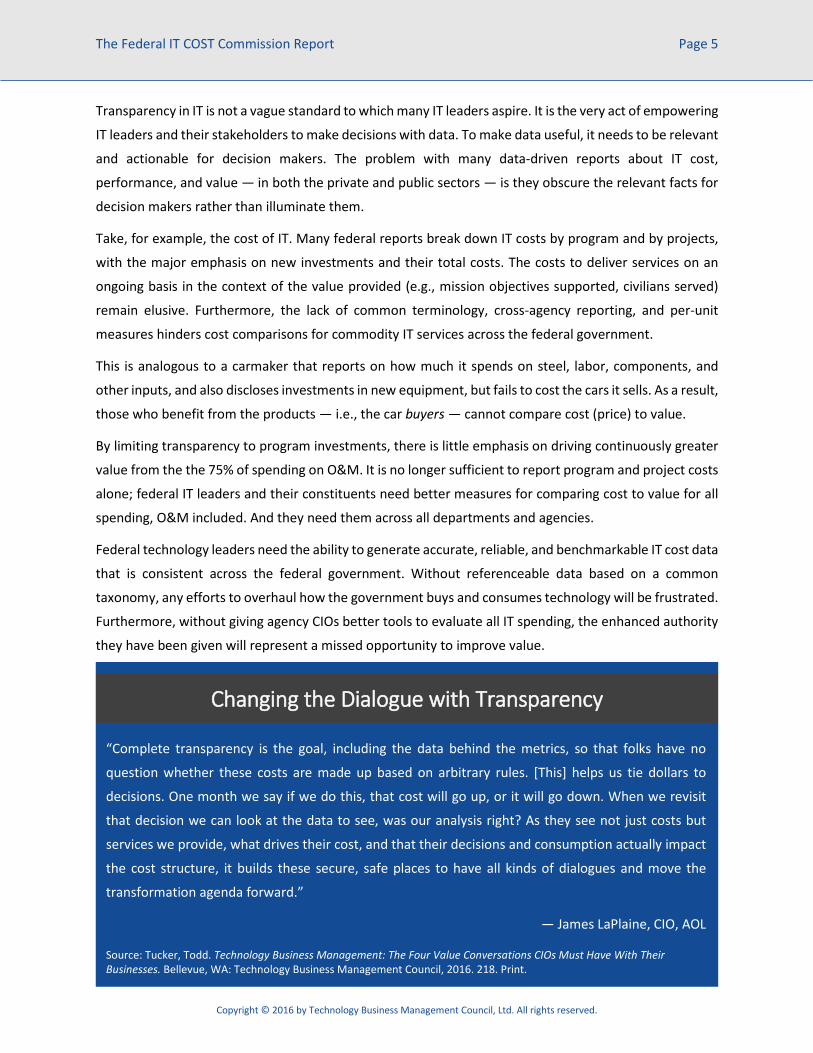
“Complete transparency is the goal, including the data behind the metrics, so that folks have no
question whether these costs are made up based on arbitrary rules. [This] helps us tie dollars to
decisions. One month we say if we do this, that cost will go up, or it will go down. When we revisit
that decision we can look at the data to see, was our analysis right? As they see not just costs but
services we provide, what drives their cost, and that their decisions and consumption actually impact
the cost structure, it builds these secure, safe places to have all kinds of dialogues and move the
transformation agenda forward.”
— James LaPlaine, CIO, AOL Source: Tucker, Todd. Technology Business Management: The Four Value Conversations CIOs Must Have With Their Businesses. Bellevue, WA: Technology Business Management Council, 2016. 218. Print.
The Federal IT COST Commission Tackles Federal IT Transparency Led by the Technology Business Management (TBM) Council, the Commission on IT Cost, Opportunity,
Strategy, and Transparency (IT COST) represents a joint effort by agency CIOs, TBM experts, and private-
sector partners to learn from and leverage private- and public-sector best practices for IT transparency,
especially those aimed at better governing run-the-business spending. The goal of the IT COST
Commission is to provide federal IT executives with a standardized approach for managing their
comprehensive technology spend in a way that generates the most value for the American people while
simultaneously eliminating waste and inefficiency.
The IT COST Commission produced this report in order to share key recommendations for applying TBM
best practices in the federal sector. The recommendations are designed to help agency CIOs:
Simultaneously reduce waste and increase the efficiency and efficacy of public-sector IT spending
Use data-driven tools to demonstrate the cost, quality, and value of federal IT spending
Accelerate the implementation of the Federal IT Acquisition Reform Act (FITARA)
To achieve the goal and define the necessary recommendations, the Commission brought together agency
CIOs, representatives from the Office of Management and Budget (OMB) and the Technology Business
Management Council, as well as advisors from industry-leading advisory firms and solution providers
including Capgemini, Deloitte, ISG, Cask, and Apptio.
The Commission conducted regular meetings between June 2015 and March 2016 to devise and draft
recommendations for the implementation of TBM best practices by the federal government. For a
complete list of meeting participants, including the private sector presenters, please refer to the list on
page iv. Additional meetings were held beyond the regular meetings to provide time to collaborate on
additional details and perform the needed analysis. To read more about the Commission’s approach, refer
to Appendix C.
“On the heels of the recently distributed draft recommendations for FITARA implementation, my
Federal CIO counterparts and I are eager to support the work being done by the TBM Council. We
believe that the IT COST Commission can give the taxpayers a better return on their investment while
simultaneously providing Congress and the Administration with better insight into the value provided
by technology. It's a win-win.”
— Richard McKinney, CIO, U.S. Department of Transportation Source: Technology Business Management Council. Public And Private Sector Technology Leaders Join Forces In Pursuit Of Federal IT Cost Transparency. PR Newswire. PR Newswire Association LLC, 14 May 2015. Web.
A Data-Driven Approach to Managing IT Cost and Value This report recommends an approach to optimizing cost efficiency and value that has matured in both the
private and public sectors over the last eight years. Called Technology Business Management — or TBM
— this approach provides a set of disciplines based on real-world implementations and experiences at
some of the largest and most complex enterprises and governments around the globe. These disciplines
begin with transparency and extend to benchmarking, shaping business demand, and both planning and
governing IT spending over time.
Repeatedly when companies eschew these best practices and try to develop internal frameworks and
taxonomies that are not based on industry standards, internal disputes over definitions and data sources
can overshadow and ultimately marginalize efforts to rationalize and control spending. Fortunately, the
TBM taxonomy and TBM model we introduce and explain in this report provide a proven roadmap for
tracing IT spending from the general ledger all the way through to the people and technology resources
that consume those dollars. When automated, TBM eliminates the data inconsistencies currently plaguing
the self-reported scorecards decision makers are relying on to make decisions today.
And, when this information comes in the form of interactive dashboards, decision makers have the
actionable information they need to ensure better outcomes, reduce costs, and improve value for the
taxpayer dollars that are spent on technology. The information displayed on ITdashboard.gov provides a
good example of a very high-level view of what these dashboards can do. But by adding layers of detail,
and by emphasizing a total cost perspective (i.e., acquire, develop, operate, and maintain), TBM exposes
costs and consumption at the asset, application, and service levels where money is spent and benefits are
directly provided.
This data-driven approach provides IT leaders with powerful tools they need to make the cost-for-
performance tradeoffs that are so essential to the good fiscal management, resource optimization, and
technology rationalization and consolidation decisions that lie at the heart of TBM.
What is Technology Business Management? Technology Business Management (TBM) is a value-management framework instituted by CIOs, CTOs, and
other technology leaders. Founded on transparency of costs, consumption, and performance, TBM gives
technology leaders and their business partners the facts they need to collaborate on business-aligned
decisions. Those decisions span supply and demand to enable the financial and performance tradeoffs
that are necessary to optimize run-the-business spending and accelerate business change. The framework
is backed by a community of CIOs, CTOs, and other business leaders on the Technology Business
Using Transparency to Enhance Technology Decision Making Like their private sector counterparts, federal IT leaders increasingly employ business principles to run
their organizations like those of any other service provider. To do this, they must analyze costs and other
metrics in a consistent, meaningful way. Unfortunately, financial accounting models are not sufficient
because United States Standard General Ledger (USSGL) accounts, responsibility centers, cost centers,
and other accounting mechanisms do not provide useful metrics for leaders outside the CFO's office.
For example, the USSGL can tell IT managers how much they have spent on hardware (CapEx) or on
maintenance and support services (OpEx). But the USSGL can rarely tell them the total cost to deliver
infrastructure, services, or applications, each of which is comprised of various elements from different
cost pools — hardware, software, facilities, internal and external labor, telecommunications, and more.
This total cost perspective is missing from the USSGL. The data is there but it is buried in a variety of
accounts, account descriptions, cost codes, and other structures. These facts are not linked in a way that
allows IT leaders to put IT spending into context, such as the outcomes it engenders (like reducing the
time and cost per tax return or reducing the person-hours required to process a single passport). This
situation obscures IT spending, impeding tradeoff decisions that are necessary to improve value.
Not only do IT leaders need linked metrics to understand their total costs, they also need them to manage
the unit costs of their technology towers, applications, and services. For example, federal IT leaders need
to compare their unit costs to industry peers and third-party alternatives (e.g., public cloud). They must
communicate costs in a way that makes sense to their agency and mission area partners (i.e., the
consumers of IT services). For all of these purposes, simply pulling cost data from the USSGL piecemeal
falls short.
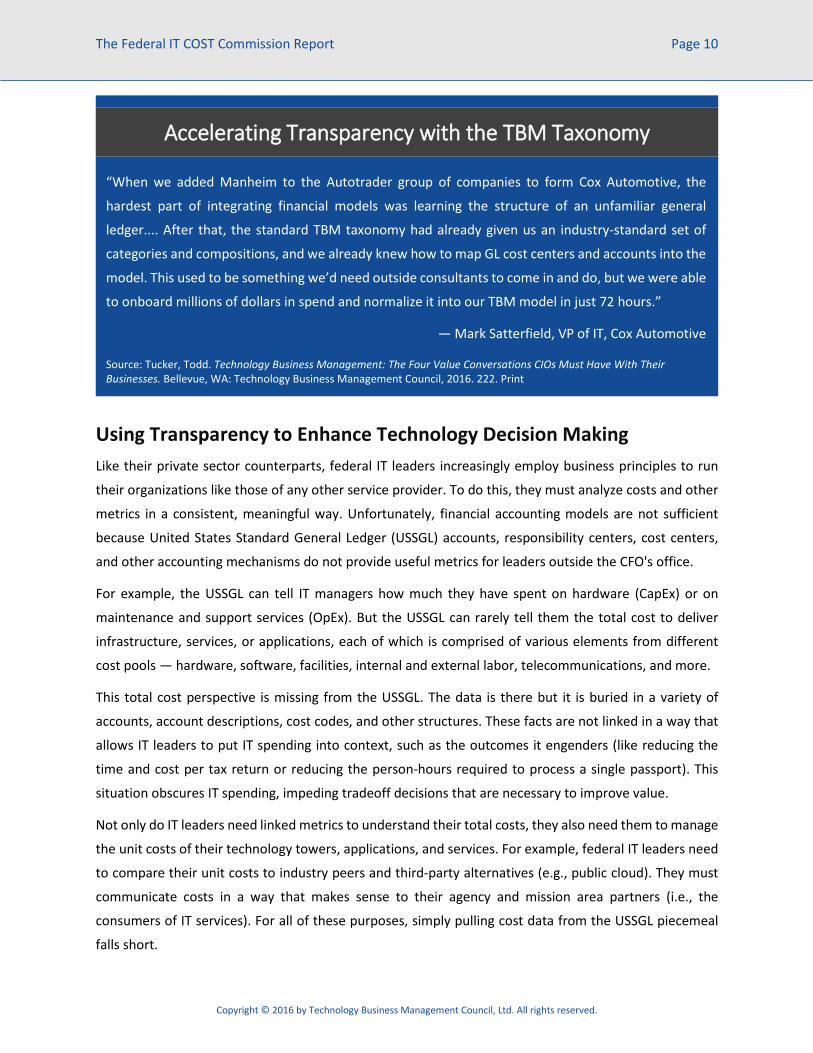
“When we added Manheim to the Autotrader group of companies to form Cox Automotive, the
hardest part of integrating financial models was learning the structure of an unfamiliar general
ledger.... After that, the standard TBM taxonomy had already given us an industry-standard set of
categories and compositions, and we already knew how to map GL cost centers and accounts into the
model. This used to be something we’d need outside consultants to come in and do, but we were able
to onboard millions of dollars in spend and normalize it into our TBM model in just 72 hours.”
— Mark Satterfield, VP of IT, Cox Automotive Source: Tucker, Todd. Technology Business Management: The Four Value Conversations CIOs Must Have With Their Businesses. Bellevue, WA: Technology Business Management Council, 2016. 222. Print
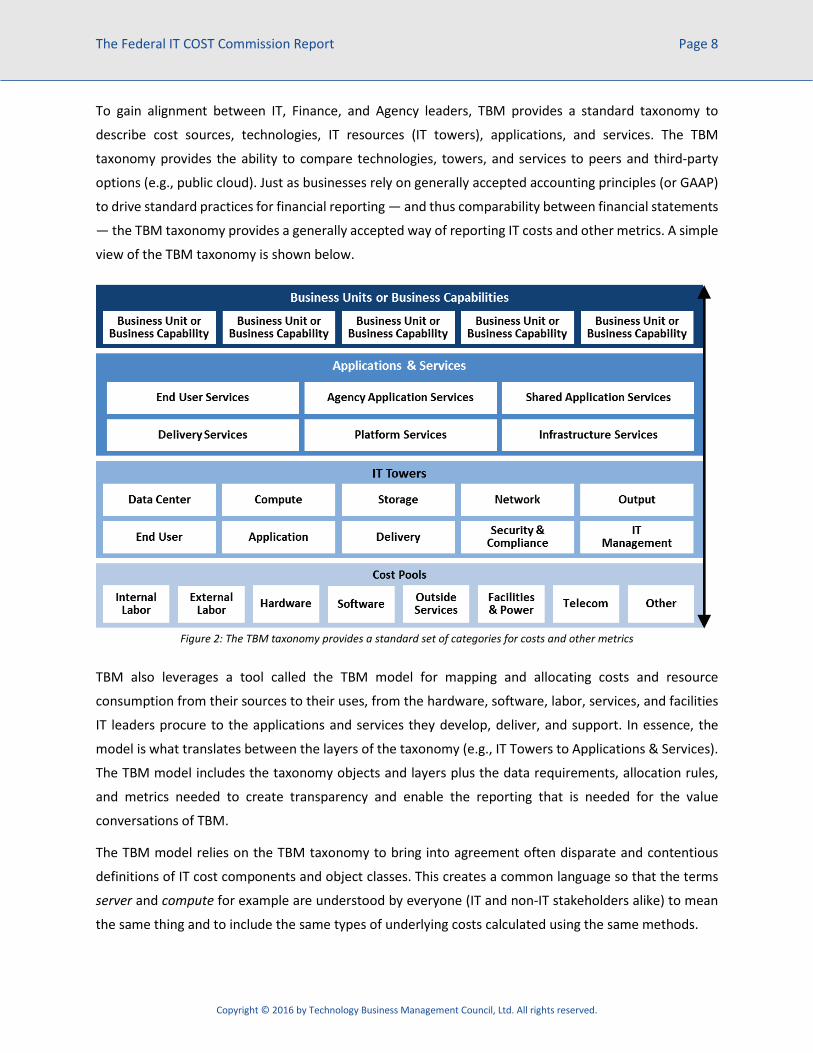
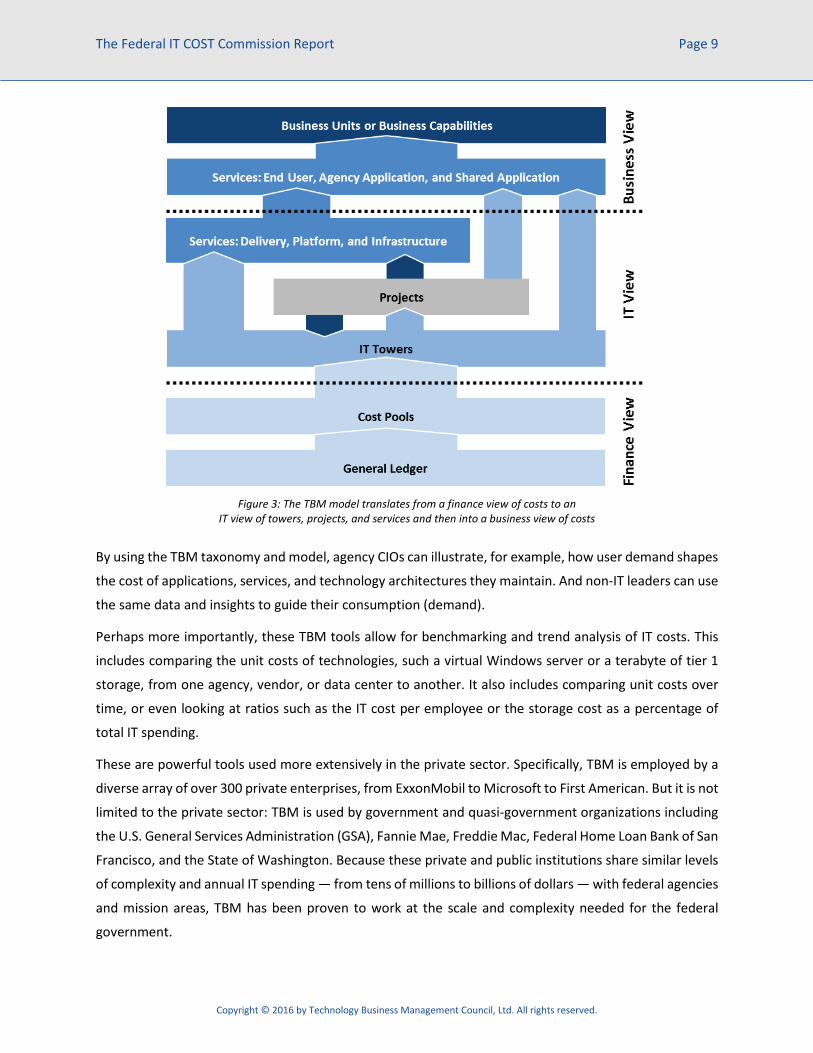
The TBM taxonomy and model allow IT executives and their agency and mission area counterparts to
report a shared set of operational and financial metrics. They are able to accelerate decisions around
where to fund vs. retire applications, consolidate vendors, migrate applications to cloud, consolidate
storage, servers, and data centers, and build business cases for technology refresh investments.
The taxonomy standardizes terminology across agencies, mission areas, finance, and IT. This taxonomy is
then fed into a cost model. Modeling allows everyone to see which costs are related to which applications,
services, and business units. The converse is also visible: TBM shows how consumption drives costs.
Decision makers can start at either end of the model — at the GL/cost pool layer or at the business unit
layer and drill down to figure out where monies are being spent and on what technologies and services.
This approach allows managers within IT functional towers like compute, storage, applications, and
support, to see exactly when their costs are in line with budgets or at odds with targets for spending.
These insights are also benchmarkable against existing industry-standard data sets so IT leaders can make
informed decisions about which services to target for reduction, which to tolerate, and which services are
performing at or above expectations compared to their peers. The result is continuous improvement in
run-cost efficiency to avoid defunding Development, Modernization, and Enhancement efforts.
TBM not only provides insights, it helps CIOs and CFOs accelerate important initiatives such as:
Becoming a transparent broker of services to the business by providing clarity into costs from
third parties (such as cloud providers and consultants), internal consumption, and total cost of
ownership (TCO) of owned assets (such as servers and storage networks);
Eliminating technical debt by providing a more complete view of TCO, including the costs to
maintain and support applications and technologies that were put into production with less than
optimal code; and
Negotiating better outsourcing contracts by providing a clearer perspective of internal costs and
consumption to ensure that vendor proposals are complete.
The question isn't if TBM is applicable to the federal environment — it is — but, given the right tools, how
can the facts TBM provides about cost, consumption, utilization, and other aspects of IT help accelerate
important goals and make better decisions?
Using TBM Principles to Support FITARA Implementation Federal IT leaders face many of the same challenges as their private sector counterparts — heightened
expectations to retire or modernize legacy systems, consolidate data centers, eliminate redundant
systems, and optimize spending. Attaining these goals will require new IT strategies, processes, systems,
roles, and ways of making technology decisions that impact stakeholders well beyond IT. Federal IT leaders
will need to understand and be able to communicate exactly where, how, and why IT spending occurs.
Through the TBM Council, hundreds of private- and public-sector CIOs, CTOs, and other IT leaders
collaborate on standards (e.g., the TBM taxonomy, TBM metrics) and best practices to answer the same
questions agency CIOs are now asking such as:
What are the top drivers of IT spending?
Who are my top consumers of IT resources and what do they cost the organization?
Where are the best opportunities to cut spending while maintaining effectiveness?
What is the fully loaded cost to build and run the applications and services we use?
Are our operations and maintenance (O&M) resources being used efficiently?
Are development, modernization, and enhancement (DME) funds being used wisely?
To meet FITARA mandates, agency CIOs should leverage the insights and experiences of the TBM Council
members, who regularly exchange ideas and knowledge on how best to answer these and many other
important questions related to IT spending.
“It was a bit of an eye-opener for a lot of our business leaders in two big ways. One, they realized that
they were using a whole lot more IT than they imagined. Maybe in the back of their minds they just
thought everybody got a computer and a phone and just went about their business. Second, they
realized that there was a whole lot more to what they were consuming. They had no idea there were
so many incremental costs to running an application.... We've got a CAD (computer-aided drawing)
viewing tool for our engineering folks. There’s no license fee, it’s just a ‘freeware’ viewer. But it sits
on 500 workstations and generates an enormous amount of support calls. So for a free application,
it's very expensive from a support labor perspective.”
— James LaPlaine, SVP & CIO, AOL Source: Tucker, Todd. Technology Business Management: The Four Value Conversations CIOs Must Have With Their Businesses. Bellevue, WA: Technology Business Management Council, 2016. 218. Print.
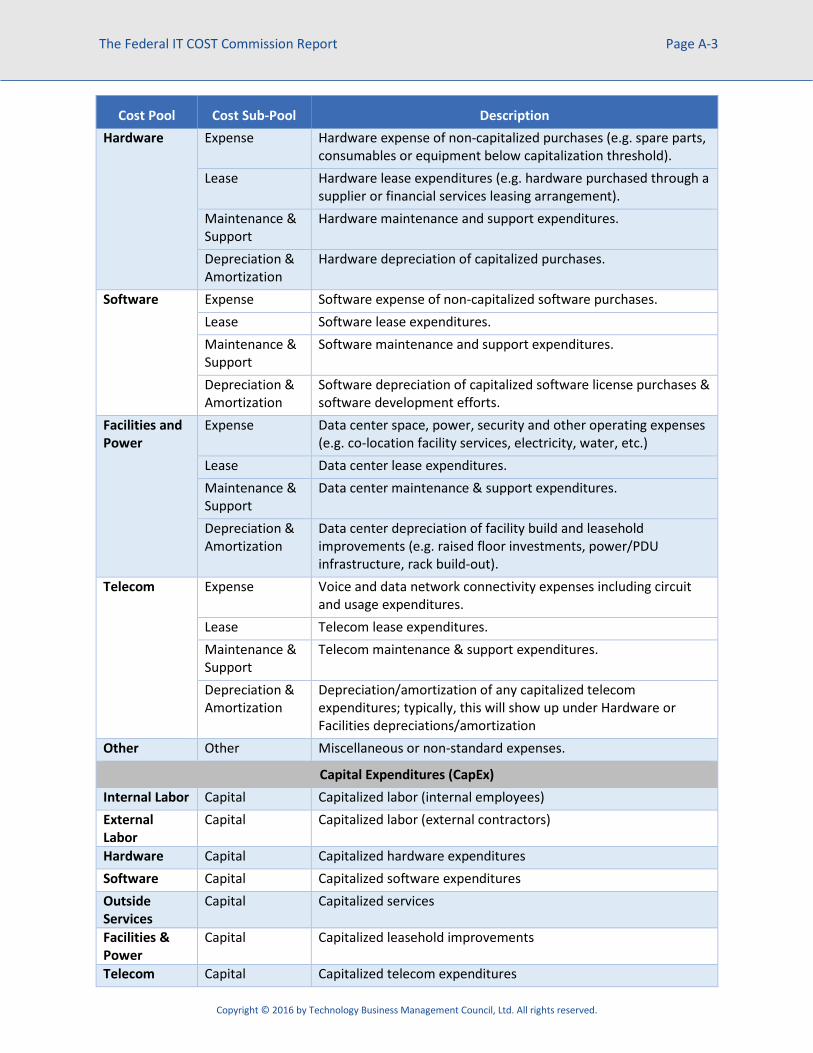
recommended solutions. The result is a standard federal TBM taxonomy that defines cost pools, IT towers
(resources), applications, and services.
Much like other standards and frameworks — think of the guiding principles of GAAP for accounting —
TBM relies on rules for governing how IT expenditures and expenses are categorized and reported.
However, TBM goes further to provide a taxonomy for reporting the total cost to build, buy, operate,
maintain, and support IT products, applications, and services. This TBM taxonomy, born in private- and
public-sector IT departments, provides the necessary categories.
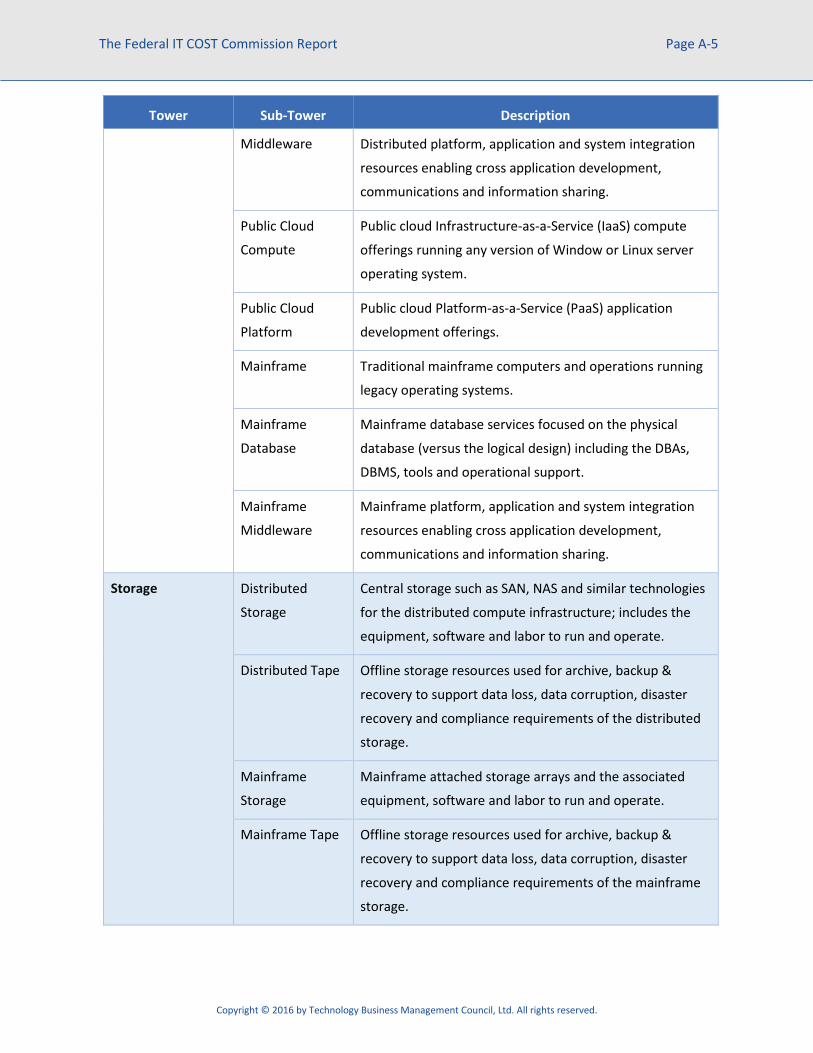
With the TBM taxonomy, IT costs can be compared over time and benchmarked against other agencies,
mission areas, and private-sector companies in a meaningful way. This is especially powerful for the
standard categories known as IT towers: data centers, compute (i.e., servers, including cloud), storage,
networking, end user, application (e.g., development, support), security & compliance, and other types of
costs.
Furthermore, the taxonomy is hierarchical, with the lowest layer defining standard accounting cost pools
(e.g., labor, hardware, software, outside services), the middle focused on the IT towers described above,
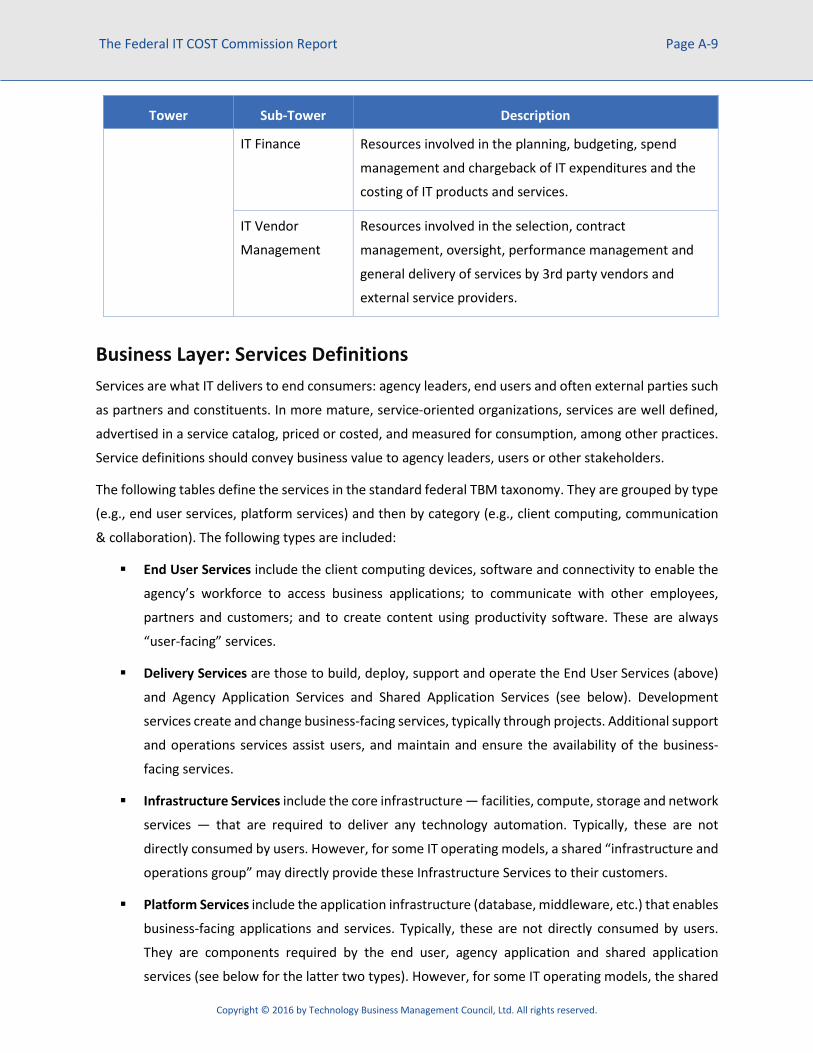
and the upper layer providing for the applications and services that are delivered by agency CIOs to their
agencies and other consumers.
The goal of TBM taxonomy is to enable a consistent method to define, analyze, and report on all aspects
of IT spending and to enable the measurement of IT value for improved decision making. When coupled
with an IT portfolio approach to project management, this can include all IT activities across both
operations and management (O&M) and DME funding as well as costs directly within IT's purview and
technology costs embedded within Agency mission areas.
Recommendation 1. Supported by the OMB, agency CIOs should adopt the standard TBM taxonomy for budgeting (planning) and reporting IT expenditures and for driving consistency across stakeholder groups. The Commission recommends that the OMB provide guidelines for federal agencies to use the standard
TBM taxonomy of cost pools (and sub-pools) and IT towers (and sub-towers) for submitting their annual
IT budget requests. These guidelines may be part of the annual OMB Circular A-11 on preparing,
submitting, and executing the fiscal year budget. This will allow federal CIOs, CFOs, and other stakeholders
to better understand and evaluate planned IT costs at a more granular level. This will also allow the OMB
to more easily compare expenditures across the federal government.
In using the standard TBM taxonomy, federal agencies will empower their CIOs to perform more
meaningful reviews of all major IT investments as required by OMB Circular A-11 (see section 51.3 of the
2015 circular). In particular, putting investment resources into IT tower and sub-tower terms allows CIOs
and their staff to better review the cost-effectiveness of the inputs used for delivering program outcomes.
Using the TBM taxonomy also enables more meaningful benchmarking of IT resources consumed in
delivering federal programs and services.
Agency CIOs should also employ the standard TBM taxonomy, through the lifecycle of IT services and
investments, to drive consistency across many stakeholder groups: program managers, project managers,
OMB, Government Accountability Office, IT governance, Office of the CFO, and more. In essence, CIOs
should define data once and use it many times.
Recommendation 2. Agency CIOs should employ a standard set of TBM KPIs to allow comparability of cost, performance, and value. Metrics are a vital aspect of almost any program for managing performance, including cost effectiveness
of IT. While the number of metrics that a TBM program can deliver is vast, the Commission recommends
agency CIOs employ 15 key metrics (we refer to them as Key Performance Indicators or KPIs) to facilitate
governmental and commercial comparisons of IT cost and performance and to manage tradeoffs, such as
TCO vs. risk. As such, these KPIs include metrics that are made possible by the TBM taxonomy and model
and others that often come from other sources (e.g., service level management, customer satisfaction
surveys).
The following metrics are categorized according to TBM outcomes: improving cost for performance,
aligning the IT portfolio to agency goals and missions, investing in innovation and increasing agility. The
following table explains each metric.
Additional metrics that are enabled by the TBM taxonomy in a way that facilitates benchmarking can be
found in Appendix B.
KPI Description Justification
Cost for Performance
Unit Cost Actuals vs. Targets for IT Towers
Unit cost targets for towers should be set annually during planning based on budgets, expected units consumed (from capacity planning), and federal- and/or private-sector benchmarks (where available). Actual cost per unit should be compared monthly or quarterly. These should be set for the majority of your tower spending.
With infrastructure consuming approximately 60% to 70% of overall IT spending, this KPI holds tower owners (and vendors or suppliers) responsible for cost efficiency and can dramatically improve overall value for the money spent on IT.
KPI Description Justification Unit Cost Actuals vs. Targets for Business-Facing IT Services or Apps
Unit cost targets for services or apps (inclusive of towers that support them) should be set annually during planning based on budgets, expected units consumed (from capacity planning), and industry benchmarks (where available). Actual costs per unit should be compared monthly or quarterly.
Most agency leaders only understand costs in terms of the services or applications they consume, not the towers or infrastructure technologies that comprise them. Managing the unit costs of services or apps helps agency CIOs shape demand and consumption.
Business-Facing IT Services or Apps Meeting SLAs
Based on total cost of the portfolio, this percentage reveals how much of the application or service portfolio is meeting service-level agreements. It is a weighted metric based on relative TCO.
Meeting service level agreements with business partners is essential to delivering value for the money. This KPI helps agency CIOs balance cost optimization with service quality.
Customer Satisfaction Scores for Business-Facing Services
This measure reflects the outcome of surveys of the users of business-facing services. This may include Net Promoter Score or other mechanisms, but should not be limited to the service or help desk. Instead, all major services should be included in the survey.
Performance should be viewed from the perspective of the business users. While SLA attainment is an important, subjective measurements of performance can be very useful and identify areas where SLA attainment alone is insufficient.
Business-Aligned Portfolio
Actual Spending (TCO) against Targets for Agency Outcomes (or Categories)
A portfolio-based view of TCO (OpEx and CapEx, including projects) by agency business outcomes (e.g., mission areas, business capabilities, lines of business served) should be produced monthly or quarterly for executive steering committee or governance reviews.
Since IT is often provided as a set of shared services, facilitating governance conversations with corporate executives is important to ensure agency and mission alignment. These conversations should drive top-level mandates for change, such as changes in spending for specific areas of the business.
Actual Spending (TCO) against Targets for Business-Facing Services or Apps
A portfolio-based view of TCO (CapEx, including projects, and OpEx) by the services and/or apps that each agency consumes should be produced monthly or quarterly and presented to the agency leaders.
In concert with top-level mandates, agency and consumer-level discussions about spending provides additional insights about where consumption and costs can be optimized or where additional investments are needed.
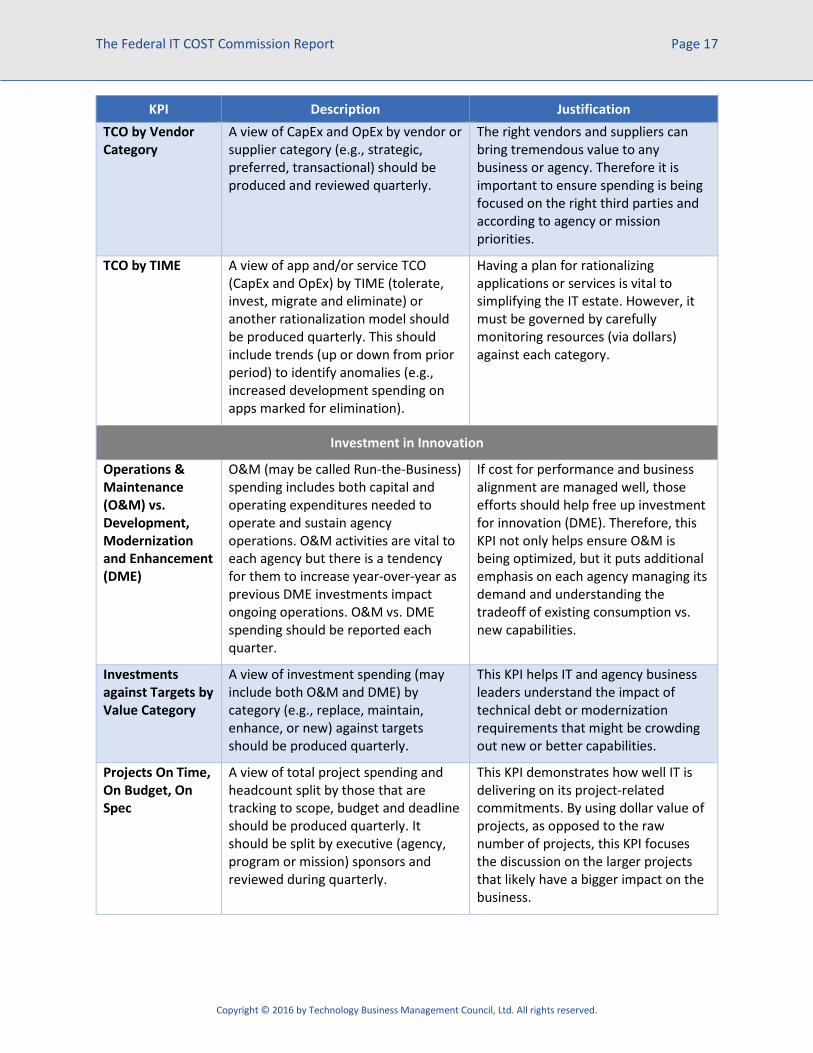
KPI Description Justification TCO by Vendor Category
A view of CapEx and OpEx by vendor or supplier category (e.g., strategic, preferred, transactional) should be produced and reviewed quarterly.
The right vendors and suppliers can bring tremendous value to any business or agency. Therefore it is important to ensure spending is being focused on the right third parties and according to agency or mission priorities.
TCO by TIME A view of app and/or service TCO (CapEx and OpEx) by TIME (tolerate, invest, migrate and eliminate) or another rationalization model should be produced quarterly. This should include trends (up or down from prior period) to identify anomalies (e.g., increased development spending on apps marked for elimination).
Having a plan for rationalizing applications or services is vital to simplifying the IT estate. However, it must be governed by carefully monitoring resources (via dollars) against each category.
Investment in Innovation
Operations & Maintenance (O&M) vs. Development, Modernization and Enhancement (DME)
O&M (may be called Run-the-Business) spending includes both capital and operating expenditures needed to operate and sustain agency operations. O&M activities are vital to each agency but there is a tendency for them to increase year-over-year as previous DME investments impact ongoing operations. O&M vs. DME spending should be reported each quarter.
If cost for performance and business alignment are managed well, those efforts should help free up investment for innovation (DME). Therefore, this KPI not only helps ensure O&M is being optimized, but it puts additional emphasis on each agency managing its demand and understanding the tradeoff of existing consumption vs. new capabilities.
Investments against Targets by Value Category
A view of investment spending (may include both O&M and DME) by category (e.g., replace, maintain, enhance, or new) against targets should be produced quarterly.
This KPI helps IT and agency business leaders understand the impact of technical debt or modernization requirements that might be crowding out new or better capabilities.
Projects On Time, On Budget, On Spec
A view of total project spending and headcount split by those that are tracking to scope, budget and deadline should be produced quarterly. It should be split by executive (agency, program or mission) sponsors and reviewed during quarterly.
This KPI demonstrates how well IT is delivering on its project-related commitments. By using dollar value of projects, as opposed to the raw number of projects, this KPI focuses the discussion on the larger projects that likely have a bigger impact on the business.
This measures how much of IT (as a percent of Opex) is delivered as private or public cloud services to the business. Clear criteria for which services are designated cloud services are needed for this KPI to be meaningful.
Public and private cloud services are, by definition, rapidly elastic and on-demand, and their consumption is measured to provide a basis for allocating costs. Cloud enables an agency to use IT services as needed, providing agility and connecting consumption to the costs incurred.
Variable Cost Ratio by Business-Facing Service against Targets
This KPI measures how much of the business-facing IT costs (i.e., apps or services delivered to the business) are fixed (i.e., static regardless of consumption) or variable (i.e., vary in line with volumes of consumption). Targets should be set while considering implications for short- and long-term total costs.
A more variable cost structure is beneficial in situations where business volumes are falling or are expected to rise and fall. A variable cost structure helps match IT costs with business revenues. However, targets for variable costs should be set based on tradeoff considerations.
Discretionary Project Spending against Targets
Discretionary projects are those designed to enhance services or introduce new ones, as opposed to mandatory investments such as compliance, capacity upgrades, reducing technical debt and maintenance.
When mandatory spending consumes a high percentage of project spending, an agency has little ability to innovate or respond to new threats or opportunities. Greater discretionary spending as a percentage of the total indicates a greater capacity to innovate, as funds can be shifted more easily.
TBM Data Quality Index
This measures the overall state of data quality for TBM. It measures missing data sets, gaps in data, breakage between data sets, and the use of assumptive data in driving allocations. It should trend in a positive direction, although setbacks may occur after major changes in the model or data sources.
As IT leaders become data-driven in their decision making, better data quality for TBM means they can make better decisions for improving business value. Better data also improves operational maturity, making it possible to run more efficiently and reliably.
Recommendation 3. Agency CIOs should benchmark significant IT tower and sub-tower costs on an annual basis. Commonly used by private-sector CIOs and CFOs, benchmarking is a powerful yet often misunderstood
tool for CIOs to rein in costs and improve efficiency. The concept of benchmarking is simple: it is the act
of comparing one agency’s cost and performance to that of a peer group (outside or inside the
organization), a standard, or over time (from a baseline using trend analysis) using similar metrics with
agreed-upon meanings. However, it is often challenging to make an apples-to-apples comparison. The
TBM taxonomy helps make comparisons useful through the use of common terminology and hierarchy.
The Commission recommends a combination of benchmarking approaches including comparisons with
external peers (at least every three years or during major contract renegotiations), between agencies (at
least every year), and over time (quarterly or semi-annually). Agency CIOs should focus benchmarking
efforts on towers and sub-towers, where unit costing is most practical and where internal and external
comparisons are most easily made. Where feasible, unit costs and consumption should be preferred to
ratios or percentages. Benchmarking tower-level unit costs will help ensure IT sourcing is cost-effective.
When evaluating benchmark comparisons, agency CIOs and their stakeholders must remember that
cheaper is not always better. If spending is consistently higher than a peer group benchmark, for example,
then the agency may be unique in some way compared to the peer group, or the data supporting the
benchmark could be off. Either way, benchmarking will reveal whether something is amiss and worth
further investigation.
Furthermore, agencies with IT costs well below peer group averages may indicate higher risk in some way,
such as running tight on capacity or putting off much-needed hardware refreshes to save money.
Regardless of where the data leads, CIOs should focus on achieving the best cost-for-performance ratio
for the organization, not just the best cost (or the best performance).
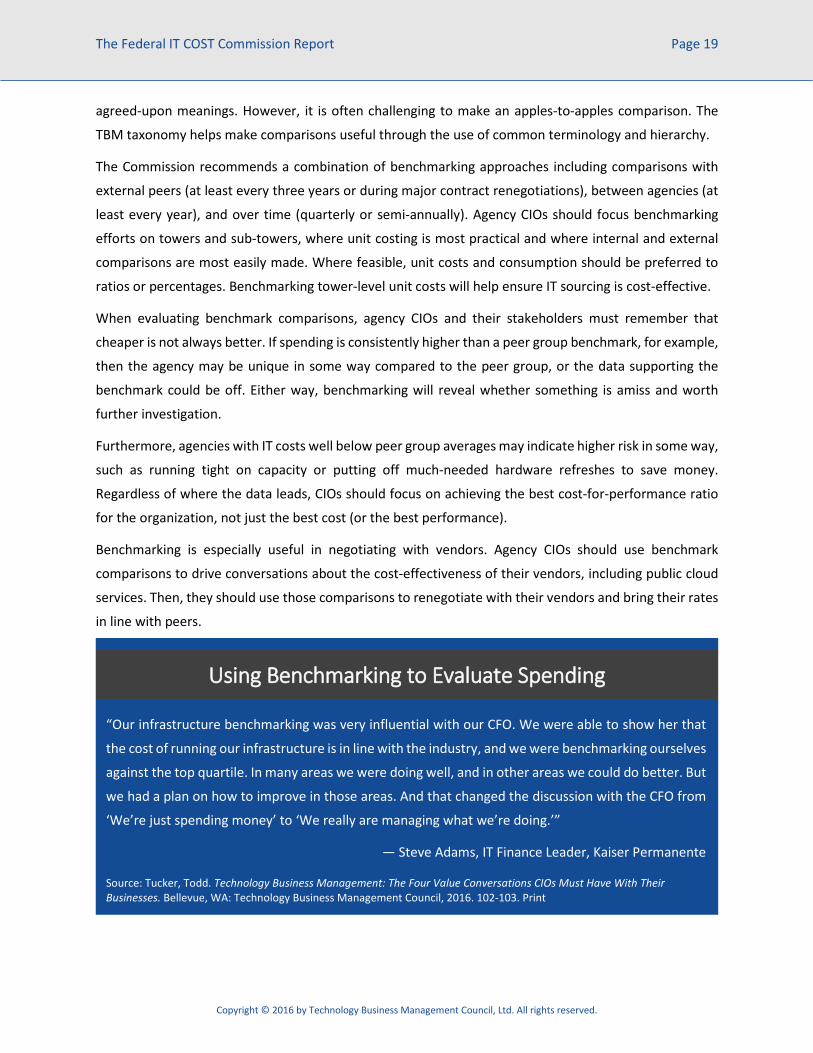
Benchmarking is especially useful in negotiating with vendors. Agency CIOs should use benchmark
comparisons to drive conversations about the cost-effectiveness of their vendors, including public cloud
services. Then, they should use those comparisons to renegotiate with their vendors and bring their rates
in line with peers.
“Our infrastructure benchmarking was very influential with our CFO. We were able to show her that
the cost of running our infrastructure is in line with the industry, and we were benchmarking ourselves
against the top quartile. In many areas we were doing well, and in other areas we could do better. But
we had a plan on how to improve in those areas. And that changed the discussion with the CFO from
‘We’re just spending money’ to ‘We really are managing what we’re doing.’”
— Steve Adams, IT Finance Leader, Kaiser Permanente Source: Tucker, Todd. Technology Business Management: The Four Value Conversations CIOs Must Have With Their Businesses. Bellevue, WA: Technology Business Management Council, 2016. 102-103. Print
Financial Accounting and Reporting The TBM taxonomy provides for an alternative view of spending to one normally coded into a federal
agency’s accounting system. This is no different than in the private sector, where a firm’s general ledger
(GL) captures expenses and expenditures that are needed for corporate financial reporting, not
managerial cost-optimization decisions.
In government, the systems and codes are different from those in the private sector. Object classes are
the government equivalent to GL accounts, for example. Fortunately, the Commission found that those
object classes generally map well to the cost pool framework of the TBM taxonomy. This means that the
base of the taxonomy and the foundation of the federal TBM cost model work well with existing federal
accounting object classes.
Another difference between federal and private-sector systems is where spending is managed and
recorded. In the private sector, IT spending is often found in budget (cost) centers for the IT department.
In the federal government, however, spend is managed via appropriations and is recorded in funds. These
funds often cross-functional lines and may contain a combination of IT and non-IT spend. For example, in
a private-sector organization, a new server would be coded in the general ledger to the computing group
within the IT department; in the government, the same purchase may be charged to a program fund used
for many other types of expenses, both IT and non-IT.
The goal of the TBM taxonomy and corresponding TBM cost model is the same for both federal and
private-sector agencies: to report costs in terms that are meaningful to stakeholders. In this section, the
Commission provides recommendations for using the TBM taxonomy with current federal accounting
systems and standards.
Recommendation 4. The GSA’s Financial Systems Integration Office (FSIO) should establish a common coding scheme for TBM taxonomy IT tower information. In order to model IT costs according to the TBM taxonomy, federal agencies must be able to map (connect)
financial accounting transactions such as hardware purchases, payments for services, payroll, and even
depreciation amounts, to the IT towers and sub-towers they support. Since object classes, funds, and
program codes do not normally support this mapping, another option must be employed. The Commission
recommends adopting a common coding scheme for IT tower information.
According to the GSA, the Common Government-wide Accounting Classification (CGAC) structure is a
standard way to code and categorize financial transactions. Issued by the Financial Systems Integration
Office (FSIO), CGAC serves as a standard financial structure for all federal agencies in order to deliver
internal and external reporting, while allowing for agency-specific needs. CGAC is being implemented as
The Commission recommends that the GSA FSIO create a common coding scheme to be used by federal
agencies in recording IT financial accounting transactions. In particular, they should consider using the
cost center code or activity code in the CGAC structure. Cost centers and activity codes are agency-defined
and are optional, according to CGAC. While agencies may use these codes to capture tower and sub-tower
information, a common scheme would not only be more efficient government-wide but would also allow
for easier reporting and implementation of TBM tools.
A cost center is defined as “a logical grouping of one or more related activities or organizational units into
a common pool for the purpose of identifying the cost incurred.” Therefore, it appears to be the most
logical code for capturing TBM taxonomy towers and sub-towers.
Recommendation 5. When implementing TBM, federal agencies should use an accrual-based calculation of costs, not a cash-based methodology. Cost benchmarks and ratios are normally based on the total cost of ownership (TCO) for assets and
services. In turn, these TCO figures are calculated using accrual-based methods that match expenses to
the periods in which they provide benefits. These methods include accounting mechanisms such as
depreciation, amortization, prepaids, and accruals. In addition to better matching costs to their benefits,
accrual-based costing provides a more accurate view of the cost to maintain and deliver IT services and
their long-term impact on agency budgets and resources.
The Commission recommends that federal agencies use accrual-based costs, including depreciation and
amortization, as opposed to cash-based expenditures for reporting and management, including
benchmarking. These figures are reported in an agency’s or component’s annual statement of net costs.
Recommendation 6. Federal agencies should code financial transactions with the corresponding TBM taxonomy IT tower. In order to avoid a change in financial account systems or transaction schemas (e.g., CGAC), federal
agencies should code financial transactions with the appropriate TBM taxonomy IT tower. Doing so will
support the accurate total costing of IT towers for reporting, benchmarking, and cost management with
a minimum of additional effort.
Note that the TBM model supports the costing of IT sub-towers by using operational data, so financial
transactions do not need to be coded with sub-tower information.
Recommendation 7. Federal agencies should adjust the financial reporting process to ensure IT spend can be identified from other spend. Since IT financial transactions are often commingled with other types of transactions, agency CIOs find it
difficult to identify, report, and evaluate total IT spending for their agencies. Furthermore, this
commingling will make it difficult to isolate and map IT spending into towers and sub-towers, a necessary
step in benchmarking and reporting.
The Commission recommends that federal agencies isolate their IT spending in their financial systems.
Isolation can be achieved via object class codes, such as adding a designation to codes when the spending
is for IT, or by ensuring that the fund or organizational codes correspond to IT appropriately.
Recommendation 8. The OMB should ensure each agency has a budget bureau code dedicated to the Office of the CIO. In the OMB MAX budget system, the OMB has assigned agency and bureau codes that are used to identify
and access data in the budget database. Some agencies have a specific code set up for the Office of the
Chief Information Officer, but most do not.
The Commission recommends that the OMB designate a Bureau code for the Office of the Chief
Information Officer for all agencies. This will help ensure, as directed by the FITARA Act, that agency CIOs
have a significant role in IT decisions, including annual and multi-year planning, programming, budgeting,
execution, reporting, management, governance, and oversight functions.
Governance and Standards In the private sector, successful TBM programs are the result of an agile approach and continuous
improvement as opposed to a “big bang” approach to implementation. TBM programs often begin
relatively small, focused on establishing a base level of transparency using the TBM taxonomy and
maturing over time. However, while private-sector IT leaders often have the benefit of fewer regulations
and standards, this is a mixed blessing for TBM: on one hand, they can operate more freely than many of
their federal peers; on the other hand, they often lack the very standards that make TBM easier and faster
to implement.
The Commission makes several recommendations for the OMB, GSA, and agency CIOs to accelerate
transparency and the adoption of the TBM taxonomy.
Recommendation 9. The OMB should establish a government-wide TBM governance board and designate a center of excellence for cross-agency implementations. Adoption of the TBM taxonomy and disciplines for managing cost represent a unique opportunity for
agencies to improve the value of IT spending. However, each agency should not be left to act on its own.
The Commission recommends that the OMB take the lead on forming a government-wide governance
board comprised of members across the federal government who set the strategic direction for TBM in
the federal government. The Board should provide the long-term vision and direction for TBM, with an
emphasis on increasing maturity over time and enabling outcomes such as improving cost efficiency,
portfolio management, and agency agility.
The OMB should also consider designating a center of excellence for TBM nationally. In particular, the
OMB should consider the GSA for the TBM center of excellence. The GSA is the first major U.S. federal
agency to implement the TBM taxonomy, cost modeling, reporting, and metrics. In doing so, the agency
is paving the way for other agencies to do the same. Having recently established an office (the United
Shared Services Management Organization) to boost the adoption of shared services, the GSA is in a
unique position to do the same for TBM.
The output of the governance board and center of excellence should include guidelines for TBM
roadmaps, templates for accounting policies and protocols, standards for data acquisition and quality
management, and reporting best practices.
Recommendation 10. Cabinet-level agency CIOs should establish policies and processes to ensure consistent application of TBM taxonomy and reporting across subordinate agencies. The power of the TBM taxonomy is greatest when it is applied consistently by those who use it. In federal
environments, having agencies, sub-agencies, and other entities all using the same taxonomy allows for
benchmarking and other comparisons, but only if similar processes and policies are applied in modeling
and describing the underlying costs.
The Commission recommends that cabinet-level agency CIOs should establish policies and processes to
ensure consistent application of TBM taxonomy and reporting across subordinate agencies. These would
include guidelines for coding IT financial transactions (per Recommendation 5), data quality reporting,
specifying and using metrics, making agency-specific extensions to the TBM taxonomy, and selecting a
benchmarking peer group.
Recommendation 11. Agency CIOs should develop a multi-year roadmap both for reporting and data maturity and for driving continuous improvement in cost efficiency and value. The Commission recommends that agency CIOs develop and maintain a TBM roadmap and regularly share
the roadmap (and current state) with stakeholders.
A TBM roadmap is also essential to adoption. It is the plan for any TBM journey. The roadmap outlines the
phases that agency CIOs will go through with TBM and shows how each step builds upon the ones taken
before it. Fully implementing a roadmap typically takes between 12 to 18 months and usually includes
Phase 1 — Build the Foundation: Phase 1 creates a foundation of cost transparency where the TBM team
begins identifying and sourcing cost and consumption data from cost pools, USSGL accounts, cost centers,
mission areas, project management offices, HR, etc. — wherever outcomes are looking to be influenced.
Some organizations use this phase to begin changing their IT planning process as well by leveraging the
clarity into their spending to accelerate IT budgeting and forecasting.
Phase 2 — Move Up the TBM Taxonomy: With the foundation in place, Phase 2 focuses on application
TCO and service costing. Having metrics at this level of the model enables agency CIOs to evaluate and
discuss the value of IT spending, possibly for the first time, with their stakeholders (e.g., agency leaders).
But it also supports application rationalization initiatives and potentially sets agencies up for demand-
based planning (e.g., zero-based budgeting) based on application requirements.
Another direction to take during this phase is to dive deeper into tower costs. This involves incorporating
more granular asset data and cloud billing data into the model.
In taking these steps, agency CIOs will begin to understand why costs deviate from benchmarks and
identify areas of waste, such as underutilized and orphaned assets.
Phase 3 — Connect with the Business: During Phase 3, agency CIOs should improve visibility into
consumption and costs at the mission area, line of business unit, and business capability level. This sets
them up to deliver a bill to their IT consumers and start reshaping demand to optimize spending. At this
point, agency CIOs will have connected the TBM model from the bottom to the top.
Recommendation 12. Agency CIOs should take specific steps to ensure better alignment of reporting between their offices, their Offices of the Chief Financial Officer, and the OMB. To achieve transparency, TBM utilizes data inputs from multiple systems well beyond the federal financial
management systems. From data center management platforms to project management tracking
solutions and every possible metric in between, TBM ties spending back to desired outcomes (such as
tracking server consolidation efforts or increasing the number of customer-facing projects in the pipeline)
and, therefore, value.
Achieving this level of transparency in federal IT spending requires better alignment between each
agency’s Office of the CIO (OCIO) and Office of the CFO (OCFO), program managers, project managers (or
PMO) as well as the OMB. Currently, each of these stakeholder's data requirements and reporting needs
do not adequately support one another's goals and objectives.
To enhance alignment, the Commission recommends agency CIOs put the following elements in place in
The Commission recommends that agency CIOs work with their program managers and CFOs to establish
consistent and traceable project parameters such as project names (identifiers), project scope, cost,
scheduling, staffing, and quality. This information and data are used by governance for decision-making,
by project managers (PMs) for detailed project planning and delivery, and to set project baselines for
performance management and investment health assessments.
Cost and Benefits Framework
Currently, disparate methods are used to assess new investments or changes to existing investments. The
Commission recommends that agency CIOs work with their CFOs to establish an agency-specific common
cost and benefits analysis (CBA) method (e.g., metrics, criteria, framework, etc.) that both IT and agency
mission areas understand and that aids in making technology investment decisions. This method should
reflect both the short-term (i.e., annual) investments as well as the longer-term cost to operate a new
technology, application, or service.
Reporting Alignment to Reduce Burden
There is a need to align external (i.e., OMB) and internal reporting requirements so that the burden of
generating these reports is reduced and value of the analysis is increased by being useful to all
stakeholders. While E300/E53 reporting guidelines attempt to provide this alignment, they do not
represent efficient reporting mechanisms that can be utilized by both internal and external stakeholders.
Therefore, the Commission recommends that agencies standardize their reporting using the E300/E53
language specific to the federal environment.
Organizational Capabilities TBM is a value management framework for technology leaders and their people. Hence, the roles that
people play and the processes they execute are crucial for improving value. The transparency of TBM
empowers decision makers such as service owners, BRMs, portfolio managers, and business process
owners; they are the consumers of transparency, responsible for improving cost for performance,
business alignment, and other outcomes of TBM. Other roles are needed to create transparency with the
TBM taxonomy and model, and the processes they execute make TBM possible.
In this section of the report, the Commission makes several recommendations for agency CIOs related to
the people and processes needed for TBM.
Recommendation 13. Agency CIOs should establish a TBM office comprised of a program director and any TBM analysts and administrator resources needed for modeling, reporting, and metrics. The Commission recommends that agency CIOs establish a TBM office with three roles: a TBM
administrator, a TBM analyst, and a TBM program director. This TBM office may be a new, stand-alone
Recommendation 14. Agency CIOs should clarify which IT personnel are accountable for TBM metrics, and ensure those personnel are trained on how to use and improve them. What sets TBM apart from other IT financial disciplines is it empowers managers who are responsible for
discrete sections of IT (e.g., infrastructure, applications, services) to make value-based decisions about
cost that, like ripples in a pond, can have far-reaching effects. Because of this, these individuals should
also be considered and treated like the key stakeholders they are.
With the TBM taxonomy and model, agency CIOs will generate more meaningful reports and metrics for
managing cost and value tradeoffs. In particular, the agency will create new TCO, consumption, and
performance metrics for IT towers and sub-towers, as well as new benchmark comparisons. When used
properly, these metrics help agency CIOs review their annual budget submissions for cost effectiveness,
set annual targets for improvement, and manage improvements over time. This only works if their people
are held accountable for using them.
The Commission recommends that agency CIOs clarify who is accountable for each key metric and ensure
they know how to use and influence them. These roles may be located across the Agencies and mission
areas. Since TBM is adopted from the top down, it is important to open lines of communication early
regarding the program's existence and its goals with leaders in each of these areas.
Based on lessons from the commercial sector, the following roles are often responsible for TBM metrics.
Their equivalents should be considered by agency CIOs.
IT Tower Owners
IT tower owners (those who are responsible for servers, storage, networking, application development,
security, compliance, etc.) are specialists who have insights into the inner workings of IT delivery. TBM
empowers them with the information they need to spot trends that can negatively and positively affect
spending and, therefore, outcomes. They should be held accountable for tower TCO, meet or beat unit
cost and operational level agreement (OLA) targets, and execute against project plans and metrics, among
other measures.
Application and/or Service Owners
Application and service owners decide the quality and quantity of infrastructure needed for what they
deliver. Because of this they are in a good position to spot variances, underutilized applications and
infrastructure, and they can drive conversations around cost-for-performance tradeoffs with their
business-side counterparts in order to ameliorate these situations. They should be held accountable for
application TCO, meet or beat unit cost and service level agreement (SLA) targets, and execute against
Since service owners often operate at arm’s length from their business partners, much like a vendor-
customer relationship, they rely on BRMs to understand the business partner, anticipate their needs, and
position solutions to meet those needs. The BRM also works with business partners and service owners
to define and deliver the right services, create service packages (i.e., different service levels), establish
service level agreements (SLAs) and so on. They should be responsible for communicating the
consumption and cost of IT services and applications and help their agency consumers make more
informed decisions to optimize efficiency.
Service Portfolio Managers
Service portfolio managers work with service owners and business relationship managers to manage the
service portfolio. Together, they set the services strategy to support the agency’s missions and objectives.
Service portfolio managers also define the key performance indicators by which service performance is
measured.
************
Regular interaction with this group (and others as they are designated) is crucial to keeping the program
on track and generating results. As success leads to success, and as these individuals become intimately
familiar with the workings of TBM, our experience has shown they will, of their own volition, ferret out
waste and inefficiency to provide significant immediate savings and improve the cost-for-performance
ratios so important to the value conversations that form the core of TBM.
Other stakeholders are also important to the TBM process, including:
External stakeholders such as the President of the United States, Congress, the Inspector General,
the OMB, and the public
Internal stakeholders such as mission owners and users, Office of the CIO staff, and other
department and agency staff
Lateral stakeholders, especially other agency CIOs
These parties should be recognized, included, and consulted using TBM metrics where appropriate so that
technology decisions are not made independent of mission area and Agency goals.
Recommendation 15. Agency CIOs should develop and implement a stakeholder rollout and end-user training program. One of the most difficult parts of TBM is the cultural shift needed to hold application and service owners
accountable for the total cost of ownership of the application or service they manage. This is
fundamentally different from a cash-based appropriation view of accountability. Just as when private-
sector companies make the shift to managing TCO, agencies will also need a plan to educate the
appropriate stakeholders to this new way of viewing cost.
The Commission recommends delivering stakeholder education that is role-based, focusing on the specific
questions and needs relevant to the different decision-maker needs. In role-based training, consider the
processes needed, such as quarterly business reviews, monthly operating reviews, or monthly budget
variance reviews. Each will require specific facts, which can be covered through role-based training.
Recommendation 16. Agency CIOs should implement and monitor key business processes that occur on a regular basis including month-end close, data quality reporting, monthly operating reviews, and quarterly business reviews. TBM is only as effective as the processes it implements or supports. Formalizing those processes (i.e.,
making them routine and repeatable) will help agency CIOs standardize reviews and analysis, ensure
better accuracy and timeliness of the information, identify and resolve issues in a more timely fashion,
and ease the burden of performing those processes on a regular basis.
The Commission recommends that agency CIOs establish (or update) and monitor key TBM business
processes. These include two types: those processes that are a core part of TBM and those that are
augmented with TBM. The former are new to an enterprise that is adopting TBM but are few in number.
Processes being augmented should already exist but may include new elements or involve different
people because of TBM.
Core processes that are introduced with TBM include:
A TBM month end close that consists of importing updated data sets, performing initial reviews
with IT finance and data owners, resolving any data quality problems, and producing the
necessary reports for distribution;
Producing a monthly or quarterly bill of IT for distribution to application owners, line-of-business
leaders, and other stakeholders;
Performing ad hoc analysis at the request of decision makers in IT, finance, or even the lines of
business;
Setting service rates (prices), usually on an annual basis (during annual planning) or semi-annually
or quarterly; and
Monthly or quarterly data quality reviews, focused on identifying data deficiencies and managing
improvements against plan.
TBM augments many other processes that agency CIOs (and CFOs) may already have in place, such as:
Monthly budget variance analysis by IT finance, cost center owners, and tower/app/service
owners. In many cases, having tower, app, and service owners review their variances is only
possible with TBM, so this is a new process for those functions;
Monthly operational reviews by tower, app, and service owners that incorporates financial
reviews against budget and targets (e.g., unit cost targets, SLA attainment, etc.);
Vendor performance reviews including financial reviews against vendor-related targets such as
unit costs, consumption of vendor services, and spend by vendor categories;
Capacity planning and procurement processes to ensure that capacity costs are properly
considered and to evaluate options such as public cloud services;
Problem management procedures whereby analysts consider the cost impact of problems that
are causing incidents and tickets;
Service portfolio management including the definition, analysis, and approval of the services in
all stages (e.g., pipeline, catalogue, retired, etc.);
Demand management including the use of incentive-based rates (prices) and the use of
packaging; and
Asset and configuration management incorporating data quality metrics from TBM along with
asset-related financial metrics.
The list could go on. What is most important is to ensure the core TBM processes are implemented,
managed and governed, measured, monitored, and improved over time. The non-core processes should
be implemented or augmented with TBM based on the goals agency CIOs set for their organizations.
Recommendation 17. Agency CIOs should remain active sponsors of the TBM program to ensure continuous improvement and that program leaders have their support to overcome roadblocks. Successful TBM programs start with executive sponsorship. Due to the strategic nature of TBM and its
impact on incentives and a decision-making model, executive sponsorship is essential for TBM success.
The Commission recommends that agency CIOs remain the executive sponsors of the TBM program.
Furthermore, sponsorship should not be in name only. Agency CIOs (or a direct report designee) should
engage with the team on a regular basis to ensure progress is being made and milestones are reached.
The importance of executive sponsorship to governance cannot be overstated. Without it, people will pay
scant attention to the numbers and analysis provided by TBM. They will not act on financial information
because it has not become a normal part of their job. They will not help improve the data needed for TBM,
because they fear transparency into what they are doing or are embarrassed by the poor quality of their
Proper sponsorship lights the TBM fire under the feet of a team, and it uses both carrots and sticks to
ensure progress moves forward.
Recommendation 18. Agency CIOs should take measures to ensure trust in their TBM model and financial reporting. When implementing a TBM program, CIOs should not underestimate the importance of trust. TBM
depends on an organizational change — roles, responsibilities, accountability — so trust is essential for
not only driving adoption of the model by IT and other stakeholders but also for building commitment to
the program.
The Commission recommends agency CIOs take active measures to build trust in their TBM model and the
associated financial reports. The following measures should be considered:
Beta test any new model or major model changes with a trusted partner (e.g., agency leader or
manager). When the beta is successful, employ the trusted partner to help articulate the benefits
of the model to others in the agency.
Prove the TBM model accounts for every dollar — for every dollar in, there is a dollar out.
Explain how the majority of costs are allocated through a short, plain-language document.
Illustrate allocations with a simple conceptual model. This also comes in handy with auditors who
need to review or test the allocations.
Ensure stakeholders understand how costs are allocated, how to interpret the reports, and what
changes they are allowed to make to the reports and to the process, such as modifying the
taxonomy to better reflect non-IT-centric mission-area terminology. Resolve any concerns or
objections they have.
Provide drill downs in TBM reporting. Empower report consumers to see what makes up unit costs
so they can verify them.
In building better trust in the TBM model, agency CIOs will find less resistance in driving better outcomes.
In addition, their people will make decisions faster by taking less time to debate or assess the accuracy of
the information they are using.
Functional Capabilities Employing the TBM taxonomy and modeling IT costs is not possible without the necessary tools and
capabilities. Indeed, TBM was born out of other data-driven disciplines by marrying financial, operational,
and business data using tools that were often familiar in business intelligence and data analytics circles.
The difference is that TBM was built on top of a standard taxonomy and with standard metrics, processes,
The following recommendations describe many of the functional requirements that agency CIOs should
consider. These requirements are tool-agnostic, but they are generally impractical without software and
automation. Each agency CIO should consider the degree of automation that they need to cost-effectively
adopt the TBM taxonomy, model their IT costs accordingly, and generate the metrics they need to manage
cost and value.
Recommendation 19. Agency CIOs should implement a TBM system that is capable of serving the requirements for data integration, scalability, cost and resource modeling, reporting and analytics, and security. Many CIOs have recognized that they are like the cobbler whose children have no shoes. They have built,
supported, and maintained business management systems for their business partners without having one
for their own people. As a result, their ability to measure, optimize, and communicate value for the money
spent on IT has been difficult or impossible.
Agency CIOs must address this shortcoming. The Commission recommends that agency CIOs implement
a system that provides for the necessary transparency using the TBM taxonomy. There are many options
from which they can choose for their TBM system. These include everything from spreadsheets and
business intelligence software to custom developed software and purpose-built packages. But all options
should be considered in the context of key system requirements. Below are several key requirements to
consider.
Cost and Resource Modeling: The system must be able to create, support, and process the TBM
model (or models), including the allocation of numerical data using other tables, lists, or rule sets
as weighting criteria that sit at the core of the TBM model.
Scalability and Performance: Since the TBM model and the amount of data that agency CIOs will
use are likely to be both very large and complex, the TBM system must scale to meet the task,
including both the ability to process large, data-driven models and to provide responsive, real-
time analytics and reporting.
Data Integration and Quality: The system must be able to extract, transform, and load data from
other tools, automatically. The system must work well with imperfect data and provide methods
for measuring and improving data quality. It should support upgrades to datasets as source data
matures or reporting needs evolve, so agencies can integrate new data without a significant
amount of rework.
Reporting and Dashboarding: The system must provide the reports, metrics, dashboards, and
analyses that agency decision makers need. Since agencies cannot predict all of their reporting
needs, the ability for report consumers to access and manipulate data and create their own
Real-Time Analytics: The TBM system must enable decision makers to interact with the data and
reports. Users such as financial planners, technology owners, architects, and application owners
will have complex, multi-dimensional questions. Commonly, those decision makers need to
explore the data in order to answer questions.
Security: The system must be secure and meet federal security and privacy requirements. TBM
models often integrate a lot of sensitive data, such as asset lists, payroll data, 6 transaction
volumes and more. When sensitive fields are not needed, they should be excluded from the
system. Since sensitive data is often required in the model, TBM systems depend on effective
security, including user authentication, role-based access controls, and the ability to redact
sensitive information within reports.
Fortunately, the need to build these systems in-house is no longer necessary, as there are commercial
versions of enterprise-class software readily available in the marketplace today.
Recommendation 20. Agency CIOs should implement a TBM model that allows for the costing of both commodity IT products and the more mission-specific IT products and services. Especially in public-sector environments, CIOs are often responsible for delivering and supporting
technologies that are outside of the realm of traditional IT departments. For example, they may support
emergency management systems such as two-way radios or air traffic control systems such as radar
control. These will have implications for the TBM taxonomy, including IT towers (the standard taxonomy
does not include radios under end user, for example) and applications and services (the taxonomy does
not include Common Support Services for Weather, for example). Fortunately, the TBM taxonomy was
designed to be extensible.
The Commission recommends that Agency CIOs implement a TBM model that allows for the costing of
both commodity IT products (e.g., server computing, storage, networking, end-user computing, DBMS,
email/messaging) and the more mission-specific IT products and services (i.e., business applications and
mission-specific systems). This may affect the tools or approaches chosen to support the TBM model, so
these considerations should be made and evaluated when sourcing any new products.
6 Average pay rates are normally used instead of actuals in order to protect specific employee salaries.
However, even names, rates, and other figures are sensitive and must be protected.
Recommendation 21. Agency CIOs should implement regular data quality reporting and use the data to continuously mature and enhance the data used for modeling, reporting, and decision making. Obtaining good data is the most common roadblock to building a good TBM model. Missing or low-quality
data can impede accurate allocations, degrade reporting, and impair trust in the model. For this reason,
the Commission recommends that agency CIOs implement regular data quality reporting and continuously
improve their data to enhance decision making over time.
TBM leaders often struggle with a variety of data quality challenges. They often have trouble getting good
data in a timely manner. This is often true when they first create their model or change it. After they have
sourced new data for the first time, that process is often easily repeated. In contrast, getting complete
datasets7 with referential integrity tends to be a more persistent problem. To address these challenges,
agencies should apply a four-step approach:
1. Use tools to transform and clean data of obvious errors and inconsistencies. Tools may be able
to correct things like improper formatting without requiring data source fixes. This process often
will address a large portion of errors.
2. Use the model and benchmarking to help identify errors. Load the data into the model and use
(or create) reports to reveal how much of the costs cannot be allocated due to referential integrity
issues and gaps in the data. (The right system will provide for data quality reporting.) Also,
compare the costs to industry benchmarks; major differences are often caused by gaps in the
underlying data.
3. Fill gaps by using generalized allocation rules. For example, if the data allows a TBM analyst to
accurately allocate 80 percent of a cost pool, they can then spread the remaining 20 percent using
weights inferred from the allocated amounts.
4. Fix source data quality problems over time by working with data source owners. This process
should include not only one-time fixes but also setting standards and procedures to prevent data
quality problems from recurring.
Taking these steps to address data quality challenges depends on the TBM system and its processes. Still,
agencies must start with the data they have and then work toward gathering (or creating) better data
over time. Agency CIOs will never have perfect data, but the very act of modeling and using data will lead
to better data — and greater decision-making power — over time.
7 Referential integrity is essential for using data to drive allocations.
Because the taxonomy enables IT and financial leaders to “bucket” infrastructure, applications, and
services into standard categories, it enables discussion of these buckets in terms that make sense — and
matter — to business leaders.
The TBM taxonomy is not theoretical; IT cost and resource models based on the TBM taxonomy have been
deployed at hundreds of enterprises, including companies as diverse as ExxonMobil, eBay, Nationwide
Building Society (UK), and the State of Washington. And because the taxonomy is aligned with the
categories and costing methods used by the leading IT benchmarking firms, the TBM taxonomy facilitates
apples-to-apples comparisons to industry peers.
The following sections describe and define the finance and IT layers of the TBM taxonomy. These layers
are largely generic from one agency to another, although extensions may be made (e.g., adding a tower
for Air Traffic Control Systems). The business layer is not defined here,
Finance Layer: Cost Pool and Sub-Pool Definitions Cost pools are low-level categories that are often aligned easily to general ledger accounts. Not only do
pools make cost allocations easier, they enhance reporting because they can be traced through the model
to reveal the composition of costs. For example, app TCO can be broken down into hardware, software,
internal and external labor, outside services, facilities, and telecom costs.
The following tables define the cost pools and sub-pools in the federal TBM taxonomy. These include both
Cost Pool Cost Sub-Pool Description Hardware Expense Hardware expense of non-capitalized purchases (e.g. spare parts,
consumables or equipment below capitalization threshold). Lease Hardware lease expenditures (e.g. hardware purchased through a
supplier or financial services leasing arrangement). Maintenance & Support
Hardware maintenance and support expenditures.
Depreciation & Amortization
Hardware depreciation of capitalized purchases.
Software Expense Software expense of non-capitalized software purchases. Lease Software lease expenditures. Maintenance & Support
Software maintenance and support expenditures.
Depreciation & Amortization
Software depreciation of capitalized software license purchases & software development efforts.
Facilities and Power
Expense Data center space, power, security and other operating expenses (e.g. co-location facility services, electricity, water, etc.)
Lease Data center lease expenditures. Maintenance & Support
Data center maintenance & support expenditures.
Depreciation & Amortization
Data center depreciation of facility build and leasehold improvements (e.g. raised floor investments, power/PDU infrastructure, rack build-out).
Telecom Expense Voice and data network connectivity expenses including circuit and usage expenditures.
Lease Telecom lease expenditures. Maintenance & Support
Telecom maintenance & support expenditures.
Depreciation & Amortization
Depreciation/amortization of any capitalized telecom expenditures; typically, this will show up under Hardware or Facilities depreciations/amortization
Other Other Miscellaneous or non-standard expenses.
Capital Expenditures (CapEx) Internal Labor Capital Capitalized labor (internal employees) External Labor
Capital Capitalized labor (external contractors)
Hardware Capital Capitalized hardware expenditures Software Capital Capitalized software expenditures Outside Services
“infrastructure and operations group” may directly provide these Platform Services to their
customers.
There are two other standard types of services that are user-facing for which the specific services are not
defined in this report. Instead, the Commission expects each agency and/or a broader standards body
(e.g., a government-wide TBM governance board) to define them. These two types are:
Agency Application Services are delivered by IT to enable constituent focused capabilities that
enable the agency to serve its constituents.
Shared Application Services are delivered by IT to enable internally focused capabilities to
automate and support the organization’s internal operations.
Note that many services can be delivered using traditional delivery models (e.g., on-premises data
centers) or via different federal cloud delivery models (i.e., Public Cloud, Government Community Cloud,
Secret Enclave Cloud and Private Cloud). These are not specifically reflected in the taxonomy categories
below as they can apply to many types of services. Furthermore, the standard cloud service models (i.e.,
Infrastructure as a Service, Platform as a Service, Software as a Service) are not included specifically.
However, federal agency TBM models should incorporate those models as classifications (e.g., labels or
metadata) where needed for reporting and decision making.
Category Name Description
Type: End User Services Client Computing BYOD Activation A set of services that enable users to bring in their own
personal computing devices (laptop, tablet, smartphone) and connect to the agency's network to access business applications, information and other technology resources.
Desktop A selection of personal computers or workstations used at a desk or office and not typically moved. May be dedicated to an individual or shared as in a public location or kiosk. Each type may be ordered with additional memory and storage. Standard corporate image will be loaded on each device. Requestor may order optional software through the Content Authoring services. Includes network and remote network access. Standard support package including security, back-up, updates and patches, remote access, centralized help desk.
Category Name Description Mobile A selection of laptop or tablet configurations. Each type may
be ordered with additional memory and storage. Standard corporate image will be loaded on each device. Requestor may order optional software through the Content Authoring services. Includes network and remote network access. Standard support package including security, back-up, updates and patches, remote access, centralized help desk.
Virtual Client The virtualization of desktop and application software enables PC and tablet functionality to be separate from the physical device used to access those functions – whether a fixed or mobile workspace environment. Virtual Workspaces may have different, pre-configured packages of software application and enable access from multiple devices. Advanced desktop management provides higher levels of flexibility, security, backup and disaster recover capabilities.
Communication & Collaboration
Collaboration A selection of collaborative software offerings that enable people to work together to achieve common goals across locations and time zones.
Communication Communication represents a broad set of integrated or individual services that enable users to communicate with other users, partners or customers. This communication may occur via electronic mail, calendaring, messaging, audio conferencing, video conferencing and direct voice calls. More robust, unified messaging provides file transfer, embedded images, clickable hyperlinks, Voice over IP (VoIP) and video chat.
Print A variety of peripheral devices that enable the distribution of information. Specialized devices may offer one or all of these services - print, copy, fax. Printing output creates a “hard copy” of digital documents, presentations, spreadsheets, etc. Scan inputs a hardcopy document into a digital format for a computer to use.
Productivity End user application software enabling the creation and distribution of information in a variety of formats including: documents, presentations, spreadsheet, databases, desktop publishing, web design, graphics and image editing, audio/video editing and CD/DVD recording.
Category Name Description Connectivity Network Access A set of connection services which enable users to access a
private or public network from their client computing device. Once connected, as part of the network they can access business applications and information; and can communicate and collaborate with other users on the network.
Remote Access A set of connection services which enable users to access the agency’s internal private network from their client computing device when away from the corporate facilities. Once connected, the user can access the agency’s business applications and information.
Type: Delivery Services
Development Services
Business Solution Consulting
Business solutions consulting services help the enterprise improve their performance, primarily through the analysis of existing business problems and development of plans for improvement. This may include business process analysis as well as technology selection.
Design & Development
Design and Development services provide the planning, design, programming, documenting, testing, and fixing involved in creating and maintaining a software product.
Program & Project Management
Program Management is the process of managing several related projects, often with the intention of improving an organization's performance. Project Management services initiate, plan, execute, control, and close the work of a team to achieve specific goals and meet specific success criteria. A project is a temporary endeavor designed to produce a unique product, service or result with a defined beginning and end (usually time-constrained, and often constrained by funding or deliverables) undertaken to meet unique goals and objectives, typically to bring about beneficial change or added value.
System Integration
Development services that link together different computing systems and software applications physically or functionally, to act as a coordinated whole. This can be accomplished across systems that reside within the enterprise's data centers as well as with SaaS services that reside in the provider's facilities.
Category Name Description Testing Testing services execute a program or application with the
intent of finding errors or other defects. The investigations are conducted to provide stakeholders with information about the quality of the product or service and allow the business to understand the risks of software implementation. Testing may take multiple forms including functional, system, integration, performance and usability.
Operations Services
Compliance IT Compliance services set policy, establish controls and measuring compliance to relevant legal and compliance requirements.
Configuration
Deployment Includes the release management and software distribution services to deploy new and/or the most recent software version to the host servers or client computing devices.
Disaster Recovery
IT Disaster Recovery sets DR policy, establishes processes & procedures, may offer shared or dedicated failover facilities, and perform DR testing.
IT Service Management
IT Service Management refers to the incident, problem and change management services necessary for IT to plan, deliver, operate and control the IT services offered to its customers.
Monitoring Service to monitor resources and applications. Service that records API calls and delivers logs and insights.
Security IT Security services which set security policy, establish process & controls, monitor compliance to security controls, and respond to security breaches. It includes the protection of information systems from theft or damage of the hardware, the software and the information on them, as well as from disruption or misdirection.
Usage Analytics Services that provide log data consolidation, reporting and analysis to enable IT administrators and security personnel to understand asset utilization, user logins, and information access.
Category Name Description Support Services Application
Support Application Support services provide the ongoing operational activities required to keep the application or service up and running, provide Tier 2 and Tier 3 technical support to more complex or difficulty user questions and requests. Application Support may also include minor the development and validation of smaller application enhancements (e.g. minor changes, new reports).
Central Print Central Print services provide high-volume and advanced printing for invoices, product literature or other complex documents for mass distribution. Additional post-print services may include folding, envelope stuffing, postage and bundling to expedite distribution.
Identity & Access Management
Services related to authentication and authorization. This includes identity, access, key and directory services
IT Training IT Training provides educational services to the agency's users on how the access and effectively use the agency's business application services, as well as common productivity software and tools.
Service Desk Service Desk provides a single point of contact to meet the communication needs of both users and the IT organization. Help Desk services provide end users with information and support related to IT products and services, usually to troubleshoot problems or provide guidance about products such as computers, electronic equipment, or software. Help desk support may be delivered through various channels such as phone, website, instant messaging, or email.
Type: Infrastructure Services
Compute Services
Compute on Demand
Offer transient compute services that are executed automatically, either on a schedule or triggered by a pre-define event or set of events.
Mainframe Offer transactional and batch oriented compute services supported by a mainframe infrastructure.
Offer a variety of compute configurations comprised of physical servers. These are typically distributed compute services based on the Windows or Linux operating systems for pre-defined configurations of memory, CPU and storage. Standard operational support includes security hardening, backup, updates, patches, and centralized monitoring.
Provision on Demand
Offer a variety of shared compute configurations (typically virtual servers), similar to Shared Compute, but available to be provisioned (and de-provisioned) on-demand manner based on user interaction or the performance of an application itself.
Virtual Compute Offer a variety of compute configurations delivered through the virtualization of physical compute resources. These virtual instances are typically running Windows or Linux operating systems and have pre-defined configurations of virtually allocated memory, CPU and storage. Standard operational support includes security hardening, back-up, updates and patches and centralized monitoring.
Data Center Services
Enterprise Data Center Service
Purpose-built facilities to securely house computer equipment providing physical security, clean & redundant power, data connectivity and environmental controls – temperature, humidity, fire suppression.
Other Data Center Services
Other data center services that may be delivered through rooms or telco closets with a facility.
Network Services
Domain Name Service (DNS)
DNS services provide lookup capabilities to convert domain names (e.g. www.acme.com) into the associated IP address to enable communication between hosts.
Internet Telecommunication services using the public internet to enable communications across the agency including its data centers, office buildings, remote locations, partners and service providers. Virtual Private Networks may be created to limit access and provide security.
Load Balancing Offer ability to optimize incoming application/workload requests through load balancing and traffic management to deliver high availability and network performance to applications.
Category Name Description Virtual Private Network (VPN)
VPN services offer a secure method to authenticate users and enable access to corporate systems and information. VPN can also isolated and secure environments in the data center across physical and virtual machines and applications.
Data Network A selection of network connection offerings that enable direct data communications across the agency including its data centers, office buildings, remote locations as well as partners and service providers (including public cloud service providers) without traversing the public internet. Typically provides a greater level of performance, security and control.
Voice Network Telecommunication offerings based on legacy voice circuits to deliver "plain old telephone service" and other advanced features including 800-services, automatic call distribution, etc.
Storage Services File Storage Secure and Durable Object Storage where an object can be unstructured data such as documents and media files or structured data like tables.
Offline Backup Secure, durable and extremely low-cost storage for data archiving using offline storage media like tape.
Online Backup Secure, durable and extremely low-cost storage for data archiving
Transactional Storage
Storage services that hold and information for application programs and code.
Type: Platform Services
Analytic Services Big Data Service to process vast amounts of data including big data use cases, including log analysis, web indexing, data warehousing, machine learning, financial analysis, scientific simulation, and bioinformatics.
Data Pipeline A set of data analytic services that automate the movement and transformation of data.
Data Visualization
Software services to communicate information clearly and efficiently to users via graphs, charts and other visual representations. These data visualization services are able to front-end large amounts of data provided by Big Data solutions, Data Warehouses and other data sources.
Data Warehouse Service supporting a central repository or set of repositories of integrated data from one or more disparate sources.
Service that enables IT consumers to easily build, deploy, and share predictive analytics solutions.
Stream Analytics Service to process and analyze real-time streaming data by providing low latency, highly available, scalable complex event processing over streaming data in the cloud.
Application Services
Application Hosting
Fully managed application and web hosting services including the general computing server, database server, web and application server services.
Notification A subscribe and publish service for enterprise and mobile messaging.
Service Bus Service that processes events to stream to multiple applications.
Web Services Standalone Web Service and App Service platform services.
Data Services Database A relational database service for applications to access transactional data.
Distributed Cache
An in-memory cache service that helps improve web application performance.
NoSQL A no-sql database service for applications that need consistent, low-latency scaled out document/key-value store models.
Search A keyword search service for web and mobile applications.
Media/Content Delivery Services
Distributed Storage
A content delivery web service for high-bandwidth content.
Live Streaming Services that deliver live and on-demand media streams.
Appendix B: Additional TBM Metrics for Federal Agencies This appendix provides the list of metrics made possible by employing the TBM taxonomy and TBM model.
This first set of recommended metrics, for early phase adoption, represents those that can be
implemented with a minimum set of data and process maturity. The second set of metrics are more
appropriate for the next level of maturity. Furthermore, the metrics align with the TBM taxonomy layers:
Cost Pool/Sub-Pool
IT Tower and Sub-Tower
Applications & Services
Business Units
In addition, industry benchmarks are available for all metrics shown below, so agency CIOs can use them
to compare their own cost and performance with private- and public-sector peers.
TBM Metrics for Early Phase Adoption # TBM Taxonomy Layer Views/Scope Metric 1 IT Tower/Sub-Tower IT Towers, High Level
Metrics, All Total IT Personnel Count (All towers)
2 IT Tower/Sub-Tower IT Towers, High Level Metrics, All
IT Employee Count (All towers)
3 IT Tower/Sub-Tower IT Towers, High Level Metrics, All
IT Contractor Count (All towers)
4 IT Tower/Sub-Tower IT Towers, High Level Metrics, All
Number of users served
5 IT Tower/Sub-Tower IT Towers, High Level Metrics, All
Percentage of Spend on Compute
6 IT Tower/Sub-Tower IT Towers, High Level Metrics, All
Percentage of Spend on Storage
7 IT Tower/Sub-Tower IT Towers, High Level Metrics, All
Percentage of Spend on Network
8 IT Tower/Sub-Tower IT Towers, High Level Metrics, All
Percentage of Spend on Data Center
9 IT Tower/Sub-Tower IT Towers, High Level Metrics, All
Percentage of Spend on Communications (Telecoms)
10 IT Tower/Sub-Tower IT Towers, High Level Metrics, All
Percentage of Spend on End User
11 IT Tower/Sub-Tower IT Towers, High Level Metrics, All
Percentage of Spend on Output
12 IT Tower/Sub-Tower IT Towers, High Level Metrics, All
# TBM Taxonomy Layer Views/Scope Metric 36 IT Tower/Sub-Tower IT Towers, Distributed
Compute, Servers Number of processors per physical server
37 IT Tower/Sub-Tower IT Towers, Distributed Compute, Servers
Number of Processor Cores per physical server
38 IT Tower/Sub-Tower IT Towers, Distributed Compute, Servers
Availability (%) during planned uptime
39 IT Tower/Sub-Tower IT Towers, Distributed Compute, Servers
Total annual cost of Servers per physical server
40 IT Tower/Sub-Tower IT Towers, Distributed Compute, Servers
Total annual cost of Servers per logical server
41 IT Tower/Sub-Tower IT Towers, Distributed Compute, Servers
Number of physical servers per FTE for Servers
42 IT Tower/Sub-Tower IT Towers, Distributed Compute, Servers
Number of logical servers per FTE for Server
43 IT Tower/Sub-Tower IT Towers, End User, All Workspace Percentage of EU Cost 44 IT Tower/Sub-Tower IT Towers, End User, All Mobile Device Percentage of EU Cost 45 IT Tower/Sub-Tower IT Towers, End User, All Field Support Percentage of EU Cost 46 IT Tower/Sub-Tower IT Towers, End User, All Virtualized Desktop Percentage of EU
Cost 47 IT Tower/Sub-Tower IT Towers, End User, All Collaboration Applications Percentage
of EU Cost 48 IT Tower/Sub-Tower IT Towers, End User, All Email Percentage of EU Cost 49 IT Tower/Sub-Tower IT Towers, End User, All Conferencing & A/V percentage of EU
Cost 50 IT Tower/Sub-Tower IT Towers, End User, All Total annual cost of End User
Computing, per workstation (PC, Laptop and Thin Clients)
51 IT Tower/Sub-Tower IT Towers, End User, All Total annual cost of End User Computing, per EUC device
52 IT Tower/Sub-Tower IT Towers, End User, All Number of EUC devices per FTE 53 IT Tower/Sub-Tower IT Towers, End User, All Devices (PCs, Laptops, Smartphone,
Thin Clients etc) percentage of EU Cost 54 IT Tower/Sub-Tower IT Towers, End User, All Support (Backup/Restore,
Moves/Adds/Changes, Office App Support) percentage of EU Cost
55 IT Tower/Sub-Tower IT Towers, End User, All End User (Office, Collaboration) percentage of EU Cost
56 IT Tower/Sub-Tower IT Towers, End User, All Desktop Printing percentage of EU Cost 57 IT Tower/Sub-Tower IT Towers, End User, All Other (Planning & Design, Training,
Infrastructure Server Admin, Overheads) percentage of EU Cost
58 IT Tower/Sub-Tower IT Towers, End User, Workspace
Hardware Percent of Workspace Cost
59 IT Tower/Sub-Tower IT Towers, End User, Workspace
Software Percent of Workspace Cost
60 IT Tower/Sub-Tower IT Towers, End User, Workspace
# TBM Taxonomy Layer Views/Scope Metric 61 IT Tower/Sub-Tower IT Towers, End User,
Workspace External Labor Percent of Workspace Cost
62 IT Tower/Sub-Tower IT Towers, End User, Workspace
Outside Services Percent of Workspace Cost
63 IT Tower/Sub-Tower IT Towers, End User, Workspace
Other Costs Percentage of Workspace Cost
64 IT Tower/Sub-Tower IT Towers, End User, Workspace
Number Desktop PCs
65 IT Tower/Sub-Tower IT Towers, End User, Workspace
Number Laptop PCs
66 IT Tower/Sub-Tower IT Towers, End User, Workspace
Number Desktop PCs/per EUC User
67 IT Tower/Sub-Tower IT Towers, End User, Workspace
Number Laptop PCs/per EUC User
68 IT Tower/Sub-Tower IT Towers, End User, Mobile Devices
Hardware Percent of Mobile Devices Cost
69 IT Tower/Sub-Tower IT Towers, End User, Mobile Devices
Software Percent of Mobile Devices Cost
70 IT Tower/Sub-Tower IT Towers, End User, Mobile Devices
Internal Labor Percent of Mobile Devices Cost
71 IT Tower/Sub-Tower IT Towers, End User, Mobile Devices
External Labor Percent of Mobile Devices Cost
72 IT Tower/Sub-Tower IT Towers, End User, Mobile Devices
Number of Smartphones
73 IT Tower/Sub-Tower IT Towers, End User, Mobile Devices
Number of Tablets
74 IT Tower/Sub-Tower IT Towers, End User, Mobile Devices
Number of Mobile Devices per Mobile Device FTE
75 IT Tower/Sub-Tower IT Towers, End User, Field Support
Internal Labor Percent of Field Support Cost
76 IT Tower/Sub-Tower IT Towers, End User, Field Support
External Labor Percent of Field Support Cost
77 IT Tower/Sub-Tower IT Towers, End User, Field Support
Outside Services Percent of Field Support Cost
78 IT Tower/Sub-Tower IT Towers, End User, Virtualized Desktop
Hardware Percent of Virtualized Desktop Cost
79 IT Tower/Sub-Tower IT Towers, End User, Virtualized Desktop
Software Percent of Virtualized Desktop Cost
80 IT Tower/Sub-Tower IT Towers, End User, Virtualized Desktop
Outside Services Percent of Virtualized Desktop Cost
81 IT Tower/Sub-Tower IT Towers, End User, Virtualized Desktop
Number of Virtualized Desktops
82 IT Tower/Sub-Tower IT Towers, End User, Email Employee Percentage of Email Cost 83 IT Tower/Sub-Tower IT Towers, End User, Email Contractor Percentage of Email Cost 84 IT Tower/Sub-Tower IT Towers, End User, Email Software Percentage of Email Cost 85 IT Tower/Sub-Tower IT Towers, End User, Email Services Percentage of Email Cost
# TBM Taxonomy Layer Views/Scope Metric 86 IT Tower/Sub-Tower IT Towers, End User, End
User Software Employee Percentage of End User Software Cost
87 IT Tower/Sub-Tower IT Towers, End User, End User Software
Contractor Percentage of End User Software Cost
88 IT Tower/Sub-Tower IT Towers, End User, End User Software
Software Percentage of End User Software Cost
89 IT Tower/Sub-Tower IT Towers, End User, End User Software
Services Percentage of End User Software Cost
90 IT Tower/Sub-Tower IT Towers, End User, Conferencing & A/V
Employee Percentage of Conferencing & A/V Cost
91 IT Tower/Sub-Tower IT Towers, End User, Conferencing & A/V
Contractor Percentage of Conferencing & A/V Cost
92 IT Tower/Sub-Tower IT Towers, End User, Conferencing & A/V
Hardware Percentage of Conferencing & A/V Cost
93 IT Tower/Sub-Tower IT Towers, End User, Conferencing & A/V
Services Percentage of Conferencing & A/V Cost
94 IT Tower/Sub-Tower IT Towers, End User, Service Desk
Employee Percentage of Service Desk Cost
95 IT Tower/Sub-Tower IT Towers, End User, Service Desk
Contractor Percentage of Service Desk Cost
96 IT Tower/Sub-Tower IT Towers, End User, Service Desk
Hardware Percentage of Service Desk Cost
97 IT Tower/Sub-Tower IT Towers, End User, Service Desk
Software Percentage of Service Desk Cost
98 IT Tower/Sub-Tower IT Towers, End User, Service Desk
Services Percentage of Service Desk Cost
99 IT Tower/Sub-Tower IT Towers, End User, Service Desk
Other Costs Percentage of Service Desk Cost
100 IT Tower/Sub-Tower IT Towers, End User, Service Desk
Annual Service Desk cost per Service Desk user
101 IT Tower/Sub-Tower IT Towers, End User, Service Desk
Annual Service Desk cost per Service Desk contact
102 IT Tower/Sub-Tower IT Towers, End User, Service Desk
Number of Service Desk Contacts per Week
103 IT Tower/Sub-Tower IT Towers, End User, Service Desk
Number of Service Desk users
104 IT Tower/Sub-Tower IT Towers, End User, Service Desk
Service Desk Contacts per FTE
105 IT Tower/Sub-Tower IT Towers, Storage, All Employee Percentage of Storage Cost 106 IT Tower/Sub-Tower IT Towers, Storage, All Contractor Percentage of Storage Cost 107 IT Tower/Sub-Tower IT Towers, Storage, All Hardware Percentage of Storage Cost 108 IT Tower/Sub-Tower IT Towers, Storage, All Software Percentage of Storage Cost 109 IT Tower/Sub-Tower IT Towers, Storage, All Services Percentage of Storage Cost 110 IT Tower/Sub-Tower IT Towers, Storage, All Supplies Percentage of Storage Cost 111 IT Tower/Sub-Tower IT Towers, Storage, All Other Costs Percentage of Storage Cost 112 IT Tower/Sub-Tower IT Towers, Storage, All Total annual cost for Storage per
113 IT Tower/Sub-Tower IT Towers, Storage, All Total annual cost of Virtual Tape per TB of data stored on Virtual Tape
114 IT Tower/Sub-Tower IT Towers, Storage, All Total annual cost of Automatic Tape Library per TB of data stored on Automatic Tape Library
115 IT Tower/Sub-Tower IT Towers, Storage, All Total TB installed Disk (including DR) 116 IT Tower/Sub-Tower IT Towers, Storage, All Total TB addressable Disk (including
DR) 117 IT Tower/Sub-Tower IT Towers, Storage, All Total TB for Automatic Tape 118 IT Tower/Sub-Tower IT Towers, Storage, All Total TB for Virtual Tape (including DR) 119 IT Tower/Sub-Tower IT Towers, Storage, All Total TB of installed Disk for Virtual
Tape 120 IT Tower/Sub-Tower IT Towers, Storage, All Addressable TB of Disk per FTE 121 IT Tower/Sub-Tower IT Towers, Network, Data Data Percentage of Network Cost 122 IT Tower/Sub-Tower IT Towers, Network, Data Annual cost of Data per user 123 IT Tower/Sub-Tower IT Towers, Network, Data Thousands of Data (LAN, WAN) Devices
per Data FTE 124 IT Tower/Sub-Tower IT Towers, Network, All Employee Percentage of Network Cost 125 IT Tower/Sub-Tower IT Towers, Network, All Contractor Percentage of Network Cost 126 IT Tower/Sub-Tower IT Towers, Network, All Hardware Percentage of Network Cost 127 IT Tower/Sub-Tower IT Towers, Network, All Software Percentage of Network Cost 128 IT Tower/Sub-Tower IT Towers, Network, All Services Percentage of Network Cost 129 IT Tower/Sub-Tower IT Towers, Network, All Other Costs Percentage of Network
Cost 130 IT Tower/Sub-Tower IT Towers, Network, All LAN/WLAN Percentage of Network
Cost 131 IT Tower/Sub-Tower IT Towers, Network, All WAN Percentage of Network Cost 132 IT Tower/Sub-Tower IT Towers, Network, All Voice Percentage of Network Cost 133 IT Tower/Sub-Tower IT Towers, Network, All Other Network Services (security etc)
Percentage of Network Cost 134 IT Tower/Sub-Tower IT Towers, Network, WAN Annual cost of WAN per connected
device 135 IT Tower/Sub-Tower IT Towers, Network, LAN Annual cost of LAN per LAN port 136 IT Tower/Sub-Tower IT Towers, Network, Voice Annual cost of Voice per Handset 137 IT Tower/Sub-Tower IT Towers, Network, WAN Number of WAN devices 138 IT Tower/Sub-Tower IT Towers, Network, LAN Number of LAN ports 139 IT Tower/Sub-Tower IT Towers, Network, Voice Number of Handsets 140 IT Tower/Sub-Tower IT Towers, Network, Voice Number of VoIP handsets 141 IT Tower/Sub-Tower IT Towers, Network, WAN Thousands of Connected Devices per
WAN FTE 142 IT Tower/Sub-Tower IT Towers, Network, LAN Thousands of LAN Ports per LAN FTE 143 IT Tower/Sub-Tower IT Towers, Network, Voice Thousands of Handsets per Voice FTE
# TBM Taxonomy Layer Views/Scope Metric 144 IT Tower/Sub-Tower IT Towers, Communications,
All Telecom Cost of Communications Cost
145 IT Tower/Sub-Tower IT Towers, Communications, All
Number of users served
146 IT Tower/Sub-Tower IT Towers, Communications, All
Annual cost of Communications per user
147 IT Tower/Sub-Tower IT Towers, Output, All Hardware Percent of Output Cost 148 IT Tower/Sub-Tower IT Towers, Output, All Software Percent of Output Cost 149 IT Tower/Sub-Tower IT Towers, Output, All Internal Labor Percent of Output Cost 150 IT Tower/Sub-Tower IT Towers, Output, All External Labor Percent of Output Cost 151 IT Tower/Sub-Tower IT Towers, Output, All Outside Services Percent of Output
Cost 152 IT Tower/Sub-Tower IT Towers, Output, All Supplies Percent of Output Cost 153 IT Tower/Sub-Tower IT Towers, Output, All Central Print Percent of Output Cost 154 IT Tower/Sub-Tower IT Towers, Output, All Post Processing Percent of Output Cost 155 IT Tower/Sub-Tower IT Towers, Output, All Millions of images processed per
month 156 IT Tower/Sub-Tower IT Towers, Output, All Annual cost of Output per million
images 157 IT Tower/Sub-Tower IT Towers, Output, All Number of FTEs for Output per million
images 158 IT Tower/Sub-Tower IT Towers, Management
Services, All Employee Percentage of Management Services Cost
159 IT Tower/Sub-Tower IT Towers, Management Services, All
Contractor Percentage of Management Services Cost
160 IT Tower/Sub-Tower IT Towers, Management Services, All
Hardware Percentage of Management Services Cost
161 IT Tower/Sub-Tower IT Towers, Management Services, All
Software Percentage of Management Services Cost
162 IT Tower/Sub-Tower IT Towers, Management Services, All
Services Percentage of Management Services Cost
163 IT Tower/Sub-Tower IT Towers, Management Services, All
Other Costs Percentage of Management Services Cost
164 IT Tower/Sub-Tower IT Towers, Management Services, All
Total annual cost of Management Services per user
165 IT Tower/Sub-Tower IT Towers, Management Services, All
Number of FTEs for Management Services per thousand users
TBM Metrics for Later Phase Adoption # TBM Taxonomy Layer Views/Scope Metric 1 Business Units Business Unit Total Spend 2 Business Units Business Unit Total Run Spend 3 Business Units Business Unit Total Change Spend 4 Business Units BU, Business Unit Portfolio
View % of IT Spend
5 Business Units BU, Individual Business Unit % of IT spend 6 Business Units BU, Individual Business Unit % change in spend, year-over-year 7 Business Units BU, Individual Business Unit % spend by service 8 Business Units BU, Individual Business Unit IT spend per person 9 Applications & Services Services, Service Portfolio Total Spend
10 Applications & Services Services, Service Portfolio Service Run Spend 11 Applications & Services Services, Service Portfolio Service Dev Spend 12 Applications & Services Services, Service Portfolio # Services, % Change YTD 13 Applications & Services Services, Service Portfolio % by Compute Virtualization Profile 14 Applications & Services Services, Service Portfolio % by Compute Environment 15 Applications & Services Services, Service Portfolio % by Storage Tier 16 Applications & Services Services, Service Portfolio % by Storage Environment 17 Applications & Services Services, Service Portfolio % by Service Desk Ticket Type 18 Applications & Services Services, Service Portfolio % by Service Desk Ticket Severity 19 Applications & Services Services, Individual Service Total Spend 20 Applications & Services Services, Individual Service,
Service Run Spend By IT Tower & IT Sub-Tower
21 Applications & Services Services, Individual Service, Service Run Spend
By Cost Pool & Cost Sub-Pool
22 Applications & Services Services, Individual Service, Service Run Spend
Servers: By Virtualization Profile, By Class, By Environment, By Platform, By Location
23 Applications & Services Services, Individual Service, Service Run Spend
Storage: By Tier, By Environment, By Platform, By Location
24 Applications & Services Services, Individual Service, Service Run Spend
Service Desk Tickets: By Category, By Impact, By Location
25 Applications & Services Applications Average Unit Costs 26 Applications & Services Applications, Application
37 Applications & Services Applications, Individual Application, App Run Spend
App Run Spend By IT Tower & IT Sub-Tower
38 Applications & Services Applications, Individual Application, App Run Spend
By Cost Pool & Cost Sub-Pool - benchmarkable
39 Applications & Services Applications, Individual Application, App Run Spend
Servers: By Virtualization Profile, By Class, By Environment, By Platform, By Location
40 Applications & Services Applications, Individual Application, App Run Spend
Storage: By Tier, By Environment, By Platform, By Location
41 Applications & Services Applications, Individual Application, App Run Spend
Service Desk Tickets: By Category, By Impact, By Location
42 IT Tower/Sub-Tower IT Towers Total Spend IT Tower 43 IT Tower/Sub-Tower IT Towers Total Spend IT Sub-Tower 44 IT Tower/Sub-Tower IT Towers Unit Quantities 45 IT Tower/Sub-Tower IT Towers Average Unit Costs 46 IT Tower/Sub-Tower IT Towers % Volume Change 47 IT Tower/Sub-Tower IT Towers % Unit Cost Change 48 IT Tower/Sub-Tower Public Cloud Total Spend 49 IT Tower/Sub-Tower Public Cloud Total Volumes 50 IT Tower/Sub-Tower Public Cloud Average Unit Costs 51 IT Tower/Sub-Tower Public Cloud % Public Cloud Spend 52 IT Tower/Sub-Tower Public Cloud % Change Public Cloud Spend 53 Cost Pool/Sub-Pool Labor Total Spend 54 Cost Pool/Sub-Pool Labor Headcount 55 Cost Pool/Sub-Pool Labor Labor Cost as % of IT Spend 56 Cost Pool/Sub-Pool Labor % Internal vs. External