Page 1 of 32 Forest Reference Emission Levels (FRELs) for the Federal Republic of Nigeria: A Jurisdictional Approach focused on Cross River State Federal Republic of Nigeria Federal Department of Forestry Federal Ministry of Environment Federal Republic of Nigeria January 2018
Transcript
Page 1 of 32
Forest Reference Emission Levels (FRELs) for the Federal Republic of Nigeria: A Jurisdictional Approach focused on Cross River State
Federal Republic of Nigeria
Federal Department of Forestry Federal Ministry of Environment
Federal Republic of Nigeria
January 2018
Page 2 of 32
CONTACT INFORMATION
National Coordinator, Nigeria REDD+ Programme
Federal Department of Forestry, Federal Ministry of Environment
Plot 393/394, Augustus Aikhomu way, Utako District, Abuja, Nigeria.
Contents List of Figures ................................................................................................................................................ 4
List of Tables ................................................................................................................................................. 4
List of Acronyms ............................................................................................................................................ 4
7. Transparent, complete, consistent and accurate information .............................................................. 19
7.1. Transparent information .................................................................................................................. 19
7.2. Complete information ...................................................................................................................... 19
7.3. Consistent information .................................................................................................................... 19
7.4. Accurate information ....................................................................................................................... 19
7.4.1 Accuracy of the estimated activity data .................................................................................... 19
7.4.2. Uncertainty of the estimated emission factor .......................................................................... 20
8. FREL/FRL Construction ............................................................................................................................ 20
8.1. Reference Period .............................................................................................................................. 20
8.2. Average Method .............................................................................................................................. 20
9. Areas for future improvement [still to be developed]............................................................................ 21
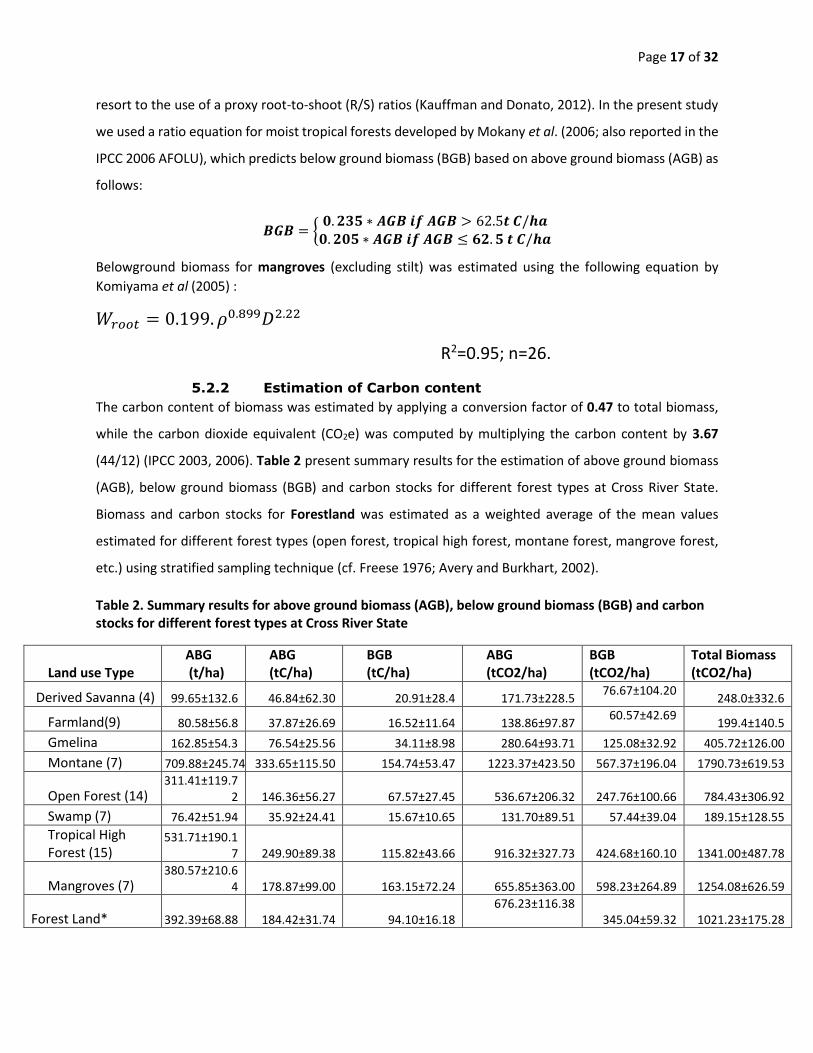
*Forest Land values were calculated as a weighted average of the means from the different forest type
estimates.
6. Forest Definition
When submitting a FRELs/FRLs to the United Nations Framework Convention on Climate Change
(UNFCCC), countries are expected to provide a definition of what they mean by forest in their FREL/FRL
construction and, demonstrate how the definition is in line with the definition used in the national GHG
inventory or in other international reporting. Forest definition in the context of REDD+ has to take into
account UNFCCC thresholds which are currently defined as follows:
- Minimum tree crown cover between 10 and 30%
- Minimum land area between 0.05 and 1 hectare
- Minimum tree height between 2 and 5 meters (at maturity in situ)
Hitherto, Nigeria had not got a forest definition, but had been using the FAO FRA definition as follows:
“Land spanning more than 0.5 hectares with trees higher than 5 meters and a canopy cover of more than
10 percent or trees able to reach these thresholds in situ. It does not include land that is predominantly
under agricultural or urban land use”.
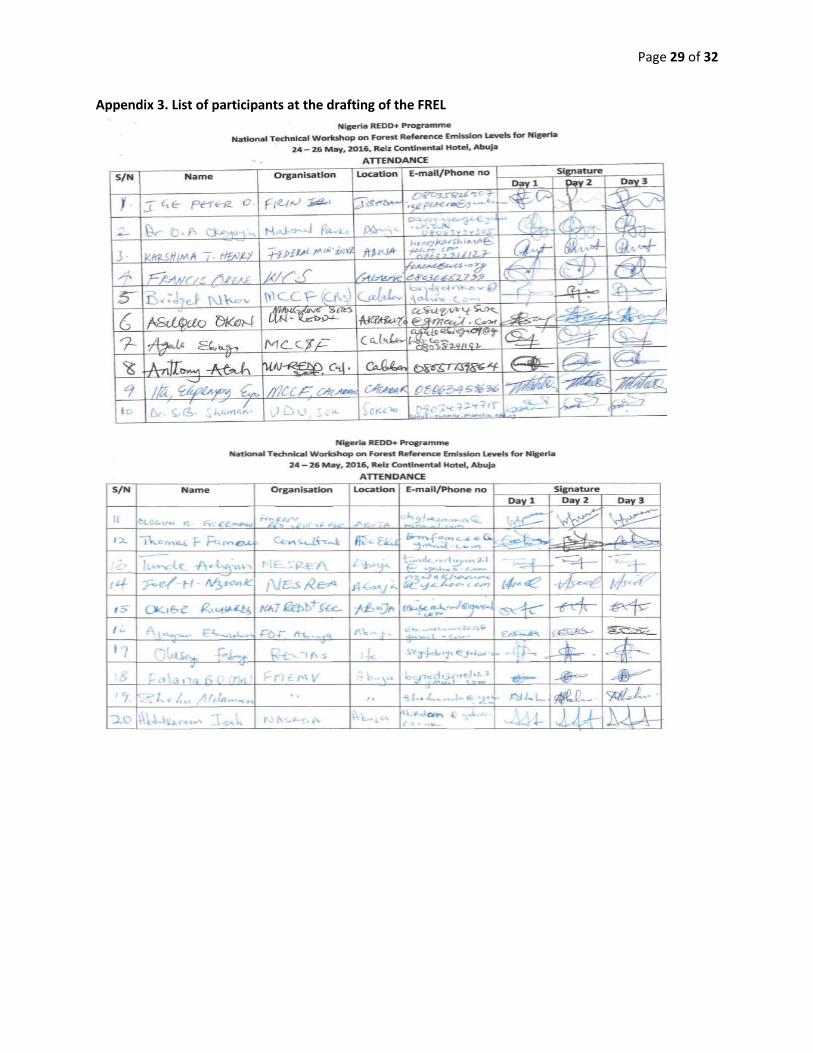
During the workshop of 24th to 26th May 2016, participants went through brain storming sessions in order
to craft a forest definition for FREL purposes. An initial stage involved an appraisal of existing definitions
and/or descriptions of forest in the forest laws, policies and Acts and other documents. After general
heated discussions, a technical working group was tasked to work on the draft version (see Appendix 5).
They explored and reviewed some policy documents, at Federal and State levels, in order to have an in-
depth understanding of what the law and policies documents consider as forest across the different
States. Based on the above background information, participants arrived at the following functional forest
definition for FREL/FRL in Nigeria.
An ecological community predominated by trees and other layers of woody plants with a minimum area
of 0.5ha, a minimum tree height of 3metres, and a minimum tree canopy cover of 15%, or stands with
potentials to reach the above thresholds in situ.
Page 19 of 32
7. Transparent, complete, consistent and accurate information
7.1. Transparent information
During the development of the FREL document, all processes followed and methodologies used for the
estimation of activity data and emission factors were documented in a transparent manner. Some
information is provided in the appendices to this document. All maps used for estimating activity data
have been referenced, and both metadata and spatial datasets are available in a spatial database. Also for
the estimation of emission factors, based on forest inventory data, all calculations have been done in a
transparent manner. The spreadsheets are available, and some detail results have been included in the
Appendix to this document.
7.2. Complete information
Annex I in Decision 12/CP.17 indicates that complete information means information provided that allows
for the reconstruction of forest reference emission levels and/or forest reference levels. All information
used in the context of the construction of the present FREL has been developed by Nigeria, and allows for
the reconstruction of the FREL and is publicly available. Nigeria also ascertains that all information used
for the construction of Nigeria’s FREL will be uploaded to the website and is available for download.
7.3. Consistent information
Consistency with the national greenhouse gas inventory paragraph 8 in Decision 12/CP.17 establishes that
FRELs and/or FRLs shall maintain consistency with anthropogenic forest related greenhouse gas emissions
by sources and removals by sinks as contained in the country’s national greenhouse gas inventory.
Compared to the second National GHG Inventory submitted by Nigeria in its Second National
Communication, there was no clear forest definition used.
7.4. Accurate information
7.4.1 Accuracy of the estimated activity data
The qualitative assessment of land use maps for the years 2014 produced from the spatially explicit study
by NASRDA (2015) was done. Same process was repeated for Hansen maps for the purpose of comparison.
The results of the comparative analysis informed the decision to opt for Hansen datasets for the creation
of new change layer through direct change assessment using FAO-SEPAL platform at FAO Rome. Reference
data were generated by Nigeria REDD+ technical team for the accuracy assessment using NASRDA and
Hansen maps stratifications. (Appendix 1)
Page 20 of 32
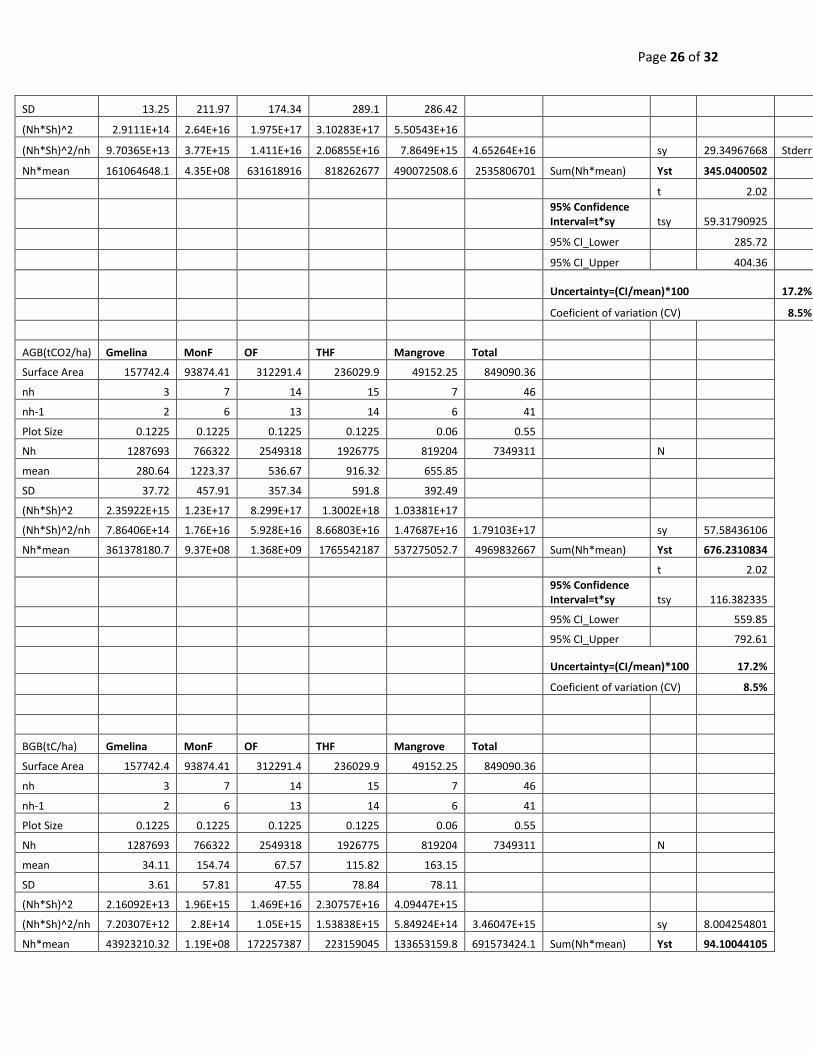
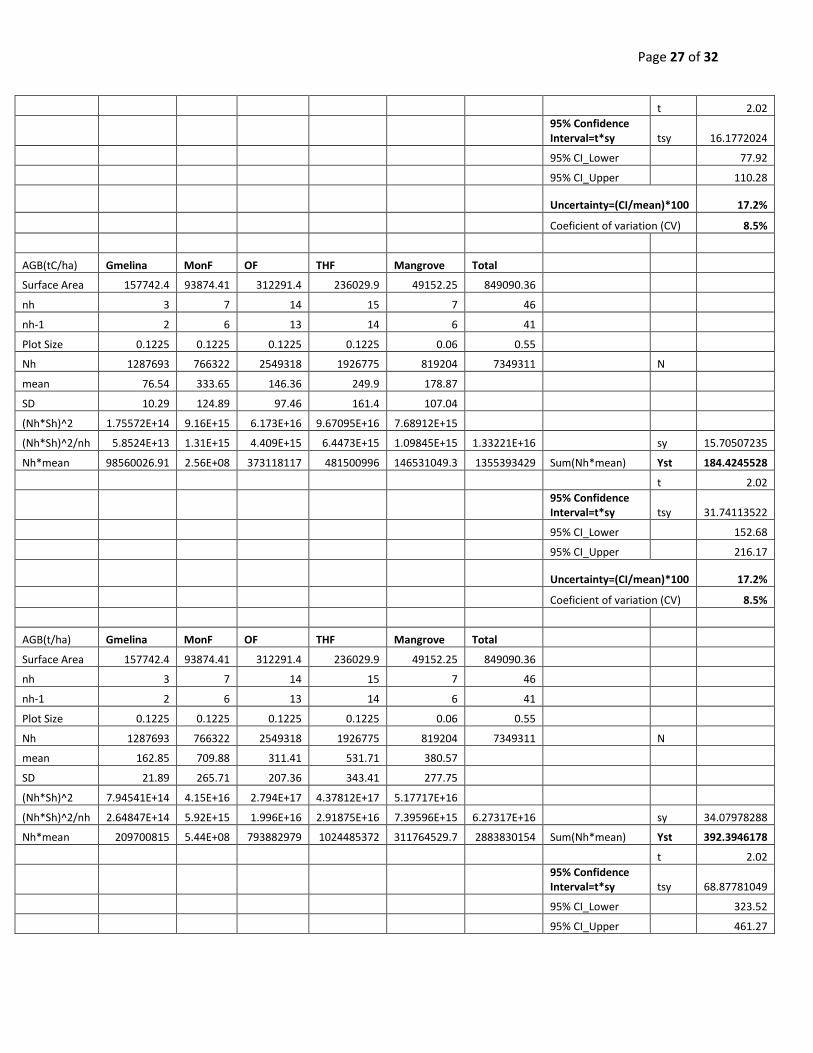
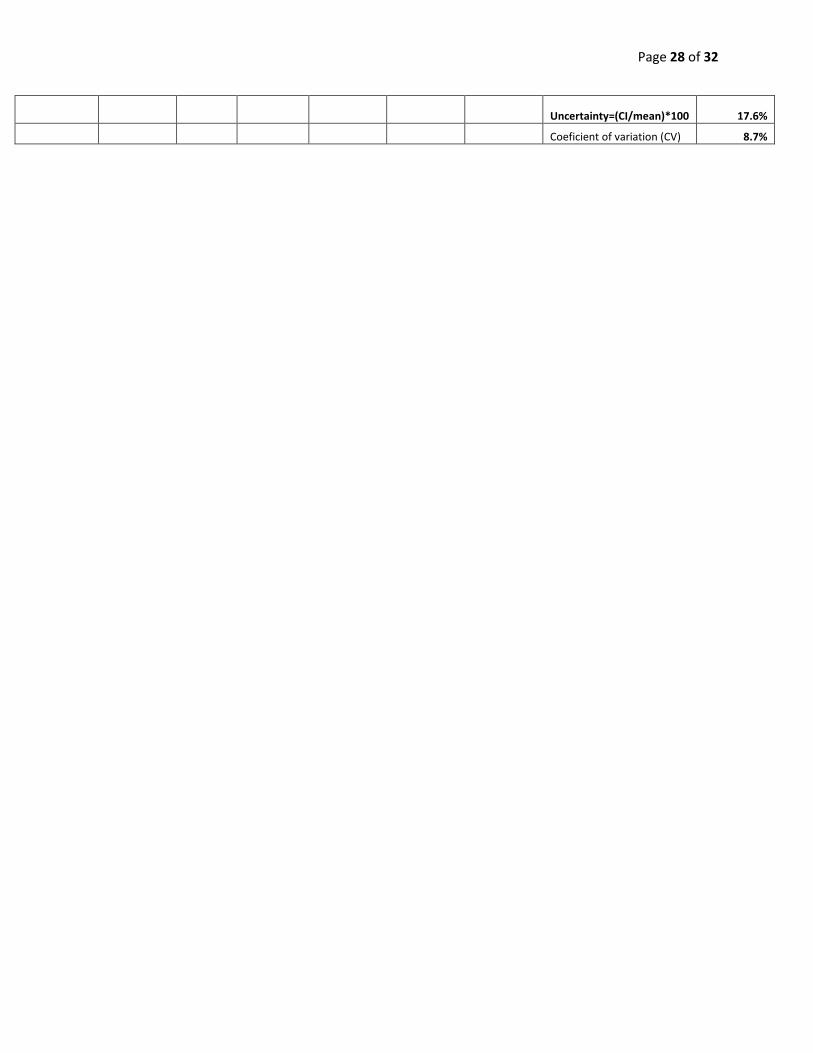
7.4.2. Uncertainty of the estimated emission factor
The estimation of emission factors is associated to many sources of uncertainty, including the use of
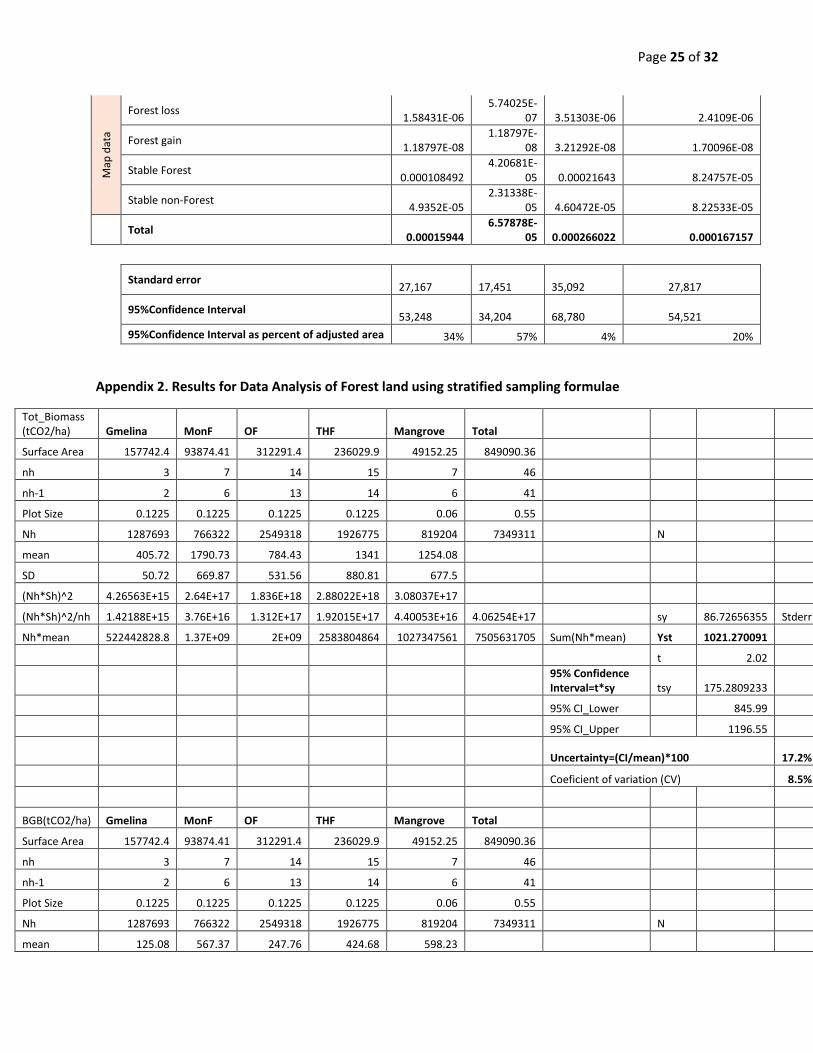
default values, sampling errors and bias from field measurements, etc. All biomass estimates (Table 2)
from the inventory were reported with 95% uncertainty values associated with the estimates (Appendix
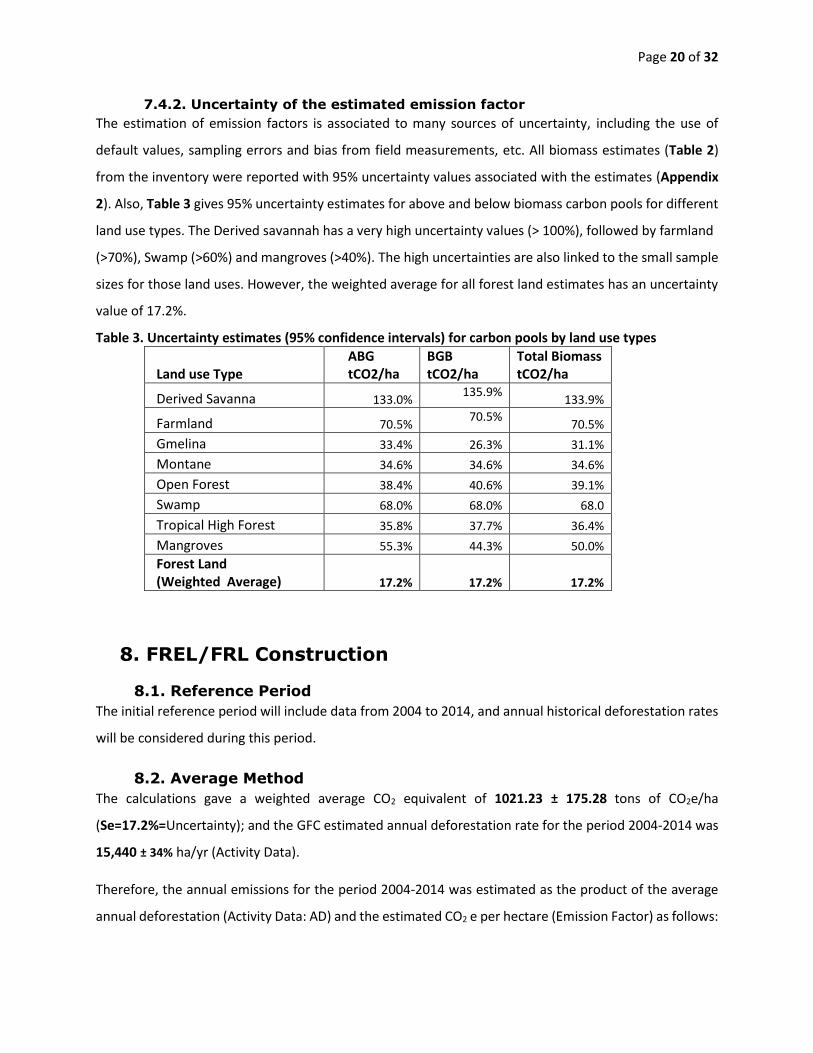
2). Also, Table 3 gives 95% uncertainty estimates for above and below biomass carbon pools for different
land use types. The Derived savannah has a very high uncertainty values (> 100%), followed by farmland
(>70%), Swamp (>60%) and mangroves (>40%). The high uncertainties are also linked to the small sample
sizes for those land uses. However, the weighted average for all forest land estimates has an uncertainty
value of 17.2%.
Table 3. Uncertainty estimates (95% confidence intervals) for carbon pools by land use types
Land use Type ABG tCO2/ha
BGB tCO2/ha
Total Biomass tCO2/ha
Derived Savanna 133.0% 135.9%
133.9%
Farmland 70.5% 70.5%
70.5%
Gmelina 33.4% 26.3% 31.1%
Montane 34.6% 34.6% 34.6%
Open Forest 38.4% 40.6% 39.1%
Swamp 68.0% 68.0% 68.0
Tropical High Forest 35.8% 37.7% 36.4%
Mangroves 55.3% 44.3% 50.0%
Forest Land (Weighted Average) 17.2% 17.2% 17.2%
8. FREL/FRL Construction
8.1. Reference Period
The initial reference period will include data from 2004 to 2014, and annual historical deforestation rates
will be considered during this period.
8.2. Average Method
The calculations gave a weighted average CO2 equivalent of 1021.23 ± 175.28 tons of CO2e/ha
(Se=17.2%=Uncertainty); and the GFC estimated annual deforestation rate for the period 2004-2014 was
15,440 ± 34% ha/yr (Activity Data).
Therefore, the annual emissions for the period 2004-2014 was estimated as the product of the average
annual deforestation (Activity Data: AD) and the estimated CO2 e per hectare (Emission Factor) as follows:
Page 21 of 32
Annual Emissions [Total Biomass] = AD x EF = (15,440 x 1021.23 = 15,677,791.2± tons CO2e/; and the 95%
confidence interval is [10,347,342.2 or 21,008,240.2] tons CO2e/year.
9. Areas for future improvement The initial inventory was deigned to collect data for standing live and dead trees as well as lying deadwood.
Data was collected for deadwood, unfortunately the decomposition classes for standing deadwood were
not noted, so the data could not be analysed, and has been left out in the present FREL submission.
As an improvement, future work will include the deadwood carbon pool, for example, in the ongoing FCPF
project, FAO is supporting Nigeria to undertake a forest carbon inventory at National Level in order to up-
scale the present sub-national FREL, measures will be put in place to ensure the best data is collected.
Furthermore, height measurements during the study were ocularly appreciated, so were not used as
inputs into the biomass estimation allometric equation. During the on-going study, laser dendrometers
(TruPulse 200B) will be used to measure tree height in the field.
Checking the quality of reference data for the estimation of Activity Data is another area for future
improvement. By this, we intend to adopt a third-party interpretation of the reference data where
disagreements between two first-hand interpreters to further validate and improve accuracy of the data.
Furthermore, we will also want to stratify the Activity Data in the future by forest type.
Page 22 of 32
10. References Ajonia G.N. 2008. Inventory and Modelling Mangrove Forest Stand Dynamics following different
levels of wood exploitation pressures in the Douala-Edea Atlantic Coast of Cameroon. PhD Thesis. Albert-Ludwig-Univers sitat Freiburg im Breisgau, Germany.
Alemayehu, F., Richard O., Mwangi J. K., and Wasonga O. 2014. Assessment of Mangrove Covers Change
and Biomass in Mida Creek, Kenya. Open Journal of Forestry, 2014, 4, 398-413
Avery, T.E. and Burkhart, H. 2002 Forest Measurements. Mcgraw-Hill Ryerson, pp. 1 –480.
Chao K-J, Phillips O.L., and Baker T.R. 2008. Wood density and stocks of coarse woody debris in a northwestern Amazonian landscape.
Chave, J., Andalo, C., Brown, S., Cairns, M.A., Chambers, J.Q., Eamus, D., Fölster, H., Fromard, F., Higuchi, N., Kira, T. et al. 2005. Tree allometry and improved estimation of carbon stocks and balance in tropical forests. Oecologia 145 : 87-99.
Chave, J., Réjou-Méchain, M., Búrquez, A., et al., 2014. Improved allometric models to estimate the
aboveground biomass of tropical trees. Glob. Change Biol. 20, 3177–3190. Feldpausch, T.R., Lloyd, J., Lewis, S.L., Brienen, R.J.W. et al. 2012. Tree height integrated into
pantropical forest biomass estimates. Biogeosciences 9, 3381–3403. Freese F. 1976. Elementary Forest Sampling. Agriculture Handbook No. 232. U.S. Department of
Agriculture. Southern Forest Experiment Station, Forest Service. USA. 95 Pages.
Hansen M. C., Potapov P. V., et al., Moore R., 2013. High-Resolution Global Maps of 21st-Century
Forest Cover Change. Department of Geographical Sciences, University of Maryland, College
Park, MD 20742, USA. Google, Mountain View, CA, USA. IPCC 2006, 2006 IPCC Guidelines for National Greenhouse Gas Inventories, Prepared by the National
Greenhouse Gas Inventories Programme, Eggleston H.S., Buendia L., Miwa K., Ngara T. and Tanabe K. (eds). Published: IGES, Japan.
Kauffman J.B. and Donato D.C. 2012. Protocols for the measurement, monitoring and reporting of structure, biomass and carbon stocks in mangrove forests. Working Paper 86, CIFOR, Bogor, Indonesia. 50 pages.
Komiyama, A., Poungparn, S., Kato, S. 2005 Common allometric equations for estimating the tree weight of mangroves. Journal of Tropical Ecology 21: 471-477.
Komiyama, A., Ong, J.E., Poungparn, S. 2008 Allometry, biomass, and productivity of mangrove forests: A review. Aquatic Botany 89: 128-137.
Mokany, K., Raison, R.J., Prokushkin, A.S., 2006. Critical analysis of root: shoot ratios in terrestrial
biomes. Global Change Biol. 12, 84–96.
Olofsson P., Giles M. Foody, et al., 2014. Good practices for estimating area and assessing accuracy of
land change
Page 23 of 32
Zanne, A.E., Lopez-Gonzalez, G., Coomes, D.A., Ilic, J., Jansen, S., Lewis, S.L., Miller, R. B., Swenson, N.G., Wiemann, M.C., Chave, J., 2009. Towards a worldwide wood economics spectrum.
Page 24 of 32
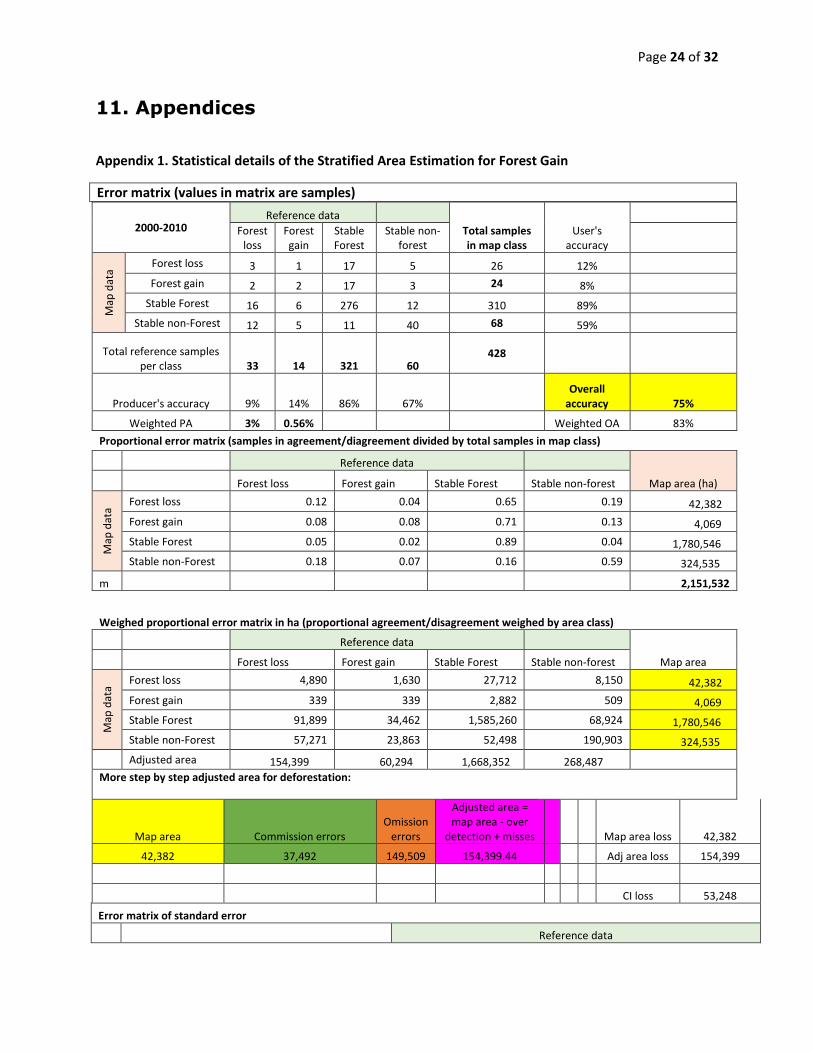
11. Appendices
Appendix 1. Statistical details of the Stratified Area Estimation for Forest Gain
Error matrix (values in matrix are samples)
2000-2010 Reference data
Total samples in map class
User's accuracy
Forest
loss Forest gain
Stable Forest
Stable non-forest
Map
dat
a
Forest loss 3 1 17 5 26 12%
Forest gain 2 2 17 3 24 8%
Stable Forest 16 6 276 12 310 89%
Stable non-Forest 12 5 11 40 68 59%
Total reference samples per class 33 14 321 60
428
Producer's accuracy 9% 14% 86% 67%
Overall accuracy 75%
Weighted PA 3% 0.56% Weighted OA 83%
Proportional error matrix (samples in agreement/diagreement divided by total samples in map class)
Reference data
Map area (ha) Forest loss Forest gain Stable Forest Stable non-forest
Map
dat
a
Forest loss 0.12 0.04 0.65 0.19 42,382
Forest gain 0.08 0.08 0.71 0.13 4,069
Stable Forest 0.05 0.02 0.89 0.04 1,780,546
Stable non-Forest 0.18 0.07 0.16 0.59 324,535
m 2,151,532
Weighed proportional error matrix in ha (proportional agreement/disagreement weighed by area class)
Reference data
Map area Forest loss Forest gain Stable Forest Stable non-forest