FEDERAL RESERVE BULLETIN OCTOBER, 1930 ISSUED BY THE FEDERAL RESERVE BOARD AT WASHINGTON Credit Conditions and the Marketing of Crops Change in Reserve Calculation Annual Report of Bank of Greece UNITED STATES GOVERNMENT PRINTING OFFICE WASHINGTON : 1930 Digitized for FRASER http://fraser.stlouisfed.org/ Federal Reserve Bank of St. Louis
Transcript
FEDERAL RESERVEBULLETIN
OCTOBER, 1930
ISSUED BY THE
FEDERAL RESERVE BOARDAT WASHINGTON
Credit Conditions and the Marketing of CropsChange in Reserve CalculationAnnual Report of Bank of Greece
UNITED STATES
GOVERNMENT PRINTING OFFICE
WASHINGTON : 1930
Digitized for FRASER http://fraser.stlouisfed.org/ Federal Reserve Bank of St. Louis
FEDERAL RESERVE BOARD
Ex officio members:A. W. MELLON,
Secretary of the Treasury, Chairman.
J. W. POLE,Comptroller of the Currency.
EUGENE MEYER, Governor.1 Vice Governor.
ADOLPH C. MILLER.CHARLES S. HAMLIN.GEORQE R. JAMES.EDWARD H. CUNNINGHAM.
WALTER L. EDDY, Secretary.E. M. MCCLELLAND, Assistant Secretary.J. C. NOELL, Assistant Secretary,W. M. IMLAY, Fiscal Agent.
Chief, Division of Examination, and Chief FederalReserve Examiner.
WALTER WYATT, General Counsel.
E. A. GOLDENWEISER, Director, Division of Researchand Statistics.
CARL E. PARRY, Assistant Director, Division of Researchand Statistics.
E. L. SMEAD, Chief, Division of Bank Operations*
FEDERAL ADVISORY COUNCIL
District No. 1 (BOSTON) . HERBERT K. HALLETT.District No. 2 (NEW YORK) WM. C. POTTER.District No, 3 (PHILADELPHIA) HOWARD A. LOEB.District No. 4 (CLEVELAND) . HARRIS CREECH.District No. 5 (RICHMOND) JOHN POOLE.District No. 6 (ATLANTA) J. P. BUTLER, Jr.District No. 7 (CHICAGO) MELVIN A. TRAYLOR.District No. 8 (ST. LOUIS) W. W. SMITH, Vice President.District No. 9 (MINNEAPOLIS) GEO. H. PRINCE.District No. 10 (KANSAS CITY) W. S. MCLUCAS.District No. 11 (DALLAS) B. A. MCKINNBY, President.District No. 12 (SAN FRANCISCO) x F. L. LIPMAN.
WALTER LICHTENSTEIN, Secretary.n
Digitized for FRASER http://fraser.stlouisfed.org/ Federal Reserve Bank of St. Louis
OFFICERS OF FEDERAL RESERVE BANKS
Federal Reserve Bank of— Chairman Governor Deputy governor Cashier
BostonNew York..
Frederic H. Curtiss.J. H. Case
Roy A. Young.Qeo. L. Harrison-
Philadelphia..
Cleveland
Richmond
Atlanta
Chicago
R. L. Austin
George DeCamp.
Wm. W. Hoxton
Oscar Newton...
Wm. A. Heath...
St. Louis. John S. Wood-
Minneapolis...
Kansas City..,
Dallas........
San Francisco.
John R. Mitchell __
M. L. McClure
C. C. Walsh
Isaac B. Newton
Geo. W. Norris
E. R. Fancher
George J. Seay
Eugene R. Black
J. B. McDougal
Wm. McC. Martin.
W. B. Geery
W. J. Bailey
Lynn P. Talley.
Jno. U. Calkins.,
W. W. PaddockW. R. BurgessJ. E. CraneA. W. GilbartE. R. KenzelWalter S. LoganL. R. RoundsL. F. SailerWm. H. Hutt
M. J. FlemingFrank J. Zurlinden..C. A. PepleR. H. BroaddusHugh FosterCreed TaylorC. R. McKayJohn H. BlairJ. H. Dillard
O. M. Attebery
Harry YaegerH. I. ZiemerC. A. Worthington.J. W. HelmR. R. GilbertR. B. ColemanWm. A. DayTra Clerk
W. Willett.C. H. Coe.1Ray M. Gidney »J. W. Jones.iW. B. Matteson.iJ. M. Rice.iAllan Sproul.i
C. A. Mcllhenny.W. G. McCreedj .2H. F. Strater.
Geo. H. Keesee.John S. Walden. jr.2M. W. Bell.
W. C. Bach man. 1D. A. Jones.i0. J. Netterstrom 1E. A. Delaney.iS. F. Gilmore.2A. H. Haill 2F. N. Hall.2G. O. Hollocher 2C. A. Schacht.2H. I. Ziemer.Frank C. Dunlop 2J. W. Helm.
Fred Harris.W. O. Ford.iWm. M. Hale.
1 Assistant deputy governor. Controller.
MANAGING DIRECTORS OF BRANCHES OF FEDERAL RESERVE BANKS
St. Louis:Louisville branchMemphis branch*.Little Rock branch
Managing director
R. M. O'Hara.
C. F. McComba.J. C. Nevin.
A. H. Dudley.Hugh Leach.
*Marcus Walker.W. S. McLarin, Jr.A. E. Walker.J. B. Fort, jr.
W. R. Cation.
W. P. Kincheloe.W. H. Glasgow.A. F. Bailey.
Federal Reserve Bank of—
Minneapolis:Helena branch
Kansas City:Omaha branch.. . . . .Denver branchOklahoma City branch
Dallas:El Paso branchHouston branchSan Antonio branch
San Francisco:Los Angeles branchPortland branchSalt Lake City branchSeattle branch.Spokane branch...
Managing director
R. E. Towle.
L. H. Earhart.J. E. Olson.C. E. Daniel.
J. L. Hermann.W. D. Gentry.M. Crump.
W. N. Ambrose.R. B. West.W. L. Partner.C. R. Shaw.D. L. Davis.
SUBSCRIPTION PRICE OF BULLETIN
The FEDERAL RESERVE BULLETIN is the board's medium of communicationwith member banks of the Federal reserve system and is the only official organor periodical publication of the board. The BULLETIN will be sent to all memberbanks without charge. To others the subscription price, which covers the cost ofpaper and printing, is $2. Single copies will be sold at 20 cents. Outside of theUnited States, Canada, Mexico, and the insular possessions, $2.60; single copies,25 cents.
i n
Digitized for FRASER http://fraser.stlouisfed.org/ Federal Reserve Bank of St. Louis
TABLE OF CONTENTS
PageReview of the month—Credit conditions and the marketing of crops 611
Continued monetary ease—Banks in New York City and outside—Liquidation of bank loans—Growth of deposits—Decline in money rates—Decline in farm income—Statement by FederalReserve Board.
Annual report of the Bank of Greece 631
Condition of all banks on June 30, 1930 650-653
National summary of business conditions 616
Financial, industrial, and commercial statistics:Reserve bank credit and factors in changes (chart and table) 617. 618Analysis of changes in monetary gold stock 618Gold movements to and from United States 618Member bank borrowing at Federal reserve banks 619Discount rates and money rates ± 619, 620Member bank credit 621Bankers' acceptances and commercial paper outstanding 621Brokers' loans, i 621Security prices, security issues, and building contracts awarded 622Production, employment, car loadings, and commodity prices 623Industrial production 624Factory employment and pay rolls 625
Banking and business conditions in Federal reserve districts:Federal reserve banks—
Discounts (chart and tables) 626, 627Reserves, deposits, note circulation, and reserve percentages 627
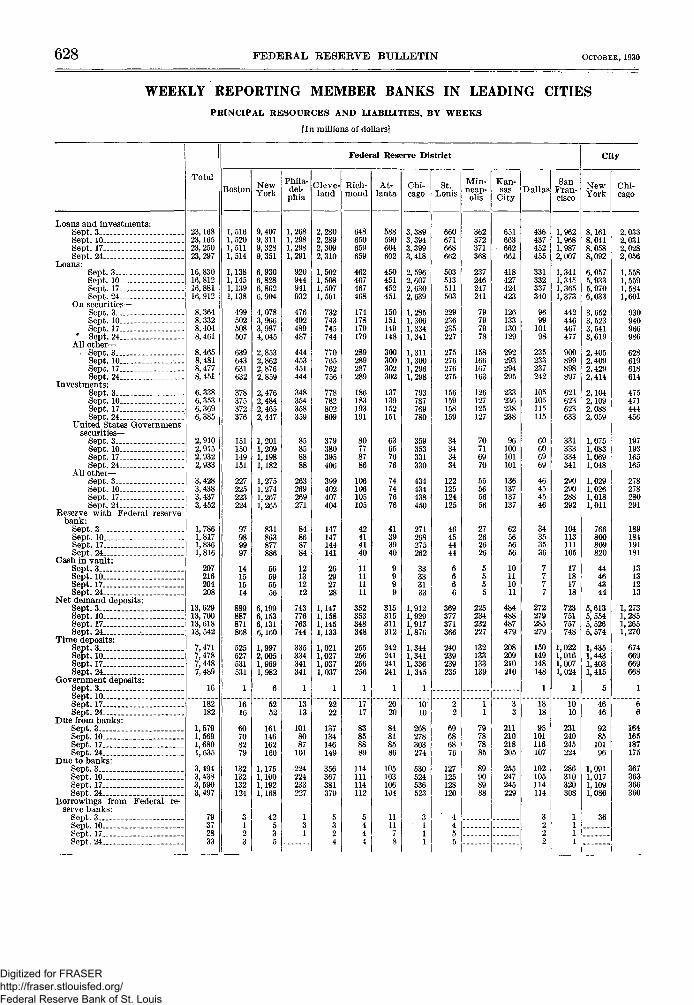
All member banks—Deposits subject to reserve, reserves held, and indebtedness at reserve banks. _ 627Member banks in leading cities—Prinicpal resources and liabilities 628Building 629Department stores—Indexes of sales and stocks 629Commercial failures 629Bank suspensions 629September crop report 630
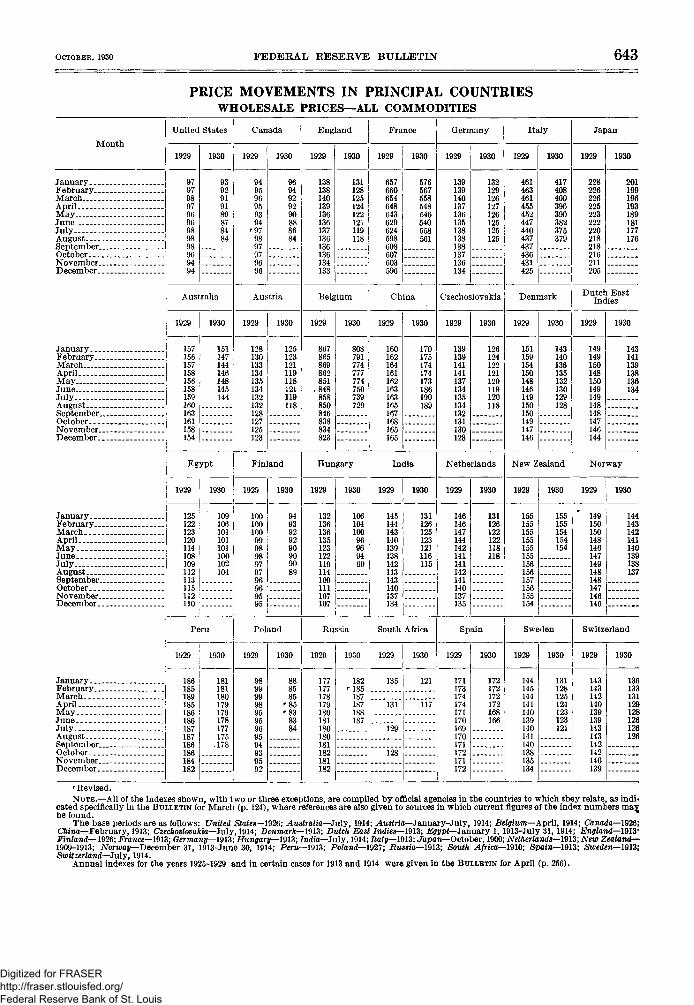
Financial statistics for foreign countries:Gold holdings of central banks and governments." 637Gold exports and imports 637Condition of Bank for International Settlements _# 638Condition of central banks 639, 640Condition of commercial banks 641Discount rates of central banks 642Money rates 642Foreign exchange rates 638Price movements 643, 644
Law department:Change in reserve calculation—Amendment to Regulation D 645
Detailed Federal reserve statistics, etc.:Resources and liabilities of Federal reserve banks in detail and Federal reserve note statement 646Condition of each Federal reserve bank at end of month 647Maturity distribution of bills and short-term securities held by Federal reserve banks 648Membership in par collection system . 648Bank debits. ._ _ — 648Kinds of money in circulation 648Changes in national and State bank membership 649Fiduciary powers granted to national banks 649
IV
Digitized for FRASER http://fraser.stlouisfed.org/ Federal Reserve Bank of St. Louis
FEDERAL RESERVE BULLETINVOL. 16 OCTOBER, 1930 No. 10
REVIEW OF THE MONTH
Conditions in the money market remainedeasy through September. Although the usual
seasonal trend at this time ofmoSrrease ^ e a r i s upward, there was little
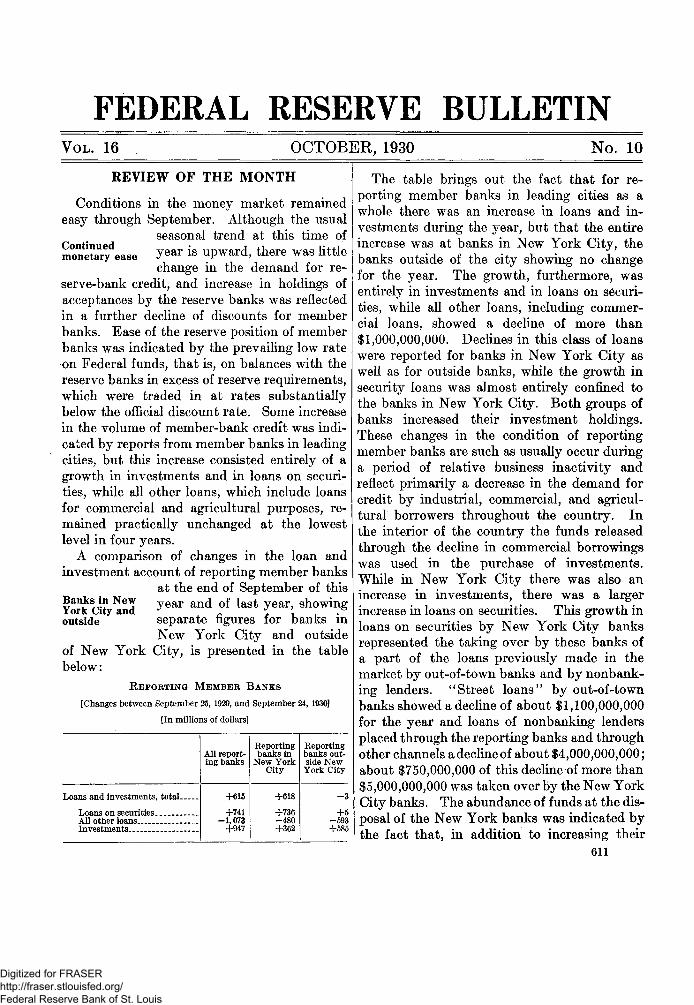
change in the demand for re-serve-bank credit, and increase in holdings ofacceptances by the reserve banks was reflectedin a further decline of discounts for memberbanks. Ease of the reserve position of memberbanks was indicated by the prevailing low rateon Federal funds, that is, on balances with thereserve banks in excess of reserve requirements,which were traded in at rates substantiallybelow the official discount rate. Some increasein the volume of member-bank credit was indi-cated by reports from member banks in leadingcities, but this increase consisted entirely of agrowth in investments and in loans on securi-ties, while all other loans, which include loansfor commercial and agricultural purposes, re-mained practically unchanged at the lowestlevel in four years.
A comparison of changes in the loan andinvestment account of reporting member banks
at the end of September of thisBanks in New y e a r a n ( j of |a s£ y e a r showingYork City a n d J J ' . &
outside separate figures lor banks inNew York City and outside
of New York City, is presented in the tablebelow:
REPORTING MEMBER BANKS
[Changes between September 25, 1929, and September 24, 1930]
[In millions of dollars]
Loans and investments,
Loans on securitiesAll other loans .Investments
total
All report-ing banks
+615
+741—1,073
+947
Reportingbanks in
New YorkCity
+618
+736-480+362
Reportingbanks out-side NewYork City
- 3
+5-593+585
The table brings out the fact that for re-porting member banks in leading cities as awhole there was an increase in loans and in-vestments during the year, but that the entireincrease was at banks in New York City, thebanks outside of the city showing no changefor the year. The growth, furthermore, wasentirely in investments and in loans on securi-ties, while all other loans, including commer-cial loans, showed a decline of more than$1,000,000,000. Declines in this class of loanswere reported for banks in New York City aswell as for outside banks, while the growth insecurity loans was almost entirely confined tothe banks in New York City. Both groups ofbanks increased their investment holdings.These changes in the condition of reportingmember banks are such as usually occur duringa period of relative business inactivity andreflect primarily a decrease in the demand forcredit by industrial, commercial, and agricul-tural borrowers throughout the country. Inthe interior of the country the funds releasedthrough the decline in commercial borrowingswas used in the purchase of investments.While in New York City there was also anincrease in investments, there was a largerincrease in loans on securities. This growth inloans on securities by New York City banksrepresented the taking over by these banks ofa part of the loans previously made in themarket by out-of-town banks and by nonbank-ing lenders. " Street loans" by out-of-townbanks showed a decline of about $1,100,000,000for the year and loans of nonbanking lendersplaced through the reporting banks and throughother channels a decline of about $4,000,000,000;about $750,000,000 of this decline of more than$5,000,000,000 was taken over by the New YorkCity banks. The abundance of funds at the dis-posal of the New York banks was indicated bythe fact that, in addition to increasing their
611
Digitized for FRASER http://fraser.stlouisfed.org/ Federal Reserve Bank of St. Louis
612 FEDERAL RESERVE BULLETIN OCTOBER, 1930
security loans by $750,000,000, they purchasedinvestments to the extent of $350,000,000 andalso increased their holdings of acceptances andof commercial paper purchased in the open mar-ket. These banks, furthermore, have been outof debt to the Federal reserve bank, except forshort periods, for more than six months.
The extent to which the growth of bankcredit during the year was confined to New
York City banks is brought outbLnkioans °f m o r e clearly by a comparison
of the New York City memberbanks with all the other banks in the UnitedStates, including member and nonmemberbanks in rural as well as in urban districts.The latest figures available for all banks in theUnited States refer to the end of June, and acomparison of the changes during the fiscalyear for all banks in the United States, formember banks in New York City, and for allother banks is shown in the following table.Since the figures do not refer in all cases to ex-actly the same dates, they are shown in ap-proximate amounts to the nearest $50,000,000.
CHANGES BETWEEN END OF JUNE, 1929 AND 1930
[In millions of dollars]
Loans and investments.
LoansInvestments..
All banksin theUnitedStates
-400
-900+500
Memberbanks in
New YorkCity i
+650
+250+400
All otherbanks
-1,050
- 1 , 1 5 0+100
i Central reserve city banks.
Loans and investments of all banks in theUnited States decreased by about $400,000,000during the year ending in June, 1930. Whenmember banks in New York City are consid-ered separately, they show an increase of$650,000,000 for the period, while all otherbanks combined reported a decrease of $1,050,-000,000. The contrast is even more pro-nounced when loans alone are considered.Loans of New York City banks increased by$250,000,000, while loans of all other banksdeclined by $1,150,000,000. Each group ofbanks increased its investment holdings. Whileat New York City banks, therefore, securityloans and investments increased by a larger
amount than the decline in commercial loans, sothat their total loans and investments showedan increase, banks outside of New York City,though they somewhat increased their hold-ings of investments, showed a large contractionof total assets as the result of the diminisheddemand for credit by trade and industry.
Turning once more to the reporting memberbanks in leading cities, for which figures up to
the end of September are avail-deposits0 able, a comparison is presented
between changes in loans andinvestments and in time and demand depositsfor the year ending in September.
REPORTING MEMBER BANKS
[Changes between September 25, 1929, and September 24, 1930]
[In millions of dollars]
Net demand depositsTime deposits
Total demand and timeLoans and investments
All report-ing banks
+470+655
+1,125+615
Reportingbanks in
New YorkCity
+444+175+619+618
Reporting'banks out-side NewYork City
+26+480+506
- 3
Growth of deposits, combining demand andtime, was nearly twice as large during theyear as the growth of loans and investments.In New York City banks the deposits andloans and investments increased by about thesame amount, most of the growth being indemand deposits, while in banks outside NewYork City, with no growth in loans and invest-ments, there was an increase of about $500,-000,000 in deposits, nearly all of this growthbeing in time deposits. The more rapid growthof deposits than of loans and investments dur-ing the year, which is usual during a period ofbusiness recession, reflected in part an inflowinto the banks of gold from abroad and of cur-rency from circulation. The country's stockof monetary gold increased during the year byabout $130,000,000, and the outstanding vol-ume of money in circulation diminished by$300,000,000, owing to decreased demandcaused by reduced pay rolls, a smaller volumeof retail trade, and a lower level of commodityprices. Both the inflow of gold and of currencytended to increase the volume of bank depositsrelative to the amount of loans and investments.
Digitized for FRASER http://fraser.stlouisfed.org/ Federal Reserve Bank of St. Louis
OCTOBER, 1930 FEDERAL RESERVE BULLETIN 613
All the factors in the situation, which havejust been discussed, have exerted an influence inthe direction of monetary ease, and money rateshave consequently been lower this autumnthan at any other time in more than 10 years.
The course of call-money rates and rates oncommercial paper for the period since the
beginning of 1919 is shown onmoneyera"es t h e c h a r t> which brings out
certain contrasts in the ratesituation during the period of the businessrecession that began in the spring of 1920 andended in the middle of 1922, and the presentperiod which began about a year ago. Thechart shows that call-money rates last year
reached about the same level as in 1919-20,with the exception of October, 1919, when anexceptional rise in these rates occurred. Com-mercial paper rates, on the other hand, whichwere above 8 per cent in 1920, never wentabove 6% per cent in 1929.
The decline in rates during the past year hasbeen much more rapid than in 1920-21, andrates are lower now than in 1922 or in 1924.The more rapid easing of money conditionsduring the past year constitutes an importantdifference between the two periods. The ex-tended condition of the banks and of manyborrowers in 1919-20 and the heavy indebted-ness to the Federal reserve banks made thedecline in money rates slower in 1920-21, whileduring the past year the strong reserve positionof the member banks as well as of the reserve
banks and the strong cash position of manyenterprises, together with Federal reservepolicy of reducing rates and purchasing securi-ties, was reflected in a much more rapid declinein money rates. In the earlier period, further-more, the overexpansion of credit was basedlargely on commodities and was reflected in ahigh level of commercial loans, while last yearit was based on securities and was reflected inan expansion of security loans. Liquidation ofthis class of loans is usually more rapid andduring the past year has proceeded faster thanthe liquidation of commercial loans during theearlier period.
Easy credit conditions at the present timeare general throughout the country, as indi-
cated by the small volume offarmTncome indebtedness of member banks
to the reserve banks in allFederal reserve districts. The growth ofdeposits, however, which has occurred duringthe year, has not been felt by rural communi-ties, as is shown by the following chart, whichpresents the course of net demand and timedeposits of country banks in 21 agricultural
MILLIONS OF DOLLARS
1300
1200
1100
1000
900
800
COUNTRY BANKS IN 21 AGRICULTURAL STATESMILLIONS OF DOLLARS
1*00
Net Demand Deposits
Time Deposits
\
1930
1300
1200
1100
1000
900
8001923 1924 1925 1926 1927 1928 1929
Deposits of member banks in towns with a population of less than15,000, located in 21 agricultural States
States. The chart shows that there has beena rapid decline in deposits of both kinds inthese banks for more than a year and that atthe present time their level is lower than atany time in recent years. This low level ofdeposits of country banks is related to thefact that the income of farmers in these Stateshas been diminished by the decline in the valueof products marketed.
Digitized for FRASER http://fraser.stlouisfed.org/ Federal Reserve Bank of St. Louis
614 FEDERAL RESERVE BULLETIN OCTOBER, 1930
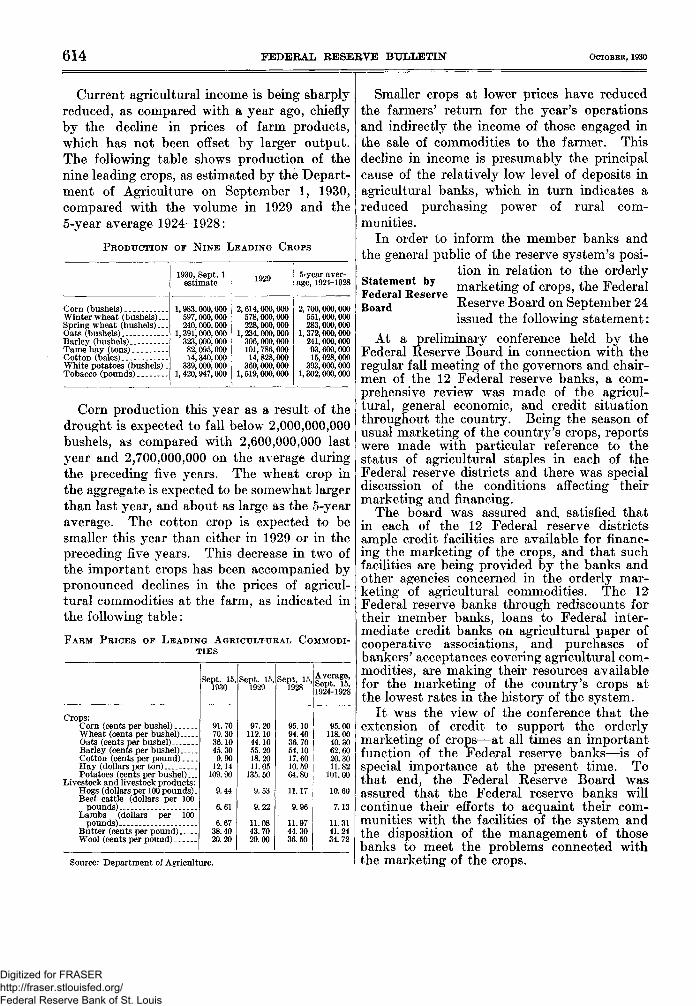
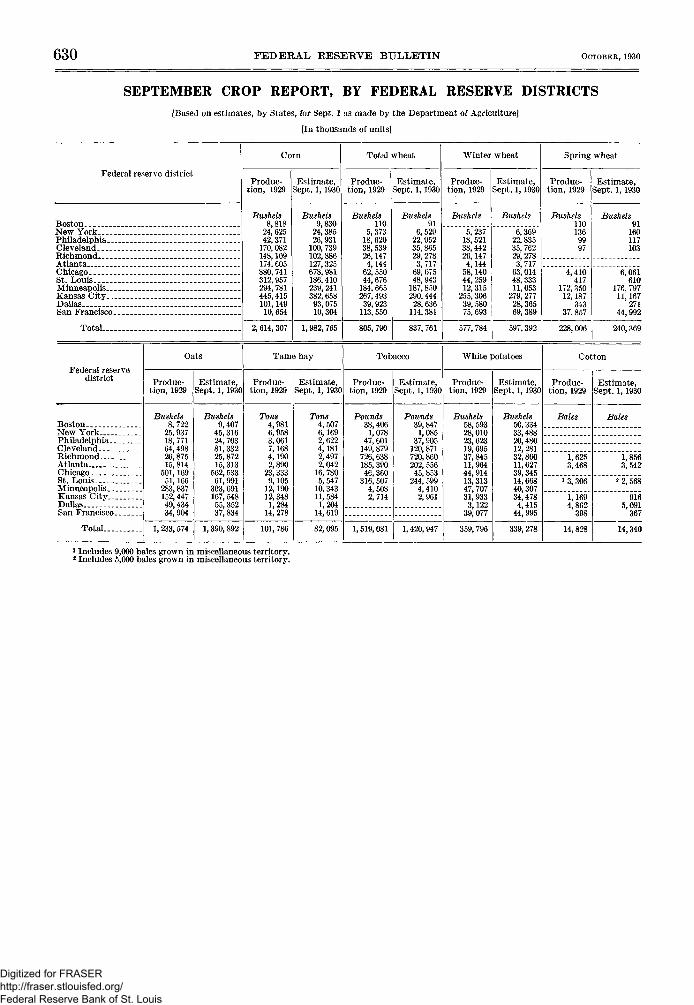
Current agricultural income is being sharplyreduced, as compared with a year ago, chieflyby the decline in prices of farm products,which has not been offset by larger output.The following table shows production of thenine leading crops, as estimated by the Depart-ment of Agriculture on September 1, 1930,compared with the volume in 1929 and the5-year average 1924-1928:
Corn production this year as a result of thedrought is expected to fall below 2,000,000,000bushels, as compared with 2,600,000,000 lastyear and 2,700,000,000 on the average duringthe preceding five years. The wheat crop inthe aggregate is expected to be somewhat largerthan last year, and about as large as the 5-yearaverage. The cotton crop is expected to besmaller this year than either in 1929 or in thepreceding five years. This decrease in two ofthe important crops has been accompanied bypronounced declines in the prices of agricul-tural commodities at the farm, as indicated inthe following table:
FARM PRICES OF LEADING AGRICULTURAL COMMODI-TIES
Crops:Corn (cents per bushel) _Wheat (cents per bushel)Oats (cents per bushel)Barley (cents per bushel)Cotton (cents per pound)Hay (dollars per ton)Potatoes (cents per bushel).. .
Livestock and livestock products:Hogs (dollars per 100 pounds).Beef cattle (dollars per 100
pounds)Lambs (dollars per 100
pounds)Butter (cents per pound)Wool (cents per pound)
Sept. 15,1930
91.7070.3036.1045. 309.90
12.14109.90
9.44
6.61
6.6738.4020.20
Sept. 15,1929
97.20112.1044.1055.2018.2011.05
135.50
9.53
9.22
11.0843.7029.00
o t 1f- Average,
1928 ' ^ P t - 15>[1924-1928
95.10 I94.4036.70 I54.10 !17.60 |10.59 I64.80
11.17
9.96
11.9744.3036.50
95.00118.0040.3062.6020.3011.82101.00
10.60
7.13
11.3141.2434.72
Source: Department of Agriculture.
Statement byFederal ReserveBoard
Smaller crops at lower prices have reducedthe farmers' return for the year's operationsand indirectly the income of those engaged inthe sale of commodities to the farmer. Thisdecline in income is presumably the principalcause of the relatively low level of deposits inagricultural banks, which in turn indicates areduced purchasing power of rural com-munities.
In order to inform the member banks andthe general public of the reserve system's posi-
tion in relation to the orderlymarketing of crops, the FederalReserve Board on September 24issued the following statement:
At a preliminary conference held by theFederal Reserve Board in connection with theregular fall meeting of the governors and chair-men of the 12 Federal reserve banks, a com-prehensive review was made of the agricul-tural, general economic, and credit situationthroughout the country. Being the season ofusual marketing of the country's crops, reportswere made with particular reference to thestatus of agricultural staples in each of theFederal reserve districts and there was specialdiscussion of the conditions affecting theirmarketing and financing.
The board was assured and, satisfied thatin each of the 12 Federal reserve districtsample credit facilities are available for financ-ing the marketing of the crops, and that suchfacilities are being provided by the banks andother agencies concerned in the orderly mar-keting of agricultural commodities. The 12Federal reserve banks through rediscounts fortheir member banks, loans to Federal inter-mediate credit banks on agricultural paper ofcooperative associations, and purchases ofbankers' acceptances covering agricultural com-modities, are making their resources availablefor the marketing of the country's crops atthe lowest rates in the history of the system.
It was the view of the conference that theextension of credit to support the orderlymarketing of crops—at all times an importantfunction of the Federal reserve banks—is ofspecial importance at the present time. Tothat end, the Federal Reserve Board wasassured that the Federal reserve banks willcontinue their efforts to acquaint their com-munities with the facilities of the system andthe disposition of the management of thosebanks to meet the problems connected withthe marketing of the crops.
Digitized for FRASER http://fraser.stlouisfed.org/ Federal Reserve Bank of St. Louis
OCTOBER, 1930 FEDERAL RESERVE BULLETIN 615
The exceptionally strong position of com-mercial banks and of the reserve banks, theprevailing ease in credit conditions, the lowlevel of money rates, and the attitude of theFederal reserve system as expressed in thisstatement give assurance that the country'scredit resources will be available to facilitatein every possible way the orderly movement ofagricultural commodities from the producerthrough the channels of trade to the ultimateconsumer.
Appointment of Governor of the Federal ReserveBoard
On September 16, 1930, Mr. Eugene Meyer,of New York, was appointed a member of theFederal Reserve Board to fill the vacancycreated by the resignation of Vice GovernorPlatt, and was designated as governor of theboard.
Resignation of Vice Governor Platt
Mr. Edmund Platt, who had been a memberof the Federal Reserve Board since June 8,1920, and its vice governor since July 23,1920,resigned on September 15, 1930, to become vicepresident of the Marine Midland Corporation.
Changes in Advisory Council
The Federal Advisory Council at its meetingon September 16, 1930, made certain changesin its organization as a result of the recentdeath of Mr. Frank O. Wetmore, of Chicago,and the resignation from the council of Mr.Levi L. Rue, of Philadelphia.
Mr. Melvin A. Traylor, of the First NationalBank of Chicago, succeeds Mr. Wetmore asrepresentative of the seventh district, and Mr.Howard A. Loeb, of the Tradesmen's NationalBank & Trust Co. of Philadelphia, succeedsMr. Rue.
Mr. B. A. McKinney, of Dallas, former vice-president of the council, has been elected pres-ident to fill the vacancy caused by Mr. Wet-more's death, and Mr. Walter W. Smith, ofSt. Louis, has been elected vice-president.These officers as ex officio members, and Mr.
14480—30——2
William C. Potter, of New York, Mr. HarrisCreech, of Cleveland, Mr. Loeb, and Mr. Tray-lor will comprise the executive committee ofthe council. Mr. Walter Lichtenstein, ofChicago, will continue as secretary.
Changes in Discount Rates
The discount rate on all classes and maturi-ties of paper was reduced from 4 to 3K percent at the Federal Reserve Bank of Dallas,effective September 9, and at the Federal Re-serve Bank of Minneapolis, effective Septem-ber 12.
Changes in Foreign Central Bank Discount Rates
The following changes have been made sincethe 1st of September in the discount rates ofcentral banks in foreign countries:
September 10.—Austrian National Bank, from 5}i to5 per cent.
September 19.—Bank of the Republic of Colombia,from 8 to 7 per cent.
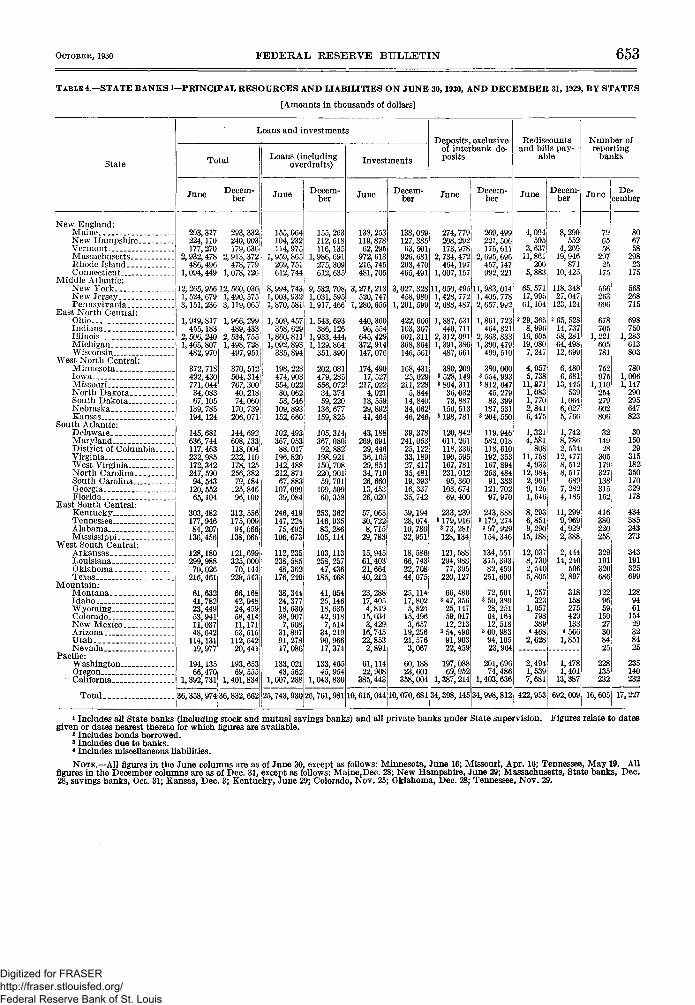
Condition of All Banks in the United States on June30, 1930
Loans and investments of all banks in theUnited States—including national banks, Statebanks, trust companies, mutual and stock sav-ings banks, and all private banks under Statesupervision—increased by $722,000,000 duringthe second quarter of 1930, to the level of$58,108,000,000, according to figures recentlycompiled by the Federal Reserve Board. Forthe year ending June 30, 1930, however, bankloans and investments decreased by $366,000,-000, or 0.6 per cent.
The increase of $722,000,000 for the quarterin total loans and investments reflected a de-crease of $68,000,000 in loans and an increaseof $790,000,000 in investments. The loans ofnonmember banks decreased by $164,000,000,while those of member banks increased by $95,-000,000. Both member and nonmember banksincreased their investments during the quarter,member banks by $505,000,000 and nonmem-ber banks by $285,000,000.
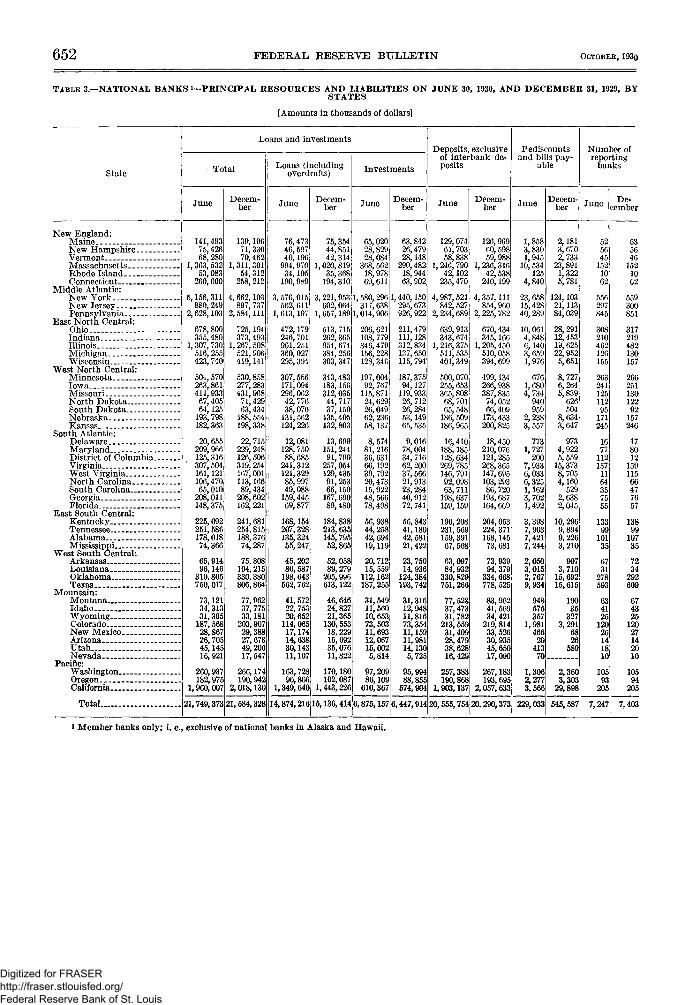
Detailed compilations of the principal re-sources and liabilities of these banks, by Federalreserve districts and by States, are given onpages 650-653 of this BULLETIN.
Digitized for FRASER http://fraser.stlouisfed.org/ Federal Reserve Bank of St. Louis
616 FEDERAL RESERVE BULLETIN OCTOBER, 1930
NATIONAL SUMMARY OF BUSINESS CONDITIONS[Compiled September 21 and released for publication September 25]
Industrial production as a whole was in thesame volume in August as in July, contrary tothe usual upward trend at this season, althoughthere were seasonal increases in activity in anumber of basic industries. Factory employ-ment and pay rolls declined further. The gen-eral level of commodity prices at wholesale,which had declined continuously for a year, re-mained unchanged between July and August,advances in price being reported for certain im-portant agricultural staples.
Production.—The board's index of industrialproduction, which makes allowance for seasonalvariations, continued to decline in August.Production of automobiles, pig iron, lumber,and sugar decreased, and there was a reductionin the consumption of cotton and wool. In thebituminous coal and silk industries there wasless increase than is usual at this season, whilein steel, cement, flour, and shoes the increasewas slightly more than seasonal. During thefirst two weeks of September activity at steelplants increased, while a further reduction inoutput of automobiles was reported.
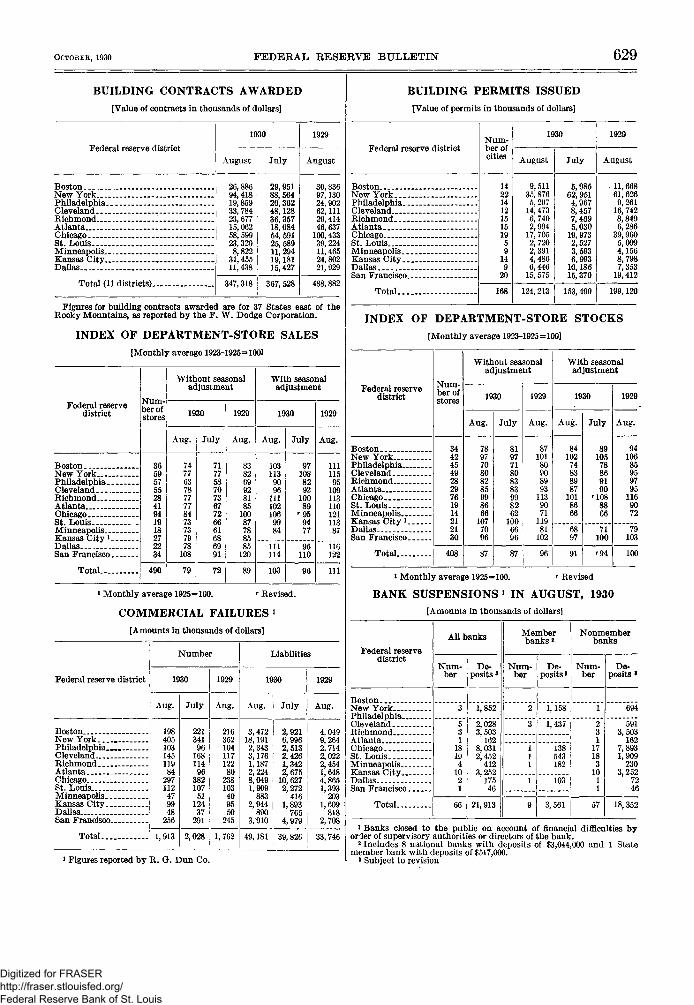
Building contracts awarded, as reported tothe F. W. Dodge Corporation, were in slightlysmaller volume during August, largely on ac-count of reductions in educational and indus-trial construction projects. Residential build-ing contracts continued small. During the firsttwo weeks in September awards averaged aboutthe same as in August.
At the middle of August, the latest date forwhich figures are available, the number ofwage earners employed in factories and thevolume of factory pay rolls was smaller than inthe middle of July. There were decreases inemployment in the iron and steel and cottontextile industries and at foundries and machineshops, automobile plants, and sawmills. Sub-stantial seasonal increases occurred in thecanning and preserving, bituminous coal min-ing, and clothing industries.
Agriculture.—September 1 estimates by theDepartment of Agriculture indicate a corncrop of 1,983,000,000 bushels, about 700,000,000bushels less than the 5-year average; a springwheat crop of 240,000,000 bushels, slightlylarger than last year's unusually small crop,making the total wheat crop about equal to
the 5-year average; and a crop of oats of aboutthe usual size. Condition of pastures on Sep-tember 1 was reported to be unusually poor.The cotton crop is expected to be about14,340,000 bales, nearly 500,000 bales less thanlast year.
Distribution.—Volume of freight shipped byrail increased by slightly less than the usualseasonal amount during August. Sales ofdepartment stores were larger than in July,but continued considerably smaller than ayear ago.
Wholesale prices.—There were increasesduring August in prices of many agriculturalproducts, especially meats, livestock, andgrains, while the price of cotton decreased.Prices of mineral and forest products and ofimported raw materials and their manufacturesin general declined, with the principal exceptionof silk. The Bureau of Labor Statistics indexof wholesale prices showed no change from thepreceding month.
During the first half of September there werepronounced declines in prices of wheat, corn,hogs, pork, and rubber. Prices of cotton andwoolen textiles remained fairly stable, whilethose of hides and coffee increased.
Bank credit.—Between August 20 and Sep-tember 17 there was an increase in memberbank holdings of investments and in their loanson securities, while all other loans, whichinclude loans for commercial purposes, declined,contrary to the usual seasonal trend.
The volume of reserve bank credit outstand-ing showed a growth for the period, as is usual atthis season, but the increase was relatively small,owing to the fact that the seasonal demand forcurrency was smaller than in other recent yearsand owing to an addition of $15,000,000 to thecountry's stock of gold. The increase was inholdings of acceptances, offset in part by afurther decline in discounts for member banksto the lowest level since 1917.
Money rates continued at low levels duringAugust and the first half of September, andthe yield on high-grade bonds declined further.Discount rates at the Federal Reserve Banksof Dallas and Minneapolis, the only bankswhich had maintained a 4 per cent rate, werereduced to 3K per cent during September.
Digitized for FRASER http://fraser.stlouisfed.org/ Federal Reserve Bank of St. Louis
OCTOBER, 1930 FEDERAL RESERVE BULLETIN 617
FEDERAL RESERVE BANK CREDIT
RESERVE BANK CREDIT OUTSTANDING AND PRINCIPAL FACTORS IN-CHANGESMILLIONS OF DOLLARS MILLIONS OF DOLLARS
200
1926 1927 1928 1929 1930Based on weekly averages of daily figures; latest figures are for week ending September 30
Digitized for FRASER http://fraser.stlouisfed.org/ Federal Reserve Bank of St. Louis
618 FEDEKAL RESERVE BULLETIN OCTOBER, 1930
RESERVE BANK CREDIT OUTSTANDING AND FACTORS IN CHANGES
[Average of daily figures. In millions of dollars]
1 For explanation see BULLETIN for July, 1929, pp. 432-438.1 Includes "other securities," amounts due from foreign banks, and reserve bank float; for explanation see BULLETIN for July, 1929.Back figures—See Annual Report for 1929 (Tables 1, 2, and 3).
Digitized for FRASER http://fraser.stlouisfed.org/ Federal Reserve Bank of St. Louis
OCTOBER, 1930 FEDERAL RESERVE BULLETIN 619
MEMBER BANK BORROWINGS AT FEDERAL RESERVE BANKS
[Monthly averages of weekly figures. In millions of dollars]
Month
January ,FebruaryMarch _ _AprilMayJune __-July-AugustSeptember - . - --OctoberNovemberDecember
Total 1
1929
891893978991951972
1,1001,013
974885944755
1930
462371247225226222218196186
Reporting member banks in leading cities
Total
1929
663659740725661670801717706634655490
1930
24717481715953534344
New York City
1929
190131166162145165319196166746080
1930
3921
117115
49
Other leading cities
Total
1929
473528574563516505482521540560595410
1930
20815380544848533935
Chicago
1929
93121463664473218382837
1930
71
2
211
Membeoutside
citi
1929
228234238266290302299296268251289265
r banksleadingesi
1930
215197166154167169165153142
i Includes (in small amounts) discounts by Federal reserve banks for nonmembers: (1) Bills discounted for intermediate credit banks and (2)notes secured by adjusted-service certificates discounted for nonmember banks.
FEDERAL RESERVE BANK RATES
DISCOUNT RATES
[Rates on all classes and maturities of eligible paper]
Federal reserve bank
BostonNew YorkPhiladelphia..ClevelandRichmondAtlantaChicagoSt. LouisMinneapolis..Kansas City-DallasSan Francisco
NOTE.—Rates on prime bankers' acceptances. Higher rates may becharged for other classes of bills.
OPEN-MARKET RATESRATES IN NEW YORK CITY
Month or week
Prevailing rate on—
Primecom-
mercialpaper,4 to 6
months
1929SeptemberOctoberNovemberDecember
6H
1930January 4?4-5February . 4^-5MarchAprilMayJuneJulyAugustSeptemberWeek e ding—
Sept. 6Sept. 13Sept. 20Sept. 27
3 -31/33
Primebank-ers'
accept-ances,
90days
3H-AH3%-A
334-3%2^-32^-321J
Timeloans,
90days 2
83/4-97 -9
4?4-543^-53?4-4344 -4M
2/2-2%2/2-2%
2/2-2%p 2^-2%
j 2H-2H
Average rate
Call loans 1
New Re-newal
U.S.Treas-
urynotesand
certifi-cates,3 to 6
months
"I"
8.626.105.404.88
4.314.283.563.79 I3.05 I2.602. 182.222.17
2.352.502.022.00
8.506.435.444.83
4.644.323.694.003.122.622.202.212.19
2.252.502.202.00
Average yield
Treas-ury
bonds8
M.584.373.47
4 3.03
3.393.36
4 2.953.002.41
4 1.891.831.53
4«1.84
1.471.53
4 5 2. 092.11
3.70
3.67
3.45
3.46
3.513.503.403.463.413.373.37
'3.383.37
3.373.363.36
1 Stock exchange call loans; new and renewal rates.* Stock exchange 90-day time loans.8 3 issues—3%, 3%, 4 per cent; yields calculated on basis of last redemp-
tion dates—1947, 1956, and 1954.4 Change of issues on which yield is computed,fi Maturities of 6-9 months.r Revised.
Digitized for FRASER http://fraser.stlouisfed.org/ Federal Reserve Bank of St. Louis
620 FEDERAL RESERVE BULLETIN OCTOBER, 1930
PREVAILING RATES CHARGED CUSTOMERS BY BANES IN PRINCIPAL CITIESWEIGHTED AVERAGES
NOTE.—Figures relate to rates charged by reporting banks to their own customers as distinguished from open-market rates (which are givenon preceding page). All averages are based on rates reported for three types of customer loans—commercial loans, and demand and time loanson securities. The method of computing the averages takes into account (a) the relative importance of each of these three types of loans and (6)the relative importance of each reporting bank, as measured by total loans. In the two group averages the average rate for each city included isweighted according to the importance of that city in the group, as measured by the loans of all banks.
BUILDING CONTRACTS AWARDED, BY TYPES OF BUILDING[Value of contracts in millions of dollars]
January .FebruaryMarchApril „MayJuneJuly__ __ . .August
Year to dateSeptemberOctoberNovemberDecember
Total
1929
410.0361.3484.8642.1587.8545.9652.4488. 9
4,173.1445.4445.6391.0316.4
1930
324.0317.1456.1482.9457.4600.6367.5347.3
3,352.9
Residential
1929
138.1129.5197 2256.8192.0189.8199.9146.1
1,449.3118.4137.7113.5114.0
1930
66.674.8
101.5123.1116.696.884.382.7
746.4
Industrial .
1929
63.156.155.868.280.870.066.675.3
535.952 660.939.767.4
1930
38.333.574.338.154.693.635.220.7
388.3
Commercial
1929
100.468.375.678086.580.991.372.0
652. 976 967.7
101.833.4
1930
54.172.977.073.273.359.146.950.9
507.4
Public works andpublic utilities
1929
66.557.671.5
152.1139.4120.8194.5119.3
921.8117 285 172.451.8
1930
112.185.8
105. 3149.7134.9251.9114.9124.2
1,078.8
Educational
1929
17.722.637.529.938.243.448.032.3
269.629 836 925.719.8
1930
19.021.235.435 236.948.942.725.9
265.2
All other
1930
24.127.347.257.150.940.952.043.9
343.550 467 338.029.9
1930
34.028.862.663.541.150.243.543.0
366.7
Figures for building contracts awarded are for 37 States east of the Rocky Mountains, as reported by the F. W. Dodge Corporation.
Digitized for FRASER http://fraser.stlouisfed.org/ Federal Reserve Bank of St. Louis
OCTOBER, 1930 FEDERAL RESERVE BULLETIN 623
PRODUCTION, EMPLOYMENT, CAR LOADINGS, AND PRICES[Index numbers; 1923-1925 average=100. The terms "adjusted" and "unadjusted" refer to adjustment for seasonal variations]
* Average per working-day, except for annual indexes.t Wholesale price index of Bureau of Labor Statistics; 1926=» 100. Index numbers for all major groups of commodities are given on p. 644v Preliminary. r Revised.
14480—30 3
Digitized for FRASER http://fraser.stlouisfed.org/ Federal Reserve Bank of St. Louis
624 FEDERAL RESERVE BULLETIN OCTOBER, 1930
INDUSTRIAL PRODUCTION, BY INDUSTRIES[Index numbers of the Federal Reserve Board. Adjusted for seasonal variations. 1923-1925 average=100]
i Without seasonal adjustment. 2 Includes also lead and zinc; see " Minerals." » Preliminary. T Revised.NOTE.—The combined index of industrial production is computed from figures for 58 statistical series, 50 of manufactures, and 8 of minerals
most of which are shown in this table. Adjustments have been made in the different industries for the varying number of working days in eachmonth and for customary seasonal variations, and the individual products and industries have been weighted in accordance with their relativeimportance. The sources of data and methods of construction were described in the BULLETIN for February and March, 1927.
Digitized for FRASER http://fraser.stlouisfed.org/ Federal Reserve Bank of St. Louis
OCTOBEE, 1930 FEDERAL RESERVE BULLETIN 625
FACTORY EMPLOYMENT AND PAY ROLLS
INDEXES OF FACTORY EMPLOYMENT AND PAY ROLLS
[Without seasonal adjustment. Monthly average 1923-1925=100]
NOTE.—These tables contain index numbers of factory employment and factory pay rolls for certain months, together with group indexes forimportant industrial components. The nature and sources of basic data and the method of construction were described and the indexes for theperiod January, 1919, to November, 1929, were published in the BULLETIN for November, 1929, pp. 706-716.
Digitized for FRASER http://fraser.stlouisfed.org/ Federal Reserve Bank of St. Louis
626 FEDERAL RESERVE BULLETIN OCTOBER, 1930
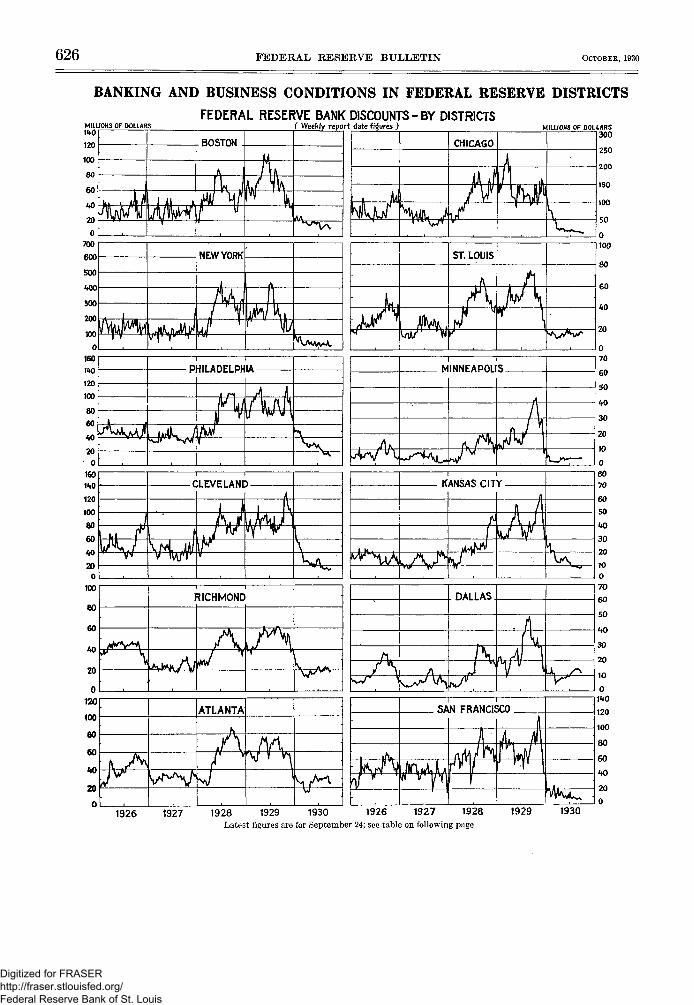
BANKING AND BUSINESS CONDITIONS IN FEDERAL RESERVE DISTRICTS
MILLIONS OF DOLLARS1M)
FEDERAL RESERVE BANK DISCOUNTS-BY DISTRICTS( Weekly report date figures ) MILLIONS OF DOLLARS
1926 1927 1928 1929 1930 1926 1927 1928 1929 1930Latest figures are for September 24; see table on following page
Digitized for FRASER http://fraser.stlouisfed.org/ Federal Reserve Bank of St. Louis
OCTOBER, 1930 FEDERAL RESERVE BULLETIN 627
FEDERAL RESERVE BANKS—RESERVES, DEPOSITS, NOTE CIRCULATION, AND RESERVE PERCENTAGES
[Averages of daily figures. Amounts in thousands of dollars]
Federal reserve bank
BostonNew YorkPhiladelphia.. .ClevelandRichmondAtlantaChicagoSt. LouisMinneapolis. . .Kansas Ci ty . . .DallasSan Francisco.
1 Includes " Federal reserve notes of other Federal reserve banks " as follows: Latest month, $20,774,000; month ago, $19,196,000; year ago, $27,947,000.
ALL MEMBER BANKS—DEPOSITS SUBJECT TO RESERVE, RESERVES HELD, AND INDEBTEDNESS AT FEDERALRESERVE BANKS
[Averages of daily figures. In millions of dollars]
Federal reserve district
BostonNew York _ .Philadelphia _ _ClevelandRichmondAtlantaChicagoSt. LouisMinneapolisKansas CityDallasSan Francisco
Total . . .
Net demand deposits
July
1,3667, 2471,1751,616
526513
2,590659420829592
1,287
18,820
June
1,3407,3051,1641,563
524519
2, 599668433821603
1,274
18,812
Time deposits
July
1,0043,4443,1451,683
558440
2,216533447378241
1,753
13,843
June
9883,4541,1291,670
559447
2,114521449369244
1,748
13, 693
Reserves held
Total
July
149.31,000. 7
139.4200.663.560.6
351. 2
June
145. ft990.3137. 8195.163.261.3
348.876. 9 I 76. 650.4 1 51.888.959.0
176.9
2,417.3
88.059.9
173.1
2,391. 8
Excess
July
2.333.42.24.42.12.88.32.72.34.82.5f.. 0
74.0
June
1.615.22.34.62.13.19.02. 12.64.92.63.8
53.9
Indebtedness atFederal reserve
banks
July
12.641.624.424.919.828.819.016.3
4.210.411.5
G.K
223.4
June
17.357.028.123.619.630.118.118.1
3.813.610.210.3
249.8
DISCOUNTS OF FEDERAL RESERVE BANKS, BY WEEKS[In thousands of dollars]
Federal reserve bank
BostonNew Y o r k . . . .Philadelphia..ClevelandRichmondAtlanta _.ChicagoSt. LouisMinneapolis-.Kansas Ci ty . .DallasSan Francisco.
1 Includes 9,000 bales grown in miscellaneous territory.2 Includes 5,000 bales grown in miscellaneous territory.
Digitized for FRASER http://fraser.stlouisfed.org/ Federal Reserve Bank of St. Louis
OCTOBER, 1930 FEDERAL RESERVE BULLETIN 631
FOREIGN BANKING AND BUSINESS CONDITIONS
ANNUAL REPORT OF THE BANK OF GREECE
The annual report of the Bank of Greece for1929 was presented to the general meeting ofshareholders on March 19, 1930. The majorpart of the report, with the omission of asection on public finances, is given herewith: *
The second working year since the estab-lishment of our bank, although it showed moresatisfactory results than the first eight months7
period of 1928, was, nevertheless, not quite sonormal in its course as the preceding year.
Our bank was confronted by new problemswhich were attributable, on the one hand, tothe international economic situation, particu-larly to conditions in the world money market,and, on the other hand, to special causes fallingwithin the range of our own national economy.
Foreign exchange policy.—During the pastyear we were again guided by the same generalprinciple which was the basis of our policyduring the first period of the bank's operations—namely, that of maintaining the value of thedrachma intact. To that end we thought itincumbent upon us to maintain the rate ofexchange close to the gold parity of the drachmaby restricting its natural fluctuations within themaximum and minimum gold points, fluctua-tions which necessarily occur as a result ofthe varying relation between the supply of anddemand for foreign exchange. Our policy wasto provide the amount of foreign exchangedemanded at any particular moment in excessof the supply available in the market at astable selling rate, which was the parity rate,and to accept what was offered by the marketlikewise at a stable purchasing rate, main-taining only a small margin between the sellingand buying rates. We aimed to afford absolutesecurity to transactions generally and to savecommerce the additional expense which iscaused even by the fluctuation of exchangewithin the limits of the gold points. Indeed,the selling rate of foreign exchange may, with-out running counter to the conditions and termsof stabilization, reach the level of 377.50drachmas ($4.9075 to the pound sterling), thatis to say, the parity rate increased by the costof the transport of gold, while the buying ratemay fall to 372.50 drachmas ($4.8425), that is,the parity rate reduced by the cost of the trans-port of gold. If the person requiring foreignexchange for the usual three months' commer-
i Taken with some textual revision from the official English trans-lation furnished by the bank.
cial transactions were to buy at the maximumrate, and after three months to sell at the mini-mum rate, this would represent an additionalexpense equivalent to an increase of the annualcapital charge at a rate exceeding 5 per cent.
It must not, however, be thought that weare bound by law to adopt this policy or thatwe have imitated the policy usually adoptedby banks of issue. There is only one obliga-tion binding upon our bank in virtue of itsquality as central bank and in view of thebasis upon which stabilization has been es-tablished both in Greece and in other countries,namely, the obligation to buy all the foreignexchange offered at the parity rate after de-duction of the cost of transport of gold andto sell all the foreign exchange demanded atthe same parity rate increased by the cost oftransport of gold, even if the relation betweensupply and demand at a given moment weresuch that, if the market were left uncontrolled,the rates w ould be forced below or above thegold points.
The policy of a bank of issue is not to inter-fere with the free operation of the law of de-mand and supply within the legal limits ofthe gold points, but to interfere if and whenthe rates show a tendency to approach themaximum or minimum gold-point limit. Ourbank is not debarred from following such apolicy, if deemed necessary. The reason isthat the security afforded to transactions ingeneral through the stability of the rate ofexchange often acts as an incentive to specula-tion, which, in turn, encourages the outflowof capital abroad with a view to profiting fromtransient favorable conditions prevailing insome foreign money market, without, however,at the same time involving any risk, owing tothe security afforded by reason of such sta-bility in the rate of exchange to the repatria-tion at any moment of Greek capital withoutimpairment of principal. In such circum-stances the bank of issue could, by properlymanipulating the rates of exchange, rendersuch a movement of capital useless or evenunprofitable.
Balance of international payments.—Of theitems constituting Greece's balance of in-ternational accounts, the balance of tradeand the movement of capital must be speciallyexamined because during the past year thesetwo items underwent important changes.
Digitized for FRASER http://fraser.stlouisfed.org/ Federal Reserve Bank of St. Louis
632 FEDERAL RESERVE BULLETIN OCTOBER, 1930
Our balance of trade is definitely unfavor-able. The results arrived at by comparing thebalance of trade in 1928 and 1929 are asfollows:
19281929
19281929. . .
Imports
(In mil
12,488.113,275. 5
( Inm
162.3172.6
Exports
ions of dn
6,282.17,018.8
llions of d(
81.791.2
Deficit
chmas)
6.206.06,256.7
Dllars)
80.781.3
The inference from this comparison is thatboth exports and imports in 1929 show anincrease as compared with those of 1928 andthat the relation between exports and importsduring both these years has remained the same.One might readily come to the conclusion thatour adverse balance of trade has influenced ourgeneral balance of accounts during both yearsto exactly the same degree. This, however,does not seem quite to correspond to the actualfacts of the case. The time when a certaincommodity is exported or imported usuallydoes not coincide with the time of payment ofits value, and consequently the figures of theimport and export trade do not coincide withthe figures of the balance of accounts. Espe-cially as regards the export of tobacco, the inflowinto the country of capital in foreign exchangefor the payment of its value precedes the actualexport of the tobacco itself, while as regardsother commodities the opposite is the case.
The purchases of the annual tobacco cropbegin in September of each year and usuallyend in May of the following year. During1928, from October until December, the pur-chases effected represented a value of £3,000,000($14,599,500). During the past year trans-actions in tobacco were rather uncertain andpurchases were deferred, with the result thatup to the end of 1929 the total purchases oftobacco represented a value which hardlycorresponded to half of the amount realizedduring the same period of the previous year.As a result of this situation there was created adefinite deficit of foreign exchange amountingto £1,500,000 ($7,299,750). This deficit, whichconstituted a charge upon the balance of pay-ments of 1929, probably will not figure as afinal loss to our economy. The stagnationobserved during the last quarter of 1929, duepartly to special conditions affecting productionin that year, will simply have the effect of post-poning the purchases and consequently ofcausing a retardation of the inflow into the
country of foreign exchange equivalent to thetotal value of the purchases effected.
The value of currants exported during thepast year fell short of that of 1928 by an amountwhich is calculated to be approximately equalto £400,000 ($1,946,600). This loss, which ismainly due to the reduction of prices and tothe competition of colonial currants of thistype, is definite and has affected our balanceof payments. In addition, there has also beenobserved abroad a reduction in the prices oftwo other products of our home production—namely, oil and wine. Consequently, the de-crease in the amount of foreign exchange thatentered the country during the past year, asa result of the movement of our export trade,whether of a definite or of a transient nature,certainly exceeded £2,000,000 ($9,733,000).
Another very important and delicate factorin the balance of accounts is the movement ofcapital. Capital, in endeavoring to find aprofitable investment, takes advantage of anychange in the conditions affecting the re-muneration of capital. The high price forcapital in the great foreign money markets andthe speculative movement on the New Yorkstock exchange exercised an influence on theGreek market, as it did on the other mar-kets of the world, and diverted the outflow ofcapital toward foreign money centers. On thebasis of accurate information from the stockexchange and the commercial banks we es-timate the visible outflow of capital during1929, as a result of the repatriation of Greeksecurities and of the purchase of foreign ones,at about £1,600,000 ($7,786,400). The in-visible outflow of capital can not, of course, becalculated, but it must not be thought thatit has been of no consequence.
During the past year the movement of cap-ital has been somewhat adverse, whereas dur-ing the previous year (1928) it was favorableto us, having contributed in considerablemeasure to the results attained during thatyear. This phenomenon, however, was inevidence everywhere during the past year,and the whole of Europe was under severepressure from the New York money mar-ket, which promised great profits to inflowingcapital.
The reestablishment of more or less normalconditions in the international money markets,which began to be observed during the lastfew months of 1929, operated as a check tothis tendency. As far as can be anticipated,this tendency is now likely to be reversed.There is already some evidence of a revivingdemand for Greek securities.
Digitized for FRASER http://fraser.stlouisfed.org/ Federal Reserve Bank of St. Louis
OCTOBER, 1930 FEDERAL RESERVE BULLETIN 633
Of the other items of the balance of accounts,special mention must be made, on the one hand,of the assistance coming from abroad and, onthe other, of the remittances of emigrants.
The importance of temporary assistance toour economy from abroad can not be over-looked. This assistance consists of foreigncapital funds in the shape of long-term sinking-fund loans. These foreign loans, the serviceof which will devolve upon financial years tocome, are contracted neither with a view todealing with ordinary requirements of oureconomy, nor in order to enable us to follow apolicy of unproductive consumption. By theseloans we aim exclusively at satisfying theextraordinary requirements which have beencreated as a result of the permanent settle-ment of refugees and of the amelioration ofconditions generally, as well as of the exten-sion of our national production. The generalassistance coming from abroad during recentyears is calculated to be approximately £3,000,-000 to £3,500,000 ($14,599,500 to $17,032,750)a year, by which amount the country has beendebited. Simultaneously, however, there havebeen effected public debt amortizations to anamount of £1,233,393 ($6,002,307) and 862,-000,000 drachmas ($11,206,000), and also certainprivate debts have been extinguished by somehundreds of thousands. This reduction of thecharges, constituting a burden on the country,neutralizes to a great extent the charge createdby fresh borrowings.
On the other hand, the remittances of emi-grants which passed through the chief Greekbanks were calculated to have reached thefigure of nearly £6,500,000 ($31,632,250) in1928. For 1929 they were estimated at £7,815,-000 ($38,031,698)—that is to say, they showedan increase of £1,315,000 ($6,399,448), whichstrengthened the position of our balance ofaccounts. This factor has constituted forquite a long time a significant element of ournational economy, constantly influencing ourbalance of accounts. Thus during the lastfive years the remittances of emigrants were asfollows:1925 £7, 304, 000 ($35, 544, 916)1926 7, 370, 000 ( 35, 866, 105)1927 6, 924, 000 ( 33, 695, 646)1928 6, 431, 000 ( 31, 296, 462)1929 7, 815, 000 ( 38, 031, 698)
There are some people who are still disturbedas to the probable results of the deficit of ourbalance of accounts, especially by reason of thegreat deficit existing in our external trade.But in almost all countries, even in those en-joying a vigorous national economy, the bal-
ance of trade, as such, develops from time totime a considerable deficit. This deficit iscovered from other sources which the countryexploits. In the countries possessing a healthyeconomy and currency, the deficit whichoccasionally appears in the balance of accountsis covered principally by the movement ofcapital. Capital being attracted to thosepoints where it can be used, fills up the gaps,and thus automatically restores the balance ofaccounts. The economic systems of variouscountries are closely interrelated, influencingeach other; their common characteristic qualityat the present time being their perpetualmovement, the transfer from place to place ofthe newly created capital and their constantstate of mobility. There is to be found in theinternational money market a great amountof floating capital which has not as yet beendiverted to permanent employment. Theeconomic purpose of this kind of capital is tomeet various needs as they arise; but we mustbear in mind that in order to attract suchcapital, and thus to profit through its timelyinflow, the conditions prevailing must be suchas to afford the necessary pledges of securityand order, and there must also exist thoseother conditions which render easy the transferof capital.
This, then, is the direction toward whichGreece is now heading, by formulating itslegislation on a basis of protection for capital,and endeavoring to create an atmosphere at-tractive to floating funds in internationalmoney markets. The existing good order inthe realm of our public finances; the progressof our home production to which has been de-voted all capital funds borrowed either fromthe public or private economy; the normaland regular service and redemption of ourloans, so necessary for maintaining undis-turbed our national credit; the maintenance,above all, of the integrity of our currency-r-ail these are the indispensably necessary ele-ments of the economic and financial health ofthe country. If any one of these elements isdisturbed the reaction is immediately felt; andthe situation created is not susceptible of anyeffective or easy treatment.
We believe that, so long as the above-men-tioned elements are kept undisturbed, oureconomy will attract the capital w hich it is inneed of; which capital, as happens elsewhere,will on each occasion fill up the gap and willbalance our accounts whenever deficits arecreated from other causes. For these reasons,therefore, the soundness of which can not pos-sibly be disputed by any serious student, we
Digitized for FRASER http://fraser.stlouisfed.org/ Federal Reserve Bank of St. Louis
634 FEDERAL RESERVE BULLETIN OCTOBER, 1930
believe that the fears entertained in somequarters are absolutely unfounded.
Reserve position.—As is natural in the cir-cumstances, the adverse movement of foreignexchange during the past year caused a gradualreduction of the proportion of cover to circu-lation.
The proportion of gold cover, which on De-cember 31, 1928, stood at 54.2 per cent of thetotal sight liabilities and 74.5 per cent of theactual circulation, declined on December 31,1929, to 46.4 per cent of the total sight liabili-ties and to 60 per cent of the note circulation.
The decline experienced in our gold coverduring the past year can not be regarded as anunusual phenomenon nor need it inspire anx-iety. A bank of issue, following a policy ofkeeping its cover at a certain fixed level with-out regard to circumstances, can not be con-sidered as fulfilling its mission. The marginabove the legal proportion of the cover mustmove with due reference to the occasionallychanging conditions of the market, followingsuch changes closely and adjusting circula-tion according to the requirements of thetransactions.
To have maintained, especially under un-favorable conditions, a cover consisting ofabsolutely liquid and stable gold values at alevel exceeding 46 per cent of the total liabili-ties of the bank is more than satisfactory,especially when regard is had to the fact thatin pre-war times a cover of about one-thirdof actual circulation only was considered morethan sufficient to enable the bank of issue toface with confidence all probable economicemergencies.
Our country, however, in addition to its ownresources, has still at its disposal from the pro-ceeds of the Tripartite loan and of the publicworks loan £1,316,017 ($6,404,397) destinedfor the liquidation of budget arrears, £534,210($2,599,733) for the continuation of the Vardardrainage works, and £835,964 ($4,068,219) forthe continuation of the refugees' settlement—sums which are deposited at the Bank of Greece.It is quite obvious, of course, that the aboveamounts will actually be spent within the coun-try. Finally, our country will have at its dis-posal, after the ratification of the Hague Con-ventions, an additional amount of 19,000,000gold marks ($4,525,800), or £931,370, whichwas adjudicated to Greece as indemnity forGreek ships sunk during the German submarinewarfare. This sum will be immediately avail-able following the ratification of the Youngplan. These extra funds, the total of whichreaches £3,675,000 ($17,884,388), constitute a
very powerful reserve element and hence afresh stimulant to the economic vitality ofGreece.
State debt to bank.—As regards the otheritems of the assets of the bank, the alterationeffected in the public debt to the bank isworthy of notice. This debt, which on De-cember 31, 1928, amounted to 3,789,600,000drachmas- ($49,264,800), had by December31, 1929, reached the figure of 3,596,500,000drachmas ($46,754,500); that is to say, it wasreduced by 193,100,000 drachmas ($2,510,300).This reduction is due to the regular annualliquidation provided in the agreement ofOctober 27, 1927.
This annual decrease of the public debt is ofparticular significance in that it improves eachyear the composition of the bank's assets.With this end in view we proceeded to anagreement with the State by virtue of whichthe bank may discount these obligations of theState. Even during the past year there wasobservable a considerable improvement in therelative proportions of the bank's assets otherthan note cover. Whereas in December, 1928,out of total assets amounting to 3,899,100,000drachmas ($50,688,300), 3,789,600,000 ($49,-264,800) represented the State debt and only109,500,000 ($1,423,500) commercial invest-ments, on December 31, 1929, out of total assetsreaching the figure of 3,921,200,000 drachmas($50,975,600), the State debt amounted to3,596,500,000 ($46,754,500) and the commer-cial investments to 324,700,000 drachmas($4,221,100). The improvement during thepresent year will be still greater and willprove how wise was the solution accepted at thetime of stabilization in regard to the liquidationof the "cours force" and other State debts.
Credit policy.—As regards the granting ofcredits, the complaint was made that thebank did not sufficiently assist the marketwhen a shrinkage in circulation occurred.This complaint is surely the result of a mis-understanding.
It is necessary clearly to realize that it isnot the duty of a bank of issue to meet all thecapital requirements of the market. Theexistence of available capital funds within thecountry depends upon speed and efficiency ofproduction which, under favorable circum-stances, create a surplus of capital leading toactual saving.
Also, abundance of capital depends upon thecredit of the country, as foreign capital is at-tracted where the public credit is consideredsafe. The bank of issue can not grant suchcredits nor create such capital funds. What
Digitized for FRASER http://fraser.stlouisfed.org/ Federal Reserve Bank of St. Louis
OCTOBER, 1930 FEDERAL RESERVE BULLETIN 635
the bank of issue really does is to make liquidcapital available; that is, capital destined toassist commercial transactions temporarilyby making liquid the values arising out of suchtransactions. The bank may create new funds,and place them at the disposal of business menon condition that the credits granted be usedfor values already in existence, the creditsbeing strictly short-dated and alsft of a purelycommercial character.
The Bank of Greece has never refused todiscount such bona fide commercial bills. If,however, it so happens that the extent of thesebills is strictly limited, and that the commercialbanks, for special reasons, do not think itdesirable to discount their portfolio in order toincrease their available cash and thus grantnew credits to the market; if it so happens that,again on account of special reasons, a necessityor simply a demand is felt for other kinds ofcredit facilities, it must be pointed out that thebank is not entitled to grant facilities of thiskind, because this sort of business is totallyforeign to the proper operations of an issuinginstitution.
On the contrary, the bank would have beenopen to criticism if, in order to assist distressedenterprises, it had decided to deviate from itsstatutes and depart from its proper field of oper-ations by directly granting open credits orcredits on guarantees that were not capable ofimmediate realization or by giving long-datedcredits. Such a policy would inevitably haveresulted in a diminution of the capacity of thebank to discharge its chief function, which isthe safeguarding of the stability of our nationalcurrency and the exercise of control over circu-lation and credit.
The policy followed by the bank during thepast year has also been criticized from anotherpoint of view, quite different from the previousone. It has been considered a mistake on thepart of the bank that, although it realized per-fectly well that there was a tendency towardan outflow of capital, it did not raise its dis-count rate in order to check that tendency.
It is, of course, beyond all doubt that theadjustment of the discount rate constitutes, as ageneral rule, one of the most important weaponsat the disposal of a bank of issue. The raisingof the discount rate exercises an influence uponfloating capital, which is induced either toremain in or return to the country, in viewT ofthe profits arising from the increase of the re-muneration of capital. It also encourages theconversion of foreign capital into home securi-ties, because the increase of the discount raterestrains speculation for the rise, tends to lower
the prices of securities on the stock exchange,and makes it profitable for foreign capital toinvest in such securities. It also exercises anindirect and slower influence on the other itemsof our economic balance.
It would, however, be an error to believe thatthe foregoing results are brought about me-chanically and recur inevitably at all times andplaces and under all circumstances. Economicphenomena do not partake of a mecnanicalnature; economic rules have only a relativeapplication. Consequently the reaction to amovement of the discount rate depends uponcertain antecedent conditions and is subject tocertain limitations, while its usefulness andefficiency depend upon the actual situation ofthe particular economy in relation to which itis applied.
Unfortunately Greece is classed among thecountries w here money is rather dear. If theofficial discount rate is 9 per cent, the lawfulconventional rate, to which in principle ourcurrent banking rates conform, is 4 per centhigher—that is, 13 per cent, and the rate onoverdue payments is 12 per cent. In spite, how-ever, of the legal restrictions, the actual chargeon capital in the open market is still higher.Keeping this fact in mind, let us examine theeconomic situation of the past year.
During the past year difficulties that wereapparent long ago resulted in a crisis whichaffected certain branches of our national econ-omy, especially industry. This crisis, which inthe beginning attacked the weaker enterprisesonly, extended afterwards, as was inevitable,to the most powerful concerns. Further, theabrupt change in the composition of the coun-try's population, as a result of the influx of newelements, differing from those already estab-lished, has continued to press hard upon ournational economy; the urban population hasincreased beyond due limits and has not as yetbeen able to conform, in a reasonable degree,to such limits. The consequence of this evolu-tion of our economy, in relation to the specialsubject that we are interested in, has beenthat, just as in the case of all countries passingthrough a critical period, tne factor inducingcapital to remain in or flow into Greece wasthe factor of safety. This factor being morepowerful than the one affecting capital remun-eration—that is, interest—was also governedby other than purely economic considerations,namely, by certain psychological influences.For the sake, then, of safety the discount ratewas maintained at a high level; but in spiteof this the result of attracting foreign capitalinto the countrv was not realized.
Digitized for FRASER http://fraser.stlouisfed.org/ Federal Reserve Bank of St. Louis
636 FEDERAL RESERVE BULLETIN OCTOBER, 1930
It appears that all the immediate resultswhich we might expect to obtain from keepingthe discount rate at a high level have been pro-duced by other factors more powerful than thediscount rate. Under such conditions theraising of the discount rate would have aggra-vated the abnormal situation without attainingthe desired result and would have affected themovement of capital and its inflow in the coun-try and consequently the improvement of theeconomic balance as long as there was in theair a spirit of uncertainty as regards the safetyof the capital disposable for investment.
With these considerations in mind, the bankdid not raise its discount rate during the pastyear. At the same time, however, it refrainedfrom encouraging any movement aiming at anartificial rise in the prices of securities, becausewe were of the opinion that any such attemptwould run counter to the interests of oureconomy and would have constituted anuncalled-for waste of capital. On the otherhand, the temporary depression in the pricesof absolutely safe securities necessarily leadsto the inflow of new capital which is attractedby the low quotations and the advantagesresulting therefrom.
But although the bank, for special reasonsalready explained, did not have recourse to themethod of raising the discount rate, neverthe-less, conscious of the necessity and efficiencyof this measure, we will not have the slighesthesitation in adopting this policy, if and whenthe vital interests of the country render such apolicy imperative.
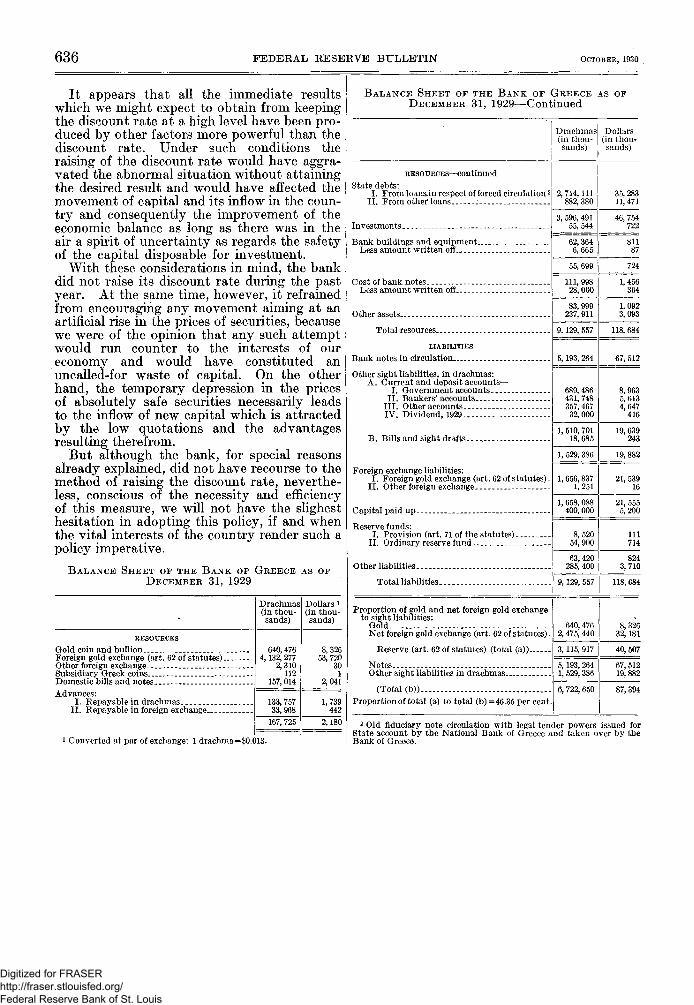
BALANCE SHEET OF THE BANK OF GREECE AS OFDECEMBER 31, 1929
RESOURCES
Gold coin and bullionForeign gold exchange (art. 62 of statutes)Other foreign exchangeSubsidiary Greek coinsDomestic bills and notesAdvances:
I. Repayable in drachmasII. Repayable in foreign exchange
Drachmas(in thosands)
640,4764,132, 277
2,310112
157, 014
133, 75733, 968
167, 725
Dollars i(in thou-sands)
8,32653, 720
301
2,041
1,739442
2,180
1 Converted at par of exchange: 1 drachma=$0.013.
BALANCE SHEET OF THE BANK OF GREECE AS OFDECEMBER 31, 1929—Continued
RESOURCES—continued
State debts:I. From loansin respect of forced circulation2
II From othef loans _. ' _
Investments _
Bank buildings and equipmentLess amount written off
Cost of bank notes ._ __ _Less amount written off
Other assets
Total resources
LIABILITIES
Bank notes in circulation
Other sight liabilities, in drachmas:A. Current and deposit accounts—
I. Government accountsII . Bankers'accounts
III . Other accountsIV. Dividend, 1929
B. Bills and sight drafts.._Y
Foreign exchange liabilities:I. Foreign gold exchange (art. 62 of statutes).
II. Other foreign exchange
Capital paid up __ _
Reserve funds:I. Provision (art. 71 of the statutes)
II. Ordinary reserve fund
Other liabilities
Total liabilities .
Proportion of gold and net foreign gold exchangeto sight liabilities:
GoldNet foreign gold exchange (art. 62 of statutes).
Reserve (art. 62 of statutes) (total (a))
NotesOther sight liabilities in drachmas
(Total (b))Proportion of total (a) to total (b) =46.35 per cent.
Drachmas(in thou-sands)
2, 714, 111882, 380
3, 596, 49155, 544
62, 3646,665
55, 699
111, 99828, 000
83, 999237,911
9,129, 557
5,193, 264
689, 486431, 748357, 467
32, 000
1, 510, 70118, 685
1, 529, 386
1,656,8371,251
1, 658, 088400, 000
8,52054, 900
63, 420285, 400
9,129, 557
640, 4762,475, 440
3,115, 917
5,193, 2641, 529, 386
6, 722,650
Dollars(in thou-sands)
35, 28311,471
46, 754722
81187
724
1,456364
1,0923,093
118,684
67, 512
8,9635,6134,647
416
19,639243
19, 882
21, 53916
21, 5555,200
111714
8243,710
118, 684
8,32632,181
40, 507
67, 51219, 882
87, 394
2 Old fiduciary note circulation with legal tender powers issued forState account by the National Bank of Greece and taken over by theBank of Greece.
Digitized for FRASER http://fraser.stlouisfed.org/ Federal Reserve Bank of St. Louis
OCTOBER, 1930 FEDERAL RESERVE BULLETIN 637
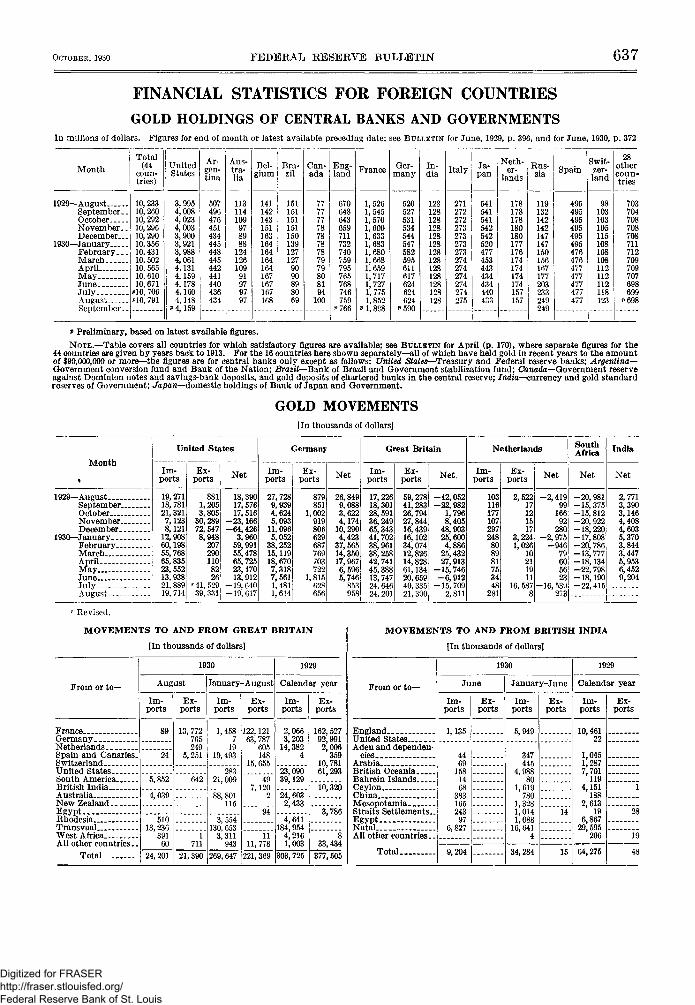
FINANCIAL STATISTICS FOR FOREIGN COUNTRIES
GOLD HOLDINGS OF CENTRAL BANKS AND GOVERNMENTSIn millions of dollars. Figures for end of month or latest available preceding date; see BULLETIN for June, 1929, p . 396, and for June, 1930, p . 372
141 , 151142 ! 151143 151151 i 151163 : 150164 i 139164164164167167167168
127127
Can-ada
777777787878787979808194
100
Eng-land
670648643659711732740759795765768746759
France
1,5261,545
, 570,600,633
,659,717,727
1,7751,8521,898
Ger-many
520527531534544547582595611617624624624
P590
In-dia
128128128128128128128128128128128128128
IJa-
271272272273273 j273 I273 j274 !274274274274
541541541542542520477453443434434440
275 I 433
Neth-
! lands
178178178180180177176174174174174157157
Rus-sia
Swit-zer-land
119132142142147147150156167177203233249249
495495495495495495476476477477477477477
103103105115108108108112112112118123
28othercoun-tries
703704708
711712709709707698699
* Preliminary, based on latest available figures.
NOTE.—Table covers all countries for which satisfactory figures are available; see BULLETIN for April (p. 170), where separate figures for the44 countries are given by years back to 1913. For the 16 countries here shown separately—all of which have held gold in recent years to the amountof $90,000,000 or more—the figures are for central banks only except as follows: United States—Treasury and Federal reserve banks; Argentina—Government conversion fund and Bank of the Nation; Brazil—Bank of Brazil and Government stabilization fund; Canada—Government reserveagainst Dominion notes and savings-bank deposits, and gold deposits of chartered banks in the central reserve; India—currency and gold standardreserves of Government; Japan—domestic holdings of Bank of Japan and Government.
1 Based on noon buying rates for cable transfers in New York.2 Averages based on daily quotations of closing rates as published by New York Journal of Commerce.3 Chervonetz quotations nominal.4 Silver currency. The figure give for parity represents gold value of unit in September, 1930, computed by multiplying silver content of unit
by New York average price of silver for September, 1930, which was $0.36632 per fine ounce. On the same basis, parity in September, 1929, for theChinese-Mexican dollar was 40.36 cents; for the Shanghai tael, 55.64 cents; for the Yuan dollar, 39.47 cents; and for the Hong Kong dollar, 40.06 cents.
s May, 1930. 6 j u n e , 1930. i j u i y > 1930.
Back figures.—See BULLETIN for January, 193Q, 1929, and 1928.
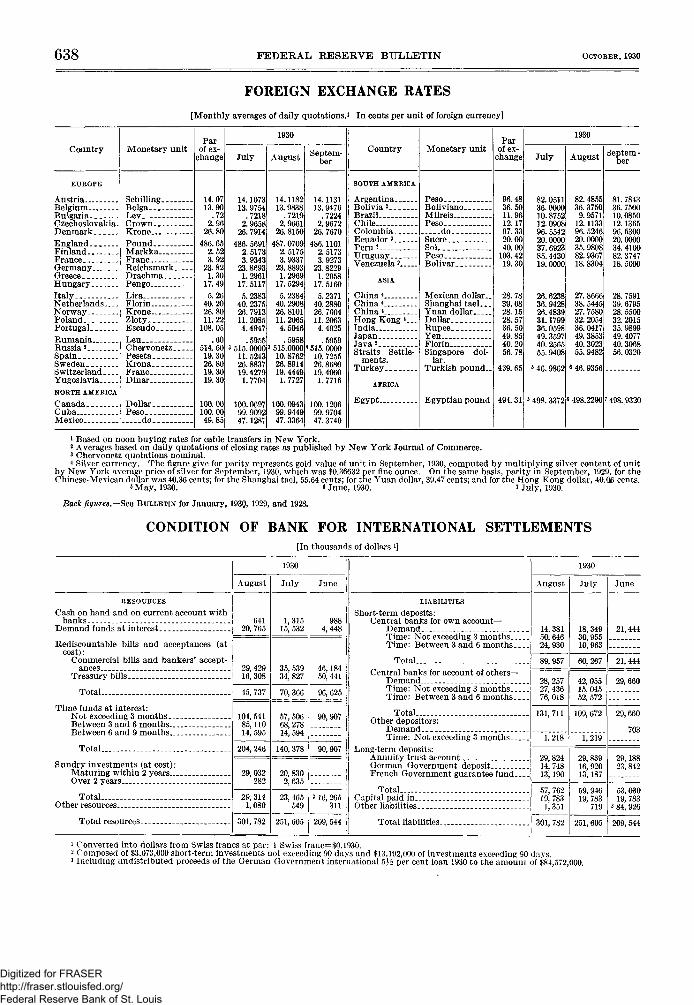
CONDITION OF BANK FOR INTERNATIONAL SETTLEMENTS[In thousands of dollars 1]
RESOURCES
Cash on hand and on current account withbanks _ _ _ _ _
Demand funds at interest
Rediscountable bills and acceptances (atcost):
Commercial bills and bankers' accept-ances
Treasury bills
Total _.
Time funds at interest:Not exceeding 3 monthsBetween 3 and 6 monthsBetween 6 and 9 months
TotalSundry investments (at cost):
Maturing within 2 yearsOver 2 years
TotalOther resources
Total resources
1930
August
64120, 765
29, 42916, 308
45, 737
104, 54185,11014, 595
204,246
29, 032282
29, 3141,080
301, 782
July
1,31515, 532
Juno
9884.448
35, 53934, 827
70, 366
57, 50668, 27814, 594
140,378
20, 8302,635
23, 465549
251, 605
46,18450,441
96,625
90,907 |
90,907
2 16, 265311
209,544 i
LIABILITIES
Short-term deposits:Central banks for own account—
DemandTime: Not exceeding 3 monthsTime: Between 3 and 6 months
TotalCentral banks for account of others—
DemandTime: Not exceeding 3 monthsTime: Between 3 and 6 months
TotalOther depositors:
Demand _ _Time: Not exceeding 3 months
Long-term deposits:Annuity trust accountGerman Government deposit .__French Government guarantee fund _
TotalCapital paid inOther liabilities
Total liabilities
1930
August
14, 38150, 64624, 930
89, 957
28, 25727, 43676, 018
131,711
1, 218
29, 82414, 74813,190
57, 76219, 7831,351
301, 782
July
18, 34930, 95510, 963
60, 267
42, 05515, 04552, 572
109, 672
1,219
29, 83916, 92013,187
59, 94619, 783
719
251, 605
June
21,444
21,444
29, 660
29, 660
703
29,18823,842
53, 03019, 783
i 84, 926
209, 544
1 Converted into dollars from Swiss francs at par: 1 Swiss franc=$0.1930.2 Composed of $3,073,000 short-term investments not exceeding 90 days and $13,192,000 of investments exceeding 90 days.3 Including undistributed proceeds of the German Government international 5H per cent loan 1930 to the amount of $84,572,000.
Digitized for FRASER http://fraser.stlouisfed.org/ Federal Reserve Bank of St. Louis
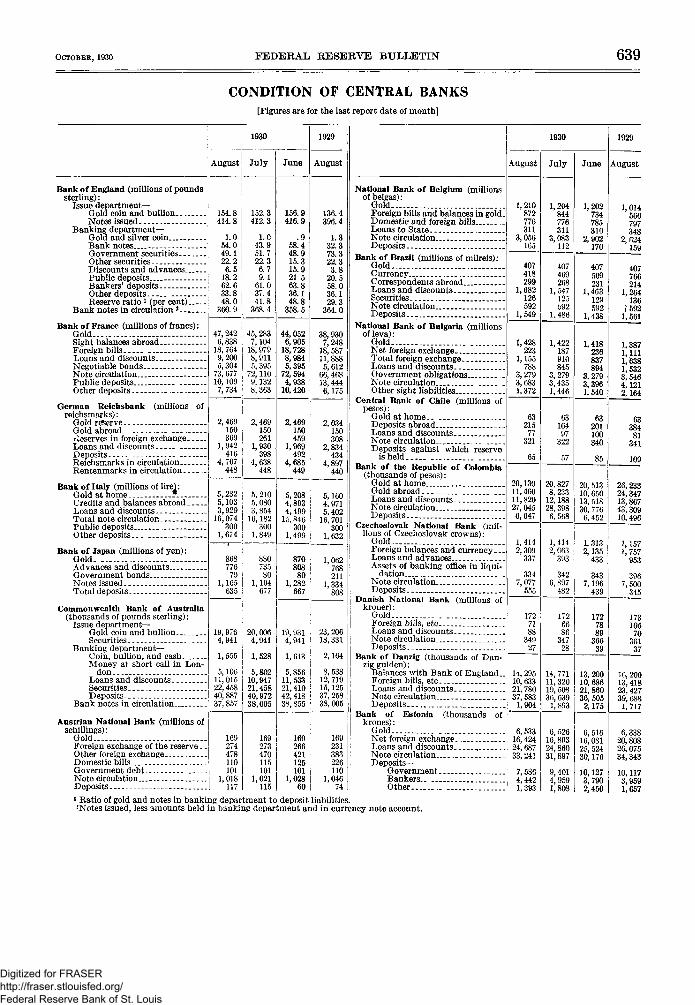
OCTOBER, 1930 FEDEKAL KESERVE BULLETIN 639
CONDITION OF CENTRAL BANKS[Figures are for the last report date of month]
Bank of England (millions of poundssterling):
Issue department—Gold coin and bullionNotes issued
Banking department-Gold and silver coinBank notes _._Government securitiesOther securitiesDiscounts and advancesPublic depositsBankers' depositsOther depositsReserve ratio * (per cent)
Bank notes in circulation J
: 1930
! August' Julyj j
154.8414.8
1.054.049.122.2
Bank of France (millions of francs):GoldSight balances abroadForeign billsLoans and discounts. - . .Negotiable bonds _Note circulation -Public deposits . .Other deposits
German Reichsbank (millions ofreichsmarks):
Gold reserveGold abroadReserves in foreign exchangeLoans and discountsDepositsReichsmarks in circulationRentenmarks in circulation
Bank of Italy (millions of lire}:Gold at home ". .Credits and balances abroad.Loans and discountsTotal note circulationPublic depositsOther deposits.. _
Bank of Japan (millions of yen):GoldAdvances and discounts _Government bondsNotes issuedTotal deposits
Commonwealth Bank of Australia(thousands of pounds sterling):
Issue department-Gold coin and bullionSecurities
Banking department-Coin, bullion, and cash..Money at short call in Lon-
donLoans and discountsSecurities _...Deposits
Bank notes in circulation _.
Austrian National Bank (millions ofschillings):
GoldForeign exchange of the reserve..Other foreign exchangeDomestic billsGovernment debtNote circulationDeposits
6.5 I18.2 i62.633.848.0
360.9
47,2426,838
18, 7649,2005,304
73, 67710,1097,734
152.3412.3
1.043.951.722.36.79.1
61.037.441.8
368.4
45, 2837,104
18, 9798,9115, 395
72,1109,1328,363
2,469150369
1, 942416
4,707448
2,469150261
1,930398
4,638448
5,232 ;5,103 '3,929 !
16,074 |300 !
1,674 j
5. 2105; 0803,854
16,182300
1,849
77679
1,165635
88073580
1,104677
June
156.9416.9
.958.448.915.315.921 563.836.148.8
358.5
1929
August
44,0526,905
18, 728
5,39572, 5944,938
10,420
2,469150459
1,969492
4,685449
19,976 20,0064, 941 4,941
1,555
5,10611,01522,458
1,528
5,80210,94721,458
40,887 I 40,97237,857 I 38,005
169274478110101
1,018 I117 I
19,9314,941
1, 613
5,85611,53321,41042, 41838,855
169 I273 i470 I115 I101
1,021115 I
169266421125101 1
1,028 j60 I
136.4396.4
1.332.373.322.33.820.558.036.129.3364.0
38, 9307,24818,58711, 8885,61266,46813,4446,175
2,034150308
2,834434
4,897440
5,208 ,4,893 !4,499 j
15,846 !300 ,
1,499 j
5,1604,9715,40216, 701
3001,632
870 :808 i80 !
1,282667
1,062768211
1,334
23, 20618, 331
2,164
8,53812, 71915,12537, 25838,005
169231383226110
1,04674
National Bank of Belgium (millionsof belgas):
GoldForeign bills and balances in gold.Domestic and foreign bills.Loans to StateNote circulationDeposits _
Bank of Brazil (millions of milreis) :G o l d . . . .Currency..Correspondents abroadLoans and discountsSecuritiesNote circulation.Deposits _
Gold at homeDeposits abroad.Loans and discountsNote circulation...Deposits against which reserve
is heldBank of the Republic of Colombia
(thousands of pesos):Gold at homeGold abroadLoans and discounts.Note circulationDeposits __
Czechoslovak National Bank (mil-lions of Czechoslovak crowns):
GoldForeign balances and currency. - .Loans and advancesAssets of banking office in liqui-
dation _Note circulationDeposits
Danish National Bank (millions ofkroner):
GoldForeign bills, etcLoans and discounts.Note circulationDeposits
Bank of Danzig (thousands of Dan-zig gulden):
Balances with Bank of England. .Foreign bills, etcLoans and discountsNote circulation ._Deposits _ _
Bank of Estonia (thousands ofkrones):
GoldNet foreign exchange.._Loans and discounts ,„Note circulationDeposits—
GovernmentBankersOther __
1930
August
1,210872776311
3,056165
407418299
1,682126592
1,549
1,428223
1,155788
3, 2793,6831,372
6321577321
65
20,13011,46011,82027, 0456,647
1,4142,309337
3347,077555
17271
34927
14,29510, 63321, 78037, 5831,904
6,53316, 42424,68733,241
7,5864,4421,393
July
1 Ratio of gold and notes in banking department to deposit liabilities.JNotes issued, less amounts held in banking department and in currency note account.
1,204844776311
3,083112
407469268
1,547125592
1,486
1,422187910845
3,2793,4351,446
6316497322
20, 8278,23312,18828,3986, 568
June
1,202734785310
2,902170
407509231
1,463129592
1,438
1,418236837894
3,2793,3961,540
63201100340
85
20, 51310, 65013, 51830, 7766,452
1,414 1,3132, C63 j 2,135393 1 433
3426,897482
3437,196439
172668631728
14,77111, 32019, 50836, 6391,893
17278
39
13, 20010,68621, 86036, 5052,175
6, 52616,80324,86031,897
9,4014,9591,808
6,51616,08125, 52430,176
10,1273,7902,450
1929
August
1,014566797348
2, 024159
407766214
1,264136
I 5921,561
1,3871,1111,6381,5323,5464,1212,164
38481341
109
26, 23324,34713,86743, 30910. 496
1,1571,757953
3967, 500345
1731057036137
16, 20013,41823, 42739, 6881,717
6,33820,80826, 07534,343
10,1173,9591,657
Digitized for FRASER http://fraser.stlouisfed.org/ Federal Reserve Bank of St. Louis
640 FEDERAL RESERVE BULLETIN OCTOBER, 1930
CONDITION OF CENTRAL BANKS—Continued[Figures are for the last report date of month]
GoldNet foreign exchange in reserve...Total foreign exchangeLoans and discountsGovernment obligations __.Note circulationOther sight liabilities
National Bank of Hungary (mil-lions of pengos):
GoldForeign bills, etc _ ..Loans and discounts __Advances to treasuryOther assetsNote circulation _ _DepositsMiscellaneous liabilities
Bank of Java (millions of florins):Gold —Foreign billsLoans and discountsNote circulation _Deposits
Bank of Latvia (millions of lats):Gold —Foreign exchange reserveBills _—LoansNote circulation _Government depositsOther deposits
Bank of Lithuania (millions of litas):Gold —Foreign currency _Loans and discountsNote circulationDeposits
Netherlands Bank (millions offlorins):
GoldForeign billsLoans and discountsNote circulationDeposits
Bank of Norway (millions of kroner):Gold _.Foreign balances and billsDomestic creditsNote circulation _Foreign depositsTotal deposits _
Reserve Bank of Peru (thousands ofsoles): i
Go ld - _Gold against demand deposits....Foreign exchange reserveBills _ _.Note circulationDeposits
1930
302
907191583
1,352149
5162,8533,770306
3,4894,7611,876
16342198701014405851
35769310395
39123413280025
147242203151
62
39,5843,57210,47316,96656,5247,145
301
949185630
1,355206
5662,7123,853282
3,4894,8161,576
1634320372914663347
139345326753
877191710
1,373151
5802,7263,555258
3,4894,8941, 505
1633223479844497146
139455627451
35789010096
39124113680916
147'222223151
60
40,8112,25112,74614,86357,0814,501
43223815984331
14753228316290
38,7864,18817,74114,23957,4538,376
1929
August
301
52020
1,3521,448
178
6192,7214,871158
3,5975,2141,551
1634029389108480117
14835146306
44315416280113
14741259315282
43,01310,71223,03121,78264,46517,610
ank of Poland (millions of zlotys):Gold at homeGold abroad__ _._Foreign exchange of the reserve...Other foreign exchangeLoans and discountsNote circulation _Current account of the treasury..Other current accounts
Bank of Spain (millions of pesetas):GoldSilver.Balances abroad _.Loans and discountsNote circulationDeposits .__
Bank of Sweden (millions of kronor):GoldForeign bills, etcLoans and discountsNote circulationDeposits
Swiss National Bank (millions offrancs):
GoldForeign balances and billsLoans and discountsNote circulationDemand deposits
National Bank of the Kingdom ofYugoslavia (millions of dinars):
GoldForeign notes and creditsLoans and discountsAdvances to StateNote circulationDeposits
6,8437,511
3608,676
1,8814,764
2,47472026
2,0004,456
826
242349160570106
63934265943176
2021,4412,9975,5211,072
484219222111685
1,32189153
9109347
1,951i
5,3563,9191, 527
408.7485, G9918,5346,979
6,4887,736206
7,459
2,3124,730122
2,47272132
1,9234,396818
243360131551110
61033379928171
2261,3942,9975,3171,153
484219211112054
1,31782155
9205315
1,89082
5,3503,9191,371
418,9215,79718,2227,481
402,025221,841
39,4502, o485.822
180,037
6,9237,505295
8,550
1,4964,602139
2,47172435
1,8704,335807
243398215594189
579300108929130
43221944184796
1,359269145
9351308
1,91254
97222
1,3452,9975,2301,247
5,1583,5925,793
7910,0607,47220,34010,495
395,607202, 747
23,0984,0458,428
135,989
7,9017,6551,6009,533
1,6874,816292
2,56571990
2,0864,327938
242205346549149
50721020991151
94255
1,6123,0005,659898
1 Figures for August, 1929, have been converted from libras (par $4.8665) into soles (par $0.4000).r Revised.See Federal Reserve Bulletin for May, 1930.
Digitized for FRASER http://fraser.stlouisfed.org/ Federal Reserve Bank of St. Louis
OCTOBER, 1930 FEDERAL RESERVE BULLETIN 641
CONDITION OF COMMERCIAL BANKS
Country
Canada:Gold and subsidiary coin 1.Money at call and short notice . . .Current loans and discountsPublic and railway securitiesNote circulationIndividual depositsGold reserve against Dominion notes-Dominion note circulation..
Argentina:Bank of the Nation-
Gold.Other cashLoans and discountsDeposits
Other banks in Buenos Aires-GoldOther cashLoans and discounts
England:Cash in vault and at banksMoney at call and short notice . __Advances and discountsInvestmentsDeposits . _
France:Bills and national-defense bondsLoans and advancesDemand depositsTime deposits
Germany:Bills and treasury notesDue from other banksMiscellaneous loansDepositsAcceptances
Denmark:Loans and discountsDue from foreign banksDue to foreign banksDeposits and current accounts
Norway:Loans and discounts __ ..-Due from foreign banksDue to foreign banksRediscounts _Deposits
Sweden:Loans and discounts ._Foreign bills and credits abroadDue to foreign banksRediscountsDeposits
Japan:Cash on hand• Total loansTotal deposits _. .
Millions of national Icurrency
June
Mill60 i
435 I1,550
444166
2,44966
174
Mil7
123586726
10197870
1,015
1930
July August
1ons of dollars
63 62422 445
1,502 1,483447 458152 166
2,30177
166
ions of p7
12!)593731
10199867
1.007
2,38783
163
esos
Millions of poundssterling
189 j 191 188144
1,231233
1,788Mill
20,21910,83235 163
1,465Millioi3, 2561 1138, 588
12, 297481
Mill1, 823
12469
2, 003Mil
1,2261066878
1, 483Mil
4,407268259
71
2302,1922,072
1431, 236
2411,794
1351,215
2501.767
ions of francs
s of reichstnarks2 964 2.9181,2188, 579
12,067507
1,0548, 593
18, 804522
ons of kroner1 818' 123
66 i2,010
ions of k1,224
1206576
1,489ions of k
4,437304237
143,722
llions of197
2 1762, 052
roner1,211
1246576
1,485onor
4,487283220
363.709
yen181
2,1482,051
June
61594
1,566525187
2, 55959
210
75121549750
13177843979
938728
5,8131,1858,615
810391
1,30339
i
4733817
524
336272127
417
1,107703070
i 928
127933920
1929
July
62577
1,572470170
2, 57859
196
65125542734
12156852972
924696
5, 9321,1788,654
782415
1,27239
4763718
523
339332226
417
1,120743151
946
118951952
August
61584
1,585462190
2,55160
199
62122552734
12161853975
915701
5,8631,1768,558
757418
1,23742
644328
1,9022,687
121
4763917
528
340352327
418
1,125823154
946
141974983
Millions of dollars
March
60415
1,626418163
2,45963
174
698
525631
10166754867
882645
5,6311,0968,185
804418
1,31458
770282
2,0522,920
122
4883324
532
329282024
404
1,166723842
980
1141,0801,022
April
60415
1,601428155
2,47264
174
6108533646
10166780890
911650
5,7291,0958,331
773440
1,32557
755271
2,0762,921
117
4913022
532
333302124
402
1,167704224
989
1401,0611,017
1930
M a y
60417
1,573431165
2,40165
170
6110492629
10165759875
897666
5,8571,1278,478
762420
1,33861
755275
2,0592,916
116
4862922
532
331302022
399
1,173684215
981
1281,0771,021
June
60435
1,550444166
2,44966
174
6104495613
10166735857
921699
5,9931,1328,701
793425
1,37857
776265
2,0462,929
115
4893318
537
328281821
397
1,181726919
978
1151,0931,033
July
63422
1,502447152
2,39177
166
6104486599
10163712826
931697
6,0151,1718,730
706290
2,0442,874
121
4873318
539
328321821
399
1.1898164
4997
981,0861,023
August
62445
1,483458166
2,38783
163
915657
5,9121,2178,600
695251
2,04V4,479
124
325331720
398
1,193765910
994
901,0711,022
i Not including amounts held abroad.^JNOTE.—Banks included are as follows: Canada—Chartered banks; England—nine London clearing banks; France—four commercial banks;
Qermany—six Berlin banks; Denmark, Norway, and Sweden—joint-stock banks; Japan—Tokyo banks.
Digitized for FRASER http://fraser.stlouisfed.org/ Federal Reserve Bank of St. Louis
642 FEDERAL RESERVE BULLETIN OCTOBER, 1930
DISCOUNT RATES OF CENTRAL BANKS(Rate prevailing October 1, 1930, with date of latest change]
NOTE.—For sources used, methods of quotation, and back figures, see BULLETIN for November, 1926, April, 1927, July, 1929, November, 1929, andMay, 1930.
Digitized for FRASER http://fraser.stlouisfed.org/ Federal Reserve Bank of St. Louis
OCTOBER, 1930 FEDEKAL RESERVE BULLETIN 643
PRICE MOVEMENTS IN PRINCIPAL COUNTRIESWHOLESALE PRICES—ALL COMMODITIES
••Revised.NOTE.—All of the indexes shown, with two or three exceptions, are compiled by official agencies in the countries to which they relate, as indi-
cated specifically in the BULLETIN for March (p. 124), where references are also given to sources in which current figures of the index numbers mavbe found.
The base periods are as follows: United States—1926; Australia—July, 1914; Austria—January-July, 1914; Belgium—April, 1914; Canada—1926;China—February, 1913; Czechoslovakia—July, 1914; Denmark—1913; Dutch East Indies—1913; Egypt—January 1, 1913-July 31, 1914; England—1913*Finland—1926; France—1913; Germany—1913; Hungary—1913; India—July, 1914; Italy—1913; Japan—October, 1900; Netherlands—1913; New Zealand—1909-1913; Norway—December 31, 1913-June 30, 1914; Peru—1913; Poland—1927; Russia—1913; South Africa—1910; -Spain—1913; Sweden—1913;Switzerland—July, 1914.
Annual indexes for the years 1925-1929 and in certain cases for 1913 and 1914 were given in the BULLETIN for April (p. 256).
Digitized for FRASER http://fraser.stlouisfed.org/ Federal Reserve Bank of St. Louis
Industrial raw and semifinished products—Continued Industrial finished products
Textiles
137
118114116116111105101
Hidesand
leather
122
114111110111112108108
Chemi-cals
127
127127127126126125125
Artificialfertilizers
82
8686868384
'7879
Technicaloils and
fats
129
127126127135134131133
Rubber
29
22222120181715
Papermaterialsand paper
152
150150149147145143139
Buildingmaterial
161
158157157156153149145
Total
158
155153152152151151149
Pro-ducers'goods
140
139139139139138138139
Con-sumers'goods
171
166163162161161160158
1 The index for other commodities, recently published by the Bureau of Labor Statistics, includes %he prices of articles In the all-commoditiesindex with the exception of those for farm products and foods; the nonagricultural index omits merely larm products.
r Revised.NOTE.—Annual indexes for the groups shown in the table are given for the years 1913 and 1925-1929 in the BULLETIN for April (p. 257). Orig-
inal sources for these indexes are: United States— Wholesale Prices of Commodities, Bureau of Labor Statistics, Department of Labor; England-Board of Trade Journal and Commercial Gazette, Board of Trade; France—Bulletin de la Statistique G6n6rale de la France, Supplement Mensuel,Statistique G6n6rale de la France; and Germany—Wirtschaft und Statistik, Statistisches Reichsamt.
Digitized for FRASER http://fraser.stlouisfed.org/ Federal Reserve Bank of St. Louis
OCTOBER, 1930 FEDERAL RESERVE BULLETIN 645
LAW DEPARTMENTAmendment to Regulation D permitting computation
of deficiencies in reserves on the basis of memberbanks deposits at opening of business instead ofclose of business
The Federal Reserve Board has amended sub-section (a) of Section IV of its Regulation Dso as to provide that, in computing penaltiesfor deficiencies in reserves, the required reservebalance of each member bank at the close ofbusiness each day shall be based upon its netdeposit balances at the opening of business, in-stead of the close of business, on the same day.No change, however, was made in the existingpractice of computing such deficiencies on thebasis of average daily net deposit balances cov-ering semiweekly, weekly, or semimonthlyperiods.
This change has been made because fluctua-tions in their own deposit balances during theday, especially toward the close of business,made it difficult for member banks to estimateaccurately what their reserve requirementswould be each day when they were computedon the basis of their deposit balances as of theclose of business.
The amendment becomes effective as to eachmember bank at the beginning of the first re-serve computation period of such member bankcommencing after midnight on October 31,1930.
Section IV (a) of the regulation, as amended,reads as follows:
SECTION IV. PENALTIES FOR DEFICIENCIES IN
RESERVES
Inasmuch as it is essential that the law withrespect to the maintenance by member banks
of the required minimum reserve balancesbe strictly complied with, the Federal ReserveBoard, under authority vested in it by section19 of the Federal reserve act, hereby pre-scribes the following rules governing penaltiesfor deficiencies in reserves:
(a) Basic penalty.(1) Deficiencies in reserve balances of mem-
ber banks in cities where Federal reservebanks or branches thereof are located and insuch other reserve cities as the Federal Re-serve Board may designate from time to timewill be computed on the basis of average dailynet deposit balances covering semiweekly pe-riods. Deficiencies in reserve balances ofmember banks in all other reserve cities willbe computed on the basis of average dailynet deposit balances covering weekly periods.Deficiencies in reserve balances of other mem-ber banks will be computed on the basis ofaverage daily net deposit balances coveringsemimonthly periods.
(2) In computing such deficiencies the re-quired reserve balance of each member bankat the close of business each day shall be basedupon its net deposit balances at the openingof business on the same day; and the semi-weekly, weekly, and semimonthly periodsreferred to in paragraph (1) hereof shall end atthe close of business on days to be fixed by theFederal reserve banks with the approval of theFederal Reserve Board.
(3) Penalties for such deficiencies will beassessed monthly on the basis of average dailydeficiencies during each of the reserve com-putation periods ending in the preceding cal-endar month.
(4) Such penalties shall be assessed at abasic rate of 2 per cent per annum above theFederal reserve bank discount rate on 90-daycommercial paper, in effect on the first day ofthe calendar month in which the deficienciesoccurred.
Digitized for FRASER http://fraser.stlouisfed.org/ Federal Reserve Bank of St. Louis
646 FEDERAL RESERVE BULLETIN OCTOBER, 1930
DETAILED FEDERAL RESERVE STATISTICS, ETC.FEDERAL RESERVE BANKS—RESOURCES AND LIABILITIES IN DETAIL AND FEDERAL RESERVE NOTE STATEMENT
[In thousands of dollars]
RESOURCES
Gold with Federal reserve agents -_Gold redemption fund with United States Treasury
Gold held exclusively against Federal reserve notes _Gold settlement fund with Federal Reserve Board -- -Gold and gold certificates held by bank _ _ _
Total gold reserves. _ _ _ __ _ _Reserves other than gold _ _._ __
Deferred availability itemsCapital paid in _ _Surplus . __ _All other liabilities __ . _
Total liabilities _ _._ _ _ _
Contingent liability on bills purchased for foreign correspondents _ _FEDERAL RESERVE NOTE STATEMENT
Federal reserve notes:Issued to Federal reserve banks by Federal reserve agentsHeld by Federal reserve banks * _In actual circulation
Collateral held by agents as security for note issued to banks:
Eligible paper __ _ _ _ _
Total collateral.... _ _ _
1930
Sept . 30
1, 559, 25635,168
1,594,424549 362823, 568
2,967,354150,182
3,117, 53663,480
272, 361
193,11215, 630
208, 742
596, 538320
596,858
6,772701
17,398
1,102, 832
557,65718,26659,64412,196
4,931,611
18, 2661,360, 608
1,378,874
2,467, 39638, 795
5,24220,938
2, 532. 371
557, 65'<170, 648276,936
15,125
4, 931, 611
431, 634
1,779,582400, 708
1,3V 8, 874
1, 559, 256452, 200
2,011,456
Aug. 31
1, 564, 25635,918
1,600,174571, 305755, 293
2,926,772152,655
3,079, 42758,193
214, 545
••166,887'1,174
168,061
'601,648' 7 5
.601,723
8,572703
'31,694
'1,025,298
457,41719, 81259,609
'16,496
'4,716,252
19, 8121, 354, 065
1, 373, 877
2, 378,18721, 3875,350
18,479
2,423, 403
457,417169,790276,936'14,829
'4,716,252
470,674
1,728,762354, 885
1, 373, 877
1, 564,256' 360, 670
' 1, 924,926
1929
Sept . 30
1,549,34568,087
1,617,432740,537612,942
2,970,911154,789
3,125, 70061,170
958,290
214,01778,722
292,739
127,42834,810
162,238
15,425787
28,462
1,457,941
600,38722,73958,9369,793
5,336,666
22,7391,840,383
1,863,122• - —
2,326,12561,0505,670
21,988
2,414,833
600,387167,017254,39836,909
5,336,666
449,217
2,332,307469,185
1,863,122
1, 549,3451,159,394
2, 708, 739
1 Includes bills discounted for intermediate credit banks as follows: Latest month, $365,000; month ago, $296,000; year ago, $4,355,000; and notessecured by adjusted service certificates discounted for nonmember banks as follows: Latest month. $45,000; month ago. $39,000; year ago, $109,000.
2 Includes bills payable in foreign currencies as follows: Latest month, $1,075,000; month ago, $1,071,000; year ago, $16,955,000.a Uncollected items in excess of deferred availability items.* Excludes "F. R. notes of other F . R. Banks," which are consequently included in "actual circulation".
Revised.
Digitized for FRASER http://fraser.stlouisfed.org/ Federal Reserve Bank of St. Louis
OCTOBER, 1930 FEDERAL RESERVE BULLETIN 647
RESOURCES AND LIABILITIES OF EACH FEDERAL RESERVE BANK ON SEPTEMBER 30,1930
[In thousands of dollars]
RESOURCES
Gold with Federal reserveagent
Gold redemption fund withU. S. Treasury..
Total Boston NewYork
! Phila-; delphia
1, 559,256J 154,917
35,168 817
Gold held exclusively againstFederal reserve notes __ i
Gold settlement fund with jFederal Reserve Board J
Gold and gold certificates held jby banks i
1,594,424! 155,734
549,362; 21,951
823,568! 32,232
305,636! 140,000
14,448! 2, 047
320, 084| 142.04-
187,941; 50,930
Cleve-land
200,550
1,782
202, 332
56, 282
Rich-mond
61,000
1,527
62, 527
17, 700
503, 608 30,4791 59,0531 9,16/
Total gold reserves i 2,967, 354; 209,917! l,011f633! 223,456Reserves other than gold | 150,182; 13,272| 36,553; 8,073
Total reserves : 3,117,536i 223,189 1,048,186] 231,529Nonreserve cash I 63,480| 6,497| 17,890' 4,195
317,6677.81
89, 3948,258
325,485 97,652
At-lanta
119, 500
1,911
121,411
6,630
6, 708|
Chi-cago
179,000
1,2
134, 74912, 778
147, 527
180, 286
99,145
125,164
404, 59522, 236
St.Louis
53, 045
1,694
54, 739
22, 024
9,221
85, 9849,834
426,831| 95,8183,676j 3,744] 4,457J 9,625| 3,717
105,837!166, 524|
5,8645,142j
Bills discounted:Secured by U. S. Govern-
ment obligationsOther bills discounted
Total bills discounted. _. I 272,361; 11,006Bills bought ! 208,742; 21,487
"U. S. Government securities:Bonds.
I46,461 9,670| 14,13756, 672! 7, 603! 6, 803
103,133 17,27369,432j 104
Treasury notes j 287, 245Certificates and bills \ 271,397
i Excludes "Federal reserve notes of other Federal reserve banks," which are consequently included in "actual circulation."
Digitized for FRASER http://fraser.stlouisfed.org/ Federal Reserve Bank of St. Louis
648 FEDERAL RESERVE BULLETIN OCTOBER, 1930
BANK^DEBITS
[Debits to individual accounts. In millions of dollars]
New York CitvOutside New York City
Federal reserve district:BostonNew YorkPhiladelphiaClevelandRichmondAtlanta.ChicagoSt. Louis _Minneapolis.Kansas CityDallasSan Francisco
Total
Numberof centers
1140
117
10137
152159
151018
141
August,1930
25,05220,966
2,07925,864
1,9082,278
665848
5,597997730
1,290582
3,179
46,018
July,1930
29,60023,171
2,47630, 5152,1352,765
741917
6,1381,108
6791,396
6003,300
52,771
August,1929
49,03328,339
3,30250,1762,5052,989
8181,1267,9681,221
9901,577
7233,977
77,372
MEMBERSHIP IN PAR-COLLECTION SYSTEM1
[Number of banks at end of August]
Federal reservedistrict
United States.
Boston _New YorkPhiladelphiaCleveland .RichmondAtlantaChicagoSt. LouisMinneapolisKansas CityDallas .San Francisco
Member banks
1930
8,271
398921756780485408
1,122547658886718592
1929
8,656
408936772805530432
1,218573693908765616
Nonmember banks
On par list
1930
11,412
267401461948554211
3,2971,543
5261,996
587621
1929
12, 242
270405479999596256
3, 5231,694
6042,169
612635
Not on par list
1930
3,632
38 co
W C
O C
O
237483
1,053184214
60
1929
3,779
10552934227476
1,112199208
61
1 Incorporated banks other than mutual savings banks.
KINDS OF MONEY IN CIRCULATION[End of month figures. In thousands of dollars]
Gold coinGold certificatesStandard silver dollarsSilver certificatesTreasury notes of 1890Subsidiary silver—Minor coinUnited States notesFederal reserve notesFederal reserve bank notes.National-bank notes
Total
June 30
357,236994,84138,629
386,9151,260
281,231117,436288,389
1,402,0663,206
650,779
4,521,988
July 31
356,0791,001,923
38,108381, 285
1,259279, 736117, 236287,878
1,320,2633,155
639,593
4,426,494
Aug. 31 Sept. 30 *I
353,3581,050,595
38,234390, 203
1,254280,162117,187297, 603
1,353,2003,126
648, 274
351,7651, 026, 076
37, 511391, 249
1,252280,732117,909297,307
1,359,3933,104
635, 23 i
4,533,197 • 4 am FAR
p Preliminary.
FEDERAL RESERVE BANKS—MATURITY DIS-TRIBUTION OF BILLS AND SHORT-TERMSECURITIES
[In thousands of dollars]
Bills discounted:Sept. 3Sept. 10Sept. 17Sept. 24
Bills bought inopen market:
Sept. 3Sept. 10Sept. 17Sept. 24
Certificates andbills:
Sept. 3Sept. 10Sept. 17Sept. 24
Municipal war-rants:
Sept. 3Sept. 10Sept. 17Sept. 24
Total
231,260183,195163,149167,162
170,395193,120208,861197,743
222,120226, 579277, 037271, 542
22222222
Within15 days
144,44799,77593,17798, 003
62, 77554,17383,508
105,051
34, 201I 34,769
45,000
16 to 30days
23,61224,29420, 54920, 581
53,41774, 50873, 57648,705
5665
31 to 60days
33,51136,42129,95530, 206
50,94851,66641, 05839,930
25, 214
61 to 90days
24,63817,94215,38014,496
3,13512, 75010,5464,047
17,21417,21496,53983,379
_ _ _i
91 daysto 6
months
4,9144,6163,9413,686
12023
17310
86,83186,3303,5003,523
22
Over 6months
138147147190
83,30888,261
131,998159,426
222222
Digitized for FRASER http://fraser.stlouisfed.org/ Federal Reserve Bank of St. Louis
OCTOBER, 1930 FEDERAL RESERVE BULLETIN 649
CHANGES IN MEMBERSHIP
On September 25, 1930, there were 8,260 activemember banks in the Federal reserve system, including7,204 national banks and 1,056 State bank members.Below are given all changes, except suspensions andinsolvencies, between August 26 and September 25affecting the list of active member banks.
Date Changes Capital
DISTRICT N O . 2—NEW YORK
Aug. 30 East Rockaway National Bank, East Rockaway,N. Y., title changed to East Rockaway Na-tional Bank & Trust Co.
Sept. 15 First National Bank, Odessa, N. YPrimary organization.
Sept. 16 Lefcourt National Bank & Trust Co., New York,N. Y., title changed to The National SafetyBank <k Trust Co.
DISTRICT N O . 3—PHILADELPHIA
Aug. 30 i Northeast-Tacony Bank & Trust Co., Philadel-j phia, Pa _.
Consolidated with County Trust Co., non-member.
Sept. 16 Bala-Cynwyd National Bank, Bala-Cynwyd, Pa-Absorbed by Merion Title & Trust Co., Ard-
more, Pa., nonmember.
Sept. 20
Sept. 3
Sept. 15
Aug. 30
Sept. 9
Aug. 28
Sept. 12
Sept. 19
Aug. 29
Sept. 4
Sept. 13
Sept. 20
Aug. 25
DISTRICT N O . 4—CLEVELAND
Citizens National Bank in Zanesville, OhioConsolidation of—
Old Citizens National BankZanesville Bank & Trust Co., non-
Absorbed by Union Trust Co., nonmember.Drovers & Mechanics National Bank, Baltimore,
MdMerged with Maryland Trust Co., a member.Under title of Maryland Trust Co
DISTRICT N O . 6—ATLANTA
Macqn National Bank, Macon, GaContinental Trust Co., nonmember
Consolidated under title of First NationalBank & Trust Co
First National Bank, Luverne, AlaAbsorbed by Bank of Luverne, Ala., non-
member.
DISTRICT N O . 7—CHICAGO
Security National Bank, Downers Grove, 111Absorbed by First National Bank . .
Western State Bank, Cicero, 111.Voluntary withdrawal.
Commercial State Bank, Mediapolis, IowaMerged with Citizens State Bank, non-
member.
DISTRICT N O . 8—ST. LOUIS
Clayton National Bank, Clayton, MoSucceeded by Clayton National Bank (No.
13481)State Bank of Collinsville, Collinsville, 111 _.
Admitted to membership.
DISTRICT N O . 9—MINNEAPOLIS
First National Bank, Ashley, N. DakAbsorbed by First State Bank, nonmember.
Lake Norden National Bank, Lake Norden, S.Dak., title changed to The First National Bank& Trust Co.
State Bank of Anoka, Anoka, MinnVoluntary withdrawal.
$50,000
250,000
50,000
400,000
200, 000
150,000100,000
100, 000
650,000
1, 000,0001, 000,0002, 500, 000
200, 000350,000
500, 00030,000
100,000100,000350,000
100,000
60, 000
100, 000100,000
25,000
50,000
CHANGES IN MEMBERSHIP—Continued
Sept
Sept
Aug
ite
. 11
. 24
. 22
Changes
DISTRICT N O . 10—KANSAS CITY
First National Bank, Bushnell, Nebr.__Absorbed by Kimball National Bank, Kim-
Security National Bank, Independence, KansPrimary organization.
DISTRICT N O . 12—SAN FRANCISCO
Farmers Commercial & Savings Bank, Oakley,Idaho
Voluntary withdrawal.
Capital
$25,000
250, 000
25, 000
The Comptroller of the Currency presents the follow-ing summary of increases and reductions in the num-ber and capital of national banks during the periodfrom August 23, to September 26, 1930, inclusive:
Amount ofcapital
5 $550,0000 07 925,000
New charters issuedRestored to solvencyIncrease of capital approved 1-
Aggregate of new charters, banks restored tosolvency, and banks increasing capital 1,475,000
LiquidationsReducing capital.. 0
3,350,0000
Total liquidations and reductions of capital..
Consolidation of national banks under act of Nov.7, 1918 .__ |
Consolidation of national banks and State banks junder act of Feb. 25,1927
21 ! 3,350,000
Total consolidations.. I-
0
900,000
4 ! 900,000
Aggregate increased capital for period ! I 1,475,000Reduction of capital owing to liquidations, etc |._. ! 3,350,000
Net decrease- 1,875,000
1 Includes 2 increases in capital aggregating $500,000 incident to con-solidations under act of Feb. 25,1927.
Fiduciary Powers Granted to National BanksDuring the month ended September 20, 1930, the
Federal Reserve Board approved applications of thenational banks listed below for permission to exerciseone or more of the fiduciary powers named in section11 (k) of the Federal reserve act as amended, as fol-lows: (1) Trustee; (2) executor; (3) administrator;(4) registrar of stocks and bonds; (5) guardian of es-tates; (6) assignee; (7) receiver; (8) committee of es-tates of lunatics; (9) in any other fiduciary capacity inwhich State banks, trust companies, or other corpora-tions which come into competition with national banksare permitted to act under the laws of the State inwhich the national bank is located.
Location
Webster, MassCentral Square, N. Y_Avoca, PaConnellsville, PaAndalusia, AlaSt. Louis, Mo _ _Spring Valley, Minn.Homer La _
Dis-trictNo.
12346.89
11
Name of bank
First National BankFirst National BankFirst National BankNational Bank & Trust Co _Andalusia National Bank___Vandeventer National BankFirst National BankHomer National Bank
Powersgranted
1 to 91 to 9I t o 9I t o 9
131
1 to 91 to 8
i Supplementary.
Digitized for FRASER http://fraser.stlouisfed.org/ Federal Reserve Bank of St. Louis
650 FEDERAL RESERVE BXJLLETIN OCTOBER, 1930
CONDITION OF ALL BANKS IN THE UNITED STATESTABLE 1.—ALL BANKS IN THE UNITED STATES i -PRINCIPAL RESOURCES AND LIABILITIES, ON CALL DATES, BY FEDERAL
RESERVE DISTRICTS
[In millions of dollars. Figures for nonmember banks are for the dates indicated or nearest dates thereto for which figures are available]
Federal reserve dis-trict and calldate
All districts:1928—June 30—
Dec. 31 —1929—June 29. . .
Dec. 31 —1930—June 30—
1928—June 30—Dec. 31—
1929—June 29.. .Dec. 31 —
1930—June 30—
1928—June 30_. .Dec. 31 —
1929—June 29___Dec. 31 —
1930—June 30—Philadelphia:
1928—June 30—Dec. 31—
1929—June 29—Dec. 31 —
1930—June 3 0 - .Cleveland:
1928—June 30—Dec. 31 —
1929—June 29—Dec. 31 —
1930—June 30.. .XvlL/XlLLlOXlCL •
1928—June 30.. .Dec. 31 —
1929—June 29.. .Dec. 3 1 . . .
1930—June 30—
1928—June 3 0 . -Dec. 31 —
1929—June 29.__Dec. 31 —
1930—June 30.._
1928^June 30—Dec. 31 —
1929—June 29—Dec. 3 1 —
1930—June 30. _ _St. Louis:
1928—June 30.. .Dec. 31 —
1929—June 29—Dec. 31 —
1930—June 30—Minneapolis:
1928—June 3 0 . -Dec. 31 —
1929—June 2 9 . -Dec. 31 —
1930—June 30—Kansas City:
1928—June 30—Dec. 31 —
1929—June 29—Dec. 31 —
1930—June 3 0 - -Tinllac*uanas.
1928—June 30—Dec. 31 —
1929—June 29—Dec. 31 —
1930—June 30—San Francisco:
1928—June 30—Dec. 31 —
1929—June 29—Dec. 31 —
1930—June 30—
Total loans and invest-
Allbanks
57,26558,26658,47458,41758,108
6,6446,6496,8186,7826,862
18,20218, 77618,89819,49419, 718
4,3654,3954,4604,3954,420
4,8984,8544,9274,8694,840
2,5312,5222,5012,4352,398
1,7531,7491,7341,6291,528
7,8267,9047,9587,7407,655
2,1412,1632,0992,0722,013
1,5491,5551,5391,5071,455
1,8931,9291,8811,8421,740
1,1631,2471,2171,1791,105
4,3004,5234,4434,4724,375
ments
Mem-ber
35,06135,68435, 71135, 93435, 656
2,6422,5712,6132,5612,592
11,09811, 59311, 77512,31612, 385
2,6562,6662,7102,6872,713
3,4483,4143,4883,4553,479
1,3441,3381,3291,2781,204
! 1,1731,1881,1771,1151,059
5,1185,1635,0524,9344,933
1,3841,4061,3411,3371,289
909933923911870
1,2241,2501,2411,2121,151
916993957936870
3,1493,1693,1053,1923,109
Non
mem-ber
22,20422, 58222, 76322, 48322,453
4,0024,0784,2054,2214,270
7,1047,1837,1227,1787,333
1,7091,7301,7501,7081,706
1,4501,4401,4391,4141,361
1,1871,1831,1721,1571,194
579560558514469
2,7092,7412,9062,8062,721
756757757736724
640622616597585
669679640630589
248254260243235
1,1511,3541,3381,2791,265
Loans (includingoverdrafts
Allbanks
39,46440,76341,51241,89840, 618
4,2264,2714,4344,5084,440
12, 60513,43513,80114,25214,009
2,6362,7472,8592,8592,807
3,2373,2793,3803,4133,272
1,8811,8791,8651,8131,730
1,3781,3461,3451,2621,166
5,8105,9336,0465,9535,764
1,5351,5461,5311,5261,485
947951945936874
1,3361,3321,3101,2931,209
895938914907842
2,9773,1073,0823,1773,021
Mem-ber
24,30325,15525,65826,15025, 214
1,8491,8241,8711,9101,836
7,7598,4048,7699,0978,914
1,6901,7451,8321,8591,829
2,2662,2912,3762,4102,336
1,0211,0221,010
974888
910895898855791
3,6983,8123,7923,7703,682
942954937955910
544560559563516
789803810804750
692736705714653
2,1442,1092,0992,2392,109
)
Non-mem-
ber
15,16115,60715,85315, 74815, 404
2,3772,4462,5632,5982,604
4,8465,0315,0315,1555,096
9461,0021,0271,000
977
972988
1,0041,004
937
861857855838841
468451447408375
2,1132,1212,2542,1832,081
593592594571575
403391387373358
5475304S9489459
203201209193189
833998983938912
Invc
Allbanks
17,80117,50416, 96216, 51917,490
2,4182,3782,3842,2732,422
5,5985,3415,0975,2435, 709
1,729 !1,6491,6011,535 :1,613
1, 660 !1,575 !1,547 '1,456 ;1,568
650643636622669
375402 .389366362
2,0161,9711,9121,7881,891
605617568546528
601605594
i 572. 582
i 557i 596! 571
549531
268310
! 302273263
1,3231,4161,3611,2951,353
stments
Mem-ber
10,75810, 52910, 0529,784
10,442
793747742650756
3,3403,1893,0063,2203,472
966921878828884
1,1821,1231,1121,0461,144
324317319303316
263293279260268
1,4201,3501,2601,1641,251
442452405381379
365373364348354
436; 447j 430
408401
224257251222217
! 1,0051,0601,007
953I 1,001
Non-
mem-ber
7,0436,9756,9106,7357,048
1,6261,6321,6421,6231,666
2,2582,1522,0912,0232,237
763728723708729
479452435410425
326326317319353
11210911010693
596620652623640
163166163165149
237232230224227
122149141141130
4453515046
318356355342353
Deposits, exclusive ofinterbank deposits
Allbanks
53,39856,76653,85255, 28954, 954
6,1066,2256,2096,2986,351
16, 61418, 91517, 02818,49018,809
3,7643,8743,7603,7453,777
4,4984,5264,5234,4524,439
2,2842,3512,2552,2712,231
1,6401,6731,5811,5481,441
7,5177,6677,5437,3817,287
2,0022,0451,9111,9621,879
1,5671,5961,5471,5191,482
1,9622,0281,9291,9091,841
1,1461,2901,1771,1861,108
4,2974,5764,3914,5294,310
Mem-ber
32,13334,82632, 28433,86533, 690
2,3512,3972,2972,3912,355
9,98212,14010,35111,81011,981
2,2322,2872, 2512,2652,301
3,1393,1653,1903,1543,182
1,1881,2141,1661,1521,105
1,0721,0931,0411,020
994
4,8064,9144,7214,6174,615
1,2151,2561,1771,2131,172
895929904892876
1,2081,2411,2071,1901,187
885989
; 911913867
3,1603,2003,0683,2473,056
Non-
mem-ber
21,26521,94021,56721,42421, 264
3,7553,8283,9123,9073,996
6,6326,7766,6776,6796,829
1,5321,5871,5091,4801,476
1,3591,3611,3331,2981,257
1,0961,1371,0891,1191,125
568580540527447
2,7122,7522,8222,7642,672
787788733750706
673666642626606
755787722719655
261301266272241
1,1371,3761,3231,2821,254
Rediscounts and bills]
Allbanks
1,5701,5121,5981,238
722
10893
1117847
523542488279181
160153164175
95
141139138155
67
10774
1137660
9474
1046667
225234221205
65
11082985655
1913222213
2934524928
1814272122
3759605523
payable
Mem-ber
1,2091,1621,198
879435
9276864930
481499453258166
11399
1059445
111105
98100
39
6949704829
5452724232
165164143148
27
6539
! 59i 3 2
25
85
1212
5
1922393513
1112201713
1939424412
Non-mem*
ber
361350399359287
1617253017
4243352115
4754588151
2934405528
3825432831
3921322335
6071795838
4543392430
1189
108
912131515
62849
1720181112
i Includes all national and State banks (including stock and mutual savings banks) and all private banks under State supervision.
Back figures.—See Tables 40, 41, and 81-84, Annual Report of Federal Reserve Board for 1929.
Digitized for FRASER http://fraser.stlouisfed.org/ Federal Reserve Bank of St. Louis
OCTOBER, 1930 FEDERAL RESERVE BULLETIN 651
TABLE 2—ALL BANKS IN THE UNITED STATES i—PRINCIPAL RESOURCES AND LIABILITIES ON JUNE 30, 1930, AND DECEM-BER 31, 1929, BY STATES
[Amounts in thousands of dollars]
State
New England:MaineNew Hampshire.VermontMassachusetts...Rhode IslandConnecticut
Middle Atlantic:
Loans and investments
Total
June
434,810299, 536245, 550
4, 296,010539, 579
1, 355,049
Decem-ber
432, 528311, 333250,'"""
4, 224, 673533,091
1, 336, 338
Loans (includingoverdrafts)
June
231, 537150,829
, 155,171! 2,954,835
303, 856803, 733
New York 17,422, 267 17, 222,1391 i 12, 570, 758 12, 754, 661New Jersey ! 2.404,928 2,388,312' 1,566,543 1,633,659Pennsylvania ' 5,779,339
East North Central:OhioIndiana 810,663Illinois ! 3,813,970Michigan 1,982,062Wisconsin j 906,710
West North Central:Minnesota 877, 288Iowa ! 756,29l|Missouri 1,182,9771North Dakota * 101,488South Dakota 131,230
333,583376,487
5,703,176 1 3,483,778
2,628,617 2, 691, 4931' 1,981,636o i n '!CO 862,926!: 605,330
3,802, 2631 2,822,0622,020, 634 jj 1,452,920
917,092J 631,288
NebraskaKansas
South Atlantic:Delaware 160,336Maryland 846, 710District of Columbia i 242, 779Virginia 540,489West Virginia 333,463North Carolina 354,060South Carolina I 159,553)Georgia 328, 563)Florida 213,479!
East South Central: iKentucky I 528,574Tennessee 429,532!Alabama i 262,225!Mississippi ; 210,822
West South Central:Arkansas j 194,094Louisiana ! 396,134Oklahoma j 380,831Texas I 966,478
1 Includes all national and State banks and all private banks under State supervision. Figures for State institutions are taken from Table 4and represent in some cases the condition of banks as of dates other than June 30, 1930, and December 31, 1929.1 2 Excess over figures shown in Tables 3 and 4 is due chiefly to technical differences between reports to the board and reports to State bankingauthorities.
Back figures.—See Tables 85-87, Annual Report of Federal Reserve Board, 1929.
Digitized for FRASER http://fraser.stlouisfed.org/ Federal Reserve Bank of St. Louis
652 FEDERAL RESERVE BULLETIN OCTOBER, 193Q
TABLE 3.—NATIONAL BANKS i—PRINCIPAL RESOURCES AND LIABILITIES ON JUNE 30, 1930, AND DECEMBER 31, 1929, BYSTATES
[Amounts in thousands of dollars]
State
Loans and investments
Total
June Decem-ber
Loans (includingoverdrafts)
June Decem-ber
Investments
June Decem-ber
Deposits, exclusiveof interbank de-posits
June Decem-ber
rediscountsand bills pay-
able
June Decem-ber
Number ofreporting
banks
June De-cember
New England:MaineNew HampshireVermontMassachusettsRhode Island _..Connecticut.
Middle Atlantic:New YorkNew JerseyPennsylvania
East North Central:OhioIndianaIllinoisMichiganWisconsin
West North Central:MinnesotaIowa __.MissouriNorth DakotaSouth DakotaNebraskaKansas
South Atlantic:DelawareMarylandDistrict of Columbia.Virginia _.West VirginiaNorth CarolinaSouth CarolinaGeorgiaFlorida __.
East South Central:KentuckyTennesseeAlabama.Mississippi _.
1 Includes all State banks (including stock and mutual savings banks) and all private banks under State supervision. Figures relate to datesgiven or dates nearest thereto for which figures are available.
2 Includes bonds borrowed.3 Includes due to banks.< Includes miscellaneous liabilities.NOTE.—All figures in the June columns are as of June 30, except as follows: Minnesota, June 16; Missouri, Apr. 16; Tennessee, May 19. All
figures in the December columns are as of Dec. 31, except as follows: Maine,Dec. 28; New Hampshire, June 29; Massachusetts, State banks, Dec.28, savings banks, Oct. 31; Kansas, Dec. 3; Kentucky, June 29; Colorado, Nov. 25; Oklahoma, Dec. 28; Tennessee, Nov. 29.
Digitized for FRASER http://fraser.stlouisfed.org/ Federal Reserve Bank of St. Louis
FEDERAL RESERVE DISTRICTS
ii • • BOUNDARIES OF FEDERAL RESERVE DISTRICTS. . . . . BOUNDARIES OF FEDERAL RESERVE BRANCH TERRITORIES
® FEDERAL RESERVE BANK CITIES• FEDERAL RESERVE BRANCH CITIESO FEDERAL RESERVE BANK AGENCY
Digitized for FRASER http://fraser.stlouisfed.org/ Federal Reserve Bank of St. Louis