Page 1
Todd Crow
March 1, 2018 www.novoco.com
FEDERAL UPDATE
Michael NovogradacManaging Partner
@Novogradac
Novogradac & Company LLP
Fred CopemanSr. VP of Equity Production
Boston Financial Investment Management, LP
Executive Vice President and
Manager of Tax Credit Capital
PNC Real Estate
@ToddJCrow
Page 2
MICHAEL NOVOGRADAC
Novogradac & Company LLP
March 1, 2018 www.novoco.com
Page 3
March 1, 2018 www.novoco.com
Tax Act Overall
PABs
retained
NMTCs
retained
RETCs
retained
HTCs
modified
Page 4
Low-Income
Housing Tax
Credit
Lower Corporate Rate
Interest Expense Deductibility Limit
100 Percent Expensing
March 1, 2018 www.novoco.com
Page 5
March 1, 2018 www.novoco.com
Interest Expense Limit
of partnership
income
30%EXCLUDE
depreciation
until 2022
Real Estate
Trade or Business Election
30 year
for post 2017 PIS
40 year (?)
for pre 2018 PIS
FUND LEVEL
RE TorB? Or not?
Page 6
March 1, 2018 www.novoco.com
Post-2017 PIS Properties, Pre-2018 PIS Properties
2015 2016 2017 2018 2019 2020
POST-2017 PIS
• Generally elect RE TorB
• 30 year life on building
PRE-2018 PIS
• Need to analyze properties
• 9% generally defer election to 2022
• Tax-exempt bonds – recent
transactions elect
• Older transactions defer to 2022
Page 7
March 1, 2018 www.novoco.com
100 Percent Expensingfor personal property and land improvements
2017 2018 2019 2020 2021 2022
SEPT. 27, 2017
Property PIS after this
date is eligible, subject
to binding contract rule.
DEC. 31, 2022
100 percent begins
phase-down
Used property eligible
Cost segregation
studies
Page 8
Opportunity Zones
Invest within 180 days of realizing a
gain
Defer gain to Dec. 31, 2026
Exclude 10% if held for 5 years
Exclude 15% if held for 7 years
March 1, 2018 www.novoco.com
• Recognize 85% on
Dec. 31, 2026
• Generally no additional
gain recognition
Page 9
Base Erosion and Anti-Abuse Tax (BEAT)
• Investors paying BEAT:
– Can lose up to 20% of LIHTC, ITC and PTC for 2018-2025;
• Can lose up to 100% thereafter
– Can lose up to 100% of NMTC and HTC in 2018 and beyond
– If credits reduce normal tax below BEAT in any given year, those credits are lost FOREVER
– Investors can also lose about 50% of the benefits of tax losses
March 1, 2018 www.novoco.com
Page 10
March 1, 2018 www.novoco.com
What’s Next After Tax Reform?
Restore affordable housing
production in light of lower
corporate tax rate
Expand and strengthen Housing
Credit by advancing Affordable
Housing Credit Improvement Act
Continued education around the
connection between Housing
Bonds and the Housing Credit
Address Base Erosion and Anti-abuse Tax issues
and other technical corrections
Page 11
March 1, 2018 www.novoco.com
2018 Legislative Agenda
MUST PASS POSSIBLE
• Government funding
beyond Feb. 8
• Debt ceiling
• Budget deal to lift spending caps
• Tax extenders
• Disaster relief
• Immigration
• Infrastructure
• Tax reform technical corrections
• Housing finance reform
Potential vehicles for Housing Credit legislation:
Anything with a tax component
Page 12
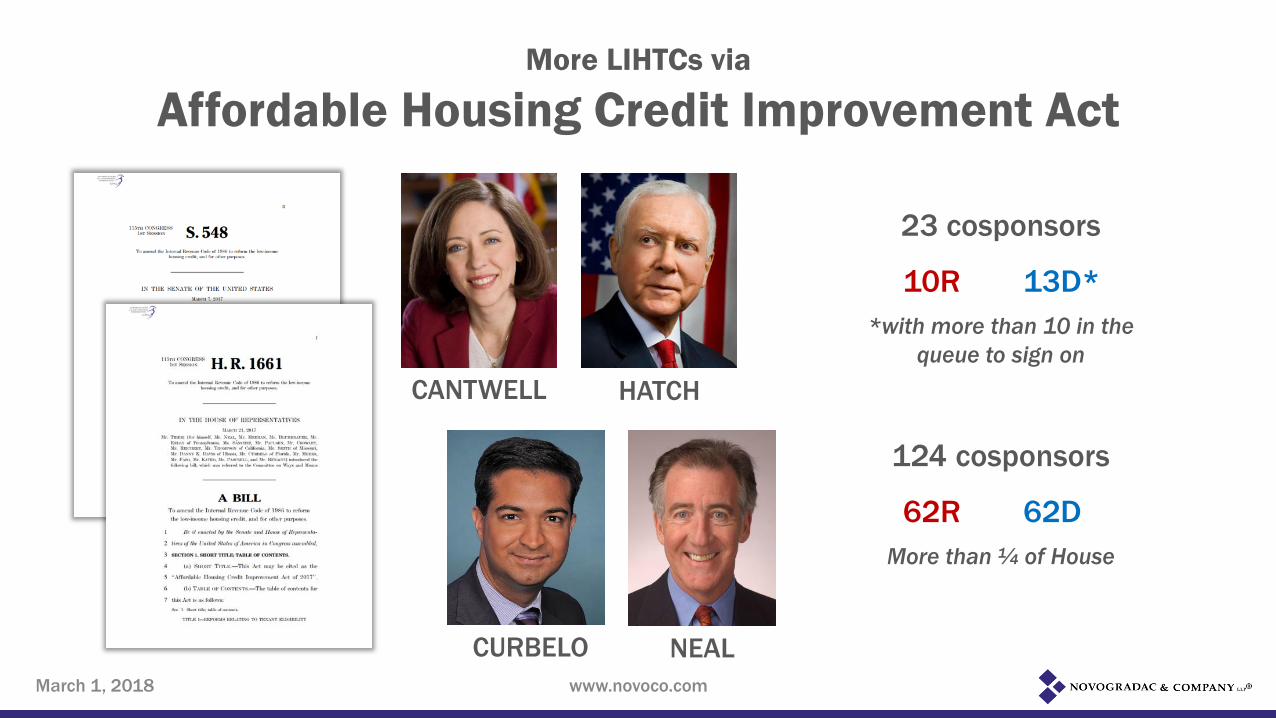
More LIHTCs via
Affordable Housing Credit Improvement Act
CANTWELL HATCH
CURBELO NEAL
23 cosponsors
10R 13D*
*with more than 10 in the
queue to sign on
124 cosponsors
62R 62D
More than ¼ of House
March 1, 2018 www.novoco.com
Page 13
More LIHTCs via
Affordable Housing Credit Improvement Act
50 percent increase
Income-averaging
Minimum 4 percent rate
CANTWELL HATCH
CURBELO NEAL
March 1, 2018 www.novoco.com
Page 14
More LIHTCs via
Affordable Housing Credit Improvement Act
50 percent increase
Income-averaging
Minimum 4 percent rate
CANTWELL HATCH
NEALCURBELO
March 1, 2018 www.novoco.com
Page 15
More LIHTCs via
Affordable Housing Credit Improvement Act
50 percent increase
Income-averaging
Minimum 4 percent rate
CANTWELL HATCH
NEALCURBELO
March 1, 2018 www.novoco.com
Page 16
More LIHTCs via
Affordable Housing Credit Improvement Act
50 percent increase
Income-averaging
Minimum 4 percent rate
CANTWELL HATCH
NEALCURBELO
Note these assumptions:
• Assumed that states will increase
their tax-exempt bond issuance for
multifamily by 25%
• Assumed the absolute amount of
soft subsidies going to tax exempt
bond properties would remain
unchanged
• To the extent that there is less
deferred developer fee, that is offset
with more taxable bond financing
Approximately 131,000 more units over 10 years
March 1, 2018 www.novoco.com
Page 17
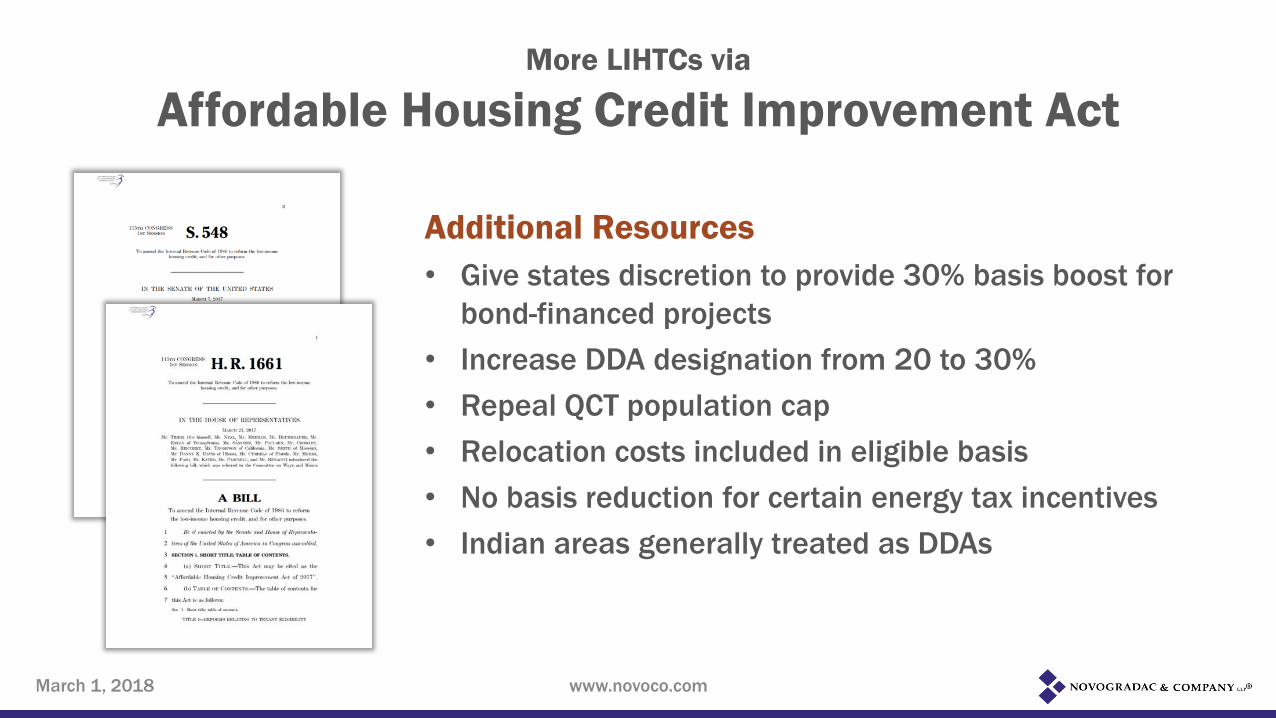
More LIHTCs via
Affordable Housing Credit Improvement Act
Additional Resources
• Give states discretion to provide 30% basis boost for
bond-financed projects
• Increase DDA designation from 20 to 30%
• Repeal QCT population cap
• Relocation costs included in eligible basis
• No basis reduction for certain energy tax incentives
• Indian areas generally treated as DDAs
March 1, 2018 www.novoco.com
Page 18
More LIHTCs via
Affordable Housing Credit Improvement Act
Financial Feasibility
• 50% basis boost for ELI units
• Modify student occupancy rules
• Codify increased tenant income guidance
• Modify 10-year rule (limits apply to acquisition basis)
• Adopt uniform income eligibility for rural projects
March 1, 2018 www.novoco.com
Page 19
More LIHTCs via
Affordable Housing Credit Improvement Act
Other
• Modify voucher rent-setting rule in LIHTC
• Clarify the community revitalization plan
• Prohibit local approval or contribution requirements
• Add selection criteria for Native American areas
• Restriction of planned foreclosures
• Clarify casualty loss rule
• Convert ROFR to purchase option
• Change the official name of the LIHTC to Affordable
Housing Tax Credit
March 1, 2018 www.novoco.com
Page 20
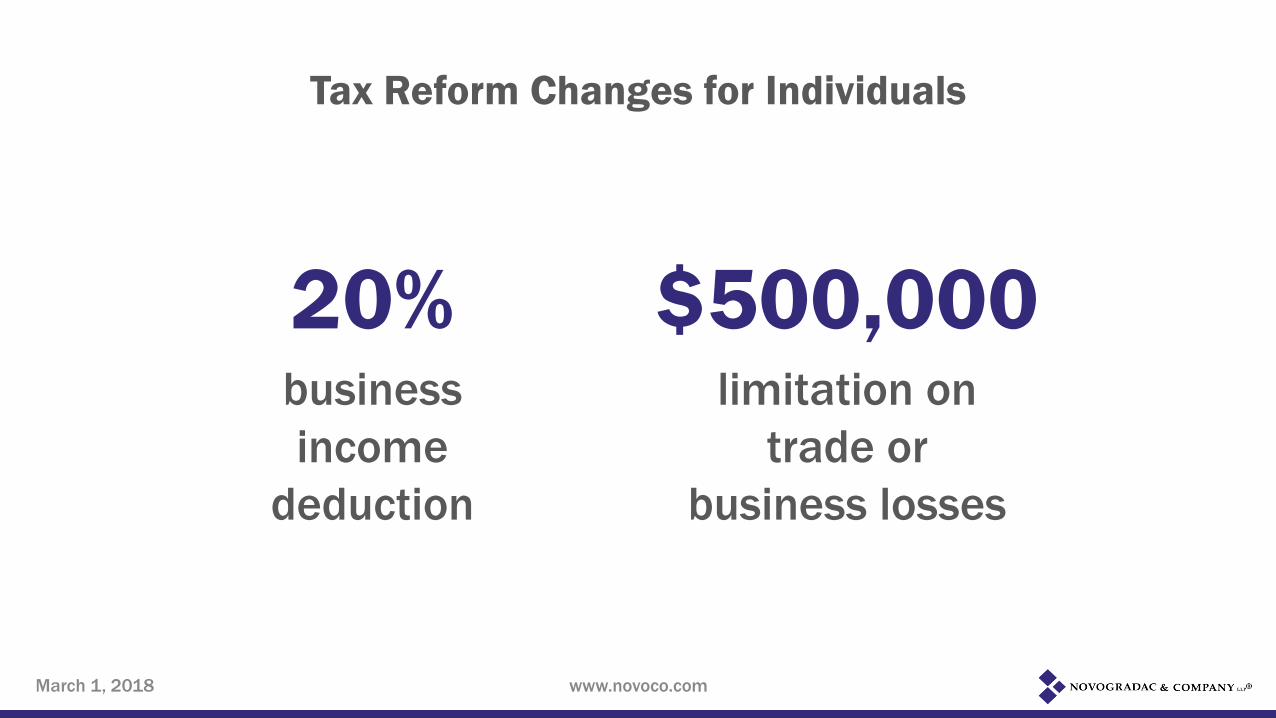
Tax Reform Changes for Individuals
20%business
income
deduction
$500,000limitation on
trade or
business losses
March 1, 2018 www.novoco.com
Page 21
March 1, 2018 www.novoco.com
Resources
Page 22
www.taxcredithousing.com
March 1, 2018 www.novoco.com
Page 23
www.rentalhousingaction.org
March 1, 2018 www.novoco.com
Page 24
TODD CROW
PNC Real Estate
March 1, 2018 www.novoco.com
Page 25
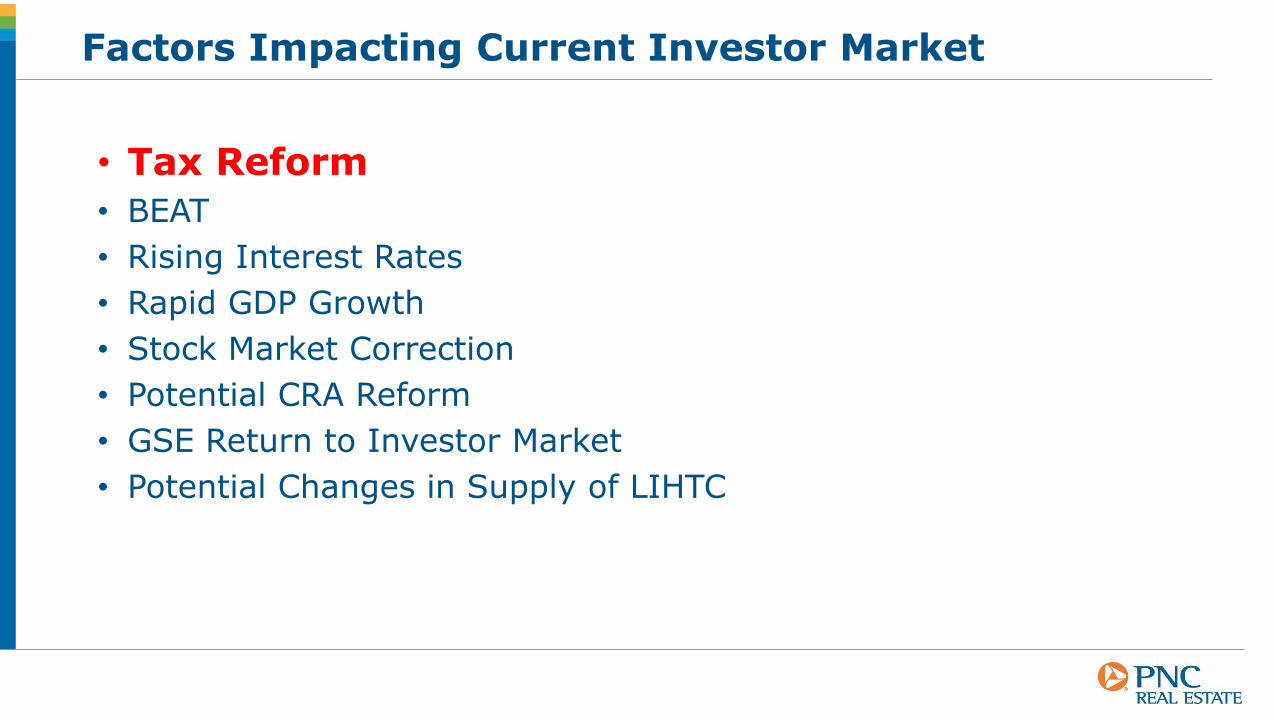
Factors Impacting Current Investor Market
• Tax Reform
• BEAT
• Rising Interest Rates
• Rapid GDP Growth
• Stock Market Correction
• Potential CRA Reform
• GSE Return to Investor Market
• Potential Changes in Supply of LIHTC
Page 26
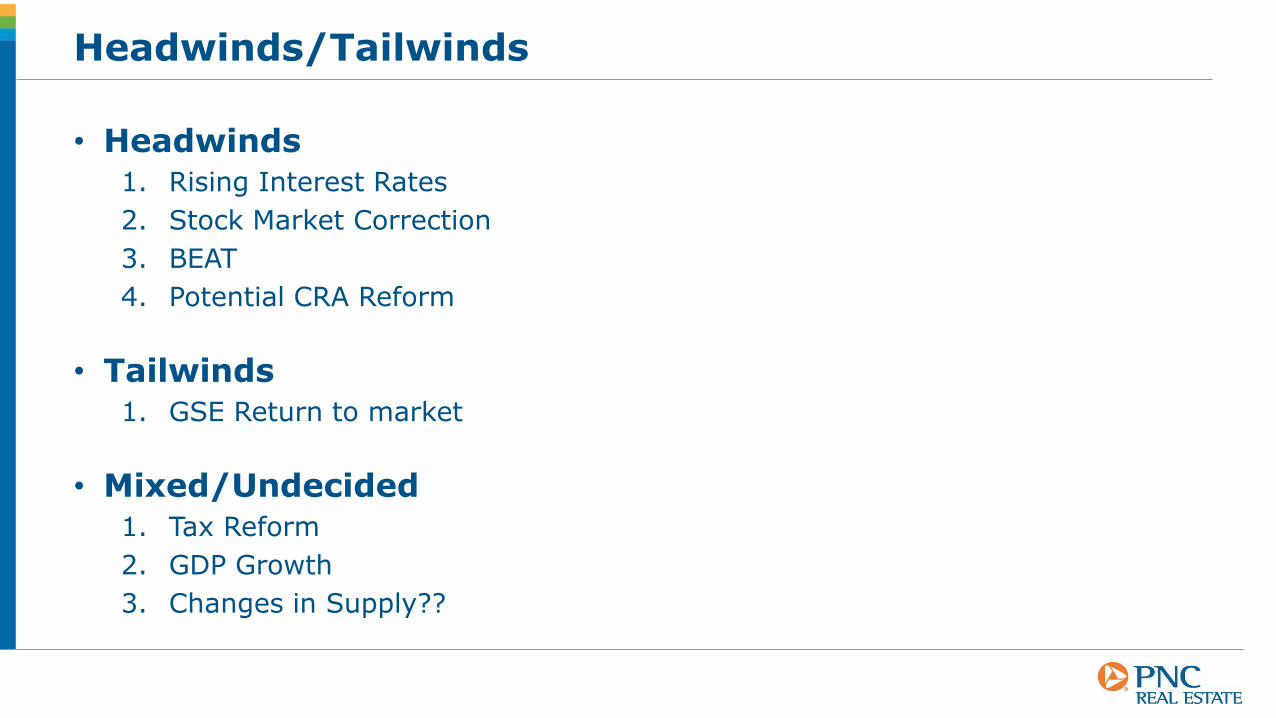
Headwinds/Tailwinds
• Headwinds
1. Rising Interest Rates
2. Stock Market Correction
3. BEAT
4. Potential CRA Reform
• Tailwinds
1. GSE Return to market
• Mixed/Undecided
1. Tax Reform
2. GDP Growth
3. Changes in Supply??
Page 27
FRED COPEMAN
Boston Financial Investment Management, LP
March 1, 2018 www.novoco.com
Page 28
www.bfim.comMarch 1, 2018
Year Capital
Credits:
LIHTC
Gross
Income
Interest
Expense
Deprec:
Buildings
Deprec:
Pers Prop
Deprec:
Land Imps
Other
Deducts
(Loss) or
Gain from
Sale Net Income
Benefits
from
Losses at
35%
Total
Benefits
2017 2,367,504 271,040 55,968 (34,267) (51,807) (201,179) (153,836) (6,835) (391,957) 137,185 (1,959,279)
2018 3,363,756 560,733 148,814 (111,754) (207,610) (121,560) (45,119) (19,812) (357,041) 124,964 (2,678,059)
2019 560,733 149,696 (79,946) (208,641) (62,256) (17,592) (27,806) (246,544) 86,290 647,023
2020 560,733 150,541 (79,213) (208,641) (57,154) (15,833) (29,577) (239,875) 83,956 644,689
2021 560,733 149,728 (78,451) (208,641) (59,041) (14,249) (29,577) (240,232) 84,081 644,814
2022 560,733 150,473 (77,660) (208,641) (56,002) (12,824) (29,577) (234,231) 81,981 642,714
2023 560,733 150,241 (76,838) (208,641) (32,721) (11,617) (29,577) (209,152) 73,203 633,936
2024 560,733 150,883 (75,983) (208,641) (34,349) (11,480) (29,577) (209,146) 73,201 633,934
2025 560,733 150,495 (75,095) (208,641) (31,469) (11,480) (29,577) (205,766) 72,018 632,751
2026 560,733 151,026 (74,172) (208,641) (30,886) (11,480) (29,577) (203,730) 71,305 632,038
2027 289,693 150,453 (73,213) (208,641) (30,675) (11,480) (25,789) (199,344) 69,771 359,464
2028 150,858 (72,216) (208,641) (32,600) (11,480) (23,086) (197,165) 69,008 69,008
2029 150,102 (71,180) (208,641) (32,269) (11,480) (23,086) (196,553) 68,794 68,794
2030 150,365 (70,102) (208,641) (34,637) (11,480) (22,895) (197,390) 69,087 69,087
2031 149,381 (68,983) (208,641) (34,445) (11,480) (21,494) (195,660) 68,481 68,481
2032 149,489 (67,819) (208,641) (36,542) (10,729) (16,922) (191,163) 66,907 66,907
2033 (2,046,114) (2,046,114) 716,140 716,140
5,731,260 5,607,328 2,308,514 (1,186,890) (3,180,386) (887,785) (373,639) (394,764) (2,046,114) (5,761,064) 2,016,372
Alpha Arms
9% Transaction
130% area
ORIGINAL (2017 Underwriting)
Original IRR
Updated IRR
PPC reduction to maintain IRR:
5.60%
3.50%
9.97 cents
IRR: 5.60%*30-year depreciation for real property
*50% bonus depreciation for LI, PP
Page 29
www.bfim.comMarch 1, 2018
Year Capital
Credits:
LIHTC
Gross
Income
Interest
Expense
Deprec:
Buildings
Deprec:
Pers Prop
Deprec:
Land Imps
Other
Deducts
(Loss) or
Gain from
Sale Net Income
Benefits
from
Losses at
21%
Total
Benefits
2018 2,367,504 271,040 55,968 (34,267) (47,490) (389,379) (305,130) (6,835) (727,134) 152,698 (1,943,766)
2019 3,363,756 560,733 148,814 (111,754) (190,309) (89,001) (69,744) (19,812) (331,805) 69,679 (2,733,344)
2020 560,733 149,696 (79,946) (191,254) 0 (27,806) (149,309) 31,355 592,088
2021 560,733 150,541 (79,213) (191,254) (19,800) (29,577) (169,302) 35,554 596,286
2022 560,733 149,728 (78,451) (191,254) (31,680) (29,577) (181,234) 38,059 598,792
2023 560,733 150,473 (77,660) (191,254) (30,408) (29,577) (178,426) 37,469 598,202
2024 560,733 150,241 (76,838) (191,254) (29,645) (29,577) (177,072) 37,185 597,918
2025 560,733 150,883 (75,983) (191,254) (34,349) (29,577) (180,279) 37,859 598,592
2026 560,733 150,495 (75,095) (191,254) (31,469) (29,577) (176,899) 37,149 597,882
2027 560,733 151,026 (74,172) (191,254) (30,886) (29,577) (174,863) 36,721 597,454
2028 289,693 150,453 (73,213) (191,254) (30,675) (25,789) (170,478) 35,800 325,493
2029 150,858 (72,216) (191,254) (32,600) (23,086) (168,298) 35,343 35,343
2030 150,102 (71,180) (191,254) (32,269) (23,086) (167,687) 35,214 35,214
2031 150,365 (70,102) (191,254) (34,637) (22,895) (168,524) 35,390 35,390
2032 149,381 (68,983) (191,254) (34,445) (21,494) (166,794) 35,027 35,027
2033 149,489 (67,819) (191,254) (36,542) (16,922) (163,047) 34,240 34,240
2034 (2,309,858) (2,309,858) 485,070 485,070
5,731,260 5,607,328 2,308,514 (1,186,890) (2,915,354) (887,785) (374,874) (394,764) (2,309,858) (5,761,011) 1,209,812
Alpha Arms
9% Transaction
130% area
2018 VERSION
Original IRR
Updated IRR
PPC reduction to maintain IRR:
5.60%
3.50%
9.97 cents
IRR: 3.50%*30-year depreciation for real property
*100% bonus depreciation for LI, PP
*Opts out of interest expense limitation
*IRR for 27.5-year depreciation (and interest limitation) is 3.39%
Page 30
www.bfim.comMarch 1, 2018
Year Capital
Credits:
LIHTC
Gross
Income
Interest
Expense
Deprec:
Buildings
Deprec:
Pers Prop
Deprec:
Land Imps
Other
Deducts
(Loss) or
Gain from
Sale Net Income
Benefits
from
Losses at
21%
Total
Benefits
2018 2,136,672 271,040 55,968 (34,267) (47,490) (389,379) (305,130) (6,835) (727,134) 152,698 (1,712,934)
2019 3,035,790 560,733 148,814 (111,754) (190,309) (89,001) (69,744) (19,812) (331,805) 69,679 (2,405,378)
2020 560,733 149,696 (79,946) (191,254) 0 (27,806) (149,309) 31,355 592,088
2021 560,733 150,541 (79,213) (191,254) (19,800) (29,577) (169,302) 35,554 596,286
2022 560,733 149,728 (78,451) (191,254) (31,680) (29,577) (181,234) 38,059 598,792
2023 560,733 150,473 (77,660) (191,254) (30,408) (29,577) (178,426) 37,469 598,202
2024 560,733 150,241 (76,838) (191,254) (29,645) (29,577) (177,072) 37,185 597,918
2025 560,733 150,883 (75,983) (191,254) (34,349) (29,577) (180,279) 37,859 598,592
2026 560,733 150,495 (75,095) (191,254) (31,469) (29,577) (176,899) 37,149 597,882
2027 560,733 151,026 (74,172) (191,254) (30,886) (29,577) (174,863) 36,721 597,454
2028 289,693 150,453 (73,213) (191,254) (30,675) (25,789) (170,478) 35,800 325,493
2029 150,858 (72,216) (191,254) (32,600) (23,086) (168,298) 35,343 35,343
2030 150,102 (71,180) (191,254) (32,269) (23,086) (167,687) 35,214 35,214
2031 150,365 (70,102) (191,254) (34,637) (22,895) (168,524) 35,390 35,390
2032 149,381 (68,983) (191,254) (34,445) (21,494) (166,794) 35,027 35,027
2033 149,489 (67,819) (191,254) (36,542) (16,922) (163,047) 34,240 34,240
2034 (1,751,060) (1,751,060) 367,723 367,723
5,172,462 5,607,328 2,308,514 (1,186,890) (2,915,354) (887,785) (374,874) (394,764) (1,751,060) (5,202,213) 1,092,465
Alpha Arms
9% Transaction
130% area
2018 VERSION WITH SAME IRR
Original IRR
Updated IRR
PPC reduction to maintain IRR:
5.60%
3.50%
9.97 cents
IRR: 5.60%*30-year depreciation for real property
*100% bonus depreciation for LI, PP
*Opts out of interest expense limitation
Page 31
www.bfim.comMarch 1, 2018
Year Capital
Credits:
LIHTC
Gross
Income
Interest
Expense
Deprec:
Buildings
Deprec:
Pers Prop
Deprec:
Land Imps
Other
Deducts
(Loss) or
Gain from
Sale Net Income
Benefits
from
Losses at
35%
Total
Benefits
2017 1,992,900 0 0 (16,154) (16,056) (170,021) (176,941) (11,586) (390,758) 136,765 (1,856,135)
2018 4,268,216 631,946 112,113 (205,564) (385,339) (65,779) (17,547) (167,408) (729,522) 255,333 (3,380,937)
2019 201,884 644,871 115,218 (24,547) (385,339) (39,467) (15,793) (46,769) (396,696) 138,844 581,830
2020 0 644,871 111,687 (23,984) (385,339) (24,080) (14,213) (12,416) (348,346) 121,921 766,791
2021 180,000 644,871 107,943 (23,413) (385,339) (18,778) (12,792) (12,416) (344,795) 120,678 585,549
2022 644,871 104,042 (22,339) (385,339) (23,566) (11,513) (12,416) (351,130) 122,895 767,766
2023 644,871 99,470 (20,903) (385,339) (9,510) (10,405) (12,416) (339,103) 118,686 763,557
2024 644,871 95,163 (19,516) (385,339) (11,798) (10,405) (12,416) (344,311) 120,509 765,379
2025 644,871 90,153 (18,185) (385,339) (13,056) (10,405) (12,416) (349,247) 122,237 767,107
2026 644,871 85,409 (16,918) (385,339) (15,501) (10,405) (12,416) (355,169) 124,309 769,180
2027 644,871 79,915 (15,725) (385,339) (15,366) (10,405) (11,819) (358,739) 125,559 770,429
2028 12,926 74,706 (14,616) (385,339) (16,600) (10,405) (5,239) (357,493) 125,123 138,048
2029 68,682 (13,602) (385,339) (16,614) (10,405) (5,239) (362,518) 126,881 126,881
2030 62,973 (12,694) (385,339) (17,606) (10,405) (5,239) (368,310) 128,908 128,908
2031 56,414 (11,903) (385,339) (17,395) (10,405) (5,239) (373,867) 130,853 130,853
2032 50,171 (11,244) (385,339) (18,544) (9,971) (4,903) (379,830) 132,940 132,940
2033 (537,867) (537,867) 188,253 188,253
6,643,000 6,448,706 1,314,059 (471,307) (5,796,136) (493,683) (352,414) (350,352) (537,867) (6,687,700) 2,340,695
Beta Brook
9% Transaction
Not in 130% area
ORIGINAL (2017 Underwriting)
Original IRR
Updated IRR
PPC reduction to maintain IRR:
5.61%
3.31%
11.38 cents
IRR: 5.61%*30-year depreciation for real property
*50% bonus depreciation for LI, PP
Page 32
www.bfim.comMarch 1, 2018
Year Capital
Credits:
LIHTC
Gross
Income
Interest
Expense
Deprec:
Buildings
Deprec:
Pers Prop
Deprec:
Land Imps
Other
Deducts
(Loss) or
Gain from
Sale Net Income
Benefits
from
Losses at
21%
Total
Benefits
2018 1,992,900 0 (16,154) (14,718) (334,467) (352,414) (11,586) (729,339) 153,161 (1,839,739)
2019 4,268,216 631,946 112,113 (205,564) (353,227) 0 (167,408) (614,085) 128,958 (3,507,312)
2020 201,884 644,871 115,218 (24,547) (353,227) 0 (46,769) (309,325) 64,958 507,945
2021 0 644,871 111,687 (23,984) (353,227) (400) (12,416) (278,340) 58,451 703,322
2022 180,000 644,871 107,943 (23,413) (353,227) (640) (12,416) (281,753) 59,168 524,039
2023 644,871 104,042 (22,339) (353,227) (6,184) (12,416) (290,123) 60,926 705,796
2024 644,871 99,470 (20,903) (353,227) (9,510) (12,416) (296,587) 62,283 707,154
2025 644,871 95,163 (19,516) (353,227) (11,798) (12,416) (301,795) 63,377 708,247
2026 644,871 90,153 (18,185) (353,227) (13,056) (12,416) (306,731) 64,413 709,284
2027 644,871 85,409 (16,918) (353,227) (15,501) (12,416) (312,653) 65,657 710,528
2028 644,871 79,915 (15,725) (353,227) (15,366) (11,819) (316,223) 66,407 711,277
2029 12,926 74,706 (14,616) (353,227) (16,600) (5,239) (314,977) 66,145 79,071
2030 68,682 (13,602) (353,227) (16,614) (5,239) (320,001) 67,200 67,200
2031 62,973 (12,694) (353,227) (17,606) (5,239) (325,793) 68,417 68,417
2032 56,414 (11,903) (353,227) (17,395) (5,239) (331,350) 69,584 69,584
2033 50,171 (11,244) (353,227) (18,544) (4,903) (337,747) 70,927 70,927
2034 (1,020,782) (1,020,782) 214,364 214,364
6,643,000 6,448,706 1,314,059 (471,307) (5,313,124) (493,683) (352,414) (350,352) (1,020,782) (6,687,604) 1,404,397
Beta Brook
9% Transaction
Not in 130% area
2018 Version
Original IRR
Updated IRR
PPC reduction to maintain IRR:
5.61%
3.31%
11.38 cents
IRR: 3.31%*30-year depreciation for real property
*100% bonus depreciation for LI, PP
*Opts out of interest expense limitation
*IRR for 27.5-year depreciation (and interest limitation) is 3.30%
Page 33
www.bfim.comMarch 1, 2018
Year Capital
Credits:
LIHTC
Gross
Income
Interest
Expense
Deprec:
Buildings
Deprec:
Pers Prop
Deprec:
Land Imps
Other
Deducts
(Loss) or
Gain from
Sale Net Income
Benefits
from
Losses at
21%
Total
Benefits
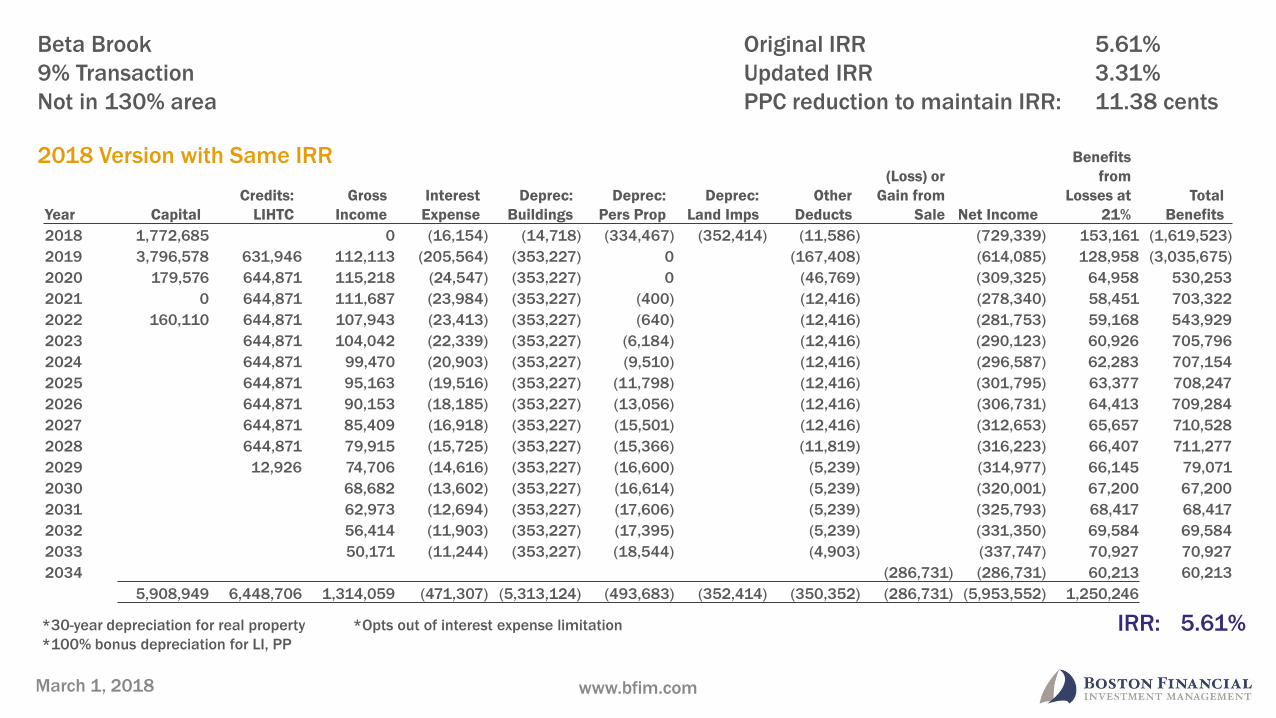
2018 1,772,685 0 (16,154) (14,718) (334,467) (352,414) (11,586) (729,339) 153,161 (1,619,523)
2019 3,796,578 631,946 112,113 (205,564) (353,227) 0 (167,408) (614,085) 128,958 (3,035,675)
2020 179,576 644,871 115,218 (24,547) (353,227) 0 (46,769) (309,325) 64,958 530,253
2021 0 644,871 111,687 (23,984) (353,227) (400) (12,416) (278,340) 58,451 703,322
2022 160,110 644,871 107,943 (23,413) (353,227) (640) (12,416) (281,753) 59,168 543,929
2023 644,871 104,042 (22,339) (353,227) (6,184) (12,416) (290,123) 60,926 705,796
2024 644,871 99,470 (20,903) (353,227) (9,510) (12,416) (296,587) 62,283 707,154
2025 644,871 95,163 (19,516) (353,227) (11,798) (12,416) (301,795) 63,377 708,247
2026 644,871 90,153 (18,185) (353,227) (13,056) (12,416) (306,731) 64,413 709,284
2027 644,871 85,409 (16,918) (353,227) (15,501) (12,416) (312,653) 65,657 710,528
2028 644,871 79,915 (15,725) (353,227) (15,366) (11,819) (316,223) 66,407 711,277
2029 12,926 74,706 (14,616) (353,227) (16,600) (5,239) (314,977) 66,145 79,071
2030 68,682 (13,602) (353,227) (16,614) (5,239) (320,001) 67,200 67,200
2031 62,973 (12,694) (353,227) (17,606) (5,239) (325,793) 68,417 68,417
2032 56,414 (11,903) (353,227) (17,395) (5,239) (331,350) 69,584 69,584
2033 50,171 (11,244) (353,227) (18,544) (4,903) (337,747) 70,927 70,927
2034 (286,731) (286,731) 60,213 60,213
5,908,949 6,448,706 1,314,059 (471,307) (5,313,124) (493,683) (352,414) (350,352) (286,731) (5,953,552) 1,250,246
Beta Brook
9% Transaction
Not in 130% area
2018 Version with Same IRR
Original IRR
Updated IRR
PPC reduction to maintain IRR:
5.61%
3.31%
11.38 cents
IRR: 5.61%*30-year depreciation for real property
*100% bonus depreciation for LI, PP
*Opts out of interest expense limitation
Page 34
www.bfim.comMarch 1, 2018
Year Capital
Credits:
LIHTC
Gross
Income
Interest
Expense
Deprec:
Buildings
Deprec:
Pers Prop
Deprec:
Land Imps
Other
Deducts
(Loss) or
Gain from
Sale Net Income
Benefits
from
Losses at
35%
Total
Benefits
2017 3,389,171 389,772 207,468 (211,497) (240,222) (167,837) (119,406) (116,318) (647,811) 226,734 (2,772,666)
2018 1,129,723 470,668 550,738 (321,601) (428,770) (46,049) (11,318) (127,266) (384,266) 134,493 (524,562)
2019 0 470,668 557,701 (339,768) (428,770) (28,213) (10,239) (87,847) (337,136) 117,998 588,666
2020 0 470,668 564,745 (336,035) (428,770) (41,506) (9,269) (92,615) (343,449) 120,207 590,875
2021 0 470,668 569,771 (332,166) (428,770) (56,026) (8,395) (97,351) (352,937) 123,528 594,196
2022 470,668 576,808 (328,158) (428,770) (46,387) (7,609) (102,033) (336,148) 117,652 588,320
2023 470,668 582,707 (324,003) (428,770) (37,463) (7,237) (106,673) (321,440) 112,504 583,172
2024 470,668 589,738 (319,699) (428,770) (43,612) (7,237) (111,251) (320,830) 112,291 582,958
2025 470,668 595,523 (315,238) (428,770) (40,557) (7,237) (115,774) (312,052) 109,218 579,886
2026 470,668 602,531 (310,615) (428,770) (39,109) (7,237) (119,841) (303,040) 106,064 576,732
2027 80,896 608,233 (305,824) (428,770) (38,099) (7,237) (120,021) (291,719) 102,102 182,998
2028 615,196 (300,860) (428,770) (40,846) (7,237) (124,319) (286,835) 100,392 100,392
2029 620,761 (295,715) (428,770) (40,397) (7,237) (128,539) (279,897) 97,964 97,964
2030 627,658 (290,384) (428,770) (42,860) (7,237) (132,658) (274,250) 95,988 95,988
2031 633,065 (284,858) (428,770) (42,600) (7,237) (136,459) (266,860) 93,401 93,401
2032 447,564 447,564 (156,647) (156,647)
2033 0 0 0
4,518,894 4,706,679 8,502,642 (4,616,422) (6,242,997) (751,561) (231,369) (1,718,964) 447,564 (4,611,107) 1,613,887
Gamma Gardens
4% Transaction
130% area
ORIGINAL (2017 Underwriting)
Original IRR
Updated IRR
PPC reduction to maintain IRR:
8.15%
5.29%
10.53 cents
IRR: 8.15%*30-year depreciation for real property
*50% bonus depreciation for LI, PP
Page 35
www.bfim.comMarch 1, 2018
Year Capital
Credits:
LIHTC
Gross
Income
Interest
Expense
Deprec:
Buildings
Deprec:
Pers Prop
Deprec:
Land Imps
Other
Deducts
(Loss) or
Gain from
Sale Net Income
Benefits
from
Losses at
21%
Total
Benefits
2018 3,389,171 389,772 207,468 (211,497) (223,344) (279,312) (227,233) (116,318) (850,236) 178,550 (2,820,850)
2019 1,129,723 470,668 550,738 (321,601) (398,645) (1,459) (535) (127,266) (298,768) 62,741 (596,314)
2020 470,668 557,701 (339,768) (398,645) (1,459) (535) (87,847) (270,553) 56,816 527,484
2021 470,668 564,745 (336,035) (398,645) (25,453) (535) (92,615) (288,538) 60,593 531,261
2022 470,668 569,771 (332,166) (398,645) (39,974) (535) (97,351) (298,899) 62,769 533,437
2023 470,668 576,808 (328,158) (398,645) (38,361) (535) (102,033) (290,922) 61,094 531,762
2024 470,668 582,707 (324,003) (398,645) (37,463) (535) (106,673) (284,613) 59,769 530,437
2025 470,668 589,738 (319,699) (398,645) (43,612) (535) (111,251) (284,003) 59,641 530,309
2026 470,668 595,523 (315,238) (398,645) (40,557) (535) (115,774) (275,225) 57,797 528,465
2027 470,668 602,531 (310,615) (398,645) (39,109) (535) (119,841) (266,213) 55,905 526,573
2028 80,896 608,233 (305,824) (398,645) (38,099) (535) (120,021) (254,892) 53,527 134,424
2029 615,196 (300,860) (398,645) (40,846) (535) (124,319) (250,008) 52,502 52,502
2030 620,761 (295,715) (398,645) (40,397) (535) (128,539) (243,070) 51,045 51,045
2031 627,658 (290,384) (398,645) (42,860) (535) (132,658) (237,423) 49,859 49,859
2032 633,065 (284,858) (398,645) (42,600) (535) (136,459) (230,033) 48,307 48,307
2033 12,376 12,376 (2,599) (2,599)
2034 0 0 0
4,518,894 4,706,679 8,502,642 (4,616,422) (5,804,371) (751,561) (234,720) (1,718,964) 12,376 (4,611,020) 968,314
Gamma Gardens
4% Transaction
130% area
2018 Version
Original IRR
Updated IRR
PPC reduction to maintain IRR:
8.15%
5.29%
10.53 cents
IRR: 5.29%*30-year depreciation for real property
*100% bonus depreciation for LI, PP (except 5% tax-exempt use)
*Opts out of interest expense limitation
Page 36
www.bfim.comMarch 1, 2018
Year Capital
Credits:
LIHTC
Gross
Income
Interest
Expense
Deprec:
Buildings
Deprec:
Pers Prop
Deprec:
Land Imps
Other
Deducts
(Loss) or
Gain from
Sale Net Income
Benefits
from
Losses at
21%
Total
Benefits
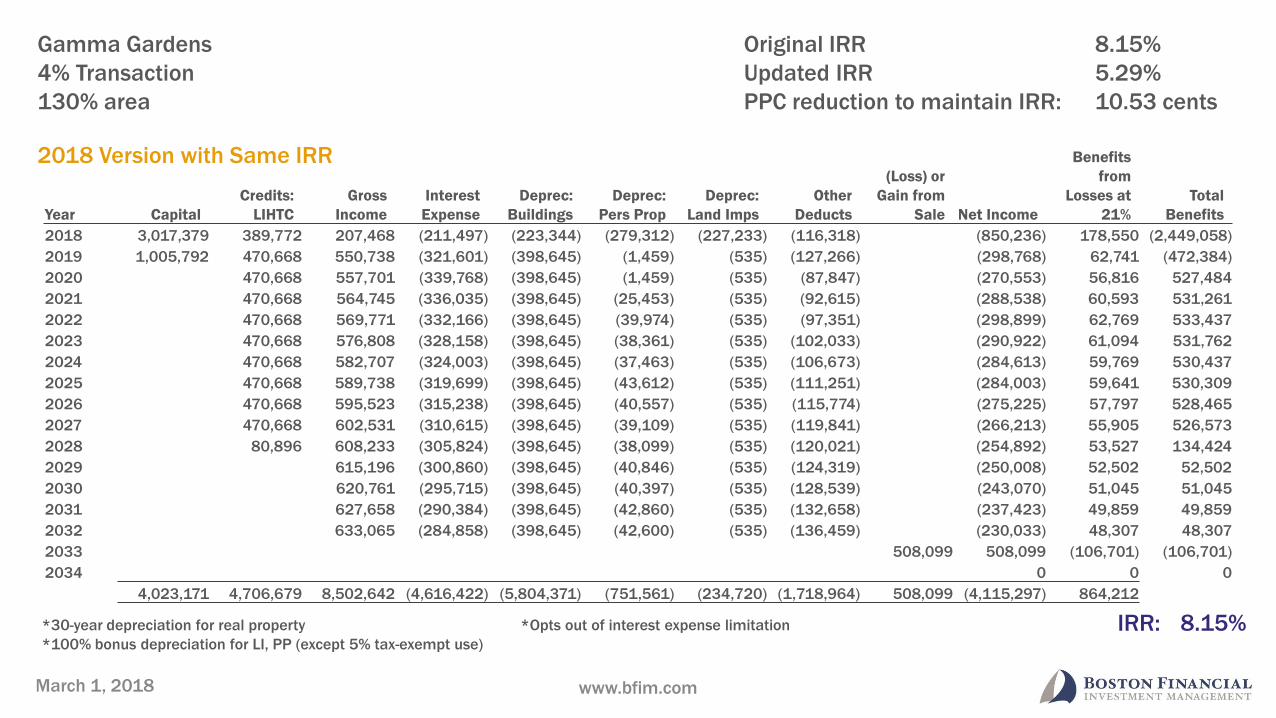
2018 3,017,379 389,772 207,468 (211,497) (223,344) (279,312) (227,233) (116,318) (850,236) 178,550 (2,449,058)
2019 1,005,792 470,668 550,738 (321,601) (398,645) (1,459) (535) (127,266) (298,768) 62,741 (472,384)
2020 470,668 557,701 (339,768) (398,645) (1,459) (535) (87,847) (270,553) 56,816 527,484
2021 470,668 564,745 (336,035) (398,645) (25,453) (535) (92,615) (288,538) 60,593 531,261
2022 470,668 569,771 (332,166) (398,645) (39,974) (535) (97,351) (298,899) 62,769 533,437
2023 470,668 576,808 (328,158) (398,645) (38,361) (535) (102,033) (290,922) 61,094 531,762
2024 470,668 582,707 (324,003) (398,645) (37,463) (535) (106,673) (284,613) 59,769 530,437
2025 470,668 589,738 (319,699) (398,645) (43,612) (535) (111,251) (284,003) 59,641 530,309
2026 470,668 595,523 (315,238) (398,645) (40,557) (535) (115,774) (275,225) 57,797 528,465
2027 470,668 602,531 (310,615) (398,645) (39,109) (535) (119,841) (266,213) 55,905 526,573
2028 80,896 608,233 (305,824) (398,645) (38,099) (535) (120,021) (254,892) 53,527 134,424
2029 615,196 (300,860) (398,645) (40,846) (535) (124,319) (250,008) 52,502 52,502
2030 620,761 (295,715) (398,645) (40,397) (535) (128,539) (243,070) 51,045 51,045
2031 627,658 (290,384) (398,645) (42,860) (535) (132,658) (237,423) 49,859 49,859
2032 633,065 (284,858) (398,645) (42,600) (535) (136,459) (230,033) 48,307 48,307
2033 508,099 508,099 (106,701) (106,701)
2034 0 0 0
4,023,171 4,706,679 8,502,642 (4,616,422) (5,804,371) (751,561) (234,720) (1,718,964) 508,099 (4,115,297) 864,212
Gamma Gardens
4% Transaction
130% area
2018 Version with Same IRR
Original IRR
Updated IRR
PPC reduction to maintain IRR:
8.15%
5.29%
10.53 cents
IRR: 8.15%*30-year depreciation for real property
*100% bonus depreciation for LI, PP (except 5% tax-exempt use)
*Opts out of interest expense limitation
Page 37
www.bfim.comMarch 1, 2018
Year Capital
Credits:
LIHTC
Gross
Income
Interest
Expense
Deprec:
Buildings
Deprec:
Pers Prop
Deprec:
Land Imps
Other
Deducts
(Loss) or
Gain from
Sale Net Income
Benefits
from
Losses at
35%
Total
Benefits
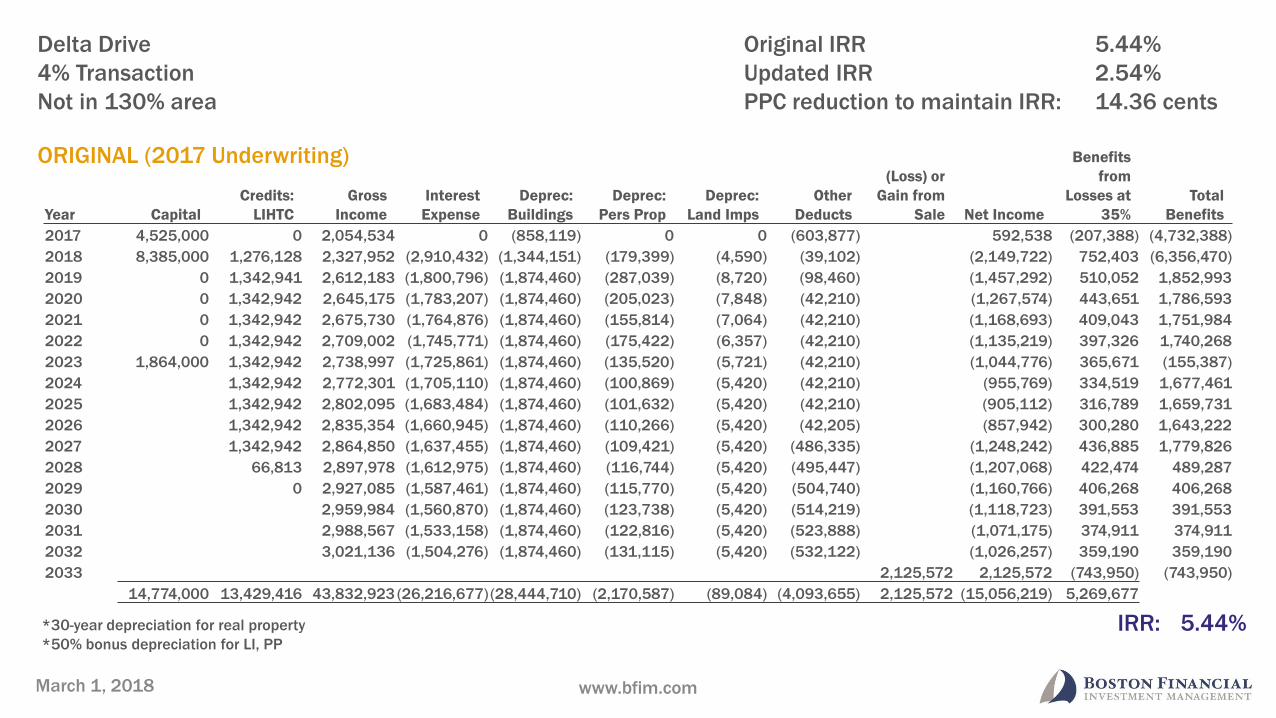
2017 4,525,000 0 2,054,534 0 (858,119) 0 0 (603,877) 592,538 (207,388) (4,732,388)
2018 8,385,000 1,276,128 2,327,952 (2,910,432) (1,344,151) (179,399) (4,590) (39,102) (2,149,722) 752,403 (6,356,470)
2019 0 1,342,941 2,612,183 (1,800,796) (1,874,460) (287,039) (8,720) (98,460) (1,457,292) 510,052 1,852,993
2020 0 1,342,942 2,645,175 (1,783,207) (1,874,460) (205,023) (7,848) (42,210) (1,267,574) 443,651 1,786,593
2021 0 1,342,942 2,675,730 (1,764,876) (1,874,460) (155,814) (7,064) (42,210) (1,168,693) 409,043 1,751,984
2022 0 1,342,942 2,709,002 (1,745,771) (1,874,460) (175,422) (6,357) (42,210) (1,135,219) 397,326 1,740,268
2023 1,864,000 1,342,942 2,738,997 (1,725,861) (1,874,460) (135,520) (5,721) (42,210) (1,044,776) 365,671 (155,387)
2024 1,342,942 2,772,301 (1,705,110) (1,874,460) (100,869) (5,420) (42,210) (955,769) 334,519 1,677,461
2025 1,342,942 2,802,095 (1,683,484) (1,874,460) (101,632) (5,420) (42,210) (905,112) 316,789 1,659,731
2026 1,342,942 2,835,354 (1,660,945) (1,874,460) (110,266) (5,420) (42,205) (857,942) 300,280 1,643,222
2027 1,342,942 2,864,850 (1,637,455) (1,874,460) (109,421) (5,420) (486,335) (1,248,242) 436,885 1,779,826
2028 66,813 2,897,978 (1,612,975) (1,874,460) (116,744) (5,420) (495,447) (1,207,068) 422,474 489,287
2029 0 2,927,085 (1,587,461) (1,874,460) (115,770) (5,420) (504,740) (1,160,766) 406,268 406,268
2030 2,959,984 (1,560,870) (1,874,460) (123,738) (5,420) (514,219) (1,118,723) 391,553 391,553
2031 2,988,567 (1,533,158) (1,874,460) (122,816) (5,420) (523,888) (1,071,175) 374,911 374,911
2032 3,021,136 (1,504,276) (1,874,460) (131,115) (5,420) (532,122) (1,026,257) 359,190 359,190
2033 2,125,572 2,125,572 (743,950) (743,950)
14,774,000 13,429,416 43,832,923 (26,216,677) (28,444,710) (2,170,587) (89,084) (4,093,655) 2,125,572 (15,056,219) 5,269,677
Delta Drive
4% Transaction
Not in 130% area
ORIGINAL (2017 Underwriting)
Original IRR
Updated IRR
PPC reduction to maintain IRR:
5.44%
2.54%
14.36 cents
IRR: 5.44%*30-year depreciation for real property
*50% bonus depreciation for LI, PP
Page 38
www.bfim.comMarch 1, 2018
Year Capital
Credits:
LIHTC
Gross
Income
Interest
Expense
Deprec:
Buildings
Deprec:
Pers Prop
Deprec:
Land Imps
Other
Deducts
(Loss) or
Gain from
Sale Net Income
Benefits
from
Losses at
35%
Total
Benefits
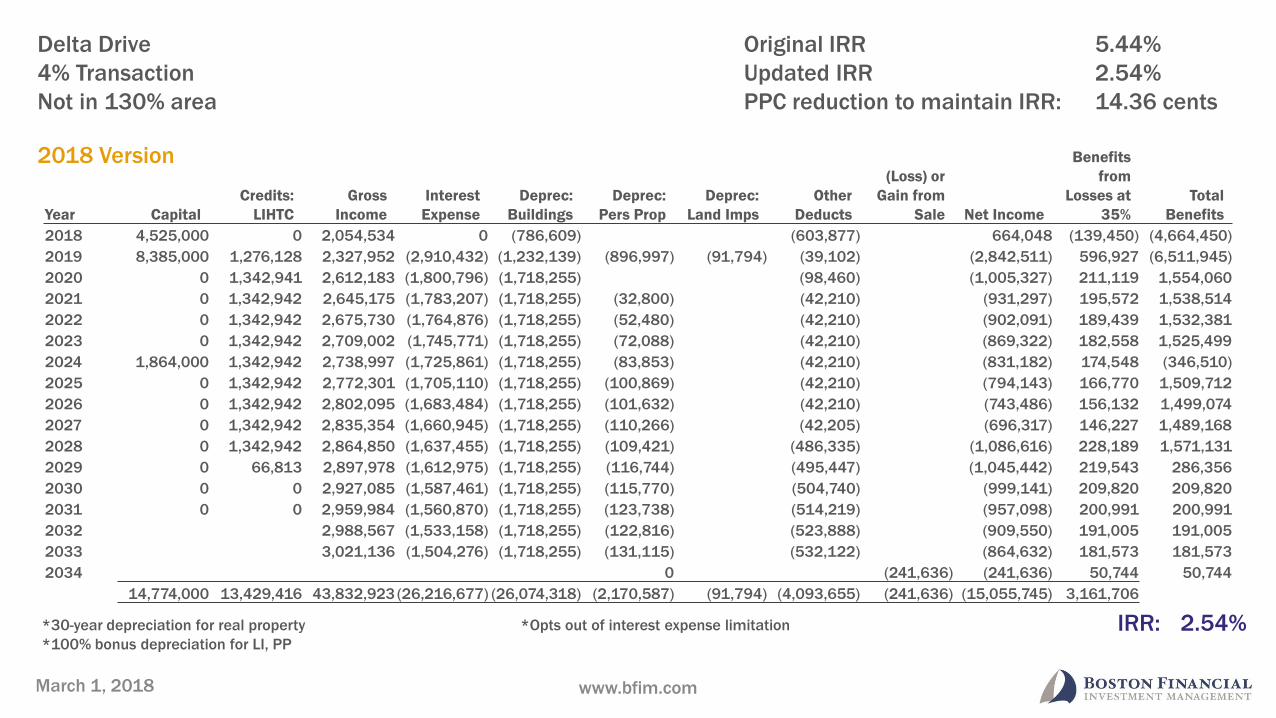
2018 4,525,000 0 2,054,534 0 (786,609) (603,877) 664,048 (139,450) (4,664,450)
2019 8,385,000 1,276,128 2,327,952 (2,910,432) (1,232,139) (896,997) (91,794) (39,102) (2,842,511) 596,927 (6,511,945)
2020 0 1,342,941 2,612,183 (1,800,796) (1,718,255) (98,460) (1,005,327) 211,119 1,554,060
2021 0 1,342,942 2,645,175 (1,783,207) (1,718,255) (32,800) (42,210) (931,297) 195,572 1,538,514
2022 0 1,342,942 2,675,730 (1,764,876) (1,718,255) (52,480) (42,210) (902,091) 189,439 1,532,381
2023 0 1,342,942 2,709,002 (1,745,771) (1,718,255) (72,088) (42,210) (869,322) 182,558 1,525,499
2024 1,864,000 1,342,942 2,738,997 (1,725,861) (1,718,255) (83,853) (42,210) (831,182) 174,548 (346,510)
2025 0 1,342,942 2,772,301 (1,705,110) (1,718,255) (100,869) (42,210) (794,143) 166,770 1,509,712
2026 0 1,342,942 2,802,095 (1,683,484) (1,718,255) (101,632) (42,210) (743,486) 156,132 1,499,074
2027 0 1,342,942 2,835,354 (1,660,945) (1,718,255) (110,266) (42,205) (696,317) 146,227 1,489,168
2028 0 1,342,942 2,864,850 (1,637,455) (1,718,255) (109,421) (486,335) (1,086,616) 228,189 1,571,131
2029 0 66,813 2,897,978 (1,612,975) (1,718,255) (116,744) (495,447) (1,045,442) 219,543 286,356
2030 0 0 2,927,085 (1,587,461) (1,718,255) (115,770) (504,740) (999,141) 209,820 209,820
2031 0 0 2,959,984 (1,560,870) (1,718,255) (123,738) (514,219) (957,098) 200,991 200,991
2032 2,988,567 (1,533,158) (1,718,255) (122,816) (523,888) (909,550) 191,005 191,005
2033 3,021,136 (1,504,276) (1,718,255) (131,115) (532,122) (864,632) 181,573 181,573
2034 0 (241,636) (241,636) 50,744 50,744
14,774,000 13,429,416 43,832,923 (26,216,677) (26,074,318) (2,170,587) (91,794) (4,093,655) (241,636) (15,055,745) 3,161,706
Delta Drive
4% Transaction
Not in 130% area
2018 Version
Original IRR
Updated IRR
PPC reduction to maintain IRR:
5.44%
2.54%
14.36 cents
IRR: 2.54%*30-year depreciation for real property
*100% bonus depreciation for LI, PP
*Opts out of interest expense limitation
Page 39
www.bfim.comMarch 1, 2018
Year Capital
Credits:
LIHTC
Gross
Income
Interest
Expense
Deprec:
Buildings
Deprec:
Pers Prop
Deprec:
Land Imps
Other
Deducts
(Loss) or
Gain from
Sale Net Income
Benefits
from
Losses at
35%
Total
Benefits
2018 3,934,488 0 2,054,534 0 (786,609) 0 0 (603,877) 664,048 (139,450) (4,073,938)
2019 7,290,758 1,276,128 2,327,952 (2,910,432) (1,232,139) (896,997) (91,794) (39,102) (2,842,511) 596,927 (5,417,702)
2020 0 1,342,941 2,612,183 (1,800,796) (1,718,255) 0 (98,460) (1,005,327) 211,119 1,554,060
2021 0 1,342,942 2,645,175 (1,783,207) (1,718,255) (32,800) (42,210) (931,297) 195,572 1,538,514
2022 0 1,342,942 2,675,730 (1,764,876) (1,718,255) (52,480) (42,210) (902,091) 189,439 1,532,381
2023 0 1,342,942 2,709,002 (1,745,771) (1,718,255) (72,088) (42,210) (869,322) 182,558 1,525,499
2024 1,620,748 1,342,942 2,738,997 (1,725,861) (1,718,255) (83,853) (42,210) (831,182) 174,548 (103,258)
2025 1,342,942 2,772,301 (1,705,110) (1,718,255) (100,869) (42,210) (794,143) 166,770 1,509,712
2026 1,342,942 2,802,095 (1,683,484) (1,718,255) (101,632) (42,210) (743,486) 156,132 1,499,074
2027 1,342,942 2,835,354 (1,660,945) (1,718,255) (110,266) (42,205) (696,317) 146,227 1,489,168
2028 1,342,942 2,864,850 (1,637,455) (1,718,255) (109,421) (486,335) (1,086,616) 228,189 1,571,131
2029 66,813 2,897,978 (1,612,975) (1,718,255) (116,744) (495,447) (1,045,442) 219,543 286,356
2030 2,927,085 (1,587,461) (1,718,255) (115,770) (504,740) (999,141) 209,820 209,820
2031 2,959,984 (1,560,870) (1,718,255) (123,738) (514,219) (957,098) 200,991 200,991
2032 2,988,567 (1,533,158) (1,718,255) (122,816) (523,888) (909,550) 191,005 191,005
2033 3,021,136 (1,504,276) (1,718,255) (131,115) (532,122) (864,632) 181,573 181,573
2034 1,686,371 1,686,371 (354,138) (354,138)
12,845,993 13,429,416 43,832,923 (26,216,677) (26,074,318) (2,170,587) (91,794) (4,093,655) 1,686,371 (13,127,738) 2,756,825
Delta Drive
4% Transaction
Not in 130% area
2018 Version with Same IRR
Original IRR
Updated IRR
PPC reduction to maintain IRR:
5.44%
2.54%
14.36 cents
IRR: 5.44%*30-year depreciation for real property
*100% bonus depreciation for LI, PP
*Opts out of interest expense limitation
Page 40
Todd Crow
March 1, 2018 www.novoco.com
FEDERAL UPDATE
Michael NovogradacManaging Partner
@Novogradac
Novogradac & Company LLP
Fred CopemanSr. VP of Equity Production
Boston Financial Investment Management, LP
Executive Vice President and
Manager of Tax Credit Capital
PNC Real Estate
@ToddJCrow