Approved by USDA’s World Agricultural Outlook Board
Feed Outlook Tom Capehart, Coordinator Olga Liefert
Projected Corn Exports Surge, Ethanol Gains Projected corn exports for 2017/18 are raised 175 million bushels this month to 2,225 million, as
reduced export prospects for Argentina provide opportunities for the United States in global markets.
On the domestic side, corn for ethanol is raised 50 million bushels to 5,575 million. With these
changes, corn use is raised 225 million bushels. A corresponding reduction in projected carryout
lowers the stocks-to-use ratio and results in a $0.05 increase in the average price received by
producers to $3.35 per bushel.
The U.S corn export forecast for 2017/18 is bumped up this month by 4.5 million tons to 56.0 million.
Since December 2017, U.S. corn export prices have been the lowest among major corn exporters,
boosting sales and driving up the recent pace of shipments. Outstanding corn sales reached a record-
high at the start of March. A sharp reduction in projected corn supplies in Argentina this month and the
slow pace of Brazilian shipments are expected to further support U.S. export competitiveness during
the latter part of 2017/18.
Economic Research Service | Situation and Outlook Report
Next release is April 12, 2018 FDS-18c | March12, 2018
2 Feed Outlook, FDS-18c, March12, 2018
USDA, Economic Research Service
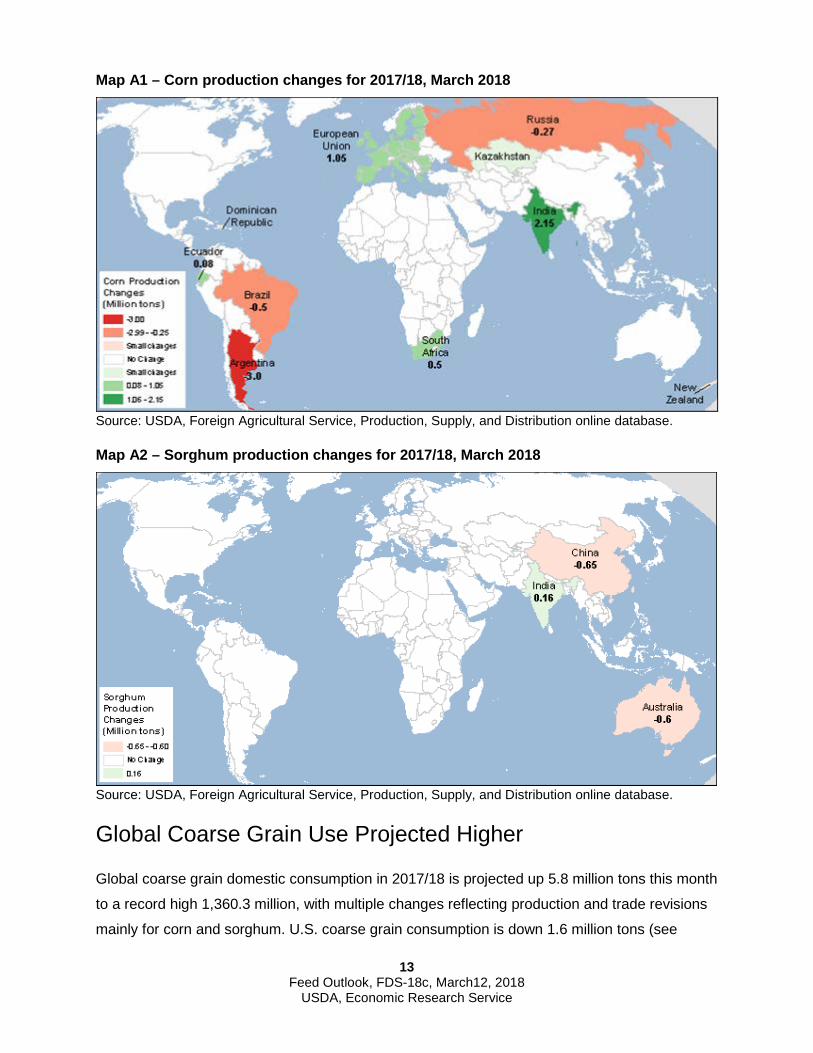
Domestic Outlook Total Corn Disappearance Projected Higher
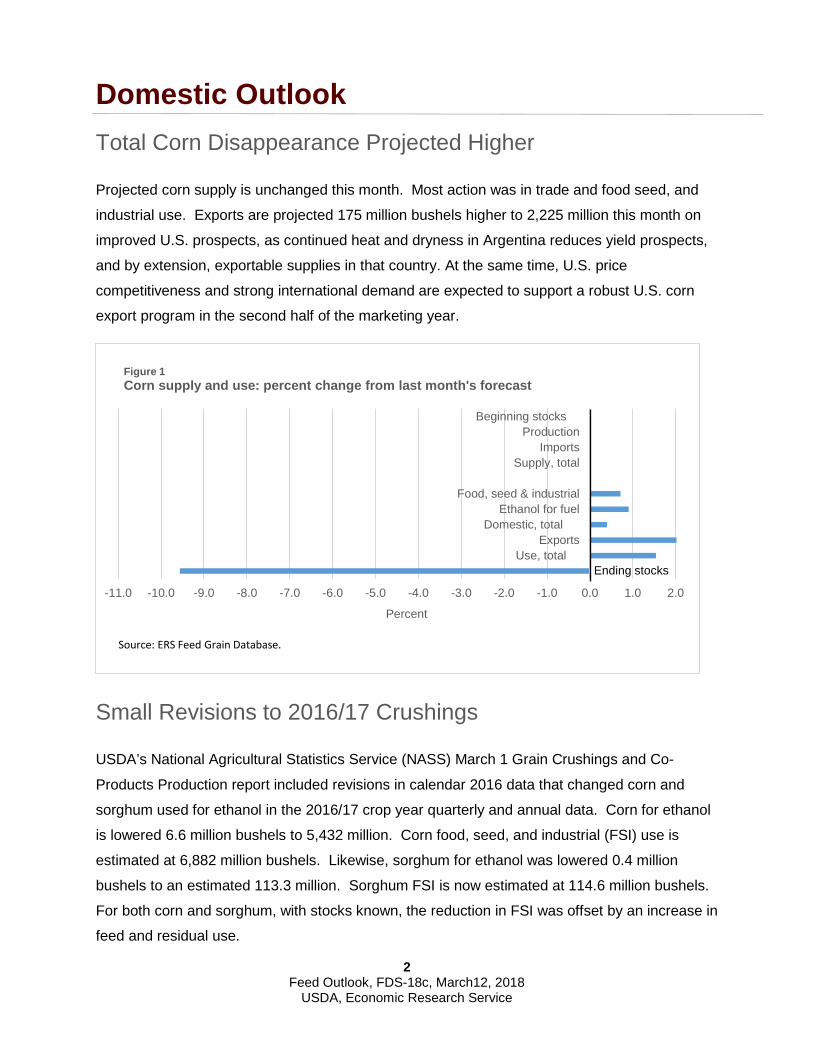
Projected corn supply is unchanged this month. Most action was in trade and food seed, and
industrial use. Exports are projected 175 million bushels higher to 2,225 million this month on
improved U.S. prospects, as continued heat and dryness in Argentina reduces yield prospects,
and by extension, exportable supplies in that country. At the same time, U.S. price
competitiveness and strong international demand are expected to support a robust U.S. corn
export program in the second half of the marketing year.
Small Revisions to 2016/17 Crushings
USDA’s National Agricultural Statistics Service (NASS) March 1 Grain Crushings and Co-
Products Production report included revisions in calendar 2016 data that changed corn and
sorghum used for ethanol in the 2016/17 crop year quarterly and annual data. Corn for ethanol
is lowered 6.6 million bushels to 5,432 million. Corn food, seed, and industrial (FSI) use is
estimated at 6,882 million bushels. Likewise, sorghum for ethanol was lowered 0.4 million
bushels to an estimated 113.3 million. Sorghum FSI is now estimated at 114.6 million bushels.
For both corn and sorghum, with stocks known, the reduction in FSI was offset by an increase in
feed and residual use.
-11.0 -10.0 -9.0 -8.0 -7.0 -6.0 -5.0 -4.0 -3.0 -2.0 -1.0 0.0 1.0 2.0
Use, totalExports
Domestic, total Ethanol for fuel
Food, seed & industrial
Supply, totalImports
ProductionBeginning stocks
Percent
Figure 1Corn supply and use: percent change from last month's forecast
Source: ERS Feed Grain Database.
Ending stocks
3 Feed Outlook, FDS-18c, March12, 2018
USDA, Economic Research Service
Feed and Residual
Feed and residual use for the four feed grains (corn, sorghum, barley, and oats) and wheat is
projected at 148.9 million metric tons, 0.1 million bushels below last month on a September-
August marketing year basis. Wheat is projected 0.4 million tons lower at 3.4 million but is
nearly offset by higher sorghum at 2.0 million tons.
0
2
4
6
8
10
12
14
16
18
87/88 1990/91 93/94 96/97 99/00 2002/03 05/06 08/09 11/12 14/15 17/18
Feed and residualExportsOther food, seed, and industrial usesEthanolEnding stocks
Note: Marketing year 2017/18 is projected.Source: USDA, World Agricultural Outlook Board, WASDE.
Figure 2U.S. corn utilizationBillion bu
1.01.52.02.53.03.54.04.55.05.56.06.57.07.5
Sep. Oct. Nov. Dec. Jan. Feb. Mar. Apr. May Jun. July Aug.
2012/132013/142014/152015/162016/172017/18
Source: USDC, U.S. Census, February 2018 Grain Inspections.
Million metric tons
Figure 3Monthly U.S. corn exports
4 Feed Outlook, FDS-18c, March12, 2018
USDA, Economic Research Service
Grain consuming animal units (GCAU) are projected at 98.72 million, 0.03 below last month’s
projection. GCAUs for 2016/17 are revised up slightly to 95.7 million units. For 2017/18, feed
and residual per GCAU is 1.51 million tons, unchanged from last month. For 2016/17, feed and
residual per GCAU is increased by 0.02 million tons to 1.53 million.
Food, Seed, and Industrial Raised on Higher Ethanol Production
FSI use of corn is raised 50 million bushels this month to 7,045 million. A 50-million-bushel
increase in corn for fuel ethanol is behind the increase. Corn for fuel ethanol is projected at
5,575 million bushels, 143 million higher than 2016/17. Energy Information Administration
shows strong gains in weekly ethanol use, and prospects for exports are favorable. Brazil, in
particular, has imported significant volumes of ethanol from the United States despite a 20-
percent tariff on shipments over 160 million gallons because of the price competitiveness of
U.S. ethanol. Currently, ethanol is priced at $1.50 per gallon at the Gulf Ports, compared with
$2.32 per gallon in Brazil. Demand for ethanol in Brazil is robust because of widespread use of
flex-fuel vehicles and an ethanol inclusion mandate of 27 percent minimum for ethanol in
gasoline.
0
20
40
60
80
100
120
140
160
180
200
Sep. Oct. Nov. Dec. Jan. Feb. Mar. Apr. May Jun. July Aug.
Figure 4U.S. fuel ethanol exports
2016/17 World 2017/18 World
2016/17 Brazil 2017/18 Brazil
Source: USDC, U.S. Census Bureau.
1,000 gal.
5 Feed Outlook, FDS-18c, March12, 2018
USDA, Economic Research Service
Projected Corn Exports Raised 175 million bushels
Projected corn exports for 2017/18 are raised 175 million bushels this month to 2,225 million.
Through January, Census data indicate September-January exports of 641.6 million bushels,
compared with 886.0 million this time last season. Lower exportable supplies in Argentina and
competitive U.S. prices are the main factors in increased prospects for U.S. trade. Corn
shipments in January were 151.5 million bushels, with Japan, Mexico, Colombia, and Taiwan
the major destinations. In January 2017, shipments were 182.5 million bushels, and Japan,
Mexico, South Korea, and Colombia were the major destinations.
Stocks Dip With Increased Use
Higher corn for ethanol and exports boost total corn use 225 million bushels to 14,820 million,
the highest ever. Total use in 2016/17 is estimated at 14,649 million bushels, and the previous
5-year average was 13,319 million. Resulting ending stocks are projected at 2,127 million
bushels, 225 million below last month’s forecast and 166 million below 2016/17. The stocks-to-
use ratio for corn is 14.4, reflecting the tighter stocks but still historically the second highest
since 2005/06. Last month’s stocks-to-use ratio was 16.1.
The shrinking stocks combined with marketings to date result in an increase of $0.10 per bushel
at the low end of the season-average price received by farmers range and no change at the
123456789
Jan. 2000
Jan. 01
Jan. 02
Jan. 03
Jan. 04
Jan. 05
Jan. 06
Jan. 07
Jan. 08
Jan. 09
Jan. 10
Jan. 11
Jan. 12
Jan. 13
Jan. 14
Jan. 15
Jan. 16
Jan. 17
Jan. 18
Dol. / bu.
Sources: USDA, Economic Research Service, Feed Grains Database and USDA, Agricultural Marketing Service, http://marketnews.usda.gov/portal/lg.
Louisiana Gulf
Central Illinois
Figure 5Monthly corn (yellow #2) prices for Central Illinois and Louisiana Gulf
6 Feed Outlook, FDS-18c, March12, 2018
USDA, Economic Research Service
high end for a range of $3.15 to $3.55 per bushel. The midpoint price of $3.35 per bushel is a
penny short of last year’s price.
Sorghum Exports Projected Lower on Reduced Imports by China
There are no supply changes for sorghum this month. Projected 2017/18 sorghum exports are
lowered 15 million bushels based on expectations of reduced shipments to China. Exports are
now projected at 245 million bushels, slightly higher than 2016/17. China has initiated a
Countervailing Duty Investigation alleging U.S. sorghum is being sold at below cost to China. In
recent weeks, total U.S. sorghum export commitments (outstanding sales + shipments) have
declined slightly with sales cancellations. The 15-million-bushel reduction in use is offset by
higher feed and residual use, leaving total use and carryout unchanged from last month’s
projection. The range for the average price received by farmers is narrowed $0.05 on each end
of the range for a midpoint $3.15 per bushel, unchanged from last month.
0
200
400
600
800
1,000
1,200
Sep. Oct. Nov. Dec. Jan. Feb. Mar. Apr. May Jun. July Aug.
Figure 6U.S. sorghum exports
2016/172017/182016/17 China2017/18 China
Source: USDC, U.S. Census Bureau, February 2018 Grain Inspections.
1,000 metric tons
7 Feed Outlook, FDS-18c, March12, 2018
USDA, Economic Research Service
Minor Changes Barley Balance Sheet
This month, there is little change in the projected barley balance sheet. A 1-million-bushel
increase in exports to 6 million bushels raises total use to 203 million bushels, a few bushels
below 2016/17. Ending stocks are projected lower at 60.3 million bushels, reflecting the shift in
exports. Barley stocks are the tightest since 2011/12.
Oats Imports Reduced, Price Rises
Projected oats imports are lowered 10 million bushels to 90 million. Imports are the major
source of supplies, accounting for nearly half of the total. Imports are forecast lower based on
year-to-date pace, with slower than expected imports from Canada. Supply is projected at
189.7 million bushels, compared with a 5-year average of 210.0 million.
With no change in use, the supply change is carried through to carryout, which is projected at
19.7 million bushels. This is 30.6 million below last year’s estimate and 24.7 million below the
previous 5 year’s average.
The projected range of average prices received by farmers is narrowed by $0.05 on each end
for a range of $2.55 to $2.75 per bushel. The midpoint projection is $2.65 per bushel, $0.59
higher than 2016/17.
2.00
2.50
3.00
3.50
4.00
4.50
Jan-14
Apr-14
Jul-14
Oct-14
Jan-15
Apr-15
Jul-15
Oct-15
Jan-16
Apr-16
Jul-16
Oct-16
Jan-17
Apr-17
Jul-17
Oct-17
Jan-18
Dol. / bu.
Source: USDA, Economic Research Service, Feed Grains Database.
Figure 7Monthly average barley prices received by farmers
8 Feed Outlook, FDS-18c, March12, 2018
USDA, Economic Research Service
2.00
2.50
3.00
3.50
4.00
4.50
5.00
Jan-14
Apr-14
Jul-14
Oct-14
Jan-15
Apr-15
Jul-15
Oct-15
Jan-16
Apr-16
Jul-16
Oct-16
Jan-17
Apr-17
Jul-17
Oct-17
Jan-18
Dol. / bu.
Source: USDA, Economic Research Service, Feed Grains Database.
Figure 8Monthly average oat price: No. 2 white heavy, Minneapolis, MN
9 Feed Outlook, FDS-18c, March12, 2018
USDA, Economic Research Service
International Outlook Argentine Corn Prospects Reduced Further
Although global coarse grain production for 2017/18 is forecast virtually unchanged at 1,322.0
million tons, substantial shifts across and within coarse grain crops are projected this month,
with sizeable implications for individual country balances and U.S. trade.
Coarse grain production for Argentina, Australia, Brazil, Russia, and China is projected lower,
with offsetting increases for India, the European Union (EU), Kazakhstan, and South Africa.
The largest production change this month is a 3-million-ton drop in Argentina’s corn prospects to
36.0 million, with projected yield down almost 8 percent to 6.9 tons per hectare. An ongoing
drought and high temperatures have been concentrated in high-yielding areas of central
Argentina (provinces of Santa Fe, western Entre Rios, and southeast Cordoba), where the corn
crop continued to deteriorate. Intermittent rains brought some relief, but coverage and rain
intensity were not enough to end the drought in many areas, and subsurface soil moisture has
become critically low. The heat and drought were most intense in January-February with record-
low precipitation during corn pollination in some areas, severely reducing yield potential. The
first harvest reports confirm greater-than-expected yield losses.
Among other reductions are a weather-driven area and yield cut for Australian sorghum, a small
downward revision for Brazilian corn, and lower projected corn output in Russia (see table A2).
Higher projected corn yields in South Africa are boosted by favorable planting moisture,
seasonable temperatures, and timely rains during the reproductive period of the crop. The crop
was stressed during the dry spell in December-mid-January that reduced projected area but
since then has recovered nicely.
The Indian Ministry of Agriculture issued a second advanced estimate for crops, suggesting a
record-high corn crop. It is suspected that hybrid corn seed imported from Argentina and Brazil
was essential in achieving high (by Indian standards) yields of 2.8 tons per hectare. Production
of all other coarse grains in India is also projected higher.
China’s National Bureau of Statistics released 2016/17 final production estimates for small
grains. Forecasts for 2017/18 were updated based on this historical data. Expectations are for
lower sorghum and barley area and output but higher millet and oats production. It is worth
mentioning that oats production almost doubled month-to-month, supported by higher yields. EU
10 Feed Outlook, FDS-18c, March12, 2018
USDA, Economic Research Service
2017/18 coarse grain production is raised 0.8 million tons this month to 151.6 million due to
additional reports from the agricultural statistics agencies of France and Germany. EU corn
production is up 1.0 million tons to 61.1 million, and adjustments are made for other EU grains.
For more information, details, and specific causes of the revisions and details of this month’s
changes in coarse grain production, see tables A1, A2, and maps A1 and A2 below. The
changes in global, foreign, and U.S coarse grain production by type of grain are shown in table
A1, while changes in coarse grain production by country and type of grain are given in table A2.
13 Feed Outlook, FDS-18c, March12, 2018
USDA, Economic Research Service
Map A1 – Corn production changes for 2017/18, March 2018
Source: USDA, Foreign Agricultural Service, Production, Supply, and Distribution online database.
Map A2 – Sorghum production changes for 2017/18, March 2018
Source: USDA, Foreign Agricultural Service, Production, Supply, and Distribution online database.
Global Coarse Grain Use Projected Higher
Global coarse grain domestic consumption in 2017/18 is projected up 5.8 million tons this month
to a record high 1,360.3 million, with multiple changes reflecting production and trade revisions
mainly for corn and sorghum. U.S. coarse grain consumption is down 1.6 million tons (see
14 Feed Outlook, FDS-18c, March12, 2018
USDA, Economic Research Service
domestic section for details). Global feed and residual use of coarse grain is raised 2.7 million
tons, with increased corn and oats use and reduced sorghum feed consumption. Changes for
other coarse grains are smaller.
COUNTRY FOCUS: China’s Feed Use and Imports Unchanged, but the Shares Shift
The most important changes in coarse grain use this month are coming from China. Although
the country’s total coarse grain feeding is unchanged, a reduction in sorghum feeding is fully
offset by an increase in corn, barley, and oats use.
The projected changes in feed use fully mirror the changes in China’s imports this month.
Figure A:
Chinese feed grain use (and imports) changes for 2017/18
Source: USDA, Foreign Agricultural Service, Production, Supply, and Distribution online database.
These changes in projected feed use stem from an investigation of alleged dumping and
subsidization of sorghum by the United States initiated by the Chinese Ministry of Commerce in
February. China alleges that sorghum imports originating in the United States at low prices put
downward pressure on prices for sorghum producers in China.
China has allowed its corn prices to fall since 2015, but they have strengthened since last year
and are considerably higher than world prices. The price structure for feed grains in China,
particularly in the feed-deficit South, creates a strong incentive for feed mills to use imported
feeds (see figure B). Highly competitive prices for imported sorghum triggered a rapid rise in
imports, which went from less than 100,000 tons in 2011/12 to 10.1 million in 2014/15 and are
projected at 5.6 million for 2017/18.
-1.5 -1.0 -0.5 0.0 0.5 1.0 1.5Million tons
Sorghum Corn Barley Oats
15 Feed Outlook, FDS-18c, March12, 2018
USDA, Economic Research Service
Figure B
Prices for feeds in China $US per ton
DDGs = distillers’ dried grains.
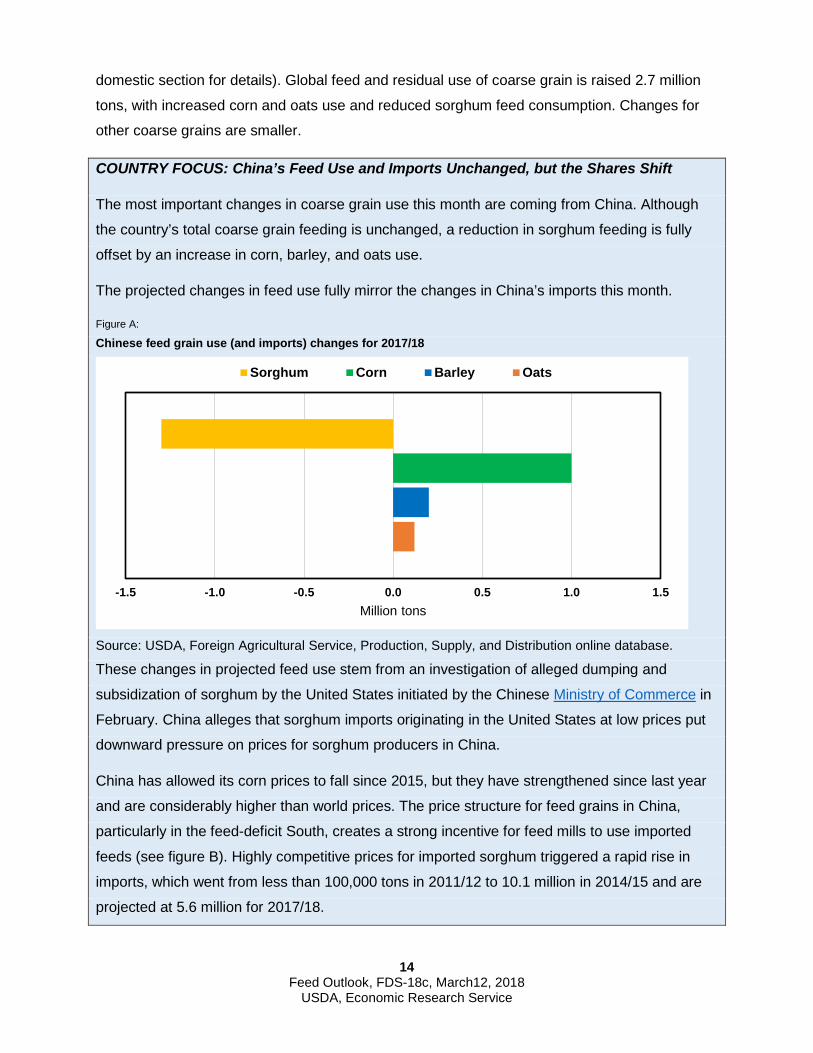
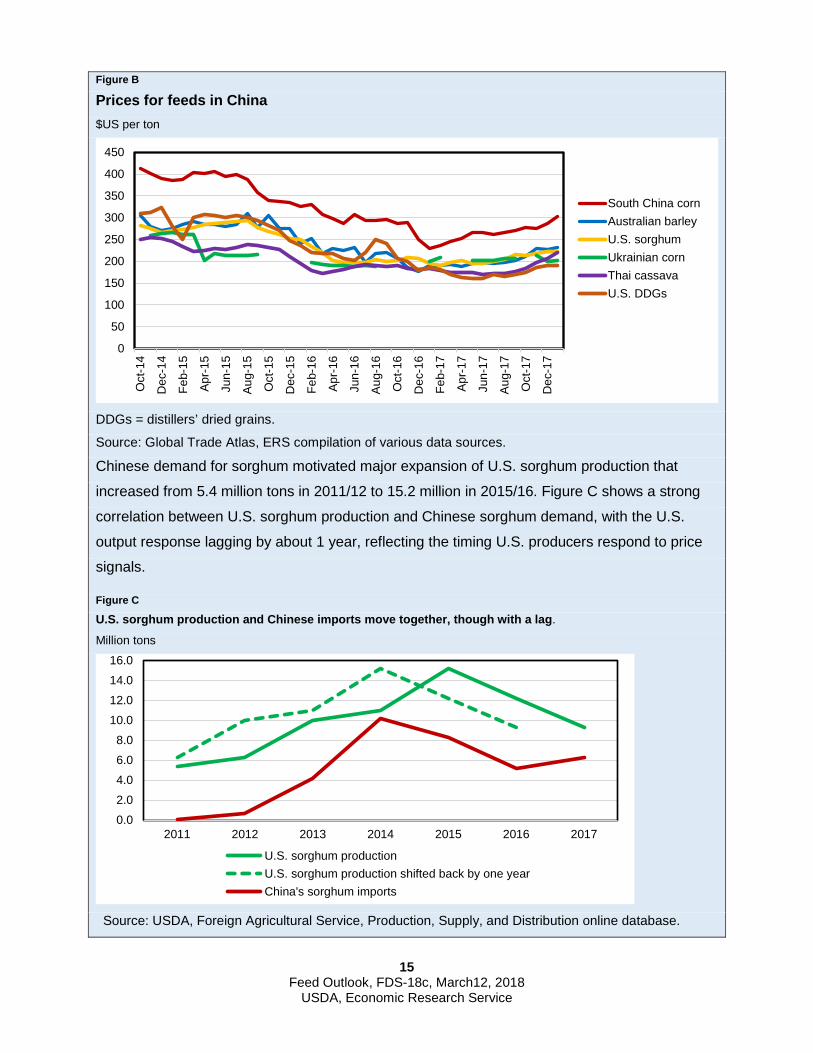
Source: Global Trade Atlas, ERS compilation of various data sources. Chinese demand for sorghum motivated major expansion of U.S. sorghum production that
increased from 5.4 million tons in 2011/12 to 15.2 million in 2015/16. Figure C shows a strong
correlation between U.S. sorghum production and Chinese sorghum demand, with the U.S.
output response lagging by about 1 year, reflecting the timing U.S. producers respond to price
signals.
Figure C
U.S. sorghum production and Chinese imports move together, though with a lag.
Million tons
Source: USDA, Foreign Agricultural Service, Production, Supply, and Distribution online database.
0
50
100
150
200
250
300
350
400
450O
ct-1
4
Dec
-14
Feb-
15
Apr-1
5
Jun-
15
Aug-
15
Oct
-15
Dec
-15
Feb-
16
Apr-1
6
Jun-
16
Aug-
16
Oct
-16
Dec
-16
Feb-
17
Apr-1
7
Jun-
17
Aug-
17
Oct
-17
Dec
-17
South China cornAustralian barleyU.S. sorghumUkrainian cornThai cassavaU.S. DDGs
0.02.04.06.08.0
10.012.014.016.0
2011 2012 2013 2014 2015 2016 2017
U.S. sorghum productionU.S. sorghum production shifted back by one yearChina's sorghum imports
16 Feed Outlook, FDS-18c, March12, 2018
USDA, Economic Research Service
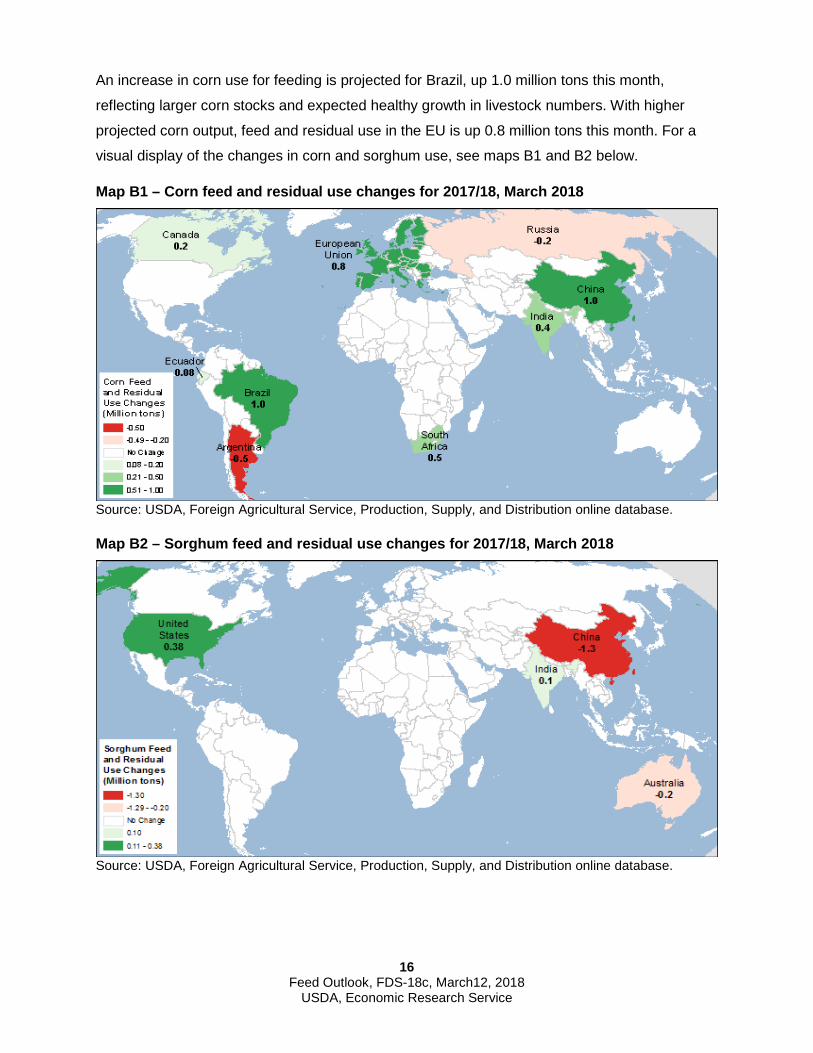
An increase in corn use for feeding is projected for Brazil, up 1.0 million tons this month,
reflecting larger corn stocks and expected healthy growth in livestock numbers. With higher
projected corn output, feed and residual use in the EU is up 0.8 million tons this month. For a
visual display of the changes in corn and sorghum use, see maps B1 and B2 below.
Map B1 – Corn feed and residual use changes for 2017/18, March 2018
Source: USDA, Foreign Agricultural Service, Production, Supply, and Distribution online database.
Map B2 – Sorghum feed and residual use changes for 2017/18, March 2018
Source: USDA, Foreign Agricultural Service, Production, Supply, and Distribution online database.
17 Feed Outlook, FDS-18c, March12, 2018
USDA, Economic Research Service
U.S. Corn Export Prospects Up Sharply, Export Share Shift Is
Projected
U.S. 2017/18 trade year corn exports are increased 4.5 million tons this month to 56.0 million
(up 175 million bushels to 2,225 million for the September-August marketing year). The increase
of almost 9 percent is supported by reduced foreign corn exporter supplies, a lull in competitors’
shipments, and strong recent U.S. sales. The pace of U.S. corn shipments during the first
months of 2017/18 has been robust, though not particularly strong compared with last year.
Census export data indicate October-January corn exports reached 12.7 million tons, 20
percent lower than in the previous year. However, as of March 1, 2018, outstanding U.S. export
sales of corn reached a record-high in recent decades of 22.3 million tons, 25 percent above
that of last year. A sharp reduction in projected corn supplies in Argentina this month and a slow
pace of Brazilian shipments are expected to further support U.S. exports competitiveness during
the latter part of 2017/18, when Southern Hemisphere countries start exporting new crop.
Global corn trade is virtually unchanged this month as reduced corn exports from Argentina and
Brazil fully offset higher projected U.S. exports. With sharply lower projected corn output,
exports are reduced 2.5 million tons for Argentina to 25.0 million for its 2017/18 local marketing
year (March 2018-February 2019). For the 2017/18 international year (October-September), the
corn export projection is reduced by a smaller amount of 1.5 million tons, supported by the
sound pace of exports since October 2017.
Despite ample supplies, the Brazilian pace of corn exports has been lagging behind the
forecast. For the 2016/17 local marketing year (March 2017-February 2018) that just ended in
February, corn exports are reduced 2.3 million tons to 31.7 million tons. The local marketing
year 2017/18 corn exports are left unchanged at a record of 35.0 million tons. For the 2017/18
October-September international trade year that includes most of the second half of the 2016/17
local year, Brazilian exports are reduced 3.0 million tons to 31.0 million, assuming several more
months of lower pace. While down sharply, the projected exports maintain Brazil as the world’s
second-largest corn exporter.
Corn imports are projected higher for China, up 1.0 million tons to 4.0 million (see the section on
Chinese changes in imports and feeding above). For a visual display of this month’s changes in
corn and sorghum feed and residual use, see maps C1 and C2.
18 Feed Outlook, FDS-18c, March12, 2018
USDA, Economic Research Service
Map C1– Corn trade year (TY) exports changes for 2017/18, March 2018
Source: USDA, Foreign Agricultural Service, Production, Supply, and Distribution online database.
Sorghum Trade Reduced, U.S. Exports Down
Global sorghum trade is projected down 0.7 million tons to 7.7 million, with a reduction in
Chinese sorghum imports that are projected now at 5.6 million tons. U.S. 2017/18 sorghum
exports are down 0.4 million tons to 6.4 million (down 15 million bushels to 245 million for the
September-August marketing year). U.S. export commitments (sales + shipments) have
declined marginally with sales cancellations over the past 3 weeks. Reduced demand from
China is expected, stemming from the country’s recent investigation into U.S. sorghum exports
(see the discussion above on China feed and import changes). With the reduction in projected
Australian sorghum output, exports by Australia (that go exclusively to China) for the October–
September trade year are halved, down 0.3 million tons to 0.3 million.
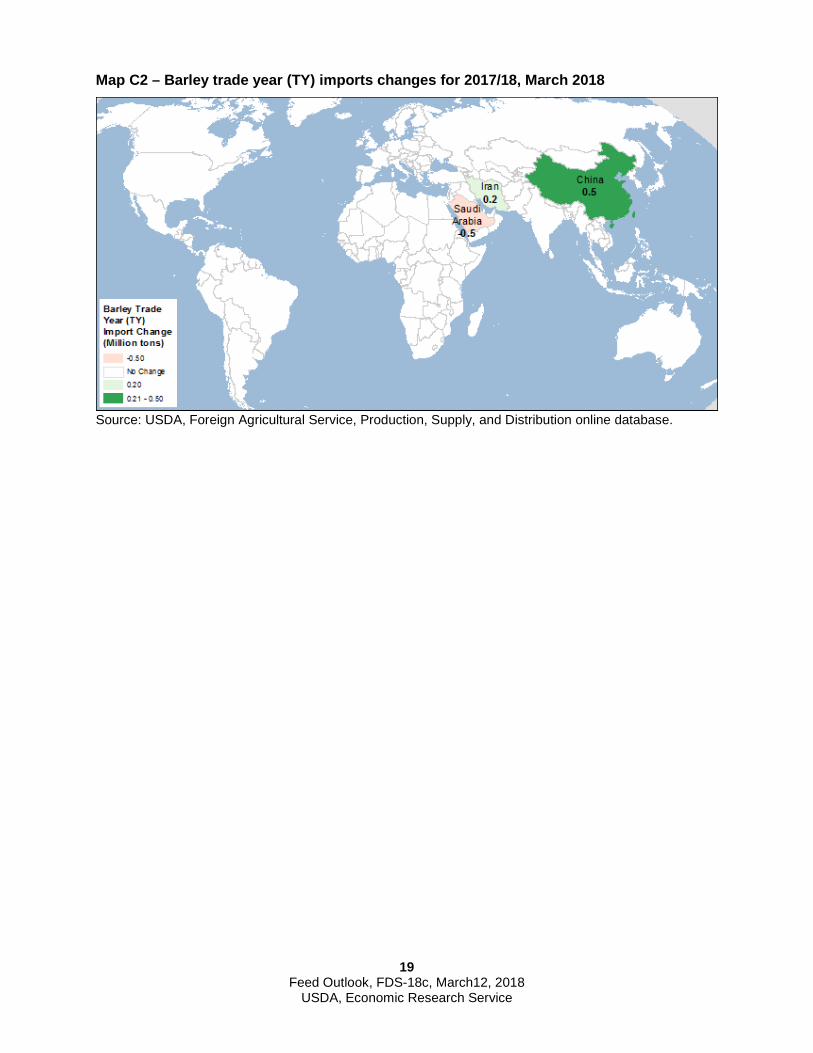
A Shift in Barley Imports This Month
Global barley trade for the October-September international trade year is projected slightly
higher, up 0.2 million tons, with increased supplies and exports from Kazakhstan that go to Iran,
a major Kazakh destination. Barley imports for China are up 0.5 million tons, while Saudi Arabia
is expected to import 0.5 million tons less. See feature “Barley Prices Fail to Curb China’s
Demand” in the March issue of Grain: World Markets and Trade, p. 1.
19 Feed Outlook, FDS-18c, March12, 2018
USDA, Economic Research Service
Map C2 – Barley trade year (TY) imports changes for 2017/18, March 2018
Source: USDA, Foreign Agricultural Service, Production, Supply, and Distribution online database.
Beginning stocks Production Imports
Total supply
Food, seed, and industrial
use
Feed and residual
use Exports
Total disappear-
anceEnding stocks
Farm price 2/(dollars
per bushel)
Sep-Nov 1,232 14,216 5 15,452 1,615 2,225 401 4,241 11,211 3.57Dec-Feb 11,211 6 11,217 1,622 1,445 400 3,468 7,750 3.80Mar-May 7,750 10 7,760 1,673 1,094 540 3,307 4,453 3.75Jun-Aug 4,453 11 4,464 1,687 520 526 2,733 1,731 3.69Mkt yr 1,232 14,216 32 15,479 6,597 5,284 1,867 13,748 1,731 3.70
Sep-Nov 1,731 13,602 13 15,346 1,631 2,178 301 4,111 11,235 3.65Dec-Feb 11,235 18 11,253 1,652 1,438 341 3,431 7,822 3.64Mar-May 7,822 21 7,843 1,655 914 563 3,132 4,711 3.60Jun-Aug 4,711 16 4,727 1,710 584 696 2,990 1,737 3.55Mkt yr 1,731 13,602 68 15,401 6,648 5,114 1,901 13,664 1,737 3.61
Sep-Nov 1,737 15,148 14 16,899 1,689 2,277 548 4,514 12,386 3.26Dec-Feb 12,386 12 12,398 1,711 1,528 537 3,776 8,622 3.39Mar-May 8,622 17 8,639 1,740 981 689 3,410 5,229 3.46Jun-Aug 5,229 14 5,243 1,743 688 518 2,949 2,293 3.40Mkt yr 1,737 15,148 57 16,942 6,882 5,473 2,293 14,649 2,293 3.36
Sep-Nov 2,293 14,604 11 16,908 1,745 2,298 349 4,392 12,516 3.22Mkt yr 2,293 14,604 50 16,947 7,045 5,550 2,225 14,820 2,127 3.15-3.55
Sep-Nov 34.03 432.58 0.21 466.82 10.60 149.98 83.64 244.23 222.59 3.63Dec-Feb 222.59 0.12 222.71 1.80 2.37 98.69 102.86 119.86 4.17Mar-May 119.86 0.00 119.86 1.43 -14.99 99.13 85.57 34.29 4.41Jun-Aug 34.29 0.04 34.33 1.18 -55.54 70.28 15.92 18.41Mkt yr 34.03 432.58 0.38 466.98 15.01 81.82 351.75 448.57 18.41 4.03
Sep-Nov 18.41 596.75 3.60 618.76 22.14 159.65 114.44 296.23 322.54 3.54Dec-Feb 322.54 0.98 323.51 41.77 -6.14 86.30 121.93 201.58 3.17Mar-May 201.58 0.01 201.59 43.31 -5.53 73.46 111.24 90.35 3.10Jun-Aug 90.35 0.01 90.36 29.73 -41.39 65.38 53.73 36.63 3.33Mkt yr 18.41 596.75 4.59 619.75 136.95 106.58 339.58 583.12 36.63 3.31
Sep-Nov 36.63 480.26 0.00 516.90 21.65 142.68 44.43 208.75 308.15 2.62Dec-Feb 308.15 0.00 308.15 33.06 3.56 90.79 127.41 180.75 2.69Mar-May 180.75 0.00 180.75 34.62 3.95 57.48 96.04 84.71 2.79Jun-Aug 84.71 1.73 86.44 25.30 -20.19 47.87 52.98 33.46 3.53Mkt yr 36.63 480.26 1.74 518.63 114.61 129.99 240.57 485.18 33.46 2.79
Sep-Nov 33.46 363.83 1.91 399.20 13.92 113.66 45.60 173.19 226.02 3.10Mkt yr 33.46 363.83 2.00 399.29 50.00 80.00 245.00 375.00 24.29 2.95-3.35
Sorghum 2014/15
2015/16
2016/17
2017/18
Table 1--Feed grains: U.S. quarterly supply and disappearance (million bushels), 3/12/2018
Commodity, market year,and quarter 1/Corn 2014/15
2015/16
2016/17
2017/18
21 Feed Outlook / FDS-18c / March 12, 2018
Economic Research Service, USDA
Beginning stocks Production Imports
Total supply
Food, seed, and industrial
use
Feed and residual
use Exports
Total disappear-
anceEnding stocks
Farm price 2/(dollars
per bushel)
Jun-Aug 82 182 7 271 40 47 4 91 180 5.69Sep-Nov 180 5 184 39 -15 4 28 156 5.25Dec-Feb 156 6 163 37 5 3 44 118 5.07Mar-May 118 6 124 44 -3 4 45 79 4.86Mkt yr 82 182 24 287 160 34 14 209 79 5.30
Jun-Aug 79 218 4 301 41 38 3 82 219 5.39Sep-Nov 219 4 223 37 1 4 43 180 5.52Dec-Feb 180 7 187 36 11 3 50 138 5.66Mar-May 138 4 141 44 -5 1 39 102 5.43Mkt yr 79 218 19 315 158 44 11 213 102 5.52
Jun-Aug 102 200 2 304 41 32 1 74 230 4.99Sep-Nov 230 2 232 39 -0 1 40 193 4.78Dec-Feb 193 2 195 37 12 1 50 145 5.04Mar-May 145 3 148 45 -6 2 41 106 4.96Mkt yr 102 200 10 312 162 39 4 205 106 4.96
Jun-Aug 106 142 2 251 42 27 2 71 180 4.52Sep-Nov 180 2 182 40 -15 2 27 155 4.43Mkt yr 106 142 15 263 162 35 6 203 60 4.20-4.70
Jun-Aug 25 70 27 122 18 30 1 48 74 3.34Sep-Nov 74 25 99 18 14 0 32 67 3.16Dec-Feb 67 32 99 17 22 0 40 59 3.08Mar-May 59 25 84 24 6 1 31 54 2.89Mkt yr 25 70 109 204 77 71 2 150 54 3.21
Jun-Aug 54 90 18 161 18 49 0 68 94 2.15Sep-Nov 94 26 120 18 19 1 37 83 2.08Dec-Feb 83 25 108 17 15 0 33 75 2.09Mar-May 75 16 91 23 10 1 34 57 2.11Mkt yr 54 90 86 229 77 94 2 172 57 2.12
Jun-Aug 57 65 21 142 19 44 1 64 79 1.87Sep-Nov 79 28 106 18 12 1 31 75 2.03Dec-Feb 75 24 100 17 18 1 36 63 2.35Mar-May 63 18 81 22 8 1 31 50 2.42Mkt yr 57 65 90 212 76 82 3 162 50 2.06
Jun-Aug 50 49 19 119 18 28 1 47 72 2.35Sep-Nov 72 30 102 19 16 1 35 67 2.58Mkt yr 50 49 90 190 78 90 2 170 20 2.55-2.75
Table 1--Feed grains: U.S. quarterly supply and disappearance, cont. (million bushels), 3/12/2018
Commodity, market year,and quarter 1/Barley 2014/15
2015/16
2016/17
2017/18
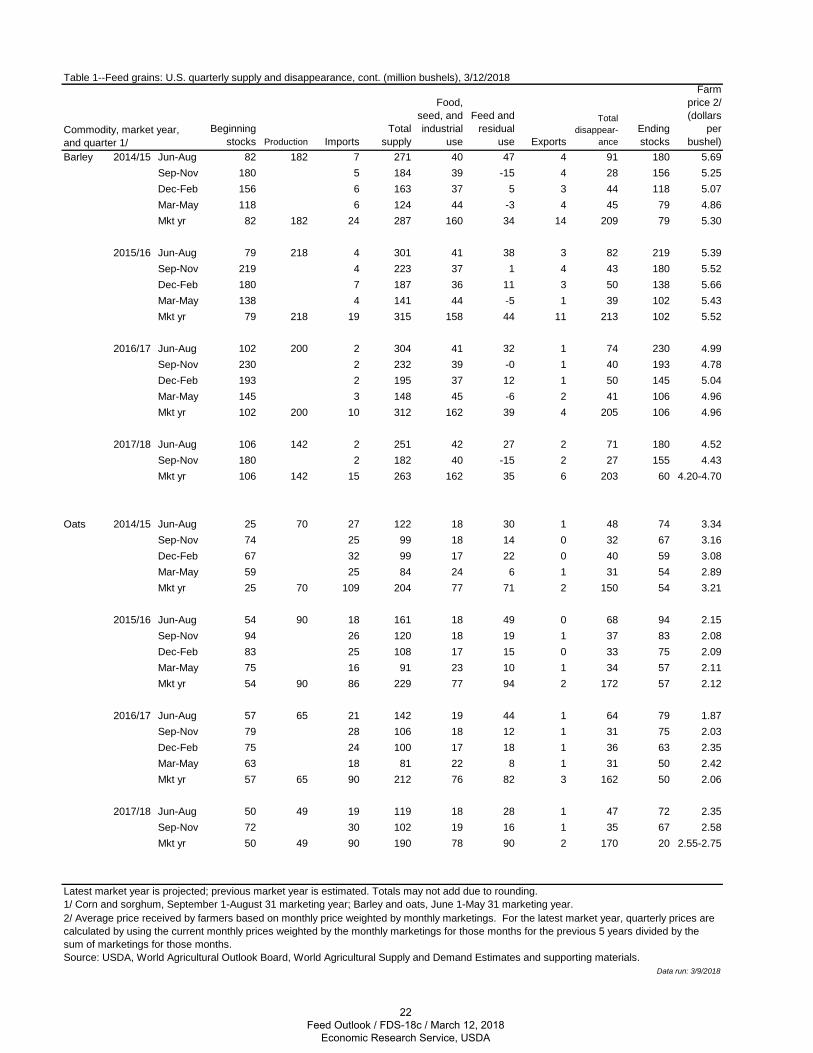
Latest market year is projected; previous market year is estimated. Totals may not add due to rounding.1/ Corn and sorghum, September 1-August 31 marketing year; Barley and oats, June 1-May 31 marketing year.2/ Average price received by farmers based on monthly price weighted by monthly marketings. For the latest market year, quarterly prices are calculated by using the current monthly prices weighted by the monthly marketings for those months for the previous 5 years divided by the sum of marketings for those months.Source: USDA, World Agricultural Outlook Board, World Agricultural Supply and Demand Estimates and supporting materials.
Data run: 3/9/2018
Oats 2014/15
2015/16
2016/17
2017/18
22 Feed Outlook / FDS-18c / March 12, 2018
Economic Research Service, USDA
Grain consuming animal units
(millions)
94.2
95.7
98.7
2015/16 2016/17Sep 3.55 3.78Oct 3.67 3.88Nov 3.62 3.83Dec 3.62 3.88Jan 3.55 4.07Feb 3.56 4.14Mar 3.54 4.04Apr 3.61 3.98May 3.74 4.03Jun 3.91 4.01Jul 3.28 4.00Aug 3.09 3.77Mkt year 3.56 3.95
2015/16 2016/17Jun 2.59Jul 2.70Aug 2.41Sep 2.39Oct 2.57Nov 2.60Dec 2.60Jan 2.58Feb 2.50Mar 2.46 4.70Apr 2.45May 2.44Mkt year 2.52 4.70
1/ Corn and sorghum, September 1-August 31 marketing year; Barley and oats, June 1-May 31 marketing year. Simple averageof monthly prices for the marketing year.Source: USDA, Agricultural Marketing Service, http://marketnews.usda.gov/portal/lg.
Data run: 3/9/2018
2.07 4.95 2.63 2.742.05 2.49 2.882.05 2.49 2.862.02 2.43 2.90
2.902.00 2.81 4.85 2.60 3.07 2.962.00 2.65 4.85 2.60 2.97
2.942.00 2.61 4.85 2.64 2.92 2.732.00 2.36 2.67 2.84
2.872.00 2.10 4.95 4.70 2.58 2.67 2.971.95 2.10 4.95 4.70 2.70 2.29
3.172.08 2.10 4.70 2.63 2.34 2.982.33 2.05 4.67 2.82 2.61
2017/182.36 2.05 4.70 2.89 2.58 2.95
Barley, No. 2 feed, Minneapolis, MN
(dollars per bushel)
Barley, No. 3 malting, Minneapolis, MN
(dollars per bushel)
Oats, No. 2 white heavy, Minneapolis, MN
(dollars per bushel)2016/17 2017/18 2015/16 2017/18 2015/16 2016/17
3.37 4.18 8.07 7.563.27 3.823.51 4.113.49 4.62 7.563.47 4.303.41 4.173.40 4.053.51 3.45 4.06 4.153.45 3.29 4.09 3.963.34 3.21 4.17 3.793.28 3.14 4.22 3.78 7.893.27 3.15 4.36 3.77 8.23
2015/16 2017/18 2015/16 2016/173.09 3.15 4.22 3.74 8.08
1/ Corn and sorghum, September 1-August 31 marketing year; Barley and oats, June 1-May 31 marketing year.Source: USDA, World Agricultural Outlook Board, World Agricultural Supply and Demand Estimates and supporting materials.
Table 3--Cash feed grain prices, 3/12/2018
Mkt year and month 1/
Corn, No. 2 yellow, Central IL
(dollars per bushel)
Corn, No. 2 yellow, Gulf ports, LA
(dollars per bushel)
Sorghum, No. 2 yellow,
Gulf ports, LA (dollars per cwt)
2016/17 2017/18
3.0 148.9 1.561.2 -1.4 59.8
MY Sep-Aug 141.0 2.0 1.1 1.7 145.92017/18 Q1 Sep-Nov 58.4 2.9 -0.3 0.3
1.522.6
MY Sep-Aug 139.0 3.3 0.7 1.2 144.3 1.6 145.9
-1.6 23.5Q4 Jun-Aug 17.5 -0.5 0.6 0.5 18.0 4.6
39.5 -0.6 38.9Q3 Mar-May 24.9 0.1 -0.1 0.2 25.1
0.2 61.7 -0.8 60.9Q2 Dec-Feb 38.8 0.1 0.3 0.3
2016/17 Q1 Sep-Nov 57.8 3.6 -0.0
MY Sep-Aug 129.9 2.7 0.8 1.5 135.0 3.2 138.2 1.5
22.0Q4 Jun-Aug 14.8 -1.1 0.7 0.7 15.2 7.2 22.4
0.1 36.9Q3 Mar-May 23.2 -0.1 -0.1 0.2 23.2 -1.2
59.8 -2.9 56.8Q2 Dec-Feb 36.5 -0.2 0.2 0.3 36.9
2015/16 Q1 Sep-Nov 55.3 4.1 0.0 0.3
Table 2--Feed and residual use of wheat and coarse grains, 3/12/2018
Market year andquarter 1/
Corn (million
metric tons)
Sorghum (million
metric tons)
Barley (million
metric tons)
Oats (million
metric tons)
Feed grains (million
metric tons)
Wheat (million
metric tons)
Energy feeds (million
metric tons)
Energy feeds per grain
consuming animal unit
(tons)
23 Feed Outlook / FDS-18c / March 12, 2018
Economic Research Service, USDA
2015/16 2016/17 2017/18327.97 241.88 80.70308.60 221.00 93.00289.78 217.50 96.25279.57 223.50 98.80273.61 221.88 106.25276.23 210.63303.81 195.00376.36 179.50408.58 179.38371.49 200.84340.80 198.50337.95 213.75324.56 208.61
2015/16 2016/17 2017/18291.88 116.25 70.36266.25 111.70 86.85221.67 104.84 107.88200.13 96.30 123.68193.75 98.88 114.59261.00 98.25316.25 99.25310.10 100.50345.00 105.25381.67 110.63347.00 110.00285.63 111.63285.03 105.29
Table 4--Selected feed and feed byproduct prices (dollars per ton), 3/12/2018
Mkt year and month 1/
Soybean meal, high protein,
Central Illinois, IL
Cottonseed meal, 41% solvent, Memphis, TN
Corn gluten feed, 21% protein,
Midwest
Corn gluten meal, 60% protein,
Midwest2016/17 2017/18 2015/16 2017/18 2015/16 2016/17 2015/16 2016/17 2017/18
Oct 323.26 319.24 292.50 229.00 96.00 77.00 509.38 466.13 469.30Nov 322.42 313.52 291.88 228.75 109.63 83.50 477.50 477.50 487.24Dec 321.03 327.17 265.00 232.50 113.13 92.83 482.25 501.67 482.88Jan 332.34 322.60 248.75 259.00 109.63 97.50 452.50 502.50 477.60Feb 334.32 362.85 238.13 303.13 102.38 88.13 457.50 516.50 483.13Mar 320.34 216.50 87.00 87.13 445.50 505.63Apr 305.67 207.50 73.25 75.00 434.00 501.13May 293.68 242.50 87.00 71.00 464.10 485.30Jun 258.75 284.00 107.13 68.38 568.13 475.75Jul 326.04 280.00 95.01 71.35 573.13 467.88Aug 301.05 280.00 90.30 73.10 507.20 475.50Sep 307.70 285.00 85.38 75.00 469.38 469.25Mkt yr 312.22 260.98 96.32 79.99 486.71 487.06
Meat and bone meal, Central US
Distillers dried grains, Central Illinois, IL
Wheat middlings, Kansas City, MO
Alfalfa hay, weighted-average
farm price 2/2016/17 2017/18 2015/16 2017/18 2015/16 2016/17 2016/17 2017/18
Oct 237.50 228.00 123.13 117.30 105.93 79.43 135.00 152.00Nov 229.00 219.38 132.63 123.13 106.53 85.53 130.00 148.00Dec 211.67 221.67 133.13 143.75 99.55 101.62 127.00 148.00Jan 255.60 220.00 132.50 155.50 104.16 98.25 126.00 152.00Feb 285.00 225.84 136.63 158.75 97.89 84.66 127.00Mar 284.38 134.50 68.64 80.76 134.00Apr 266.25 122.38 65.12 58.03 150.00May 245.50 141.10 60.72 48.41 157.00Jun 248.13 170.50 57.94 60.39 154.00Jul 276.25 149.38 61.48 67.10 152.00Aug 318.50 130.90 60.61 63.15 147.00Sep 301.88 127.75 64.43 67.48 149.00Mkt yr 263.31 136.21 79.42 74.57 136.001/ October 1-September 30 except for hay. Simple average of monthly prices for the marketing year except for hay.2/ May 1-April 30 marketing year. U.S. season-average price based on monthly price received by farmers weighted by monthly marketings.
Source: USDA, Agricultural Marketing Service, http://marketnews.usda.gov/portal/lg, and USDA, National Agricultural Statistics Service, http://www.nass.usda.gov/Data_and_Statistics/Quick_Stats/index.asp.
Table 5--Corn: Food, seed, and industrial use (million bushels), 3/12/2018
Mkt year and qtr 1/
High-fructose corn syrup
(HFCS)Glucose and
dextrose StarchAlcohol for
fuel
Alcohol for beverages and manufacturing
Cereals and other
products Seed
Total food, seed, and
industrial use2015/16 Q1 Sep-Nov 110.81 72.33 62.30 1,300.20 34.89 50.62 0.00 1,631.15
Q2 Dec-Feb 108.82 81.39 58.34 1,316.28 36.58 50.43 0.00 1,651.83Q3 Mar-May 125.18 89.99 57.84 1,264.80 38.27 50.92 27.93 1,654.93Q4 Jun-Aug 127.30 93.74 60.03 1,342.34 33.27 51.13 2.63 1,710.44MY Sep-Aug 472.11 337.44 238.52 5,223.61 143.00 203.10 30.56 6,648.34
2016/17 Q1 Sep-Nov 113.14 88.81 58.20 1,343.08 35.78 49.92 0.00 1,688.93Q2 Dec-Feb 106.39 88.16 56.08 1,371.21 36.35 52.33 0.00 1,710.52Q3 Mar-May 119.64 96.14 59.72 1,346.10 36.72 54.45 27.25 1,740.02
204.30Q4 Jun-Aug 126.35 97.09 61.18 1,371.56 37.15 47.60 2.05 1,742.99MY Sep-Aug 465.52 370.20 235.17 5,431.95 146.00
0.00
29.30 6,882.45
7,045.002017/18 Q1 Sep-Nov 112.55 93.62 59.71 1,391.29 36.30 51.40 1,744.87
MY Sep-Aug 460.00 390.00 235.00 5,575.00 149.00 206.40 29.60
1/ September-August. Latest data may be preliminary or projected.Source: Calculated by USDA, Economic Research Service.
Date run: 3/9/2018
24 Feed Outlook / FDS-18c / March 12, 2018
Economic Research Service, USDA
2017/18 2017/18Sep 16.01 14.41Oct 15.94 13.87Nov 15.78 13.90Dec 15.69 13.75Jan 15.75 13.81Feb 16.00 14.08MarAprMayJunJulAugMkt year 2/
3/ Grain for purposes other than malting, such as feed and seed use.Source: U.S. Department of Commerce, Bureau of the Census, Foreign Trade Statistics.
Date run: 3/9/2018
4 3 2 1 0 Total 2/ 51
73 55
71
711/ Grain only. Market year (June-May) and market year to date.2/ Totals may not add due to rounding.
Other barley 3/ Canada 116 74 89 50All other countries
119 77 90
55All other countries 0 0 17 17 0
Malting barley Canada 285 201 103 57
Total 2/ 285 202 119
Total 2/ 1,475 1,111 1,556 1,129 1,094
16All other countries 0 0 0 0 0
62 62 27 41Finland 34 27 21 21
Jun-Jan Jun-JanOats Canada 1,378 1,022 1,508 1,108 1,038
Sweden
1/ September-August. Latest month is preliminary.2/ Simple average of monthly prices for the marketing year.3/ Bulk-industrial, unmodified.Source: Milling and Baking News, except for corn starch which is from private industry.
Date run: 3/9/2018
Table 7--U.S. feed grain imports by selected sources (1,000 metric tons) 1/, 3/12/2018
Import and country/region---------- 2015/16 ---------- ---------- 2016/17 ---------- 2017/18Mkt year Jun-Jan Mkt year
28.2516.89 18.53 14.23 39.00 27.7516.25 17.92 14.98 39.00
28.2516.89 18.56 15.04 39.00 28.2516.89 18.56 14.74 39.00
28.2516.91 18.58 14.38 39.00 28.2516.99 18.58 14.29 39.00
28.2517.06 18.40 14.41 39.00 28.2517.13 18.80 17.67 14.20 39.00 39.25
26.75 28.2517.07 18.74 17.42 14.05 39.00 39.25 28.25 28.2516.84 18.51 17.35 14.23 39.00 39.00
28.2516.89 18.56 17.45 13.87 39.00 39.00 26.75 28.25
39.00 26.75 28.2517.06 18.73 17.61 13.39 39.00 39.00 26.75
2016/17 2016/17 2017/18 2016/17 2017/1816.71 18.38 17.68 13.21 39.00
Table 6--Wholesale corn milling product and byproduct prices, 3/12/2018
Mkt year and month 1/
Corn meal, yellow, Chicago, IL
(dollars per cwt)
Corn meal, yellow, New York, NY
(dollars per cwt)
Corn starch, Midwest 3/
(dollars per cwt)
Dextrose, Midwest
(cents per pound)
High-fructose corn syrup (42%),
Midwest(cents per pound)
2016/17 2016/17 2017/18
25 Feed Outlook / FDS-18c / March 12, 2018
Economic Research Service, USDA
2017/18Mkt year Sep-Jan Mkt year Sep-Jan Sep-Jan
Mexico 13,337 4,703 13,916 5,192 5,963Japan 10,439 2,509 13,527 4,465 3,408Colombia 4,548 1,801 4,730 1,886 2,104South Korea 2,964 206 5,601 2,422 624Peru 2,383 816 2,986 1,075 1,353China (Taiwan) 2,038 272 2,966 1,155 244Saudi Arabia 1,389 298 2,138 977 145Venezuela 1,155 196 419 158 165Canada 1,014 463 704 362 571Guatemala 906 281 993 398 243Egypt 852 189 323 211 55Algeria 663 91 16 0.119El Salvador 631 183 593 227 102Costa Rica 552 137 819 339 310Honduras 550 170 505 187 185Morocco 450 0.888 871 399 88European Union-27 413 3 843 203 72Vietnam 413 70 200 199 0.028Panama 392 93 504 239 235Israel 388 0.027 83 0.039 0.024Chile 353 0.338 543 418 0.574China (Mainland) 321 67 807 21 26Jamaica 283 118 275 101 127Nicaragua 258 48 329 123 59Dominican Republic 253 0.213 807 364 51All other countries 1,342 365 2,670 1,368 165Total 2/ 48,288 12,991 58,242 22,505 16,297
China (Mainland) 7,034 3,933 4,801 2,545 2,099Mexico 625 236 585 269 49Sub-Saharan Africa 593 270 475 138 41Pakistan 205 0.486 0.466 0.385All other countries 170 70 250 55 61Total 2/ 8,626 4,510 6,111 3,007 2,250
2017/18Mkt year Jun-Jan Mkt year Jun-Jan Jun-Jan
Mexico 142 122 2 1 0.427Canada 52 44 63 27 55Morocco 14 14China (Taiwan) 7 5 4 2 3All other countries 21 16 26 14 29Total 2/ 235 201 95 45 87
Date run: 3/9/2018
Sorghum
---------- 2015/16 ---------- ---------- 2016/17 ----------
Barley
1/ Grain only. Market year (September-August for corn and sorghum, June-May for barley) and market year to date.2/ Totals may not add due to rounding. Source: U.S. Department of Commerce, Bureau of the Census, Foreign Trade Statistics.
Table 8--U.S. feed grain exports by selected destinations (1,000 metric tons) 1/, 3/12/2018
Export and country/region---------- 2015/16 ---------- ---------- 2016/17 ----------
Corn
26 Feed Outlook / FDS-18c / March 12, 2018
Economic Research Service, USDA
Contacts and Links
Contact Information Tom Capehart (domestic), (202)-694-5313, [email protected] Olga Liefert,(international), (202)-694-5155, [email protected]
Subscription Information Subscribe to ERS e-mail notification service at http://www.ers.usda.gov/subscribe-to-ers-e-newsletters.aspx to receive timely notification of newsletter availability. Printed copies can be purchased from the USDA Order Desk by calling 1-800-363-2068 (specify the issue number)
To order printed copies of the five field crop newsletters—cotton and wool, feed, rice, oil crops, and wheat—as a series, specify series SUB-COR-4043
Data
Feed Grains Database is a queryable database that contains monthly, quarterly, and annual data on prices, supply, and use of corn and other feed grains. This includes data published in the monthly Feed Outlook.
Related Websites
Mann Library Feed Outlook page Mann Library WASDE page
Grain Circular https://www.fas.usda.gov/commodities/grain-and-feed
ERS Corn Topic page
E mail Notification
Readers of ERS outlook reports have two ways they can receive an e-mail notice about release of reports and associated data. • Receive timely notification (soonafter the report is posted on theweb) via USDA’s Economics,Statistics and Market InformationSystem (which is housed at CornellUniversity’s Mann Library). Goto http://usda.mannlib.cornell.edu/MannUsda/aboutEmailService.do andfollow the instructions to receive e-mail notices about ERS,Agricultural Marketing Service,National Agricultural StatisticsService, and World AgriculturalOutlook Board products
• Receive weekly notification(on Friday afternoon) via the ERSwebsite. Go to here and followthe instructions to receive noticesabout ERS outlook reports,Amber Waves magazine, andother reports and data products onspecific topics
The U.S. Department of Agriculture (USDA) prohibits discrimination in all its programs and activities on the basis of race, color, national origin, age, disability, and, where applicable, sex, marital status, familial status, parental status, religion, sexual orientation, genetic information, political beliefs, reprisal, or because all or a part of an individual’s income is derived from any public assistance program. (Not all prohibited bases apply to all programs.) Persons with disabilities who require alternative means for communication of program information (Braille, large print, audiotape, etc.) should contact USDA’s TARGET Center at (202) 720-2600 (voice and TDD). To file a complaint of discrimination write to USDA, Director, Office of Civil Rights, 1400 Independence Avenue, S.W., Washington, D.C. 20250-9410 or call (800) 795- 3272 (voice) or (202) 720-6382 (TDD). USDA is an equal opportunity provider and employer.
20 Feed Outlook / FDS-18c / March 12, 2018
Economic Research Service, USDA