40
FEEDBACK REPORT: AUDIT QUALITY INDICATORS 2019

FEEDBACK REPORT: AUDIT QUALITY INDICATORS
2019

FEEDBACK REPORT: AUDIT QUALITY INDICATORS
Page 2 of 40
DISCLAIMER
The content of this Feedback Report is based on information provided by selected audit firms, is not verified by the
Independent Regulatory Board for Auditors (IRBA), and is for information purposes only. The IRBA does not accept
any responsibility or liability for any claim of any nature whatsoever arising out of or relating to this report. Appendix
1 provides a description of the IRBA’s methodology and observations about data quality.
HOW TO USE THIS REPORT
Audit Quality Indicators (AQIs) are context specific. High or low ratios may mean different things to different users,
and may be interpreted differently when correlated with other statistics. AQIs are also based on the data provided
by firms; as such, better quality data may produce more accurate results. Users may consider how AQIs that firms
present at an engagement level or firm level compare to the AQIs presented in this Feedback Report. Such
comparisons can lead to further discussions and enquiries with auditors, and that can provide deeper insights into
audit quality. The Feedback Report does not set out to establish benchmarks or trends. The context of the AQIs
should be carefully considered at all times.
The AQIs discussed in this Feedback Report are not exhaustive or the only indicators of audit quality that should
be considered.
The references to the IRBA Code of Professional Conduct for Registered Auditors (Revised November 2018) (the
IRBA Code)1 are not exhaustive.
The full suite of the International Auditing and Assurance Standards Board’s International Quality Control, Auditing,
Review, Other Assurance, and Related Services Pronouncements (International Standards), the IRBA Code and
applicable legislation should be considered by the user of this Feedback Report.
COPYRIGHT
Copyright © December 2019 by the Independent Regulatory Board for Auditors (IRBA). All rights reserved.
Permission is granted to make copies of this work, provided that such copies, in whichever format, are for the
purpose of registered auditors discharging their professional duties; for use in academic classrooms or personal
use; that such copies are not sold or disseminated; and further provided that each copy bears the following credit
line:
“Copyright © December 2019 by the Independent Regulatory Board for Auditors. All rights reserved. Used with the
permission of the IRBA.” Otherwise, written permission from the Independent Regulatory Board for Auditors is
required to reproduce, store, transmit or make other similar uses of this document, except as permitted by law.
1 The IRBA Code of Professional Conduct for Registered Auditors is available on the IRBA website.

FEEDBACK REPORT: AUDIT QUALITY INDICATORS
Page 3 of 40
Foreword by the IRBA CEO
The IRBA is the statutory regulator of registered auditors in South Africa. Its strategic focus is to protect the financial
interests of the public by ensuring that registered auditors deliver services of the highest quality and adhere to the
highest ethics standards. The introduction of Audit Quality Indicators (AQIs) is in line with the IRBA’s strategic
objectives to be more proactive and help restore confidence in the auditing profession.
The AQIs may be used by:
• Auditors to help manage audit quality within their firms;
• Audit committees, as a tool when overseeing and assessing the quality of external auditors; and
• The IRBA, as a further source of information for business intelligence gathering and risk-based selections as
part of the IRBA inspections process.
The AQIs cover the following thematic areas: independence; tenure; internal firm quality review processes; workload
of partners and audit managers; span of control; technical resources; and training.
Market participants, such as audit committees, are encouraged to solicit this information directly from their current
and prospective auditors to assist in their oversight of the external audit function. The IRBA believes this tool and
the agreed formulae will assist audit committees to compare the audit quality scores of their auditors against others
in the market. It will also assist audit committees and firms to have open conversations about audit quality and what
measures could be put in place to satisfy audit committees that the firms they engage can meet their expectations.
Audit firms accredited with the Johannesburg Stock Exchange (JSE) Limited to perform audits of listed companies
were requested to submit AQI-related information for their Public Interest Entity (PIE) clients only. This Feedback
Report (this report) describes the results of the information submitted, under the broad thematic categories of AQIs
listed above. The report also presents the results, with explanations, that audit committees and other users could
consider when requesting similar information from their existing or new audit firms, both during the re-appointment
and tendering/new appointment processes.
This is the first time that the IRBA has requested this information from firms; it is also the first Report on AQIs in
South Africa. We would like to thank the leadership and personnel of the firms for embracing this initiative and for
their timely submission of the data. We value the feedback from firms that have indicated how this initiative will be
incorporated into their internal quality management processes, and how data quality will be improved.
The AQIs presented in this report provide a rich source of information not seen or published before in this format in
South Africa. The granularity of the data and comparisons across firms give the user insights that demonstrate
significant differentiations in the audit marketplace. The range of ratios (or scores), with large gaps between the
highest and lowest, are an indication that firms’ approaches do differ, investments in resources differ and that these
inputs may have a bearing on the individual inspection outcomes arising from the IRBA inspections.
We believe that this data will:
a) Encourage firms to understand the gaps and, where relevant, close those gaps, where they are measured to
be laggards; and
b) Assist firms to consider their approaches to quality and grow their investment in quality to improve their ratios
(or scores).
Bernard Peter Agulhas
Chief Executive Officer
December 2019
FEEDBACK REPORT: AUDIT QUALITY INDICATORS
Page 4 of 40
CONTENTS
Overview of AQI Categories ....................................................................................................................................5
Background to AQIs, ................................................................................................................................................6
AQI Observations .....................................................................................................................................................7
Independence: Non-audit Fees (%) ...................................................................................................................................... 7
Independence: Fee Recovery (%) ......................................................................................................................................... 9
Tenure: Firm (years) ............................................................................................................................................................ 11
Tenure: Partner Experience (years) ................................................................................................................................... 13
Review: EQ Review Partner Hours (%) .............................................................................................................................. 15
Review: Firm Review Processes ........................................................................................................................................ 16
Review: Internal Review Results (%) .................................................................................................................................. 18
Review: Partner Coverage (%) ............................................................................................................................................ 20
Workload: Engagement Partner Role (%) .......................................................................................................................... 22
Workload: Manager Supervision (%) .................................................................................................................................. 24
Technical Resources: Partner (ratio) ................................................................................................................................. 28
Training (hours per person) ................................................................................................................................................ 30
Way Forward .......................................................................................................................................................... 32
Further Resources ................................................................................................................................................. 32
Appendix 1: Our Approach ................................................................................................................................... 33
Data Quality and Systems Limitations ............................................................................................................................... 34
Understanding the graphs – limitations ............................................................................................................................ 34
Definitions and Parameters ................................................................................................................................................ 35
Key Observations and Learnings ....................................................................................................................................... 35
Appendix 2: Definition of Public Interest Entities .............................................................................................. 37
Appendix 3: Definitions and Parameters regarding Data Submitted ............................................................... 39

FEEDBACK REPORT: AUDIT QUALITY INDICATORS
Page 5 of 40
Overview of AQI Categories
Independence Non-audit Fees Fee Recovery
Tenure FirmPartner
Experience
ReviewEQ Review
Partner HoursFirm Review Processes
Internal Review Results
Partner Coverage
WorkloadEngagement Partner Role
Manager Supervision
OtherSpan of Control:
Professional Staff
Technical Resources:
PartnerTraining

FEEDBACK REPORT: AUDIT QUALITY INDICATORS
Page 6 of 40
Background to AQIs2,3
What are AQIs?
AQIs refer to a portfolio of quantitative measures provided by an audit firm to an audit committee of their
client, or future client; or for use in transparency reports and for regulatory purposes. These measures
could be used to enhance dialogue about, and an understanding of, auditors and their audits as well as
ways to evaluate their audit quality. That way, audit committees can be better informed about key matters
that may contribute to the quality of an audit (both at audit firm level and audit engagement level). This
could be to the benefit of the audit committee in discharging its oversight responsibilities regarding the
external audit process, including the appointment or reappointment of the external auditor.
What are the benefits of using AQIs?
• They facilitate efficient and effective dialogue between management, those charged with governance
and auditors, leading to improved oversight and project management of the audit.
• AQIs can help create a mutual understanding of the roles and responsibilities of each of the parties
related to audit quality.
• They focus discussions on those areas, and factors, of the audit that impact audit quality the most.
• AQIs offer improved knowledge of the audit process as well as a more efficient measurement and
an evaluation of audit quality, with a proactive focus on potential weaknesses.
What are the challenges of using AQIs?
• AQIs could be misinterpreted, if the context is not provided and/or considered.
• Determining the appropriate and relevant AQIs for the specific engagement and the firm.
• There can be difficulties with understanding unexpected AQI outcomes.
• The collection of AQI information is complex. The quality of data needs to be considered. Refer to
the observations about data quality in Appendix 1.
What kinds of decisions can AQIs help audit committees make?
• Asking appropriate questions regarding potential weaknesses in the audit quality value chain.
• Requesting remedial adjustments to be made, e.g. to audit resourcing.
• Which auditors to appoint (tendering process – compare AQIs across firms).
• Whether the auditor should be reappointed.
The context of each AQI should be understood as it is interrogated, in order to make
meaningful decisions that will promote high audit quality.
2 Some content has been derived from the Canadian Public Accountability Board’s Audit Quality Indicators – Final
Report, 2018, which can be accessed at http://www.cpab-ccrc.ca/Documents/Topics/Audit%20Quality%20Indicators/AQI%20Final%20Report%20EN.pdf.
3 Refer to Appendix 1 for details on our approach; data quality and systems limitations; understanding the graphs –
limitations; definitions and parameters; and key observations and learnings.

FEEDBACK REPORT: AUDIT QUALITY INDICATORS
Page 7 of 40
AQI Observations
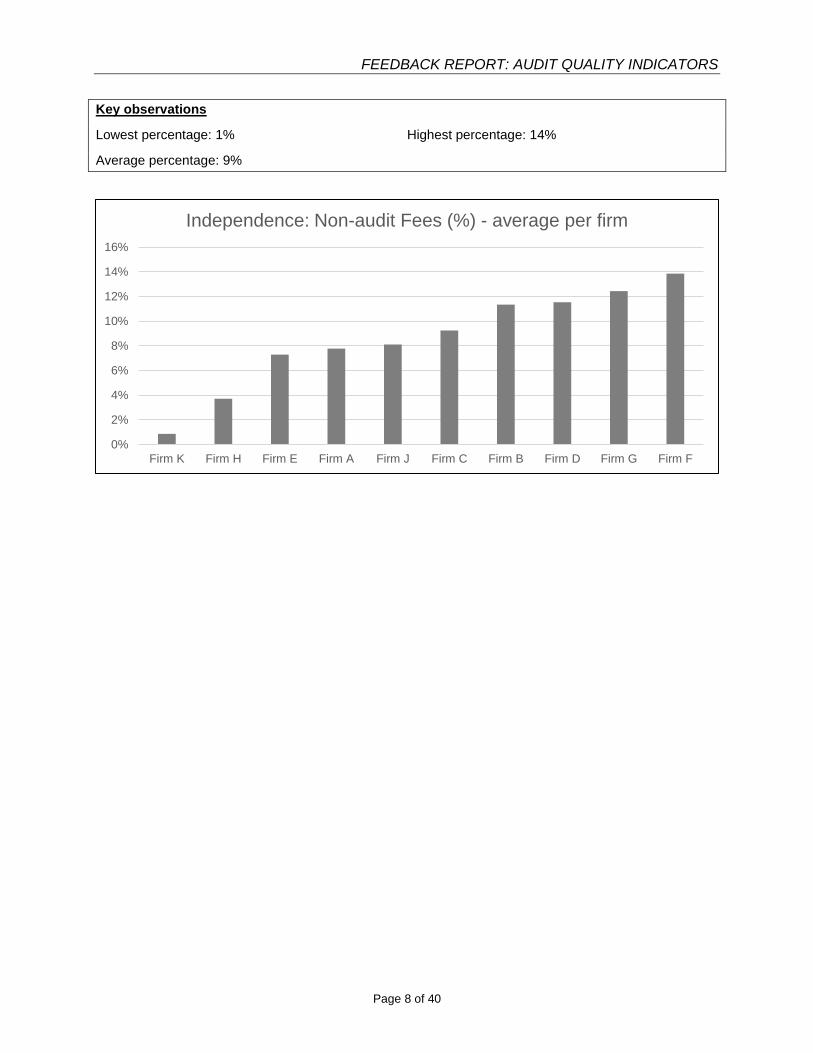
Independence: Non-audit Fees (%)
Description/purpose
Non-audit fees billed (Rands invoiced) to the audit client as a percentage of the total audit fees billed (Rands
invoiced) to the audit client for completed engagements.
How to interpret the AQI
This is a measure that may indicate threats to independence. It is an indicator that measures the extent to
which the firm is dependent on a particular client for audit versus non-audit fees. The indicator is presented
as an average per firm.
A higher percentage indicates that the firm receives more fees for non-audit services, such as taxation and
consulting, than what it receives for audit services. This may create the impression of diminished
independence. Independence threats may jeopardise audit related decision-making.
A higher percentage may also indicate a higher demand (sanctioned by audit committees) from the firm’s
audit clients for non-audit services.
The King IV Report on Corporate Governance for South Africa, 2016 requires the audit committee to
oversee the provision of non-audit services by the external auditor.
The Companies Act of South Africa, 2008 (Act 71 of 2008) requires that the auditor must be acceptable to
the company’s audit committee as being independent of the company. Furthermore, the IRBA Code places
the responsibility for the determination of independence on the auditor.
IRBA Code considerations
Section 410 of the IRBA Code addresses fee dependencies and their impact on independence for audit
and review engagements.
R411.4: A firm shall not evaluate or compensate a key audit partner based on that partner’s success in
selling non-assurance services to the partner’s audit client. This requirement does not preclude normal
profit-sharing arrangements between partners of a firm.
R600.4: Before a firm or a network firm accepts an engagement to provide a non-assurance service to an
audit client, the firm shall determine whether providing such a service might create a threat to
independence.
600.5 A4: A firm or network firm might provide multiple non-assurance services to an audit client. In these
circumstances, the consideration of the combined effect of threats created by providing those services is
relevant to the firm’s evaluation of threats.
FEEDBACK REPORT: AUDIT QUALITY INDICATORS
Page 8 of 40
Key observations
Lowest percentage: 1% Highest percentage: 14%
Average percentage: 9%
0%
2%
4%
6%
8%
10%
12%
14%
16%
Firm K Firm H Firm E Firm A Firm J Firm C Firm B Firm D Firm G Firm F
Independence: Non-audit Fees (%) - average per firm
FEEDBACK REPORT: AUDIT QUALITY INDICATORS
Page 9 of 40
Independence: Fee Recovery (%)
Description/purpose
Total audit fees billed (Rands invoiced) to the audit client as a percentage of the total audit fees (Rands)
internally charged to the audit client for completed engagements.
How to interpret the AQI
A low percentage indicates that a firm has charged less for its actual services (time spent); therefore, fees
have been “written off” and not recovered. This may indicate inefficiencies in supervision and project
management (time wasted on an audit); or lowballing (discounted fees or fee pressures).
A high percentage indicates that a firm has recovered more of the actual service (hours spent on the
engagement) it has provided; therefore, fees have been recovered. This may indicate better efficiencies in
supervision and project management. The firm may have budgeted more accurately and final time spent
on the engagement may have been more in line with the budget.
This AQI is presented as an average per firm.
IRBA Code considerations
300.6 A1 (a): Self-interest Threats (arise when):
• A registered auditor quoting a low fee to obtain a new engagement and the fee is so low that it might
be difficult to perform the professional service in accordance with applicable technical and
professional standards for that price.
330.3 A1: The level of fees quoted might impact a registered auditor’s ability to perform professional
services in accordance with professional standards.
330.3 A2: A registered auditor might quote whatever fee is considered appropriate. Quoting a fee lower
than another registered auditor is not in itself unethical. However, the level of fees quoted creates a self-
interest threat to compliance with the principle of professional competence and due care, if the fee quoted
is so low that it might be difficult to perform the engagement in accordance with applicable technical and
professional standards.
Key observations
Lowest average percentage: 49% Highest average percentage: 97%
Average percentage: 67%

FEEDBACK REPORT: AUDIT QUALITY INDICATORS
Page 10 of 40
0%
10%
20%
30%
40%
50%
60%
70%
80%
90%
100%
Firm B Firm H Firm K Firm G Firm E Firm F Firm I Firm J Firm D
Independence: Fee Recovery (%) - average per firm

FEEDBACK REPORT: AUDIT QUALITY INDICATORS
Page 11 of 40
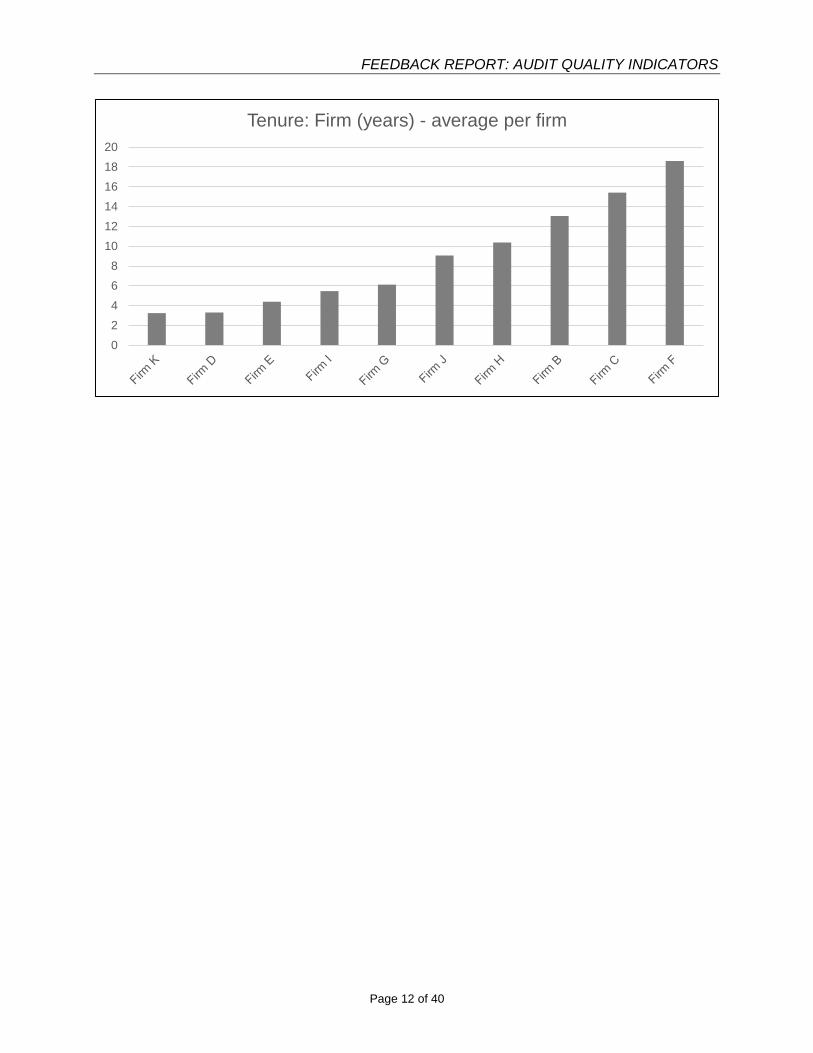
Tenure: Firm (years)
Description/purpose
Average number of completed years as the audit firm for the audit client. This is an indicator of
independence.
How to interpret the AQI
The longer the tenure, the greater the familiarity threat to independence. Alternatively, the shorter the
tenure, the greater the risk of lack of experience and knowledge of the business. This indicator is presented
as an average per firm. It should also be considered in conjunction with:
- the IRBA Rule relating to Mandatory Audit Firm Rotation (MAFR)4, and
- the IRBA Rule relating to Disclosure of Audit Firm Tenure on an Audit Client5
IRBA Code considerations
Familiarity threat – the threat that due to a long or close relationship with a client, a registered auditor will
be too sympathetic to that client’s interests or too accepting of their work.
Key observations
Lowest average number of years: 3 Highest average number of years: 19
Average number of years: 9
4 Available on the IRBA website at:
https://www.irba.co.za/upload/Government%20Gazette%20with%20Final%20Rule%20-%201%20June%202017.pdf.
5 Available on the IRBA website at:
https://www.irba.co.za/guidance-for-ras/general-guidance/audit-tenure.
FEEDBACK REPORT: AUDIT QUALITY INDICATORS
Page 12 of 40
0
2
4
6
8
10
12
14
16
18
20
Tenure: Firm (years) - average per firm

FEEDBACK REPORT: AUDIT QUALITY INDICATORS
Page 13 of 40
Tenure: Partner Experience (years)
Description/purpose
An average tenure as an engagement partner (in years). This is also an indicator of years of experience as
an engagement partner.
How to interpret the AQI
The greater the number of years, the more experience the engagement partner is likely to have obtained.
In understanding this AQI, considerations could be given to whether the engagement partner has kept up
to date with Continuing Professional Development requirements and the type of experience gained as an
engagement partner.
This AQI is presented as an average per firm.
IRBA Code considerations
R113.1 A registered auditor shall comply with the principle of professional competence and due care, which
requires a registered auditor to:
(a) Attain and maintain professional knowledge and skill at the level required to ensure that a client
receives competent professional service, based on current technical and professional standards and
relevant legislation; and
(b) Act diligently and in accordance with applicable technical and professional standards.
Key observations
Lowest average number of years: 4 Highest average number of years: 13
Average number of years: 10

FEEDBACK REPORT: AUDIT QUALITY INDICATORS
Page 14 of 40
0
2
4
6
8
10
12
14
Firm D Firm A Firm C Firm K Firm I Firm J Firm F Firm G Firm B Firm H Firm E
Tenure: Partner Experience (years) - average per firm

FEEDBACK REPORT: AUDIT QUALITY INDICATORS
Page 15 of 40
Review: EQ Review Partner Hours (%)
Description/purpose
The engagement quality (EQ) review partner hours charged to the audit client by the EQ review partner as
a percentage of total audit hours charged to the audit client for completed engagements.
How to interpret the AQI
This provides a measure of the depth of pre-issuance EQ reviews, measured by time spent. Higher ratios
indicate a greater involvement of the EQ review partner, and potentially a greater number of areas of
significant judgement covered in an audit file. Alternatively, lower ratios may indicate that insufficient time
was spent by the EQ review partner or that areas of significant judgement were not adequately addressed.
This measure is not an indicator of the eligibility and objectivity of the EQ reviewer.
This AQI is presented as an average per firm.
Key observations
Lowest average percentage: 0.2% Highest average percentage: 1.9%
Average percentage: 0.7%
0,0%
0,2%
0,4%
0,6%
0,8%
1,0%
1,2%
1,4%
1,6%
1,8%
2,0%
Firm C Firm F Firm G Firm B Firm K Firm I Firm J Firm D Firm A Firm E
Review: EQ Review Partner Hours (%) - average per firm

FEEDBACK REPORT: AUDIT QUALITY INDICATORS
Page 16 of 40
Review: Firm Review Processes
Description/purpose
A description of and conclusions on engagement related reviews performed by the firm (by personnel
outside the engagement team), including the nature of reviews, how many partners were covered and the
frequency of reviews.
How to interpret the AQI
This can be used to assess the firm's internal quality management processes (e.g. internal monitoring
systems) as well as the quality of engagement performance (the outcome/findings of the internal monitoring
systems). Satisfactory results could be an indication that the quality of the engagements is adequate. These
internal quality management results can also be compared to the external inspection results (obtainable
from the firm).
Key observations
Common features of the majority of firms’ internal monitoring systems
• Evidence of the application of International Standard on Quality Control (ISQC) 1, Quality Control for
Firms that Perform Audits and Reviews of Financial Statements, and Other Assurance and Related
Services Engagements; and ISA 220, Quality Control for an Audit of Financial Statements.
• Selection of partners to be reviewed:
o A review of engagement partners takes place at least every three (3) years, with some firms
performing reviews more frequently and one firm every 3-5 years.
o Firms with only a few partners, in some cases, review all the engagement partners every year.
o Several firms described how they select partners for review for a specific year. Factors included:
▪ New partners (whether promoted or newly employed).
▪ Partners with high-risk clients, such as large, complex, multi-locational, initial, joint and/or
regulated industries engagements.
▪ Partners with unsatisfactory internal or external review results, including the IRBA inspections
results.
o Several firms mentioned that the selection of partners to be reviewed is done by an independent
party (independent of the office, partner and engagement); and the review is performed by an
independent party.
• Firms provided the following examples of the scope of the review (but not all of the areas listed below
are included in each firm’s reviews):
o Acceptance and continuance considerations.
o Independence and ethical considerations.
o Planning and completion considerations (all or parts).
o Risk assessment procedures.

FEEDBACK REPORT: AUDIT QUALITY INDICATORS
Page 17 of 40
o Communication with management and those charged with governance.
o Audit/assurance evidence obtained for all material amounts, high-risk or significant risk areas.
o Consultations, if any.
o Corrected and uncorrected misstatements.
o Overall conclusions.
o Matters that led to reportable irregularities.
o Audit report, especially where opinions were qualified or modified.
o Annual financial statements.
o Full engagement review for a partner’s first review.
o Re-reviews (prior year unsatisfactory results) may be the full scope of the engagement or focus
areas.
Review results and implications
o All firms have a rating process, generally from 1 to 3 (with some variations). A rating of 1 would
be for satisfactory results, 2 for some low-risk findings and 3 for unsatisfactory results. Most firms
perform re-reviews of partners, if the review has shown unsatisfactory results within a year.
o Where the firms are part of a global network, the global policies and procedures are used and
adapted for the South African firm. Monitoring of the process occurs at a global level. Reporting
on results is at local, regional and global levels.
o Some firms use panels, quality management teams or moderators that are independent member
firms to decide on results.
o Several firms mentioned that they consider unsatisfactory results in their remuneration and
promotion decisions.
o Most firms provided information on plans to address significant findings or common findings
through firm level improvement plans and remediation actions.
o Several firms provided information on communication with staff, including emails, training and
additional guidance.
Less common features of firms’ internal monitoring systems
• Several firms include an element of surprise in selecting reviews. For example, one firm selects
partners to be reviewed based on the above listed factors and then, in addition, performs a few surprise
reviews every year. Reviews are then performed without a prior notification of the partner.
• One firm reviews all partners on listed engagements every year.
• One firm has appointed an independent external consultant to perform the reviews.
• One firm mentioned that it performs a root cause analysis (RCA) of findings, and positive elements are
also included in the RCA. Positive elements are then communicated to audit teams and may be built
into the quality management system.

FEEDBACK REPORT: AUDIT QUALITY INDICATORS
Page 18 of 40
Review: Internal Review Results (%)
Description/purpose
An average percentage of all results ratings of engagement partners, subject to internal reviews during the
calendar year.
How to interpret the AQI
All firms have a rating process, generally from 1 to 3 (with some variations). A rating of 1 is for satisfactory
results, 2 for some low-risk findings and 3 for unsatisfactory results. The ratings have been standardised
for the purpose of the graph below. For example, where a firm has a rating system of 1 to 4, ratings 3 and
4 have been included in this standardised rating of 1 to 3.
Results have been depicted as a percentage of review results. For example, 35% of a firm’s engagement
partners received a satisfactory review rating of 1; 45% received a low-risk finding review rating of 2; and
20% received an unsatisfactory review rating of 3.
The correlation of firm internal review results with the same firm’s IRBA (external) inspection results
(obtainable from the firm) may indicate the effectiveness of the firm’s internal monitoring process.
Key observations
Highest percentage of rating 1 – satisfactory: 93%
Highest percentage of rating 2 – low-risk findings: 100%
Highest percentage of rating 3 – unsatisfactory: 100%

FEEDBACK REPORT: AUDIT QUALITY INDICATORS
Page 19 of 40
0
10
20
30
40
50
60
70
80
90
100
Firm H Firm J Firm C Firm B Firm G Firm K Firm D Firm E Firm F Firm I Firm A
Review: Internal Review Results (%)
% Low risk findings
% Satisfactory
% Unsatisfactory

FEEDBACK REPORT: AUDIT QUALITY INDICATORS
Page 20 of 40
Review: Partner Coverage (%)
Description/purpose
A percentage of engagement partners subject to internal reviews during the calendar year. This is internal
monitoring coverage.
How to interpret the AQI
The higher the percentage, the greater the proportion of engagement partners subjected to a firm’s internal
reviews during the period. Therefore, the likelihood of detecting shortcomings in audit quality may be higher.
This does not indicate the quality of the audit engagements (consider the “internal review results” AQI), or
the effectiveness of the internal review.
IRBA Code considerations
400.4: ISQC 1 requires a firm to establish policies and procedures designed to provide it with reasonable
assurance that the firm, its personnel and, where applicable, others subject to independence requirements
(including network firm personnel) maintain independence where required by relevant ethics requirements.
ISAs and ISREs establish responsibilities for engagement partners and engagement teams at the level of
the engagement for audits and reviews, respectively. The allocation of responsibilities within a firm will
depend on its size, structure and organisation. Many of the provisions of this Part do not prescribe the
specific responsibility of individuals within the firm for actions related to independence, instead referring to
“firm” for ease of reference. Firms assign responsibility for a particular action to an individual or a group of
individuals (such as an audit team), in accordance with ISQC 1. In addition, an individual registered auditor
remains responsible for compliance with any provisions that apply to that registered auditor’s activities,
interests or relationships.
Key observations
Lowest percentage: 18% Highest percentage: 75%
Average percentage: 43%

FEEDBACK REPORT: AUDIT QUALITY INDICATORS
Page 21 of 40
0%
10%
20%
30%
40%
50%
60%
70%
80%
90%
100%
Firm H Firm G Firm B Firm C Firm F Firm A Firm K Firm J Firm D Firm E Firm I
Review: Partner Coverage (%)
FEEDBACK REPORT: AUDIT QUALITY INDICATORS
Page 22 of 40
Workload: Engagement Partner Role (%)
Description/purpose
Engagement partner (excl. EQ review partner) hours charged to the audit client as a percentage of total
audit hours charged to the audit client for completed engagements. This provides a measure of the level of
involvement by the engagement partner.
How to interpret the AQI
Higher ratios indicate a greater involvement of the engagement partner and may be indicative of a higher
quality audit file, or an audit with more areas of significant judgement. Alternatively, high ratios may indicate
an understaffed or inexperienced engagement team, or other execution issues. This indicator is presented
as an average per firm.
This ratio can be compared to the workload: manager supervision (%) ratio and the review: EQ review
partner hours (%) ratio.
IRBA Code considerations
“Professional Competence and Due Care” is one of the Fundamental Principles in the IRBA Code.
110.1 A1: Professional Competence and Due Care – to:
(i) Attain and maintain professional knowledge and skill at the level required to ensure that a client
receives competent professional service, based on current technical and professional standards and
relevant legislation; and
(ii) Act diligently and in accordance with applicable technical and professional standards.
Section 320 Client and Engagement Acceptance acknowledges that there might be a self-interest threat
when accepting a new engagement due to complexity, experience, technical knowledge, etc. Paragraph
320.3 A5 includes the following examples of safeguards that address competencies and time on the
engagement:
• Assigning sufficient engagement personnel with the necessary competencies.
• Agreeing on a realistic timeframe for the performance of the engagement.
In paragraph 300.8 A2, where safeguards to self-interest threats are discussed, the following actions that
in certain circumstances might be safeguards to address threats are mentioned:
• Assigning additional time and qualified personnel to required tasks when an engagement has been
accepted might address a self-interest threat.
Key observations
Lowest average percentage: 2.4% Highest average percentage: 10.0%
Average percentage: 5.4%

FEEDBACK REPORT: AUDIT QUALITY INDICATORS
Page 23 of 40
0%
2%
4%
6%
8%
10%
12%
Firm F Firm C Firm B Firm D Firm G Firm J Firm A Firm K Firm I Firm H Firm E
Workload: Engagement Partner Role (%) - average per firm

FEEDBACK REPORT: AUDIT QUALITY INDICATORS
Page 24 of 40
Workload: Manager Supervision (%)
Description/purpose
Total audit manager hours charged to the audit client as a percentage of total audit hours charged to the
audit client for completed engagements.
How to interpret the AQI
Higher ratios indicate a greater involvement of the audit manager/s. There may be many reasons for such
involvement. Alternatively, high ratios may indicate a lack of review and involvement by the engagement
partner and/or an understaffed engagement team. In understanding this AQI, the firm’s model and nature
of engagements would need to be considered.
IRBA Code considerations
“Professional Competence and Due Care” is one of the Fundamental Principles in the IRBA Code.
110.1 A1: Professional Competence and Due Care – to:
(i) Attain and maintain professional knowledge and skill at the level required to ensure that a client
receives competent professional service, based on current technical and professional standards and
relevant legislation; and
(ii) Act diligently and in accordance with applicable technical and professional standards.
Key observations
Lowest percentage: 9.2% Highest percentage: 26.0%
Average percentage: 17.3%

FEEDBACK REPORT: AUDIT QUALITY INDICATORS
Page 25 of 40
0%
5%
10%
15%
20%
25%
30%
Firm A Firm I Firm K Firm D Firm J Firm F Firm G Firm H Firm B Firm E Firm C
Workload: Manager Supervision (%) - average per firm

FEEDBACK REPORT: AUDIT QUALITY INDICATORS
Page 26 of 40
Span of Control: Professional Staff (ratio)
Description/purpose
Audit professional staff headcount (accounting, audit and risk) as a ratio to partners in the audit firm. This
indicates the capacity of partners to supervise junior audit team members in the audit firm, and the level of
professional support for audit partners.
How to interpret the AQI
Higher ratios may indicate that a partner has more responsibilities. That, however, may also indicate
possible related time pressure as more people need to be managed, which may distract the partner from
giving appropriate attention to a particular audit engagement. Higher ratios may also indicate either
relatively few partners, or a firm that is better resourced with professional staff to support partners. In
addition, higher ratios may indicate that the partners manage their professional staff better, or their
professional staff are more skilled and require less supervision.
IRBA Code considerations
“Professional Competence and Due Care” is one of the Fundamental Principles in the IRBA Code.
110.1 A1: Professional Competence and Due Care – to:
(i) Attain and maintain professional knowledge and skill at the level required to ensure that a client
receives competent professional service, based on current technical and professional standards and
relevant legislation; and
(ii) Act diligently and in accordance with applicable technical and professional standards.
Key observations
Lowest ratio: 5:1 Highest ratio: 15:1
Average ratio: 9:1

FEEDBACK REPORT: AUDIT QUALITY INDICATORS
Page 27 of 40
0
2
4
6
8
10
12
14
16
Firm K Firm G Firm E Firm I Firm J Firm H Firm B Firm C Firm F Firm D
Span of Control: Professional Staff (ratio)

FEEDBACK REPORT: AUDIT QUALITY INDICATORS
Page 28 of 40
Technical Resources: Partner (ratio)
Description/purpose
Engagement partner to technical partner ratio.
How to interpret the AQI
The higher the ratio, the more engagement partners a technical partner serves. Therefore, a high ratio may
mean that an engagement partner does not have as much access to a technical partner resource as an
engagement partner in a firm with a lower ratio would have. In understanding this ratio, the nature of the
firm as well as the nature and scope of engagements are also relevant.
IRBA Code considerations
“Professional Competence and Due Care” is one of the Fundamental Principles in the IRBA Code.
110.1 A1: Professional Competence and Due Care – to:
(i) Attain and maintain professional knowledge and skill at the level required to ensure that a client
receives competent professional service, based on current technical and professional standards and
relevant legislation; and
(ii) Act diligently and in accordance with applicable technical and professional standards.
The IRBA Code highlights the importance of technical support by including in the definition of Audit Team:
(ii) Those who provide consultation regarding technical or industry specific issues, transactions or events
for the assurance engagement.
The need to obtain technical expertise is also applicable when exercising professional judgement as
follows:
120.5 A3: In exercising professional judgement to obtain this understanding, the registered auditor might
consider, among other matters, whether:
• There is a need to consult with others with relevant expertise or experience.
In paragraph 300.6 A1 of the IRBA Code, under the discussion of threats to compliance with the
fundamental principles, the following is mentioned as an example of a fact and circumstance that might
create an intimidation threat:
• A registered auditor feeling pressured to agree with the judgement of a client because the client has
more expertise on the matter in question.
Additionally, paragraph 400.53 A3 elaborates on “professional resources” under the Network Firm
discussion, and includes the following:
• Technical departments that consult on technical or industry specific issues, transactions or events for
assurance engagements.

FEEDBACK REPORT: AUDIT QUALITY INDICATORS
Page 29 of 40
Key observations
Lowest ratio: 5:1 Highest ratio: 28:1
Average ratio: 12:1
0
5
10
15
20
25
30
Firm D Firm A Firm J Firm C Firm I Firm B Firm E Firm F Firm G Firm K Firm H
Technical Resources: Partner (ratio)

FEEDBACK REPORT: AUDIT QUALITY INDICATORS
Page 30 of 40
Training (hours per person)
Description/purpose
Total hours of structured training delivered for audit professional staff for the previous calendar year as a
ratio to average (monthly) audit professional staff for the previous calendar year.
How to interpret the AQI
The level of investment in formal training is an indication of the firm's investment in improving audit quality,
and in maintaining professional knowledge. In understanding this AQI, the type, quality and relevance of
the training should be considered, as well as whether it is input or output based (attendance versus
demonstration of knowledge gained).
IRBA Code considerations
R113.2: In complying with the principle of professional competence and due care, a registered auditor shall
take reasonable steps to ensure that those working in a professional capacity under the registered auditor’s
authority have appropriate training and supervision.
Exercise of Professional Judgement
120.5 A1 Professional judgement involves the application of relevant training, professional knowledge, skill
and experience commensurate with the facts and circumstances, including the nature and scope of the
particular professional activities, and the interests and relationships involved. In relation to undertaking
professional activities, the exercise of professional judgement is required when the registered auditor
applies the conceptual framework in order to make informed decisions about the courses of actions
available, and to determine whether such decisions are appropriate in the circumstances.
When discussing the Firm and its Operating Environment, paragraph 300.7 A5 of the IRBA Code considers
the following as an example of a factor the registered auditor will consider when evaluating a threat to the
fundamental principle:
300.7 A5: A registered auditor’s evaluation of the level of a threat might be impacted by the work
environment within the registered auditor’s firm and its operating environment. For example:
• Educational, training and experience requirements.
Key observations
Lowest ratio: 36 hours per person Highest ratio: 162 hours per person
Average ratio: 78 hours per person

FEEDBACK REPORT: AUDIT QUALITY INDICATORS
Page 31 of 40
0
20
40
60
80
100
120
140
160
180
Firm A Firm K Firm D Firm I Firm G Firm J Firm E Firm C Firm B Firm H
Training (hours per person)
FEEDBACK REPORT: AUDIT QUALITY INDICATORS
Page 32 of 40
Way Forward
The IRBA plans to request AQI information again from audit firms. Only JSE-accredited firms that audit
PIEs will be requested to provide this information. Information for the same category of clients, i.e. PIEs,
will be requested. For corporate structures that are groups, information will be collected at the group level
and not at the subsidiary level.
The information to be requested will build on what was requested for this report, with some further fields to
be identified. At a minimum, the following additional information will be requested:
• Engagement year-end.
• Type of registered auditor, e.g. engagement partner, technical partner or risk advisory partner.
Clarity will be provided regarding the following two matters highlighted in this report:
• Granularity of data required.
• Period for which the data is required.
Where there were interpretation issues of definitions and guidelines, these will be clarified.
Firms will be requested to provide evidence of a quality review of the data submitted, with authorisation
(sign-off) by a suitable senior firm representative. Firms are expected to provide the IRBA with complete
and accurate information.
The next report will include some interpretation and analysis of AQIs, in order to provide further guidance
to audit committees. Some links to audit quality may be made.
Information received will be cross-checked to other sources, e.g. tenure to audit reports, the number of
partners with the IRBA’s Registry department, and the list of JSE-accredited firms with the JSE Limited.
Firms are encouraged to embed the AQI system in their processes, as this will be an ongoing process.
For any questions or suggestions regarding this Report, please send an email to [email protected].
Further Resources
Please refer to the Transparency Reporting and Audit Quality Indicators page on the IRBA website. The
link is: https://www.irba.co.za/guidance-for-ras/technical-guidance-for-ras/transparency-reporting-and-
audit-quality-indicators-aqis.
The Public Inspections Report can be accessed through the following link. The link is :
https://www.irba.co.za/guidance-to-ras/inspections/reports

FEEDBACK REPORT: AUDIT QUALITY INDICATORS
Page 33 of 40
Appendix 1: Our Approach
The IRBA requested AQI-related information for audits of PIEs6 only, specifically from firms accredited with
the JSE Limited. This category of firms was chosen as they are generally the larger firms and medium-
sized firms, have more sophisticated systems in place to extract the information, and usually audit the
higher risk clients and clients with a high public interest. Such firms are the only ones that are accredited
with the JSE Limited to perform audits of listed companies.
Number of audit firms accredited with the JSE Limited, from whom information was requested and received:
187
Of these, the number of firms that were analysed in this report: 118
Approximate total number of audited entities (PIEs and related entities): 2 064
Approximate total number of PIEs (groups or corporate structures) where audits were completed: 526
Average number of PIEs (and related entities) audited by the four biggest firms: Approximately 400
Average number of PIEs (and related entities) audited by the seven (7) other firms: Approximately 55
The IRBA consulted extensively with various stakeholders while researching global developments on AQIs.
The AQIs selected were developed based on those that were raised frequently by other regulators and
certain parties we consulted, and were also based on the local environment. These selected AQIs will
provide valuable information to the IRBA and other stakeholders to better identify some indicators of
independence and audit quality, and to help make better informed assessments of risks. We also
considered the practicality, for firms, of collecting and collating the information.
Our stakeholder consultations included workshops and meetings with other regulators, audit committee
members and Heads of Quality at several audit firms. Stakeholders that were consulted included the JSE
Limited; two of the new South African stock exchanges; several large and medium-sized audit firms; the
South African Reserve Bank; the Companies and Intellectual Property Commission (CIPC); the Auditor-
General South Africa; the Association for Savings and Investment South Africa; the South African Institute
of Chartered Accountants; and the Institute of Directors.
6 Refer to Appendix 2 for the definition of Public Interest Entities.
7 Firms accredited with the JSE Limited, including network firms: BDO South Africa Inc; HLB CMA South Africa Inc.; Crowe JHB; Deloitte & Touche; Ernst & Young Inc; KPMG Inc.; Mahdi Meyer Steyn Chartered Accountants Inc.; Mazars; Middel & Partners; Moore Stephens; Nexia SAB&T; Ngubane & Co (Johannesburg) Incorporated; Nolands JHB Inc.; PKF South Africa; PricewaterhouseCoopers Inc.; RSM South Africa Incorporated; Sizwentsalubagobodo Grant Thornton Inc.; and Tuffias Sandberg.
8 These seven firms were removed from the analysis as they advised us that they had completed the audits of only 0,
1 or 2 PIEs in the specified period: Moore Stephens; Crowe JHB; Nolands JHB Inc.; HLB CMA South Africa Inc.; Middel & Partners; Mahdi Meyer Steyn Chartered Accountants Inc.; and Tuffias Sandberg.

FEEDBACK REPORT: AUDIT QUALITY INDICATORS
Page 34 of 40
Data Quality and Systems Limitations
The IRBA understands that there are system readiness and data quality concerns in relation to the
information submitted to us. In our consultations with several firms, a number of them had committed to
providing the information requested. However, they later indicated that their systems were not, in some
cases, ready or able to provide the required data by 31 March 2019.
The implication is that data quality could be regarded as not mature; and as the AQIs are interrogated and
used by decision-makers, the data quality could be expected to improve over time.
It is also understood that some data was identified or summarised differently between firms. For example,
internal cost accounting may differ between firms (i.e. charge-out rates differ, some firms use standard
costing, others use fully absorbed costing, while some may have different charge-out rates for different
divisions or offices). This is a practical reality of a data collection exercise, and this feedback has also
featured in responses to requests for comments from other regulators around the world.
We have highlighted below how differences in interpretation of the AQIs by firms, incomplete data or data
quality not yet at a high level, may influence the understanding of some graphs:
Understanding the graphs – limitations
Independence: Non-audit fees (%) One firm indicated that it did not provide non-audit services to the PIEs it audits. Thus, non-audit fees as a percentage of total audit fees billed to the firm’s clients for completed engagements were 0%.
Independence: Fee recovery (%) One firm’s data was omitted as data for internally charged fees was not provided.
One firm’s data was omitted as the information request was misinterpreted by the firm, and could not be analysed.
Tenure: Firm (years) One firm did not provide this information.
Tenure: Partner Experience (years) In understanding the data and the graph, we recognise that firms were not consistent in their use of the term “engagement partner”; and some firms may have only counted experience of engagement partners within that firm only, and not prior experience as an engagement partner with another firm(s).
Review: EQ Review Partner Hours (%) One firm did not provide this information.
Span of Control (Professional Staff) One firm did not provide this information.
Training (hours per person) One firm did not provide this information.

FEEDBACK REPORT: AUDIT QUALITY INDICATORS
Page 35 of 40
Definitions and Parameters
The definitions and parameters used in the data submitted by the firms are listed in Appendix 3.
The overarching parameters were:
• JSE-accredited audit firms only.
• Regarding client data, information for PIEs only (and related entities).
• Regarding registered auditor data, information for engagement (signing) partners only.
• Information for audit engagements only, unless otherwise stated (e.g. non-audit fees).
• Information for engagements completed (opinions signed off) during the year only (1 January 2018
to 31 December 2018).
Key Observations and Learnings
Results
The purpose of this Report is to provide results of and observations on data submitted. The data has
undergone a desktop-based data cleaning exercise. The results and observations have been depicted in a
graphical format, with some notes on statistics such as the highest or lowest number.
A section has been dedicated to each of the AQIs identified as being of the most use in the context of audit
firms and audit committees in South Africa. Each section provides a description and purpose of the AQI,
an explanation on how to interpret the AQI, key observations (highest, lowest and average results); and a
graph comparing the results across the firms. The appendices provide further context to the data collection
and analysis exercise.
In addition, the IRBA Code considerations have been explained, with certain paragraph references where
relevant.
Results are anonymous. Firms have not been identified.
Data quality
All sizes of firms reported that obtaining the data was, in many cases, difficult; and the information often
had to be manually extracted from existing systems. Our analysis indicates where data quality challenges
were encountered. Despite the limitations of the data described elsewhere in this Report, we were
encouraged that the data submitted by firms was sufficiently usable to generate this first iteration of this
Report.
In some cases, firms provided “best estimates”. In those cases, the reason the exact information could not
be provided and the explanation of how the estimate was calculated were accepted.
The lack of a quality check of the data submitted was evident in several of the submissions. In future, firms
will be required to assess the data before it is submitted to the IRBA. Reasonability tests should be
performed as a cursory overview of the data would in some cases show obvious errors.

FEEDBACK REPORT: AUDIT QUALITY INDICATORS
Page 36 of 40
Commonly found data quality and consistency issues included the following:
• Data provided was not in line with the request. For example, data was provided for audit engagements
that were not completed during the year, or data was provided for fees, etc., billed during the year only.
The request had been for information for engagements completed during the year only (1 January 2018
to 31 December 2018), with the information for the complete engagement provided.
• Incomplete information: Sometimes this was explained; in other cases, the data was not provided and
there was no explanation. Explanations are required and no cell should be left blank without an
explanation.
• Duplications – identical audit fee, engagement hours, etc., for the same client.
• Mergers of firms affected data – previously unreliable data was combined with reliable data. Data may
also have been different, and now needed to be aligned with the merged firm.
• The number of years was captured as dates.
• Numerical content was captured as text, thereby making sorting and filtering of data difficult.
• Firm tenure could not be provided, or a rough estimate was provided (e.g. greater than five years).
• Inconsistent data: For example, EQ review team hours were given, but no EQ review partner hours
were given.
• Illogical data: For example, firm tenure was much lower than the engagement partner tenure.
• Inconsistent data formats: For example, use of “nil”, “0”, “-”, “not required”, “N/A” and blank cells.
• Spelling errors: Filtering and pivoting of data would not be correct in these cases.
• Firms providing inconsistent data due to internal inconsistencies proved to be problematic.
• Client names were not captured in full. Client names should be captured exactly as per their registration
with the CIPC.
What did not work
Across the board, the firms were not able to provide quality data down to a client engagement level. Hours
and fees are booked at group or holding company level. Subsidiaries, therefore, did not “stand on their own”
in terms of data content; and any form of AQIs calculated to this level were generally not helpful. The holding
company and subsidiaries needed to be aggregated to group level.
Information was requested for engagements completed during the year only (1 January 2018 to
31 December 2018). Therefore, the information was not expected to match to the Assurance Work
Declaration (annual declarations) submitted annually by firms to the IRBA. However, some firms reconciled
the information they submitted to their annual declarations. It was decided not to remove this data, as year-
on-year the data will smooth out. However, where this misinterpretation has occurred, it is highlighted
elsewhere in Appendix 1.

FEEDBACK REPORT: AUDIT QUALITY INDICATORS
Page 37 of 40
Appendix 2: Definition of Public Interest Entities
The IRBA Code is based on Parts 1, 3, 4A and 4B of the Code of Ethics for Professional Accountants
(including International Independence Standards) of the International Ethics Standards Board of
Accountants (the IESBA Code) published by the International Federation of Accountants (IFAC) in April
2018 and used with the permission of IFAC. South African amendments to the IESBA Code are underlined
and in italics in the Code.
“Public Interest Entity” is defined in the IRBA Code as:
(a) A listed entity; or
(b) An entity:
(i) Defined by regulation or legislation as a public interest entity; or
(ii) For which the audit is required by regulation or legislation to be conducted in compliance with the
same independence requirements that apply to the audit of listed entities. Such regulation might be
promulgated by any relevant regulator, including an audit regulator; or
(c) Other entities as set out in paragraphs R400.8a SA and R400.8b SA.
R400.8a SA Firms shall determine whether to treat additional entities, or certain categories of entities, as
public interest entities because they have a large number and wide range of stakeholders.
Factors to be considered include:
• The nature of the business, such as the holding of assets in a fiduciary capacity for a
large number of stakeholders. Examples might include financial institutions, such as
banks, insurance companies and pension funds.
• Number of equity or debt holders.
• Size.
• Number of employees.
R400.8b SA A registered auditor shall regard the following entities as generally satisfying the conditions
in paragraph R400.8a SA as having a large number and wide range of stakeholders, and
thus are likely to be considered as Public Interest Entities:
• Major Public Entities that directly or indirectly provide essential or strategic services or
hold strategic assets for the benefit of the country.
• Banks as defined in the Banks Act, 1990 (Act No. 94 of 1990), and Mutual Banks as
defined in the Mutual Banks Act 1993, (Act No. 124 of 1993).

FEEDBACK REPORT: AUDIT QUALITY INDICATORS
Page 38 of 40
• Market infrastructures as defined in the Financial Markets Act, 2012 (Act No. 19 of
2012).9
• Insurers registered under the Long-term Insurance Act, 1998 (Act No. 52 of 1998), and
the Short-term Insurance Act, 1998 (Act No. 53. of 1998), excluding micro lenders.
• Collective Investment Schemes, including hedge funds, in terms of the Collective
Investment Schemes Control Act, 2002 (Act No. 45 of 2002), that hold assets in excess
of R15 billion.
• Funds as defined in the Pension Funds Act, 1956 (Act No. 24 of 1956), that hold or are
otherwise responsible for safeguarding client assets in excess of R10 billion.
• Pension Fund Administrators (in terms of Section 13B of the Pension Funds Act, 1956
(Act No. 24 of 1956)) with total assets under administration in excess of R20 billion.
• Financial Services Providers as defined in the Financial Advisory and Intermediary
Services Act, 2002 (Act No. 37 of 2002), with assets under management in excess of
R50 billion.
• Medical Schemes as defined in the Medical Schemes Act, 1998 (Act No. 131 of 1998),
that are open to the public (commonly referred to as “open medical schemes”) or are
restricted schemes with a large number of members.
• Authorised users of an exchange as defined in the Financial Markets Act, 2012 (Act No.
19 of 2012), who hold or are otherwise responsible for safeguarding client assets in
excess of R10 billion.
• Other issuers of debt and equity instruments to the public10.
9 Market Infrastructure is defined in the Financial Markets Act, 2012 (Act No. 19 of 2012), as:
(a) A licensed central securities depository;
(b) A licensed clearing house;
(c) A licensed exchange; and
(d) A licensed trade repository. 10 For the purposes of this section, “the public” shall mean the public in general or large sectors of the public, such as
participants in Broad-Based Black Economic Empowerment schemes or participants in offers to large industry sectors that result in the debt or equity instruments being owned by a large number and wide range of stakeholders.

FEEDBACK REPORT: AUDIT QUALITY INDICATORS
Page 39 of 40
Appendix 3: Definitions and Parameters regarding Data Submitted
The following definitions and parameters apply:
• Audit – financial statement audit only (those engagements that require the application of
International Standards of Auditing (ISAs)). Non-audit is therefore non-ISA engagements.
• Audit manager – anyone designated as an audit manager (or equivalent) in the firm, or
network, or firm in a network, who was part of the engagement team.
• Audit professional staff – audit managers, supervisors and trainees only, including staff in
technical roles related to audit quality.
• Billed – excludes disbursements, expenses and taxes.
• Charged – this includes hours recorded on the firm's time-keeping system and may be more
or less than the hours billed.
• Client – individual statutory entity for which an audit report has been prepared. Although
information for clients is requested at the lowest level in terms of legal audit opinion (i.e. signed
opinion for subsidiaries), information should be furnished at the level that it is practicable.
• Engagement – audit engagements only.
• Engagement team – as defined in the International Auditing and Assurance Standards
Boards’ (IAASB) Handbook.
• EQ review partner – the partner performing the engagement quality reviews, the individual,
whether from the network firm, in the network or external service provider, who is responsible
for the review as per ISQC 1.
• EQ review hours – include all EQ review hours charged by the EQ review partner, NOT hours
related to the cyclical inspection of files, or in-process reviews or other forms of engagement
monitoring.
• Group – link individual clients to the group by identifying the highest level entity within the
group to which the lower level entity relates.
• Partner – the common term meaning, in the audit profession, and including the individuals
who are legally directors of firms in the form of incorporated companies. Partners in leadership
and in technical roles in audit practice. Partners included in the engagement team (as defined
in the IAASB Handbook).
• Partner hours – include partner hours from the network and the firms in the network.
• Public interest entities – definition as per the IRBA Code. Once a group is deemed to be a
PIE by the firm, information is to be provided for all entities audited by the firm within that
group. (See Appendix 2).
• Retention – measures should be based on the formal grade of the staff. Where staff fall
between grades, e.g. assistant manager, these individuals should be grouped into the lower

FEEDBACK REPORT: AUDIT QUALITY INDICATORS
Page 40 of 40
grade for the purposes of reporting. This excludes promoted staff as they are still considered
to be part of the firm and the resources available to perform audits.
• Reviews – formal internal reviews as defined in the firm's policies.
• Technical partner – partners designated as firm IFRS specialists, partners dedicated to the
firm’s technical department and partners responsible for firm risk and independence matters
that are part of the audit firm and the network firm (excludes external service providers). For
partners with mixed roles, then determine FTEs (full-time equivalents).
• Tenure – calculated as per the guidance in the IRBA communique dated 4 December 2015,
and Section 90 of the Companies Act.
• Time period – unless otherwise stated, information should be provided for completed
engagements during the previous calendar year. For example, for the March 2019 AQI
submission, period refers to engagements completed during 2018.
• Total audit hours – the hours of all engagement team members (as defined in the IAASB
Handbook).
• Training – total hours of structured training. Formal training events provided by the firm and
measured for attendance and time. Training events exclude academic courses for trainees,
such as the SAICA Board courses or APT. The type of structured training activities included
should follow SAICA’s Continuing Professional Development requirements, which will
primarily comprise the following focus areas that are perceived to have the most significant
impact on audit quality: audit, accounting, ethics, etc.


