Page 1
FACOLTÀ DI SCIENZE AGRARIE E ALIMENTARI
Department of Food, Environmental and Nutritional Sciences (DeFENS)
Graduate School in Molecular Sciences and Plant, Food and
Environmental Biotechnology
PhD programme in Food Science, Technology and Biotechnology
XXV Cycle
Development of Nano-material for Food Packaging
Scientific field AGR/15
FEI LI
Tutor: Prof. Luciano Piergiovanni
Co-tutor: Prof. Saverio Mannino
PhD Coordinator: Prof. Maria Grazia Fortina
2011/2012
Page 2
I
CONTENTS
ABSTRACT ............................................................................................................................. IV
RIASSUNTO ............................................................................................................................ VI
ACKNOWLEDGEMENTS ................................................................................................. VIII
0 PREFACE ................................................................................................................................ 1
1 STATE OF THE ART ............................................................................................................. 2
1.1 Nano-cellulose ............................................................................................................... 2
1.1.1 Nano-cellulose structure ...................................................................................... 3
1.1.2 Nano-cellulose classifications .............................................................................. 4
1.1.3 Nano-cellulose preparations ................................................................................. 4
1.1.4 Morphology of CNs ............................................................................................. 5
1.2 CNs applications ........................................................................................................... 8
1.2.1 Barrier properties ................................................................................................. 8
1.2.2 Mechanical properties ........................................................................................ 10
1.2.3 Thermal properties ............................................................................................. 13
1.3 References .................................................................................................................... 19
2 AIM OF STUDY .................................................................................................................... 27
3 RESULTS AND DISCUSSION ............................................................................................ 28
3.1 Topic/theme 1: The process, structure, morphology of different-form cellulose
nanocrystals (CNs) ............................................................................................................ 28
3.2 Materials and methods 1 ............................................................................................ 30
3.2.1 CNs extraction process ...................................................................................... 30
3.2.2 Freeze-dried powder .......................................................................................... 30
3.2.3 CNs gel .............................................................................................................. 30
3.2.4 Fourier transform infrared spectroscopy (FTIR) ................................................ 31
3.2.5 Solid-state nuclear magnetic resonance (NMR) spectroscopy ........................... 31
3.2.6 XPS (X-ray photoelectron spectroscopy) ........................................................... 31
3.2.7 Transmission electronic microscopy (TEM) ...................................................... 31
3.2.8 Scanning electronic microscopy (SEM)............................................................. 31
3.2.9 Atomic force microscopy (AFM) ....................................................................... 32
3.2.10 Size distribution ............................................................................................... 32
3.3 Results and discussion 1 ............................................................................................. 33
3.3.1 Modified process and different forms of CNs .................................................... 33
3.3.2 Structure of CNs ................................................................................................ 34
3.4 Conclusions 1 ............................................................................................................... 46
Page 3
II
3.5 References .................................................................................................................... 47
3.6 Topic/theme 2: Multi-functional green coating of cellulose nanocrystals (CNs) on
conventional films for food packaging applications ....................................................... 51
3.7 Materials and methods 2 ............................................................................................ 53
3.7.1 Materials. ........................................................................................................... 53
3.7.2 CNs producing process. ..................................................................................... 53
3.7.3 Preparation of Coating Dispersion. .................................................................... 53
3.7.4 Coated Film Preparation. ................................................................................... 54
3.7.5 Thickness measurement ..................................................................................... 54
3.7.6 Transmission Electron Microscopy. ................................................................... 55
3.7.7 Atomic force microscopy ................................................................................... 55
3.7.8 Transparency measurements .............................................................................. 55
3.7.9 Haze ................................................................................................................... 55
3.7.10 Oxygen Transmission Rate (OTR), oxygen permeability (PO2) and Water Vapor
Transmission Rate (WVTR) measurements. ............................................................... 55
3.7.11 Contact angle measurements ............................................................................ 56
3.7.12 Coefficient of friction....................................................................................... 57
3.8 Results and discussion 2 ............................................................................................. 58
3.8.1 Morphology of CNs and CNs on different substrates ........................................ 58
3.8.2 Coefficient of friction of bare and coated substrates .......................................... 59
3.8.3 Optical properties ............................................................................................... 61
3.8.4 Anti-fog property ............................................................................................... 61
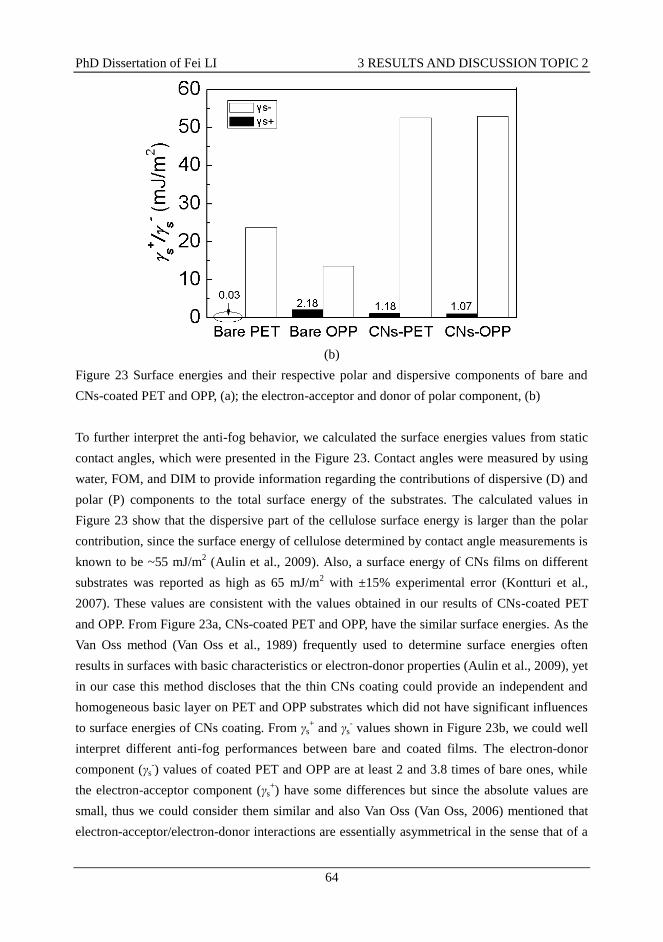
3.8.5 Barrier properties. .............................................................................................. 65
3.9 Conclusions 2 ............................................................................................................... 67
3.10 References .................................................................................................................. 68
3.11 Topic/theme 3 Tunable Green Oxygen Barrier through Layer by Layer Self-assembly
of Chitosan (CS) and Cellulose Nanocrystals (CNs) .............................................................. 71
3.12 Materials and methods 3 .......................................................................................... 73
3.12.1 Materials .......................................................................................................... 73
3.12.2 Preparation of biopolymer dispersions for layer-by-layer coating ................... 73
3.12.3 Surface charge density measurements.............................................................. 73
3.12.4 Layer-by-Layer assembly ................................................................................ 74
3.12.5 Transparency measurements ............................................................................ 74
3.12.6 Fourier transform infrared spectroscopy (FTIR) .............................................. 74
3.12.7 XPS (X-ray photoelectron spectroscopy) ......................................................... 74
3.12.8 Atomic Force Microscopy ................................................................................ 75
3.12.9 Ellipsometry ..................................................................................................... 75
Page 4
III
3.12.10 Field-Emission Scanning Electron Microscopy ............................................. 76
3.12.11 Oxygen barrier properties .............................................................................. 76
3.13 Results and discussion 3 ........................................................................................... 77
3.13.1 Layer-by-layer assembly .................................................................................. 77
3.13.2 Structure of CS/CNs nanocomposite ............................................................... 79
3.13.3 Thickness of CS/CNs nanocomposite coating ................................................. 83
3.13.4 Oxygen permeability of CS/CNs nanocomposite coating ................................ 86
3.14 Conclusions 3 ............................................................................................................. 90
3.15 References .................................................................................................................. 91
APPENDIX 1 ............................................................................................................................. 94
Gas and water vapor permeability coefficient summary ............................................... 94
Chitosan XPS plots comparison between the 30 and 60 min ........................................ 95
APPENDIX 2 ............................................................................................................................. 97
Publications ....................................................................................................................... 97
Posters ................................................................................................................................ 99
Page 5
IV
ABSTRACT
Being cellulose the most abundant natural polymer in biosphere, more and more attention has
been paid on its new functionalities, sustainability, and renewability. Meanwhile, food
packaging materials is one of the largest products we are using in daily life, but most of
conventional materials are still oil-based due to their low cost and good performances.
Therefore, in order to improve the sustainability and renewability of food packaging materials,
this PhD dissertation focuses on development new nano-material (cellulose nanocrystals, CNs)
for food packaging and includes mainly four sections.
In the first section of this PhD dissertation, we reviewed the progress in knowledge on
nano-cellulose first and then, specifically, on CNs. In this section the structure and
classifications of various nano-cellulose preparations are included, as well as the preparation,
the morphologies, and applications of CNs. In CNs applications, we reviewed that it exhibits
excellent barrier, mechanical, and thermal properties itself or combined with other polymers.
Particularly, the barrier properties refer to oxygen, water vapor, and migration barrier;
mechanical properties are related with tensile strength, Young‘s modulus, and strain percentage;
the thermal properties include glass transition and melting or decomposition temperature, heat
flow, and thermal mechanical parameters.
In the second section of this PhD dissertation, to better understand the structure and status of
CNs itself or in other polymers, we have used different powerful analytical tools for
qualification and quantification. Firstly, we have obtained the relatively precise dimensions of
CNs and observe its redispersability in different solvents, mainly water solutions. In the
following, we could gain the information of the CNs status in other polymers in order to
interpret the final performance efficiently. Finally, we preliminarily concluded that TEM, SEM,
and AFM are suitable tools for observing individual crystals, estimating the roughness, and
learning the morphology in different scale, respectively. As for the size distribution, functional
groups, and interactions between the atoms of CNs, the particle size distributor, FTIR, XPS, and
NMR are used for determinations, respectively.
In the third section of this PhD dissertation, we have systematically investigated the properties
of conventional films coated with CNs. In particular, we have analyzed their optical properties
(transparency and haze), mechanical properties (static and dynamic coefficient of friction),
anti-fog (contact angle and surface energy) and barrier properties (oxygen and water vapor
transmission rates). In doing this, we have demonstrated that CNs coatings mainly lead to a
Page 6
V
reduction of friction, a premium feature for industrial applications, and that their influence on
the optical properties of the packaging is not significant. Excellent anti-fog property guarantees
customers more conveniently to evaluate the product inside the packages easily. At last but not
the least, CNs coatings dramatically improve not only the oxygen barrier properties of
conventional flexible food packaging, but also lead to a certain reduction in the water vapor
transmission rate. The perspective use of CNs as multi-functional coatings favors a reduction of
the required thickness for plastic films, towards a more environmentally-friendly and
sustainable approach to packaging.
In the last section of this PhD dissertation, we demonstrated the use of chitosan (CS)/CNs
nanocomposites realized by layer-by-layer (LbL) self-assembly as oxygen barrier under
different pH combinations. The oxygen permeability coefficient of CS/CNs nanocomposites is
as low as 0.02 cm3 µm m
-2 24h
-1 kPa
-1, close to EVOH co-polymers, under dry conditions.
Meanwhile, we consider that CNs has no potential risks for human beings and the renewable
origin of the carbohydrate polymers as significant added values that justify a deeper
investigation. Finally, it deserves to be underlined also the chance of finely tuning the oxygen
permeability by means of the pH values and the sharp control of the thickness associated with
this process. Therefore, based on the advantages outlined above, the LbL CS/CNs
nanocomposite represents a promising oxygen barrier component in transparent flexible
packaging materials and semi rigid tridimensional objects (bottles, trays, boxes and etc.).
Based on our researches, we conclude that CNs leads to very promising applications in food
packaging field and deserves to be further investigated in the future.
Page 7
VI
RIASSUNTO
La cellulosa è il polimero naturale più abbondante sulla terra, una risorsa rinnovabile che ogni
anno viene prodotta in miliardi di tonnellate da molti organismi vegetali. Per questa ragione, su
di essa si sta concentrando una crescente attenzione nell‘ipotesi di una sua sempre maggiore
applicazione nei più diversi campi. Quello del food packaging, che è ancora fortemente
dipendente da materiali di sintesi e provenienti da risorse non rinnovabili, è particolarmente
interessato ad un suo più ampio impiego, anche con il fine di aumentare la sostenibilità dei
suoi prodotti e di ridurne l‘impatto ambientale. Con questa tesi di dottorato si è inteso mettere a
fuoco le potenzialità di impiego della nano cellulosa (cellulose nanocrystals, CNs),
sperimentare la produzione e valutare le proprietà di alcune lacche a base di CNs, destinate a
ricoprire convenzionali materiali flessibili per il confezionamento alimentare. La tesi si
compone di quattro parti distinte.
Nella prima parte si è inteso rappresentare lo stato dell‘arte delle conoscenze e delle
applicazioni della nanocellulosa, attraverso un ampio lavoro di documentazione bibliografica.
Dapprima si è voluto mettere a fuoco quanto noto sulla struttura e la classificazione delle varie
forme di nanocellulosa che è oggi possibile produrre e, a proposito della cellulosa
nanocristallina in particolare, si è fatto il punto sulle tecniche di preparazione, la morfologia e le
principali applicazioni. Da questo lavoro di documentazione sono emerse le notevoli proprietà
di barriera ai gas ed a potenziali migranti, le eccellenti proprietà meccaniche (resistenza alla
rottura, massima elongazione tensile, modulo di Young) e le interessanti caratteristiche termiche
(transizione vetrosa, punto di fusione e di decomposizione) della CNs da sola ed in
combinazione con altri materiali.
Nella seconda sezione della tesi, al fine di comprendere meglio la struttura e la morfologia dei
nanocristalli di cellulosa ottenuti attraverso un processo di idrolisi acida di linter di cotone, sono
state utilizzate diverse tecniche analitiche avanzate, sia per la caratterizzazione qualitativa che
quantitativa. E‘ stato così possibile ottenere informazioni precise sulle dimensioni dei nano
cristalli, il rapporto di forma, la solubilità e numerose altre loro importanti proprietà. In
particolare le tecniche di TEM, SEM, e AFM sono apparse come le più adatte per osservare la
morfologia dei cristalli, studiare le caratteristiche e la rugosità delle superfici trattate con lacche
a base di CNs. Si è inoltre indagato sulla distribuzione delle dimensioni dei cristalli ottenuti e,
grazie all‘uso di FTIR, XPS e NMR, sulla natura dei gruppi funzionali disponibili e sulle loro
interazioni.
Page 8
VII
La terza parte della tesi è dedicata ad uno studio delle proprietà di alcuni differenti film,
largamente impiegati per il food packaging (PET, OPP, OPA e cellophane), rivestiti con uno
strato sottile di CNs. In particolare, è statomesso a punto il processo di laccatura e sono state
misurate le proprietà ottiche (la trasparenza, l‘opacità e le proprietà anti-fog), il coefficiente di
frizione statico e dinamico, le energie superficiali e gli angoli di contatto, le proprietà di barriera
all‘ossigeno ed al vapor d‘acqua. Da questo lavoro è emerso come sia effettivamente possibile
rivestire di uno strato sottile (intorno ad un micron di spessore), omogeneo e continuo, film
plastici differenti e che attraverso questo processo di laccatura, si riduce significativamente
il coefficiente di frizione, si incrementano le proprietà anti-fog, si aumenta decisamente la
barriera all‘ossigeno, senza pregiudicare la trasparenza dei film di supporto. La prospettiva
molto concreta è quella di costituire, in un modestissimo spessore, un coating multifunzionale
con spiccate caratteristiche di sostenibilità e di sicurezza alimentare.
L‘ultima sezione della tesi è dedicata al lavoro fatto per sperimentare la possibile applicazione
di una tecnica di rivestimento molto moderna (layer-by-layer coating, LbL) che sfrutta la
formazione di legami elettrostatici tra biopolimeri caricati diversamente. In particolare si è
dimostrata la possibilità di costituire lacche di un composito ottenuto mediante la
sovrapposizione alternata di sottilissimi strati (da 6 a circa 30 nm) di chitosano e cellulosa
nanocristallina. Il diverso pH delle soluzioni in cui vengono dispersi i due biopolimeri
determina un diverso grado di ionizzazione delle cariche, rispettivamente positive del
chitosano e negative della cellulosa, e di conseguenza diversi spessori e proporzioni relative
dei due biopolimeri nel coating composito che si realizza. Ciò, evidentemente, permette di
modulare in un ampio intervallo di valori, la permeabilità del film ricoperto. Il coefficiente di
permeabilità del composito giunge a valori pari 0.02 cm3 µm m
-2 24h
-1 kPa
-1, molto simili a
quelli espressi da copolimeri a base di EVOH, in condizioni anidre. I vantaggi di un simile
rivestimento sono comunque fondamentalmente legati alla sicurezza e non tossicità dei
biopolimeri impiegati, dalla loro sostenibilità e dall‘ampio grado di libertà disponibile nel
modulare le caratteristiche finali di barriera, secondo le esigenze del prodotto da confezionare.
Lo strato di lacca LbL così costituita rappresenta, in definitiva, una barriera all‘ossigeno
particolarmente promettente negli impieghi reali più critici anche per la concreta possibilità di
realizzarla convenientemente su oggetti tridimensionali come bottiglie, vassoi e altri imballaggi
finiti.
In conclusione, le ricerche condotte rappresentano una base di partenza molto promettente per
un‘innovazione di sostenibilità e di prestazioni nel campo dell‘imballaggio flessibile e meritano
ulteriori approfondimenti ed applicazioni.
Page 9
VIII
ACKNOWLEDGEMENTS
Firstly, I would like to thank my supervisor, Prof. Luciano PIERGIOVANNI, for helping and
guiding me on every aspect, including daily life and academic research. Without him, I could
not have done my research smoothly and obtained my PhD degree. Also, I would like to thank
Dr. Paolo BIAGIONI for helping me on academic research and scientific publications.
Secondly, I would like to thank my co-supervisor, Prof. Saverio MANNINO, and Prof. Matteo
SCAMPICCHIO, who guided and taught me electrospinng and electrochemical applications
which lead to my first publication during first-year of my PhD, Prof. Enzio RAGG who has
been helping determining and interpreting CNs structures by NMR, Dr. Silvia TAVAZZI who
manipulated and interpreted ellipsometery data, Prof. Franco FAORO who helped in TEM
observations, and Dr. Giorgio Capretti who helped in the surface charge density measurements.
Thirdly, I would like to thank my girlfriend (Dandan LV), parents (Mr. Nan LI and Ms Mengtao
HAO) and relatives for mentally supporting me.
Fourthly, I would thank Dr. Sara LIMBO who is always helping me to solve practical problems
during the experiments, PhD coordinator, Prof Maria Grazia FORTINA who was informing us
related academic activities, and Dr. Chiara FERRARIO who translated everything especially for
foreign students. Also, thank my colleagues in PACKLAB or those from other labs who helped
me.
Finally, I would like to thank Dr. Carmen ROVEDA, Cesare PONTIERI and Dario DAINELLI,
from Sealed Air (Passirana di Rho, Italy), who carried out most of oxygen permeability
measurements, Dr. Gero BONGIORNO, from Fondazione Filarete (Milano, Italy), who helped
in SEM observations, Dr. Graziano BIAGIONI, from ILPA (Bazzano, Italy), who provided
A-PET sheets, and Alessandro BORGHESI for his help during the ellipsometry measurements,
Dr. Maccagnan ANDREA and Roberto GALBASINI, from Goglio (Daverio, Italy), who carried
out the permeability tests.
Page 10
PhD Dissertation of Fei LI 0 PREFACE
1
0 PREFACE
The requirement of sustainability and safety of products and processes are increasing due to the
progressive reduction in un-renewable resources and to the environment deterioration. A
sustainable green economy needs a revolutionary change to overcome today‘s dependency on
fossil fuels and bring about a shift towards products based on natural resources. Within the
energy supply sector, the change will be solar and wind power; within the materials sector, it is
renewable materials, bio-based plastics and composites.
Food packaging, as one of the largest markets all over the world, accounts for about 500 billion
euro and uses approximately 250 million tons of different materials each year. Packaging,
however, is not only about holding foods but also to prolong shelf-life and extend quality
maintenance of foods in order to distribute them in long term, and where they are most needed.
Therefore, a special attention to packaging materials performance has to be paid together with
the evaluation of their sustainability. Conventional food packaging materials have limited
sustainability but exhibit many advantages so as to be very difficult to substitute them by new
materials in short term.
Cellulose has been used for thousands of years in many different fields and is an annual
renewable resource; thus, its safety and sustainability are beyond debate. However, the present
utilization of cellulose limits on conventional way. After many years‘ development, cellulose
nanocrystals (CNs) come into our views and recently have been paid more and more attention.
Based on above situations, we did some investigations on basic structure, morphology, and
different properties of CNs in order to better understand it and attempt to develop new
applications of CNs on high performing food packaging materials.
Page 11
PhD Dissertation of Fei LI 1 STATE OF THE ART
2
1 STATE OF THE ART
1.1 Nano-cellulose
Cellulose is the most abundant natural material biopolymer in the biosphere. Its production is
estimated to be over seventy-five billion tons annually (Habibi et al., 2010), we therefore could
consider cellulose as the most abundant sustainable and renewable material biopolymer. Paper,
furniture, floor etc. all origin from cellulose, which indicates that human beings have been
realizing and using cellulose almost everywhere in our daily life for thousands of years.
However, since the computers emerged, the use for one of the largest cellulose-based products,
paper, has been reducing all the time. Facing huge quantity of cellulose, we therefore have to
rethink about how to utilize it more efficiently and develop more functions from it. Based on
above situation, nano-cellulose therefore is paid more attention once again recently.
Figure 1 Schematic of the tree hierarchical structure (Postek et al., 2011).
In our daily life, the use of cellulose only could be classified into the first generation, which
took advantages of hierarchical structure design. Natural materials develop functionality,
Page 12
PhD Dissertation of Fei LI 1 STATE OF THE ART
3
flexibility and high mechanical strength/weight performance by exploiting hierarchical structure
design that spans nanoscale to macroscopic dimensions (Figure 1). However, the first
generation cellulose products are insufficient to meet the demands of modern society for high
performance materials, which is another reason for compelling scientists to further investigate
the fundamental reinforcement unit, cellulose nanoparticles, in our case, cellulose nanocrystals
(CNs).
1.1.1 Nano-cellulose structure
Figure 2 Schematics of (a) single cellulose chain repeat unit, showing the directionality of the
14 linkage and intrachain hydrogen bonds (dotted line), (b) idealized cellulose microfibril
showing one of the suggested configurations of the crystalline and amorphous regions, and (c)
cellulose nanocrystals after acid hydrolysis dissolved the disordered regions (Moon et al.,
2011).
Cellulose is a linear chain of ringed glucose molecules and has a flat ribbon-like conformation.
The repeat unit (Figure 2a) is comprised of two anhydroglucose rings ((C6H10O5)n); n = 10000
to 15000, where n is depended on the cellulose source material) linked together through an
oxygen covalently bonded to C1 of one glucose ring and C4 of the adjoining ring (14 linkage)
and so called the 1–4 glucosidic bond (Azizi Samir et al., 2005; Moon et al., 2011). The intra-
and inter-chain hydrogen bonds network between hydroxyl groups and oxygen of the adjoining
ring molecules stabilizes the linkage, and makes cellulose having linear chain thereby be a
Page 13
PhD Dissertation of Fei LI 1 STATE OF THE ART
4
relatively stable polymer, and gives the cellulose fibrils high axial stiffness. These cellulose
fibrils are the main reinforcement phase for trees, plants, some marine creatures (tunicates),
algae, and bacteria. Within these cellulose fibrils there are highly ordered (crystalline) regions
and disordered (amorphous-like) regions, but the structure and distribution of these crystalline
and amorphous domains within cellulose fibrils have yet to be rectified (Figure 2b) (Moon et al.,
2011; Nishiyama, 2009). However, it is these crystalline regions contained within the cellulose
microfibrils that are extracted, resulting in cellulose nanocrystals (CNs) (Figure 2c).
1.1.2 Nano-cellulose classifications
The term nano-cellulose generally includes cellulose nanocrystals, nanowhisker, or
nanocrystalline (CNs, CNW, or CNC), micro- or nano-fibrillated cellulose (MFC or NFC),
TEMPO-oxidized cellulose nanofibre (TOCN), and bacterial cellulose (BC). Herein, although
we classify nano-cellulose into four groups by preparation methods, there yet should be some
overlapped parts among them. In the literature CNs are also referred as CNW or CNC, when
they are stiff and rod like or as MFC, NFC, or cellulose microcrystals, or microcrystallites when
they are longer and more flexible consisting of alternating crystalline and amorphous domains.
The latter are usually prepared by combining mild hydrolysis (acidic or enzymatic) and
mechanical defibrillation treatments (ultra-blender, grinder, homogenizer and so on). In the PhD
dissertation, we focus on the CNs and its characterizations, morphology, and applications.
1.1.3 Nano-cellulose preparations
Chemical and physical treatments are two ways for preparing nano-cellulose. A huge number of
scientific articles appeared during recent years, describing possible procedures to obtain
cellulose at nanoscale. Few of them led to industrial applications but all are good descriptions of
main priciples behind nano cellulose obtainment. In this PhD project we used the method most
useful and suitable for our lab's facilities but literature is easily available for accurate reports
about the different ways of preparing nano cellulose; in this paragraph, these different methods
are just shortly mentioned with references to the main papers published as follows: chemical
ways: acidic (Habibi et al., 2010; Moon et al., 2011) and enzymatic hydrolysis (Ahola et al.,
2008; Filson et al., 2009; Meyabadi & Dadashian, 2012; Paakko et al., 2007; Siro & Plackett,
2010) and TEMPO-oxidized processes (Fujisawa et al., 2011; Fukuzumi et al., 2009; Isogai et
al., 2011; Okita et al., 2011; Saito et al., 2007; Saito et al., 2006; Saito et al., 2005; Shinoda et
al., 2012); physical ways: refining and high-pressure homogenization (López-Rubio et al., 2007;
Nakagaito et al., 2005; Paakko et al., 2007; Stenstad et al., 2008; Zimmermann et al., 2004),
cryocrushing (Alemdar & Sain, 2008; Chakraborty et al., 2007; Wang & Sain, 2007a, b) and
grinding (Iwamoto et al., 2007; Iwamoto et al., 2005).
Page 14
PhD Dissertation of Fei LI 1 STATE OF THE ART
5
In the PhD dissertation, we are specifically studying on CNs. The main process of CNs
preparation from cellulose fibers is acidic hydrolysis. During the hydrolysis, the disordered
(amorphous) or para-crystalline regions of cellulose are preferentially hydrolyzed, but the
crystalline parts remain intact due to its higher resistance to acid attack (Anglès & Dufresne,
2001).
The sulfuric and hydrochloric acids have been extensively utilized as well as the phosphoric and
hydrobromic acids (Habibi et al., 2010; Johansson et al., 2012). Moreover, different acids,
H2SO4 and HCl for hydrolysis lead to distinct properties of CNs: Colloidal dispersion of the
HCl-treated sample was obtained by more thorough removal of acid from the hydrolysate than
in the case of H2SO4 treatment (Araki et al., 1998). In other words, the dispersed ability of
HCl-treated sample is limited and their aqueous suspensions tend to flocculate, whereas during
hydrolysis of H2SO4 the cellulose grafts several charged sulfate ester group on the surface,
which results in improving the dispersion of CNs in aqueous solutions and polar solvents, and
hence induces crucial characters. It was reported that the optimized processes of extracting CNs
from plant resource, for instance cotton, were grinding and 64% (w/w) sulfuric acid, following
with neutralization by dilution and dialysis, ultrasonic treatment, filtration and removing excess
ions from suspension (Dong et al., 1998). To obtain the CNs from different origins, the
processes are similar, but the conditions (Elazzouzi-Hafraoui et al., 2007) varied according to
different measurements and requirements. Likewise, Bondeson et al prepared the CNs from
Microcrystalline cellulose (MCC) by 63.5% (w/w) H2SO4, sequentially obtaining CNs with a
length between 200 and 400 nm and a width less than 10 nm in approximately 2 h with a yield
of 30% (of initial weight) (Bondeson et al., 2006). The investigation of Håkansson & Ahlgren
found that dilute acids (HCl and H2SO4) hydrolysis of pulp led to the same leveling-off degree
of polymerization (LODP) (Håkansson & Ahlgren, 2005), but a longer time was needed under
the milder conditions. Meanwhile, they reported that distinguished intrinsic viscosities of birch
prehydrolysed kraft pulp and a mixed hardwood prehydrolysed kraft pulp, after hydrolysis, only
had a small difference (10%) in LODP. Beck-Candanedo demonstrated that longer hydrolysis
times and increasing acid-to-pulp ratio produced shorter CNs, less polydisperse black spruce
CNs and slightly increased the critical concentration for anisotropic phase formation and the
biphasic range became narrower (Beck-Candanedo et al., 2005).
1.1.4 Morphology of CNs
The acidic hydrolysis methods (Araki et al., 1998; Beck-Candanedo et al., 2005; Bondeson et
al., 2006; de Souza Lima & Borsali, 2002; Dong et al., 1998; Elazzouzi-Hafraoui et al., 2007;
Favier et al., 1995; Håkansson & Ahlgren, 2005; Marchessault et al., 1961; Nickerson & Habrle,
1947; Roman & Winter, 2004) were commonly used for extracting the CNs from natural origins,
Page 15
PhD Dissertation of Fei LI 1 STATE OF THE ART
6
which brings on producing varieties of CNs and observed by transmission electronic
microscopy (TEM). TEM figures of CNs are presented in Figure 3 and show rod-like
morphology with dimensions dependent on the source of the native cellulose, including cotton,
Valonia algae, bacterial cellulose, tunicates, and wood pulps. The concentrated acid firstly
attacks and hydrolyzes the hemi- and amorphous (defects) parts of native cellulose. After the
hydrolysis, the high crystallinity regions remain intact (Anglès & Dufresne, 2001), which show
rod-like nanocrystals with different morphologies in Figure 3 due to the source of native
cellulose, including cotton (Dong et al., 1998), wood pulp (Elazzouzi-Hafraoui et al., 2007),
ramie (Habibi et al., 2008), tunicate (Elazzouzi-Hafraoui et al., 2007), Valonia (Imai et al., 1998)
and, bacterial cellulose (Grunert & Winter, 2002). Furthermore, different sources lead to various
CNs dimension, including heterogeneous cross-sections and lengths, which result in the
differences in their aspect ratio (ratio of length to width) (Moon et al., 2011). Diverse aspect
ratio exhibits distinct CNs mechanical properties and capabilities of reinforcement (Eichhorn et
al., 2010), which is also presented by models in Figure 4.
Page 16
PhD Dissertation of Fei LI 1 STATE OF THE ART
7
Figure 3 TEM images of dried dispersion of cellulose nanocrystals derived from (a) cotton
(Dong et al., 1998), (b) bacterial cellulose (Grunert & Winter, 2002), (c) Tunicate
(Elazzouzi-Hafraoui et al., 2007), (d) wood pulp (Elazzouzi-Hafraoui et al., 2007), (e) Valonia
(Imai et al., 1998), and (f) ramie (Habibi et al., 2008).
Page 17
PhD Dissertation of Fei LI 1 STATE OF THE ART
8
Figure 4 Model plots of the Halpin-Tsai equation for a range of fiber moduli showing the
predicted composite modulus (Ec) as a function of the aspect ratio of the fiber reinforcement.
The model assumes a unidirectional composite sample, with no fiber-fiber interactions and a
polypropylene matrix (Eichhorn et al., 2010).
1.2 CNs applications
1.2.1 Barrier properties
Barrier properties are among the most important aspects in packaging applications. We are
always attempting to find new materials which are more sustainable and have premium
properties. Nano-cellulose is one of the materials who fulfill all of above requirements and has
been paid more and more attention globally. As we known, conventional cellulose-based
materials have excellent gas barrier properties due to their intrinsic structures (strong hydrogen
bonds) (Habibi et al., 2010). According to above views, nano-cellulose is considered as a highly
competitive candidate for barrier applications, whereas MFC/NFC and TEMPO-oxidized
cellulose nanofibers (TOCN) have been utilized as a barrier but not the CNs. CNs has short
length and narrow diameter, it thus has been supposed that CNs is only suitable for using as a
filler into other polymers but not for a barrier as a coating or self-standing film (Isogai et al.,
2011). We summarize the limited numbers of publications as follows. Moreover, we provide all
collected permeability values from literatures in the Appendix 1 (Gas and water vapor
permeability coefficient summary).
(1) Oxygen barrier
Martinez-Sanz et al. introduced the bacterial cellulose nanocrystals (BCNs) into poly (lactic
Page 18
PhD Dissertation of Fei LI 1 STATE OF THE ART
9
acid) (PLA) by electrospinning and melt mixing systems and all nanocomposites presented
significant increases in the oxygen barrier at 0% RH (34 % reduction). Nevertheless, the oxygen
barrier at 80% RH was only improved for BCNs loadings as low as 1 wt % (26 % reduction)
(Martinez-Sanz et al., 2012). From another PLA reinforced by CNs report, similar improvement
of oxygen barrier was presented reduction of 26 and 48% in oxygen permeability were obtained
for the cast film containing 1 and 5% of surfactant modified CNs (Fortunati et al., 2012).
As for CNs coating, only a few reports were related with CNs coating for improving barrier
properties. Our group recently demonstrated that CNs combing with chitosan were used as
layer-by-layer coating materials to significantly improve oxygen barrier (>94% oxygen
permeability reduction) (Li et al., 2013). Also, in the topic 2 of this PhD dissertation, we
prepared and investigated CNs coating on different substrates which revealed excellent oxygen
barrier (>99% oxygen permeability reduction). These results exhibited the similar barrier
capabilities with TOCN coating which is chemically modified.
Oxygen permeability of self-standing CNs films were only reported once by Belbekhouche et al.
(Belbekhouche et al., 2011). It was surprising that they demonstrated that MFC film‘s oxygen
permeability displayed 2-order magnitudes lower than CNs film due to CNs being lower aspect
ratio and the lower packing of the particles in films characterized by a large extent of porosity
and MFC being entangled and high aspect ratio. This explanation however showed opposite
views from other group who interpreted that smaller widths and aspect ratio TOCN had denser
structures leading to excellent oxygen barrier properties (Fukuzumi et al., 2011). To better
understand the relationship between the aspect ratios and oxygen barriers, further investigations
are needed in the future.
(2) Water vapor barrier
The researches on water vapor permeability (PH2O) of CNs or CNs composites were relatively
more than oxygen permeability in that cellulose is a hydrophilic material which is one of the
most main its drawbacks. Fortunati et al. created PLA/surfactant-CNs nanocomposites by
solvent casting and its PH2O was reduced by 34 and 15% at 1 and 5wt% CNs addition (Fortunati
et al., 2012). CNs is evaluated as low risk potential for human beings (Kovacs et al., 2010),
Georage and Siddaramaiah thus attempted to produce edible films by gelatin and BCNs whose
WVP was reduced by ~24% at 4% BCNs addition in comparison with neat gelation films
(George & Siddaramaiah, 2012). While Sanchez-Garcia et al. also produce nanocomposite
combining carrageenan matrix/CNs and the largest reduction (71%) in PH2O was exhibited at 3
wt% CNs addition (Sanchez-Garcia et al., 2010a). The PH2O of CNs-reinforced methycellulose
was significantly decreased and obtained a further decrease after 50 kGy γ irradiation at films
Page 19
PhD Dissertation of Fei LI 1 STATE OF THE ART
10
containing 0.25% CNs. Poly(vinyl alcohol)/CNs‘ PH2Owas improved by crosslinking with
poly(acrylic acid) (PAA). The 10% CNs/10% PAA/80% PVOH composition showed he best
performance and PH2O reduction by 76% (Paralikara et al., 2008).
(3) Migration barrier
Nano-cellulose is becoming more and more popular in recent years and is considered as a safe
and sustainable new nano-material, it therefore might have a huge potential to be applied into
food related fields. Meanwhile, to migration from food packaging materials has been paid more
and more attentions, since varieties of migrating substances has come into being a risk to human
health for their toxicity or allergenicity. Based on above concerns, CNs as a functional barrier to
limit or avoid mass transfer is emerging and so far there was only very a few related reports.
After general overall migration test, Fortunati et al. reported that the migration level of the
studied bio-nanocomposites (PLA/CNs) was below the overall migration limits required by the
current normative for food packaging materials in both non-polar and polar simulants (Fortunati
et al., 2012).
1.2.2 Mechanical properties
(1) Poly lactic acid (PLA) reinforcement
Oksman group firstly reported that 5% CNs dispersion with PLA improved the tensile strength
and elongation at break, compared to its unreinforced counterpart (Bondeson & Oksman, 2007a)
and that in PLA feeding with dry and wet CNs+PVOH extrusion system, the relative small
improvements in tensile modulus (increase by12%), tensile strength, and elongation to break for
the nanocomposites indicated that it was principally the polyvinyl alcohol phase that was
reinforced with whiskers but PLA phase (Bondeson & Oksman, 2007b). Regarding the silylated
CNs, Pei et al. demonstrated that it was used to reinforce PLLA and the tensile modulus (1.4
GPa) and tensile strength (58.6 MPa) of the nanoccomposite films were more than 20% higher
than for pure PLLA with only 1 wt% silylated CNs, due to crystallinity effects and fine
dispersion (Pei et al., 2010). In order to improve the affinity between the polymers and CNs,
Goffin et al. found by dynamic mechanical thermal analysis (DMTA) that PLA-g(grafted)-CNs
only induced a limited reinforcing effect below Tg, because of a plasticization effect of the
grafted PLA chains on the polymer matrix, whereas above Tg the presence of nanofiller
increases the stiffness of the material (Goffin et al., 2011a).
Concerning the electrospun system, Martinez-Sanz et al. reported that the percolation-threshold
concentration of electropun reinforced by BC-CNs is 2-3 wt %. Under this condition, The
elastic modulus (2.16 GPa) and tensile strength (61.36 MPa) of nanocomposites increase ca. 17
and 14 %, respectively, as compared to neat PLA, without significantly decreasing the ductility
Page 20
PhD Dissertation of Fei LI 1 STATE OF THE ART
11
of the material (Martinez-Sanz et al., 2012).
(2) Polyurethanes (PU) reinforcement
Cao et al. orderly reported that the Young‘s modulus and tensile strength of nanocomposites
(polycaprolactone (PCL)-based water-borne polyurethane (WPU) reinforced by flax/hemp CNs)
were 201 and 2.5 times, respectively, when the filler amount was increased from 0 to 30 wt%.
The elongation is however reduced at break over the range from 1100 to 200% (Cao et al., 2007;
Cao et al., 2011). With regard to the shape memory material (segmented PU, SPU), different
concentration CNs additions into SPU after polymerization led to a increase in dynamic storage
and tensile modulus and a decrease in deformation at break. Addition of the cellulose
nanocrystals during the synthesis increased modulus, reduced deformability and erased the
shape memory behavior of the SPU‘s (Auad et al., 2010). Wik et al. found that castor oil-based
polyurethanes reinforced by 1% CNs addition showed a significant increase of tensile modulus
(682.9 MPa), compared to the unfilled solid PU (497.5 MPa) due to the incorporation of the
rigid particle reinforcement and the interfacial bonding (Wik et al., 2011). It was reported that
the segmented thermo-plastic polyurethane elastomers (STPUE) reinforced by 1.5% modified
CNs showed a much more pronounced increase in tensile modulus (21 MPa) compared to the
neat one 9.2 (MPa) (Rueda et al., 2011). Mendez et al. demonstrated that the nanocomposite
with the highest CNs content investigated (20% v/v) showed Young‘s modulus of 1076 MPa,
which represents a stiffness increase of almost 2 orders of magnitude than the one of neat PU,
which was ascribed to interfacial interactions (hydrogen bonding) between the polyurethane and
CNs (Mendez et al., 2011).
(3) Polyvinyl alcohol (PVOH) reinforcement
For cast films, first George reported that 10% cross-linked PVOH filled with BC-CNs, which
resulted in an improved tensile strength from 62.5 MPa to 128 MPa (increase by 105%), by the
addition of just 4 wt% of BC-CNs by casting method. Furthermore, the elastic modulus was
found to increase from 2 GPa to 3.4 GPa (increase by 70%) (George et al., 2011). Sequentially,
Pakzad reported that in PVOH/PAA/CNs (80%:0%:15%) cast film system, the PAA functioned
to reduce the agglomerate of CNs and its highest elastic modulus reached to ~7.6 GPa by AFM
nano-indentation. This value is, however, different from the elastic modulus (1.4 GPa) result
from tensile test due to the high degree of local heterogeneity of CNC distribution (Pakzad et al.,
2012).
Regarding electrospun system, Peresin et al., demonstrated that the effect moisture on
electropun nanofiber of PVOH (7%) and CNs was investigated and it was found that the
plasticizing and anti-plasticizing effect of water and CNs, respectively. It was interesting that
Page 21
PhD Dissertation of Fei LI 1 STATE OF THE ART
12
the CNs-loaded PVA fiber mats showed a reversible recovery in mechanical strength after
cycling the relative humidity (Peresin et al., 2010). Afterward, Lee and Deng demonstrated that
aligned electrspun webs of PVOH (8%) reinforced by CNs showed 87.4 MPa modulus, which
increased by 35% comparing to the isotropic PVOH electrospun webs (Lee & Deng, 2012).
(4) Polycaprolactone (PCL) reinforcement
In modified CNs (PCL-g-CNs) and CNs with PCL nanocomposite systems, Habibi et al.
reported that the addition of PCL-g-CNs into PCL proved to improve considerably the Young‘s
modulus, which increases from 230.7 MPa for unfilled PCL to 582.0 MPa for nanocomposites
containing 40% of PCL-grafted CNs. The elongation at break decreases drastically, but the
values remain mostly better than compositions filled with unmodified CNs (Habibi et al., 2008).
Then, Goffin reported that the Young‘s modulus of 8wt% PCL-g-CNs nanocomposites reached
to 1500 MPa, 255% and 132% higher than the ones of neat matrix and 8wt% unmodified CNs
nanocomposites (Goffin et al., 2011b).
In the electrospun PCL system, electrospun fiber webs from PCL reinforced with 2.5%
unmodified CNs showed ca. 1.5-fold increase in Young‘s modulus (reach 6.54 MPa) and the
ultimate strength (1.51 MPa) compared to PCL webs (Zoppe et al., 2009).
(5) Others reinforcement
Poly(ethylene oxide)(PEO): in PEO/pentaerythritol triacrylate (PETA) reinforced by CNs
system, the maximum tensile stress (14.22 MPa) and Young‘s modulus (39.8 MPa) of the
crosslinked PEO/ 10%CNs composite fibrous mats increased by 377.5 and 190.5% than those
of uncrosslinked PEO mats, and 76.5 and 127.4% than those of crosslinked PEO mats,
respectively (Zhou et al., 2012). As for the PEO/CNs electrospun system, the electrospun
heterogeneous mats are stronger than their homogeneous counterparts for all compositions
(Zhou et al., 2011) and the storage moduli of aligned electrospun PEO/CNs nanocomposite
fibers (324 MPa) are 1.5-2 times greater than those of the neat PEO counterparts (Changsarn et
al., 2011).
Natural rubber (NR): Siqueira et al. reported that, compared with neat natural rubber, Young‘s
modulus and tensile strength of 10% CNs/NR were increased by 257 and 11 times (Siqueira et
al., 2010). Afterward, Visakh demonstrated that the tensile strength (17.3 MPa) and storage
modulus (3.8 MPa) of NR+CNs nanocomposite at 25°C was about 88% and 124% in
comparison with neat NR (Visakh et al., 2012).
Starch: For plasticized starch (PS) reinforced by hemp/flax CNs system, Cao et al. found
Page 22
PhD Dissertation of Fei LI 1 STATE OF THE ART
13
significant increases in the tensile strength and Young‘s modulus, from 3.9 to 11.9 MPa and
from 31.9 to 498.2 MPa, respectively, with increasing FCN content from 0 to 30wt% (Cao et al.,
2008b; Cao et al., 2007). Considering the relative humidity (RH) effects, for all RH levels, the
modulus increased gradually with filler load, and above ~5% whiskers, a significant
improvement is observed. The tensile strength and Young‘s modulus are high at lower RH
levels, and elongation at break remains constant, irrespective of RH and filler content. With
sorbitol, the final composite has better thermal mechanical properties than the one with glycerol
due to glycerol functioning for transcrystallization which effectively decreases fiber matrix
adhesion, but sorbitol which shows that a good fiber-matrix adhesion is present in the system
favoring effective stress-transfer at the fiber/matrix interface (Mathew et al., 2008).
Besides above, CNs was also used for reinforcement filler into varieties of polymers which
include biopolymers (carboxymethyl cellulose (CMC) (Choi & Simonsen, 2006), chotisan (Sui
et al., 2010), methylcellulose (MC) (Khan et al., 2010), cellulose acetate butyrate (Ayuk et al.,
2009; Siqueira et al., 2011), alginate (Urena-Benavides et al., 2010; Urena-Benavides &
Kitchens, 2011, 2012), aligned cellulose nanofibers (Magalhaes et al., 2011), cellulose acetate
(CA) (Herrera et al., 2011), silk (Huang et al., 2011; Park et al., 2012), xylan (Kohnke et al.,
2012), poly(3-hydroxybutyrate-co-3-hydroxyvalerate) (PHBV) (Ten et al., 2010; Yu et al.,
2012), and gelation (George & Siddaramaiah, 2012)) and synthetic polymers (polysulfone (PSf)
(Noorani et al., 2006, 2007), , poly(diallyldimethylammonium chloride) (PDDA) (Sui et al.,
2010), Poly(methyl vinyl ether-co-maleic acid)-Polyethylene Glycol (PMVEMA-PEG) (Goetz
et al., 2010) polyacrylamide (PAM) (Zhou et al., 2011), polyvinylacetate (PVAc) (Mathew et al.,
2011), poly(acrylic acid) (PAA) (Pakzad et al., 2012), stereolithographic resins (Kumar et al.,
2012), healable material (Fox et al., 2012), and poly(methyl methacrylate) (PMMA) (Dong et
al., 2012)).
1.2.3 Thermal properties
Thermal properties are usually determined by thermogravimetric analysis (TGA), differential
scanning calorimetry (DSC), and dynamic mechanical thermal analysis (DMTA), which are
able to monitoring changes of gravity (loss weight), calories (heat flow), and mechanical
properties as a function of temperature to reflect the thermal properties, e.g. glass transition
temperature (Tg), melting or decomposition temperature (Tm or Td), tan δ, and so on. Generally
speaking, different CNs extraction processes and the addition of CNs into other polymers have
influences on the thermal properties of CNs themselves and their nanocomposites, respectively.
Firstly, we focus on different thermal properties of CNs resulting from their extraction
processes. Inorganic acids are widely used for extracting CNs from different sources, such as
Page 23
PhD Dissertation of Fei LI 1 STATE OF THE ART
14
bio-residues obtained from a bioethanol pilot plant (Oksman et al., 2011), bacterial cellulose
(BC) (Martinez-Sanz et al., 2011a), coconut husk (Rosa et al., 2010), microcrystalline cellulose
(MCC) (Man et al., 2011; Wang et al., 2007), rice husk (Johar et al., 2012), kenaf bast
(Kargarzadeh et al., 2012), and mengkuang leaves (Pandanus tectorius) (Sheltami et al., 2012).
Above two extraction processes result in grafting a few of sulfate ester groups on the surface of
CNs which lead to a lower thermal stability. Matinez-Sanz and Wang reported that
neutralization produced a slight increase in the crystallinity index and led to a remarkable
increase on the BCNs thermal stability and the degradation (decomposition) temperature (Td)
shift to the higher temperature and occurred within a narrow temperature range for spherical
CNs from MCC (Martinez-Sanz et al., 2011a; Wang et al., 2007). Besides neutralization,
physical extractions, including ultrasonication and homogenization, could further increase the
thermal stability to 265°C in comparison with the degradable temperature of raw material
around 202 °C (Oksman et al., 2011), while the hydrolyzed CNs showed a two-stage
degradation, with an initial onset of degradation around 120°C and a second step around 255 °C
which is a typical behavior of sulphuric acid-hydrolyzed CNs. Rose et al. also demonstrated that
higher residual lignin content was found to increase thermal stability indicating that the thermal
properties of the CNs could be tailored by controlling reaction conditions (Rosa et al., 2010).
Georage et al. revealed that the thermal stability of enzyme processed BC nanocrystals (BCNs)
was almost two fold higher than sulfuric acid processed ones. The activation energy required for
decomposition of enzyme processed BCNs was much higher than the other (George et al.,
2011).
Secondly, the thermal properties of CNs-nanocomposites produced by casting method will be
reviewed.
(1) Synthesized polymers:
Poly(methyl methacrylate) (PMMA): Liu et al. reported that the glass transition of the
PMMA-CNs nanocomposites was shifted to lower temperatures with respect to the pure PMMA.
The DMA data showed a marked increase in storage modulus (from 1.5 GPa for pure PMMA to
5 GPa) for the composite sheet containing 10 wt.% CNs at 35°C due to the high modulus of
cellulose crystals (Liu et al., 2010). Xu et al. grafted PMMAZO
(Poly(6-[4-(4-methoxyphenylazo) phenoxy] hexyl methacrylate)) on the CNs surface and
PMMAZO-grafted CNs showed smectic-to-nematic transition at 95 °C and nematic-to-isotropic
transition at 135 °C, and exhibit analogous lyotropic liquid-crystalline phase behavior above
135 °C. It also showed a lyotropic nematic phase in chlorobenzene above a concentration of 5.1
wt% (Xu et al., 2008).
Page 24
PhD Dissertation of Fei LI 1 STATE OF THE ART
15
Stereolithographic Resins (SLRs): The storage modulus (E') increased steadily with increasing
CNs content in the regimes below and above the glass transition (a remarkable modulus
enhancement in the rubbery regime) but less pronounced in the glassy state (Kumar et al.,
2012).
Polyurethane (PU): The CNs from Eucalyptus globulus favored the hard-segments
(HSs)/soft-segments (SSs) microphase separation of the Water-borne PU (WPU), causing shifts
of the SS glass transition temperature and the HS melting temperature toward higher
temperatures was reported by Gao et al. (Gao et al., 2012). Auad et al. reported that CNs
addition increased the PU SS melting and crystallization temperatures and the degree of
crystallinity of this phase, while both neat PU and composites exhibited shape memory
properties, with fixity and recovery values that depend on heating temperature, imposed
deformation, deformation rate and CNs addition (Auad et al., 2012). Pei et al. however
demonstrated that the decrease of Tg for the PU-CNs nanocomposites was due to the fact that
the CNs are strongly associated with the HS of PU, resulting in lower fraction of hydrogen
bonded carbonyl groups in the HS and an increase of the degree of freedom for the SS in PU
(Pei et al., 2011). The tan δ corresponding to the glass transition of PU from DMA decreased
with increasing CNs content, while the half height width of the peak increased. This could be
attributed to the greatly restricted motion of PU chains resulting from the covalent bonding and
cross-linking between PU molecules and nanoscale stiff rod-like CNs (Pei et al., 2011). In order
to improve the compatibility of CNs with WPU, Cao et al. induced the grafting of part of the
pre-synthesized WPU chains on the surface of CNs and the corresponding nanocomposites were
processed by casting. Degradation temperature of nanocomposite (400 °C) was higher than
WPU (337 °C), but started to decompose at the same temperature. From DSC, these
grafted-WPU chains were able to form a crystalline structure on the surface of CNs, and thus
induce the crystallization of the matrix which created a co-continuous phase (Cao et al., 2009).
Polyvinyl alcohol (PVOH): Georage et al. found that the thermal stability of enzyme processed
BCNs was almost two fold higher than sulfuric acid processed ones. Incorporation of these
BCNs in PVOH matrix resulted in a remarkable improvement in the thermal stability as well as
mechanical properties of nanocomposite films, which exhibited higher melting temperature (Tm)
and enthalpy of melting (ΔHm) than those of pure PVOH, suggesting that the addition of BCNs
should modify the thermal properties of PVOH (George et al., 2011).
Starch: CNs results in an increase in the glass transition temperature due to the strong
interactions between CNs and plasticized starch which reduce the flexibility of starch molecular
chains (Cao et al., 2008a).
Page 25
PhD Dissertation of Fei LI 1 STATE OF THE ART
16
Poly(styrene-co-butyl acrylate) (PSBA): A significant increase of the stiffness of the acrylic
polymer beyond the glass transition temperature was shown. MFC from Stipa tenacissima (ST)
showed higher reinforcing effect compared to ST-CNs, probably because of higher aspect ratio
and possibility of entanglement of the former (Ben Mabrouk et al., 2012).
(2) Biopolymers:
Carrageenan: Sanchez-Garcia et al. demonstrated that addition of cellulose microfibers to
unplasticized carrageenan resulted in a continuous decrease in the Td for CNs loadings of up to
3 wt%. The behavior of adding cellulose microfibers to the carrageenan containing glycerol was
found to be rather similar to that of CNs (Sanchez-Garcia et al., 2010a).
Cellulose acetate butyrate (CAB): TGA and DMTA results showed a substantial improvement
in the thermal stability and an increase in the storage modulus of CAB reinforced with 5 and 10
wt% CNs for both unplasticized and plasticized cellulose acetate butyrate (CAB)-CNs
nanocomposites (Ayuk et al., 2009). Furthermore, Petersson et al. compared the storage
modulus of CNs-CAB with layered silicates (LS)-CAB and results from DMTA showed
improved storage modulus for a wide temperature range for both nanocomposites compared
with the pure CAB matrix. The CNs decreased the tan δ peak temperature of the CAB whereas
LS did not affect the tan δ peak (Petersson et al., 2009).
Methylcellulose (MC): TGA curves clearly show that addition of CNs in MC-based films
contributed to a substantial improvement in the thermal stability up to 200 °C. Melting peaks in
DSC curves at 150 °C disappeared, which might be attributed to CNs fiber covering the surface
as well as the interface of the MC-based films and thus stabilized the films and the second DSC
cycle indicated that the curves do not reveal either crystalline structures or other transitions due
to the thermal degradation/evaporation of some components during the first heating cycle of
films (Khan et al., 2010).
Natural rubber (NR): The CNs (from Capim Dourado) reinforcing effect observed above Tg of
the matrix was higher than the one observed for other polysaccharide nanocrystals and CNs
extracted from other sources (Siqueira et al., 2010).
Poly(3-hydroxybutyrate-co-3-hydroxyvalerate) (PHBV): Ten et al. considered the CNs as a
nucleation agent in the nanocomposite. The cold crystallization temperature (Tcc) progressively
decreased with the addition of CNs, but Tg was not noticeably affected (Ten et al., 2010). DMA
results showed an increased tan delta peak temperature and broadened transition peak,
Page 26
PhD Dissertation of Fei LI 1 STATE OF THE ART
17
indicating restrained PHBV molecular mobility in the vicinity of the CNs surface (Ten et al.,
2010). Yu et al. demonstrated that decomposition temperature (T-0), temperature at 5% weight
loss (T-5%), maximum decomposition temperature (Tmax) and complete decomposition
temperature (Tf) increased by 51.4, 36.5, 47.1, and 52.9 °C, respectively compared to the ones
of PHBV (Yu et al., 2012).
Poly lactic acid (PLA): Lin et al. found that the addition of (acetylation) A-CNs improved the
thermal property of the nanocomposites, but a marked drop in the storage modulus (E') of
PLA-based nanocomposites at around 65-80°C was attributed to the glass transition effects of
the PLA component (Lin et al., 2011).
.
Thirdly, electrospinning is becoming one of the most important method to produce new
nanocomposites. Different polymers are reinforced by CNs via electrospinning. The DSC
results showed a significant increase in Tg of the electrospun EVOH-CNs nanocomposite during
the second heating run, which may be related to the acidic character of the nanofiller
(Martinez-Sanz et al., 2011b). Lalia et al. demonstrated that the electrospun
poly(vinylidenefluoride-co-hexafluoropropylene) (PVDF-HP) with 2 wt% CNs exhibited high
values of tensile modulus in the 30-150°C temperature range by DMA (Lalia et al., 2012). Dong
et al. found that Tg of electrospun PMMA with 5wt%CNs is 123°C and Tg other percentages are
around 125 °C, while their Tm slightly increased (2.7-4.6%) in comparison of neat PMMA
(Dong et al., 2012). In the electrospun system of PVA reinforced by CNs, the addition of CNs
improved the thermal stability of nanocomposite (Ago et al., 2012; Cao et al., 2011).
Above we reviewed the thermal properties of CNs or CNs-reinforced nanocomposites by
different extraction processes, casting, and electrospinning methods. Finally, the thermal
properties of CNs-reinforced nanocomposites by other producing methods are reviewed as
follows. Visakh et al. found that the addition of CNs had a positive impact on the E‘, tan δ peak
position and thermal stability of the crosslinked natural rubber (NR) by masterbatch,
compounding, and curing (Visakh et al., 2012). Bondeson et al. reported that the thermal
properties of PLA-CNs nanocomposite modified by PVA was not improved compared to its
unreinforced counter-part through two-feeding compounding extrusion method, probably
because the majority of the CNs were located in the PVA phase and only a negligible amount
was located in the PLA phase (Bondeson & Oksman, 2007b). Goffin et al. grafted PLA with
CNs by ring-opening polymerization (PLA-g-CNs) and produced PLA nanocomposite with
PLA-g-CNs by melting processing. The DSC and DMTA results indicated that PLA-g-CNs
enhances their compatibility with PLA, large modification of the crystalline properties such as
the crystallization half-time, and thus improves the final properties of the nanocomposite
Page 27
PhD Dissertation of Fei LI 1 STATE OF THE ART
18
(Goffin et al., 2011a). Through solvent-exchange method, the incorporation of CNs did not
significantly affect the thermal stability of the phenolic resin but clearly increased the heat of
cure, suggesting that additional cure reactions took place in presence of the CNs (Liu & Laborie,
2011). The DSC and TGA results of rigid PU foam reinforced by CNs clearly indicated
enhanced thermal stability (increment in Tg and Td) (Li & Ragauskas, 2012).
Although only barrier, mechanical, and thermal properties have been reviewed, we could yet
clearly realize that CNs has been applied into various polymers, mainly biopolymers, and could
generally improve their properties significantly only through some simple methods. Moreover,
CNs has been evaluated to be highly safe (Ni et al., 2012) and sustainable (Moon et al., 2011).
Food packaging is one of the largest markets in the world, based on all CNs present advantages
CNs thus will be widely used into this field and lead to more breakthroughs.
Page 28
PhD Dissertation of Fei LI 1 STATE OF THE ART
19
1.3 References
Ago, M. et al., 2012, Lignin-Based Electrospun Nanofibers Reinforced with Cellulose
Nanocrystals. Biomacromolecules 13: 918-926.
Ahola, S. et al., 2008, Enzymatic hydrolysis of native cellulose nanofibrils and other cellulose
model films: effect of surface structure. Langmuir 24: 11592-11599.
Alemdar, A., Sain, M., 2008, Isolation and characterization of nanofibers from agricultural
residues – Wheat straw and soy hulls. Bioresource Technology 99: 1664-1671.
Anglès, M. N., Dufresne, A., 2001, Plasticized Starch/Tunicin Whiskers Nanocomposite
Materials. 2. Mechanical Behavior. Macromolecules 34: 2921-2931.
Araki, J. et al., 1998, Flow properties of microcrystalline cellulose suspension prepared by acid
treatment of native cellulose. Colloids and Surfaces A: Physicochemical and Engineering
Aspects 142: 75-82.
Auad, M. L. et al., 2010, Nanocomposites Made from Cellulose Nanocrystals and Tailored
Segmented Polyurethanes. Journal of Applied Polymer Science 115: 1215-1225.
Auad, M. L. et al., 2012, Shape memory segmented polyurethanes: dependence of behavior on
nanocellulose addition and testing conditions. Polymer International 61: 321-327.
Ayuk, J. E. et al., 2009, The Effect of Plasticizer and Cellulose Nanowhisker Content on the
Dispersion and Properties of Cellulose Acetate Butyrate Nanocomposites. Journal of Applied
Polymer Science 114: 2723-2730.
Azizi Samir, M. A. S. et al., 2005, Review of Recent Research into Cellulosic Whiskers, Their
Properties and Their Application in Nanocomposite Field. Biomacromolecules 6: 612-626.
Beck-Candanedo, S. et al., 2005, Effect of Reaction Conditions on the Properties and Behavior
of Wood Cellulose Nanocrystal Suspensions. Biomacromolecules 6: 1048-1054.
Belbekhouche, S. et al., 2011, Water sorption behavior and gas barrier properties of cellulose
whiskers and microfibrils films. Carbohydrate Polymers 83: 1740-1748.
Ben Mabrouk, A. et al., 2012, Cellulosic nanoparticles from alfa fibers (Stipa tenacissima):
extraction procedures and reinforcement potential in polymer nanocomposites. Cellulose 19:
843-853.
Bondeson, D. et al., 2006, Optimization of the isolation of nanocrystals from microcrystalline
cellulose by acid hydrolysis. Cellulose 13: 171-180.
Bondeson, D., Oksman, K., 2007a, Dispersion and characteristics of surfactant modified
cellulose whiskers nanocomposites. Composite Interfaces 14: 617-630.
Bondeson, D., Oksman, K., 2007b, Polylactic acid/cellulose whisker nanocomposites modified
by polyvinyl alcohol. Composites Part a-Applied Science and Manufacturing 38: 2486-2492.
Cao, X. et al., 2008a, Starch-based nanocomposites reinforced with flax cellulose nanocrystals.
Express Polymer Letters 2: 502-510.
Cao, X. D. et al., 2008b, Green composites reinforced with hemp nanocrystals in plasticized
Page 29
PhD Dissertation of Fei LI 1 STATE OF THE ART
20
starch. Journal of Applied Polymer Science 109: 3804-3810.
Cao, X. D. et al., 2007, New nanocomposite materials reinforced with flax cellulose
nanocrystals in waterborne polyurethane. Biomacromolecules 8: 899-904.
Cao, X. D. et al., 2009, One-pot polymerization, surface grafting, and processing of waterborne
polyurethane-cellulose nanocrystal nanocomposites. Journal of Materials Chemistry 19:
7137-7145.
Cao, X. D. et al., 2011, Cellulose nanocrystals-based nanocomposites: fruits of a novel biomass
research and teaching platform. Current Science 100: 1172-1176.
Chakraborty, A. et al., 2007, Dispersion of Wood Microfibers in a Matrix of Thermoplastic
Starch and Starch-Polylactic Acid Blend. Journal of Biobased Materials and Bioenergy 1:
71-77.
Changsarn, S. et al., 2011, Biologically Inspired Hierarchical Design of Nanocomposites Based
on Poly(ethylene oxide) and Cellulose Nanofibers. Macromolecular Rapid Communications 32:
1367-1372.
Choi, Y. J., Simonsen, J., 2006, Cellulose nanocrystal-filled carboxymethyl cellulose
nanocomposites. Journal of Nanoscience and Nanotechnology 6: 633-639.
de Souza Lima, M. M., Borsali, R., 2002, Static and Dynamic Light Scattering from
Polyelectrolyte Microcrystal Cellulose. Langmuir 18: 992-996.
Dong, H. et al., 2012, Cellulose nanocrystals as a reinforcing material for electrospun
poly(methyl methacrylate) fibers: Formation, properties and nanomechanical characterization.
Carbohydrate Polymers 87: 2488-2495.
Dong, X. M. et al., 1998, Effect of microcrystallite preparation conditions on the formation of
colloid crystals of cellulose. Cellulose 5: 19-32.
Eichhorn, S. J. et al., 2010, Review: current international research into cellulose nanofibres and
nanocomposites. Journal of Materials Science 45: 1-33.
Elazzouzi-Hafraoui, S. et al., 2007, The Shape and Size Distribution of Crystalline
Nanoparticles Prepared by Acid Hydrolysis of Native Cellulose. Biomacromolecules 9: 57-65.
Favier, V. et al., 1995, Polymer Nanocomposites Reinforced by Cellulose Whiskers.
Macromolecules 28: 6365-6367.
Filson, P. B. et al., 2009, Enzymatic-mediated production of cellulose nanocrystals from
recycled pulp. Green Chemistry 11: 1808-1814.
Fortunati, E. et al., 2012, Effects of modified cellulose nanocrystals on the barrier and migration
properties of PLA nano-biocomposites. Carbohydrate Polymers 90: 948-956.
Fox, J. et al., 2012, High-Strength, Healable, Supramolecular Polymer Nanocomposites. Journal
of the American Chemical Society 134: 5362-5368.
Fujisawa, S. et al., 2011, Preparation and characterization of TEMPO-oxidized cellulose
nanofibers with different counter ions. Abstracts of Papers of the American Chemical Society
Page 30
PhD Dissertation of Fei LI 1 STATE OF THE ART
21
241.
Fukuzumi, H. et al., 2009, Properties of TEMPO-oxidized cellulose nanofiber film. Abstracts of
Papers of the American Chemical Society 237.
Fukuzumi, H. et al., 2011, Pore Size Determination of TEMPO-Oxidized Cellulose Nanofibril
Films by Positron Annihilation Lifetime Spectroscopy. Biomacromolecules 12: 4057-4062.
Gao, Z. Z. et al., 2012, Biocompatible elastomer of waterborne polyurethane based on castor oil
and polyethylene glycol with cellulose nanocrystals. Carbohydrate Polymers 87: 2068-2075.
George, J. et al., 2011, Bacterial cellulose nanocrystals exhibiting high thermal stability and
their polymer nanocomposites. International Journal of Biological Macromolecules 48: 50-57.
George, J., Siddaramaiah, 2012, High performance edible nanocomposite films containing
bacterial cellulose nanocrystals. Carbohydrate Polymers 87: 2031-2037.
Goetz, L. et al., 2010, Poly(methyl vinyl ether-co-maleic acid)-Polyethylene Glycol
Nanocomposites Cross-Linked In Situ with Cellulose Nanowhiskers. Biomacromolecules 11:
2660-2666.
Goffin, A. L. et al., 2011a, From Interfacial Ring-Opening Polymerization to Melt Processing of
Cellulose Nanowhisker-Filled Polylactide-Based Nanocomposites. Biomacromolecules 12:
2456-2465.
Goffin, A. L. et al., 2011b, Poly(epsilon-caprolactone) based nanocomposites reinforced by
surface-grafted cellulose nanowhiskers via extrusion processing: Morphology, rheology, and
thermo-mechanical properties. Polymer 52: 1532-1538.
Grunert, M., Winter, W. T., 2002, Nanocomposites of Cellulose Acetate Butyrate Reinforced
with Cellulose Nanocrystals. Journal of Polymers and the Environment 10: 27-30.
Håkansson, H., Ahlgren, P., 2005, Acid hydrolysis of some industrial pulps: effect of hydrolysis
conditions and raw material. Cellulose 12: 177-183.
Habibi, Y. et al., 2008, Bionanocomposites based on poly(epsilon-caprolactone)-grafted
cellulose nanocrystals by ring-opening polymerization. Journal of Materials Chemistry 18:
5002-5010.
Habibi, Y. et al., 2010, Cellulose Nanocrystals: Chemistry, Self-Assembly, and Applications.
Chemical Reviews 110: 3479-3500.
Herrera, N. V. et al., 2011, Randomly oriented and aligned cellulose fibres reinforced with
cellulose nanowhiskers, prepared by electrospinning. Plastics Rubber and Composites 40:
57-64.
Huang, J. et al., 2011, Electrospinning of Bombyx mori Silk Fibroin Nanofiber Mats Reinforced
by Cellulose Nanowhiskers. Fibers and Polymers 12: 1002-1006.
Imai, T. et al., 1998, Unidirectional processive action of cellobiohydrolase Cel7A on Valonia
cellulose microcrystals. FEBS Letters 432: 113-116.
Isogai, A. et al., 2011, TEMPO-oxidized cellulose nanofibers. Nanoscale 3: 71-85.
Page 31
PhD Dissertation of Fei LI 1 STATE OF THE ART
22
Iwamoto, S. et al., 2007, Nano-fibrillation of pulp fibers for the processing of transparent
nanocomposites. Applied Physics A: Materials Science & Processing 89: 461-466.
Iwamoto, S. et al., 2005, Optically transparent composites reinforced with plant fiber-based
nanofibers. Applied Physics A: Materials Science & Processing 81: 1109-1112.
Johansson, C. et al., 2012, Renewable Fibers and Bio-Based Materials for Packaging
Applications - a Review of Recent Developments. Bioresources 7: 2506-2552.
Johar, N. et al., 2012, Extraction, preparation and characterization of cellulose fibres and
nanocrystals from rice husk. Industrial Crops and Products 37: 93-99.
Kargarzadeh, H. et al., 2012, Effects of hydrolysis conditions on the morphology, crystallinity,
and thermal stability of cellulose nanocrystals extracted from kenaf bast fibers. Cellulose 19:
855-866.
Khan, R. A. et al., 2010, Production and Properties of Nanocellulose-Reinforced
Methylcellulose-Based Biodegradable Films. Journal of Agricultural and Food Chemistry 58:
7878-7885.
Kohnke, T. et al., 2012, Nanoreinforced xylan-cellulose composite foams by freeze-casting.
Green Chemistry 14: 1864-1869.
Kovacs, T. et al., 2010, An ecotoxicological characterization of nanocrystalline cellulose (NCC).
Nanotoxicology 4: 255-270.
Kumar, S. et al., 2012, Reinforcement of Stereolithographic Resins for Rapid Prototyping with
Cellulose Nanocrystals. ACS Appl Mater Interfaces.
López-Rubio, A. et al., 2007, Enhanced film forming and film properties of amylopectin using
micro-fibrillated cellulose. Carbohydrate Polymers 68: 718-727.
Lalia, B. S. et al., 2012, Nanocrystalline-cellulose-reinforced
poly(vinylidenefluoride-co-hexafluoropropylene) nanocomposite films as a separator for
lithium ion batteries. Journal of Applied Polymer Science 126: E441-E447.
Lee, J., Deng, Y. L., 2012, Increased mechanical properties of aligned and isotropic electrospun
PVA nanofiber webs by cellulose nanowhisker reinforcement. Macromolecular Research 20:
76-83.
Li, F. et al., 2013, Tunable green oxygen barrier through layer-by-layer self-assembly of
chitosan and cellulose nanocrystals. Carbohydrate Polymers 92: 2128-2134.
Li, Y., Ragauskas, A. J., 2012, Ethanol organosolv lignin-based rigid polyurethane foam
reinforced with cellulose nanowhiskers. Rsc Advances 2: 3347-3351.
Lin, N. et al., 2011, Surface acetylation of cellulose nanocrystal and its reinforcing function in
poly(lactic acid). Carbohydrate Polymers 83: 1834-1842.
Liu, H. Y. et al., 2010, Fabrication and properties of transparent
polymethylmethacrylate/cellulose nanocrystals composites. Bioresource Technology 101:
5685-5692.
Page 32
PhD Dissertation of Fei LI 1 STATE OF THE ART
23
Liu, H. Z., Laborie, M. P. G., 2011, Bio-based nanocomposites by in situ cure of phenolic
prepolymers with cellulose whiskers. Cellulose 18: 619-630.
Magalhaes, W. L. E. et al., 2011, Novel all-cellulose composite displaying aligned cellulose
nanofibers reinforced with cellulose nanocrystals. Tappi Journal 10: 19-25.
Man, Z. et al., 2011, Preparation of Cellulose Nanocrystals Using an Ionic Liquid. Journal of
Polymers and the Environment 19: 726-731.
Marchessault, R. H. et al., 1961, Some hydrodynamic properties of neutral suspensions of
cellulose crystallites as related to size and shape. Journal of Colloid Science 16: 327-344.
Martinez-Sanz, M. et al., 2011a, Optimization of the nanofabrication by acid hydrolysis of
bacterial cellulose nanowhiskers. Carbohydrate Polymers 85: 228-236.
Martinez-Sanz, M. et al., 2012, On the Optimization of the Dispersion of Unmodified Bacterial
Cellulose Nanowhiskers into Polylactide Via Melt Compounding to Significantly Enhance
Barrier and Mechanical Properties. Biomacromolecules.
Martinez-Sanz, M. et al., 2011b, Development of electrospun EVOH fibres reinforced with
bacterial cellulose nanowhiskers. Part I: Characterization and method optimization. Cellulose
18: 335-347.
Mathew, A. P. et al., 2011, Moisture Absorption Behavior and Its Impact on the Mechanical
Properties of Cellulose Whiskers-Based Polyvinylacetate Nanocomposites. Polymer
Engineering and Science 51: 2136-2142.
Mathew, A. P. et al., 2008, Mechanical properties of nanocomposites from sorbitol plasticized
starch and tunicin whiskers. Journal of Applied Polymer Science 109: 4065-4074.
Mendez, J. et al., 2011, Bioinspired Mechanically Adaptive Polymer Nanocomposites with
Water-Activated Shape-Memory Effect. Macromolecules 44: 6827-6835.
Meyabadi, T. F., Dadashian, F., 2012, Optimization of Enzymatic Hydrolysis of Waste Cotton
Fibers for Nanoparticles Production Using Response Surface Methodology. Fibers and
Polymers 13: 313-321.
Moon, R. J. et al., 2011, Cellulose nanomaterials review: structure, properties and
nanocomposites. Chem Soc Rev 40: 3941-3994.
Nakagaito, A. N. et al., 2005, Bacterial cellulose: the ultimate nano-scalar cellulose morphology
for the production of high-strength composites. Applied Physics A: Materials Science &
Processing 80: 93-97.
Ni, H. et al., 2012, Cellulose nanowhiskers: Preparation, characterization and cytotoxicity
evaluation. Bio-Medical Materials and Engineering 22: 121-127.
Nickerson, R. F., Habrle, J. A., 1947, Cellulose Intercrystalline Structure. Industrial &
Engineering Chemistry 39: 1507-1512.
Nishiyama, Y., 2009, Structure and properties of the cellulose microfibril. Journal of Wood
Science 55: 241-249.
Page 33
PhD Dissertation of Fei LI 1 STATE OF THE ART
24
Noorani, S. et al., 2006, Polysulfone-cellulose nanocomposites. Cellulose Nanocomposites:
Processing, Characterization, and Properties 938: 209-220.
Noorani, S. et al., 2007, Nano-enabled microtechnology: polysulfone nanocomposites
incorporating cellulose nanocrystals. Cellulose 14: 577-584.
Okita, Y. et al., 2011, TEMPO-Oxidized Cellulose Nanofibrils Dispersed in Organic Solvents.
Biomacromolecules 12: 518-522.
Oksman, K. et al., 2011, Cellulose nanowhiskers separated from a bio-residue from wood
bioethanol production. Biomass & Bioenergy 35: 146-152.
Paakko, M. et al., 2007, Enzymatic hydrolysis combined with mechanical shearing and
high-pressure homogenization for nanoscale cellulose fibrils and strong gels.
Biomacromolecules 8: 1934-1941.
Pakzad, A. et al., 2012, Elastic properties of thin poly(vinyl alcohol)-cellulose nanocrystal
membranes. Nanotechnology 23.
Paralikara, S. A. et al., 2008, Poly(vinyl alcohol)/cellulose nanocrystal barrier membranes.
Journal of Membrane Science 320: 248-258.
Park, D. J. et al., 2012, Bacterial cellulose nanocrystals-embedded silk nanofibers. J Nanosci
Nanotechnol 12: 6139-6144.
Pei, A. H. et al., 2011, Strong Nanocomposite Reinforcement Effects in Polyurethane Elastomer
with Low Volume Fraction of Cellulose Nanocrystals. Macromolecules 44: 4422-4427.
Pei, A. H. et al., 2010, Functionalized cellulose nanocrystals as biobased nucleation agents in
poly(L-lactide) (PLLA) - Crystallization and mechanical property effects. Composites Science
and Technology 70: 815-821.
Peresin, M. S. et al., 2010, Effect of Moisture on Electrospun Nanofiber Composites of
Poly(vinyl alcohol) and Cellulose Nanocrystals. Biomacromolecules 11: 2471-2477.
Petersson, L. et al., 2009, Dispersion and Properties of Cellulose Nanowhiskers and Layered
Silicates in Cellulose Acetate Butyrate Nanocomposites. Journal of Applied Polymer Science
112: 2001-2009.
Postek, M. T. et al., 2011, Development of the metrology and imaging of cellulose nanocrystals.
Measurement Science and Technology 22: 024005.
Roman, M., Winter, W. T., 2004, Effect of Sulfate Groups from Sulfuric Acid Hydrolysis on the
Thermal Degradation Behavior of Bacterial Cellulose. Biomacromolecules 5: 1671-1677.
Rosa, M. F. et al., 2010, Cellulose nanowhiskers from coconut husk fibers: Effect of preparation
conditions on their thermal and morphological behavior. Carbohydrate Polymers 81: 83-92.
Rueda, L. et al., 2011, Isocyanate-rich cellulose nanocrystals and their selective insertion in
elastomeric polyurethane. Composites Science and Technology 71: 1953-1960.
Saito, T. et al., 2007, Cellulose nanofibers prepared by TEMPO-mediated oxidation of native
cellulose. Biomacromolecules 8: 2485-2491.
Page 34
PhD Dissertation of Fei LI 1 STATE OF THE ART
25
Saito, T. et al., 2006, Homogeneous Suspensions of Individualized Microfibrils from
TEMPO-Catalyzed Oxidation of Native Cellulose. Biomacromolecules 7: 1687-1691.
Saito, T. et al., 2005, Distribution of carboxylate groups introduced into cotton linters by the
TEMPO-mediated oxidation. Carbohydrate Polymers 61: 414-419.
Sanchez-Garcia, M. D. et al., 2010, Morphology and Water Barrier Properties of
Nanobiocomposites of k/i-Hybrid Carrageenan and Cellulose Nanowhiskers. Journal of
Agricultural and Food Chemistry 58: 12847-12857.
Sheltami, R. M. et al., 2012, Extraction of cellulose nanocrystals from mengkuang leaves
(Pandanus tectorius). Carbohydrate Polymers 88: 772-779.
Shinoda, R. et al., 2012, Relationship between Length and Degree of Polymerization of
TEMPO-Oxidized Cellulose Nanofibrils. Biomacromolecules 13: 842-849.
Siqueira, G. et al., 2010, High reinforcing capability cellulose nanocrystals extracted from
Syngonanthus nitens (Capim Dourado). Cellulose 17: 289-298.
Siqueira, G. et al., 2011, Processing of cellulose nanowhiskers/cellulose acetate butyrate
nanocomposites using sol-gel process to facilitate dispersion. Composites Science and
Technology 71: 1886-1892.
Siro, I., Plackett, D., 2010, Microfibrillated cellulose and new nanocomposite materials: a
review. Cellulose 17: 459-494.
Stenstad, P. et al., 2008, Chemical surface modifications of microfibrillated cellulose. Cellulose
15: 35-45.
Sui, L. et al., 2010, Brillouin Light Scattering Investigation of the Mechanical Properties of
Layer-by-Layer Assembled Cellulose Nanocrystal Films. Macromolecules 43: 9541-9548.
Ten, E. et al., 2010, Thermal and mechanical properties of
poly(3-hydroxybutyrate-co-3-hydroxyvalerate) / cellulose nanowhiskers composites. Polymer
51: 2652-2660.
Urena-Benavides, E. E. et al., 2010, Effect of Jet Stretch and Particle Load on Cellulose
Nanocrystal-Alginate Nanocomposite Fibers. Langmuir 26: 14263-14270.
Urena-Benavides, E. E., Kitchens, C. L., 2011, Wide-Angle X-ray Diffraction of Cellulose
Nanocrystal-Alginate Nanocomposite Fibers. Macromolecules 44: 3478-3484.
Urena-Benavides, E. E., Kitchens, C. L., 2012, Cellulose Nanocrystal Reinforced Alginate
Fibers-Biomimicry Meets Polymer Processing. Molecular Crystals and Liquid Crystals 556:
275-287.
Visakh, P. M. et al., 2012, Crosslinked natural rubber nanocomposites reinforced with cellulose
whiskers isolated from bamboo waste: Processing and mechanical/thermal properties.
Composites Part a-Applied Science and Manufacturing 43: 735-741.
Wang, B., Sain, M., 2007a, Dispersion of soybean stock-based nanofiber in a plastic matrix.
Polymer International 56: 538-546.
Page 35
PhD Dissertation of Fei LI 1 STATE OF THE ART
26
Wang, B., Sain, M., 2007b, Isolation of nanofibers from soybean source and their reinforcing
capability on synthetic polymers. Composites Science and Technology 67: 2521-2527.
Wang, N. et al., 2007, Thermal degradation behaviors of spherical cellulose nanocrystals with
sulfate groups. Polymer 48: 3486-3493.
Wik, V. M. et al., 2011, Castor Oil-based Polyurethanes Containing Cellulose Nanocrystals.
Polymer Engineering and Science 51: 1389-1396.
Xu, Q. X. et al., 2008, A novel amphotropic polymer based on cellulose nanocrystals grafted
with azo polymers. European Polymer Journal 44: 2830-2837.
Yu, H. Y. et al., 2012, Simultaneous improvement of mechanical properties and thermal stability
of bacterial polyester by cellulose nanocrystals. Carbohydrate Polymers 89: 971-978.
Zhou, C. J. et al., 2011, Electrospun Polyethylene Oxide/Cellulose Nanocrystal Composite
Nanofibrous Mats with Homogeneous and Heterogeneous Microstructures. Biomacromolecules
12: 2617-2625.
Zhou, C. J. et al., 2012, UV-initiated crosslinking of electrospun poly(ethylene oxide)
nanofibers with pentaerythritol triacrylate: Effect of irradiation time and incorporated cellulose
nanocrystals. Carbohydrate Polymers 87: 1779-1786.
Zimmermann, T. et al., 2004, Cellulose Fibrils for Polymer Reinforcement. Advanced
Engineering Materials 6: 754-761.
Zoppe, J. O. et al., 2009, Reinforcing Poly(epsilon-caprolactone) Nanofibers with Cellulose
Nanocrystals. Acs Applied Materials & Interfaces 1: 1996-2004.
Page 36
PhD Dissertation of Fei LI 2 AIM of STUDY
27
2 AIM OF STUDY
Cellulose as the most abundant natural polymer in biosphere has received more and more
attention on its sustainability, renewability, and new possible functionalities, Furthermore,
nowadays conventional packaging materials cannot meet the increasing demands for full
sustainability and performance; new materials therefore are discovered, synthesized, and
developed for varieties of applications in different fields globally by a number of funded
research groups and companies.
Food packaging materials is one of the largest products we are using in daily life, but most of
conventional materials are still based on fossil and un-renewable resources. In this PhD project,
we propose to use cellulose nanocrystals (CNs) in combination with current food packaging
materials in order to improve performance, especially barrier, mechanical, and anti-fog
properties. The aim of this study is to use green material, CNs, as coatings of conventional
plastic films, to promote the sustainability of food packaging materials, while keeping or
improving different properties.
Page 37
PhD Dissertation of Fei LI 3 RESULTS AND DISCUSSION TOPIC 1
28
3 RESULTS AND DISCUSSION
3.1 Topic/theme 1: The process, structure, morphology of different-form cellulose
nanocrystals (CNs)
Introduction
The acidic hydrolysis methods (Araki et al., 1998; Beck-Candanedo et al., 2005; Bondeson et
al., 2006; de Souza Lima & Borsali, 2002; Dong et al., 1998; Elazzouzi-Hafraoui et al., 2007;
Favier et al., 1995; Håkansson & Ahlgren, 2005; Marchessault et al., 1961; Nickerson & Habrle,
1947; Roman & Winter, 2004) were commonly used for extracting varieties of CNs from
sources whose morphologies are characterized mainly by electronic microscopy. The
concentrated acid firstly attacks and hydrolyzes the hemi- and amorphous (defects) parts of
native cellulose. After the hydrolysis, the high crystallinity regions remain intact (Anglès &
Dufresne, 2001) and the final products show rod-like nanocrystals with different morphologies
and aspect ratio due to the source of native cellulose, including cotton (Dong et al., 1998), wood
pulp (Elazzouzi-Hafraoui et al., 2007), ramie (Habibi et al., 2008), tunicate (Elazzouzi-Hafraoui
et al., 2007), Valonia (Imai et al., 1998), bacterial cellulose (Grunert & Winter, 2002) and so on.
In fact, acidic hydrolysis of native cellulose induces a rapid reduction of the degree of
polymerizatio, which is correlated with crystals sized of the original cellulose chains
(Håkansson & Ahlgren, 2005).
The basic chemical structures of CNs are generally determined by Fourier transform infrared
spectroscopy (FTIR) (de Mesquita et al., 2010). From the peaks of FTIR spectra, the typical
functional groups could be confirmed efficiently and easily. Moreover, the crystallinity and
crystal structures could be detected by X-ray diffraction (XRD) (Eichhorn et al., 2004), nuclear
magnetic resonance NMR (Bergenstrahle et al., 2008; Koch et al., 2000; Witter et al., 2006),
Raman spectroscopy (Šturcová et al., 2005), and neutron crystallography (Nishiyama et al.,
2008). These data combined with experimental measurements could be helpful to establish or
validate crystal structure models or molecular simulation. At a minimum, these models are
made for the axial length of the crystalline cellulose unit cell, often referred to in the literature
as the c-spacing. Besides the cellulose crystal structure, the grafted groups from acidic
hydrolysis or chemical modifications which always occur on the surface due to intact highly
ordered CNs, are determined by FTIR (Habibi et al., 2008) or X-ray photoelectron spectroscopy
(XPS) (Yang et al., 2011). The resolution of XPS is much higher than FTIR and is able to scan
only a few nano meters on the surface of samples, which is quite suitable for ultrathin
Page 38
PhD Dissertation of Fei LI 3 RESULTS AND DISCUSSION TOPIC 1
29
deposition.
The geometrical dimensions (length, L, and diameter, d) of CNs vary due to the different
sources of the raw material and the hydrolytic conditions. Such variations are partially ascribed
to the diffusion-controlled nature of the acid hydrolysis. Their morphologies are usually
investigated by microscopy (TEM, AFM, E-SEM, (Miller & Donald, 2003) etc.) or light
scattering techniques, including small angle neutron scattering (SANS) (Šturcová et al., 2005),
polarized and depolarized dynamic light scattering (DLS, DDLS) (De Souza Lima et al., 2002).
TEM images of CNs typically show aggregation of the particles, mainly due to the drying step
for the preparation of the specimens after negative staining. Besides aggregation, additional
instrumental artifacts usually lead to an overestimation of CNs dimensions (Elazzouzi-Hafraoui
et al., 2007) therefore, it is suggested the use of TEM in cryogenic mode (cryo-TEM) to prevent
aggregation. Atomic force microscopy (AFM) has been widely used to provide surface
topography of CNs (Hanley et al., 1997; Hanley et al., 1992; Kvien et al., 2005; Miller &
Donald, 2003). But sometimes AFM topography may show different profiles compared with
TEM imagines, which are attributed to substrate shape perturbations induced by AFM tip and
tip-broadening effects.
Page 39
PhD Dissertation of Fei LI 3 RESULTS AND DISCUSSION TOPIC 1
30
3.2 Materials and methods 1
3.2.1 CNs extraction process
Whatman No. 1 filter paper (98% cotton, pore size11 µm) or cotton linter was milled by lab
mill into small pieces. The milled cotton was added to a preheated solution of 64% w/w sulfuric
acid (ratio of fiber and acid 1 : 17.5 <g/mL>) and hydrolysis proceeded under vigorous stirring
at 45 °C for 45 min. To quench the reaction, the reaction mixture was diluted with 10
times-volume deionized water (18 MΩ cm, Millipore Milli-Q Purification System) and allowed
to settle for 2 h. In order to concentrate the cellulose and remove excess acid and water, the
suspension was centrifuged at 5000 rpm for 20 min. The pellet that precipitated was repeatedly
rinsed and centrifuged with deionized water until the supernatant became turbid (after the 3rd
time centrifugation).The next step was to further remove the excess sulfuric acid by dialysis.
Before used, the dialysis tubes should be boiled in deionized water for 3 h. Further purification
was then done by dialysis against deionized water until the effluent remained at neutral pH
(Molecular weight cut-off, MWCO 12 000 and higher). The suspension was sonicated (UP400S
400 W, hielscher Co., Germany) repeatedly (0.7 cycles of 15 min at 70% output) to create
cellulose crystals of colloidal dimensions. During the ultrasonic treatment, the suspension was
cooled with an ice water bath to avoid overheating, and the sonication process was performed in
a plastic beaker to avoid possible ion release from glass containers. Mixed-bed research grade
ion-exchange resin (DowexMarathonMR-3, Sigma-Aldrich) was added to the cellulose
suspension for 24 h to complex any stray ions and was then removed by filtering through
ashless filter paper (Muktell grade GF/C, 1.2 μm). Finally, the suspension was filtered under
vacuum with a Whatman glass microfiber filter (grade GF/F, 0.7 μm) to remove sonicater tip
contamination and largest cellulose-fiber agglomerates. The cellulose content of the resulting
aqueous suspension was determined by drying several samples (1 mL) at 105 °C for 15 min
intervals (to avoid decomposition or burning) until weight constancy, giving a cellulose
concentration of 1 % w/w and a yield of ~50%.
3.2.2 Freeze-dried powder
Firstly, according to US patent (US 005629055A), the pH value of 1% CNs dispersion was
adjusted to ~7 by 1M NaOH(aq) in order to gain fully charged CNs. Secondly, the dispersion
was frozen at the -18 °C for overnight and then moved it to freeze dryer (LIO-10P). Finally, the
freeze-dried power could be obtained and stored in tightly close bottle for conservation under
dry conditions.
3.2.3 CNs gel
The CNs dispersion was prepared from freeze-dried powder by ultrasonication (0.7 cycle of 5
min at 70% output). When the CNs dispersion concentration is above than 3.5% (w/w), the
Page 40
PhD Dissertation of Fei LI 3 RESULTS AND DISCUSSION TOPIC 1
31
dispersion converted into gel status.
Characterization
3.2.4 Fourier transform infrared spectroscopy (FTIR)
FTIR spectra were recorded using a Perkin Elmer instrument (Sprectrum 100) equipped with an
ATR. Spectra were recorded using a spectral width ranging from 650 to 4000 cm-1
, with 4 cm-1
resolution and an accumulation of 16 scans.
3.2.5 Solid-state nuclear magnetic resonance (NMR) spectroscopy
All NMR spectra were acquired at room temperature on a Bruker AVANCE-600 spectrometer
(Bruker Spectrospin Gmbh, Rheinstetten, Germany), equipped with a 4 mm broad-band
CP-MAS probe for solid state measurements. About 100 mg of cellulose sample were directly
pressed into a 4 mm ZrO2 rotor without further treatment. 13
C spectra were acquired at 150.9
MHz using Cross Polarization (CP) and Magic Angle Spinning (MAS) at 6-10 KHz (Pines et al.,
1973). Proton decoupling was achieved with GARP-based composite pulse. Standard
acquisition parameters were as follows: Spectral width: 75.7 KHz; acquisition time: 3.4 ms;
relaxation delay: 2s (fast acquisition conditions); contact time for Cross Polarization: 1 ms;
number of scans: 7000-24000. The contact time was optimised by systematic variation of the
corresponding pulse within the 0.3-3 ms range. Adamantane was used as external chemical shift
reference.
3.2.6 XPS (X-ray photoelectron spectroscopy)
XPS scans were acquired with a Phoibos 150 hemispherical analyzer at normal emission. X-ray
excitation was provided by a twin anode X-ray source operated at 200 W. Mg Kα radiation
(photon energy: 1253.6 eV) was used. The wide scans were acquired with a pass energy of 50
eV, while detailed scans were acquired with a pass energy of 25 eV.
3.2.7 Transmission electronic microscopy (TEM)
Drops of aqueous dispersions of CNs (0.05% w/v) were deposited on carbon-coated electron
microscope grids, negatively stained with uranyl acetate and allowed to dry. The samples were
analyzed with a Hitachi Jeol-10084 transmission electron microscope (TEM) operated at an
accelerating voltage of 80 kV.
3.2.8 Scanning electronic microscopy (SEM)
(1) Field emission SEM (FE-SEM) observation of the film cross-sections was carried out with a
Zeiss Σigma field-emission microscope at 5 kV. The samples subjected to the SEM observation
were pre-coated with gold using a Polaron E5100 Coater at 18 mA for 20 s.
Page 41
PhD Dissertation of Fei LI 3 RESULTS AND DISCUSSION TOPIC 1
32
(2) Environmental SEM (E-SEM) analysis was performed on freeze-dried CNs samples at10 kV
with Evo 50 EP Instrumentation (Zeiss, Jena, Germany).
3.2.9 Atomic force microscopy (AFM)
An atomic force microscope (AFM, AlphaSNOM, WITec GmbH, Germany) was employed
both to systematically study the thickness of the deposited multilayers and to analyze their
morphology. For thickness measurements, the LbL coating on glass slides was gently scratched
in order to expose part of the glass substrate and thus measure the thickness of the coating.
Topography images were acquired with soft tapping mode at low oscillation amplitudes,
stabilized by an amplitude-modulation feedback system based on the optical lever deflection
method. Standard AFM Si probes have been used.
3.2.10 Size distribution
1% CNs dispersion was scanned by laser diffraction particle size analyzer (Mastersizer 2000,
Malvern Instruments) wavelength from 0.020 to 2000 µm.
Page 42
PhD Dissertation of Fei LI 3 RESULTS AND DISCUSSION TOPIC 1
33
3.3 Results and discussion 1
3.3.1 Modified process and different forms of CNs
As mentioned in the introduction, the process of producing CNs leads to a slightly chemical
modification of cellulose by acidic hydrolysis (Dong et al., 1998), and the detailed steps of
process are as follows: milling, hydrolysis, centrifugation, dialysis, ultrasonication, ion
exchange, and filtering, and freeze drying for producing CNs powder. The yield of the process
is ca. 55%, in our case, using cotton linter as raw material. The dialysis step is the most
time-consuming, we therefore skip this step and directly neutralize CNs suspension by 5M
NaOH (aq) till pH ~7. The neutralization process is relatively long, since the suspension is a
dispersion of high molecular weight of cellulose. If compared with dialysis process (3-5 days),
neutralization is a much easier to handle and less time-consuming way. Then eliminating the
excess ions from dispersion is through ion exchange step. Through this slightly modified
preparation CNs process, the finally obtained product was similar with before from eye
inspection. The ~1% dispersion is obtained directly after filtration step, which is colloid and its
color ivory white. To improve the storability, the powder-form CNs was prepared by
lyophilization. The specific concentrations of CNs dispersion could be prepared from
re-dispersing CNs powder into distilled water through ultrasonication till no aggregations
appeared and the light could pass the dispersion (colloid). If the dispersion concentration is
higher than ~5%, CNs become to gel state after settling down due to the strong hydrogen bonds
between cellulose molecular chains and inter molecular (Beck et al., 2012). The 1% dispersion,
freeze-dried powder, and gel of CNs are presented in Figure 5.
Figure 5 1% dispersion (a), freeze-dried powder (b), and 3.5% CNs gel (c), from left to right.
The yellow parts caused by the light of the lamps.
The final CNs products are grafted with a few sulfate ester groups (-O-SO3-) from sulfuric acid.
The sulfate ester groups bring negative charges on the surface of CNs, which result in the
repulsion between charged chains thereby CNs can be dispersed into water or other polar
solvents (Viet et al., 2007). As known, the charge density of polymer chains could be adjusted
by changing the pH values of solutions or dispersions. For CNs dispersion, when pH > 7, the
repulsions between chains are stronger and the molecular chains might be rigid. On the other
hand, when pH < 7, repulsions are weaker and the molecular chains might be loose. It is noticed
Page 43
PhD Dissertation of Fei LI 3 RESULTS AND DISCUSSION TOPIC 1
34
that CNs precipitate under pH<1 due to the associations between sulfate ester groups (-O-SO3-)
and hydrogen ion (H+) from acidic condition which lead to be non-charged CNs. Based on
above principles, flexible CNs films of pH 2 and pH 7 were casted from 1% dispersion in
polyethylene petri disk under room temperature and presented different transparency, which are
shown in Figure 6. Thickness of the films is 20-30 µm and the transparency of pH 2 and pH 7
films are 88% and 63% at 550 nm, respectively.
Figure 6 pH 7 CNs cast films (a) and (c), pH 2 CNs cast films (b) and (d). Scale 1.5 cm.
3.3.2 Structure of CNs
3.3.2.1 Fourier transform infrared spectroscopy (FTIR)
The structures of raw material (cotton linter) and final product (freeze-dried CNs) were
determined by FT-IR, shown in Figure 7. In raw material, pure CNs film with and without
dialysis, the band at 3338 cm-1
is attributed to the O-H stretching vibration. The bands at 2899
and 1428 cm-1
are characteristic of C-H stretching and bending of -CH2 groups, respectively,
while the peaks at 1162 and 1057 cm-1
are ascribed to the saccharide structure (Li et al., 2009).
The band at 1135 cm-1
is assigned to the SO42-
which origins from sulfuric acid. This intensive
band might be due to the skipping dialysis step, which could remove most of the substances
(Mw > 20,000 Dalton, Sigma) including huge amount of SO42-
. Even though the ion exchange
step was carried out in the modified process, it is yet not sufficient to thoroughly remove all of
SO42-
. The possible solution could be increasing the amount of ion exchange resin and the
adequate quantity should be optimized in the future work. The sulfate salt could not have
dramatic influence to CNs nano filler usage but could change the optical properties (Nogi et al.,
Page 44
PhD Dissertation of Fei LI 3 RESULTS AND DISCUSSION TOPIC 1
35
2009; Yano et al., 2005), the ion exchange step could therefore be dependent on the CNs
applications. The sulfate ester groups in dialyzed samples were not detected because the number
of these groups was very small. The freeze-dried powders from two processes have the highly
similar re-dispersed properties into water. The 1% dispersions were prepared from two varieties
of CNs under the same condition of ultrasonic treatment (70% cycle, 70% amplify, and 3 min),
and presented in Figure 8.
Figure 7 FTIR of the raw material cotton linters (I), freeze-dried CNs (II), and freeze-dried CNs
(III) without dialysis
Figure 8 1% dispersion of CNs from original (a) and modified process (b) (c).
4000 3500 3000 2500 2000 1500 1000 500
Tra
ns
mit
tan
ce
%
Wavenumber / cm-1
(III)
(I)
(II)
33382902
1060
1429
1162
1135
Page 45
PhD Dissertation of Fei LI 3 RESULTS AND DISCUSSION TOPIC 1
36
From Figure 7, we could conclude that there are no significant differences before and after the
CNs producing process, which indicates that no strongly chemical modifications occurred.
Producing CNs by acidic hydrolysis is therefore only an extraction process from raw material
without strongly chemical modifications. Also, some literature reported that nano cellulose are
relatively safe for human beings (Kovacs et al., 2010), which might be widely considered and
used as safe food contact material in future.
3.3.2.2 Nuclear magnetic resonance (NMR)
Figure 9 NMR spectra of CNs
13
C-NMR spectrum of CNs freeze-dried powder is shown in Figure 9. The spectrum presented
the characteristic signals of native cellulose (Atalla & VanderHart, 1999). The anomeric carbon,
C-1, appears furthest downfield, at around 105 ppm. Characteristic signals of C-2, C-3 and C-5
carbons are shown between 70 and 78 ppm. The signal between 87 and 90 ppm corresponds to
C-4 of the highly ordered cellulose crystallite, whereas the broader upfield signals, between 79
and 86 ppm, were assigned to the C-4 of disordered cellulose, as well as to the less ordered
cellulose chains of the crystallite surfaces (Larsson, 2003). Also, the signal centered at 64.5 ppm
is attributed to C-6 of ordered cellulose chains and the slight shoulder, between 60 and 63 ppm,
is attributed to C-6 of cellulose in the amorphous and disordered component of CNs. In
particular, the C-4 region was used for this analysis, the signals from ordered and less ordered
regions being well separated. Larsson et al. used spectral fitting for the C-4 region of cotton
cellulose and assigned three Lorentzian‘s lineshapes for the signals from celluloses Iα, I(α+β), and
Page 46
PhD Dissertation of Fei LI 3 RESULTS AND DISCUSSION TOPIC 1
37
Iβ and four Gaussian‘s lineshapes for the signals from para-crystalline cellulose, inaccessible
fibril surfaces, and two accessible fibril surfaces (Larsson, 2003). The degree of cellulose
crystallinity, in the case of CNs from cotton linter, was determined using the areas of the
crystalline and amorphous C-4 signals according to Larsson‘s fitting (Habibi et al., 2009;
Larsson, 2003). The results indicated that the degree of crystallinity of CNs from cotton is
around 85%.
3.3.2.3 XPS (X-ray photoelectron spectroscopy)
Figure 10 XPS wide scan for CNs deposition on PET
The XPS spectrum is presented in Figure 10 and CNs did show additional peaks related to
fluorine and Na Auger signals, and did not show a nitrogen peak. Table 1 lists all the elements
present in the analyzed samples and their atomic concentration (xi), assuming homogeneous
samples. Raw intensities (Ai) have been corrected according to the following formula:
𝑥𝑖 =𝐴𝑖/𝑠𝑖
∑ 𝐴𝑛/𝑠𝑛𝑛
By making use of tabulated relative sensitivity factors (si)a.
a Photoelectron cross sections from report (Reilman et al., 1976) (with θ = 60°), transmission
function from literature (Hemminger et al., 1990) (with n = 0.5), attenuation length from related
literature (Powell, 1988) (with p = 0.7414).
Page 47
PhD Dissertation of Fei LI 3 RESULTS AND DISCUSSION TOPIC 1
38
Table 1 Concentration of atomic species (in terms of number of atoms) for the CNs samples
O [%] C [%] N [%] S [%] F [%]
39.1±0.2 59.4±0.4 - 0.6±0.1 0.8±0.1
From Table 1, it is shown additional peaks related to fluorine without a nitrogen peak. Fluorine
did not come from improper handling of the samples during XPS analysis, probably from the
impurity of raw material or sulfuric acid. The oxygen signal shows that about 90% of the
oxygen is related to C–O bonds, while only a smaller amount (<10%) is related to O–H and
C=O bonds, likely due to the presence of acidic groups, and thus to the presence of oxidized
cellulose species.
(1) Carbon peaks
Figure 11 Carbon peaks of XPS
The carbon peaks were presented in Figure 11 and decomposed into a sum of
Gaussian/Lorentzian lineshapes with the same FWHM. The lineashpe used to model the carbon
peaks was a weighted product of a Gaussian (~30 %) and a Lorentzian (~70%) lineshape. Peak
C1 is associated to photoemission from C 1s orbitals in carbon atoms with C-C bonds and its
position was set to -285.0 eV (Beamson & Briggs, 1992). Peak C2 is associated to C-O bonds,
Page 48
PhD Dissertation of Fei LI 3 RESULTS AND DISCUSSION TOPIC 1
39
peak C3 is associated to O-C-O or C=O bonds and peak C4 to O=C-O bonds. The chemical shift
between peak C1 and C2 is 1.7±0.1 eV (ΔE12) in good agreement with the literature (Fras et al.,
2005), while ΔE13 and ΔE14 were fixed to 3.1 and 4.4 eV, according to reference (Fras et al.,
2005). Table 2 lists the results of the C 1s peak decomposition:
Table 2 Carbon signal features related to different bonds
C-C [C1%] C-O [C2%] O-C-O/C=O [C3%] O=C-O [C4%]
10.9±0.2 69.9±0.4 16.7±0.3 2.5±0.2
(2) Oxygen peaks
Figure 12 Oxygen peaks of XPS
The oxygen peaks were presented in Figure 12 decomposed into a sum of Gaussian/Lorentzian
lineshapes with the same FWHM. The lineashpe used to model the oxygen peaks was a
weighted product of a Gaussian (70 %) and a Lorentzian (30 %) lineshape. The most intense
peak, peakO2, is associated to photoemission form O 1s orbitals in oxygen atoms bonded to one
carbon atom (C-O bonds). The binding energy of O2 electrons is -532.9 eV, in good agreement
with the value reported in the literature (Shen et al., 2004). Peak O1 is associated to oxygen
atoms in carbonyl groups (C=O bonds) (Beamson & Briggs, 1992), while peak O3 is associated
to free O-H groups (Beamson & Briggs, 1992; Marchessault et al., 1961; Shen et al., 2004). The
Page 49
PhD Dissertation of Fei LI 3 RESULTS AND DISCUSSION TOPIC 1
40
chemical shifts between peak O2 and the side peaks O1 and O3 were not fixed, and the
optimized values are ΔE12=1.9 ±0.2 eV and ΔE23=2.2±0.1 eV. These values are somewhat
higher than those found in the literature (ΔE12=1.6 eV and ΔE23=1.5 eV) (Da Róz et al., 2010).
Table 3 lists the results of the O 1s peak decomposition:
Table 3 Oxygen signal features related to different bonds
C=O [O1%] C-O [O2%] O-H [O3%]
3.2±0.2 93.7±0.5 3.1±0.3
Figure 13 Cellulose monomer
The Figure 13 represents the cellulose monomer, made by two units with molecular formula
(C6H10O5)n. Carbons atoms are present in two different configurations, corresponding to one
(peak C2) and two bonds (peak C3) with oxygen with an intensity ratio of 5 to 1. The oxygen to
carbon ratio should be 0.83 (Fras et al., 2005). According to Table 1, the O/C ratio in the CNs
sample is 0.65 (0.63 from the detailed scans analysis, see Table 4 below), smaller than expected.
Furthermore, a considerable amount of C1 carbons (i.e. carbons without oxygen neighbors) is
observed, which should not be present in pure cellulose. If we neglect the signal from C1 peak,
the oxygen to carbon ratio equals 0.73, while the C3/C2 ratio 0.24, in good agreement with the
results obtained from the XPS analysis of spin coated cellulose fibers (see reference (Da Róz et
al., 2010)for further details).
Table 4 the ratios between the peak intensities, determined from the detailed scans and corrected
by the tabulated relative sensitivity factors.
O/CTotal O/(C2+C3)a C3/C2
a
0.63 (0.83) 0.73 0.24 (0.2)
a Number within brackets are the expected values from bond counting arguments.
According to references (Fras et al., 2005; Johansson et al., 1999), the total amount of surface
contamination on cellulose fibers due to exposure to ambient atmosphere is 2-4% of the total
amount of carbon. The signal from C1 peak thus cannot be attributed to atmospheric
contamination. XPS analysis of cotton cellulose fibers (Fras et al., 2005) attribute the observed
C1 peak to laminar layer of waxes, proteins and pectin, which conceal the cellulose backbone.
Page 50
PhD Dissertation of Fei LI 3 RESULTS AND DISCUSSION TOPIC 1
41
Reference (Fras et al., 2005) reports on the formation of acidic groups (O-C=O) upon cellulose
fibers oxidation; these groups can, in principle, explain the existence of peak C4. The
determination of the exact concentration of acidic groups from the C4 peak intensity is however
not very accurate, since slight peak asymmetries in peak C3 could, in principles, almost
completely mask the presence of this side peak.
The oxygen peak of pure cellulose is expected to be composed only of O2 species. The shoulder
at lower (absolute) binding energy can be linked to the presence of acidic groups, and thus to
the presence of oxidized cellulose species. The quantitative estimation of O1 and O3 signal is
affected by some uncertainty because of the vicinity of the two peaks to peak O2 and their low
intensity.
The treatment with sulfuric acid causes the grafting of the CNs with sulfate groups (i.e. the
replacement of an O-H with an O-SO3H group) (de Mesquita et al., 2010). This explains the
origin of the sulfur signal which has been detected in the wide scans. According to Table 1, the
oxygen to sulfur ratio is 65:1, which means approximately 8 sulfate groups every 100 cellulose
monomers.
3.3.2.4 Morphology and dimensions of CNs by TEM, SEM, AFM and mastersizer
(1) TEM
Figure 14 TEM of CNs
Page 51
PhD Dissertation of Fei LI 3 RESULTS AND DISCUSSION TOPIC 1
42
The rod-like CNs produced from sulfuric acid hydrolysis of cotton linters were characterized by
TEM as shown in Figure 14 Observations of the CNs obtained from diluted suspensions
(approximate 0.05% w/w) show individual nanocrystals and some aggregates. The appearance
of aggregated elementary crystallites in TEM images is expected due to the high specific area
and strong hydrogen bonds established between the CNs. From several TEM images, the mean
values of the length (L) and diameter (D) of the isolated CNs were determined to be 145±25 nm
and 6±1.5 nm, respectively, giving an aspect ratio (L/D) of around 24. These dimensions agreed
well with the literature values reported for CNs (Dufresne, 2008). However, a wide distribution
of CNs size, especially the length, is inevitable owing to the acid diffusion-controlled nature of
the hydrolysis (Podsiadlo et al., 2005).
(2) SEM
Figure 15 Freeze-dried CNs powder observed by FE-SEM (a) and E-SEM (b), CNs casting film
(c), and CNs deposition on PET observed by FE-SEM (d).
The high-resolution FE-SEM or E-SEM figures of CNs freeze-dried powder, casting film, and
deposition are presented in Figure 15. The image clearly shows highly dense packing and
uniform nanofibers likely due to the hydrogen bonds formed during the drying process. The
dense packing of the CNs has been previously described in other reports (Podsiadlo et al., 2005).
Page 52
PhD Dissertation of Fei LI 3 RESULTS AND DISCUSSION TOPIC 1
43
Meanwhile, the morphologies of CNs network present the porous surfaces, which probably will
have some influences on the final properties, such as gas barrier. It was reported that different
porosities, caused by diverse original cellulose sources, led to significantly distinct gas barrier
properties (Fukuzumi et al., 2011). The SEM figures could be only used to estimate the profile
and dimension of CNs, since the CNs real morphology is covered by gold particles which is
used to make the CNs more conductive for better resolution observations.
(3) AFM
Figure 16 High-resolution AFM of CNs deposition on OPA substrate
The bundles of CNs are shown in Figure 16. The CNs are clearly presented but majority of
them are swelling and aggregating each other, since the deposition origins from 3.5% (w/w)
CNs dispersion and then was dried by air dryer. The air drying step results in the aggregating
via strong hydrogen bonds and swelling phenomena was caused by the small water content in
CNs deposition. This AFM figure might not therefore indicate the exact dimension of CNs, but
it could reveal the profile (shape) of CNs. In this case, the shape of CNs is clearly rod like,
highly agreement with other reports (Edgar & Gray, 2003; Lefebvre & Gray, 2005).
Page 53
PhD Dissertation of Fei LI 3 RESULTS AND DISCUSSION TOPIC 1
44
(4) CNs size distribution
Figure 17 Particle size distribution of 1% CNs dispersion
The particle size distribution of 1% CNs dispersion is shown in Figure 17. It indicates that the
range of the CNs length is from 90 to 160 nm, which is similar with the most precise results
obtained from TEM and other literatures (Habibi et al., 2010). Compared with TEM-CNs
dimension, the one from particle size distribution has larger range. It is reasonable that larger
ranges are due to different forms of CNs. Since the working range of this instrument
(Mastersizer 2000) is from 0.020 to 2000.00 µm, the average of CNs diameter (~6 nm), which
is beyond, the work range could not be obtained from Figure 17. The results disclose that the
acidic hydrolysis process is highly compatible and effective to extract relatively uniform CNs
from cotton linter, because this measurement was carried out for size distribution of dispersion
not only limited to local dimensions.
The dimension of CNs was determined by different advanced techniques, including TEM,
FE-/E-SEM, AFM, and particle size distributor, respectively. In our case, the most efficient and
illustrative method is TEM, since the dimension (diameter and length) are easily obtained from
high resolution figures. But for TEM, the limitations are related with small observation area
(highly locally dependent) and vacuum working condition which sometimes leads to
agglomeration and change the original morphology of samples. For example, the CNs are
strongly aggregated with each other under the vacuum due to the hydrogen bonds (Habibi et al.,
2010). As for the SEM, all of observations could be carried out under vacuum and it is more
suitable for the surface morphology of samples at relatively larger scale. FE-SEM could provide
high-resolution images even at small scale but the conductive samples and vacuum condition
Page 54
PhD Dissertation of Fei LI 3 RESULTS AND DISCUSSION TOPIC 1
45
are required, while E-SEM could observe samples under ambient condition and no requirements
for samples. For AFM, it is a very powerful tool for observations and no special requirements
for samples and testing conditions. Through AFM, the dimension and morphology could be
gained easily and efficiently even at larger scale. The dimension for AFM from figure is not as
accurate as the one from TEM and particle size distributor, since the CNs were aggregated with
each other in the deposition and influenced by surroundings, such as temperature, humidity and
so on. To obtain precise dimension of CNs, it is suggested that relatively lower concentration of
CNs dispersion should be prepared for TEM and particle size distributor.
Page 55
PhD Dissertation of Fei LI 3 RESULTS AND DISCUSSION TOPIC 1
46
3.4 Conclusions 1
To better understand the structure and status of CNs itself or in other polymers, we used
different powerful tools for qualification and quantification. Firstly, we have obtained the
relatively precise dimensions of CNs and observe its re-dispersability in different solvents, in
our case in water. In the following, we could gain the information of the CNs status in other
polymers in order to interpret the final performance efficiently. Finally, if we observe individual
crystals, TEM is the most suitable tool; if we estimate the roughness, AFM is the most efficient
tool; if we generally learn the morphology in different scale, the SEM is the best choice. As for
the size distribution, functional groups, and interactions between the atoms of CNs, the particle
size distributor, FTIR, XPS, and NMR are used for determinations, respectively.
Page 56
PhD Dissertation of Fei LI 3 RESULTS AND DISCUSSION TOPIC 1
47
3.5 References
Anglès, M. N., Dufresne, A., 2001, Plasticized Starch/Tunicin Whiskers Nanocomposite
Materials. 2. Mechanical Behavior. Macromolecules 34: 2921-2931.
Araki, J. et al., 1998, Flow properties of microcrystalline cellulose suspension prepared by acid
treatment of native cellulose. Colloids and Surfaces A: Physicochemical and Engineering
Aspects 142: 75-82.
Atalla, R. H., VanderHart, D. L., 1999, The role of solid state 13
C NMR spectroscopy in studies
of the nature of native celluloses. Solid State Nuclear Magnetic Resonance 15: 1-19.
Beamson, G., Briggs, D. High resolution XPS of organic polymers: the Scienta ESCA300
database. Chichester [England]; New York: Wiley, 1992, pp. 120-130.
Beck-Candanedo, S. et al., 2005, Effect of Reaction Conditions on the Properties and Behavior
of Wood Cellulose Nanocrystal Suspensions. Biomacromolecules 6: 1048-1054.
Beck, S. et al., 2012, Dispersibility in water of dried nanocrystalline cellulose.
Biomacromolecules 13: 1486-1494.
Bergenstrahle, M. et al., 2008, Dynamics of Cellulose−Water Interfaces: NMR Spin−Lattice
Relaxation Times Calculated from Atomistic Computer Simulations. The Journal of Physical
Chemistry B 112: 2590-2595.
Bondeson, D. et al., 2006, Optimization of the isolation of nanocrystals from microcrystalline
cellulose by acid hydrolysis. Cellulose 13: 171-180.
Da Róz, A. L. et al., 2010, Adsorption of chitosan on spin-coated cellulose films. Carbohydrate
Polymers 80: 65-70.
de Mesquita, J. P. et al., 2010, Biobased Nanocomposites from Layer-by-Layer Assembly of
Cellulose Nanowhiskers with Chitosan. Biomacromolecules 11: 473-480.
de Souza Lima, M. M., Borsali, R., 2002, Static and Dynamic Light Scattering from
Polyelectrolyte Microcrystal Cellulose. Langmuir 18: 992-996.
de Souza Lima, M. M. et al., 2002, Translational and Rotational Dynamics of Rodlike Cellulose
Whiskers. Langmuir 19: 24-29.
Dong, X. M. et al., 1998, Effect of microcrystallite preparation conditions on the formation of
colloid crystals of cellulose. Cellulose 5: 19-32.
Dufresne, A., 2008, Polysaccharide nano crystal reinforced nanocomposites. Canadian Journal
of Chemistry 86: 484-494.
Edgar, C. D., Gray, D. G., 2003, Smooth model cellulose I surfaces from nanocrystal
suspensions. Cellulose 10: 299-306.
Eichhorn, S. J. et al., 2004, Modeling Crystal and Molecular Deformation in Regenerated
Cellulose Fibers. Biomacromolecules 6: 507-513.
Elazzouzi-Hafraoui, S. et al., 2007, The Shape and Size Distribution of Crystalline
Nanoparticles Prepared by Acid Hydrolysis of Native Cellulose. Biomacromolecules 9: 57-65.
Page 57
PhD Dissertation of Fei LI 3 RESULTS AND DISCUSSION TOPIC 1
48
Favier, V. et al., 1995, Polymer Nanocomposites Reinforced by Cellulose Whiskers.
Macromolecules 28: 6365-6367.
Fras, L. et al., 2005, Analysis of the oxidation of cellulose fibres by titration and XPS. Colloids
and Surfaces A: Physicochemical and Engineering Aspects 260: 101-108.
Fukuzumi, H. et al., 2011, Pore Size Determination of TEMPO-Oxidized Cellulose Nanofibril
Films by Positron Annihilation Lifetime Spectroscopy. Biomacromolecules 12: 4057-4062.
Grunert, M., Winter, W. T., 2002, Nanocomposites of Cellulose Acetate Butyrate Reinforced
with Cellulose Nanocrystals. Journal of Polymers and the Environment 10: 27-30.
Håkansson, H., Ahlgren, P., 2005, Acid hydrolysis of some industrial pulps: effect of hydrolysis
conditions and raw material. Cellulose 12: 177-183.
Habibi, Y. et al., 2010, Cellulose Nanocrystals: Chemistry, Self-Assembly, and Applications.
Chemical Reviews 110: 3479-3500.
Habibi, Y. et al., 2008, Bionanocomposites based on poly([varepsilon]-caprolactone)-grafted
cellulose nanocrystals by ring-opening polymerization. Journal of Materials Chemistry 18:
5002-5010.
Habibi, Y. et al., 2009, Microfibrillated cellulose from the peel of prickly pear fruits. Food
Chemistry 115: 423-429.
Hanley, S. et al., 1997, Atomic force microscopy and transmission electron microscopy of
cellulose from Micrasterias denticulata; evidence for a chiral helical microfibril twist. Cellulose
4: 209-220.
Hanley, S. J. et al., 1992, Atomic force microscopy of cellulose microfibrils: comparison with
transmission electron microscopy. Polymer 33: 4639-4642.
Hemminger, C. S. et al., 1990, An empirical electron spectrometer transmission function for
applications in quantitative XPS. Surface and Interface Analysis 15: 323-327.
Imai, T. et al., 1998, Unidirectional processive action of cellobiohydrolase Cel7A on Valonia
cellulose microcrystals. FEBS Letters 432: 113-116.
Johansson, L.-S. et al., 1999, Evaluation of surface lignin on cellulose fibers with XPS. Applied
Surface Science 144–145: 92-95.
Koch, F.-T. et al., 2000, Calculation of solid-state 13
C NMR spectra of cellulose I α, I β and II
using a semi-empirical approach and molecular dynamics. Macromolecular Chemistry and
Physics 201: 1930-1939.
Kovacs, T. et al., 2010, An ecotoxicological characterization of nanocrystalline cellulose (NCC).
Nanotoxicology 4: 255-270.
Kvien, I. et al., 2005, Characterization of Cellulose Whiskers and Their Nanocomposites by
Atomic Force and Electron Microscopy. Biomacromolecules 6: 3160-3165.
Larsson, P. T. (2003). Interaction between Cellulose I and Hemicelluloses Studied by Spectral
Fitting of CP/MAS 13
C-NMR Spectra. Hemicelluloses: Science and Technology (Vol. 864, pp.
Page 58
PhD Dissertation of Fei LI 3 RESULTS AND DISCUSSION TOPIC 1
49
254-268): American Chemical Society.
Lefebvre, J., Gray, D. G., 2005, AFM of adsorbed polyelectrolytes on cellulose I surfaces
spin-coated on silicon wafers. Cellulose 12: 127-134.
Li, Q. et al., 2009, Structure and properties of the nanocomposite films of chitosan reinforced
with cellulose whiskers. Journal of Polymer Science Part B: Polymer Physics 47: 1069-1077.
Marchessault, R. H. et al., 1961, Some hydrodynamic properties of neutral suspensions of
cellulose crystallites as related to size and shape. Journal of Colloid Science 16: 327-344.
Miller, A. F., Donald, A. M., 2003, Imaging of Anisotropic Cellulose Suspensions Using
Environmental Scanning Electron Microscopy. Biomacromolecules 4: 510-517.
Nickerson, R. F., Habrle, J. A., 1947, Cellulose Intercrystalline Structure. Industrial &
Engineering Chemistry 39: 1507-1512.
Nishiyama, Y. et al., 2008, Neutron Crystallography, Molecular Dynamics, and Quantum
Mechanics Studies of the Nature of Hydrogen Bonding in Cellulose Iβ. Biomacromolecules 9:
3133-3140.
Nogi, M. et al., 2009, Optically Transparent Nanofiber Paper. Advanced Materials 21:
1595-1598.
Pines, A. et al., 1973, Proton-enhanced NMR of dilute spins in solids. The Journal of Chemical
Physics 59: 569-590.
Podsiadlo, P. et al., 2005, Molecularly Engineered Nanocomposites: Layer-by-Layer Assembly
of Cellulose Nanocrystals. Biomacromolecules 6: 2914-2918.
Powell, C. J., 1988, The quest for universal curves to describe the surface sensitivity of electron
spectroscopies. Journal of Electron Spectroscopy and Related Phenomena 47: 197-214.
Reilman, R. F. et al., 1976, Relative intensities in photoelectron spectroscopy of atoms and
molecules. Journal of Electron Spectroscopy and Related Phenomena 8: 389-394.
Roman, M., Winter, W. T., 2004, Effect of Sulfate Groups from Sulfuric Acid Hydrolysis on the
Thermal Degradation Behavior of Bacterial Cellulose. Biomacromolecules 5: 1671-1677.
Shen, G. et al., 2004, X-ray photoelectron spectroscopy and infrared spectroscopy study of
maleimide-activated supports for immobilization of oligodeoxyribonucleotides. Nucleic Acids
Research 32: 5973-5980.
Šturcová, A. et al., 2005, Elastic Modulus and Stress-Transfer Properties of Tunicate Cellulose
Whiskers. Biomacromolecules 6: 1055-1061.
Viet, D. et al., 2007, Dispersion of cellulose nanocrystals in polar organic solvents. Cellulose 14:
109-113.
Witter, R. et al., 2006, 13
C Chemical Shift Constrained Crystal Structure Refinement of
Cellulose Iα and Its Verification by NMR Anisotropy Experiments. Macromolecules 39:
6125-6132.
Yang, J. Z. et al., 2011, Biotemplated preparation of CdS nanoparticles/bacterial cellulose
Page 59
PhD Dissertation of Fei LI 3 RESULTS AND DISCUSSION TOPIC 1
50
hybrid nanofibers for photocatalysis application. Journal of Hazardous Materials 189: 377-383.
Yano, H. et al., 2005, Optically Transparent Composites Reinforced with Networks of Bacterial
Nanofibers. Advanced Materials 17: 153-155.
Page 60
PhD Dissertation of Fei LI 3 RESULTS AND DISCUSSION TOPIC 2
51
3.6 Topic/theme 2: Multi-functional green coating of cellulose nanocrystals (CNs) on
conventional films for food packaging applications
Introduction
Nowadays, the vast majority of flexible food packaging materials is constituted of oil-based
plastics whose resources are non-renewable, resulting in low sustainability. Considering the
issues, the interest in bio-based materials have been rising, such as poly lactic acid (PLA)
(Auras et al., 2004; Drumright et al., 2000; Lim et al., 2008; Vert et al., 1995), starch,(Avella et
al., 2005; Tharanathan, 2003) and so on. However, such materials are not yet widely applied
because of their inferior properties (Krikorian & Pochan, 2003; Ray et al., 2002, 2003) and high
cost, compared with conventional ones. Therefore, it is likely that there will be a long journey
for substituting bio-based materials for conventional plastics.
The use of plastic materials also poses a challenge in finding appropriate strategies to improve
their barrier properties. In current research, inorganic fillers, such as SiO2 (Creatore et al., 2002;
Erlat et al., 1999; Haas et al., 1999) or nano-clays (Ghasemi et al., 2012; Priolo et al., 2010;
Sánchez-Valdes et al., 2006; Svagan et al., 2012) are used for coatings or composites as oxygen
or water vapor barriers with inevitable disadvantages that include a tendency to crack,(Priolo et
al., 2010) and potential health risks (Lordan et al., 2011). Therefore, there is an increasing
tendency to at least partially replace conventional plastics with bio-based materials, for instance,
utilizing bio-coatings with the two-fold aim of improving the original plastic properties and
reducing the plastic use, thereby, increasing the sustainability. Bio-coatings can, therefore, be
considered as one of the suitable solutions for food packaging applications. Nevertheless, the
number of directly related bio-coating publications is still limited. Gelation (Farris et al., 2009),
or pullulan (Farris et al., 2012) have been recently reported as oxygen barriers on PET or OPP
plastic films. Isoga et al. (Kato et al., 2005) compared the oxygen barrier properties of 12
μm-thick PET films coated by TEMPO-oxidized microcrystalline cellulose, chitosan and starch,
whilst TEMPO-oxidized nano-fiber coatings have been demonstrated as an oxygen barrier on
PLA film (Fukuzumi et al., 2008). Besides cast coating, some research groups successfully
improved barrier properties of food packaging materials through layer-by-layer (LbL) assembly
(de Mesquita et al., 2010; Jang et al., 2008; Priolo et al., 2010; Svagan et al., 2012; Yang et al.,
2011b; Zhang & Sun, 2010). However, TEMPO-oxidized and LbL coating process might be
difficult to be applied at the industrial scale due to their safety, cost and process complexity.
In this part of the PhD thesis, we thoroughly investigate the physical, mechanical, and optical
properties of bio-coating made of cellulose nanocrystals (CNs), which can be obtained from the
Page 61
PhD Dissertation of Fei LI 3 RESULTS AND DISCUSSION TOPIC 2
52
most abundant natural polymer on earth. Besides the promising results that are discussed
throughout the paper, such material brings advantages also in terms of low weight, low cost,
and biodegradability. Over the last few years, CNs have been extracted from different original
sources by chemical, physical, enzymatic or a combination of them (Siro & Plackett, 2010).
However, physical and enzymatic processes imply high cost and high energy consumption,
respectively, hence we choose a chemical-hydrolysis method for their production from cotton
linter, whose thorough characterization has been the focus of the first part of this project, and
we deposit them on different conventional flexible food packaging materials to produce a
multi-functional coating. In particular, we use a water dispersion of CNs, with relatively low
concentration, deposited on polyethylene terephthalate (PET), oriented polypropylene (OPP),
oriented polyamide (OPA) and cellophane films. The morphology, coefficient of friction,
anti-fog, and oxygen and water vapor barrier properties of coated films were measured and
interpreted systematically.
Page 62
PhD Dissertation of Fei LI 3 RESULTS AND DISCUSSION TOPIC 2
53
3.7 Materials and methods 2
3.7.1 Materials.
Cotton linter was provided by S.S.C.C.P. (Milan, Italy), as the raw material to produce CNs.
Four different plastic substrates were coated and used for experiments: (1) poly(ethylene
terephthalate) (PET, 12.0±0.5 μm thickness, Radici Film, San Giorgio di Nogaro, Italy) , (2)
oriented polypropylene (OPP, 20± 0.5 μm thickness, San Giorgio di Nogaro, Italy), (3) oriented
polyamide (OPA, 12 ±0.5 μm thickness, San Giorgio di Nogaro, Italy), and cellophane (12 ± 0.5
μm thickness, San Giorgio di Nogaro, Italy).
3.7.2 CNs producing process.
As described in 3.1, the brief process of producing CNs is as follow. 1% Cellulose nanocrystals
(CNs) dispersion was produced from cotton linter using a procedure already established for
cotton from powdered filter paper (Dong et al., 1998). Briefly, milled cotton linter was
hydrolyzed by 64% (w/w) sulfuric acid with vigorous stirring at 45 °C for 45 minutes. The
reaction mixture was diluted with 10 times-volume deionized water (resistivity, 18.2 MΩ cm,
Millipore Milli-Q Purification System), settled for 2 hours, and then rinsed and centrifuged at
5000 rpm repeatedly until the supernatant became turbid. Further purification was then done by
dialysis against deionized water until the effluent remained at neutral pH (MWCO 12 000 and
higher). Sequentially, the suspension was sonicated (UP400S 400 W, Hielscher Co., Germany)
repeatedly (0.7 cycles of 5 min at 70% output) to create cellulose crystals of colloidal
dimensions. Finally, the suspension was filtered under vacuum with Muktell (grade GF/C, 1.2
μm pore diameter) and Whatman glass microfiber filter (grade GF/F, 0.7 μm pore diameter) to
remove contamination and big aggregations. The CNs content of the resulting aqueous
suspension was determined by drying several samples (1 ml) at 105 °C for 15 min intervals (to
avoid decomposition or burning) until weight constancy, giving a cellulose concentration of ~1 %
w/w and a yield of ~50%. To prepare a given concentration of CNs solution, the resulting CNs
dispersion was adjusted pH to ~7 by 1M NaOH(aq), freeze-dried and stored in tightly sealed
container under dry conditions for later analysis and experiments.
3.7.3 Preparation of Coating Dispersion.
A 3.5 wt% CNs water dispersion was obtained by dissolving the CNs into distilled water
assisted with ultrasonic treatments until the dispersion became visually homogenous. During the
process, the sonication should be carried out every ten minute under water bath to avoid
overheating. After recovering to room temperature, the CNs dispersion was coated on different
plastic substrates.
Page 63
PhD Dissertation of Fei LI 3 RESULTS AND DISCUSSION TOPIC 2
54
3.7.4 Coated Film Preparation.
According to ASTM D823-07, practice C, the corona-treated sides of rectangular (25×20 cm2)
four different plastic films were coated by an automatic film applicator (ref 1137, Sheen
Instruments, Kingston, U.K., shown in Figure 18) at a constant speed of 2.5 mm s-1
. In this
work, the 24 µm bar was used for coatings on different substrates, whose final thickness is ca.
0.6 µm. It is noticed that the horizontal flat is one of the most important factors to obtain
homogenous CNs coating. Water was evaporated using a constant mild flowing air (25±0.3 °C
for 5 min) at a perpendicular distance of 40 cm from the automatic applicator. The coated films
were stored under controlled conditions (20±2 °C, 45±2.0% RH) for 24 h, and then stored in
sealed anhydrous desiccators for 24 h before analysis.
Figure 18 Automatic applicator
3.7.5 Thickness measurement
For the coating thickness measurement, a 10 × 10 cm2 sample (plastic substrate with coating)
was cut and weighed (m1, g). The coating was removed by running hot water (~70 °C), and then
the resulting bare film was weighed (m2, g). The coating thickness (L, μm) was obtained
according to the following equation:
Page 64
PhD Dissertation of Fei LI 3 RESULTS AND DISCUSSION TOPIC 2
55
𝐿 =𝑚1−𝑚2
𝜌× 100 (1)
where ρ (g cm-3
) is the density of CNs (~1.58 g cm-3
) (Mazeau & Heux, 2003). Three
replications were determined.
3.7.6 Transmission Electron Microscopy.
Drops of aqueous dispersions of CNs (0.05% w/v) were deposited on carbon-coated electron
microscope grids, negatively stained with uranyl acetate and allowed to dry. The samples were
analyzed with a Hitachi Jeol-10084 transmission electron microscope (TEM) operated at an
accelerating voltage of 80 kV.
3.7.7 Atomic force microscopy
Atomic-force microscopy (AFM) topography images have been acquired in tapping mode with
a Veeco Innova instrument. Super-sharp silicon probes (typical radius of curvature 2 nm) have
been used for high-resolution imaging of nanocrystals, while standard silicon probes have been
employed for large-area scans in order to evaluate the sample roughness.
The root mean square roughness S is calculated as the standard deviation of the topography
(M × N pixels):
M
ii
N
j
ji zyxzMN
S1
2
),(1
, (2)
where 𝑧̅ is the mean value of the topography z(x, y).
3.7.8 Transparency measurements
The transmittance of the sample was measured at a wavelength of 550 nm, according to the
ASTM D 1746-70, by means of a Perkin-Elmer L650 spectro-photometer.
3.7.9 Haze
Haze was measured in accordance with ASTM D 1003-61 with spectrophotometer (Perkin
Elmer L650). The haze values of uncoated and coated films were obtained as (Lee et al., 2008):
haze = 100 ×𝐼s
𝐼T, (3)
where Is and IT are the scattered and total transmitted light, respectively.
3.7.10 Oxygen Transmission Rate (OTR), oxygen permeability (PO2) and Water Vapor
Transmission Rate (WVTR) measurements.
The OTR and WVTR of CNs coated plastic films were tested by permeation instrument
Page 65
PhD Dissertation of Fei LI 3 RESULTS AND DISCUSSION TOPIC 2
56
(MOCON, OX-TRAN® Model 702 and PERMATRAN-W
® Model 700) under the 23 °C and 0%
relative humidity(RH) for OTR and 38 °C and 90% RH for WVTR, complying with ASTM
D-3985, F-1927, F-1307 (OTR) and ASTM F-1249 (WVTR), respectively.
The PO2 of the CNs coating in the coated film [i.e., PO2 (Coating)] was calculated using the
following equation (Lee et al., 2008):
1
PO2(coated A − PET)=
1
PO2(coating)+
1
PO2(A − PET)
3.7.11 Contact angle measurements
Contact angles were measured to estimate the surface energies of the tested substrates by OCA
15 Plus angle goniometer (Data Physics Instruments GmbH, Filderstadt, Germany). The
softwares (SCA20 and SCA21) delivered by the instrument manufacturer calculates the contact
angles on the basis of a numerical solution of the full Young-Laplace equation and surface
energy. Measurements of static and advancing contact angle were performed at room
temperature with three liquids: two polar: Milli-Q water and formamide (FOM, ≥99.5%, Carlo
Erba, Milan); one apolar diiodomethane (DIM, 99%, Sigma Aldrich) at minimal five different
positions on each sample. The surface energies were calculated from the contact angle data at
equilibrium by the Van Oss method (Van Oss, 2006), which divides the total surface free energy
into two components, the dispersive and the polar components, where the polar interactions
originate from the Lewis acid-base interactions
𝛾𝑠𝑡𝑜𝑡𝑎𝑙 = 𝛾𝑠
D + 𝛾𝑠P (4)
where
𝛾𝑠P = 2√𝛾𝑠
+𝛾𝑠− (5)
The subscripts indicate the solid, s, or liquid, l, phase, and 𝛾𝑠LW and 𝛾𝑠
AB refer to the
dispersive and polar components of the total surface energy, respectively. 𝛾+ is the acceptor
and 𝛾− the donor part of the Lewis acid-base interactions.
When combined with Young‘s equation, the equations developed by Chaudhury, Good, and Van
Oss yield the equation
𝛾𝑙(1 + cos𝜃) = 2(√𝛾𝑙D𝛾𝑠
D + √𝛾𝑠+𝛾𝑙
− + √𝛾𝑠−𝛾𝑙
+) (6)
Where, θ is contact angle (°), 𝛾𝑙 is the liquid surface tension (mJ/m2), and 𝛾𝑠
+, 𝛾𝑙−and 𝛾𝑠
−, 𝛾𝑙+
are the acid and base contributions to the surface energies of the solid and liquid, respectively
(mJ/m2). The values of the surface tension and its components for the liquids that were used in
calculations were determined by Van Oss (van Oss, 2003). Water, formamide, and
Page 66
PhD Dissertation of Fei LI 3 RESULTS AND DISCUSSION TOPIC 2
57
diiodomethane, with known 𝛾𝑙D, 𝛾𝑙
+,and 𝛾𝑙− values (Table 5), and measured contact angle (θ)
were used to determine the 𝛾𝑠D, 𝛾𝑠
+,and 𝛾𝑠− combined with Equation (6). Finally, 𝛾𝑠
𝑡𝑜𝑡𝑎𝑙 and
𝛾𝑠P were calculated from Equation (4) and (5).
Table 5 Surface tension components and paprmeters of liquids used in direct contact angle
determination in mJ/m2, at 20 °C (Van Oss, 2006)
Liquid 𝛾𝑙 𝛾𝑙D 𝛾𝑙
P 𝛾𝑙+ 𝛾𝑙
−
APOLAR
Diiodomethane 50.8 50.8 0 ≈0 0
POLAR
Water 72.8 21.8 51.0 25.5 25.5
Formamide 58.0 39.0 19.0 2.28 39.6
3.7.12 Coefficient of friction.
The static (µS) and kinetic (µd) friction coefficients were measured by a dynamometer (model
Z005, Zwick Roell, Ulm, Germany), in accordance with the standard method ASTM D 1894-87.
38 The software TestXpert V10.11 (Zwick Roell, Ulm, Germany) Master was used for data
analysis. 5 replications for each sample.
Page 67
PhD Dissertation of Fei LI 3 RESULTS AND DISCUSSION TOPIC 2
58
3.8 Results and discussion 2
3.8.1 Morphology of CNs and CNs on different substrates
Figure 19 TEM image of individual CNs
The rod-like CNs produced from sulfuric acid hydrolysis of cotton linters were characterized by
TEM as shown in Figure 19. CNs observations obtained from diluted dispersion (approximate
0.05% w/w) show individual nanocrystals and some aggregates. The appearance of aggregated
elementary crystallites in TEM images is expected due to the high specific area and strong
hydrogen bonds established between the CNs. From several TEM images, the mean values of
the length (L) and diameter (d) of the isolated CNs were determined to be 150±30 nm and 6±3
nm, respectively, giving an aspect ratio (L/d) ~25. Similar dimensions have been reported in the
literatures (Angles & Dufresne, 2000; Elazzouzi-Hafraoui et al., 2007) . However, a wide
distribution of CNs size, especially of their length, is inevitable owing to the acid
diffusion-controlled nature of the hydrolysis (de Mesquita et al., 2010). It means that the from
the molecular level point of view, the diffusion of sulfuric acid is relatively inhomogeneous
which results in the different hydrolysis degree of cotton linter, thereby leads to a relatively
wide distribution of CNs size. The size distribution was presented in 3.3.2.4 (4).
Page 68
PhD Dissertation of Fei LI 3 RESULTS AND DISCUSSION TOPIC 2
59
Figure 20 High-resolution AFM images of CNs-coated films, coated PET (a), OPP (b),
cellophane (c), and OPA (d).
Figure 20 shows high-resolution AFM images of CNs-coated films. The image clearly shows a
dense packing and uniform coverage of nanofibers. A dense packing of CNs has been
previously described in other reports (Fujisawa et al., 2011). The continuous layer of
overlapping CNs fibers (Siró & Plackett, 2010) points towards possible improvements in the
oxygen barrier properties of the different substrates, which we will demonstrate and discuss
later on.
3.8.2 Coefficient of friction of bare and coated substrates
The values for the coefficient of friction (COF) of CNs-coated films against films are presented
in Table 6. By means of the statistical analysis, we conclude that the casting deposition created
a completely new CNs-coating layer on different substrates with one exception. In fact, it can be
clearly noted that three of the investigated systems (coated-PET, OPA, and cellophane) present
similar values in dynamic (µd) COFs, while only CNs-coated OPP is significantly different from
the other coated films probably due to weak adhesion between CNs coating and OPP surface
Page 69
PhD Dissertation of Fei LI 3 RESULTS AND DISCUSSION TOPIC 2
60
which leads to the removal of CNs from substrate during dynamic measurements. The COF
results and oxygen permeability shown later indicate that for 600 nm CNs coating, a
homogenous independent CNs layer was established by cast coating.
Table 6 Plastic films (Ex) against plastic film (In)
Substrate Bare (Ex) Coated (600 nm
a)
µs µd µs µd
PET 0.57±0.02D 0.52±0.03
H 0.38±0.01
C 0.33±0.01
G
OPP 0.18±0.01A 0.17±0.00
F 0.30±0.02
B 0.18±0.01
F
OPA 0.79±0.02E 0.74±0.03
J 0.32±0.01
BC 0.32±0.02
G
Cellophane 0.62±0.03D 0.57±0.01
I 0.38±0.02
C 0.34±0.01
G
a Thickness of CNs coating
A to
E, different letters mean that static COFs are significantly different (p<0.01);
F to
J, different letters mean that dynamic COFs are significantly different (p<0.01).
Table 7 Roughness of bare and coated substrates
Substrates PET OPP Cellophane OPA
10×10
µm2
Bare Coate
d
Bare Coate
d
Bare Coate
d
Bare Coate
d Ex
a
Inb
Exa
Inb
Exa
Inb
Exa
Inb
Roughnes
s (nm) 10 3 6 2 7 6 4 2 13 21 8 11
a External side of substrates, which generally were treated by corona;
b Internal side of substrates, which usually were not treated.
In order to complement the COF data with those for the sample roughness, we acquired
large-area AFM images, as shown in Figure 21, where cobble stone pathway like aggregations
of CNs where cobble-stone pathway-like aggregations of CNs due to the strong hydrogen bonds
are visible in all images, which are qualitatively very similar with each other. Roughness values
calculated from such AFM investigations all lay in the 6-13 nm range (see Table 7), which is
definitely lower than the one of bare films from 2-21 nm (external side). We therefore could
conclude that a new CNs layer was homogeneously established on different substrates.
Generally speaking, CNs coating could result in improvements of practical applications,
reduction of friction between the films, which probably lead to a premium feature for industrial
applications.
Page 70
PhD Dissertation of Fei LI 3 RESULTS AND DISCUSSION TOPIC 2
61
Figure 21 AFM for roughness of coated substrates, coated PET (a), OPP (b), OPA (c), and
cellophane (d).
3.8.3 Optical properties
Table 8 Transparency at 550 nm and haze of bare and CNs-coated films
Substrates Transparency (%) Haze (%)
Bare CNs-coated Bare CNs-coated
PET 88.0±0.2 89.4±0.2 2.7±0.1 5.1±0.2
OPP 91.9±0.0 91.3±0.2 2.9±0.1 5.2±0.2
OPA 89.7±0.3 90.3±0.1 4.1±0.1 6.2±1.0
Cellophane 87.6±0.2 88.5±0.4 4.3±0.1 5.8±0.1
Regarding the optical properties of CNs-coated films, results from transparency and haze
measurements in Table 8 show that the CNs-coated films still maintain high transparency, as
requested to ensure easy evaluation of the product quality by eye inspection. The excellent
optical properties are attributed to the thin CNs coating (around 600 nm, as determined by
weighting the samples). Nevertheless, small reduction and increase of the transparency and haze
values, respectively, are due to the nano-scale dimensions of CNs. Moreover, it is noticed that
the transmittance values at 300 nm reduced by 10% with CNs-OPP film, which indicates that
CNs coating slightly decrease the UV light.
3.8.4 Anti-fog property
Boiling water and breathe (Huff) tests both showed that the CNs-coated films have excellent
anti-fog property, which are presented in Figure 22(b). Particularly, we deposited 3.5% CNs
directly on different substrates without any primers or any chemicals to guarantee the safety of
food contact. In Figure 22 we show the results for the coated OPP film, since OPP it is the most
hydrophobic material among the substrates under investigation, but very similar results were
obtained for all the substrates. We observed the border (the blue dashed line) between bare and
Page 71
PhD Dissertation of Fei LI 3 RESULTS AND DISCUSSION TOPIC 2
62
coated films through the fog from our eye inspection. In order to observe the anti-fog property
better, we set a black sponge in the water containers, as shown in Figure 22. As known, fog is
formed by small discontinuous water droplets which could reflect the incident light, thereby
decrease the transparency and increase the haze (Introzzi et al., 2012; Nuraje et al., 2010).
Figure 22(a) and (c) obtained from optical microscopy, presents two parts, uncoated part with
water droplets which forms fog and coated part homogeneous water layer without any droplets,
which remained transparent. In the following part, we will further interpret the excellent
anti-fog of CNs-coated films from the comparison of surface energies obtained from contact
angle goniometery.
Figure 22 Boiling water test; the foggy bare OPP photo from optical microscope, (a);
comparison of bare and CNs-coated OPP during the test, (b); the border between CNs-coated
and bare parts taken form optical microscope, (c).
Table 9a Static contact angles of bare and CNs-coated films
Films Static CA
a
θWater(°) θDIM(°) b
θFOM(°) b
Bare PET 57.44±5.84 22.41±2.73 39.55±1.77
Bare OPP 63.03±1.00 52.22±1.61 41.39±1.70
CNs-PET 12.32±1.33 37.15±3.02 7.41±1.33
CNs-OPP 12.08±0.95 36.37±1.70 8.78±0.73
Table 9b Advancing contact angles of bare and CNs-coated films
Films Advancing CA
a
θWater(°) θWater(°)b θWater(°)
b
Bare PET 72.57±2.96 72.57±2.96 72.57±2.96
Bare OPP 90.06±1.84 90.06±1.84 90.06±1.84
CNs-PET 26.29±3.27 26.29±3.27 26.29±3.27
CNs-OPP 27.33±3.07 27.33±3.07 27.33±3.07
a static contact angle values recorded at 60
th second
b Diiodomethane, DIM and formamide, FOM
Page 72
PhD Dissertation of Fei LI 3 RESULTS AND DISCUSSION TOPIC 2
63
We did static and dynamic (advancing) contact angle measurements specifically on PET and
OPP which have different wettability and are the most widely used in food packaging field.
From Table 9a, we could notice that the CNs-coating showed highly similar static contact
angles, which indicates that the completely new CNs layer was established through cast coating
process. Moreover, the static contact angles of CNs coated substrates presented much lower
than the ones of bare substrates, since cellulose chains are full of hydroxyl (-OH) groups
leading to very hydrophilic.
We will use advancing contact angles (shown in Table 9b) of CNs coating to interpret the
principles behind the anti-fog performance. It was reported that one possible measure of the
level of interaction of water with a material is the advancing contact angle and it has been
suggested that hydrophilic surfaces with values less than 40° should exhibit anti-fog behavior
(Briscoe & Galvin, 1991; Howarter & Youngblood, 2008). The advancing contact angle value
(θWater) of CNs-coated films is around 26.5°, which is much lower the 40° thereby leads to
excellent anti-fog performance.
(a)
0
10
20
30
40
50
60
Total surface
energy
Polar
compoent
Su
rfa
ce
En
erg
y (
mJ/m
2) Bare PET
Bare OPP
CNs-PET
CNs-OPP
Dispersive
compoent
Page 73
PhD Dissertation of Fei LI 3 RESULTS AND DISCUSSION TOPIC 2
64
(b)
Figure 23 Surface energies and their respective polar and dispersive components of bare and
CNs-coated PET and OPP, (a); the electron-acceptor and donor of polar component, (b)
To further interpret the anti-fog behavior, we calculated the surface energies values from static
contact angles, which were presented in the Figure 23. Contact angles were measured by using
water, FOM, and DIM to provide information regarding the contributions of dispersive (D) and
polar (P) components to the total surface energy of the substrates. The calculated values in
Figure 23 show that the dispersive part of the cellulose surface energy is larger than the polar
contribution, since the surface energy of cellulose determined by contact angle measurements is
known to be ~55 mJ/m2 (Aulin et al., 2009). Also, a surface energy of CNs films on different
substrates was reported as high as 65 mJ/m2 with ±15% experimental error (Kontturi et al.,
2007). These values are consistent with the values obtained in our results of CNs-coated PET
and OPP. From Figure 23a, CNs-coated PET and OPP, have the similar surface energies. As the
Van Oss method (Van Oss et al., 1989) frequently used to determine surface energies often
results in surfaces with basic characteristics or electron-donor properties (Aulin et al., 2009), yet
in our case this method discloses that the thin CNs coating could provide an independent and
homogeneous basic layer on PET and OPP substrates which did not have significant influences
to surface energies of CNs coating. From γs+ and γs
- values shown in Figure 23b, we could well
interpret different anti-fog performances between bare and coated films. The electron-donor
component (γs-) values of coated PET and OPP are at least 2 and 3.8 times of bare ones, while
the electron-acceptor component (γs+) have some differences but since the absolute values are
small, thus we could consider them similar and also Van Oss (Van Oss, 2006) mentioned that
electron-acceptor/electron-donor interactions are essentially asymmetrical in the sense that of a
Page 74
PhD Dissertation of Fei LI 3 RESULTS AND DISCUSSION TOPIC 2
65
given polar substrate and the electron-acceptor and donor components are quite different, which
suggested normally only one of two parameters has the significant influence to the final
performance. Moreover, cellulose always presents polar and hydrophilic surface (Moon et al.,
2011) and CNs are grafted with a few sulfate ester groups (-O-SO3H) due to the sulfuric acid
hydrolysis process. These results, therefore, suggest that the anti-fog property induced on the
PET and OPP substrates should be attributed to the electron-donor parameter of the polar
component. For hydrophilic biopolymers, similar results were also reported (Introzzi et al.,
2012; Nuraje et al., 2010).
3.8.5 Barrier properties.
Table 10 OTR and WVTR
Substrates (Thickness) Status OTRa WVTR
b
PET (12 µm) Bare 97.0±4.2 52.0±0.3
Coated 7.6±3.0 38.5±0.7
OPP (20 µm) Bare 2500.0±12.5 8.7±0.0
Coated 157.0±52.3 5.8±0.2
OPA (12 µm) Bare 90.0±0.5 1136.0±5.7
Coated 12.1±5.5 865.0±4.3
Cellophane (12 µm) Bare 152±0.8 41.0
Coated 4.4±0.0 41.0
a cm
3 m
-2 day
-1, test condition 23 °C 0% RH
b g day
-1 atm
-1, test condition 38 °C 90% RH
The Table 10 shows that the barrier properties of coated films improve significantly thanks to
the thin (~600 nm) CNs coating. The oxygen transmission rates (OTR) of all samples have been
measured and analyzed under the dry condition. PET and OPA are both relatively hydrophilic
materials with already good oxygen barrier properties. After coating, their oxygen barrier is
significantly improved, with a further reduction of about 90% in OTR value. The cellophane is
regenerated from cellulose and could have similar hydrophilic properties. After CNs coating,
oxygen resistance increases almost 40-fold and OTR of coated cellophane is reduced to 0.044
cm3 m
-2 24h
-1 kPa
-1. Coefficient oxygen permeability (KPO2) of CNs coating on cellophane is
0.027 cm3
µm m-2
24h-1
kPa-1
, which is similar with that of EVOH under dry conditions and
smaller than that of PVDC (Lee et al., 2008). Such excellent oxygen barrier property of
cellophane with CNs coating can be tentatively attributed to the strong hydrogen bonds among
CNs and between CNs and cellophane. On the other hand, OPP is a definitely hydrophobic
material with low oxygen barrier. CNs deposition on OPP dramatically reduces the oxygen
permeability, which isolates ~94% oxygen compared to the bare OPP.
Page 75
PhD Dissertation of Fei LI 3 RESULTS AND DISCUSSION TOPIC 2
66
The water vapor transmission rate (WVTR) of CNs is limited by their hydrophilicity (Moon et
al., 2011). Nevertheless, the WVTR of CNs-coated PET, OPP and OPA films is reduced by 26%,
33%, and 24% respectively under 38 °C and 90% RH conditions, compared to bare films. It is
obvious that CNs obtained from cotton linters are hydrophilic and could absorb certain amount
of water vapor during the measurements, leading to reduction of WVTR, which were also
reported in other literatures (Fukuzumi et al., 2012; Hult et al., 2010; Sanchez-Garcia et al.,
2010). On the other hand, bare and coated cellophane films have the same WVTR values
because of both originate from cellulose.
Thus, thin CNs coating improves the oxygen and water vapor barrier properties of conventional
flexible food packaging. In another words, substitution of conventional plastics is difficult
because of the cost, flexibility, availability and etc. But at least, CNs coated thin plastic films
might be partially instead of the thicker ones, thereby, save the plastic and make our food
packaging more friendly-environmental and sustainable. In this work, the OTR values were
measured only under the dry condition and obtained relatively good performance. Since CNs is
hydrophilic biopolymer, we suppose that the oxygen barrier will be reduced under high RH as
other reports by the form of coating or filler on to in other polymers (Fukuzumi et al., 2011;
Kato et al., 2005). The CNs, however, has the highest crystalinity (~85-87%) compared with
MFC, MFC/PEI LbL coatings (Aulin et al., 2009) and TEMPO-oxidized cellulose nanofibers
(~74%) (Isogai et al., 2011), which might result in relatively better oxygen barrier under the
high RH than other form nano-cellulose. This point should be still under the investigation and
be proved by more evidence.
Page 76
PhD Dissertation of Fei LI 3 RESULTS AND DISCUSSION TOPIC 2
67
3.9 Conclusions 2
In conclusion, we have systematically investigated the properties of conventional films coated
with CNs. In particular, we have analyzed their optical properties (transparency and haze),
mechanical properties (static and dynamic coefficient of friction), anti-fog (contact angle and
surface energy) and barrier properties (oxygen and water vapor transmission rates). In doing
this, we have demonstrated that CNs coatings mainly lead to a reduction of friction, a premium
feature for industrial applications, and that their influence on the optical properties of the
packaging is not significant. Excellent anti-fog property guarantees customers more convenient
to evaluate the product easily. At last but not the least, CNs coatings dramatically not only
improve the oxygen barrier properties of conventional flexible food packaging, but also leading
to a certain reduction in the water vapor transmission rate. While substitution of conventional
plastics might still be far ahead because of the low cost, large flexibility and availability, the
perspective use of CNs as multi-functional coatings to favor a reduction of the required
thickness for plastic films, towards a more environmentally-friendly and sustainable approach
to packaging.
Page 77
PhD Dissertation of Fei LI 3 RESULTS AND DISCUSSION TOPIC 2
68
3.10 References
Angles, M. N., Dufresne, A., 2000, Plasticized starch/tunicin whiskers nanocomposites. 1.
Structural analysis. Macromolecules 33: 8344-8353.
Aulin, C. et al., 2009, Nanoscale Cellulose Films with Different Crystallinities and
Mesostructures—Their Surface Properties and Interaction with Water. Langmuir 25: 7675-7685.
Auras, R. et al., 2004, An overview of polylactides as packaging materials. Macromolecular
Bioscience 4: 835-864.
Avella, M. et al., 2005, Biodegradable starch/clay nanocomposite films for food packaging
applications. Food Chemistry 93: 467-474.
Briscoe, B. J., Galvin, K. P., 1991, The effect of surface fog on the transmittance of light. Solar
Energy 46: 191-197.
Creatore, M. et al., 2002, Deposition of SiOx films from hexamethyldisiloxane/oxygen
radiofrequency glow discharges: Process optimization by plasma diagnostics. Plasmas and
Polymers 7: 291-310.
de Mesquita, J. o. P. et al., 2010, Biobased Nanocomposites from Layer-by-Layer Assembly of
Cellulose Nanowhiskers with Chitosan. Biomacromolecules 11: 473-480.
Dong, X. M. et al., 1998, Effect of microcrystallite preparation conditions on the formation of
colloid crystals of cellulose. Cellulose 5: 19-32.
Drumright, R. E. et al., 2000, Polylactic acid technology. Advanced Materials 12: 1841-1846.
Elazzouzi-Hafraoui, S. et al., 2007, The Shape and Size Distribution of Crystalline
Nanoparticles Prepared by Acid Hydrolysis of Native Cellulose. Biomacromolecules 9: 57-65.
Erlat, A. G. et al., 1999, SiOx gas barrier coatings on polymer substrates: Morphology and gas
transport considerations. Journal of Physical Chemistry B 103: 6047-6055.
Farris, S. et al., 2012, Self-Assembled Pullulan-Silica Oxygen Barrier Hybrid Coatings for Food
Packaging Applications. Journal of Agricultural and Food Chemistry 60: 782-790.
Farris, S. et al., 2009, Evaluation of a bio-coating as a solution to improve barrier, friction and
optical properties of plastic films. Packaging Technology and Science 22: 69-83.
Fujisawa, S. et al., 2011, Preparation and characterization of TEMPO-oxidized cellulose
nanofibril films with free carboxyl groups. Carbohydrate Polymers 84: 579-583.
Fukuzumi, H. et al., 2012, Influence of TEMPO-oxidized cellulose nanofibril length on film
properties. http://dx.doi.org/10.1016/j.carbpol.2012.04.069.
Fukuzumi, H. et al., 2011, Pore Size Determination of TEMPO-Oxidized Cellulose Nanofibril
Films by Positron Annihilation Lifetime Spectroscopy. Biomacromolecules 12: 4057-4062.
Fukuzumi, H. et al., 2008, Transparent and High Gas Barrier Films of Cellulose Nanofibers
Prepared by TEMPO-Mediated Oxidation. Biomacromolecules 10: 162-165.
Ghasemi, H. et al., 2012, Properties of PET/clay nanocomposite films. Polymer Engineering
and Science 52: 420-430.
Page 78
PhD Dissertation of Fei LI 3 RESULTS AND DISCUSSION TOPIC 2
69
Haas, K. H. et al., 1999, Functionalized coatings based on inorganic-organic polymers
(ORMOCER (R) s) and their combination with vapor deposited inorganic thin films. Surface &
Coatings Technology 111: 72-79.
Howarter, J. A., Youngblood, J. P., 2008, Self-Cleaning and Next Generation Anti-Fog Surfaces
and Coatings. Macromolecular Rapid Communications 29: 455-466.
Hult, E. L. et al., 2010, Efficient approach to high barrier packaging using microfibrillar
cellulose and shellac. Cellulose 17: 575-586.
Introzzi, L. et al., 2012, ―Wetting Enhancer‖ Pullulan Coating for Antifog Packaging
Applications. ACS Applied Materials & Interfaces 4: 3692-3700.
Isogai, A. et al., 2011, TEMPO-oxidized cellulose nanofibers. Nanoscale 3: 71-85.
Jang, W.-S. et al., 2008, Layer-by-layer assembly of thin film oxygen barrier. Thin Solid Films
516: 4819-4825.
Kato, Y. et al., 2005, Oxygen Permeability and Biodegradability of Polyuronic Acids Prepared
from Polysaccharides by TEMPO-Mediated Oxidation. Journal of Polymers and the
Environment 13: 261-266.
Kontturi, E. et al., 2007, Cellulose Nanocrystal Submonolayers by Spin Coating. Langmuir 23:
9674-9680.
Krikorian, V., Pochan, D. J., 2003, Poly (L-lactic acid)/layered silicate nanocomposite:
Fabrication, characterization, and properties. Chemistry of Materials 15: 4317-4324.
Lee, D. S. et al. Food Packaging Science and Technology. CRC Press, 2008, 58-59, 86-93.
Lim, L. T. et al., 2008, Processing technologies for poly(lactic acid). Progress in Polymer
Science 33: 820-852.
Lordan, S. et al., 2011, Cytotoxic effects induced by unmodified and organically modified
nanoclays in the human hepatic HepG2 cell line. Journal of Applied Toxicology 31: 27-35.
Mazeau, K., Heux, L., 2003, Molecular Dynamics Simulations of Bulk Native Crystalline and
Amorphous Structures of Cellulose. The Journal of Physical Chemistry B 107: 2394-2403.
Moon, R. J. et al., 2011, Cellulose nanomaterials review: structure, properties and
nanocomposites. Chemical Society Reviews 40: 3941-3994.
Nuraje, N. et al., 2010, Durable Antifog Films from Layer-by-Layer Molecularly Blended
Hydrophilic Polysaccharides. Langmuir 27: 782-791.
Priolo, M. A. et al., 2010, Super Gas Barrier of Transparent Polymer−Clay Multilayer Ultrathin
Films. Nano Letters 10: 4970-4974.
Ray, S. S. et al., 2002, Polylactide-layered silicate nanocomposite: A novel biodegradable
material. Nano Letters 2: 1093-1096.
Ray, S. S. et al., 2003, New polylactide-layered silicate nanocomposites. 2. Concurrent
improvements of material properties, biodegradability and melt rheology. Polymer 44: 857-866.
Sánchez-Valdes, S. et al., 2006, Effect of Ionomeric Compatibilizer on Clay Dispersion in
Page 79
PhD Dissertation of Fei LI 3 RESULTS AND DISCUSSION TOPIC 2
70
Polyethylene/Clay Nanocomposites. Macromolecular Materials and Engineering 291: 128-136.
Sanchez-Garcia, M. D. et al., 2010, Morphology and Water Barrier Properties of
Nanobiocomposites of k/i-Hybrid Carrageenan and Cellulose Nanowhiskers. Journal of
Agricultural and Food Chemistry 58: 12847-12857.
Siró, I., Plackett, D., 2010, Microfibrillated cellulose and new nanocomposite materials: a
review. Cellulose 17: 459-494.
Siro, I., Plackett, D., 2010, Microfibrillated cellulose and new nanocomposite materials: a
review. Cellulose 17: 459-494.
Svagan, A. J. et al., 2012, Transparent Films Based on PLA and Montmorillonite with Tunable
Oxygen Barrier Properties. Biomacromolecules 13: 397-405.
Tharanathan, R. N., 2003, Biodegradable films and composite coatings: past, present and future.
Trends in Food Science & Technology 14: 71-78.
van Oss, C. J., 2003, Long-range and short-range mechanisms of hydrophobic attraction and
hydrophilic repulsion in specific and aspecific interactions. Journal of Molecular Recognition
16: 177-190.
Van Oss, C. J. Interfacial Forces in Aqueous Media. New York: CRC Press, 2006, pp 18-21 and
89-107.
Van Oss, C. J. et al., 1989, Estimation of the polar parameters of the surface tension of liquids
by contact angle measurements on gels. Journal of Colloid and Interface Science 128: 313-319.
Vert, M. et al., 1995, Present and Future of PLA Polymers. Journal of Macromolecular
Science-Pure and Applied Chemistry A32: 787-796.
Yang, Y.-H. et al., 2011, Super Gas Barrier of All-Polymer Multilayer Thin Films.
Macromolecules 44: 1450-1459.
Zhang, L., Sun, J., 2010, Layer-by-Layer Codeposition of Polyelectrolyte Complexes and Free
Polyelectrolytes for the Fabrication of Polymeric Coatings. Macromolecules 43: 2413-2420.
Page 80
PhD Dissertation of Fei LI 3 RESULTS AND DISCUSSION TOPIC 3
71
3.11 Topic/theme 3 Tunable Green Oxygen Barrier through Layer by Layer Self-assembly
of Chitosan (CS) and Cellulose Nanocrystals (CNs)
Introduction
High gas-barrier materials are urgent and important need for food, drug packaging applications
(Cooper et al., 2011; Priolo et al., 2010; Svagan et al., 2012). Particularly, the oxygen
permeability of conventional plastic films is not able to meet assurance of the long shelf lives
required for a wide variety of foods and expected by the market (Cooper et al., 2011). Facing a
tough situation, we simultaneously cannot neglect environmental factors: the food should be
effectively protected from oxygen by the films, whilst it is recommended that the barrier
materials or coatings should be sustainable and environmentally friendly (Svagan et al., 2012).
In other words, the conventional materials could not be completely and immediately substituted
by bio-based ones. Thus, the high-barrier coatings are considered as a current key solution to
significantly reduce the thickness of conventional materials, thereby, lead to make our present
films more environmentally friendly.
Up to now, the main strategies to increase the barrier properties of flexible and transparent
materials for food packaging applications have been limited to vacuum metallization, silicon
oxide (SiOx) coatings (Jang et al., 2008; Leterrier, 2003), manufacturing of multi-layers (by
co-extrusion and/or laminating) (Affinito et al., 1996), or development of clay-nanocomposites
(Chang et al., 2003; Donadi et al., 2011; Ghasemi et al., 2012). However, these solutions do not
completely fulfill the sustainability expectations and the needs of transparency, while some
technological drawbacks still exist. For instance, SiOx vapor-deposited thin films are prone to
cracking when flexed and show poor adhesion to plastic substrates (Leterrier, 2003); multilayer
materials can also present adhesion problems denoting delaminating occurrences;
nanoclay-reinforced polymer composites and metallized films suffer from low transparency and
relatively high values of the oxygen transmission rate (Osman et al., 2005; Sánchez-Valdes et
al., 2006). Also, although the most claimed option to increase gas barrier properties of flexible
packaging materials is currently represented by nanoclays inclusions (Jang et al., 2008; Priolo et
al., 2010; Svagan et al., 2012), yet it was demonstrated that various nanoclays are highly
cytotoxic, posing a possible risk to human health (Lordan et al., 2011). Ideally, a barrier coating
made of natural bio-polymers could achieve all the goals of high transparency, low gas
permeability, bio-compatibility, sustainability and good adhesion. Layer-by-layer (LbL)
assembly is a basic technique for the fabrication of multicomponent films on solid supports by
controlled adsorption from solutions or dispersions (Decher, 1997) and is also considered as a
good candidate for versatile surface applications including gas barrier coatings (Jang et al.,
2008; Priolo et al., 2010; Svagan et al., 2012; Yang et al., 2011), anti-fog and super-hydrophobic
Page 81
PhD Dissertation of Fei LI 3 RESULTS AND DISCUSSION TOPIC 3
72
coatings (Nuraje et al., 2010; Zhai et al., 2004; Zhang & Sun, 2010), antimicrobial surfaces
(Dvoracek et al., 2009; Etienne et al., 2005), drug delivery (Chung & Rubner, 2002; Kim et al.,
2008), and electrically conductive films (Daiko et al., 2008; Park et al., 2010). When a
nanofiller needs to be integrated within a polymer matrix in order to provide it with specific
novel functionalities, LbL techniques represent a means to avoid aggregation and thus achieve a
high level of dispersion and a large filler load.
Since cellulose nanocrystals and chitosan come from the first and second most abundant natural
polymers on the earth (de Mesquita et al., 2010), their sustainability seems beyond doubt. Due
to its nontoxicity, biodegradability, and anti-microbial properties, chitosan has been widely
applied to food packaging and medical fields as a polycationic material (Ravi Kumar, 2000),
whilst cellulose nanocrystals recently gained a great attention as optically-transparent
reinforcement and barrier coatings (Eichhorn et al., 2010; Kontturi et al., 2007; Sanchez-Garcia
et al., 2010) and were found to have neither genotoxicity nor effects on survival and growth of
nine aquatic species in the ecotoxicological tests conducted so far (Kovacs et al., 2010).
Furthermore, cellulose nanofibers were reported as effective gas barriers, also thanks to their
high degree of crystallinity and strong hydrogen bonds: casted coatings based on
TEMPO-oxidized cellulose nanofibers (TOCNs) reduced the oxygen permeability (PO2) of bare
poly lactic acid (PLA) and PET films (Fukuzumi et al., 2008; Kato et al., 2005). Recently,
well-controlled LbL assembly of CNs/CS multilayers has been proposed as a novel solution to
improve the performance of CS coatings by exploiting the large electrostatic interaction and
hydrogen bonds with CNs nanofillers (de Mesquita et al., 2010; Qi et al., 2012). At present,
however, the barrier properties of such nanocomposites, as well as the influence of pH values
on the assembly process, have not yet been fully investigated.
The aim of our work refers to the development of a bio-nanocomposite coating, able to enhance
the gas barrier properties of one of the currently most used synthetic plastics, maintaining its
intrinsic transparency and reducing the environmental impact of the coated materials, lowering
their final thickness. Our goal was also the full comprehension of the mechanism involved in
the nanocomposite growth, in order to be able to modulate the final thickness and porosity,
leading to a possible design of the barrier properties.
Page 82
PhD Dissertation of Fei LI 3 RESULTS AND DISCUSSION TOPIC 3
73
3.12 Materials and methods 3
3.12.1 Materials
Shellfish chitosan (CS, GiustoFaravelli SpA, Milan, Italy) had a degree of deacetylation of 85%
and a molecular weight ranging from 50 000 to 60 000 (data provided by the supplier). Cotton
linter board, provided by SSCCP (Italian pulp and paper research institute, Milan, Italy), was
used for producing cellulose nanocrystals. Amorphous poly(ethylene terephthalate) (A-PET,
~180 μm thick) was used as the plastic substrate for layer-by-layer coating, provided from ILPA
srl (Bazzano, Italy). Other reagents were purchased from Sigma-Aldrich, Italy.
3.12.2 Preparation of biopolymer dispersions for layer-by-layer coating
1 wt % chitosan water dispersion was prepared by dissolving the polysaccharide in 0.1 M
HCl(aq) at 25 °C for 3 h under stirring. After adjusting pH and filtration, the chitosan dispersion
was used for the layer-by-layer coating.
1wt % cellulose nanocrystals (CNs) water dispersion was prepared from cotton linter using a
procedure already established for cotton from powdered filter paper (Dong et al., 1996). Briefly,
milled cotton linter was hydrolyzed by 64% (wt/wt) sulfuric acid with vigorous stirring at 45 °C
for 45 min. The reaction mixture was diluted with 10 times-volume deionized water (18.2 MΩ
cm, Millipore Milli-Q Purification System) and settled for 2 h, and then was rinsed and
centrifuged at 5000 rpm repeatedly until the supernatant became turbid. Further purification
was then done by dialysis against deionized water until the effluent remained at neutral pH
(Molecular Weight Cut Off 12 000 and higher). Sequentially, the suspension was sonicated
(UP400S 400 W, Hielscher Co., Germany) repeatedly (5 cycles of 10 min at 70% output) to
create cellulose crystals of colloidal dimensions. Finally, the suspension was filtered under
vacuum with Muktell (grade GF/C, 1.2 μm) and Whatman glass microfiber filter (grade GF/F,
0.7 μm) to remove contamination and big aggregations. The CNs content of the resulting
aqueous suspension was determined by drying several samples (1 ml) at 105 °C for 15 min
intervals (to avoid decomposition or burning) until weight constancy, giving a cellulose
concentration of ~1 % wt/wt and a yield of ~50%.
3.12.3 Surface charge density measurements
Surface charge densities were measured by means of conductometric titration. For the CNs
dispersion, a commercial particle charge detector was used (PCD-04, Müteck, Germany), while
for the CS dispersion, the same procedure described by Farris et al. (Farris et al., 2012) was
employed.
Page 83
PhD Dissertation of Fei LI 3 RESULTS AND DISCUSSION TOPIC 3
74
3.12.4 Layer-by-Layer assembly
Glass slides and silicon wafers were used as the substrates for AFM and ellipsometry thickness
evaluation, respectively. Firstly, the glass slides or silicon wafer were rinsed and pre-treated into
the Piranha solution (96% H2SO4 : 30% H2O2= 3:1 (v:v)) to remove the contaminations and
generate the negative charge on the surface of glass slides [Caution! Cleaning solution reacts
violently with organic materials and should be handled with extreme caution]. The coating
procedure is as follows: (1) The glass slide or silicon wafer was dipped into the chitosan
dispersion for 5 min (for the first bilayer) and 3 min (for other bilayers); (2) The substrates were
rinsed in distilled water for 3 min for removing the excess chitosan; (3) The CS coated surfaces
were dried by filtered compressed air and dipped into the CNs dispersion for certain time (5 min
for the first bilayer and 3 min for other bilayers); (4) The rinsing and drying steps were the same
as the one for chitosan. Finally, the different numbers of bilayers were achieved by the recycle
of (1)-(4) steps. For the coating on flexible plastic, A-PET films were rinsed with distilled water,
methanol, and again distilled water for removing the lipids and other contaminants, dried by
filtered air, and submitted to corona treatment (BD-20 high frequency generator, Electro-technic
products, Inc., Chicago, IL, USA) to increase the surface energy and generate a negative-charge
surface. Sequentially, the coating procedure is the same as the one on glass slides and silicon
wafer. All of the samples were stored into desiccators at 0% RH ready for following
measurements. The pH of CS or CNs dispersions is presented next to their name in the figures
and text. For example, one bilayer of CS (pH = 4)/CNs (pH = 2) is abbreviated as
(CSpH4/CNspH2)1.
3.12.5 Transparency measurements
The transmittance of the sample was measured at a wavelength of 550 nm, according to the
ASTM D 1746-70, by means of a Perkin-Elmer L650 spectro-photometer.
3.12.6 Fourier transform infrared spectroscopy (FTIR)
FTIR spectra were recorded using a Perkin Elmer instrument (Sprectrum 100) equipped with an
ATR. Spectra were recorded using a spectral width ranging from 650 to 4000 cm-1
, with 4 cm-1
resolution and an accumulation of 16 scans.
3.12.7 XPS (X-ray photoelectron spectroscopy)
XPS scans were acquired with a Phoibos 150 hemispherical analyzer at normal emission. X-ray
excitation was provided by a twin anode X-ray source operated at 200 W. Mg Kα radiation
(photon energy: 1253.6 eV) was used. The wide scans were acquired with a pass energy of 50
eV, while detailed scans were acquired with a pass energy of 25 eV.
Page 84
PhD Dissertation of Fei LI 3 RESULTS AND DISCUSSION TOPIC 3
75
3.12.8 Atomic Force Microscopy
An atomic force microscope (AFM, AlphaSNOM, WITec GmbH, Germany) was employed
both to systematically study the thickness of the deposited multilayers and to analyze their
morphology. For thickness measurements, the LbL coating on glass slides was gently scratched
in order to expose part of the glass substrate and thus measure the thickness of the coating.
Topography images were acquired with soft tapping mode at low oscillation amplitudes,
stabilized by an amplitude-modulation feedback system based on the optical lever deflection
method. Standard AFM Si probes have been used.
3.12.9 Ellipsometry
The thickness of each layer from 0 to 8 bilayers was also determined by a variable angle
spectroscopic ellipsometer (VASE® J.A. Woollam Co. Inc., USA) with a wide spectral range
capability of 200-1700 nm. In order to provide the system with a standard reference substrate,
CS/CNs multilayers were here deposited on a Si wafer. Data were collected at different angles
of incidence (60°, 65° and 70°), between 400 and 800 nm. The ellipsometric amplitude ratio, Ψ,
and the phase difference, Δ, data were fitted using a Cauchy model for the refractive index of
the deposited material, with its given uncertainty based on data reported in the literature
(Angles & Dufresne, 2000; Frank et al., 1996; Kasarova et al., 2007; Ligler et al., 2001; Sei-ichi
et al., 2001).
In order to increase the fitting accuracy, the Bruggeman model of the effective medium
approximation (EMA) layer was employed (Hoeger et al., 2011). This approximation allowed
for film thickness analysis by incorporating air as an integral part of the ultrathin film. The
positive free parameters of the fitting were the thickness of the deposited layers and their
percentage P of air-filled voids. The fitting of the experimental data was performed by
minimizing the mean-squared-error defined as
MNMSE
N
i i
ii
i
ii
2
1
22
exp
,
expmod
exp
,
expmod
where N is the number of measured and pairs and M is the total number of model fit
parameters.
Since the layer thickness and the material refractive index are expected to be correlated in the
fitting procedure, the reported thickness values were found within some uncertainty, which
reflects the uncertainty in the material refractive index. However, this uncertainty was found to
be lower than 1%, with the exception of thicknesses below about 20 nm (with uncertainty of the
Page 85
PhD Dissertation of Fei LI 3 RESULTS AND DISCUSSION TOPIC 3
76
order of few %).
3.12.10 Field-Emission Scanning Electron Microscopy
SEM observation of the film cross-sections was carried out with a Zeiss Σigma field-emission
microscope at 5 kV. The samples subjected to the SEM observation were pre-coated with gold
using a Polaron E5100 Coater at 18 mA for 20 s.
3.12.11 Oxygen barrier properties
Oxygen permeability measurements of coated A-PET films were performed by OX-TRAN®
Model 702 (MOCON, USA), complying with ASTM-3985, under the condition of 23°C and 0%
relative humidity (RH). The samples, with a surface of 50 cm2, were measured at atmospheric
pressure. Each sample was conditioned in the chamber for 24 h, and the oxygen transmission
rate (OTR) was measured over 1-2 days until it reached a stable value. The PO2 of the CS/CNs
nanocomposite coating in the coated film [i.e., PO2 (Coating)] was calculated using the
following equation (Lee et al., 2008):
1
PO2(coated A − PET)=
1
PO2(coating)+
1
PO2(A − PET)
Page 86
PhD Dissertation of Fei LI 3 RESULTS AND DISCUSSION TOPIC 3
77
3.13 Results and discussion 3
3.13.1 Layer-by-layer assembly
We first investigated the layer-by-layer self-assembled growth of the CS/CNs nanocomposite.
The growth process and the resulting multilayer structure created by polycationic 1 wt % CS
and polyanionic 1 wt % CNs are sketched in Figure 24(a) and 1(b). Scheme Figure 24(a)
presents one cycle of layer-by-layer assembly and the numbers of cycles are directly related
with the thickness of coating and indirectly correlated to the properties of coated substrates.
Figure 24(b) clearly exhibits the CS and CNs layers deposited on substrate. The different layers,
however, are not exactly independent and they overlap and attract each other tightly due to the
low thickness of each layer and hydrogen bonds and electrostatic interactions between CS and
CNs. Also, the thickness of CS is lower than CNs by reason of the big differences of charge
density of two polymers. The proportion of CS and CNs-layer thickness in Figure 24(b) does
not show the actual situation, just for illustration. In the next section (3.2), we will discuss the
interaction between the two polymers at length.
Figure 24 (a) Illustrations of the LbL self-assembly process and (b) the nanostructure
constructed by the alternate adsorption of CS (orange) and CNs (gray) onto a substrate.
Page 87
PhD Dissertation of Fei LI 3 RESULTS AND DISCUSSION TOPIC 3
78
Figure 25 Scanning electron microscopy images of the multilayer cross section and morphology,
after cutting it with blade and coating it with a few nm Au layer. The average thickness of the
multilayer is about 800 nm.
Hereafter, we will refer to a single CS/CNs assembly as one bilayer. A cross section of the
multilayer film, obtained after 30 deposition cycles on an amorphous-polyethylene terephthalate
(A-PET) substrate, is presented in Figure 25(a). Multiple-layer structures are clearly observed,
confirming that nano-scale layers were established by the LbL assembly. The total thickness of
the 30 bilayers CS/CNs coating can be estimated to be ~ 800 nm on average from FE-SEM
figure (T1 and T2). Owing to the warming phenomena of SEM, the cross section was blend and
occasionally not only the cross section of LbL coating but also the planes of inside layers are
vividly shown, which ascertain again the overlapped multiple layers. Morphology of 30-bilayer
sample is presented in Figure 25(b). Although the Au particles partially cover the real
morphology, we still could see CNs network with each other. There are pores on the surface,
whereas most of them are closed or blocked by the nether layer, which was also reported in
other papers (Siró & Plackett, 2010).
We also measured the optical transparency of the same film at 550 nm, obtaining a
transmittance of about 70% (representing a reduction of approximately 13% compared to the
bare A-PET substrate). Figure 26 presents high transparency of CS/CNs nanocomposite coating.
The boarder of coated and uncoated part is marked by red in Figure 26, from which we could
not significantly distinguish the transparency differences by eye inspection.
Page 88
PhD Dissertation of Fei LI 3 RESULTS AND DISCUSSION TOPIC 3
79
Figure 26 Optical property of coated A-PET.
3.13.2 Structure of CS/CNs nanocomposite
(1) FTIR
4000 3500 3000 2500 2000 1500 1000 500
Tra
ns
mit
tan
ce
%
Wavenumber / cm-1
(III)
(II)
1515
1621
(I) (a)
Page 89
PhD Dissertation of Fei LI 3 RESULTS AND DISCUSSION TOPIC 3
80
Figure 27 FTIR of pure CNs (I), 30-bilayer CS/CNs nanocomposite (II), and pure chitosan (III).
(a) FTIR spectrum from 650 to 4000 cm-1
. (b) Close-up of the spectrum showing the
displacement of the N-H bending in the nanocomposite from 1515 to 1535 cm-1
.
.
Figure 27 shows the FTIR spectra of cellulose nanocrystals, chitosan, and 30-bilayer CS/CNs
nanocomposite. The main bands that appear in the spectrum of chitosan are located around 1621
and 1515 cm-1
which is shifted to 1535 cm-1
in CS/CNs nanocomposite due to the proportion of
amide and amine groups by pH conditions. The first one corresponds to the C=O stretching of
acetyl groups and the second one arises from N-H bending vibrations (amide and amine groups).
The bands at 1070 and 1030 cm-1
are attributed to the C-O stretching vibrations, whereas the
broadband at 3200-3450 is assigned to the O-H and N-H stretching. The peaks at 1375 and
1450 cm-1
are due to the -CH3 groups of N-acetylglucosamine residue and -CH2 groups,
respectively (de Mesquita et al., 2010; Li et al., 2009). In pure CNs, the band at 3338 cm-1
is
attributed to the O-H stretching vibration. The bands at 2902 and 1429 cm-1
are characteristic of
C-H stretching and bending of -CH2 groups, respectively, whereas the peaks at 1162 and 1060
cm-1
are attributed to the saccharide structure (Li et al., 2009). The sulfate groups were not
detected in that the amount of these groups was very small, whereas it was determined by XPS
in Table 11. The spectrum of the CS/CNs nanocomposite shows characteristic bands of both
materials. The saccharide and the C-H stretching bands could be observed in the spectrum of
the nanocomposite film as well as the bands related to C=O stretching and N-H bending. The
broadband around 3200-3450 cm-1
in the nanocomposite moved slightly and became broader
1800 1700 1600 1500 1400
(b)
1535
Tra
nsm
itta
nce %
Wavenumber / cm-1
1515
(I)
(II)
(III)
Page 90
PhD Dissertation of Fei LI 3 RESULTS AND DISCUSSION TOPIC 3
81
compared to the spectrum obtained for pure CNs. Zhang et al. (Li et al., 2009) stated that these
effects result from the interaction between the negatively charged sulfate ester groups on the
CNs surface and the positive charged ammonium groups of chitosan. Besides these interactions,
the formation of hydrogen bonds between CNs and chitosan is highly expected given the
chemical structure of these polysaccharides.
(2) XPS
Table 11 Concentration of atomic species (in terms of number of atoms) for the CS/CNs
nanocomposite, CNs, and CS samples
O [%] C [%] N [%] S [%] Cl [%] Na [%] F [%]
CS/CNs 28.7±0.2 68.7±0.6 2.2±0.2 0.3±0.1
CNs 39.1±0.2 59.4±0.4 - 0.6±0.1 ~0 ~0 0.8±0.1
CS 20.3±0.3 43.6±0.8 5.2±0.3 15.5±0.2 14.8±0.5 0.6±0.1
Table 11 did show peaks related to oxygen, carbon, nitrogen and a faint signal from sulfur for
CS/CNs nanocomposite sample, additional peaks related to fluorine and not a nitrogen peak for
CNs sample, and peaks related to oxygen, carbon, nitrogen, chlorine, fluorine and sodium for
CS sample.
Fluorine, sodium and chlorine did not come from improper handling of the samples during XPS
analysis but were already present in the films, which were likely originated from the impurity of
reagents.
The nitrogen signal allows us to distinguish between two different situations:
(N1) nitrogen atoms bonded to one carbon atom (N–C bonds) or in non-protonated amine
groups; (N2) oxidized or protonated nitrogen atoms. The amount of N1 and N2 contributions in
the two samples containing CS is in the following Table 12:
Table 12 Nitrogen signal features related to different bonds for the CS/CNs nanocomposite and
CS samples
N1 [%] N2 [%]
CS/CNsa 68±5 32±4
CS 47±5 53±6
a CS/CNs, CS/CNs nanocomposite
However, these numbers should be considered only as qualitative information, since we have
evidence that after long exposure to X-ray, part of the protonated nitrogen (N2) is converted into
Page 91
PhD Dissertation of Fei LI 3 RESULTS AND DISCUSSION TOPIC 3
82
non-protonated (N1) in Appendix 1 (Chitosan XPS plots comparison between the 30 and 60
min). Interestingly, this change upon irradiation was seen only in CS sample and not in CS/CNs
sample (multilayer).
The relative amount of protonated amine groups in the CS/CNs sample is much lower than in
the CS reference sample. A possible explanation should be as follows: due to the reduced
thickness of the chitosan layer, the process of de-protonation by X-ray is much faster in CS/CNs
than in CS sample. On the other side, the percentage of protonated nitrogen groups is much
more stable in CS/CNs sample, maybe because linked to the underlying cellulose layer.
Considering the CS sample, the oxygen to nitrogen ratio is 4, in perfect agreement with the
expectations from the chitosan molecular structure.
Figure 28 Nitrogen peaks of XPS
The peaks in Figure 28 were decomposed into a sum of Gaussian/Lorentzian lineshapes with
the same FWHM. The lineshape used to model the nitrogen peaks is a weighted product of a
Page 92
PhD Dissertation of Fei LI 3 RESULTS AND DISCUSSION TOPIC 3
83
Gaussian (70 %) and a Lorentzian (30 %) lineshape. The peak at the lowest (absolute) binding
energy, peak N1, is associated to photoemission form N 1s orbitals in nitrogen atoms bonded to
one carbon atom (N-C bonds) or in non-protonated amine groups (Matienzo & Winnacker,
2002), while peak N2 is associated to oxidized or protonated nitrogen atoms (Dambies et al.,
2000; Matienzo & Winnacker, 2002). The binding energy of N1electrons is -399.8±0.1 eV, in
good agreement with the value reported in the literature (-400.0 eV) (Matienzo & Winnacker,
2002). The chemical shift between peak N2 and peak N1 is ΔE12=2.2 ±0.2 eV, in good
agreement with the literature (ΔE12=2.1±0.3 eV) (Da Róz et al., 2010).
3.13.3 Thickness of CS/CNs nanocomposite coating
Figure 29(a) and (b) show the thickness, obtained by atomic force microscopy (AFM) and
ellipsometry, respectively, for films constituted of an increasing number of bilayers and
deposited under two different pH conditions (CSpH2/CNspH6) and (CSpH4/CNspH2). CSpH4/CNspH2
combination is one of best compromises between the transparency and oxygen barrier, while the
pH 4 CS and pH 2 CNs are close to the original pH of two polymers which dissolve in 1 M HCl
and water. We chose these two combinations in order to better interpret another method for
changing the coating thickness, thereby, manipulating the oxygen barrier properties. The two
individual thickness measurements provide accordant results on each measured sample. Notice
that the thickness increase is proportional to the nominal number of deposited bilayers, clearly
indicating a stable and replicable growth process. Under the (CSpH2/CNspH6) deposition
conditions, an average thickness of ~7 nm per bilayer was gained and as shown in Figure 29(a)
and 2(b) (empty circles), consistent with previous values reported in the literature for a similar
pH combination (de Mesquita et al., 2010). Remarkably, the pH conditions of the employed
solutions can be suitably controlled as a means to tune the thickness of the individual layers.
Indeed, under the (CSpH4/CNspH2) conditions, we observe a huge change in the thickness of the
individual bilayers, which increases more than 3 times, from ~7 up to ~26 nm (solid squares).
The principle behind the significant thickness differences will be interpreted in the following
paragraph.
Page 93
PhD Dissertation of Fei LI 3 RESULTS AND DISCUSSION TOPIC 3
84
Figure 29 (a) Thickness, obtained from AFM, as a function of the number of CS/CNs bilayers
(n) deposited on a glass substrate at two different combinations of pH values: (CSpH4/CNspH2)n
(■) (dashed line: linear fitting with adjusted R2=0.996) and (CSpH2/CNspH6)n (○) (R
2=0.999). (b)
Thickness, obtained by ellipsometry, as a function of the number of bilayers (n) deposited on
silicon wafer for the same conditions as in panel (a). Non integer values of n represent
deposition of CS layers, while integer values are related to CNs deposition.
In order to further investigate the role of charges on the growth process, we measured surface
charge density of two polymers by means of conductometric titration at neutral conditions.
From such measurements, the amounts of cationic and anionic groups are determined to be
about 4600 mmol kg-1
of CS and 220 mmol kg-1
for CNs, respectively, in a good agreement
with other report (de Mesquita et al., 2010). In other words, the ratio of –NH3+ (from CS) to –
O–SO3- (from CNs hydrolyzed by H2SO4) is about 21. A highly different surface charge density
leads to large differences in the CS and CNs-layer thickness, as confirmed by Figure 29(b).
Combining the evidence of surface charge density with the thickness values obtained for each
individual layer by ellipsometry, we conclude that electrostatic interactions are the main driving
force in the LbL assembling of CS and CNs and in establishing their thickness. On the other
hand, the overcompensation has also to be taken into account as a crucial factor in determining
the thickness (Yang et al., 2011), especially under the CSpH4/CNspH2 conditions. In this case,
surface charges on the CNs layer (pH 2) are particularly sensitive to local pH (CS pH 4), thus
when top CNs layer was dipped into CS solution, the pH of the CS solution makes cellulose
segments more charged, which are able to attract more CS molecules than usual. A similar
process occurs for the complementary situation as well, when the CS layer (pH 4) is dipped into
the CNs solution (pH 2), the pH of CNs makes the CS chains become more charged and attract
more CNs. Regarding the original charge density of CS is much higher one of CNs, thus under
the local pH effect, a larger number of charged groups induces overcompensation, thereby
significantly changing the thickness of deposition.
Page 94
PhD Dissertation of Fei LI 3 RESULTS AND DISCUSSION TOPIC 3
85
In CSpH2/CNspH6 system, when the pH value of chitosan is 2, the amino groups on the chitosan
chains are more protonated than pH 6. The more protonated amino groups (at pH 2) mean that
the chitosan chains are more charged and the repulsions between the chains are stronger,
thereby the chains become more rigid, than the ones at pH 6. For CNs, when the pH value is
approaching 7 (pH 6), the CNs chains are more charged and rigid than the ones at pH 2. The
rigid chains of both chitosan and CNs result in the higher porosity of the films. Meanwhile, if
the samples whose top layer is chitosan is dipped into CNs pH 6 solution, the local pH 6 could
significantly decrease the charge density of chitosan, which brings on attracting much less CNs,
thereby the lower film thickness, vice versa (dipping CNs pH 6 into pH 2 chitosan solution).
Hence, adjusting the pH of two polyelectrolytes solutions or dispersions can tune both the
individual thicknesses and the relative proportion of the two biopolymers, thereby influencing
the oxygen permeability of LbL coating (Lee et al., 2008; Svagan et al., 2012; Yang et al., 2011).
In CSpH4/CNspH2 system, the local pH has more influence on the thickness of CNs due to its
much lower charge density. Control over the pH conditions seems, therefore, an easy way to
achieve ideal properties (ex. lower permeability) while keeping the number of deposition steps
reasonably low.
Figure 30 Oxygen permeability (PO2, cm3 m
-2 24h
-1 kPa
-1) for a 180 µm A-PET substrate coated
with increasing numbers of (CSpH4/CNspH2)n bilayers (n = 0, 5, 10, 15, 20, 25, and 30). Inset,
reciprocal value of the oxygen permeability coefficient (KPO2) (cm-3
µm-1
m2 24h kPa) of the
bio-nanocomposite coating only. All of the measurements were performed under ‗dry condition‘
(namely, 23 °C and 0% RH). For each number of bilayers, two independent samples were
prepared and tested, with typical deviation between the two measurements around 20%.
Page 95
PhD Dissertation of Fei LI 3 RESULTS AND DISCUSSION TOPIC 3
86
3.13.4 Oxygen permeability of CS/CNs nanocomposite coating
The oxygen permeability of the CS/CNs coating only and those of the coated A-PET are
presented in Figure 30 for the (CSpH4/CNspH2) condition, according to the number of bilayers (n)
which vary from 0 to 30. Following the thickness increase of LbL coating, the oxygen
permeability (PO2) value of coated A-PET is decreasing dramatically. At 30 bilayers, the PO2
value of coated A-PET reduces by ~94%, compared to uncoated A-PET, from about 0.2 down to
about 0.013 cm3 m
-2 24h
-1 kPa
-1, as a result of the strong electrostatic interaction and hydrogen
bonding between CS and CNs. In order to have the same oxygen permeability, a bare PET
should be about 2.7 mm thick. In the inset of Figure 30, the reciprocal value of the oxygen
permeability coefficient KPO2 is also reported to highlight the oxygen resistance of the LbL
coating only (after subtraction of the PET contribution). It is a remarkable evidence that from
10 to 30 bilayers, i.e. from 260 to 780 nm (thickness of one-side coatings on A-PET), this index
remains quite stable, hence KPO2 is approximately constant. We can thus assume that at the
testing temperature neither the oxygen diffusion coefficient, nor the oxygen solubility changes
in the CS/CNs nanocomposite, which therefore acts as a homogeneous material, independently
of the thickness and the number n of bilayers (for 𝑛 ≳ 10).(Lee et al., 2008) This is a relevant
assessment in order to design LbL self-assembly nanoscale coatings with a specific oxygen
permeability and optimized thickness. The most significant decrease of PO2 value is observed
from 5 to 10 bilayers, denoting a likely inhomogeneous structure of the LbL coating for the first
5 bilayers: some pores or extremely thin parts might exist, resulting in easier oxygen
penetration. In order to test this hypothesis, we studied the sample topography over (100×100)
µm2 areas by AFM. Figure 31 shows the topography for the bare A-PET substrate (a) and for
the coated substrate with 5 (b), 10 (c), 20 (d), and 30 (e) bilayers. Scratches on the bare A-PET
surface are likely caused by the friction between films during the handling, but most parts of the
PET are smooth. Noticeably, the overall height excursion of the 5 bilayers topography is
comparable with the average thickness of the film, denoting a non-uniform coverage of the
substrate by the coating, as can also be clearly seen by simple eye inspection of Figure 31b).
For the 10-bilayer coating, on the contrary, a fully covered surface, with many small CS/CNs
aggregates, is apparent from the AFM image, in qualitative agreement with the results of the
oxygen permeability measurements. For the 20- and 30-bilayer samples deposited under the
same conditions, the surface topography is qualitatively similar to the one observed for the
10-bilayer film.
Page 96
PhD Dissertation of Fei LI 3 RESULTS AND DISCUSSION TOPIC 3
87
Figure 31 AFM topography images and section lines of a bare A-PET substrate (a), and the
same substrate coated with 5 (b), 10 (c), 20 (d), and 30 (e) CS/CNs bilayers. Note the different
height scale bars.
Page 97
PhD Dissertation of Fei LI 3 RESULTS AND DISCUSSION TOPIC 3
88
The results shown in Figure 32 are also in agreement with the fitting results of the ellipsometry
data. Indeed, in order to increase the fitting accuracy, the Bruggeman model of the effective
medium approximation was employed (Hoeger et al., 2011). This allowed for the film thickness
analysis (see Figure 29) by incorporating air as an integral part of the ultrathin film. For the
(CSpH4/CNspH2) sample, in particular, we found that the percentage of air voids reduces from
30-40% for the first two bilayers to less than 6% after the fifth bilayer (see Figure 32), denoting
an increasing filling of the CS/CNs nanocomposite with increasing thickness. This finding is in
good agreement with the oxygen permeability results for the (CSpH4/CNspH2) sample, which
reveal the establishment of good barrier properties only after more than 5 deposited bilayers.
Interestingly, similar phenomena have recently been postulated as the reason for the absence of
oxygen-barrier properties in a multi-functional LbL coating produced by TEMPO-oxidized
cellulose nanofibers and nano-chitin (Qi et al., 2012), where 10 bilayers were deposited with an
overall thickness (~100 nm) very similar to our 5 bilayers coating. By our analysis, we are,
therefore, able to interpret such occurrence by quantifying the pore density by means of
ellipsometry measurements. The high porosity of CSpH2/CNspH6 sample is due to the higher
rigidity of molecular chains resulting from pH values. According to the ellipsometry results,
after 8 deposited bilayers the (CSpH2/CNspH6) coating was still characterized by more than 15%
air voids, which discloses that more LbL cycles are needed to obtain a homogenous
nano-coating compared to the (CSpH4/CNspH2) conditions.
Figure 32 The air void percentage P as a function of the number of bilayers (n), as obtained
from the fitting procedure of the ellipsometry data.
Page 98
PhD Dissertation of Fei LI 3 RESULTS AND DISCUSSION TOPIC 3
89
In this work, the OTR values were measured only under the dry condition and obtained
relatively good performance. Since CS and CNs are both hydrophilic biopolymers, the oxygen
barrier will be certainly reduced under high RH. This limitation is common to the currently used
synthetic barrier polymers (polyamide (PA), polyvinyl alcohol (PVOH), ethylene vinyl alcohol
(EVOH)) and led to the development of multilayer structures, designed in order to protect
moisture sensitive polymers with polyolefin such as low-density polyethylene (LDPE),
high-density polyethylene (HDPE), and polypropylene (PP).
Page 99
PhD Dissertation of Fei LI 3 RESULTS AND DISCUSSION TOPIC 3
90
3.14 Conclusions 3
We demonstrated the use of CS/CNs nanocomposites realized by LbL self-assembly as oxygen
barrier under different pH combinations, which has not been systematically reported so far to
the best of our knowledge. The oxygen permeability coefficient of CS/CNs nanocomposites is
as low as 0.02 cm3 µm m
-2 24h
-1 kPa
-1, close to EVOH co-polymers, under dry conditions (Lee
et al., 2008). Although the oxygen barrier property of the CS/CNs bio-nanocomposite is still not
as outstanding as that of some LbL coatings including inorganic nanoclays (Svagan et al., 2012;
Yang et al., 2011), we consider the absence of any potential risks for human beings and the
renewable origin of the carbohydrate polymers as significant added values that justify a deeper
investigation and exploitation of the LbL process applied to CS/CNs (Kovacs et al., 2010;
Lordan et al., 2011). Moreover, the production processes for chitosan and cellulose nanocrystals
are both low-energy consuming, especially compared to microfibrillated cellulose (MFC)
produced by mechanical processes (Isogai et al., 2011) and the inexpensive use of cotton linters
might lead to further promising practical applications. Finally, it deserves to be underlined also
the chance of finely tuning the oxygen permeability by means of the pH values and the sharp
control of the thickness associated with this process. Therefore, based on the advantages
outlined above, the LbL CS/CNs nanocomposite represents a promising oxygen barrier
component in transparent flexible packaging materials and semi rigid tridimensional objects
(bottles, trays, boxes and etc.).
Page 100
PhD Dissertation of Fei LI 3 RESULTS AND DISCUSSION TOPIC 3
91
3.15 References
Affinito, J. D. et al., 1996, A new method for fabricating transparent barrier layers. Thin Solid
Films 290–291: 63-67.
Angles, M. N., Dufresne, A., 2000, Plasticized starch/tunicin whiskers nanocomposites. 1.
Structural analysis. Macromolecules 33: 8344-8353.
Chang, J.-H. et al., 2003, Poly(lactic acid) nanocomposites with various organoclays. I.
Thermomechanical properties, morphology, and gas permeability. Journal of Polymer Science
Part B: Polymer Physics 41: 94-103.
Chung, A. J., Rubner, M. F., 2002, Methods of Loading and Releasing Low Molecular Weight
Cationic Molecules in Weak Polyelectrolyte Multilayer Films. Langmuir 18: 1176-1183.
Cooper, M. et al., 2011, Developing the NASA Food System for Long-Duration Missions.
Journal of Food Science 76: R40-R48.
Da Róz, A. L. et al., 2010, Adsorption of chitosan on spin-coated cellulose films. Carbohydrate
Polymers 80: 65-70.
Daiko, Y. et al., 2008, Proton Conduction in Thickness-Controlled Ultrathin Polycation/Nafion
Multilayers Prepared via Layer-by-Layer Assembly. Chemistry of Materials 20: 6405-6409.
Dambies, L. et al., 2000, Characterization of metal ion interactions with chitosan by X-ray
photoelectron spectroscopy. Colloids and Surfaces A: Physicochemical and Engineering
Aspects 177: 203-214.
de Mesquita, J. P. et al., 2010, Biobased Nanocomposites from Layer-by-Layer Assembly of
Cellulose Nanowhiskers with Chitosan. Biomacromolecules 11: 473-480.
Decher, G., 1997, Fuzzy Nanoassemblies: Toward Layered Polymeric Multicomposites. Science
277: 1232-1237.
Donadi, S. et al., 2011, PET/PA Nanocomposite Blends with Improved Gas Barrier Properties:
Effect of Processing Conditions. Journal of Applied Polymer Science 122: 3290-3297.
Dong, X. M. et al., 1996, Effects of Ionic Strength on the Isotropic−Chiral Nematic Phase
Transition of Suspensions of Cellulose Crystallites. Langmuir 12: 2076-2082.
Dvoracek, C. M. et al., 2009, Antimicrobial Behavior of Polyelectrolyte−Surfactant Thin Film
Assemblies. Langmuir 25: 10322-10328.
Eichhorn, S. et al., 2010, Review: current international research into cellulose nanofibres and
nanocomposites. Journal of Materials Science 45: 1-33.
Etienne, O. et al., 2005, Antifungal coating by biofunctionalized polyelectrolyte multilayered
films. Biomaterials 26: 6704-6712.
Farris, S. et al., 2012, Charge Density Quantification of Polyelectrolyte Polysaccharides by
Conductometric Titration: An Analytical Chemistry Experiment. Journal of Chemical Education
89: 121-124.
Frank, C. W. et al., 1996, Structure in Thin and Ultrathin Spin-Cast Polymer Films. Science 273:
Page 101
PhD Dissertation of Fei LI 3 RESULTS AND DISCUSSION TOPIC 3
92
912-915.
Fukuzumi, H. et al., 2008, Transparent and High Gas Barrier Films of Cellulose Nanofibers
Prepared by TEMPO-Mediated Oxidation. Biomacromolecules 10: 162-165.
Ghasemi, H. et al., 2012, Properties of PET/clay nanocomposite films. Polymer Engineering
and Science 52: 420-430.
Hoeger, I. et al., 2011, Ultrathin film coatings of aligned cellulose nanocrystals from a
convective-shear assembly system and their surface mechanical properties. Soft Matter 7:
1957-1967.
Isogai, A. et al., 2011, TEMPO-oxidized cellulose nanofibers. Nanoscale 3: 71-85.
Jang, W.-S. et al., 2008, Layer-by-layer assembly of thin film oxygen barrier. Thin Solid Films
516: 4819-4825.
Kasarova, S. N. et al., 2007, Analysis of the dispersion of optical plastic materials. Optical
Materials 29: 1481-1490.
Kato, Y. et al., 2005, Oxygen Permeability and Biodegradability of Polyuronic Acids Prepared
from Polysaccharides by TEMPO-Mediated Oxidation. Journal of Polymers and the
Environment 13: 261-266.
Kim, B.-S. et al., 2008, Hydrogen-Bonding Layer-by-Layer-Assembled Biodegradable
Polymeric Micelles as Drug Delivery Vehicles from Surfaces. ACS Nano 2: 386-392.
Kontturi, E. et al., 2007, Cellulose Nanocrystal Submonolayers by Spin Coating. Langmuir 23:
9674-9680.
Kovacs, T. et al., 2010, An ecotoxicological characterization of nanocrystalline cellulose (NCC).
Nanotoxicology 4: 255-270.
Lee, D. S. et al. Food Packaging Science and Technology. CRC Press, 2008, 58-59, 86-93.
Leterrier, Y., 2003, Durability of nanosized oxygen-barrier coatings on polymers. Progress in
Materials Science 48: 1-55.
Li, Q. et al., 2009, Structure and properties of the nanocomposite films of chitosan reinforced
with cellulose whiskers. Journal of Polymer Science Part B: Polymer Physics 47: 1069-1077.
Ligler, F. S. et al., 2001, Development of Uniform Chitosan Thin-Film Layers on Silicon Chips.
Langmuir 17: 5082-5084.
Lordan, S. et al., 2011, Cytotoxic effects induced by unmodified and organically modified
nanoclays in the human hepatic HepG2 cell line. Journal of Applied Toxicology 31: 27-35.
Matienzo, L. J., Winnacker, S. K., 2002, Dry Processes for Surface Modification of a
Biopolymer: Chitosan. Macromolecular Materials and Engineering 287: 871-880.
Nuraje, N. et al., 2010, Durable Antifog Films from Layer-by-Layer Molecularly Blended
Hydrophilic Polysaccharides. Langmuir 27: 782-791.
Osman, M. A. et al., 2005, Gas permeation properties of polyethylene-layered silicate
nanocomposites. Journal of Materials Chemistry 15: 1298-1304.
Page 102
PhD Dissertation of Fei LI 3 RESULTS AND DISCUSSION TOPIC 3
93
Park, Y. T. et al., 2010, High Electrical Conductivity and Transparency in
Deoxycholate-Stabilized Carbon Nanotube Thin Films. The Journal of Physical Chemistry C
114: 6325-6333.
Priolo, M. A. et al., 2010, Super Gas Barrier of Transparent Polymer−Clay Multilayer Ultrathin
Films. Nano Letters 10: 4970-4974.
Qi, Z.-D. et al., 2012, Multifunctional Coating Films by Layer-by-Layer Deposition of
Cellulose and Chitin Nanofibrils. Biomacromolecules 13: 553-558.
Ravi Kumar, M. N. V., 2000, A review of chitin and chitosan applications. Reactive and
Functional Polymers 46: 1-27.
Sánchez-Valdes, S. et al., 2006, Effect of Ionomeric Compatibilizer on Clay Dispersion in
Polyethylene/Clay Nanocomposites. Macromolecular Materials and Engineering 291: 128-136.
Sanchez-Garcia, M. D. et al., 2010, Natural micro and nanobiocomposites with enhanced
barrier properties and novel functionalities for food biopackaging applications. Trends in Food
Science & Technology 21: 528-536.
Sei-ichi, M. et al., 2001, Change in Refractive Index of Cellulose Particle with Particle Size.
Bulletin of the Faculty of Human Environmental Science, Fukuoka Women's University 32:
65-69.
Siró, I., Plackett, D., 2010, Microfibrillated cellulose and new nanocomposite materials: a
review. Cellulose 17: 459-494.
Svagan, A. J. et al., 2012, Transparent Films Based on PLA and Montmorillonite with Tunable
Oxygen Barrier Properties. Biomacromolecules 13: 397-405.
Yang, Y.-H. et al., 2011, Super Gas Barrier of All-Polymer Multilayer Thin Films.
Macromolecules 44: 1450-1459.
Zhai, L. et al., 2004, Stable Superhydrophobic Coatings from Polyelectrolyte Multilayers. Nano
Letters 4: 1349-1353.
Zhang, L., Sun, J., 2010, Layer-by-Layer Codeposition of Polyelectrolyte Complexes and Free
Polyelectrolytes for the Fabrication of Polymeric Coatings. Macromolecules 43: 2413-2420.
Page 103
PhD Dissertation of Fei LI APPENDIX 1
94
APPENDIX 1
Gas and water vapor permeability coefficient summary
Page 104
PhD Dissertation of Fei LI APPENDIX 1
95
Chitosan XPS plots comparison between the 30 and 60 min
Figure A-1 Chitosan XPS plots comparison between the 30 and 60 min
Table A-2 All analyzed peaks at the two exposures time (30 and 60 min)
Atoms C 1s [%] O 1s [%] N 1s [%]
Ex. time Conc. C1 C2 C3 C4 Conc. O1 O2 O3 Conc. N1 N2
30 min 64±3 10±1 74±2 12±1 3.5±0.5 28.3±0.4 9.7±0.5 88±2 2.6±0.4 7±1 47±6 53±6
60 min 67±3 11±1 72±3 13±1 3.5±0.5 27.7±0.4 9.5±0.7 88±3 2±1 7±1 53±4 47±3.5
The column ‗concentration‘ refers to the atomic concentration of the selected element,
calculated on the basis of the detailed scans and with the same relative sensitivity factors of
those used in Table A-2. The results are normalized only to the signal from oxygen, carbon and
nitrogen, and the agreement with the results of Table 11 is good, once the signal from
contaminants is discounted. There are no variations in the carbon and oxygen peaks, and also
the concentration of nitrogen in the sample does not change with the increase of X-ray exposure.
Parts of the protonated or oxidized nitrogen are converted into not protonated, or not oxidized
Page 105
PhD Dissertation of Fei LI APPENDIX 1
96
form.
References
Belbekhouche, S. et al., 2011, Water sorption behavior and gas barrier properties of cellulose
whiskers and microfibrils films. Carbohydrate Polymers 83: 1740-1748.
Fortunati, E. et al., 2012, Effects of modified cellulose nanocrystals on the barrier and migration
properties of PLA nano-biocomposites. Carbohydrate Polymers 90: 948-956.
George, J., Siddaramaiah, 2012, High performance edible nanocomposite films containing
bacterial cellulose nanocrystals. Carbohydrate Polymers 87: 2031-2037.
Khan, R. A. et al., 2010, Production and Properties of Nanocellulose-Reinforced
Methylcellulose-Based Biodegradable Films. Journal of Agricultural and Food Chemistry 58:
7878-7885.
Li, F. et al., 2013, Tunable green oxygen barrier through layer-by-layer self-assembly of
chitosan and cellulose nanocrystals. Carbohydrate Polymers 92: 2128-2134.
Martinez-Sanz, M. et al., 2012, On the Optimization of the Dispersion of Unmodified Bacterial
Cellulose Nanowhiskers into Polylactide Via Melt Compounding to Significantly Enhance
Barrier and Mechanical Properties. Biomacromolecules.
Paralikara, S. A. et al., 2008, Poly(vinyl alcohol)/cellulose nanocrystal barrier membranes.
Journal of Membrane Science 320: 248-258.
Sanchez-Garcia, M. D. et al., 2010, Morphology and Water Barrier Properties of
Nanobiocomposites of k/i-Hybrid Carrageenan and Cellulose Nanowhiskers. Journal of
Agricultural and Food Chemistry 58: 12847-12857.
Page 106
PhD Dissertation of Fei LI APPENDIX 2
97
APPENDIX 2
Copies of Extended abstract of papers
Publications
1. Journal: Electroanalysis
Title: Carbon Nanotube-Adsorbed Electrospun Nanofibrous Membranes as Coating for
Electrochemical Sensors for Sulfhydryl Compounds Abstract: A new method to modify
electrodes with carbon nanotubes (CNT) was developed. Multiwalled carbon nanotubes
(MWNT) were adsorbed on the electrospun nylon-6 nanofibrous membranes (Ny-6-NFM) and
used as a coating to modify conventional glassy carbon electrodes. The modified electrode was
designed for the amperometric detection of sulfhydryl compounds with the potential held at+0.3
V vs. Ag/AgCl. The modified electrode showed a linear response for cysteine up to 0.4 mM
(R2=0.997), with a sensitivity of 5.1mA/mM and a detection limit of 15mM. Other sulfhydryl
compounds showed similar results. After use, the Ny-6-NFM was easily peeled off, leaving the
bare electrode surface back to its original electrochemical behavior. This is the first attempt to
use a disposable membrane functionalized with MWNT for electroanalytical purposes.
Page 107
PhD Dissertation of Fei LI APPENDIX 2
98
2. Carbohydrate Polymers
Title: Tunable Green Oxygen Barrier through Layer by Layer Self-assembly of Chitosan and
Cellulose Nanocrystals
Abstract: We address the oxygen-barrier properties of a nanocomposite created by layer-by
layer assembly of two biopolymers, chitosan (CS) and cellulose, in nanocrystals form (CNs), on
an amorphous PET substrate. We systematically investigated the oxygen permeability,
morphology, and thickness of the nanocomposite grown under two different pH combinations
and with different number of deposition cycles, up to 30 bilayers. Noticeably, the thickness of
each deposited bilayer can be largely tuned by the pH value of the solution, from ~7 up to ~26
nm in the tested conditions. By our analysis, it is reliably concluded that such CS/CNs
nanocomposite holds promises for gas barrier applications in food and drug packaging as a clear
coating on plastic films and tridimensional objects, improving performance and sustainability of
the final packages.
Page 108
PhD Dissertation of Fei LI APPENDIX 2
99
Posters
1. SLIM 2010 in Zaragoza, Spain (2010)
Title: Moisture effects on water vapor permeability measurements of Polylactide films
Abstract: The moisture barrier properties of polylactide was investigated. The first part of the
study focused on the mosisture sorption of PLA films. The results showed that it was not linear
between the relative humidity (from 10% to 80%) and moisture sorption. The second part of the
study investigated the influences of relative humidity on the water vapour transmission rate
(WVTR) under the condition of 38 °C by two methods. One was by PLA bags with calthuim
chloride, another one was using the permeability equipment. According to the results, the
WVTR values were linear with relative humidity from 10% to 80% with very high correlation
coefficient. Therefore, it concluded that the moisture sorption did not have effect on the WVTR
under the different relative humidity.
Page 109
PhD Dissertation of Fei LI APPENDIX 2
100
2. PhD workshop in Napoli, Italy (2010)
Title: Development of nano-material for food packaging
Abstract: Over the past decades, polymers have replaced conventional materials in packaging
applications due to their functionality, lightweight, ease of processing, and low cost. However,
despite their huge versatility, a limiting property of these polymers is their inherent permeability
to gases and vapors. This has boosted interest in developing new strategies to enhance the
general performance and to carry out research aimed to understand the ‗structure-properties‘
relationships. The most frequently used strategies to enhance the properties of synthetic
polymers are the use of polymer blends, high barrier coatings, and the use of multilayered films.
Polymers can also be added with suitable fillers to form composites with enhanced barrier
properties. Fibers, platelets and particles have been used to form polymer composites with
enhanced mechanical, barrier and thermal properties. Environmental concerns and the need for
a sustainable development led to a growing attention towards bio-based materials also in the
packaging sector. Hence, the general goal of the project is to achieve better performance of food
packaging materials using bio-based nano-materials, mainly obtained from cellulose.
Page 110
PhD Dissertation of Fei LI APPENDIX 2
101
Page 111
PhD Dissertation of Fei LI APPENDIX 2
102
3. PhD workshop in Lodi, Italy (2011)
Title: Development of nano-material for food packaging
Abstract: The first two activities of the PhD thesis project are described. Firstly, the process of
producing cellulose nanocrystals was set up and the morphology of cellulose nanocrystals such
as a coating onto a plastic film, were observed by transmission electronic microscopy (TEM)
and field-emission scanning electronic microscopy (FE-SEM). Secondly, the coating conditions
and properties of cellulose nanocrystals were investigated and optimized by means of an
auto-applicator coating device and different techniques of characterization.
Page 112
PhD Dissertation of Fei LI APPENDIX 2
103
4. MATBIM in Dijon, France (2012)
Titile: Cellulose nanocrystals coating to improve the properties of flexible films for food
packaging applications
Abstract: The use of synthetic polymers is common in food packaging applications because
they are able to provide mechanical, chemical, and microbial food protection from the
environment and good products display. However, despite their enormous versatility, it is not
always easy to match the overall needs of a product with the specific properties of the flexible
packaging materials available. In the recent years, in particular, the expectations for more
sustainable packaging raised significantly. The strategies most frequently used to achieve the
required properties for a final flexible packaging material are the application of synthetic
coatings, the use of multilayered films, or the blending of polymers with suitable fillers or
additives. In this context, the use of nanocomposites or nanostructured materials, promises a
new crop of stronger, more heat resistant, and high barrier materials. Among the various
nanostructures recently developed for practical applications like hybrid organic-inorganic
systems, cellulose nanocrystals (CNs) are promising solutions used in combination with
different polymers due to their unique characteristics such as broad availability, low cost,
biodegradability, high stiffness and low density. Therefore, the general goal of our work is to
use cellulose nanocrystals as coating of common plastic films to modulate and improve their
original properties by means of a real sustainable approach.
Page 113
PhD Dissertation of Fei LI APPENDIX 2
104
5. SLIM 2012 in Changwon, Korea (2012)
Title: Green oxygen barrier of self-assembled bionanocomposites
Abstract: Layer-by-layer (LbL) assembly is commonly used in different research, especially for
nano-scale multiple layers on different substrates applied into various fields. Generally speaking,
the steps of LbL coating are polycation deposition, rising, drying, other polyanion deposition,
and repeated until obtaining the desired thickness and properties.
Page 114
PhD Dissertation of Fei LI APPENDIX 2
105
6. PhD workshop in Cesena, Italy (2012)
Title: Development of nano-material for food packaging
Abstract: The aim of PhD project research is to improve the properties of food packaging
materials and develop new food packaging materials. To the purpose, we use nano-materials to
improve the characteristics of materials, as well as to produce nanocomposite. Particularly,
biopolymer, cellulose nanocrystals (CNs), is considered as the main coating material for
improving the gas barrier properties of conventional packaging materials. In order to better
understand the relationships between nano-coating and its properties, we investigated the
oxygen barrier and mechanical properties, morphology and thickness of nanocomposite through
advanced instruments.