FEMISE REPORT ON THE EURO-MEDITERRANEAN PARTNERSHIP 2005 Analysis and Proposals of the Euro-Mediterranean Forum of Economic Institutes Samir Radwan, Economic Research Forum, Egypt Jean-Louis Reiffers, Institut de la Méditerranée, France Coordinators This text has been drafted with financial assistance from the Commission of the European Communities. The views expressed herein are those of the authors and therefore in no way reflect the official opinion of the Commission. June 2006 Institut de la Méditerranée FEMISE CAISSE D EPARGNE PROVENCE - ALPES - CORSE 2005
Transcript
FEMISE REPORT ON THEEURO-MEDITERRANEAN PARTNERSHIP
2005
Analysis and Proposals of theEuro-Mediterranean Forum of Economic Institutes
Samir Radwan, Economic Research Forum, EgyptJean-Louis Reiffers, Institut de la Méditerranée, France
Coordinators
This text has been drafted with financial assistancefrom the Commission of the European Communities. The views expressed herein are those of the authors and therefore in no way reflect the official opinion of the Commission.
June 2006
Institut de la Méditerranée
FEMISE
C A I S S E D E PA R G N EPROVENCE - ALPES - CORSE
2005
FEMISE REPORT ON THE EURO-MEDITERRANEAN PARTNERSHIP
2005
Samir Radwan, Economic Research Forum, Egypt
Jean-Louis Reiffers, Institut de la Méditerranée, France
Coordinators
This report was produced with financial support from the Commission of European Communities. The opinions expressed in this Report are those of the authors only and do not necessarily reflect the opinions of the Commission of European Communities.
June 2006
2005
-ii-
-iii-
June 2006
FEMISE REPORT ON THE EURO-MEDITERRANEAN PARTNERSHIP
2005
Main redactors :
Frédéric Blanc Institut de la Méditerranée, France
Nathalie Grand Institut de la Méditerranée, France
Maryse Louis Economic Research Forum Egypt
Yasmine Fahim Economic Research Forum Egypt
List of the main Femise researches used in this report:
FEM 21-31 : «Promoting Competitivness in the Micro and Small Enterprise Sector in MENA», leaded by Faculty
of Economics and Political Sciences, Cairo University, coord. Alia El-Mahdi, in collaboration with INSEA
(Morocco), Bogazici University (Turkey), Consultation and Research Institute (Lebanon) ; December 2005
FEM22-02 : «Impact of Liberalization of Trade in Services: Banking, Telecommunications and Maritime Transport
in Egypt, Morocco, Tunisia and Turkey», leaded by Bilkent University, Center for International Economics,
coord. Sübidey Togan in collaboration with Faculty of Economics and Political Science, Cairo University.
(Egypt), INSEA (Morocco), University of Tunis (Tunisia) ; December 2005
FEM22-06 : «The Informal Economy Employment Impacts Of Trade Liberalisation And Increased Competition In
Export Markets: The North African Textile, Clothing And Footwear Sector», leaded by Federico Caffè Centre,
Roskilde Univeristy Denmark, coord. Bruno Amoroso, Andrea Gallina, in collaboration with CREAD (Algeria),
INSEA (Morocco), University of Sussex (United Kingdom), University of Tunis, Tunisia ; October 2005
FEM22-07 : «Integration and enlargement of the European Union, lessons for the Arab region», Center for
European Studies, Faculty of Economics and Political Science, Cairo University, coord. Naglaa El Ehwany,
November 2005
FEM22-20 : «Flexibilité du travail et concurrence sur le marché des biens et services : impact sur les conditions
de travail et le développement du secteur informel en Algérie, au Maroc et en Tunisie», leaded by ROSES,
université de Paris I, coord. Gérard Duchêne, Boris Najman, in collaboration with CREAD (Algeria), CREQ
(Morocco) et ISTIS (Tunisia) ; November 2005
FEM22-22 : «Identification des effets sur la croissance et l’emploi des mécanismes d’ajustement micro-éconbomique de
l’offre face à l’ouverture», leaded by CEFI, université de la Méditerranée, coord. Patricia Augier, Michael Gasiorek, in
collaboration with INSEA (Morocco), Sussex University (United Kingdom) ; September 2005
FEM22-34 : «Les perspectives de changement sectoriel dans les pays méditerranéens: quels secteurs de crois-
sance après l’industrie légère?», leaded by CEPII, coord. Agnes Chevalier, Jean-Raphael Chaponnière, and
Marc Lautier, in collaboration with CARE-Université de Rouen (France), CEPN-Université de Paris 13 (France),
ESSEC Tunis (Tunisia), Hebrew University Jerusalem (Israel), Granada University (Spain) ; July 2005
FEM22-36 : «Obstacles to South-South Integration, to trade and to foreign direct investment: the MENA countries
case», leaded by CATT-Université de Pau, réseau EMMA, coord. Jacques Le Cacheux, in collaboration with
Granada University (Spain) ; October 2005
FEM22-39 : «South-South Trade Monetary and Financial Integration and the Euro-Mediterranean Partnership:
An Empirical Investigation», leaded by Institute of Financial Economics, American University of Beirut, Dir.
Simon Neaime ; June 2005
-iv-
Samir RADWAN Economic Research Forum Egypt
Jean-Louis REIFFERS Institut de la Méditerranée France
Nuhad ABDALLAH Academic Unit for Scientific Research ( AUSR) Syria
Sergio ALESSANDRINI Université de Modène Italy
Aziz Al KAZAZ Deutches Orient Institut University of Hamburg Germany
Bruno AMOROSO Federico Caffe Center Roskilde University Denmark
Slimane BEDRANI CREAD Algeria
Gérard DUCHENE Université de Paris XII France
Mahmoud EL JAFARI Al Quds University of Jerusalem Palestine
Alia EL MAHDI MSA Université-Le Caire Egypt
Michael GASIOREK Sussex University United Kingdom
Alejandro LORCA CORRONS Universidad Autonoma de Madrid Spain
Samir MAKDISI Institute of Financial Economics Am. Univ. in Beirut Lebanon
Tuomo MELASUO University of Tampere TAPRI Finland
Jan MICHALEK Department of Economics Université de Varsovie Poland
Cherif MONDHER ESC Sfax Tunisia
Seyfeddin MUAZ Royal Scientific Society Jordan
Lahcen OULAHJ Université Mohammed V Morocco
Yilmaz ÖZKAN Center for Mediterranean Studies Turkey
Khalid SEKKAT Université Libre de Bruxelles Belgium
Alfred TOVIAS Leonard Davis Institute of International Relations Israel
Meine Pieter Van DIJK UNESCO-IHE Institute for Water education Netherlands
The Mediterranean Region is once again at a turning point. Ten years ago, the Barcelona process had created a new framework for North–South coopera-tion, which also laid the foundations for South–South integration, and charted the way to build peace and prosperity. The present transition to a neighbou-rhood policy, in turn, creates opportu-nities and challenges. It is in this fra-mework that Femise should examine the results obtained and identify the requi-rements for a successful neighbourhood policy.
With regard to the results obtained up to the present, the Femise report, writ-ten in February 2005, on the ten years that have elapsed since the Barcelona process, took stock of the first ten years after Barcelona, at the economic level. It is true that these results did not meet expectations, nor were they able to make the needed modifications to the dynamic process in the Mediterranean countries, so as to give impetus to visi-ble changes in the daily lives of stake-holders. However, the conclusions of the report focused on the following facts:
√ There are two incontestable and positive facts that will serve as presup-positions in this report. The first is that a macroeconomic discipline has been achieved, which preserves the major
macroeconomic equilibriums indispen-sable to building a new dynamic process in these countries. It should be empha-sised that these achievements are not only reflected in figures (cf. Report 2005), mainly in budgets, balances of payments, or inflation levels, which pro-tect the future, give the Mediterranean countries time to make the necessary modifications and allow Europe to think up effective support tools, but they are also and no less importantly, now roo-ted in the expectations of stakeholders, mainly non-locals. It is suffice to say, that even among the most conservative institutions, which evaluate countries in the world according to different criteria, the great majority of Mediterranean Countries are high on the list in terms of economic regulation.
√ The second positive point, which also gives us hope in the future of Euro-Mediterranean partnership, is the almost unfailing support that civil society in Euro-Med countries has given the pro-cess. Paradoxically, even harsh judg-ments, made on the occasion of the tenth anniversary, indicate a form of irritation with a promising tool, which is tardy in producing concrete results. Today, this is what should be a priority: how can the efforts of the two coasts of the Mediterranean be made visible. How to make visible: actions taken as part of association agreements and the positive effects of the considerable adjustments.
Samir Radwan, Economic Research Forum, EgyptJean-Louis Reiffers, Institut de la Méditerranée, France
Coordinators
June 2006
-2-
In brief, help the stakeholder to seize the impact of this process in their daily lives, rather than just the institutions.
√ On the other hand, internal fac-tors, (the enlargement of Europe, con-tinued regional conflicts) and external factors (evolution of the WTO, invol-ving a generalised open economy policy, which has diminished developments in the MPs and the opening up of China, mainly within the context of multi- fibre accords), and, at times, unforeseeable and at others, ignored factors have wei-ghed heavily on the Euro-Mediterranean dynamic process. To manage these con-sequences, macro economic stability alone will not be enough. It may be an indispensable foundation, but it should be completed by impetus-giving ele-ments. The ILO annual international report on world employment indicators emphasises that economic growth alone, will not be enough to meet global job needs.
The idea of partnership was that by combining macroeconomic stability with a liberalisation strategy, through the establishment of a free trade zone with Europe, the Mediterranean coun-tries would have the basic elements for development, to which the effects of induced investments would automati-cally be added. Such effects would be improved competitiveness in production, sector specialisation and development, and improvement of regional relations among the south Mediterranean coun-tries, which would place them in a better position in the dynamic process. The international community has not failed to emphasise this and has modi-fied its expectations for the region and as a result, increased the movement.
It should be noted that this mechanism has been overestimated, as most of the expected automatic relations have har-dly progressed.
Our report is intended to continue this research. First, it takes macroeconomic stabilisation for granted, without recon-sideration, especially as 2005 has been marked by the energy crisis, which has made it too early to reach final con-clusions At the same time, it is part of the perspective of the inadequate equi-librium achieved at present, since the pace of resolving the job problem is not satisfactory.
The idea, therefore, is to identify the ini-tial and present conditions that the sta-keholders encounter, the specific reasons that have led to the inadequate dynamic process promised by the association agreements, while trying to highlight elements that could modify the growth paths and social adjustment forms. This question had been posed by Femise in its last rest research programme. It had raised the question of the supply capacities of the MPs in response to the demand generated by the liberalisation strategy, which was the maximisation of the induced investments, expected when the process was put in place.
In this report, and on the basis of seve-ral research studies, we shall adopt as a hypothesis, the sources of a new dyna-mic process in the renewed performance of stakeholders, in the first place, in the network of enterprises, as they are the establishments that will provide the jobs that are absolutely necessary to the equilibrium of the region. However, these enterprises develop in a special historical background, which can only
-3-
be modified slowly and has many cons-traints. Therefore, in the second place, we should identify these constraints, which result from the sector structure of these enterprises, mainly in terms of opportunities. We should look for the terms of specialisation and the opportu-nities that can generate a better circle. This impetus may be well supported in the framework of regional agreements. This, in fact, is the very idea of Euro-Mediterranean partnership. Then, emer-ges the question of what type of North-South and South-South partnership would be consistent with the initial 1995 objectives and the present geo-political developments.
In the first part, the report discusses several surveys carried out by network teams and the specific processing of surveys on national enterprises, to bet-ter understand the performance of firms and the impact of liberalisation on them, particularly with regard to employment.
Local industries are, to an extraordi-nary extent, still dominated by micro enterprises, which provide the better part of private employment. It is in their performance, constraints and perspec-tive that we can find the dynamics of employment. The budgetary measures in the taxation policy of States make it imperative to understand performance, particularly with regard to distinctions made between the formal and the infor-mal sectors which, in Femise Studies, appear to be more blurred than pre-viously thought.
The second part will make an analysis by sector of the economy of MPs, with emphasis on textiles. It is now clear that improved supply, which is indispen-
sable in view of the job constraints in MPs, can not automatically result from the adoption of a liberalisation strategy. Specialisation and the dynamics of the profession, at the European and interna-tional levels, are among the main condi-tions of competitiveness and durability of the enterprises.
In the Euro-Mediterranean region, the present situation of Mediterranean coun-tries is largely due to the fact that the two basic sectors of the economies of these countries (in 1995 and at pre-sent) are, on the one hand, agriculture, which for a long time has been margi-nalised in agreements and it is only now that it appears on the agenda, and on the other, the textile-clothing industry, which has been drastically disrupted by the end of the multi-fibre agreements and the opening up of China.
To address the question of how a new dynamic process that is more suited to the needs of the MPs can be launched, will inevitably lead us to the question of agriculture, a subject that has been discussed by Femise in 2003 and which will not be dealt with in this report. The question of what comes after tex-tiles, or at least after 2005, also arises. Specialisation options, whether they are dictated by a forced adaptation to the changed conditions of competitiveness at the national and regional levels, or by industrial policy strategies, are not without effect on employment and growth in each country.
As Femise has already pointed out, the MPs should find their place in the most dynamic external markets, an adjust-ment which remains to be done by most of them.
-4-
However, the competitiveness of export enterprises in MPs can not be an end in itself in view of the employment pro-blem in these countries. In addition to working in sectors that generate rapid economic growth, specialisations of MPs should allow for sufficient absorption of employment, or at least, enough to maintain present unemployment levels.
The adaptation of industries to the new conditions of competitiveness, at the local and international levels, may arise from voluntary industrial policies or sec-tor reform. In this transition, production factors are moved, leading to the loss of some jobs and the creation of others. For the MPs, the question of the final results is undoubtedly the most important. Over and above the industrial sectors, some services will assume major importance and their liberalisation is likely to modify some present processes.
Third, the report deals with the ques-tion of regional integration, in terms of the potential contained for the regional integration of the South and the form Euro-Mediterranean and South integra-tion can take.
At the strictly economic level, it would be a mistake to think that the enlarge-ment of Europe and more particularly, regional conflicts on the southern coasts of the Mediterranean, do not affect sta-keholders’ expectations, and as a result, economic flow. With the establishment of the new neighbourhood policy, the shape of this integration will become a more pressing question. Should it be unilateral, multilateral or take the form of regional agreements between coun-tries at the same development levels? Each of these options is expressed in a
specific way. A South-South integration would involve reallocation of specific factors that could be substantially diffe-rent from those generated by integration with Europe, for instance. In view of the socio-economic situation of the MPs, they should not be allowed to shoulder the same readjustment costs several times. This leads to an in-depth conside-ration of the consistency of the different agreements.
Then, there is the very under-estima-ted symbolic dimension: as we said in the introduction, the durability of the Euro-Mediterranean region cannot be conceived of without civil society. It is this support of civil society that will be the most important mainspring of a rapid transition, once the right directions have (finally) been defined. This is why it is essential that association agree-ments, partnership and neighbourhood policy should be strongly felt in the daily life of stakeholders. Then not only will European policy be the decisive factor, but also the regional policy of MPs.
Finally, the 2005 annual report deals with aspects of migration. Partnership seeks to create a zone that maintains equilibrium, peace and prosperity that is to establish a de jure interdependence that will de facto link the two coasts. However, the disequilibrium between the possible circulation of financial flows, commodity flows and human flows, the latter being the most systematically res-tricted can only generate friction, eco-nomic reallocations that are not optimal and bring out the partial character of the present tool. It could be said that, in order to allow partnership agreements to be felt in daily life, to win over public opinion in the South and to have the sup-
-5-
port that will enable the acceleration of reforms, there should be developments in the possibilities of human flows.
Furthermore, at the strictly economic level, time is needed to make substan-tial modifications in the anticipations of the international community, in terms of work in the MPs. This will continue to affect investment flows, especially as a subjective disadvantage will persist between them and the countries of the East (because a well known political pro-ject will continue) or with China (because its weight generates unequalled econo-mic perspectives). In fact, the need for financial investments in small projects is important, as we shall see in the next part of this report. From this point of view, migration generates a resource: the funds that are sent back home by migrant workers (mainly in Europe), which leads us to think that they could be an important lever to enhance the growth paths.
I- The enterprises facing the opening
1. Small entreprises, a new panacea?
Studying the performance of the MSE sector is not an easy task, as it requires facing (at least) two sets of challenges: (i) theoretical challenges, including defi-nition problems, framework designing, etc; and (ii) practical challenges, since studying this sector means studying more than 90% of the enterprises that exist in a country, most of them are not only informal but also deeply integrated into the society that they are hardly located physically.
The need to accelerate economic growth of most MPs has created the need to tap
new sources that would push those eco-nomies forward. Given the prevalence of the MSE sectors in economic activi-ties, they could represent this endoge-nous power that, if given the adequate support, can contribute significantly to sustainable growth. The MSE sector can also contribute to the solution of the unemployment problem, be a channel of investment of small savings, and a source of enhancing the economies’ value added.
It is against this backdrop that the idea of studying this sector has originated. Despite the many challenges that this would involve, it was thought wor-thwhile to attempt to provide adequate and targeted policies based on sound understanding of this sector’s dynamics if it is to realize its potential.
With this belief, the FEMISE (together with several other international donors) have funded a large and pioneering study on the means to promote the competiti-veness of this sector in four MPs: Egypt, Lebanon, Morocco and Turkey. The study is based on a field survey of 5,000 micro and small enterprises operating in each of those countries (3,000 in the case of Lebanon) and aims at understanding their characteristics, the impediments to their performance, their prospects and the determinants of their success.
The main surveys of the MSE firms were conducted in the four countries between 2001 (Turkey), 2002 (Morocco), and 2003 (Egypt and Lebanon) followed by a follow-up survey (except in the case of Lebanon). The survey was based on filling questionnaires at the enterprise level, at the entrepreneur level, and at the household level.
-6-
The database of these surveys will allow better assessment of the performance of this sector and deeper understanding of its needs. A profile of the MSE sector in selec-ted Mediterranean Countries
The MSE sector, defined here as formal and informal enterprises employing 1-49 workers, represents the backbone of the activities of the MPs economies. This sector represents more than 90% of the enterprises, employing 60-70% of workers in these countries and con-tributing from 30-50% of the econo-mies’ value added.
97% of the enterprises (formal and informal) in Egypt, are micro and small (employing from 1 to 49 workers), the informal[1] ones constitute around 81% of this share. It is also to note that the informal female workers represent only 14% of the whole informal workers community, which is a relatively modest share given that females constitute 50% of the population[2]. The MSE sector in Egypt employs 62% of total formal and informal workers (88% informal wor-kers vs. 23% of formal). In Turkey this sector represents 99.4% of the total number of enterprises, most of which are formal since registering the firm is an obligation before setting up certain activities. This sector employs 73% of non-agriculture workers and contri-butes 64.8% of total value added. In Lebanon, 96% of enterprises are either micro (88%) or small (8%) accounting for more than 50% of total employment. In Morocco, micro and small enterprises represent 99.6% of total enterprises, and represents more than 70% of total employment.
Determinants of Success of the MSE Sector
Success of the MSE sector does not only depend on the good performance of the firm, or the education and training of the entrepreneurs. This sector does not function in a vacuum: macroeco-nomic and business environment has significant impact on the performance of the MSEs. Prospects of the MSEs, as reflected in the Egyptian and Turkish surveys, have been greatly affected by the recession that both countries were undergoing. One may argue that this reflects only a short temporary period that should not be generalized, but the fact that this sector is not meeting its growth potential still holds. In fact, both the performance of the firm and the macroeconomic environment in which it operates play a major role in the success or failure of this sector.
In view of these conditions, this research programme adopted a combination of quantitative and qualitative approaches to data collection in order to capture both the context and dynamics of the issue within a national and comparative scope for the entire region.
The coming section will discuss the determinants of success of this sector as identified by the entrepreneurs them-selves in Egypt, Lebanon, Turkey and Morocco. This could make major con-tributions to the designing of policies in each of those countries.
1. Formality[3] represents one of the major determinants of success of MSEs. The degree of informality varies depending on its definition and on the regulations. In some countries such
-7-
as Turkey and Lebanon, registration is a requirement before undertaking some activities. However, in Egypt, where being registered is not a requi-rement, it was found that 80% of the MSEs are informal. Being formal holds many benefits as it means better access to financial and administrative support, but most entrepreneurs find the procedures of registration very complicated, time consuming and expensive, relative to the potential gains it may achieve.
2. The presence of MSEs in Clusters could, generally, provide an enabling environment that enhances efficiency of firms through existence of different production complementary entities. Being in a cluster ensures the exchan-ge of knowledge and experience, and provides business inter-linkages between the firms operating in the same cluster community, which adds value to the performance of the firm through the growing social capital. Being in a cluster was found to be the top priority determinant of success for MSEs in Egypt. In Lebanon, however, the norm is reversed; MSEs that do not belong to a cluster achieve bet-ter performance levels. This is due to the nature of clusters in Lebanon, which consists mainly of firms in the same, or similar, line of business. As a result, a competitive environment arises, restricting profits, and thus performance.
3. All studies of MSEs have showed that being a male entrepreneur means a better performance of the firm than being a female. Regardless of their education, training and experience (if any), female entrepreneurs are at
a disadvantaged position compared to males: they face more difficulties in the market, in getting education or training and in getting access to finance and other support services. Moreover, the woman’s role in the household limits her ability to work longer hours in her business.
4. The existence of an enabling busi-ness environment that ensures good working conditions, the availability of specialized workers, access to finan-cial and non-financial business ser-vices, enjoying fiscal incentives and limited competition from larger firms are regarded as essential tools to ensure the success of the enterprise.
5. The success of MSEs depends on the
educational attainment of its entrepre-neurs and the training and/or expe-rience he/she gained. It was found in Morocco, Lebanon and Turkey that the best performing firms are those that are owned by educated entrepreneurs who received more than 10 years of education. Contrarily, in Egypt, it was found that the years of education have no effect on the performance of the firm.
6. Equally important than being educa-ted is the formal vocational or tech-nical training for entrepreneurs. In turkey only 10% of the entrepreneurs had formal technical or vocational education. In Egypt, the percentage of entrepreneurs who received tech-nical education was 3.4% for the males and 2.9% for the females. In Lebanon, this percentage is 9% and 15% respectively. In Lebanon what matters most is not the voca-tional training (it had a negative
-8-
affect on the performance of the firm) but entrepreneurs who have training apprenticeship experience do benefit their firms, which record better per-formance levels. This is true in all countries under consideration becau-se this type of training is specialized and thus can be particularly relevant to the field of the firm.
7. Having access to financial resources constitutes an important determinant of the success and the sustainability of MSEs. As denoted by the entre-preneurs, it is considered one of the major challenges they face: financial institutions are not apt to lend small enterprises due to the high risk asso-ciated with lending small unknown entrepreneurs and high transactions cost linked with small loans. As a con-sequence, it was found in the survey conducted in the four countries that a very small percentage of entrepre-neurs rely on formal loans to finance their businesses, while most rely on their own savings or other sources of finance.
8. Another important determinant of success is the availability of the ade-quate infrastructure (such as roads, transportation, electricity, water, sewage, etc.) and also the access to
some machinery and advanced tech-nology (especially for firms working in the industrial sector) that would increase productivity and ensures the sustainability of growth.
Assessment of Performance: A Case study of the MSE sector in Egypt
In order to highlight the growth dyna-mics of MSEs in Egypt, a Growth Index was constructed (using the available data from the main survey (2003)), where data related to their perfor-mance was given in two points of time: survey time (2003) and one year ear-lier (2002).
The Growth Index[4] is composed of four growth-indicating variables: (i) value of invested capital; (ii) space of enterprise (iii) number of workers; and (iv) value of used raw materials. The Index was deri-ved based on the average change rate in the values of those combined variables at the survey time compared to the pre-vious year. The growth-indicating varia-bles, help in shedding some light on the dynamic change that occurred during this period.
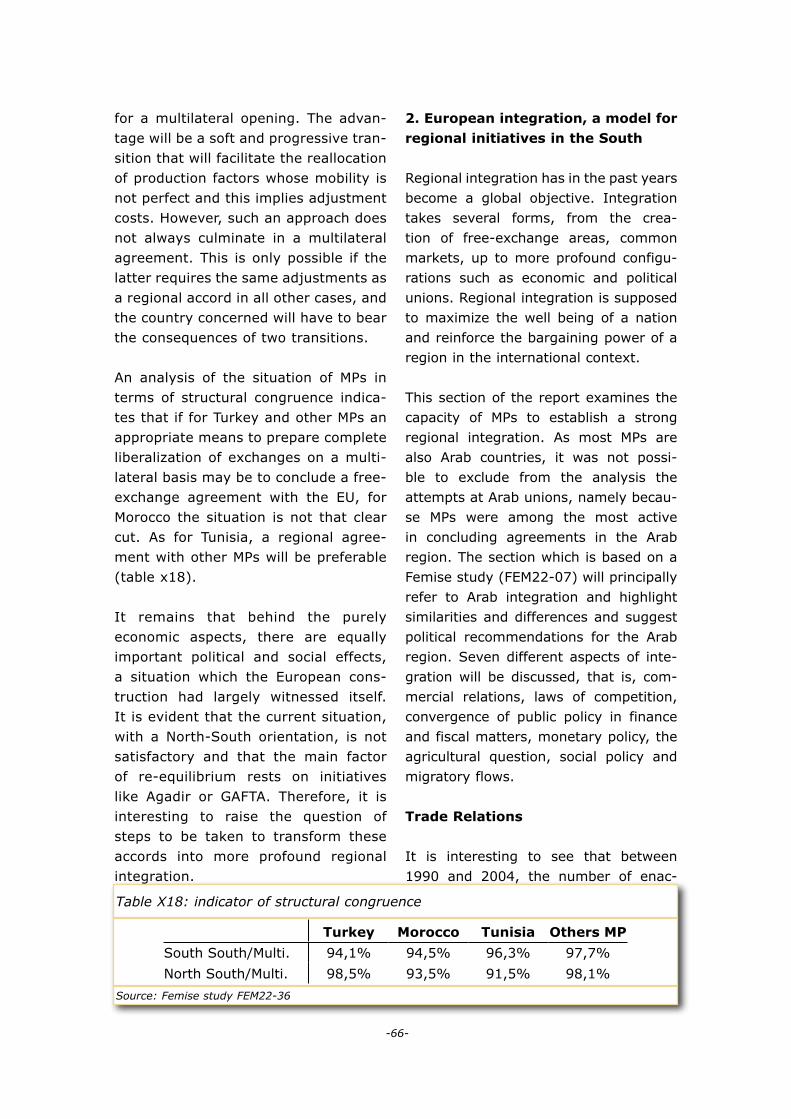
On average, the MSEs growth rate did not exceed 2.2% between 2002 and
Table X1: Sources of Finance for MSEs
Source of finance Egypt Lebanon Turkey
Inheritance 21.0 18.0 5.3
Own savings 67.1 60.0 78.9
Liquidation of assets 3.6 3.8 1.9
Formal loans 3.5 4.2 0.6
Informal loans 2.6 2.5 8.8
Own remittances 0.5 5.5 0.1
Source: Femise, from research n° FEM21-31
-9-
2003. The growth index showed that more than half (52.2%) of the MSEs did not grow within that year. Most of the remaining MSEs (28.5%) dete-riorated and only 19% had registered some growth. While 17% deteriorated by more than five percentage points, only 12% grew with more than five percentage points.
Testing the relationship between the growth index and some of the charac-teristics of the MSEs can assess the effect of those characteristics on the potential growth of the sector. The results showed:
√ In terms of economic activity, firms working in the industry sector have achieved the highest average growth of 4.1%, compared to 3.8% growth in the services sector, and only 1.3% in the trade sector.
√ On another front, it was found that 15% of the MSEs working in the services sector witnessed a growth of more than 5%, while only 10% of the MSEs working in the industrial sector achieved this growth rate.
√ In terms of size, data showed that small enterprises employing 5 to 9 workers have achieved the highest growth rate of 4.75%, while those employing 10-49 workers have dete-riorated with 1.3%.
√ Data showed that while almost half of the micro enterprises (1-4 workers)
did not grow, 30% have deteriorated and only 18% have achieved some growth.
√ The picture has somewhat changed
when considering small firms (5-9 workers), where the percentage of firms that deteriorated is almost equal to those that have improved (25%).
√ While most of the larger firms (80%) (10 to 49 workers) remained unchan-ged during that year, indicating that that kind of firms is more stable. The number of firms which deteriora-ted was larger than those that have improved, putting the growth rate of this group at the negative level (1.3%).
√ In terms of invested capital, results showed that firms that have invested a capital between 5,000 and 20,000 LE have achieved the highest growth rate of 4.4% while those that have invested less than 1,000 have achie-ved the lowest of almost 0.5%.
√ One of the interesting results that were found is the one deriving from studying the relation between the growth index and formality. It was found that informal firms have achie-ved a higher average growth rate of 2.7% than those that are formal (1.1%).
√ In terms of pattern of growth, it remains the same for formal and
Table X2: Distribution of MSEs according to the index categories
Growth Index value <-5% -5<…< 0% 0% 0<…<5% > 5 %
% MSEs 17,1 11,4 52,5 7,1 11,9
Source: Femise, from research n° FEM21-31
informal firms: half of both categories remain unchanged (52%); almost 28% of the firms (either formal or informal) deteriorated, and almost 19% of them (formal or informal) achieved some growth.
To summarize, the best performing firms in Egypt were those: 1. working in the industrial sector;2. with a number of workers between 5
and 9;3. with an invested capital between LE
5,000 and LE 20,000; 4. and informal.
Prospects of MSEs
It is clear that the performance of MSEs and the environment in which they ope-rate play a major role in how the entre-preneur perceives the future of his firm. The study used a Future Prospects Index to measure the perception of the entre-preneurs in the MSE sector on how they regard the future of their businesses.
The index was calculated based on data gathered from the main survey (2003) and after one year from the follow-up sur-vey (2004) about the expectations of the entrepreneurs regarding specific issues related to the future of their firms.
The index measures the future pros-pects of the entrepreneurs based on the following factors: (i) employment; (ii) space of the economic unit; (iii) output; (iv)invested capital; (v) revenues; (vi) domestic sales; (vii) exports; and (viii) introducing new products[5].
It was found that in Egypt, Morocco and Lebanon most entrepreneurs
-10-
foresee no changes in their businesses. Entrepreneurs in Egypt had a more negative perception of the future of their businesses in 2004 survey than in 2003[6]. The negative expectations were quite definite on the number of the entrepreneurs who intend to leave the business or to decrease the num-ber of workers, the value of assets, the output, the domestic sales and the revenues. While in Lebanon, the picture was completely different, with the num-ber of entrepreneurs that expect the growth of their firms larger than those that expect contractions of their activi-ties. High expectations were particularly perceived in output (42% expected an increase in output) and domestic sales (54%). In Morocco the picture was similar to that of Lebanon, where entre-preneurs that had good expectations about the future of their firms were larger than those with negative percep-tions. The expectations were higher in terms of future production (39%) and revenues (49%).
Policy recommendations
It is not difficult to generalize the policy recommendations that should be used to promote the MSE sector, as the basic needs of this sector are more or less the same in all the MPs. However some country specificity reflecting the spe-cial conditions under which this sector operates, have to be considered. The recommendations should not only focus on the policies that would enhance the growth of the MSEs, but more impor-tantly to improve on their effectiveness and the conditions under which they operate. It should be noted that the effectiveness of these recommendations is conditional on pursuing macroecono-
-11-
mic reforms pertaining to infrastructu-ral, fiscal, institutional, sectoral, and employment policies.
√ It is important to differentiate between the micro and the small enterprises in designing the policies relevant to their growth. The two groups have different productivity schemes, different condi-tions, different growth perspectives and different needs. Policies targeting Micro enterprises should focus on pro-moting the productivity and efficien-cy by providing technical assistance programs especially in cluster com-munities. Whereas policies directed towards small enterprises, need to be more diversified containing financial, technical and marketing supports and export promotion programs.
√ Policies should be directed to link this sector (specially the small ones) to larger firms. This sector could act as food industries, subcontrac-tors, service/maintenance providers of goods or services produced by the larger companies. This sector can be considered the missing middle that could link between larger firms. One suggestion would be to give the large firms those links with micro or small ones, special incentives or tax exemptions.
√ There is a need to provide an ena-bling business and institutional envi-ronment. This includes the need to simplify the registration procedures and to design special tax schemes for this sector as incentives that would encourage it to operate formally. Most of the informal MSEs, have a tendency to avoid growth beyond certain limits and/or prefer operating informally,
based on the fear of having to deal with public administrations, taxes, etc. Also there is a need to encou-rage MSEs to work in clusters so as to share the benefits of supporting counseling and services.
√ As noted by most entrepreneurs in the four surveys, access to official loans is a very difficult, if not an impossi-ble, task. Loans could be granted to specialized activities/projects based on market needs, while reducing the conditions and required guaranties.
√ As reflected in the surveys, «on the job training» is considered the main (and sometimes the only) source of training. In order to promote this sector, more formal training schemes should be organized. Public training centers are not enough; there is a need to encourage NGOs and the private sector to invest in the esta-blishment of new modern specialized training centers and/or finance reno-vation and management of the exis-ting public training centers.
√ More specialized policies should be made to promote women entrepre-neurs who are put at a disadvantaged position: they are less educated, uns-killed, untrained, they suffer from low productivity, low earnings, they have lower added-value; and have less access to assets and resources.
√ The number of exporting MSEs is extremely low (if any). MSEs do not have the knowledge, experience or infrastructure required for exporting. In addition, training and counselling services on exporting, and the crea-tion of specialized exporting enter-
of enterprises, its ability to export, etc.), its weight in industry and in categories of industries. Heterogeneous enterprises have been identified as an important explanation for the job crea-tion/cutting waves, which, in this case, are not directly linked to specific sector shocks or fluctuation cycles but to the performance of firms. Through this ana-lysis, it was possible to understand the impact of an open economy on employ-ment in Morocco employment, which was symbolised by Morocco’s adherence to the WTO in l995 and the signing of an association agreement with the EU. The analysis was also conducted on Turkey with a similar objective.
An in-depth study of the Moroccan case revealed that the rigidity of its labour market was a less important obstacle than claimed by previous studies and that manpower mobility was rather high:
√ In Morocco total net job creation was low (64,000 that is an average annual growth of 1.2% over that period), especially since 1998, in spite of great man-power mobility, demonstrated by the gross job crea-tion figures (650,000) and gross job losses (586,000) and the feeble constraints contained in legislation (especially for firing). This is the fac-tor that is often blamed.
√ Job creation was quite regular. It rose to about 11.8% between 1990 and 2002 (a 0.7 lower standard deviant) whereas job losses, were almost as high, (10.6) and more chaotic (1.9 standard deviant), which was consistent with the results obtained for other developing countries. This
-12-
prises capable of mediating between export markets and MSEs could be an effective way to promote an export culture among the MSEs. MSEs with export potential should be informed about foreign markets as well as foreign enterprises to enhance the possibility of an active cooperation.
2. The liberalisation–employment relationship from the point of view of small enterprises
The characteristics of small enterpri-ses and employment, which are the main part of the industrial network in MPs, allow us to better understand the channels through which the expected benefits of an open economy can be transmitted. However, the impact on jobs should be defined in greater detail. That is to say, we should not only eva-luate the global result, which has been modest, during the past ten years, but above all, the exact mechanisms that have led to this impact and which can lead to an improvement in potential consequences.
This is what another study of Femise has attempted to do[7], on the basis of the annual survey of the Moroccan Ministry of Commerce and Industry covering the period from 1990-2002.The teams studied the process of crea-ting and cutting jobs in the branches of the manufacturing industry, to obtain an exact understanding of the move-ment that is produced and that reflects the consequences of industrial adjust-ment. This does not allow an analysis at the sector level of the changes in net employment. The objective is to better understand the origins of employment reallocation (size, sector and activity
-13-
can be explained by the fact that job cutting, more than job creation, is linked to the crisis. Furthermore, the slowdown of net job creation would be the reflection of a stron-ger elimination process rather than a drying up of the job creation pro-cess (Table X3).
√ Job creation was in 90% of cases the result of durable enterprises, which was not the case for most other coun-tries sampled in this analysis, but these were also the enterprises that cut the most jobs (57%), when they reorganised their workforce (43% were the result of bankruptcy). These job losses were very variable and fluctuated between 32.8% in 1999-2000 and 76% in 1993-1994.
However, in addition to the perfor-mance of firms, the case of Morocco
illustrated the impact of specialisation, whose limits were beginning to produce the results that were prejudicial to job creation:
√ Sectors which absorbed most man-power, especially unskilled labour, namely the textile and leather indus-tries (46.7% of total manufacturing employment in 2002), chemistry and Parachemistry (19.4%) and food pro-cessing industries (18.7%) have seen their contribution to total employ-ment decline, a decade ago. The lat-ter alone lost jobs in absolute terms (Table X4). However, as the second part of this report will demonstrate. This may also be the case of the tex-tile and leather industry, as a result of the end of the multi fibre agreement and the fact that these countries have not prepared for this situation (decline in investments, etc.).
Table X3: Net and Gross flows of workforce in the manufacturing industry in Morocco.
YearsNet rate of
creation (NRC)
Gross rate of creation
(GRC)
Gross rate of
destruction (GRD)
Rate of reallocation
(RR)
1990-1991 3 12,3 9,3 21,6
1991-1992 2,8 11,7 8,8 20,5
1992-1993 2,2 12,3 10,1 22,3
1993-1994 0,5 12,1 11,5 23,6
1994-1995 1,7 11,7 10 21,6
1995-1996 2,8 12 9,2 21,2
1996-1997 2,9 10,9 8 18,9
1997-1998 -2,4 10,5 12,9 23,4
1998-1999 1,5 11,4 9,9 21,4
1999-2000 -1,4 12,8 14,2 26,9
2000-2001 0 12,9 12,9 25,8
2001-2002 0,7 11,3 10,6 21,9
Average 1,2 11,8 10,6 22,4
S t a n d a r d Deviation
1,8 0,7 1,9 2,6
Source: Femise, from research n° FEM22-22
-14-
√ Electric and electronic industries were taking a more prominent position. Though they ranked only fifth in terms of total employment (5.6%), they were dynamic in job creation (22.7% between 1990 and 2002, of which -0.9% in 1990-1995 and 77.2% in 1996 -2002). These figures were only surpassed by those of the textile and leather industries (81.9%). However, the role of this sector is still small and does not allow it to take over the leather and textile sector in the short term (Table X5).
√ In the textile and leather industry, which was the main contributor to manufacturing employment, it was the clothing industry that gave impe-tus to job creation, while the textile industry lost steam. It was therefore, evident that the expected negative consequences of the end of the multi-
fibre agreements on Morocco were greater than an analysis by sector would have us believe. Moreover, this increasingly emphasised the inability of Morocco, unlike Turkey, as we shall see later, to develop an industry on its soil, which would enable it to capture part of the surplus (cloth can account for 60% of the price of an article of clothing), Another factor was the inability to control costs and delivery dates which would, in the short term, greatly strengthen the competition faced by firms.
√ Finally, gross job creation came from enterprises, which had been esta-blished in the market for a long time (this was the case with 95% of the chemical-Parachemical industries, 92% of the food processing indus-tries and 92% of the mechanical and metallurgical industries). However,
Table X4: Evolution of the contribution of manufacturing employment by sector
Source: Femise, from research n° FEM22-22
Years Food processing industries
Textile and leather
industries
Chemical and Parachemical
industries
Mechanical and metallurgical
industries
Electric and electronic industries
Total
1990 22,9 41,2 21,9 11,0 3,0 100
1991 22,2 41,8 22,1 11,2 2,8 100
1992 20,8 42,9 22,3 11,6 2,4 100
1993 21,7 41,7 22,2 11,9 2,5 100
1994 21,9 42,8 21,8 11,0 2,4 100
1995 21,5 42,2 22,7 11,1 2,6 100
1996 20,6 42,2 23,7 10,8 2,6 100
1997 20,2 43,2 23,4 10,6 2,6 100
1998 18,9 45,7 22,1 9,7 3,6 100
1999 18,3 46,5 21,0 9,9 4,2 100
2000 18,8 46,1 20,5 9,9 4,7 100
2001 19,1 46,3 19,9 9,6 5,1 100
2002 18,7 46,7 19,4 9,6 5,6 100
Table X5: Sectoral contribution in net employment creation
Source: Femise, from research n° FEM22-22
YearsFood
processing industries
Textile and leather
industries
Chemical and Parachemical
industries
Mechanical and metallurgical
industries
Electric and electronic industries
Total
1990-1995 8,1 50,8 29,9 12,1 -0,9 100
1996-2002 -46,3 154,1 -58 -27,1 77,2 100
Whole -8,3 81,9 3,4 0,3 22,7 100
-15-
the contribution of newly established enterprises was greater than that of the less capitalistic textile and leather or electronics sectors. We shall again see the problem of access to financing for enterprises. Another factor that should be taken into consideration is the big enterprises’ ability to adapt to the changed competitive situation at the international level. Partnership agreements had not prepared them for this eventuality, since it was reflec-ted in outsourcing and an internatio-nal division of tasks but rarely in the emergence of industries in the MPs, or sufficient increases in value to sell a product with a local brand name on the European market.
The Moroccan industry apparently, has still not initiated a transitional process towards a higher growth system, which would meet job constraints. It is still dominated by branches that employ unskilled labour and produce little added value. The emergence of a more skilled labour intensive industry with high added value has proved difficult and the open economy has not been much help in this process. It can therefore be noted that:
√ The employment structure hardly evolves; unskilled labour in 2002, as in 1990, accounts for 51% of total employment, jobs requiring skilled labour and training levels are still stagnate at around 39% and 10% respectively.
√ Workers’ movements are mainly at the level of constant qualification in the clothing industry at the expense of the textile industry; the movement of workers from an industry that is not very capitalistic to another indus-
try, which is capital intensive and skilled labour intensive is rare.
√ Job creation is not the prerogative of export-oriented enterprises[8]. Those which are less export-orien-ted, or which only cater to the local market, have similar results with regard to this aspect. However, the former have higher reallocation rates than the latter and their gross job loss rates are high and very much affected by crises, but their ability to create jobs is greater and has progressed between 1990 and 2002. (-3.8 points for the latter) Above all, the development of gross rates between 1990/91 and 2001/02 seem to indicate that export indus-tries, as expected, have succeeded more in standing up to competition, since gross job loss rates have considerably fallen. Conversely, non-export enterprises see their gross job loss rates increase with or without fluctuations. This, therefore, seems to confirm on the one hand, that the open economy can produce a positive shock of competitiveness, which is reflected by improvement of gross and net job creation pos-sibilities. However, as predicted, it is accompanied by a negative effect on local enterprises (lower job crea-tion rates and higher job loss rates) which, at the global level, (i) have a low net global impact, and (ii) threaten the dynamic process of job creation in the long term, which does not meet the needs of the MPs and will require actions to modify the present processes.
√ Job reallocation rates are estimated at 22.4% (taking into account job
-16-
creation and job losses). This means that more than a fifth of the work-force is renewed every year.
√ The heterogeneousness of firms insi-de this branch explains the volati-lity of job creation. Enterprises can be divided into two groups: durable enterprises with great mobility, but which create almost as many jobs as they lose and small enterprises that have been newly created and which have a large capacity for the absorp-tion of workers, but they have a brief life–span and are rapidly changing.
In Turkey[9], as in Morocco, short-term static effects on growth, related to the reallocation of resources in export-orien-ted sectors, which are exposed to inter-national competition, should be limited
in general, and have a negative impact on employment. Dynamic effects, which bring a balanced long-term growth that is mainly due to technology transfers are supposed to dynamically activate employment, especially the employment of skilled workers and lead to producti-vity gains as is the case in the NICs in Asia.
The Turkish export promotion policy relied on an increase of subsidies accounting for 25% of commodity exports between 1979 and 1990 (Table X7). Asian counties also resorted to such incentive measures, by linking the release of subsidies to the export performances of enterprises. This policy was part of the more global libe-ralisation movement (deregulation of the labour market, financial liberalization, convertibility of capital accounts etc.).
Table X6: Employment creation and loss by the orientation of activities of enterprises
Table X7: subsidies evolution for Turkish exports 1979-1990 (% of total exports)
Source: Femise, from research n° FEM22-22
Direct subsidies Export credits Import tax
exemptionDiscount on
the VAT Total subsidies
-1 -2 -3 -4 (=1+2+3+4)
1979 11,0 9,9 0,3 0,0 21,2
1980 5,6 14,9 4,2 - 26,7
1981 9,1 13,0 3,3 - 27,4
1982 15,1 10,8 3,6 - 31,5
1983 17,4 10,5 5,6 - 35,9
1984 17,3 5,9 2,0 2,0 27,2
1985 10,0 2,0 5,1 2,0 19,1
1986 9,9 4,8 8,6 2,6 25,9
1987 8,6 2,9 6,7 4,3 22,5
1988 7,6 4,8 6,6 4,3 22,5
1989 5,5 8,8 7,7 5,9 27,9
1990 4,4 9,2 7,7 6,2 27,5
% of exporting enterprisesExporting Non exporting
GRC GRD GRC GRD
1990/1991 50,8 11,2 11 13,8 7,9
1994/1995 50,9 13 11,2 10,5 8,9
1999/2000 54,4 15,4 16,2 9,5 11,6
2001/2002 56,1 14,1 6,9 10 14,1
Source: Femise, from research n° FEM22-22
-17-
The study revealed that in the case of Turkey, employment was:
√ Positively related to production levels, but weak elasticity, (a 1% production rise increased employment by 0.44) came from the development of the informal sector, which has now rea-ched about 50% of employment in the period from 1988-2003,
√ Negatively dependent on the price of inputs, capital and investments made in the preceding period The adjust-ment of the production apparatus the-refore weighed heavily on employ-ment,
√ The opening of the economy, evalua-
ted up to the present, by import pene-tration ratios, did not seem to have had a significant impact on jobs in the manufacturing sector, even when an effect was detected, it was more likely to be a negative one. This confirmed the general results obtained for deve-loping countries.
Thus, in Turkey too, the expected pos-sible effects of an open economy on employment have not yet been demons-trated. The extremely rapid develop-ment of informal employment however, makes the discouraging results relative. Furthermore, an analysis of specialisation reveals that Turkey is creating the neces-sary conditions for greater and more stable growth in the long-term, which will create jobs for the most skilled workers.
3. Determinants of behaviour: infor-mality
The preceding observations, which we have made on the basis of several sur-
veys carried out by Femise on enterprises, statistical treatment of these surveys and national surveys on industries and analysis of employment growth, allow us to make the following conclusions: the feeble or even negative overall impact of an open economy on employment is, to a great extent, due to the operation conditions of these industries, especially with regard to financing; (ii) adjust-ment performance can be substantially different between the various sectors of a given country and from one MP to the other (cf. Morocco and Turkey). This underscores the role played by the expectations of local entrepreneurs; (iii) the incentives offered by public policies may lead firms to favour certain adjust-ment strategies over others. This in turn, has a differentiated impact on the increase of jobs that can be generated by opening competition.
Of the different performances analysed in the previous parts, the movement of enterprises to the informal sector has often been emphasised as having an important role in what is to be expec-ted of an open economy. This move-ment is often justified by the rigidity of the legal frameworks. However, it is difficult to distinguish between TWO different sectors, one formal and the other informal. As the next part of this report will show, enterprises “adjust” to a certain degree of informality with the development of the situation and according to their perception of their competitive environment.
In the next part of this report, based on a Femise study which, in turn, was based on surveys[12], we show that the prin-ciple is that firms perceive the obstacles they must face and their performance
-18-
according to the institutional, political and legal conditions in their countries. With the intensification of competition and the hikes in oil prices we are faced with a “structure-management-perfor-mance” relation, which means that firms will adapt their adjustment strategies to the national context.. Performance is then the result of actions or strategies which are part of the internal structural constraints (technical characteristics of the firm, production and cost functions, organisational structure etc.), and exter-nal constraints (sector characteristics, competitive position of the firm etc.).
On the basis of the survey conducted by the ROSES team, «governance» indica-tors and “competitive pressure” repre-sent structural constraints. There are also two gauges of firms’ performance, one “synthetic” or global (growth of enterprise etc.) and the other, which reflects their results on the international markets. The results of assessing the impact of belonging to a given country on a firm’s performance and probity indicate that, if this impact is weak with regard to the overall performance of the firm, it is definitely weaker in its export capacity. Insofar as we have noted above, with the difference in job creation potential between local firms and export-oriented firms (in the case of Morocco) the role of the local context has again been emphasised. However, in addition to this simple result, far from being counter-intuitive, the interest of this study also lies in its identification of entrepreneurs’ reaction to corruption and informal/formal arbitration in the case of Maghreb. This enables us to pin-point the role of enterprises in informal activity, when they choose to resort to corruption and how they see it.
Several determinants of informal acti-vity have been identified by studies on the effects of institutional changes rela-ted to the transition towards a market economy, particularly in the countries of the East. Thus, enterprises can (i) refrain from declaring all their reve-nues, if taxes are too high and rules too strict, (ii) practise their activity in the informal economy, if the extortion to which they are subjected is proportio-nal to their production or, if the cost of this opportunity is low (resulting from a weak institutional framework, which involves, for instance the inability to respect property rights or a high degree of discretion on the part of government representatives when they implement taxation systems, etc.)
As regards the inclination to engage in active corruption, which is defined as the enterprises’ offer to corrupt, which is the result of factors that can be divi-ded into two categories: those which are related to the institutional set-up (breach of laws especially in an environ-ment that is not very competitive) and those which arise from the characteris-tics of the enterprises (enterprises that are not very competitive and are forced to break the rules of the game to sur-vive, or according to the size and profi-tability of the firm, nature of its relation with the State etc).
Several channels that affect the enga-gement in corruption by enterprises can be identified in the informal activi-ties. First, with the growth of informal activity, the tax base is reduced which, on the one hand, means a rise in taxes and drives people to find ways to avoid taxes (bribes etc.) and, on the other, a fall in taxes, which are collected, means
-19-
a decline in public service which, in turn, leads to greater corruption and less protected property rights, (Johson et al, 1998). Second, the degree of corruption in a country is inversely proportional to the benefits that can be reaped by developing countries by respecting the law. The more frequent the corruption, the greater the strategy aimed at elimi-nating the informal economy. This, as a way to elude the authority of corrupt officials, will therefore be more probably reflected by an increase in corruption. In this case, according to Vostroknutova (2003), reducing corruption should be the first priority.
Trade liberalisation, conclusion of new agreements and increased competition usher in new opportunities, but they also bring constraints, mainly through the change in laws, which oblige the firms to adapt and modify their activities.
The survey conducted by the Femise ROSES team on Algeria and Tunisia demonstrated that:
√ The part of production concealed by the enterprise would be (i) much higher than the sum of supplementary pay-ments demanded (more than a third) (ii) corruption was seen as an impor-tant obstacle to its activity, (iii) this would enable it to reduce its tax levels. Furthermore, if the enterprise was not competitive, it could develop its infor-mal activity, so as to reduce labour costs and evade complex procedures.
√ The shortcomings of the legal system also explained the level of informal activity, insofar as the interest in declaring the activity was to protect it. Enterprises could therefore resort
to corruption to guarantee the pro-tection of their rights when the legal system was weak. If the authorities had little capacity to protect property or contractual rights, the opportunity cost of its activity in the informal eco-nomy diminishes.
√ Petty or day-to-day bribes, given or taken, on which the smooth running of firms’ activities relied, weighed more heavily on the decision of enter-prises to engage in informal activities than corruption designed to influence the content of regulations and laws, which was the reflection of a more long-term strategy.
√ The more important the informal acti-vities were, the more firms were dri-ven to engage in the different forms of corruption. However, it was a two edged weapon, as enterprises then saw corruption as an obstacle to the expansion of their activities.
√ Firms that found taxes to be cons-training are less sensitive to the pro-blem of corruption since additional taxes in this sense are relatively less expensive.
√ Firms believed that they could get round the obstacle of laws that were too strict, not by weighing on the content of these laws and regulation (State capture) but by their applica-tion (administrative corruption).
√ The stronger the market position of the enterprise, the less likely it is that it would engage in corruption.
These results emphasised that there was a strong positive correlation between
-20-
informal activities and the perception of corruption; in whatever sense this word is used.
They reinforced one another as has been observed in countries of the East, which were in a transitional stage. They also demonstrated that it was a matter of adjustment and optimisation to be able to compete at the national level.
However, the practices of firms are, to a great extent dictated by the political context or their history. The political con-text, for instance, determines the incli-nation of firms to accept to be subjected to corruption. If, in the political context, corruption is systematically denounced, the extent of corruption, in which the administration and enterprises engage, will be reduced. However, with regard to the second element, we can mention the existing or past relations between the enterprise and the State. Analysis shows that the closer the enterprise is to the authorities, the less it considers cor-ruption an obstacle to its development, probably because it can influence the content of law and regulations, without having to pay in return. On the other hand, a public enterprise certainly has less inclination to capture the State, but as it is sometimes relatively more exposed to corruption, it may suffer.
With regard to economic policy recom-mendations, the results of this study emphasised that, in order to be effective in Algeria and Tunisia, a policy to com-bat the informal economy must go hand-in–hand with a policy to reduce cor-ruption and improve the legal system, especially with regard to respect for con-tracts and property rights. Furthermore, it was imperative to modify the concept
that enterprises have of regulations. Regulations should not be considered as obstacles, and this was particularly so with taxes. In addition, to modifica-tions of structures, there should be an educational campaign, should first be conducted to explain to enterprises the consequences of their choices.
4. Behaviour Adjustments of enter-prises and jobs
The results of the open economy in MPs first provided for in the Association Agreements with the European Union are, on the one hand, dependent on strategies adopted by firms, that is to say, the manner in which they will face market developments and, and on the other, the development of these dif-ferent markets for different specialisa-tions. In this section we shall deal with the first point:
An analysis of the liberalisation – employ-ment relation should include three con-sequences that are expected as a result of increased trade:
(i) Reallocation of the production fac-tors in protected sectors to sec-tors exposed to foreign competition, which are supposed to offer higher return and salary rates;
(ii) Reallocation of productive resources in a given industry, from less to more efficient stakeholders. From this point of view the firms are hete-rogeneous;
(iii) A change in the strategic options chosen by firms in their adjustment. There are several options, such as profit or salary margin squeezes,
-21-
more frequent recourse to unskilled or temporary labour, and search for improved productivity or quality of products, etc.
A Femise study tried to define these actions so as to evaluate the impact on the decisions of the existing industrial enterprises[10] on the liberalisation– employment relation, with liberalisation referring mainly to the development of tariff and non-tariff protection. The study identified the sectors, in which the modifications of intensive competi-tion were more significant on the basis of a ratio of import penetration[11]. The industries affected were the lea-ther, furniture and its accessories, rub-ber and other manufacturing industries in Turkey, as well as textiles, manufac-ture of metal objects, machines and their material, radio sets and equip-
ment, televisions and communications, the car industry and other transport materials.
It seems that in the case of Turkey, and as demonstrated in theory, the industries facing increasing competition saw their production fall. (Figures 1, 2, 3, 4), while total industrial produc-tion increased. Furthermore, the gra-phs for industry reveal a disconnection between production developments and employment, which is not corroborated by sector dynamics and, as a result, can be attributed to the specificities of the environment and actions of firms. In Morocco, this disconnection between total industrial production, production by industry and the produc-tion–employment relation in industries, which increasingly faced competition, was clearly less marked and the adjust-
Figure 1: Evolution of production and employment for the whole industry
Figure 2: Evolution of production and employment for the firms belonging to the most open to foreign competition sectors
Source: Femise, from research n° FEM22-22
Turkey
Morocco
Morocco Production
Turkey Production Production
Production
Ttl employmt Ttl employmt
Ttl employmt Ttl employmt
-22-
ment was achieved by a fall in the apparent productivity of work.
Increased competition can indeed lead firms to adopt different types of adjust-ment measures: they can play with the selling price (reducing input prices, salaries and accepting profit mar-gin squeezes while increasing technical efficiency), or they may improve the quality of their products and/or the quantity sold. The differences in the developments of actions by each indus-try and total industries, which appear between Morocco and Turkey, probably arise from the strategic choices taken to adapt to the modifications required by competition: Turkey succeeded in maintaining apparent and overall pro-ductivity through investment efforts, while Morocco opted for a price policy with a cutback in profits and production costs. However, there are other factors
that seem to have led to these results, a competitive location in a given country. Other Femise studies have dealt with this aspect (see below).
To identify the strategy adopted in each country, the study then assessed the impact of liberalisation on employ-ment using an econometric fixed effect approach to a sample group for the 1993-2002 period or the 1995-2001 period in Morocco (when the various elements of employment were intro-duced in the analysis) and 1985-1990 for Turkey. 4 digit import ratios were used along with the ad valorem ave-rage of customs duties, according to the available data. 7 sub- samples of firms were identified, according to their characteristics: those which were most exposed to international compe-tition, those which, over a period of time, had seen their production inclined
Figure 3: Evolution of apparent productivity for the whole industry
Figure 4: Evolution of apparent productivity for enterprises of the sectors most open to foreign competitive
Source: Femise, from research n° FEM22-22
Morocco Turkey App. Prodty App. Prodty
Morocco Turkey App. Prodty App. Prodty
-23-
to increase or fall, those which expor-ted more than 25% of their production and those which exported less than 25% of their production, enterprises which had a workforce of more than a 100 employees in Morocco and 150 in Turkey, and those which had a smaller workforce. These estimates revealed that:
√ The liberalisation-employment rela-tion was globally weak and negative. This confirmed the results obtained by other teams working on other coun-tries. Thus, in the case of Morocco, a ten point tariff reduction resulted in a 1% fall of employment in industry, but it could reach 3%, if the enter-prise was big or export-oriented. This effect was still more marginal in the case of Turkey, since a 10% rise in import ratio was reflected by 0.3 job loss, and only certain types of firms were affected (big firms or firms with falling production).
√ A crucial element in the liberalisa-tion-employment relation in Morocco was that of the exchange rate poli-cy with falling employment (mainly temporary). It could go up to 7% in reaction to a 10% real apprecia-tion in exchange rates. Firms, which were most vulnerable, were obvious-ly those which were export-oriented. However, this effect was not syste-matically negative in Turkey. This can be explained by the considerable volume of imported inputs in produc-tion, whose costs were reduced when the exchange rates were apprecia-ted. This increased the productivity of commodities and employment. (+2.5%+3.5% for a 10% apprecia-tion in exchange rates).
√ Adjustments of the workforce have been made, to meet the changed conditions of competition or money value. In Morocco, this was achieved through more frequent recourse to temporary employment, and particu-larly unskilled labour. This movement was not obvious in industry as a whole, but in certain industries, which have reconsidered the management options of their job structures.
√ In the case of Turkey, there were two elements that have weighed hea-vily on the liberalisation–employment relation. The first was positive, the margin achieved, when it was posi-tive, could enable a 0.8% to a 1.3% increase in employment for a 10% appreciation in the exchange rate. The second was negative: a 1% ove-rall improvement of productivity could lead to a 2.8% decline in employ-ment. It would be worth knowing if such a development of productivity was possible. It was the result of capi-tal intensiveness which, if increased by 10%, would reduce employment by 1%, even if the investment, in itself, improved employment (+0.4% to +1.2% for a 10 % appreciation).
To conclude this part on the behaviour of firms in their day-to-day operations and the impact of the open economy on employment, we should emphasise the following:
√ The liberalisation policy, which almost all the Mediterranean countries have adopted, has changed the competiti-ve context which local firms will have to face. The open economy policy, whether it is multilateral in origin (WTO) or regional (the Association
-24-
Agreements) therefore not only has a macro-economic content, it also has a micro-economic impact. In reaction to changes in the context of competi-tion, firms have resorted to different strategies, which arose from their need to develop their activities (or at least to survive) and from the possi-bilities they have through their local context.
√ These activities, here as elsewhere, were reflected by actions on usual levers, mainly investments, margins and jobs. From this point of view, the choices made by Mediterranean countries, with regard to employment and investment, were not in line with micro-economic needs. (cf. for ins-tance the textile-clothing industry in Morocco).
√ As regards the public actions to be taken at this level, various surveys on different but connected and com-plementary subjects, which were made on several countries (Algeria, Egypt, Lebanon, Morocco, Tunisia and Turkey), have confirmed the priorities already emphasised by Femise. These priorities were: improving conditions to make firms competitive, espe-cially with regard to basic services in financing and communications, which would allow enterprises access to financial resources and enable them to export at the lowest cost, providing training to develop the necessary skills to upgrade all types of indus-tries, streamlining administrative procedures that are still complicated and opaque, so that enterprises could perceive positive consequences for the greatest “formalisation” of their activity.
Finally, another important point was that the behaviour of firms was dictated by the general developments in their sector, international dynamics and evo-lution of the laws regulating this sector. This aspect is dealt with in the following part, first by highlighting the specific aspects of Mediterranean countries in the course of their industrial develop-ment, then by examining in detail the exemplary dynamics of the textile-clo-thing sector, and by pointing out future opportunities, mainly in the services sector, and in particular, those which were referred to above.
II. Adjustment of sector specialisa-tions to modify dynamics
1. A specific industrial path
An analysis of a country’s specialisation cannot be ignored in any study on the effects of the liberalisation strategy, whatever its origin, (changes in the provisions of an agreement, admission of a new member to the WTO etc.). In this first part, we should obtain a better understanding of the ongoing industria-lisation process in the MPs to make a first assessment of their ability to con-front the shock of competition.
At the end of the 1960s, all the MPs had a comparative advantage in primary com-modities. However, the structural adjust-ment policies, devaluation of exchange rates and the liberalisation policy of the 1980s led them to develop new compa-rative advantages, modify their speciali-sation and reallocate the factors of pro-duction. Economic development is in fact a process of improving productivity that is based on a sound investment dynamic process and growth[13].
-25-
History has shown us that this process is invariably associated with structural change in production and employment, from agriculture towards industry, and then gradually between different bran-ches of the manufacturing industry. Though it may not be linear, this development is systematically orien-ted towards a prolongation of out-put diversion. The interpretation of the principle underlying the growing division of labour, as an evolution of the industrial structure to increasin-gly intensive branches of intermediary goods, enables us to construct a typo-logy of three groups of branches in the manufacturing industry. The for-malisation of industrial development and gradual movement of the centre of gravity from simple labour-inten-sive production (IPS-L) towards simple capital intensive production (IPS–C) then towards intermediary goods (IPC) - intensive production, defines the standard path of industrialisation. This path has been successfully tested in the long dynamic processes of the big industrialised countries. An empirical examination reveals that the long pro-cesses of sector change were geared towards the same general tendencies. They fell within these limits, which were identifiable and they were convergent. They therefore defined a sequence, which generally characterized the evo-lution of the industrial structure. From England at the beginning of the 19th century to South Korea and Taiwan in the last third of the twentieth century, all the industrialisation processes have followed this path of sector sequence. However, national rhythms were not identical. The later industrialization was in coming, the steeper the slopes and the more rapid the structural change.
The confrontation of structural change in industries in the MPs with this stan-dard sequence of industrialization since the early 1960s generally indicated an evolution of the meaning of develop-ment in the wrong direction. The lowe-ring of the IPS-L may seem to have conformed to the historical sequence, but the main particularity of the regio-nal industrial dynamic process was the stagnation of the IPC at a low level.
This movement to the rear of the industrialisation process was particu-larly obvious in Turkey, Morocco and, to a lesser extent, Jordan. The most modern IPC industries remained mar-ginal or were relatively decreasing, whereas the support industries for an industrial takeoff (IPS-L) still represen-ted a considerable part of manufactu-ring production. The dynamic process of structural change seemed relatively better orientated, if weak, in Egypt. As Israel was a case apart, Turkey repre-sented the only real difference to the regional trend. Its industrialization sequence was close to those of South Korea and Taiwan, but with a 25 year gap between them.
A comparison with other developing regions emphasised the counter-tendency nature of developments in the Mediterranean region. The industrialisation process in the NIC2 (Thailand, Malaysia, Indonesia and the Philippines) and also in China followed the same historical path of industrialisation, but with a time gap between them. Industrial growth may have been slower in South West Asia, but the same sequence of structural change, at a slower pace, could be observed.
-26-
This age-old orientation of industrialisa-tion was also observed in Latin America, in spite of the slow pace of industrial modernization and the “lost decades”. The MPs were therefore, the only coun-ter-tendency case in this sample. The hypothesis of a late start seemed less relevant than that of structural inertia. In the early 1970s, the Mediterranean countries had more advanced industrial structures than the NIC2: Since then, only the Mediterranean has been cha-racterised by a stable hierarchy in the three groups of industries. The fact that the IPC was not adopted led us to con-clude that there was a poor division of labour and insufficient building of new industrial skills in the past four deca-des. In fact, it was not the question of
the speedy industrial transition of MPs, which seemed relevant but the direction to be taken.
2. The impact of industrial strate-gies on the liberalisation-employ-ment relation
The hypothesis, often put forward by Femise, was that this inertia was partly due to the desire to preserve employ-ment, by favouring relatively labour- intensive industries. This objective might seem perfectly rational and might well be tenable in a closed economy. However, it was not only difficult to uphold in the long term, but it was also inconsistent with the present general movement towards liberalisation in the MPs. On the
contrary, in this con-text, present speciali-sations seemed coun-terproductive in terms of jobs, as a compa-rative analysis made in a Femise study showed[14]. This study was concerned with the consequen-ces of the choice of specialisations in the areas of growth and jobs for five countries (Morocco, Tunisia, Turkey, Malaysia, Indonesia) in the period from 1985-2001 (which was divided into two sub- periods 1985-1995 and 1995-2001). It compared the results in terms of growth and jobs in the sec-tors of the economy,
Table X8: Employment coefficients by principal industrial sectors[15]
Source: Femise, study FEM22-22, ONUDI 2005, author’s calculation
Sectors 1985-1995 1995-2001 1985-2001
FPI 0,5 1,0 0,5
CPCI 0,6 1,2 0,8
Indonesia EEI 0,5 1,0 0,5
MMI 0,4 1,5 0,7
TCI 0,5 1,9 1,0
Total 0,5 1,3 0,7
FPI 0,7 1,1 0,8
CPCI 0,7 1,1 0,7
Malaysia EEI 0,5 0,9 0,5
MMI 0,5 1,1 0,6
TCI 0,4 1,1 0,4
Total 0,6 1,0 0,6
FPI 0,6 1,1 0,7
CPCI 0,5 1,1 0,6
EEI 0,6 1,3 0,7
Morocco MMI 0,4 1,2 0,5
TCI 0,6 1,3 0,7
Total 0,5 1,1 0,6
FPI 1,0 0,9 0,9
CPCI 1,4 1,2 1,6
EEI 1,4 1,9 2,7
Tunisia MMI 1,0 0,9 0,9
TCI 0,8 1,3 1,1
Total 1,1 1,2 1,3
FPI 0,4 1,0 0,4
CPCI 0,3 1,1 0,3
Turkey EEI 0,3 1,2 0,4
MMI 0,3 1,1 0,3
TCI 0,4 1,2 0,4
Total 0,3 1,1 0,4
-27-
so as to establish a typology of sectors that best addressed the difficulties met in MPs.
Generally speaking, the 1995-2001 period was more favourable for the creation of jobs in the Mediterranean countries and Asia. This proved that this was not due to the effect of “trade integration with the EU”. Job coefficients in Morocco, Tunisia and Turkey were more similar in the second period, while they were more different in the first. Tunisia led the group with coefficients that were higher than 1 and were sli-ghtly improving (Table x8). The sectors, which generated most jobs were the same in the three MPs (the electric and electronics industry (EEI), the textile-clothing industry (TCI) and the chemical and Parachemical industry (CPCI)). This meant that they had similar specialisa-tions, which were different from those found in Asian countries, while, in the Asian countries specialisations diffe-red from one country to the other. In Indonesia, the sectors, which created most jobs, were the mechanical, metal-lurgy and machinery industries (MMI) and the food processing industry (FPI).
However the contributions of each sec-tor to net job creation and added value, seen in perspective, emphasised that (table X9):
√ The strategies of Asian countries were to develop relatively more tech-nology and skilled labour–intensive sectors. This enabled them to cap-ture part of the international mar-ket, while keeping sectors that had a big capacity to absorb manpower (Rizwanul, 2003). Indonesia over-came the crisis, which had dealt a
severe blow to the TCI and the MMI, which continued to play an important part in job creation. It preferred to build sectors, such as the electro-nics and chemical sectors, which are playing an increasing role as an impetus to growth and job creation. Malaysia, on the other hand, opted for a much more rapid restructuring. It supported electric and electronics industries, which now have a key role in the absorption of employment and the creation of wealth (80% of job creation).
√ Tunisia had adopted a strategy that was more similar to that of the Asian countries. It preserved the textile-clothing sector, in which it had a comparative advantage and which had created many jobs, but it also reoriented its specialisation towards the FPI and the EEI, while disenga-ging itself from the CPCI. Similarly, Turkey relied on and strengthened its comparative advantages in the TCI sector, which continued to play an important part in job creation. It also tried to diversify its industry, particu-larly the CPCI and the MMI.
√ There was a gap in the MPs, especial-ly in Morocco, between employment systems and the sectors, which gave impetus to growth. The 1985-1995 specialisation structure demonstrated that the TCI created jobs, while the CPCI, the FPI and, to a lesser extent, the TCI created wealth. The changes resulting from the Barcelona process were reflected in a diversification of the sectors that promoted growth, such as the EEI and the MMI. The capacity of those industries to absorb manpower is the weakest.
-28-
Another study conducted by Femise[16] analysing the transformation of manu-factured exports confirmed these results. The comparison between the evolution of the manufactured exports of MPs and those of the emerging countries, mainly the two generations of NIC and China, revealed that exports had played a very modest role in the Mediterranean. The differential between their export dynamism and the average of deve-loping countries increased, even though the association agreements offered the MPs privileged access to the European
market. This quantitative approach was completed by an analysis of the «qua-lity» of exports from MPs, in a dyna-mic and comparative perspective, which relied on the construction of a synthe-tic indicator (IRX). Export Catch up Indicator. The export catch up indicator synthesised the level of sophistication of exports from each country and, in every period, marked that level on an interna-tional scale, which moved from the least to the most performing. The calculations of this indicator were not based on the characteristics of the product, but rather
* : Positive contributions to the absolute variation in employment and deflated VA. For information, the negative contributions are denoted in italic and parenthesis.Source: Femise research FEM22-22
-29-
on the exporters of these products. They were inspired by a method which was first proposed by C. H. Kwan (2002) in another context. The export catch up indicator enabled us to measure the gap between the exportation structure of a developing country and that of a country, which had the most advanced exportation structure and how to narrow this gap. This is the countries’ export catch up dynamics. The application of this method to the structure of world trade since the mid 1960s again empha-sised the particular position of Morocco and Tunisia. While Israel and Turkey had seen an evolution similar to that of the newly industrialised countries2, Tunisia and Morocco which had the same catch up indicator as the NIC2 up to the early 1970s, witnessed different deve-lopments .Their export catch up indictor fluctuated, but remained very low.
This comparative approach was com-pleted by a more fine-tuned analysis of diversification niches (level 4 of SITC that is a thousand jobs) between 1994 and 2003. When we set aside exports related to exploitation of natural resour-ces and textiles-clothing, niches became almost non-existent in Jordan and Syria, and rare in Egypt. A stable number of about ten could be found in Morocco and Tunisia, and about twenty in Turkey. With regard to demand, these niches were found in markets which were not very dynamic. In these segments competi-tion between the Maghreb and Mashrek countries was weak, but it was strong between the MPs and Turkey. In the Maghreb, these niches were mostly for inter–company trade toward Europe. In this market the MPs were more in competition with East and Central European Countries than with Asia and
China. This confrontation and the pre-dominance of inter-firm trade suggested that the diversification of MPs’ exports was halted by the irruption of the CEEC, which attracted massive European FDI in the 1990s.
Other indicators confirmed these trends. The analysis of investment efforts, added value, employment and apparent productivity of labour revealed that the specialization resulting from liberalising and upgrading the economy did not put Morocco on a growth path, which would be consistent with its unemployment problems[17]. Graver still, there was a process of deskilling labour, which explained the growing difficulties faced by graduates in finding jobs.
With regard to forms of sector adjust-ment, it should be noted that, in the case of Morocco, the ongoing process of spe-cialisation in the electric and electronics industries did not lead to an up-market position. Employment and investment had greatly progressed at the beginning of the period, but the apparent produc-tivity of labour and real salaries had considerably declined as of 1995. This was due to the fact that Morocco was mainly a sub-contractor in this sector. In Tunisia, on the other hand, employ-ment had increased fivefold between 1993 and 2001 for this very same sector. However, real salaries fell sharply and the progress of investment and added value was slow.
The situation in Turkey was totally diffe-rent as this sector generated a substan-tial and rapidly rising added value and offered the highest remuneration levels. Malaysia was in a similar position: pro-gress in employment, added value and
-30-
investment, fall in salaries and increased labour productivity. The same applied to Indonesia, which trailed a little behind, but took the same course.
As regards the textile-clothing indus-try, the important investments made in 1993 to 1996, did not reactivate the hoped for growth or added value, while salaries remained at their former levels. An up-market position would therefore be difficult to achieve especially in view of the disruption caused by the end of the multi-fibre accords. For Tunisia this meant either a considerable fall in sala-ries which did not promote investment or an improvement in apparent labour productivity, which was increasingly des-killed.
Turkey on the other hand, found the way to achieve an up-market position: investment at a swift pace, which has not slowed down, and has even quic-kened in view of the possible adverse consequences of the end of the multi-fibre accord. Added value production and the apparent productivity of labour increased throughout the period and jobs were created for relatively more skilled workers. Indonesia presented a similar situation with investments that did not lag, stable salaries and apparent productivity levels and more jobs.In Morocco, investment mainly served the chemical and food processing indus-tries. The former was a key sector of the Moroccan economy and maintained its job creation capacity and salary levels in spite of trends towards a fall in the apparent productivity of labour that fol-lowed the drop in added value, which, at the end of the period, was joined by a fall in salaries. Tunisia, because of the gradual exhaustion of its natural
resources, mainly petroleum, saw the importance of this sector decline (fall in salaries, added value, and investments, employment was maintained but appa-rent labour productivity was reduced by 50%).
In this area, Turkey relied again on its investments. This explained the good results in terms of added value and labour productivity, but it was not a very dynamic sector in terms of employment. Indonesia adopted the same type of strategy: investment fuelled by produc-tivity and added value gains, but here the sector created employment.The food processing sector also suffe-red from a lack of dynamism as of the second half of the 1990s. Employment continued to increase slowly, but added value fell, dragging productivity with it. In this sector in Turkey and Tunisia, strong investments maintained produc-tivity levels. Salaries greatly increased in Tunisia and were among the highest in Turkey.
One of the few sectors in which invest-ment efforts remained important at the end of the period was the mechanical and metallurgical industries. In spite of this, added value continued to decline, while employment and salaries increased. This proved that the investments were not sufficiently developed. The performances of Turkey or Malaysia were much better, because investment did not falter over all the period and added value increased at the same pace, while employment remained stable.
The question that arises now is to find the result, in terms of employment, of these different industrial strategies in the context of trade liberalisation. From
-31-
Thus, Indonesia preserved jobs for uns-killed labour in the textile and clothing industries, while developing the more capital and skilled labour-intensive che-mical and electronics sectors. Malaysia, where the restructuring of industry was more advanced, followed the same path and now it can focus on the sophistica-ted electric and electronics industries, which have become sufficiently dynamic to create employment. The main con-cern of the intervention policies of these countries was to make the skills acqui-red in the educational system adequate to the industries’ requirements for qua-lified workers.
As regards the MPs, there has been no improvement in trade-related jobs in the two sub-periods, with the exception of the textile-clothing industries. Turkey was in a relatively better position becau-se of its investment behaviour.
The great difference between the per-formances of the MPs and those of the Asian countries was partly due to the fact that the two groups of coun-tries had different concepts of the role of industry in growth and, for both of them; the question of jobs was presen-ted in different terms. The proof lay in the development of the tertiary sector, which followed and accompanied the development of industry, and influenced its activities (banking, consultancy to enterprises etc.) in Asian countries. In the MPs, the influence of the tertiary sector hardly reflected the stage of the country’s industrialisation. It was relati-vely disconnected and required a solu-tion to the supply of unskilled labour. This position did not seem optimal even though it met short-term needs and assured the continuity of social order,
this point of view, the job content of trade confirmed the fact that the Asian countries, which we have considered, had a completely different strategy than that adopted by the MPs.
The former based their economic deve-lopment on heavy and often diversified industrialisation. They thus protected their capacity to absorb unskilled man-power and increased their capacity to absorb more skilled workers. The stra-tegy of the Asian countries consisted of the following elements:
(i) On the one hand, the protection of emerging economies, which were intended to create opportunities to gain an up-market position, such as developing the electric and electro-nics industries. This renewed their comparative advantages and gave them a position in the more dynamic sectors at the international level. The human and financial requirements for the reorientation of specialisa-tion were met, thanks to the firm commitment of the State, which also targeted the sectors that should be strengthened and expanded;
(ii) On the other hand, the restructu-ring of traditional sectors by making investments, this, at times, could be very substantial. These investments often resulted in an up-market posi-tion, while maintaining job creation level.
This industrial strategy preserved social cohesion and created opportunities for growth, so that the country could more easily absorb the structural adjustments related to internal macroeconomic cons-traints and international competition.
-32-
it eliminated the long-term capacity to absorb jobs and greatly affected the quality of manpower.
The grave crises, which Turkey encoun-tered, may have promoted these restruc-turing efforts by lowering opportunity costs, and giving it a big leap forward in the transitional process. For the MPs, the risk faced by the rest of the economy, because of the end of the multi-fibre accord with its induced investments, could oblige them to accelerate the pace of levelling the economy and find a strategy to develop new comparative advantages, since they had a stock of highly qualified manpower on the one hand, and could rise to an up-market position on the other, if they did not confine themselves to sub-contracting, which would not allow them to capture a big part of the income. The experience of the Asian countries or Turkey showed that a country could change its position in the international market, provided that it adopted firm industrial policies and there was a strong State commitment.
This commitment might be to act as an investor, but then the question of main-taining the necessary equilibrium would arise. Then too, there was the question of breaking off with the former system, which we should admit, has proved its limitations. It could also move to actions in the firms’ behaviour, as we have seen in the first part. The stakeholders’ movement should be accompanied by a process that facilitated their day-to-day operations, so that they could adopt strategies that were consistent with national objectives. As we have seen earlier, the dynamics of the textile clo-thing sector was an excellent example of this point of view.
3. The textile, revealing industrial sector dynamic
The textile-clothing industry sector has been the engine of development in many countries and continues to be of impor-tance for developing countries. Within the EU, the share in value-added of tex-tile-clothing (TC) in the manufacturing sector increased to 4% and absorbs 7% of employment. Italy, The United Kingdom, France, Germany and Spain produce three quarters of the EU textiles-clothing. A total of 200 billion Euros divided among 177 000 enterprises employing more than 2 million individuals[18]. The largest expor-ters of textiles are China, Italy, Germany, The Republic of Korea, Taipei, France, Belgium, Japan and The United Kingdom, while in the clothing industry, China, Italy, Germany, France, Turkey, Indonesia, The Republic of Korea and Thailand dominate.
But, in the case of MPs, the stakes are high, firstly because of the historic role played by the sector in the industrialization of economies, then by its weight today in their industries, in their exchanges and above all in employment, and finally because at the time of the shock of a major opening, that is the end of the multi-fiber agreement. In two years time, this will entail transitional measures to be taken by the EU and the United States when they will have realized the potential quantitative impact. This sector is very symptomatic of the role that could be played by different industrial strategies, either by comparing MPs to Asian countries or MPs with one another.
Expansion of the textile network
Morocco and Tunisia were very open countries before their independence
-33-
whose national economy largely depen-ded on the importation of European pro-ducts in TC sector. The achievement of independence coincided with the imple-mentation of alternative plans regarding exports that boosted investment. 41% of approved investments in Morocco were directed to textile-clothing in 1960. However, these plans rapidly indicated their limits and new measures were taken to promote the role of exports in growth. In 1972, Tunisia promulga-ted a law that established the status of exporting enterprise and provided fiscal advantages, while firms were encoura-ged to produce for the internal market which remained protected. Morocco followed the same course. Its structu-ral adjustment programme of 1983 and promulgation of investment and expor-tation codes furthered the development of exchanges.
The expansion of the textile-clothing industry in these countries benefited the movement of European delocaliza-tion, which originally stood at around 30% of investments accomplished in Morocco after 1987 and the signing of the EU-Tunisia partnership agreement in 1976. This industry created 40% of new jobs in the Tunisian manufacturing sector between 1972 and 1981 and 48% in Morocco between 1980 and 2000. It accounts for 40% of manufactured exports in Tunisia in 1980, higher than the rate in Morocco or Turkey.
The structure of the TC industry in the three Maghreb countries varies greatly. In Algeria, at the outset of the 1980s, the sector represented 30% of total industrial employment. Prior to pri-vatizations which began in the 1990s, the textile sector was dominated by
public enterprises while private compa-nies occupied a preponderant place in the garment sector. These two sectors fell into crisis as they were incapable of confronting the competitiveness brought about by privatizations. In 2001, the production of textiles stabilized by 25% of its 1990 level and clothing at around 40%. Employment declined markedly until 2000. In the first stage of priva-tization, Algerian retailers demanded more and more foreign products, but this trend was reversed and domes-tic production augmented recently. In 2002, the sector accounted for 4.4% of industrial production (hydrocarbons not included) whereas the private TC sector represented 9.9% of the value of pro-duction in 2003.
Egypt followed a very different course. The industry developed thanks to the support of Bank Misr at the end of the War, with Misr Spinning and Weaving considered the largest enterprise in the Middle East, accounting for 25 000 employees. Since 1945, the TC indus-try occupies a dominant position in the Egypt economy reaching 42.4% enter-prises and 37% of jobs in the manufac-turing sector. Since the nationalizations of 1960-1962 when only establishments of less than 200 employees remained private, the public sector dominated the textile while the private sector controlled the clothing industry (75% of exports).
The textile industry is also very old in Turkey. Largely dependent on imports as long as it had not regained its cus-toms autonomy, the country has, within the framework of the first five-year plan and Soviet aid, entrusted Sumerbank with the development of the TC sector. However, here the private sector was
-34-
above all active in the production of yarn and fabric (50% to 60%).
Textile activity developed significantly after the Second World War, benefiting from the cotton boom as a result of the war in Korea, as well as incentives for investment in the context of import substitution policies and protection of the domestic market. It was only thanks to the open trade policy and promotion of exports that the clothing sector took off and its export performance reached a peak at the end of 1980s. In the 1990s, the privileged relations between Turkey and Germany and the perspective of a customs union with the EU promoted garment exports and supported and encouraged considerable efforts toward investment and the modernization of enterprises.
The TC is an essential component of industrial exportation in Jordan, Lebanon, Morocco, Syria and Turkey. Given the inability of most of these countries to create a network on national territory, it is equally an important position for imports.
The TC continues to be the main com-ponent of the manufacturing sector and the major employer in Egypt, Morocco, Tunisia and Turkey. In Morocco, it con-tributed to creating 60% new manu-facturing jobs since 1986 against more than 30% industrial jobs in Tunisia. It is a strongly feminized and informal occu-pation and the figures on employment in this sector are not reliable. Moreover, professionals in Turkey estimate that employment in the sector is five times higher than that which appears in the statistics. Another difficulty, it is difficult to evaluate production in as much as
certain enterprises[19], in this activity, often some of the largest in the country that generate considerable exports, are in close proximity with many SME.
Major importance at the economic and social levels
In Morocco as in Tunisia, the clothing sec-tor occupies a central role in manufactu-red exports since the 1980s. Concerning Tunisia, since 1996, textiles represent more than half of exports in terms of manufactured products and in 2001, textiles, footwear and leather accounted for 48.5% of the value of total exports (this figure dropped to 42% in 2002). Morocco is in a similar situation: TC exports rose to 23% of the total value of manufactured exports in 1996 and 33% in 2001[20]. Regarding Algeria, the per-centage is lower[21].
In the three Maghreb countries, within the textile sector, it is clothing that domi-nates in terms of value of production and employment. This structural element is significant since the clothing sector is more labour intensive than textiles in general, a matter that impacts the level of formal employment. TC production in Morocco rose to 15% of the value of manufactured goods but accounted for 45% of employment in 2003. Tunisia is in the same situation where produc-tion in this sector represents one third of manufactured goods while absor-bing more than half the employment and accounting for 7.1% of GDP (EIU, 2003).
It is necessary to underline certain cha-racteristics of the TC sector in Maghreb countries that are an important part in informal employment and the conduct of
-35-
firms that resort to non-declared labour in order to reduce costs. The origin of difficulties related to competitiveness confronted by these countries lies in the cost of manpower which is significantly higher than that borne by their Asian competitors. In 2002, average wages in the textile sector in Morocco and Tunisia was nearly fivefold those in China and equivalent to those registered in cer-tain eastern countries such as Slovakia, Estonia or even Turkey. With the end of the multi-fiber agreement and its impact on quotas imposed on Asian competitors, it was inevitable that Maghreb countries would suffer from competitive pressures and lay-offs.
In view of the structure and employ-ment conditions in the TC sector in Morocco, female employment prevailed as well as informal production, young employees and/or unmarried with a modest level of education without regu-lar schooling and who were often only temporarily employed. In 1999, 61% of wage earners and 90% of household workers were women. Employers have a marked preference for single women with no family responsibilities and who are easy to train. According to Bouquia (2002), 59% of employees in this sec-tor are below 25 years of age against 45% of employees. Nonetheless they do have certain family responsibilities such as contributing to family expenses to a large extent. Temporary work is widespread in particular in SMEs. This structure of employment mainly results from the orientation toward exporting the activity of formal sector firms and dependence vis-à-vis orders coming from European distributors. The latter prefer calling upon geographically close companies since delivery delays have
to be brief (Belghazi). If a product is sold more rapidly than expected and restocking is necessary, firms based in Morocco are apparently capable of satis-fying these constraints.
Surveys undertaken for the Femise study indicate that if the labour force is relati-vely young in Morocco, this was not the case for Tunisia and Algeria where wor-kers are mostly below 30 years of age. On the other hand, here as well, female employment is dominant. However, in Tunisia, where average per capita income is nearly two times higher than that in Morocco, women’s motivations to seek employment are more personal such as to earn enough money to buy their marriage trousseau.
A revealing crisis that broke out before the end of the multi-fiber agreement
Recent tendencies of Maghreb countries indicate that production began to decline at the beginning of the 1990s in Algeria, in 1999 in Morocco and 2002 in Tunisia, and that employment followed the evol-ution of production.
The TC industry crisis appeared at the close of the 1990s in Morocco. Lay-offs began to take place. Revaluation of the Moroccan Dirham and uncertainties rela-ted to the end of the multi-fiber agree-ment engendered a decline in invest-ments, more lay-offs as well as losses in some European markets. Expansion in employment in the TC sector suffered from unfavorable changes in demand and price. In the first half of 2005, Morocco registered a loss of 60 000 jobs whereas the workforce in 2002 stood at 202 000 persons[22]. Morocco is also confron-
-36-
ted with problems in its own market, reflected in the drop in prices and this explains the disappointing performance of this sector. In the third quarter of 2005, production of the clothing indus-try lost -8.9% as compared to 2004; the textile branch and leather reached -0.8% whereas it had progressed by 5% in 2004. In the second quarter of 2005, exports of ready-made clothing and hosiery yielded 10.8% and 17.9% respectively. This produced a reduction of -3.3% in value-added of “textile and leather”[23].
As for Tunisia, it overcame the slowdown which occurred during 1980s. Furthermore, growth in the sector sur-passed that of manufactured exports. The country managed to preserve its share in the European market, which attained a peak of 6.1% in 1998 despite the arrival of new competitors (Morocco, Turkey, Eastern European countries). This is not the case since the end of the multi-fiber agreement which was followed by a wait-and-see approach, uncertainty, slow reforms while at the same time large exporting countries stepped up their investments. 79% of Tunisian enterprises of the sector produ-ce only for export [24] and nevertheless find difficulty in keeping up with com-petition with Asian producers in foreign and domestic markets.
As of 2005, the production of the TC sector faltered while the manufacturing sector in its totality progressed thanks to diversification toward automobiles and electronics.
In Algeria, the sector entered into a crisis before the crises in Tunisia and Morocco following restructuring along
the way to a market economy. In the 1980s, working conditions were rela-tively good, particularly in the public sector but less so for employees in the private sector especially SMEs where workers were replaced by apprentices or household workers in order to reduce production costs. In the 1990s, econo-mic restructuring engendered a wave of company closures and reduced produc-tion (1500 enterprises were involved). Employment in this sector declined by 60%, wages fell and occasional work increased. Legislation on working condi-tions (health and security norms, social coverage, working hours, etc.) was less scrupulously observed. In the same vein, paid holidays were abolished or reduced, training programmes abando-ned and canteens or medical centers closed down. Workers were not declared and the practice of paying wages in cash spread.
Fragility of the sector is essentially industrial
The textile-clothing industry in MPs is very fragile, because, except for Turkey, it appears that: √ These countries were not able to
forge a network, which is to esta-blish direct relations with clients-retailers. Through networking, acti-vities could be segmented and loca-lized in different countries without seriously impacting the price of the final product insofar as the cost of transporting intermediate products is relatively low. The strategic variables here are the time of transport and the cost of stocking incurred by each con-tributor in the network. This explains increased externalizing of operations
-37-
of cutting and assembling that allow taking advantage of specific manufac-turing in each location, both on a city scale or on the scale of one or more countries.
√ Their companies were incapable of ameliorating their position in the value chain. The central position in the organization of the value chain in the textile sector is held by the distributor in that he controls the strategic variables which are concep-tion of products and knowledge of the market. Hence it is at this level that more value is created (table x12). The price of an article can be three to fifteen times its price ex-factory. The difference is explained not by the quality of the fabric or a significantly higher time of execution but by the cost of promotion, distribution and “revenue” generated by the trade-mark. Moreover, inputs, such as the fabric which represents nearly 60% of the cost price of a garment, are the essential elements of a product’s competitiveness and not the cost of manufacture[25].
These are a few facts that indicate the method of organization of the TC sector which underlines the difference that exists between the enterprise that exports under its own local trademark and which controls and can capture a large share of the value, and the sub-contractor who produces the same pro-ducts for a foreign client who provides him with the model and fabric (table x12). Competitiveness of the former rests on factors other than cost (collec-tion, fame), whereas the latter depends on cost and time required. A third actor can intervene between the first two, the
co-contractor who makes an article from fabrics he has purchased and whose competitiveness refers to his knowledge of the market for basic products.
These two viewpoints, the value chain and the network, are not entirely dis-sociated from each other. The position that enterprises in a country can occupy along the value chain depends on the level of development of the network. The more an industry is diversified, the more an enterprise can easily find the raw material required in its country, the more co-contractor activities could be multiplied.
The multi-fiber agreement and trade preference accords, while curbing immi-gration and stimulating the emergence of developing countries, have furthered the appearance of “specialized clothing” in neighboring European countries which in turn have permitted an increase in the export of European fabrics. Incoming products to the European market without customs tariffs must respect rules of origin. MPs, except Turkey, having had no right to install a network on national territory were obliged to import fabrics from Europe.
However, this movement caused frag-mentation of the market. The four prin-cipal exporters (China, Mexico, India, and Turkey) account for 38% of global exports followed by twenty countries to the tune of 1% worldwide. Examining the cost of wages, competitiveness and industrial performance of diverse pro-tagonists indicates that positions occu-pied by some in the global market are artificial and solely maintained by the existence of the multi-fiber agreement. Countries that abolished quotas have
-38-
registered a formidable concentration of their imports, hence the two following economic configurations:
√ countries whose TC exporters are present in all markets, who rely on abundant and diversified national tex-tile offer;
√ countries whose exporters, essenti-ally sub-contractors, have a radius of regional action (European or American market), but where the TC sector accounts for more than 40% of the country’s exports, even if its share in added value is small (weak producti-vity, unskilled jobs), and is one of the
Table X10: Cost structure of clothing industry in several countries, 2001 (% of the production)
Source: Femise, study FEM22-34
Table X11: Cost structure of textile industry in several countries, 2001 (% of the production)
Source: Femise, study FEM22-34
Table X12: Value added in each step of the added values chain (from the fibers to the commercialization)
Source : Kurt Salomon Associates, in Textile Outlook international, January 2004, cited in Study Femise FEM22-34.
Unqualified manpower
Qualified manpower Capital Value-added Inputs Imported inputs
Canada 25,9 5,0 10,2 41,2 58,8 19,8
USA 21,0 5,8 5,8 32,6 67,4 13,8
France 21,6 4,7 8,8 35,0 65,0 24,3
Italy 14,3 3,1 16,4 33,8 66,2 13,5
Japan 21,9 4,0 11,2 37,1 62,9 7,8
Hong Kong, China 22,6 7,9 12,9 43,4 56,6 13,0
Korea 15,0 2,9 4,7 22,6 77,4 15,9
China Taipei 20,8 3,5 6,0 30,3 69,7 10,9
China 18,2 2,5 12,2 32,9 67,1 6,7
India 21,1 2,9 7,8 31,8 68,2 1,8
Vietnam 9,0 1,2 3,8 14,0 86,0 40,4
Czech Republic 21,1 3,2 9,9 34,1 65,9 28,9
Morocco 14,6 2,1 10,9 27,6 72,4 37,9
Unqualified manpower
Qualified manpower Capital Value-added Inputs Imported inputs
Canada 22,7 3,1 10,3 36,1 63,9 24,2
USA 19,5 4,2 10,3 34,0 66,0 9,7
France 13,8 3,7 7,2 24,7 75,3 22,0
Italy 11,8 3,2 7,2 24,7 75,3 22,0
Japan 17,6 6,6 7,0 31,2 68,8 11,2
Hong Kong, China 9,0 3,9 10,8 23,8 76,2 5,8
Korea 12,0 2,3 16,2 29,5 70,5 20,0
China Taipei 10,4 3,3 8,3 22,0 78,0 10,2
China 9,7 1,6 12,0 23,2 76,8 8,1
India 17,8 2,8 6,7 27,3 72,7 4,0
Vietnam 10,2 1,6 12,4 24,3 75,7 34,3
Czech Republic 13,0 1,8 13,8 28,7 71,3 35,1
Morocco 5,8 0,9 6,2 13,0 87,0 44,3
Stage Fiber threading Weaving Making Distribution
Shirt
Unit 1kg 0,8 kg 4,85 m 2,1 shirts 2,1 shirts
Value in USD 1 2,0 4,7 9,8 22,7
Value-added (USD) 1,0 2,6 5,1 12,9
% of final value 4% 5% 12% 23% 57%
Trousers
Unit 1 0,75 kg 2,3 m 2 trousers 2 trousers
Value in USD 1 2,2 7,5 14,5 37,5
Value-added (USD) 1,2 5,2 7 23
% of final value 3% 3% 14% 19% 61%
-39-
main industrial employers, is capa-ble of compensating the weakness of other exporters and drawing FDI (Bangladesh, Cambodia, Egypt, Syria, Tunisia).
In terms of competitiveness, MPs blame several types of handicaps:
√ They cannot compete in terms of wages with Asian countries where salaries vary between 50 (Myanmar) and 100 Euros (China) although they can do so with European countries (5% to 15% of European costs).
√ They suffer from significantly unqua-lified manpower and its negative impact on productivity.
√ Rigidity of the labour market hinders reallocation of manpower.
√ Evolution of real exchange rates wei-ghs on external competitiveness and the evolution of the US dollar has helped Asian countries in European markets.
Needless to say, they have the advan-tage of proximity to the European mar-ket, not that the cost of transportation is particularly low, but it still allows for better reactivity. Dispatching by air,
which represents an additional cost of 1 Euro per article and which does pena-lize medium range or higher articles, can nevertheless undermine this advan-tage (10% of Chinese exports). Cultural proximity remains.
A troubling factor is the decline of the share of Maghreb countries in the European market since 1998: 5.4% in 1998 against 4.9% in 2004 for Morocco, and 6.1% against 5.2% for the same years for Tunisia. These bad perfor-mances cannot be attributed to China’s progress in global markets following entry in WTO, or liberalization of certain exchanges of goods because these do not figure among the principal exports of these countries.
This phenomenon is due in particular to the slackness of investments accompa-nied by increasing uncertainties regarding the magnitude of harmful consequences caused by the abolition of the multi-fiber agreement. The crisis in the tex-tile-clothing sector in Maghreb countries probably had a self-fulfilling dimension. Figures of machine purchases highlight this. Between 2000 and 2003, when China bought half of the yarn equipment (long fiber) sold in the world, and India and Pakistan one quarter for short fiber, western Europe acquired 18 000 looms
Figures 5 and 6: textile-clothing investments in % of turnover (Tunisia and Morocco)
-40-
and Turkey 11 000, more than India, Bangladesh, Pakistan and Thailand put together. The effort exerted by Turkey is considerable despite the very grave eco-nomic crisis it was experiencing during this period. GDP lost 7%, 40% of stock was renewed. Egypt and Syria followed sluggishly while Tunisia and Morocco made very few investments.
Consequences of the end of the multi-fiber agreement
Exchanges in the TC sector are governed by the General Agreement on Tariffs and Trade of the 1st of January 2005, which put an end to the system of import quotas, which had been in force for 40 years. Liberalization of textile exchanges that was so dreaded is a reality today to which MPs, like the EU and the United States must adapt. Undoubtedly, in the face of the immediate opposition engen-dered by the first effects of the end of the multi-fiber agreement, quotas on Chinese imports were temporarily rein-troduced in spring 2005. MPs also obtai-ned a supplementary delay of two years to restructure this sector and prepare to confront Asian competitiveness. After January 2008, the only protection that will remain will be a tariff of 12.4% in the case of the EU (with a maximum of 13.4%) and 12.8% for the United States (with a maximum of 29.7%).
The consequence of raising quotas on European industry is a very tangible set-back for its exports in terms of yarn and fabric which will climb to nearly 15%. For the United States and the EU, the danger is not so much an invasion of their markets by products manufactured in China than the significant reduction of their yarn and fabric exports. These
products feed clothing industries in cen-tral Europe, southern Mediterranean and Central America who are subjected to the full blast of competing Chinese goods. The evolution of European and American yarn and fabric exports are but the effects resulting from the difficulties confronting the industries of these coun-tries.
Regarding MPs, the new situation car-ries both risks because exchanges with textile industries of Maghreb with EU in particular were relatively well protec-ted by this system as well as possible new opportunities which these countries should seize. This demands a considera-ble effort to adapt in the face of competi-tors who have belatedly, but more reso-lutely, engaged in the road to reform.
Opportunities and risks can be measured by some figures. Bangladesh, Sri Lanka, Vietnam, Mauritania and Cambodia have registered rapid pace of growth in this sector. China was the top exporter of textiles-clothing during 1995-2002 and its share in the global market rose from 22.5% to 30% in the clothing sector and 16% to 22% in textiles. On the other hand, numerous industries did not manage to adapt themselves and survive changes of competition. Clothes sector in Bangladesh could be the next victim. According to IMF report, the country could lose one quarter of its exports, i.e. at least 2.3 million jobs, after quo-tas are eliminated. North Africa, Turkey and eastern European countries could be evicted from the European market similar to Mexican and African producers from the American market. The rapid success of Cambodia, where garments were the leading manufactured product is equally at peril.
-41-
The impact of lifting quotas is often measured with a bias toward minimizing Chinese competitiveness. In fact, the measures are realized based on simi-larities between exportation structures of countries that enter into competition in EU markets, tilted, in the case of China by using data on clothing exports towards the EU which reflects the exis-tence of quotas. In order to circumvent this problem, one can calculate the index by taking as reference China-Japan exchanges whose structure is not too far from that of the EU, but whose aggregate does not suffer from the same limits. It therefore appears that potential competitiveness of Chinese exports over those of MPs is formidable and that MPs compete among themselves by blocs (Morocco and Tunisia, but not Maghreb-Machrek and Turkey with MPs). However competitiveness is less strong with eas-tern European countries who are new members of the European Union.
The effects expected of change are alarming by their importance, even if measures are always indicative. For example, it is expected that Morocco’s share in the European market will fall
from 5% to 4% in 2005 due to the rise in EU imports from Asia, in particular from China. However, the volume of textile exports in these countries is high and weighs upon the share of Moroccan and Tunisian value-added in total production and it does not allow the use of the currency devaluation weapon to boost international competitiveness.
The experience of 2002 of significant growth of shares in the European mar-ket of eleven Chinese products affected by the lifting of quotas following China’s entry into WTO (+13% to 45%) is enli-ghtening and heralds what will undoub-tedly occur in 2 years time. On eight clothing products, China has registered astonishing progress and equally sur-prising drop in prices: -12% to -80% of unit prices in Euros (figures 6 and 7). This is the result of suppressing quo-tas that involve costs and the reform of Chinese industry as State owned enterprises lose their privileges, thereby permitting others to progress as well as reducing intermediaries.
Recognizing that the TC sector was the motor for development of production,
Table X13: competition indicator of textile-clothing sector, MP, new members, China, with figures of 2003
Source: Femise, study 22-36Note: The indicator used is called Cos Cos. To compare the structure of exports to the EU of clothing articles of a country i to that of a country j, we have considered the vectors Eik et Ejk for k=1,...,n (n being the 246 items of the HS nomenclature HS for clothing) that represent the exports of the two studied countries in this sector. The “distance” between these two vectors is obtained by calculating the cosines of their angles that varies from 0 (total dissimilarity) and 1 (total similarity).
Romania Tunisia Morocco Poland Czech Republic Egypt Syria China China*
Turkey 0,5 0,6 0,7 0,5 0,6 0,7 0,8 0,3 0,8
Romania 0,7 0,8 0,9 0,8 0,4 0,4 0,4 0,7
Tunisia 0,9 0,8 0,8 0,4 0,2 0,3 0,6
Morocco 0,9 0,8 0,6 0,5 0,4 0,7
Poland 0,8 0,4 0,3 0,4 0,6
Czech Republic 0,0 0,0 0,4 0,8
Egypt 0 0,3 0,7
Syria 0,2 0,6
-42-
employment and exportation, and given that socio-economic characteristics of the sector, the competitive shock resul-ting from changes in competition cir-cumstances in international markets, can be translated as: (i) movement of manpower from the
formal to the informal sector of the economy (SME-SMI and independent entrepreneurs),
(ii) a decrease in productivity of work as a result of transferring formal man-power to sectors of exchangeable and non-exchangeable goods fol-lowing a decline in hourly wages or working time,
(iii) an evolution of wages that depends on capital intensity and qualification in diverse branches of production of SMEs.
A study undertaken by a Femise team indicates, especially through its sur-veys[26], that:
√ Consequences of loss of employment vary within and between countries according to structural characteristics of the three countries and their economic development standards but that insecurity rises.
√ With regard to working con-ditions, the idea that there exists a clear dichotomy between formal and infor-mal sector firms appears to be false. There exists a con-tinuum of enterprises whose characteristics and conduct
are embodied in a manner to carry out their activity partly in conformity with formal legislations and regula-tions and at the same time seeks to bypass certain obligations, particular-ly those pertaining to employment.
√ Because firms close down or down-size owing to ongoing restructuring, it is difficult to find a job in the same sector thereby prolonging the period of unemployment. Thus economic dif-ficulties increase even if this is not the case with all workers. On the whole, surveys confirm the results of other studies whereby informal employment is gaining ground in North Africa.
√ It is quite improbable that the clo-thing sector in the three countries can absorb workers who were fired during the past years or who will be regar-dless of the effectiveness of restruc-turing and possible improvements. Moreover, all that could be done to further increase the competitiveness
Figures 6 and 7: rising of China share in EU imports and fall of unit prices
Source: Femise, study FEM22-34
Increase of the China share in EU imports And fall in unit prices (in euros)
-43-
and efficiency should be realized, according to the authors, a strategy to absorb the excess workforce in the clothing sector must be elaborated and promptly implemented.
At the end of two years during which the EU will impose new quotas, as will the United States, Chinese exporters will have organized the rise of its range of products and converged their speciali-zations with those of MPs. For the latter, it is imperative to exploit this respite in order to face the shock looming in 2008 and which could mark the beginning of the end of textiles in MPs.
How to manage textiles after Multi-fiber
According to what preceded, the fol-lowing question is naturally posed: is it possible to prepare a “soft landing” for the textile sector in MPs, to give time to identify activities of the industrial sector and services that could take over the employment charge from the TC indus-try as well as its export and productivity gains? The above mentioned study pro-posed the following policy recommen-dations whose beneficial effects could rapidly materialize:
√ Maghreb countries must bear in mind three new elements to guide their restructuring strategy: firstly, chan-ges in conditions of international competitiveness, secondly, a trend that is more and more marked in the EU, namely to concentrate its supply sources in Asia (China, India), finally, modification of the role of textile-clothing producers, who are geogra-phically close to the EU but whose cost of production is higher and who
must be capable of providing reduced series in very short time (mid-season production or need for restocking due to a greater demand than predicted, etc.). Meanwhile, it is necessary for EU countries to ensure the constant quality of their products. Therefore they will continue to impose stringent control on design and origin of inputs (mainly from outside North Africa). The level of production for export by North Africa will by virtue of the above, probably continue to be inten-sive in importation and will depend on the capacity of firms to satisfy new orders in brief periods, to diversify their production, and to move from one product to another. The ensuing constraints are that one will need to sub-contract certain activities as in Morocco’s case, and strengthen the tendency for occasional employment. This is also a characteristic of the Moroccan clothing sector. In Tunisia, where the majority of companies are used to produce for trademarks such as Levis and Lee Cooper, there is scope for enterprises with the means to meet a more punctual demand (as in Egypt and Jordan).
√ As demonstrated by Morocco, deve-lopment of niche production oriented toward the parties that generate rela-tively higher revenues in the European market is possible. Other countries should possibly copy this trend even if attaining this type of slot (niche) is not easy. Tunisia is actually experien-cing problems in taking this turn due to lack of originality in production, a fear in changing entrepreneurs as well as delays in adopting modern mana-gement techniques (Zghal, 1999). The keys for succeeding in restruc-
-44-
turing the sector are: ameliorating the quality of products, by adopting innovative and modern management techniques. In this domain, the EU can assist firms in Maghreb countries (i) by helping to identify opportunities of existing niche markets (possibi-lity to exploit specific knowledge and savoir-faire in embroidery and other decorative techniques destined to certain markets such as kaftans and leather clothes, embroidered mar-riage gowns, evening dresses utilizing European styles and embellished with traditional embroidery of MPs), (ii) by offering necessary funds to start joint EU-MED activities in the clothing sector, (iii) by encouraging innovation within SME-SMI, (iv) by assisting firms in Maghreb to undertake stu-dies on EU markets, (v) by encoura-ging more efficient management via training programmes for Maghrebian entrepreneurs, namely in European companies (these programmes could be disseminated to all MPs and sec-tors).
√ The fact that it should be relevant to intervene at the level of SMEs signifies that policies in favour of facilitating exchanges, acquiring competences in design and production, micro-finan-cing possibilities, obtaining technical advice and encouragement to the groupings of enterprises could be very effective in the short-term; the objective of these initiatives is the development of SMEs in the clothing sector, but not only those.
√ It will also be beneficial to pro-mote knowledge of workers in the fields of design and productions in close cooperation with enterprises in
order to ensure jobs for all but not to create excessive personnel which is likely to increase unemployment. Tunisia already adopted initiatives in this regard by creating schools for technical education, particularly in design, specifically related to the textile-clothing sector. Training capa-bilities though are not fully exploi-ted. Therefore, regional cooperation should be established for developing training institutions.
√ An essential role that should be played by government if it wishes to assist enterprises in adapting to new competitive conditions is to simplify customs formalities. Responsiveness of firms in exportation is often hinde-red by administrative obstacles that delay passage through customs of imported intermediary goods used in the manufacture of these products. Morocco which is modernizing it cus-toms in cooperation with the World Bank, must take into account this dimension. Consequently a study on the opinion of firms on the effective-ness of customs reform in Morocco will provide useful information for other MPs.
√ Problems related to loss of revenue and employment suggest an extension of the period required to set up the free-trade zone with EU and Morocco from 3-5 years as was the case with Tunisia, provided that supplementary measures are taken to increase the capacity of the economy to respond to liberalization of exchanges. This delay will shelter Morocco from addi-tional pressures on its competitive-ness and will limit lay offs. Tunisia already obtained a delay and giving it
-45-
another is not pertinent because this will encourage firms and government to postpone restructuring, which is a necessity to face market realities.
√ Strengthening education is necessary for the three countries at all levels. Their reforms should aim firstly at promoting adaptation capabilities and flexibility of manpower. That is to say possessing basic knowledge including in the domain of new technologies. At the level of secondary and higher education, an extension for professio-nal apprenticeship and lifelong lear-ning would be welcome.
The project to establish a free exchange zone between the EU and MPs flagrantly lacks a clear-cut economic strategy for countries that need to liberalize. With time, predictions concerning rising reve-nues and employment in partner coun-tries, that theoretically should ensue from liberalization and reform of natio-nal economic policies, proved to be overly optimistic. Few studies focused on analyzing the nature of competition that these countries could progressi-vely come to bear in their principal export markets. Given the problems experienced by Morocco and Tunisia with their exportation keys, it is urgent today to elaborate realistic development strategies. This primarily means that they must understand that reform and investment in infrastructure are prere-quisites but were unable to generate the dynamism required by these countries. Hence other ways and means must be devised. According to the team who undertook this study, these strategies should bear in mind the specificities of these countries in order to identify and exploit new export opportunities while
exploring possibilities of enhancing the expansion of intensive production at work in the domestic market. The latter aspect depends on the rhythm of expan-sion of the domestic market. Its rise will augment demand by the necessary proportion but it is difficult to control and it will in turn depend on the rhythm of expansion of intensive exportation at work (goods and services). It also depends on the EU’s will to contribute, for example by reducing restrictions on horticultural imports from Maghreb. It is equally necessary to improve quality and competitiveness of domestic products and to generate higher revenue for the domestic economy by acquiring techni-cal training.
In Morocco where significant but unex-ploited capabilities are available in the domain of water reserves (Yang and Zehnder,2002), restructuring of farms via redirecting cereal producing land which is irrigated on a large scale towards hor-ticulture units and adding more intensive animal husbandry can increase revenue and employment. Consequently, it will contribute to the expansion of domestic demand for locally produced goods and services. Implementation of this stra-tegy will only be viable if liberalization of agricultural imports by EU not only take place but does so through a negotiated process that recognizes the rationale of a slower transition toward lifting pro-tection from agricultural products in the Mediterranean.
Whatever the case may be, if revitaliza-tion of the TC network is necessary, it also appears to be a short-term objec-tive considering the lessons of the first two chapters. It is a more global stra-tegy of sectoral diversification as well as
-46-
one lending support to local enterprises which should be elaborated. Within a context marked by intensive competi-tiveness between developing countries in the manufacturing sector and new openings in the market for exportable services, the pertinent question accor-ding to Femise is to improve capacities for responding to supply from MPs and the emergence of sectors that could take over present specializations that no longer keep pace with the most dyna-mic markets in the world. As indicated by surveys on enterprises in part 1, in order to carry this out, any industrial strategy should be coherent with the points raised in the first part on the needs of enterprises which, in the first place, have essentially stressed the par-ticular importance of the services sector, namely financial, communications, and transport services.
4. Services, relay opportunities
Services are seldom tackled by develo-pment theories which, marked as they are by industrial tradition, are confined to the role of supports for industry. However, current technical and institu-tional evolution demands a re-evaluation of the viability of development by servi-ces. Progress in telecommunications and information modifies the division of work and creates new possibilities for externa-lization, delocalization and exportation of services activities. Simultaneously, accu-mulation of human capital in developing countries allows some to mobilize a supply of qualified and competitive man-power for such productive activities.
In a context marked by insufficient sta-tistical coverage and a problematic that is relatively new, several approaches are
combined. After a synthesis of the ter-tiarisation process in different MPs and exportation prospects in this domain, one can deal with the opportunities that are being opened before MPs today, either by developing comparative advan-tages and promising niches (tourism, health services) or by liberalizing and reforming sectors identified in the first part as indispensable in assisting firms to adapt to the new context (banking services, telecom, transport).
Growth and development pers-pectives for services in the Mediterranean
The process of tertiarization concerns rich and developing countries alike and the correlation between income per capi-ta and degree of tertiarization is narrow. Turkey aside, MPs are an exception to these heavy structural trends, on the one hand because at the regional level, there is no relation between per capita GDP and contribution of services to GDP. On the other, at the level of national eco-nomies, the weight of services stagnates (Jordan, Morocco, Tunisia) or diminishes (Algeria, Syria) since the 1970s.
However, ongoing internationalization in the service economy seems to have started quite early on in MPs. The ope-ning rate of services, in the aggregate, is higher than the world or European average; and it is rising. As for all MPs, the contribution of exported services to national income increased by 50% during the past two decades. This sector accounts for a larger share than others in total exports. It provides more than half of export revenues in two countries (Egypt, Lebanon), and more than one quarter in five others (Turkey, Israel,
-47-
Morocco, Tunisia, Jordan). At the regio-nal level, exchange of services generates a growing trade surplus and constitutes an essential factor in stabilizing the balance of payments. Despite this “spe-cialization of services”, MPs have not profited from the internationalization of the sector as much as other developing countries and their share in the global market has fallen. Nevertheless, MPs are characterized by a marked hetero-geneity in terms of different indicators of trade performance. Utilization of a classification breakdown in ten branches of services will allow a description of the service specializations in each MP and identify, alongside the effective specia-lizations, existing growth opportunities (table x14).
Gains of liberalization in services: the case of banks and telecommu-nications
Besides traditional markets such as tou-rism (illustrated opposite) or nascent such as exchanges in health services (illustrated below), the other side of the
Box: Exportation of tourism services in Tunisia and Mediterranean countries
Tourism constitutes one third of global services exports. As for MPs, revenues from the item travel rose to 20 billion US dollars in 2000, as compared to 10 billion for textile exports, 90 billion for total goods exported and 5 billion derived from emigration. These revenues provi-de between 15% (Turkey) and 50% (Cyprus) of incoming hard currencies. Direct net revenues from tourism represent a growing percentage of GDP in the region: from 1 point in 1980 to 4 points in 2000. For MPs who posses these, the utilization of satellite accounts of tourism demonstrate that the sector’s weight measured by the demand of the economy, ranges from 10% (Turkey) to 19% (Tunisia). The place it occupies in employment is close to its partici-pation in GDP. The link between added-value and tourism employment (excluding induced effect) leads to a production level similar to TC activity.
The Southern Mediterranean is one of the prime destinations for mass tourism. The flux into the region rose from 4% (1990) to 6% (2003) of global tourism, whereas income was multiplied by 2.5. Simultaneously, competitiveness was intensified on the Euro-Mediterranean market. However, tourism offers by MPs vary far more than at first glance. Indeed one can observe national preferences which are translated by dis-tinct specializations, sometimes by the sending country or by the receiving country. Moreover, exportation performance is equally diverse. It is possible to distinguish three diverse profiles: extensive growth (Turkey), intensive growth (Morocco), loss of competition (Egypt, Tunisia).
Table X14: taxonomy of service industries for which there is a potential growth
Source: Femise, study FEM22-34
Industry Turkey Israel Algeria Morocco Tunisie Egypt Jordan Lebanon Syria
question of services could be appre-hended in terms of competitiveness. As been underlined on many instances, MPs have committed to an opening up strategy. But, this for the time being is focused on industrial sectors. It is there-fore necessary to advance on the ques-tion of services, rapidly in certain key sectors well identified through the reac-tion of firms (cf. part 1), for two reasons that reinforce one another: (i) to identify new specializations that would augur well as the world evolves; (ii) to foster conditions that favour competitiveness of local companies so that they can keep pace with other sectors.
Certainly today there is recognition of the importance of services in the eco-nomy. Technological progress also plays a key role in the attention given to trade in services by decision makers. Progress in the fields of finance, information tech-nology, communications, and transport has contributed to a rapid expansion of trade in services. Long considered as expensive, international transactions have been facilitated by the flow of elec-tronic information.
The advantages of liberalization of ser-vices were highlighted by certain facts, such as the increase in exports and FDI achieved by countries which have enhan-ced their services performance related to trade (transport, finance, roads and telecommunications).Internal reforms aim at lowering the cost of transport and daily manage-ment of affairs can play a crucial role in improving access to global markets. Liberalization of services will strengthen the capability of exporters to respond to reforms carried out within the framework of trade, and allow local producers to
Box: International trade health ser-vices and exportation perspectives of developing countries
Exportation of health services traditional-ly flowed from North to South; patients traveled inversely. However, factors that ensured the attraction of health services in the North progressively became com-monplace and widespread along with the increase and improvement of medical capabilities in several developing coun-tries.
Export opportunities in this sector are evaluated here, on the one hand by estimating the volume of international health trade in terms of trends and structure of these exchanges. On the other, by analyzing the Tunisian expe-rience. Exportation of health services represents one quarter of private sector activity. With the accommodation ser-vices involved, they attained 107 mil-lion US dollars in 2003 – nearly 4% of Tunisian service exports– and provided nearly 10 500 jobs.
At the global level, this trade witnesses an expansion that is faster than the ave-rage of the exchanges, especially since 2000. It stood at 11.8 billion US dollars in 2003, that is 0.75% of global services exchanges. This proportion has doubled since 1997. Case studies and global ana-lysis converge to underline the regional dimension of external health services. 84% foreign patients in Tunisia, 87% in Jordan hail from neighbouring coun-tries. Trade of other developing coun-tries’ exporters of health care (Thailand, Malaysia, Cuba) is subject to the same principle of proximity. The particular nature of trade in health services and the specificity of its demand explain this predominance in South-South exchan-ges. These two characteristics highlight a promising niche for MPs in the Euro-Mediterranean in the vicinity of the EU, but also prospects of expansion in South-South integration
-49-
better coordinate their activities with input suppliers situated in higher income countries, thereby rendering the country more attractive for FDI. Furthermore, liberalizing trade in services can create investment opportunities for the pri-vate domestic sector and help in drawing foreign investments that do not entail a debt burden such as FDI and port-folio investments. FDI in services was the principal engine of FDI global flux during the 1990s and today represents nearly half of the value of FDI stock in the world.
However, MPs experience difficulties of profiting from these global trends because they are inclined to imple-ment services reforms in a dislocated manner. Privatizations that took place were slower than in other parts of the world; barriers upon entry always held back investors both foreign and local. The reason for this is undoubtedly to be found in strategies to preserve employ-ment. Services, essentially public, were (and still are) envisaged in the first place as a reservoir for employment which eventually allow the management of social adjustment in industry. They are not understood as “productive” sectors in themselves. Therefore, what undenia-bly emerges from surveys conducted by Femise teams is that a number of these sectors participated in the industrial process, providing firms with other com-petitive sources, thereby placing them in the heart of the industrial processes. The specificity of MPs according to this point of view is that they act negatively, that is to say firms regret their absence and inefficiency. Hence, not only can they evolve as a new regional specialization but the effects practicing on local fabrics can lead to better returns on their open
door strategy in general, and the Euro-Mediterranean process in particular.
Opening up of services markets in the Mediterranean region to competition can offset the costs of adjustment stemming from merchandise trade liberalization: pro-competitive reforms that facilitate entry by new firms can generate large employment opportunities for skilled and unskilled workers who are employed by governments in low productivity jobs. Because services often cannot be tra-ded, increasing access to services mar-kets is likely to entail the entry of foreign competitors through FDI. This will lead to the introduction of new technologies as well as hiring domestic labor.
In this section, based on the case of four Mediterranean partner countries (Egypt, Morocco, Tunisia, and Turkey), we are going to explore the potential welfare gains of the liberalization, more specifically defined as alignment with EU regulations of trade in services, in three sectors: the banking sector, the telecommunication sector and the mari-time transport sector. Special emphasis is drawn on the banking sector, where highlights of recent reforms and recent performance of the sector in the respec-tive countries is given, and on transport due to the expected gain and the cohe-rence with the MP strategies. For the 3 sectors, the general presentation is followed by an estimation of the overall welfare gains of liberalization through compliance with EU regulations.
Banking sector: Effects of full con-formity with EU
During the nineties, several MENA countries have embarked on significant
-50-
reform programs of their financial sec-tors, where they commonly initiated with banking sector reform. The outco-mes of those programs, though varied across countries, were generally modest and have thus urged for another wave of reform and modernization. Within the phase to come, most MENA economies will be looking forward to setting the stage for deeper global integration, of which integration with the EU is a key ingredient. Thus, several countries of the region are indeed considering ope-ning up their services sectors gradually to the EU competition; that is to extend their Free Trade Agreement with the EU to cover trade in services.
It is worth noting that liberalization as used in this context is not meant to denote the removal of all regulations or all forms of restrictions, but it refers to the status where prudential regulations essential for the survival of the banking sector is preserved. Thus, the term “liberalization” in this section refers to the alignment of countries’ legislations and institutions with those commonly adopted by the EU countries, and hence also refers to the compliance to the requirements of integration with the EU. This part basically explores the impact of the liberalization of the banking sec-tors in four selected MENA countries (Egypt, Tunisia, Morocco, and Turkey) on their performance, while assuming the country undertakes the reforms needed for a successful integration.
Opening banking services to the EU com-petition may arguably lead to the impro-vement of the banking system in the MENA countries, paving the way for bet-ter and cheaper services. As compared to the case of trade in goods, measuring
liberalization of trade in services is found to be difficult and problematic. Trade in services differs from trade in goods, not only for being applied on four conventio-nal modes, but also because of the way the domestic market is protected. In case of services, a country’s legislations and institutions are assumed to add to mere tariff protection observed in the case of goods. However, it has been pos-sible to calculate tariff equivalent to the restrictive regulation. This facilitates the estimation of the impact of liberalization on various indicators, including prices and welfare.
This section, based on the result of a Femise study[28], will provide for the estimation of the overall welfare benefits accruing from the implementation of full liberalization measures, by quantifying the tariff equivalent of restrictive measu-res adopted in the banking sector and testing the effect of lifting them.
In Egypt, the liberalization moves were translated into a sector enjoying a rela-tively low tariff equivalent rate (11.7%) compared to 5% in the case of the EU. A number of additional indicators, not included in the calculations, if taken into consideration would have even resulted in a lower tariff equivalent. The simulations showed that if the banking sector in Egypt was more liberalized reaching the extent of liberalization in the EU this would not be translated into significant welfare gains for the Egyptian economy where a 6% reduc-tion of prices will result only in 1.44% welfare gains in consumption and 1.2% of GDP. Moreover, even if larger price cuts were undertaken it will not result into larger welfare gains where a 26% price reduction will increase the welfare
-51-
gains to 6.54% of consumption and 5.47% of GDP.
In Tunisia, the result obtained gives a rate of restrictiveness (RI) of 55 per-cent; which is quite remarkable: this rate is high but comparable to other results obtained for other similar deve-loping countries. It implies, approxima-tely, a 50 percent tariff equivalent rate. Using the 1997 Tunisian 99 sector input-output table, the calculations of the price and welfare variations were performed, it comes out that the gains are positive, significant but modest. Prices, other than the banking price, would decrease by no more than1 percent and often by less than 0.5%. And the total welfare gain is less than 0.5 % of the current GDP.
As for Morocco, harmonizing the Moroccan banking sector regulations along the EU lines, would translate into a reduction of 19.3 percent of the cost of banking services, given that the restrictiveness index for the EU is estimated at 0.0708, which leads to a tariff equivalent of 6.3 percent in comparison with a scenario of full liberalization. In order to assess the effect of this reduction on the eco-nomy, the 1998 Input-Output table of the Moroccan economy has been used assuming that there are no significant changes in the structure of the Moroccan economy over the period 1998-2005. The results indicate that the welfare, captured through total consumption, will improve by 1.15 percent. Since in 1998 consumption represented 86.12 percent of GDP, this welfare gain will translate into an increase of 0.9912 percent in GDP.
In the Turkish case, with the new price of banking services under liberalization, it
was found that the welfare of the society will increase by 1.38 percent. Thus, the effect of the adoption of EU rules and regulations similar to those of the EU countries in the banking sector amounts to US$ 2.1 billion annual increase in the real income of the Turkish consumers. Since during 1996 consumption formed 72.95 percent of GDP, the percentage change in welfare of the society is equi-valent to 1 percent increase in real GDP. Moreover, as the cost of the 2001 finan-cial crisis has been estimated as $53.2 billion, and considering the figure of 6.86 percent for the annual real interest rate, we note that the annual cost of the currency crisis amounts to US$ 3.65 billion. Turkey would not have incurred this cost if it had adopted and implemen-ted the legislative, regulatory, and ins-titutional framework of the EU banking system at the beginning of the 1990’s. Noting that GDP in 2004 has amounted to US$ 300.63 billion, the welfare gain from adopting the EU rules and regula-tions in the banking sector can be thus calculated as 2.2 percent of GDP.
It can be inferred from previous results that adopting EU regulations is not expected to result in a significant boost in the overall welfare. The highest poten-tial gains were observed in Egypt (1.2% of GDP), and the lowest were observed in Tunisia (0.5%). However, this abs-tracts from the even more important gain produced by a more competitive banking sector, the effect on investment and growth, which is not captured by the input-output equations. The quantitative exercise, however, points here only to the fixed effects of prices, which are positive, and generally nearly one point of GDP, bearing in mind that these effects are calculated using input-output table,
-52-
which assumes a constant of productive combinations. As explained previously, the essential gain expected from a “mise à niveau” of the banking sector, rests in fact, on the dynamic effects that will result from the positive modification of the firm’s competitiveness (we need to remember that most of the studies that were based on analyzing impediments facing firms, recognized the access to financing as the main concern) on the whole sectors.
Other much underestimated effect is the anticipations effect, which is going to bring, at a given moment, the society to take a decisive step. The example of the textile and clothing sector, and its under-investment, also indicates that the current agents` expectations are reserved to the national level. Therefore, the modification of the banking sector, in particular in its function as provider of financial resources to enterprises, will constitute a decisive stage, firstly by bringing a visible change in the condi-tions of the agents’ daily operations with a strong symbolic power, and also the efficient firms will find means of compe-titiveness that are currently lacking.
Liberalization of telecommunication
Over the last decade, the telecommuni-cation sector has embarked on a period of deep change initiated by technologi-cal innovation, liberalization of national markets, and by partial or full liberaliza-tion of incumbent operators. Historically, telecom operators were state-owned and vertically integrated monopolists. Due to large fixed costs of building a network, the activity of providing tele-communication services was considered as natural monopoly. However, techno-
logical progress and innovation gene-rated new transmission systems and decreased the cost of building infras-tructure. Therefore, the idea of a natural monopoly is no longer seen as valid. In addition, evidence indicates that the absence of competition does not provide incentives to decrease costs, and leads to inefficiencies and welfare loss. As a consequence, most historical operators, all over the world, have been subjected to privatization plans.
This section follows the same approach of the previous section in providing an estimation of the expected welfare accruing from the liberalization of the telecommunication services in Egypt, Tunisia, Morocco, and Turkey.
In Egypt, this sector has gained increased importance since 1999 with the establis-hment of the Ministry of Communications and Information Technology (MCIT). A number of major changes have happened in this sector reflecting the increasing role it plays in the development process and in catching up with the advan-ced technology. The telecommunications sector contributes largely to the Gross Domestic Product (GDP) where the offi-cial statistics show that it represents 3%. Moreover, it is considered one of the fastest growing sectors in the economy. The number of employees in the whole sector was estimated at around 0.27% of the total labour force, which is relatively low revealing the capital intensive natu-re of this industry. The sector had seen a total expenditure of 2.3 billion US dol-lars in 2001 which represented 2.5% of GDP (International Telecommunications Union (ITU), 2001). The FR index for the fixed line was 0.519 and the Foreign Discriminatory Restrictiveness (FDR)
-53-
was 0.387 which represents around 75% of the FR. The same exercise was repea-ted assuming the more liberal scenario likely to prevail after the end of 2005. An FR index of 0.138 and an FDR index of 0.0973 were obtained, where the latter represents around 70% of the FR index. For the mobile subsector we obtained an FR index of 0.354 and FDR index of 0.235 which represents 67% of the FR. In the internet sub sector we obtained an FR index of 0.124 and FDR of 0.089 which represents 72% of the FR.
On calculating the tariff equivalent the results obtained were 13% in the case of the mobile which decreases to 4% if the constant of the fixed line sector is applied instead of the mobile. In the case of the internet, where the fixed line coefficients were applied, a tariff equiva-lent of 2% was obtained.
Results generally reveal that the tele-communications sector in Egypt has experienced several changes on the policy and regulatory level driving the sector with all its subsectors towards liberalization. The estimated tariff equi-valents showed that the mobile sector is relatively highly protected when compa-red with the fixed line and the internet. Though this might come as a surprise as the fixed line is likely to be more pro-tective, it is believed that this is rather a result of the specification of the model used (which changes tremendously the fixed line model specification applied). The estimations showed that there is a high expected decrease in the level of protection in the case of fixed line subsector when the GATS commitments are fully implemented by the end of 2005. Despite the rapid adoption of new technologies and the introduction of IT
in different sectors of the economy, as observed by different indicators, Egypt is still relatively lagging when compared to the lower middle income set of countries to which it belongs.
In the case of Tunisia, the Tunisian government was for a long time reluc-tant before undertaking any strategic liberalization move, and little was done until 2001. But in 2001, the liberalization process in this sector was accelerated, and the issue is no longer whether or not to open it to competition and to foreign investment but how and how fast to libe-ralize. The answer should depend on the expected impact of this liberalization on the telecommunication sector itself and on the whole economy, and also on the way liberalization is designed.
Applying the analysis separately to fixed line telephony, mobiles and internet ser-vices, RI equivalent to 60 percent for fixed lines, 46 percent for mobiles and 53 percent for the internet was obtai-ned... The sector overall RI is taken as the average of the three RIs calculated. The average overall rate is thus 53 per-cent. Consequently, the overall tariff equivalent is 70 percent.
The result is not surprising and con-firms that telecommunications are still strongly protected. Beyond the expec-ted direct effects for Tunisia however, the main concern is the existence of coherence within the Tunisian strategic plan of economic development based on knowledge. Communications techniques are the pillar without which the success of the Tunisian plan can’t be acheived, and it requires a huge reduction of the protectionism in order to increase the local diffusion.
-54-
As for the Moroccan case, Since the early nineties, Morocco, like most other countries, has put substantial emphasis on telecommunication and information technologies. The significant develop-ment recorded over the last decade can be traced back to three major cau-ses: legal and institutional telecom-munications reforms; political openness and democratisation; and, technological changes.
The overall restrictiveness index for tele-communications services in Morocco was estimated to be 0.278, and the tariff-equivalent obtained therefrom was equi-valent to 32 percent. In other words, the extent of existing restrictions increases the price of telecommunications services by 32 percent compared to what would prevail under full liberalization. The cal-culation also indicates that the magni-tude of the tariff equivalent amounts to 40.5 percent for the fixed telephony, 29.7 percent for internet services, and only 23.4 percent in the mobile telepho-ny. These results provide evidence that full liberalization of telecommunications services would benefit users particularly in fixed telephony and internet services. The expected price reduction for mobile services is relatively lower but still signi-ficant in absolute terms.
In order to assess the total effect a 32 percent decrease in the price of tele-communications services on the eco-nomy, the 1998 Input-Output table of the Moroccan economy has been used. By using this table, it was assumed that there are no significant changes in the structure of the Moroccan economy over the period 1998-2005. In particular, this presumes that the telecommunication sector plays more or less the same role
in 2005 compared to 1998. Yet, this assumption is a serious limitation as it tends to underestimate the remarkable progress in telecommunication sector over the last few years. The second limi-tation of the 1998 Input-Output table of the Moroccan economy is the absence of any distinction between transport and telecommunications, only one line stands for both. On the basis of value added data, the share of telecommuni-cations in “Transport and telecommuni-cations” amounted to 23 percent in 1998 and more than 34 percent in 2002.
On the basis of previous computations, the adoption of the EU rules and regula-tions in the telecommunication sector is expected to lead to an average reduction of telecom services’ price of 32 percent. Accordingly, the welfare of the society captured through total consumption, will improve by 1.627 percent. Since in 1998 consumption represented 86.12 percent of GDP, this welfare gain will translate into an increase of 1.4 percent in GDP.
Since in 2004, GDP amounted to DH 444 billion or the equivalent of US$ 50 billion, the preliminary and rough approximation of the welfare gain from adopting the EU rules and regulations in the telecommunication sector is esti-mated at US$ 700 million. It very likely that this figure underestimate the total effect of liberalizing telecommunications services in Morocco.
In Turkey, the telecommunication ser-vices were provided until 1994 by the state owned company PTT, a national monopoly providing postal and tele-communications services. Turkey deci-ded to liberalize the telecommunica-tions sector during the 1990’s. A new
-55-
Telecommunications Law was passed by Parliament in 2000, which was amended in 2001. Since then Turkey is trying to liberalize the telecommunications sector by following the EU approach to libera-lization. It recognizes that competition and regulation in the sector are vital, and that privatization combined with the establishment of conduct regulation is essential for achieving economic effi-ciency and the guarantee of a universal service to keep the country away from the danger of digital divide.
Estimations of the FR indexes revealed a value equals to 0.193 in the case of the fixed line, 0.165 in the case of the mobile, and 0.12 in the case of internet services. Using input-output tables, and assuming that with the adoption of the EU rules and regulations in the telecom-munications sector, telecommunications price will decrease by 33.53 percent, the welfare of the society was found to increase by 0.587 percent. Thus, the effect of the adoption of EU rules and regulations in the telecommunications sector similar to those of Finland and the United Kingdom amounts to US$ 1.12 billion annual increase in the real income of the Turkish consumers.
Since during 1996 consumption formed 72.95 percent of GDP, the percentage change in welfare of the society is equi-valent to 0.428 percent increase in real GDP. Finally, it should be noted that as of 2005, Turkey has adopted most of the EU rules and regulations in the telecommunications sector. With further alignment of these rules and regulations to those of the EU and strict implemen-tation of these rules and regulations by TA, Turkey could derive the welfare gains calculated above.
The importance of maritime trans-portation
Maritime transportation constitutes an important economic activity in almost all Mediterranean partner countries. For instance, about 95 percent of internatio-nal trade of goods from and to Tunisia is shipped, and the volume of its trade (exports and imports) is worth close to 80 percent of its GDP. In Egypt, the importance of the sector arises from the geographical location of Egypt which had made its seaports among the most important in the Mediterranean area, whether acting as a hub for the Arab region, or as an important station for the transshipment cargo between Europe and the rest of the world. In Morocco, available statistics show that more than 98 percent of the country’s international trade is carried by sea, which is the equi-valent of more than 60 million metric tons in 2004.
So, transportation is an essential com-ponent of the MCs’ capacity to preserve and extend their market share and to face the competition in their markets. In the present case, however, the most important issue is that of the regional coherence, which must be emphasized while considering in details the opening measures, as the gains of each country is dependant on the actions of the other partners. Thus, if Algeria improves the capacity of its airports to accommodate large cargos, its exchanges can rise with other MCs under the condition that they can offer the same services as the airline companies[29].
A Femise study on the conditions of regional integration can be referred to to illustrate the importance of the
-56-
sector[30]. The analysis shows that trade between zones further and fur-ther apart has risen thanks to the maritime expansion although the cost stays high even despite that it is a key element of the MCs’ capacity to face the competition. The creation of the link traffic-quality in infrastruc-ture seems to be distending itself, this may appear paradoxical, but, it in fact reflects the existence of scale econo-mies. The countries which were late in the 70s and 80’s have caught up with the most developed countries and the construction gains of an additional road, for example, will be less and less significant with the extension of the road network.
Nevertheless, the traffic creation within the MCs (Algeria, Egypt, Morocco, Tunisia, Turkey) resulting from a reduc-tion in transportation costs due to an improvement in transportation quality, from an intermediary situation to an equivalent level to that of 25% of the most efficient countries[31], could be between 34% and 55%[32]. Turkey, the richest country in the region which is recording a weak share of infrastructu-re, could benefit the most this way. The importance is to know if it will get all potential gains of the “mise à niveau”,
bearing in mind that the necessary adjustments are considerable.
Also, the global effect of the liberali-zation of the maritime transportation can be calculated, using just about the same methodology used in the previous sections. It summarizes the outcome of a FEMISE study (FEM 22-02) that investigated the overall welfare accruing from the liberalization of the sector to the full compliance with the EU regula-tions. Thus, it should be reiterated that the liberalization as used in this context refers to the application of EU regulation and does mean the abolishment of all regulations.
The findings in Egypt shows that the maritime sector is among the sectors that remain relatively restricted when compared to banking and telecommuni-cations. The tariff equivalents are rela-tively high; however it is comparable with other countries. In fact the Foreign restrictiveness (FR index) of Egypt is less than that of the United States and highly comparable with Germany. The major problem related to the maritime sector is the non-transparency where the laws stipulate certain liberal issues, however reality shows restrictive practi-ces. Despite the reforms undertaken in the 1990s that have helped to liberalize the sector, it still remains highly protec-ted. This has been confirmed by Egypt’s GATS obligations that showed highly restrictive commitments.
Due to data implications, the analysis was conducted jointly on the maritime and telecommunications sectors. The liberalization of maritime and telecommu-nications sectors following the EU norms was found to result in welfare increase of
Figure 8: Share of each country in the zone infrastructures total
Source : Femise study 22-36
Tunisia
Turkey
Algeria
EgyptMorocco
-57-
11.2% and 0.89% respectively in terms of consumption or successively 5.47% and 0.74% of GDP. In fact welfare effect is likely to be lower than shown here, as the calculations are assuming that libera-lization applies to the whole sector that includes telecommunications, maritime as well as other modes of transport.
In the case of Tunisia, the maritime trans-portation restrictiveness index obtained is equal to 40 percent, and it is equiva-lent to a 50% tariff. Given the measures already taken to liberalize the sector, this rate is not so high compared to other countries in and outside the region, but it remains rather restrictive compared to the rates obtained for more developed countries, including the EU countries. If liberalization refers to the adoption of EU regulations, then the restrictiveness index would have to be reduced to about 30%, which is approximately the rate obtained in the EU countries, and the tariff equivalent rate by about as much. Maritime transport prices would therefore be significantly lowered. In terms of the indirect impact on commodity prices, and on welfare measured by the equivalent variation, the result may seem weak, but the numbers do not really capture all the gain.
In Morocco, by converting the overall restrictiveness index for maritime trans-port services in Morocco, estimated at (0.5425), we obtain a tariff-equivalent of (72 percent). In other words, existing restrictions generate an extra cost of maritime transport services of 72 per-cent compared to what would prevail under full liberalization. This substantial cost affects the economy as a whole and undermines seriously the capacity of the Moroccan operators to compete effecti-
vely on foreign markets. It also repre-sents a serious handicap for attracting foreign investors willing to use Morocco as an export platform.
In order to assess the hypothetical effect, a 72 percent decrease in the price of maritime services derived from our pre-vious calculations on the economy, the 1998 Input-Output table of the Moroccan economy has been used. It assumes in particular that the maritime sector plays roughly the same role in 2005 as in 1998. This assumption is to some extent defendable with regard to the role of maritime transport statistics, and the current state of reforms covering various components of the logistic chain. However, the serious limitation of wel-fare assessment of liberalizing maritime transport services in Morocco emerges from the fact that the 1998 Input-Output table does not separate transport from telecommunications. On the basis of the conducted computa-tions, it seems that by aligning Moroccan regulations in Maritime transport ser-vices with their European counterparts and ensuring that various services are provided in a competitive environment, would lead to an improvement of con-sumers’ welfare captured through total consumption by 3.254 percent. Since in 1998 consumption represented 86.12 percent of GDP, this welfare gain would translate into an increase of 2.84 percent in GDP. This is a substantial amount and reveals the magnitude of the economic cost for Morocco due to lack of efficiency in the maritime transport services. This amount also indicates the potential gain that could be generated once maritime sector reforms are fully and effectively implemented.
-58-
In the Turkish case, foreign indexes for Turkey and the 15 EU member countries (on average) are calculated as 0.4944 and 0.3270, respectively. In converting restrictiveness index obtained above into its tariff (ad valorem) equivalent, three alternative scenarios were considered. Scenario A is based on the assumption that Turkey will lower her foreign index (0.4944) to the level of the EU (0.3270), if it adopts the EU rules and regulations in the maritime sector as they prevailed as of the end of 1998. In scenario B, the degree of existing maritime restrictions in Turkey is lowered to the level of the UK (0.2394), where the foreign index is the lowest among all EU member coun-tries considered. Finally, in scenario C, it is assumed that the degree of existing restrictions in Turkey is reduced by 100 percent (i.e., all restrictions on trade in maritime services are removed).
The calculations reveal that, if Turkey liberalizes its maritime sector to the 1998 level for the 15 EU member coun-tries, then Turkish maritime prices will be reduced by 30.44 percent. A further maritime liberalization in Turkey to bring the sector to the UK’s level will cause an additional fall in shipping prices in the amount of 15.92 percent points. However, a complete elimination of trade barriers in Turkish maritime sector is expected to create a cost fall of 89.9 percent.
To analyze the possible welfare effect of the change in the price of maritime transport on the prices of other goods and services, the 1996 Input-Output Table of the Turkish economy which has 97 sectors was considered. Under the abovementioned three alternative scenarios about the degree of maritime
liberalization in Turkey, the welfare of the Turkish society will increase by 0.22, 0.34 or even 0.66 percent respectively. However, these potential welfare effects need to be converted into their real GDP growth equivalents. Since during 1996 consumption formed 72.95 percent of GDP, the percentage change in welfare of the society is equivalent to 0.1616, 0.2464 or 0.4793 percent increase in real GDP of Turkey.
It can be concluded that liberalization of the maritime sector holds a scope for higher welfare of the respective coun-tries, albeit with varying degrees. The four countries were found to benefit from adopting and implementing the legislative, regulatory and institutional framework of the EU maritime transport sector. This is expected to accrue mainly due to the increase in competition in the maritime transport sector. It is worth noting that, one of the limitations of the Input-Output methodology is that it only accounts for static effects. It does not capture any likely increase in consumer demands for various commodities fol-lowing their price reduction, which would require information on price elasticities of demand for all commodities covered in the input-output table.
Moreover, it can be highlighted that even if these global static effects appear “modest”, they remain the most signi-ficant for 3 out of the 4 countries. Especially in terms of prices, the effect on the firms will be far from negligible at the micro economic level. As underlined in the first part, the firms acquire optimi-zation behavior to face the competition and from this point of view, transporta-tion problems constitute an obstacle that is often mentioned. It is obvious that all
-59-
means allowing the stimulation of firms’ price competitiveness, without having an effect on labor or wage levels (which is incompatible with the social constraints of the MCs) assumes a strategic impor-tance. Finally, the examination of the problems facing the textile and clothing sectors has also shown that the MCs might, to improve their value chain, increase the reactivity of their firms. Here in addition to the prices effect, the transport liberalization becomes also a major component of a global industrial project.
Moreover, transport remains a deter-minant factor and a major piece in the big puzzle of development because the existence of a reliable transport sector is a precondition for investors and espe-cially for exporters. It is well established at least that with an inefficient maritime transportation system, progress in terms of investment and growth would be very hard to achieve.
III. Regional integration: time for choices
The question of transport naturally brings to mind one of the main missed opportunities of the ten first years of the Barcelona process as mentioned in the introduction, namely South-South regio-nal integration. The open door strategy was clearly selected by the quasi-totality of Mediterranean partners, but the North-South axis was still much preferred to a more regional dimension. It is the objec-tive of this chapter to raise the question of the coherence of this state of affairs, and seek the reasons that could explain it or allow proceeding on the transversal axis and which might seem essential in the Euro-Mediterranean context, about
what the European model can contribute to the latest regional initiatives.
1. Current international integration of MPs
Very few countries are not involved in some trade agreement or another (7 according to Bouet and Mayer, 2003) and from this point of view MPs are not atypical at first glance. They are mem-bers of WTO (Egypt, Morocco, Tunisia, Turkey since 1995, Jordan since 2000); they signed trade agreements with their European neighbours. Moreover, the policy of new neighbourliness launched negotiations for the establishment of a vast Euro-Mediterranean free trade area: finally they are parties to diverse regional agreements.
The main question is to know what is the degree of coherence in MPs’ trade stra-tegy and the compatibility between their multilateral and regional approaches to the liberalization of exchanges. To reply to this question, one approach consists of measuring the degree of trade openness of a country, starting with an assessment of the level and distribution of tariffs and the consequences of non-tariff barriers. In fact, protectionism can be defined as any act that impedes the exchange of goods and services by rendering goods imported by a national actor more costly than the same products on the national market. If the price, all taxes included, of these two identical goods produced in two different places is the same in the market under consideration then there is no protectionism. According to these indicators on the extent of opening up of a domestic market of a country as well as its export markets, it is possible to have a better idea of the optimal trade
-60-
policy of these countries and coherence between past agreements and optimal opening strategy (multilateral, regional, etc.)
A study undertaken by the Femise team[35] has used a new database that offers an assessment of the degree of openness of a country. This was done based on calculations carried out on a bilateral, detailed and disaggrega-ted basis which includes the degree of tariffs dispersions according to the goods, which is done traditionally, but also according to the partners in agree-ment with the type of agreement in force (regional agreement, preferential treat-ment) which is translated into particular
measures (tariff quotas, specific rights, etc.). This process offers a more realistic view of barriers in existing trade, even if each type of barrier has a different impact on the level of exchange which in turn depends on the supply and demand flexibility. It provides an ad valorem evaluation of some of their elements it remains a delicate process.
MPs’ access to markets
The new measure of trade barriers used here indicates that MPs markets are over protected. The richer countries apply a generally lower level of protection. However, a sector by sector examination reveals a totally different reality, namely
Table X15: level of global and sector protection in the MPs
Global Agriculture Industry
SM Countries Algeria 13,8% 17,9% 13,5%
Egypt 29,0% 13,8% 30,3%
Jordan 11,2% 11,8% 11,1%
Lebanon 3,9% 8,8% 3,4%
Libya 21,0% 11,9% 21,8%
Morocco 20,9% 43,9% 19,0%
Syria 16,4% 12,1% 16,8%
Tunisia 20,2% 57,5% 17,1%
Turkey 6,1% 42,0% 3,1%
OECD Countries Australia 5,2% 1,2% 5,5%
Canada 3,5% 15,2% 2,6%
EU 3,5% 17,2% 2,6%
Japan 4,1% 37,4% 1,5%
Switzerland 3,9% 43,7% 1,0%
USA 2,4% 5,1% 2,2%
Emerging Countries Argentina 12,5% 11,5% 12,6%
Brazil 11,8% 10,2% 11,9%
China 14,1% 23,6% 13,3%
India 33,4% 59,2% 30,1%
Pakistan 19,1% 26,9% 18,1%
South Africa 8,5% 19,4% 7,4%
LDC Bangladesh 17,4% 20,0% 17,1%
Cambodgia 12,9% 12,7% 13,0%
Chad 15,8% 21,5% 14,7%
Ethiopia 14,4% 17,0% 13,9%
Lesotho 8,1% 20,7% 6,4%
Madagascar 4,4% 4,8% 4,3%
Source: Femise Study FEM22-36, based on database MacMap-HS6 and author’s calculation
-61-
that in terms of the agricultural markets it was found that the OECD countries’ protection is as strong as that calcu-lated for MPs (table x15). Within the group of developing countries, the level of protection is in general higher and more homogeneous than in the richer countries. There are several exceptions: Madagascar has a free exchange policy and Lesotho has tariff barriers which vary from one sector to another.
A comparison of MPs performance on the global level with that of countries with intermediate revenues[36] underlines the high degree of protection of their
domestic markets, specially in Libya, Morocco, Tunisia and Egypt (figure 9). Turkey is relatively more open than other MPs except for Lebanon. This reflects the influence of EU, through the customs union agreement and pros-pects of joining the economic Union thereby obliging the country to align itself with EU practices. Nevertheless, Turkey’s agricultural sector remains over protected. This differentiated treatment of the industrial and agricultural sector is common in all countries. Only Egypt, Syria and Libya give less protection to agriculture than to industry where cer-tain activities are nascent.
Figure 9: comparison of the protection level in the world, imports
Source: Femise Study FEM22-36
Figure 10: comparison of the protection level in the world, exports
-62-
from Turkey are strongly penalized in exchanges with Egypt as opposed to, for example, petroleum and gas exports of Algeria or Libya which benefit from a quasi free access to all markets). The lessons learnt from this approach are:
√ In general, MPs strongly discriminate against their partners in imports. This is certainly due to existence of trade agreements but mostly to heteroge-neity of tariffs which they impose;
√ Most countries, members of WTO, reserve the right to impose tariffs that significantly exceeded those set by agreements (16.2% higher for Tunisia, 24.8% for Turkey) with the exception of Egypt.
√ MPs exports to EU could develop due to weak imposed tariffs as compared to those practiced in other countries such as the United States and the rest of OECD. This explains their speciali-zation in textile-clothing for example as the EU market is nearby and also one of the richest in the world.
A more refined analysis of protection per type of goods confirms that it is high for certain agricultural products, such as cereals in Japan, meat in Switzerland, etc. as well as products of key sectors in the economy (clothing in Egypt, vehi-cles in Syria). This reflects the weight of lobbies or adoption of policies to develop new activities which should be shielded from global competition until they are ready to confront it.
Furthermore, the data used allows the tracing of the level of bilateral protection that is the degree of access of a country to the market of its partner (table x15). Any interpretation of these figures must be made cautiously[37] because they refer to the type of agreement that a country has with another (Morocco has concluded accords with Libya and Algeria and trade is free between these countries). But also they indicate the composition of the flow of exchange and respective specializations which, the more they are similar to those in partner countries, the more they are driven to lift barriers (for example, garment exports
Table X16: level of bilateral protection, imports, 2001[38]
Source: Femise Study FEM22-36, based on database MacMap-HS6 and author’s calculation
√ Tariffs imposed by MPs on other MPs are among the highest, a matter that is not conducive to South-South inte-gration.
√ High tariffs are imposed on imports of minor importance for the well-being of consumers in the case of Turkey, Tunisia and Morocco but not for the rest of MPs.
Specialization of MPs, as previously mentioned, equally influences the forms of integration in the flows that are con-venient to MPs as well as the burden of tariff protection on their flows. It has been noted that:
√ The degree of diversification of exports depends on a number of factors such as the industrialization process, established open door policy and geographic concentration of the flows of exchanges. The proximity of Maghreb countries to the EU explains the relatively concentrated structure of exports from the Maghreb. There are two consequences: first, Maghreb
countries will be more vulnerable to fluctuations in the European econo-mic cycle; second, concentration of exports, in the absolute, weakens the resilience of their economies.
√ Inclusion of MPs in international mar-kets essentially occurs on the basis of comparative advantages resting on differences of relative productivity or factorial endowments. Geographic proximity to EU explains the intensive exchanges and the characteristics of supply largely determine the compo-sition of exchanges. Exchanges are principally inter-branch[39]. However, a development of an intra- branch trade can be observed.
√ MPs are outstanding in the export of manufactured products with the exception of Algeria, which has regressed while Egypt stagna-tes. Concerning Turkey and Israel, the decline in agro-foods produce has been more than compensated by the good results of consumer goods and equipment, respectively.
Table X17: level of bilateral protection, exports, 2001
Source: Femise Study FEM22-36, based on database MacMap-HS6 and author’s calculation
Nonetheless, since the second part of the 1990s, market shares gained by Morocco and Tunisia suddenly stop-ped, largely because enterprises in the textile sector were paralyzed by the consequences of the end of the multi-fiber agreement and decelera-tion of investments.
√ Except for Algeria, all MPs had a trade deficit, the origin being in their exchanges with EU (except for Egypt), more specifically in manu-factured goods. The offsetting of this deficit the 1980s was driven by the increase in exports and decrease in imports owing to the slow down in European demand and the gains in market share. Turkey, which enjoys a certain status in the customs union with EU since January 1996, saw its imports coming from EU 15 grow rapidly whereas its exports remained very diversified. Hence, the country was able to profit from the opportunity to import new tech-nologies and cheaper products to reactivate its exchanges and reduce its deficit (devaluation of its cur-rency also helped).
√ Based on a gravity model at the sectoral level, an estimation of the effects on the imports and exports of each country relative to the welfare of the considered country have been studied. Also the capitalist inten-sity of their trade and its struc-ture, the presence of a common language or grounds, or common history were also considered. It has been shown that the level of tariff protection affects more significantly MPs imports than their exports and the flexibility of exchange flows to
tariffs is high[40]. This refers to the existence of preferential access of MPs to certain large markets such as those of the EU. Certainly, but this also means that a tariffs dismantling will cause a significant increase in exchanges, greater than that obtai-ned generally in this type of analy-sis which does not take tariffs into account or the fact that MPs can not influence the market price imposed by their trade partners. Beyond this, constraints imposed by the majority of MPs on imports, especially more advanced technologies have had a negative impact on their adjustment capacity thus hampering the upgra-ding of their industry.
√ It appears as well that sharing a common language encourages MP exports and imports, located as they are in the proximity of countries whose colonies they were in the past, whereas having a common bor-der has no impact on the intensity of trade. This illustrates the difficul-ties of South-South integration, even when the size of the importer market plays a significant role. Nonetheless, estimations that were made demons-trate that the effect of lifting tariff barriers of MPs vis-à-vis other MPs would only have a marginal effect on intra-zone exchanges and that other elements should complement South-South trade integration policy in order to help achieve a rapproche-ment with EU.
√ Not forgetting, as noted above, the importance of transportation costs, by reform of different sectors, parti-cularly maritime transport as well as by creation of new infrastructures.
-65-
Evaluation of the advantages of dif-ferent forms of integration
On the basis of these reports, the study tries to determine which type of open policy is the best for MPs. Simulations made according to the MIRAGE model indicate that:
√ A free-exchange South-South agree-ment will benefit Turkey and Tunisia only and very marginally Morocco, which is relatively very protectio-nist towards other MPs. The first will increase its exports, namely TC towards MPs and the second will direct its exports towards MP and EU countries and gain ground thanks to the benefits of competition which will come about on opening up South markets.
√ The same type of agreement signed between the EU and each MP sepa-rately will raise living standards in Turkey, Tunisia, and Morocco but not the rest of the Mediterranean where they would decline. Morocco and Tunisia will consequently benefit from the significant exchanges (res-pectively +54% and +48%) gene-rated by liberalization and the trade in agricultural goods with EU will compensate the fall in exchanges between MPs. The budgetary equili-brium will suffer greatly from the loss of earnings due to abolition of tariffs, but employment, income and invest-ment will progress. This opening up strategy will entail a profound modi-fication of the productive structure. Sectors destined to witness a reduc-tion of activities are milk and meat for Turkey, Morocco, and Tunisia, and TC and agriculture for other MPs.
Others will greatly profit from this growth in exchanges such as TC sec-tors in Turkey, Morocco (more than agricultural products) and Tunisia. However, this strategy does not appear best suited to MPs as a zone, the creation of traffic benefiting some will be compensated by the rerouting of traffic away from others. For example, in the TC sector, creation of traffic with EU affects intra-branch exchanges. The comparative advan-tages of Morocco, Tunisia and Turkey are such that activity is on the rise and net trade balance vis-à-vis EU in this sector is improving. As compe-tition with other MPs in this domain is weak, EU will prefer the products of Morocco, Tunisia, and Turkey and their net trade balance vis-à-vis EU will deteriorate as well as their terms of exchange. This will undermine the global efficiency of this strategy.
√ Finally, multilateral trade liberaliza-tion will profit a priori all MPs but less so Turkey. Adjustment costs, more important than those in the two examples previously envisa-ged, must be taken into account (increased unemployment in sec-tors exposed to foreign competition, future of agriculture, massive real-location of production factors) and this cannot be accomplished by this model. Results are therefore to be handled with care, but this strategy will generate a strong traffic that will mainly boost TC production in Tunisia and Morocco and cereals in other MPs, hence a tangible growth in GDP and wages.
Some will suggest that a regional approach could serve as a springboard
-66-
for a multilateral opening. The advan-tage will be a soft and progressive tran-sition that will facilitate the reallocation of production factors whose mobility is not perfect and this implies adjustment costs. However, such an approach does not always culminate in a multilateral agreement. This is only possible if the latter requires the same adjustments as a regional accord in all other cases, and the country concerned will have to bear the consequences of two transitions.
An analysis of the situation of MPs in terms of structural congruence indica-tes that if for Turkey and other MPs an appropriate means to prepare complete liberalization of exchanges on a multi-lateral basis may be to conclude a free-exchange agreement with the EU, for Morocco the situation is not that clear cut. As for Tunisia, a regional agree-ment with other MPs will be preferable (table x18).
It remains that behind the purely economic aspects, there are equally important political and social effects, a situation which the European cons-truction had largely witnessed itself. It is evident that the current situation, with a North-South orientation, is not satisfactory and that the main factor of re-equilibrium rests on initiatives like Agadir or GAFTA. Therefore, it is interesting to raise the question of steps to be taken to transform these accords into more profound regional integration.
2. European integration, a model for regional initiatives in the South
Regional integration has in the past years become a global objective. Integration takes several forms, from the crea-tion of free-exchange areas, common markets, up to more profound configu-rations such as economic and political unions. Regional integration is supposed to maximize the well being of a nation and reinforce the bargaining power of a region in the international context.
This section of the report examines the capacity of MPs to establish a strong regional integration. As most MPs are also Arab countries, it was not possi-ble to exclude from the analysis the attempts at Arab unions, namely becau-se MPs were among the most active in concluding agreements in the Arab region. The section which is based on a Femise study (FEM22-07) will principally refer to Arab integration and highlight similarities and differences and suggest political recommendations for the Arab region. Seven different aspects of inte-gration will be discussed, that is, com-mercial relations, laws of competition, convergence of public policy in finance and fiscal matters, monetary policy, the agricultural question, social policy and migratory flows.
Trade Relations
It is interesting to see that between 1990 and 2004, the number of enac-
Table X18: indicator of structural congruence
Source: Femise study FEM22-36
Turkey Morocco Tunisia Others MP
South South/Multi. 94,1% 94,5% 96,3% 97,7%
North South/Multi. 98,5% 93,5% 91,5% 98,1%
-67-
ted regional trade agreements (RTAs) increased from 50 to around 230 glo-bally. The mean number of RTAs that a country belongs to is six.
Over the years, several RTAs have been initiated between Arab countries. History of these agreements dates back to 1950, when the Treaty for Joint Defense and Economic Cooperation was formed. As the title suggests, this was a form of cooperation rather than integration. Around the same period, integration attempts were taking place in Europe as well. The European story started with the formation of the European Coal and Steel Community (ECSC) by Germany, France, Britain, and the Benelux coun-tries (Belgium, the Netherlands, and Luxembourg). While European integra-tion was strengthened on both the verti-cal and horizontal axis, Arab integration included more countries yet did not seem to deepen.
Later, other RTAs were formed, inclu-ding the Agreement on Trade Facilitation and Regulating Transit Trade in 1953, which was to exempt Arab-originated products from tariffs as a form of pre-ferential treatment. 1953 also featured the Agreement for Paying the Current Transactions and Movement of Capital in the same year, which constituted only a set of unbinding recommendations and therefore remained idle. These two agreements were followed by the Arab Economic Union Agreement in 1957, the Arab Common Market Agreement in 1964, and the Agreement on Facilitation and Development of Trade in 1983.
However, the contribution of these agreements to regional integration was very modest. This is primarily due to
the vague wording of these agreements, which was often intended to guaran-tee the approval of all parties involved. This makes these agreements weak and unbinding. In addition, RTAs are often characterized as being too ambitious, given the circumstances they have to function under, which in turn infest trade partners with frustration as a result of not attaining the announced goals and objectives. Furthermore, RTAs generally lack a clear vision of the achievements required. Also, these RTAs are frequently intended as political slogans that are not put into action. Integration is also gene-rally selective as soon as controversial issues emerge, especially that partners want to always be winners and are not willing to sacrifice part of their imme-diate benefit for future gains.
Several economic and institutional reasons have hindered the process of integration. From an economic pers-pective, the likeness of production and export composition of countries of the Box : Spotlight on GCC
The Gulf Cooperation Council (GCC) is yet one of the successful examples of sub-regional integration. Formed in 1981, the Council was meant to enhance cooperation among six countries that have congruent political, social, and eco-nomic conditions, namely United Arab Emirates, Bahrain, Saudi Arabia, Oman, Qatar, and Kuwait. The council started out with limited specific objectives, such as the GCC free trade area. Since this aim has been successfully attained, GCC countries have recently considered going a step further and creating a customs union and a GCC common market. In 2001, GCC countries have approved a more comprehensive economic agree-ment which further detailed the new structure of GCC economic integration.
-68-
region under study as well as the lack of congruence between one country’s exports and another country’s imports prevent the deepening of trade relations. In addition, the strategy of import subs-titution prevalent in many countries, coupled with high tariff protection and the large size of the public sector, are further hindrances. Moreover, there is a huge disparity between tariff rates and income among countries of the region, as well as their economic structure (see Figure 11).
In addition to the above-mentioned eco-nomic obstacles, integration of the Arab region faces a number of institutional difficulties. One of the major drawbacks is the absence of an adequate transpor-tation system. It is interesting to know, for example, that while there are two daily flights between Cairo and diffe-rent parts of Germany, there are only
two weekly flights between Cairo and Casablanca, Morocco.
The major institutional handicap, howe-ver, is the lack of appropriate suprana-tional institutions that would govern the whole process of integration. Instead, MPs use an intergovernmental approach, which limits the integration process within the bounds of each government. This lack of institutions has several implications, including the vagueness of rules and regulations controlling trade. In addition, such institutions would have the authority to settle disputes and con-flicts arising between countries, espe-cially that some of the MPs are not mem-bers of the World Trade Organization (WTO), namely Algeria, the Palestinian Authority, and Lebanon. Hence, vio-lations by or against these countries, such as those enacted between Egypt and Lebanon, are resolved bilaterally in
Figure 11: Shares of Economic Sectors to GDP in a Sample of Arab Countries
Source: Femise Study FEM22-07, from World Bank, WDI 2003
-69-
an inefficient way, which often requires political intervention. These conditions ultimately weaken trade ties between these countries and represent further obstruction to regional integration.
The most recent RTA in the Arab region is the Greater Arab Free Trade Area (GAFTA), which is specifically interested in the liberalization of trade in goods. It is planned that through the GAFTA, a customs union will be formed among member countries over a period of ten years, starting in 2006. Analysts see GAFTA as the first true integration agreement. It is believed that GAFTA will outperform its predecessors. To avoid falling into the traps of ineffective-ness, as has always been the case with Arab RTAs, implementation of the GAFTA agreement should build on the lessons learned from successful experiences, such as that of the EU.
The EU has had several advantages and strengths that have supported its regional integration. Firstly, and most importantly, there is a clear vision of the intended goals. For the EU, econo-mic integration is not the end, rather a means to achieving political integration. On the Arab front, however, the goal is often not clear and, as previously men-tioned, is frequently vague and based on emotional drives.
In addition, the EU has moved to a federal approach by creating suprana-tional institutions that were granted the power to oversee the process of integra-tion. Examples of these institutions are the European Parliament, the European Court of Justice, the European Central Bank, and the European Commission. In the Arab region, however, integration is
still based on a governmental approach, mainly due to the fact that political lea-ders fear the loss of their sovereignty and authority.
Moreover, European agreements are mostly clear and specific with attainable goals. The EU has adopted a gradual and pragmatic approach that has enabled a smooth and affordable transformation, moving steadily from a shallow type of integration to a deeper one. Analysts argue, however, that recent develop-ment in international trade and techno-logical advancement would not enable the success and sustainability of a shal-low integration approach.
Going back to the initiation of the EU, two factors helped the integration pro-cess, one of which is the pressure and support of the United States to push forward the process. In addition, the six founding countries of the EU had simi-lar economic conditions. The difference between average non-weighted tariff levels, for example, was around 10% only. On the Arab front, however, as shown above, countries of the region are not homogeneous enough to allow for a smooth integration process.
Competition Laws
To complement and facilitate trade rela-tions, competition laws have been ini-tiated and fine-tuned worldwide. In 2005, over 110 countries have embra-ced national competition laws in order to prohibit anti-competitive behavior and to guarantee a competitive market. However, it has been proven that natio-nal competition laws are not sufficient to oversee competition on the regional level. This argument is believed to be
-70-
true since objectives of different national competition laws may vary and because some countries entering regional inte-gration may not be operating under a national competition law. Introducing a regional competition law necessitates the introduction of a regional competi-tion authority.
With respect to Arab integration, the Arab League Charter of 1945 has not mentio-ned the provision of a competition law. It is not clear whether this was a deliberate decision or whether it has been overloo-ked. It is suggested, however, that the Charter unintentionally overlooked this notion, especially that it was not widely publicized at the time. On the European side, however, competition laws have been initiated in Austria in 1890. Then, the first European competition law was adopted in Germany in 1923, and has been developing ever since. As the GAFTA agreement is believed to allow for more integration, the Arab region is in need for a regional competition law. The EU experience would be a valuable lesson to build on.
One of the main objectives of the European competition law was suppor-ting the creation of a single market. The process of enacting the law for the EU was not effortless. Several obstacles have been overcome. Opposition of big industries was one of these obstacles; these viewed the law as limiting. It has also faced political and intellectual resistance. It was primarily with the persistence and determination of mem-ber states that this law saw the light. It had to change the perceived notion that competition laws are a constraint and plant the idea that it is a constructive social power instead. Initially, European
agreements did not include competition laws, but had the necessary provisions to enact one. These provisions, as pre-viously mentioned, are lacking in the case of the Arab region.
In addition, European bureaucrats were supportive of the competition law, which facilitated the process of its enactment. In the Arab region, however, bureaucrats lack a profound understanding of the importance of a competition law to the process of integration. It is suggested that a model competition law be formu-lated for the Arab region, to serve as a guide for harmonization of national com-petition laws, which could pave the way for the passing of a regional competition law.
Public Finance Convergence
Another aspect that is believed to be significant for deepening regional inte-gration is public finance convergence, as it is argued that discrepancy of member states’ fiscal policy may create political tension and disagreement. Gradual fiscal convergence may guarantee a smooth integration process and may minimize the costs incurred by member states. In addition, removal of barriers and distortions, especially tax coordination, is crucial for regional integration. Public finance convergence is even a pre-requi-site for deeper forms of integration, specifically monetary and fiscal unions. Again, this convergence implies a unified authority, hence a supranational institu-tion.
The EU experience is just as beneficial in the area of public finance convergence. The EU has realized that it is crucial to narrow the gap between richer and
-71-
poorer areas of the Union. Thus, it has adopted budgetary federalism to be able to cope with this challenge; especially that per capita income of the 15 initial members of the EU is between 2.2 and 13 times that of the ten new members. The European Commission has put an action plan spanning the period 2006-2013 to narrow this gap. The plan has been allocated €336.4 billion, divided among three main objectives. The first objective, which is assigned €262 billion, will target underdeveloped areas, which have a GDP of less than 75% of the EU average. The second aim, which has been allotted a sum of €61 billion, will target regions that are undertaking reforms. The third component of the plan, with a budget of €13.4 billion, will enhance trade among EU member sta-tes. This plan was presented in detail to give an idea of how regions tackle their disparities. Such a plan should be adop-ted with some modification to fit the Arab situation.
In the Arab region, similar disparities between countries as well as poverty problems exist. The level of domestic and foreign public debt, for example, is rela-tively high among some Arab countries. It is as high as 100% of GDP for Egypt, 135% for Lebanon, 93% for Jordan, and 81% in the case of Syria. Moreover, the discrepancy of public spending between member states is huge, especially that some countries direct a considerable amount of public spending to military expenditure.
It should be acknowledged, however, that taxes have been featuring a decli-ning trend in Arab countries. In addition, by 2004, customs and duties among Arab countries have been reduced to 20% of
their level in 1997. Many countries have also started revising and restructuring their tax systems. However, reforms are done on a country basis rather than regionally, which may result in widening the disparities.
The problem with fiscal convergence is that states have to be willing to bear some short-term costs in order to reap long-term gains. In addition, coordina-tion is a key issue. Individual reform might be even worse than existing dis-parities.
Monetary Policy
Moving from fiscal convergence, the next step would be harmonizing mone-tary policy. This topic cannot possibly be discussed without shedding light on the unique experience of the EU. It is worth noting that the idea of a unified currency was met with great skepticism. This move required the willingness of political leaders, an effective regional institutio-nal framework, and agreeing that one of the member states would play a leading role in the process. In the case of The EU, Germany was the primary driving force. The Arab version, however, fails to fulfill these three requirements. There are doubts about Arab leaders’ willin-gness to be involved in such deep inte-gration. In The Arab world, integration is merely a political slogan. Hence, it is difficult to have a regional institutional framework in such a hostile environ-ment. And certainly, choosing a leader would be the most difficult and rather impossible task.
Establishing the European Central Bank (ECB) was crucial for the success of this form of integration. It was a supranatio-
-72-
nal institution that possessed credibility, a suitable strategy, technical expertise, as well as the authority to implement its plans. A crucial pre-requisite for the suc-cess of the ECB was its independence. It is argued that independence of central banks implies lower inflation rates and better growth and employment condi-tions. The ECB also sustained transpa-rency; although this is a difficult task, as any events that are unaccounted for and that may affect monetary policy could attack its credibility. The process was accompanied by awareness campaigns to guarantee support of the public.
In the Arab region, most integration attempts relied heavily on trade, which was sometimes followed by labor and capital mobility. However, not much effort has been exerted to identify regio-nal monetary policies.Box: South-South Financial and Monetary Integration (based on Femise study FEM22-39)
MPCs are opting for increased regional eco-nomic integration in the future. An important part of economic integration is the increase in cross border trade. However, given the uns-table monetary, macroeconomic and finan-cial environments in certain parts of the MED region, it is doubtful whether pursued macroeconomic policies will provide the requi-red stability for increasing economic integra-tion on a regional scale.
We still see significant divergence in business cycles and exchange rate polices. The exis-tence of exchange rate overvaluations and misalignments within GAFTA countries is still hindering intraregional trade flows. Therefore, macroeconomic policy divergence within the region appears to be among the main obs-tacles towards achieving further trade and monetary integration. One way to circumvent this problem is perhaps through the adop-tion of a common currency within the MED region.
The exchange rate literature stipulates that the benefits of monetary unification, by adopting a common currency, are in the form of elimi-
nation of the costs associated with exchange rate misalignments and currency conversion. The recent GAFTA agreements do not imme-diately provide for labor mobility within the region and for fiscal cross-border transfers in order to smooth out economic and finan-cial shocks. Further, the various MED central banks do not possess a good track record of maintaining price stability, and a flexible exchange rate, which allows them to pursue their own independent monetary policy. A monetary policy that adopts a common cur-rency or that ties the various MED currencies closely to the euro and not the dollar can turn out to be instrumental in borrowing monetary credibility from the European Central Bank (ECB), and thus, may reduce the MED region inflation and interest rates.
If there is a desire for monetary indepen-dence, then a flexible exchange rate regime is better for MED countries in the presence of structural differences between the different MED countries. However, Lebanon, Egypt, Morocco and Tunisia’s experience with flexible rates has been disappointing, given the high volatility of their real exchange rates and the prolonged misalignment of their respective currencies from its equilibrium value. A weak domestic currency contributes to the low productivity of domestic firms competing in the foreign sector. Since these countries are moving toward greater trade links with each other, greater exchange rate fixity vis-à-vis the Euro might be favored.
The Femise study analysis is based on yearly data for the period 1960-2003, collected from the International Financial Statistics databa-se, and the Arab Monetary Fund to study the status of monetary integration within the MED region and the prospects for the adoption of a common currency.
Cointegration tests were used to study South-South monetary integration to see whether the MPCs set their macro and monetary poli-cies independently, or follow some sort of policy convergence, and can therefore adopt a common currency. The South-South cointe-gration results show that there is no conver-gence in MED monetary or macroeconomic policies in general. The results of the test pointed towards a strong long-run relationship between the GDP growth rates of Jordan Kuwait, Morocco, Saudi Arabia, Syria, Tunisia, UAE, and Lebanon, indicating a strong conver-gence in MED business cycles. While this can perhaps be explained by the fact that greater trade links resulting from GAFTA are gradually
-73-
Agricultural issues
When considering integration of the Arab region, special attention should be paid to the agricultural sector, as it is one of the major sectors of the Arab world. Around 23 million workers are employed in direct agricultural activi-ties in the region. Yet, despite the vast natural resources available in the region, the absence of policies and regulations have led to a large and widening trade gap in that sector. The majority of Arab countries import agricultural products intensively. Over the period 1980-2003, agricultural imports of the Arab region increased from US$19 billion to US$26.2 billion. On the other hand, exports increased from US$3 billion to only US$5.7 billion (Figure 12). With respect to trade among Arab countries, its volu-me amounted to US$5.3 billion, which implies that imports from within the Arab region represents only one fourth of total imports of Arab countries.
On the European side of the world, the number of workers employed in the agri-
leading to similar dynamics of the rates of growth of GDP, these GDP growth rates are highly correlated with oil price fluctuations. This is not only true for the oil producing MED countries, but also true for the remaining non-oil producing MED countries through the significant effects of workers remittances wor-king in oil-MED countries. One can thus safely conclude that the strong convergence in the rate of growth of GDP is not really the result of greater trade integration, but is rather driven by the dynamics of oil prices. The coin-tegration results for nominal exchange rates in Jordan, Egypt, Kuwait, Morocco, Syria, Tunisia, and the UAE points to a rather weak convergence, which is not surprising. It is attributed to the lack of coordination of mone-tary and exchange rate polices, and to the fact that there is a significant degree of hete-rogeneity in MED exchange rates policies: at least 5 of the seven MED countries appear to be setting their exchange rates independent-ly. The result of test for cointegration between the inflation rates of Bahrain, Egypt, Jordan, Saudi Arabia and Syria points to the existence of a very weak convergence of MED monetary policies with respect to inflation. The presen-ces of a convergence in government monetary policies cannot be attributed to more coordi-nation in MED monetary polices, but is rather due the fact that all MPCs have been devoting significant efforts to contain the inflationary pressures of the late 1980s.
The general conclusion drawn is that macroe-conomic and monetary policy coordination is still lacking in the region and more efforts need to be devoted in that respect. One area where genuine efforts should be devoted rela-tes to government Monetary policies. There is a need for more harmonization of exchange rate and interest rate policies. The policies of fixed exchange rates to the USD have led to real exchange rate overvaluations with detrimental impacts on intra-regional trade. Two policy options are available. The optimal monetary policy option is a monetary union between those countries. However, since a monetary union between GAFTA members is a somewhat distant prospect, these countries should perhaps follow the Egyptian Tunisian and Moroccan examples and introduce in the short run more flexibility in their exchange rates. In the long-run these countries can opt for more fixity through a rigid peg or an exchange rate target zone as a preliminary step before the adoption of a common cur-rency. However, this may not be a viable alternative for the majority of the MPCs, given the virtual absence of independent monetary
policies and well-developed capital markets. Another consideration is that underdeveloped monetary, political and policy-making insti-tutions tend to undermine the effectiveness of discretionary monetary policy. For now, some type of fixed arrangement may be the safest option for most of these countries. For the MED countries engaged in a significant amount of trade with the EU, a euro peg may be more appropriate than a dollar peg. In all cases, those countries maintaining fixed exchange rate arrangements must implement crisis-prevention measures, namely by exer-cising fiscal discipline, managing their debts and foreign reserves, and avoiding currency appreciation. As the countries in the MED region improve their monetary and fiscal infrastructures and become more integrated with global capital markets, they should alto-gether adopt a common currency in the long run.
-74-
cultural sector dropped from 19 million in 1970 to only 6.7 in 2002. This drop could be attributed to several factors, including the growth of the industrial and services sectors, representing a pull factor, and the increasing mechanization of agricultural processes. The agricultu-ral sector of both the Arab region and the EU has two specific differences. First, its contribution to GDP is much lower for EU countries. In addition, the structure of agricultural production is quite diffe-rent, represented by, the quality of pro-duction, the level of mechanization, the scale of business, etc. To illustrate the difference, it is interesting to see that the highest level of exports per laborer in the Arab region was reached in the year 2002. Yet it represented only 10% of that of the EU in the same year. While the Arab region is still struggling through the trade liberalization stage, the EU has already proceeded to full integration.
Despite the fact that agriculture accounts on average for only 2% of EU countries, its development and integration have been paid special attention by the EU. The EU has initiated the Common Agricultural
Policy (CAP) with the aim of increasing agricultural productivity, guaranteeing a decent standard of living for the agri-cultural community, stabilizing the mar-ket, ensuring the availability of supplies, and maintaining reasonable prices. As a result of this policy, cereal production, for example, has boomed in Europe since the nineties. The EU has also worked on nar-rowing the trade gap between its imports and exports (Figure 13).
In addition, while the Arab intra-trade is quite limited, as displayed above, the EU depends more on intra-markets than on external ones. Figure 14 portrays the proportion of European intra-trade to total trade. The figures represented here pertain to the EU 15 only, which suggests that the EU enlargement to include 25 states would even increase the proportion of intra-trade.
The weak integration of agriculture has been attributed to several factors. One of the main reasons is importing cheap products from outside the Arab region. Another reason is investments that are directed to large public works projects.
Figure 12: Imports and Exports of Total Agricultural Products in the Arab Region 1980-2003 (US$1000)
Source: Femise study FEM22-07
-75-
These projects often need high main-tenance costs, which leaves countries with little funds to be directed towards developing the agricultural sector and adopting new technologies. A factor that is common among all aspects of integra-tion is the lack of regional agricultural policies.
To combat the weaknesses of the agri-cultural sector, several Arab institu-tions have paid special attention to its development allover the region. One example is the Arab Fund for Economic
and Social Development. From 1974 to 2003, agricultural and rural develop-ment have been allocated an amount of KD886 million, representing around one fifth of the Fund’s total loan com-mitments. The Kuwait Fund for Arab Economic Development has directed KD338 million to agriculture, which represent around 19% of total disburse-ments. The Saudi Fund for Development has also shown interest in the agricul-tural sector, directing around 19% of its disbursements to it, which amount to around SR4.5 billion during the period
Figure 13: EU agricultural imports and exports in million US$ (1980-2003)
Source: Femise study FEM22-07
Figure 14: Total EU trade in Agricultural Products including and Excluding Intra-Trade (1990-2003, million US$)
Source: Femise study FEM22-07
-76-
1974-2003 in 71 projects. Although these efforts have been widely appre-ciated, they still fall short of providing a regional integration scheme and poli-cies, as they do not posses a suprana-tional nature.
Drawing on the lessons learned from the EU experience, there is a strong need for the Arab region to adopt an agri-cultural model that would strengthen the market orientation, increase the productivity of agricultural goods, and coordinate efforts between different member states. Arab countries need to start negotiating as one entity in order to get better terms of trade and to be clearly heard internationally.
Social Policies
It is believed that integration would not be considered successful, unless it truly benefits citizens of each of the member states. Thus, analysts are inclined to assess social policies as a measure of the extent of regional integration and the welfare of citizens.
The Arab region is often characterized by the lack of coordination of social deve-lopment efforts, not only on a regional level but even within each country. Development efforts are often carried out by individual NGOs. The region has witnessed incremental improvements in some of the social indices, such as maternal and infant mortality, life expec-tancy, and literacy rates, which will be discussed in detail thereafter. Yet the Arab Human Development Report has stated that progress has been quite slow and cannot be seen as universal, as many citizens of the region are still deprived of their basic needs.
It is worth noting that the average per capita income PPP of Arab states is US$5,685. This is a relatively high value, when compared to the average of developing countries, which is US$4,359 (2003 values, according to the Human Development Report 2005). Yet this value is in a way misleading, as it is strongly affected by values of the GCC countries, which have per capita inco-mes reaching up to US$22,420 for the United Arab Emirates. Other Arab sta-tes, however, have considerably lower values, such as Sudan (US$1,910) and Yemen (US$889).
Despite apparent income improvements, some basic indices are still lagging behind. The Average literacy rate for the Arab states is 64.1% while the deve-loping countries’ average is 76.5%. The lowest rates of literacy in the region are to be found in Algeria, Egypt, Morocco, Oman, Sudan, Tunisia and Yemen, which also have lower incomes. Yet income is not the only determinant of literacy. This hypothesis is proven through a study comparing Oman and Jordan. While Oman’s per capita income is around triple that of Jordan, literacy rate of the latter is higher than that of the former by around 20%.
In addition, the gender gap is a major characteristic in the Arab world. Literacy rates as well as labor force values prove that fact. Female literacy rates, as a percentage of males, accounts to 71% in the region. In addition, school regis-tration rates for females reach around 83.8%, while the average of developing countries is 87.3%. Moreover, the rate of female economic activity as a percen-tage of rates recorded for males reached 38.9%. The narrowest gap of economic
-77-
activity between males and females is found in Morocco, then Kuwait, Tunisia, and Egypt, while the widest gap is recor-ded in Oman, Iraq, and Saudi Arabia. It should be recognized that, while female participation in the labor force increased by 11.7% in the Arab region between 1985 and 1997, the average increase for developing countries amounted to only 2.3%.
On another note, life expectancy has witnessed substantial improvements since the fifties, where it amounted to 40.5 for males and 42.6 for females. During the period 1990-1995, life expec-tancy reached 62.6 and 65.2 for men and women, respectively. In addition, under five mortality rates (per 1,000 live births) range from 3 to 39, with Lebanon reporting the lowest rate and Yemen the highest. Maternal mortality rates (per 100,000 live births) range between 3 and 550. Total health expenditure as a percent of GDP ranges from 1.5 to 10.1%.
To improve the welfare of citizens, seve-ral Arab countries have established social funds, which act as mediators and deli-ver funds provided by the government as well as by donors to mainly the poor by financing small projects. They work on ensuring job opportunities, impro-ving infrastructure, and offering basic services to the poor. Yet effectiveness of such funds can be hampered by a number of factors. The independence of such funds varies from one nation to the other. While the Jordanian and Lebanese funds, for example, enjoy higher levels of independence, the board of direc-tors of the Egyptian Social Fund is lar-gely composed if government officials, which adds to its bureaucratic nature.
Moreover, monitoring and evaluation of social funds’ activities are someti-mes abandoned with the intention of cutting costs. Furthermore, the tempo-rary nature of these funds is a major challenge to the sustainability of their interventions.
In addition to the national effort exerted in Arab countries, there is a regional effort to improve the welfare of citizens. Just as in the case of agriculture dis-played in the previous section, different institutions, such as the Arab Fund for Economic and Social Development have paid special attention to social develop-ment. The fund has been directing almost 9.3% of its total loan disbursements to social services projects. The Arab Reform Forum is yet another attempt to harmo-nize social policies. The forum has been established on 2004 in the Bibliotheca Alexandrina with the mandate of con-tinuous dialogue between intellectuals. These dialogues are intended to discuss development issues, while particularly focusing on the role of youth and women in development.
Yet social policies in the Arab world are still lagging behind. This may be attri-buted to several hindrances. Political tension in the region has forced govern-ments to direct large amounts of funds to military development, which is to the disadvantage of social development. Thus there is also a problem of unavaila-bility of funds. High population growth rates are also a serious challenge, which also raises the issue of unemployment and the failure in many instances to pro-vide professional training. The inability of coordinating development efforts among governments and different non-govern-mental entities also hampers their effec-
-78-
tiveness; especially that civil society in Arab region has a limited experience. Centralizing decision-making is also an obstacle, especially given high rates of corruption and lack of capacity-building. The crisis management nature of most development efforts lacks sustainability and true welfare improvement.
Moving to the European experience, it is worth noting that the European Social Fund has played only a marginal role in the integration of social policy. On ano-ther front, the European Social Charter of 1961, which was revised and exten-ded in 1996, represents a set of binding undertakings. In addition, to strengthen the role integrated social policy, the European Court if Justice has limited a country’s control over social policy in the sense that it has prohibited the restriction social benefits to a country’s citizens.
One of the challenges that the EU had to deal with was the persistent unem-ployment of the nineties. To deal with such problem, each member state was required to formulate an action plan. Plans of all countries would then be coordinated through the EU’s different bodies. The European Social Fund was to provide support to these initiatives. This is just one problem to demonstrate how the EU has been coordinating social development efforts.
To accelerate the development process, Arab countries need to utilize the availa-ble resources efficiently and coordinate social development efforts. The two main problems of social development, namely youth unemployment and the gender gap, need also to be addressed. To support development efforts, partici-
pation of the civil society must be fur-ther encouraged and enhanced.
Labor Mobility
The shallowest form of integration, namely RTAs, concentrate mainly on the free movement of goods and services. Common markets, as the second stage of integration, allow for the movement of factors of production, hence labour mobility. It is well known that labour mobility is a natural process that accom-panies economic growth. However, it can be enhanced through further integration policies. Hence, in the absence of such policies, which is the case in the Arab region, pull factors are the only determi-nant of labour mobility. Bilateral agree-ments are the only agreements in the Arab region that deal with some aspects of labour mobility, however, not to the extent of its free movement.
Egypt, for example, has signed agree-ments on cooperation on labour issues with nine Arab countries during the period 1974-1990. Morocco has agree-ments with five Arab countries, dating back to the early 1980s, Tunisia with four countries, and the United Arab Emirates with five countries. Despite this number of bilateral agreements, Arab labour force has been facing com-petition from extra-regional labour, especially from Asia. Furthermore, poli-tical tension between Arab countries often resulted in the termination of employment of labourers of other Arab countries. This was not a unique event; it was repeated in several countries with large numbers of workers. In 1985, for example, Libya terminated the working contracts of large numbers of Egyptian and Tunisian migrant workers. Qatar
-79-
deported hundreds of Egyptian workers in 1998. Moreover, the second Gulf war, in 1990-91, resulted in returning around 390 thousand Egyptian workers to their country. Estimates also suggest that GCC countries, as a result of disa-greement on political stance pursued by these countries during that war, depor-ted over a million workers to Jordan, Syria, and Yemen.
The Arab Labour Organisation has adop-ted two charters to regulate labour movement within the Arab region. They indicate that preference should be given to Arab workers, especially Palestinians, after preserving job opportunities for citizens of a member state. However, they do not mention anything about free labour mobility. In addition, this is a non-binding instrument. The latest agree-ment in this respect is the Declaration of Principles on the Facilitation of the Movement of Arab Labor, enacted in February 2005. This declaration men-tions only the facilitation, and not the freeing, of labor movement. This too, is a non-binding agreement.
As previously indicated, in the absence of labour movement policies, economic growth is the only determinant of migra-tion. Within the Arab region, the main pull factors exist in the GCC countries, as they possess a huge potential of growth. Over the period 1975-2002, the population of GCC receiving countries increased by 335%, namely from 9.7 to 32.5 million. However, while the natio-nal population represented 77.4% of total population in 1975, it represented only 61.5% in 2002; implying a growth rate of migrant population of 568%. Yet the non-GCC Arab portion of the migrant population decreased from 72%
in 1975 to 31% in 1996. Specifically in Saudi Arabia, which is the most striking example, the portion moved from 90% to only 30%.
To the contrary, the EU has solid inte-gration policies with respect to labour mobility. Citizens of EU members have the right to reside and be employed in any other member state. One of the major obstacles that faced this form of integration was the divergence of quali-fications. To overcome this challenge, it was agreed that member states would mutually recognize each other’s quali-fications instead of unifying the criteria for education. It is important to realize the difference between the case of the Arab region and that of the EU. While the former did not have a clear vision and determination to reach it, the latter esta-blished precise rules and regulations and delegated the authority of implementing them to supranational institutions to guarantee their timely attainment.
Looking Ahead
The Arab region has a number of advan-tages that are of major value. Countries of the region have a strong common historical, cultural, and religious heri-tage, in addition to being unified throu-gh one language. The latter has been unavailable among EU member states. In addition, the region enjoys a variety and wealth of natural resources. A col-lective population exceeding 270 million in 2003 represents a huge market and a diverse labor force. The region’s location in the heart of the world is also a great asset. Yet the region seems paralyzed as a result of several factors, notably a lack of commitment for integration on the part of the member states.
-80-
some of the pressure off the domestic employment market, brings in far more foreign currency overall than is received in official aid, and enhances skills.
With unemployment on the rise in the Mediterranean Partners’ (MPs) econo-mies, migration forms a window of opportunity to absorb part of excess labor. On the other hand, concerns over social cohesion issues and illegal migra-tion in Europe have prevented accepting migration as a compensation for the slow growth of the labor force.
Demographic Contrasts of Labor Market Trends within the Mediterranean Basin
The demographic situation in the Mediterranean Basin varies considera-bly. The population in the EU is aging; total births (7.3 million per year) do not compensate for the deaths (8.1 million per year) (Femise, 2003). Moreover, the average population growth rate for the EU was 0.3% in the period of 1990-2003 while it was 2.4% for the southern countries, and estimates show that it will decline to 0% and 1.7% in the period of 2003-2015 for Europe and MPs respecti-vely (World Bank, 2005).
Northern countries have a relatively older population; those of the South, a fairly young population. Children under the age 15 account for between 35 and 40 per cent of the population of southern countries (Femise, 2003). Hence, the proportion of the population of wor-king age will grow more quickly than total population. Additional demand for employment will hence increase, as will the migratory potential. As a result, employment outside the domestic eco-
The discussion of the different aspects of integration and lessons learned from the European experience has shown a com-mon set of actions needed to actually reach proper integration. First, countries of the region need to have a clear vision of what they really want to achieve. There is also a strong need for political leaders to have the will and the commit-ment for integration; the lack thereof is a major hindrance. Countries also need to coordinate their efforts in different fields in order to form a homogeneous region rather than being scattered and sometimes even contradicting. Yet the most important measure that truly needs instant action is forming supranational institutions capable of monitoring and overseeing progress made in different countries towards integration. Without these institutions, Arab countries will not be able to seriously coordinate their efforts and guarantee implementation of the agreed objectives. A pre-requisite for the formation of such institutions is the political authorities’ readiness to be evaluated by regional institutions.
3. Migrations in the Mediterranean: the road for Deeper integration
Migration within the Mediterranean basin is a long-established phenomenon with deep historical and socio-political implications. Recently, this issue has become a much complex and contesta-ble subject.
The influence of migration on global development is considerable: conside-rable for the EU because it fills gaps in the employment market and increases the size of the workforce and thus the number of taxpayers; positive for the developing countries because it takes
-81-
nomy has become a structural feature in many countries of the region.
Moreover, the Southern Mediterranean population and the entrants to the labor markets will continue to grow at least till 2015, because the population structure is marked by the predominance of youth (FEMISE, 2003). Also, the average unem-ployment rate for the EU is 6.7% (ILO, 2004a) while it is about 16.0% for the South Med countries (World Bank, 2005).
Meanwhile, the European Union coun-tries, faced with aging populations, are reluctant toward recognizing the need for managed and legal immigration pro-grams to cover their labor requirements in the future.
Migration Magnitude: Half of the MPs’ migrants are bound to Europe
South Med countries now form a major region of emigration. There are 2 main streams of emigration in the MPs, one bound for the Gulf Cooperation Council countries (GCC) and the other is bound for European countries. With a number of first-generation emigrants ranging between 10 and 15 million according to whether migrants are counted by destination of countries of origin, First
generation emigrants from the ten South Med countries appear to represent some 4.8% of their aggregated population which amounted to 260 million in 2005. (Fargue, 2005).
Migration flows to the GCC countries
This stream is directed towards the oil-rich countries of Bahrain, Kuwait, Oman, Qatar, Saudi Arabia and the United Arab Emirates. These countries now have massive stocks of foreign labor, but immigration into them related to deve-lopment of oil resources back to 1972 where about 800.000 migrant workers were settled in the GCC. With the oil pri-ces increases which followed, the entire region rapidly became dependent upon foreign labor, and by 1975 the foreign population in the GCC states could have been as much as 3.8 million people, or 40% of total population
Nowadays, expatriate workers represent almost three quarters of the labor force (Fasano, and, Rishi, 2004). A wide dif-ference in the expatriate workers distri-bution among the GCC countries exists, for while they represent almost 90 per cent in the labor force of the UAE, they account for up to 50 per cent in Saudi Arabia (table X19).
Table X19: Percentage of nationals and expatriates in the labour force of GCC coun-tries, 1995-2001 (000 Person)
1995 * 2002**
Total (‘000s)
% Nationals
% Non-nationals
Total (‘000s)
% Nationals
% Non-nationals
UAE 955,1 11,6 88,4 2 269,0 10,2 89,8
Bahrain 226,5 40,0 60,0 308,3 40,1 59,0
KSA 6 450,0 36,5 63,5 6 089,8*** 49,7 50,3
Oman 670,3 35,8 64,2 731,5 21,7 78,2
Qatar 218,0 17,9 82,1 322,9 14,2 85,7
Kuwait 1 051,5 16,6 83,4 1 320,2 19,6 80,4
Total 9 571,4 26,4 73,6 11 041,7 26,0 74,0
Sources : * Maurice Girgis, Les nationaux et les ouvriers migrants dans le GCC : Coping with Change, 2000 ; ** GCC, STATISTICAL BULLETIN, volume 12, 2003; http : // www.gcc-sg.org/gccstatvo112/gens-tat/g4.htm; *** Annuaire d’OIT de Statistique du Travail 2002
-82-
As of mid 1980s to mid 1990s the GCC witnessed a substitution of Asian workers for the existing Arab workers and the share of Arabs declined from 75% of the foreign workers in 1975 to 28% by 2000 in favor of the Asian workers (Girgis, 2002). One reason for the decline is the trend towards the nationalization of the labor markets. As the unemployment among the GCC nationals increased, their governments took measures which entailed adopting regulations limiting the size of foreign labor in favor of the national work force such as:
√ Job reservation where some profes-sions are reserved only for nationals.
√ Subsidizing enterprises to increase the percentage of employed natio-nals.
√ Increasing the cost f foreign labor through taxation.
√ Relying on mandatory measures. These include quantitative tar-gets or quotas on the proportion of nationals employed by private companies in specific professions or sectors.
√ Attempting to equalize the percei-ved attractiveness of public and private employment by extending retirement benefits and social allowances to all nationals inde-pendently of the sector that they work for.
√ Attempting to reduce the wage and productivity differential between the public and private sectors.
Figure 15: MENA Migrants in the EU, by country of residence
Sources: Fargue, 2005, based on calculations from:Algeria: 1998 population census; Armenia: 2001 population census; Australia: 2001 Population Census; Austria :Population census, 2001; Belgium: Office des étrangers, 2005; Canada : 2001, Statistics Canada; Cyprus: Census of Population, 2002; Czech Republic: Ministry of the Interior, 2002; Denmark: Statistics Denmark, 2003; Estonia: Population census, 2000; Finland: Statistics Finland, 2003; France: Recensement de la population, INSEE, 1999; Germany: Central Register on Foreigners, 2002; Greece: Population Census, 2001; Hungary: Population Census, 2001; Iceland: Statistics Iceland, 2003; Iran: Statistical Centre of Iran, 2003; Ireland: nd; Israel: Central Bureau of Statistics, mid-2003; Italy: Residence permits 31.08.2004; Japan: Japan Statistics Bureau, 2000; Jordan: Population and Housing Census 1994; Latvia: Population and Housing Census, 2000; Lithuania: Population and Housing Census 2001; Luxembourg: RP2001; Malta: nd; Morocco: Direction Gén. Sûreté Générale, 2002; Netherlands: Netherlands statistics, 2004; New Zealand: Population census, 2001; Norway: Statistics Norway, 2005; Palestinian Territory: Israel, Central Bureau of Stat, end 2004; Poland: nd; Portugal: 2003; Romania: Census of Population, 2002; Slovakia: nd; Slovenia: Population Census, 2000; South Africa: Statistics South Africa,2003; Spain: Residence permits 31.12.2003; Sweden: Statistics Sweden, 2003; Switzerland: Office fédéral de l’immigration, 2003; Tunisia : Recensement de la Population 2004; Turkey: Population Census of 2000; United Kingdom: 2001 Census; United States: 2000, U.S. Census Bureau, Census.
-83-
In light of the rising oil prices and the resulting revenues that are expected to even exceed those of the 1970s and 1980s; fiscal balances and external cur-rent account balances are greatly impro-ving creating a strong domestic demand. The regional current surplus is projected to reach 23.5% of GDP in 2006 (IMF, 2005).
This cash gift is an opportunity for the oil-surplus GCC countries to accelerate reforms that would generate employ-ment for the rapidly growing working age population as well as increase demand for foreign labor.
The flow towards Europe
Between 5.0 and 6.4 million Med-MENA first-generation migrants reside in Europe (unrecorded migrants not included). This number does not include ‘second-gene-ration’ migrants. In general it is esti-mated that there are about 10.6 million
second and first generation migrants (Fargue, 2005).
Statistics provided by the EU mem-ber states report the presence of an aggregated 5.8 million migrants of Med-MENA origin. Two traditional countries of destination, Germany and France, together host almost three-quarters of this number, the remaining quar-ter being distributed among the other twenty-three EU member states (Figure 15). Among the three countries ranking next—the Netherlands, Spain and Italy—the last two act as a new magnet for South-Mediterranean migrant workers. The main countries of origin are: the Palestinian Territories, Turkey, Morocco and Egypt.
Figure 16 indicates the existence of specific patterns of destination among different countries of origin. Migrants from the Maghreb and Turkey are pre-dominantly destined for Europe, while
Figure 16: Distribution of Migrants originating from 7 Med Countries by Region of Destination According to origin countries data
Notes: Israel, Jordan and Syria do not provide statistics of their nationals abroad by country of residence and are not included Source: Fargue, 2005, based on calculations from:1/ Conseil National Économique et Social (1997), Commission de la Communauté Algérienne à l’Étranger «Situation de la communauté algérienne à l’étranger» étude préliminaire; 2/ CAPMAS (2001); 3/ Choghig Kasparian, L’entrée des jeunes libanais dans la vie active et l émigration depuis 1975, Université Saint Joseph de Beyrouth, 2003; 4/ Ministère des Affaires étrangères et de la Coopération, Maroc, 2004; 5/ Palestinian Central Bureau of Statistics, Statistical Abstract of Palestine, No4. Ramallah, 2003; 6/ Ministère des Affaires Etrangères, Tunis, 2005; 7/ General Directorate of Services for the Workers Abroad, Attached to the Ministry of Labour and Social Security (2002).
-84-
those from Eastern Arab Mediterranean countries are instead destined for the GCC countries and other regions of the world.
Remittances play a central role in the monetary stability of many developing countries and are crucial to the survival of poor households. For these last two decades or more, migrants’ remittan-ces to North Africa have constituted the highest ratio to GDP of any region in the world: in 2002, they were 3,1% of GDP, compared with 1,6% for Latin America and 0,6% for sub-Saharan Africa – the latter, the lowest ratio in the world (Gallina, 2004).
Since Barcelona Declaration, and the launch of the partnership agreement, the flows of remittances became an impor-tant source of income to the MPs (Table X20), as it represents over 35 percent of the value of exports in Morocco and Egypt, and more than 50 percent of the value of exports for Jordan.
It appears that remittances are more important to the region than aid flows. As development aid from the EU -under the MEDA program launched with the Barcelona Process- in 8 of the 12 Mediterranean countries is less than 1 billion USD per year, in addition to ano-ther billion as loans from the European Bank of Investments. This aid, about 9
USD per capita, is expected to provide a boot to the modernization of the eco-nomies of the Southern Mediterranean, and encouraging them to compete in a completely free market with the EU partners by 2010. Remittances instead are not only larger and more stable, but contribute directly to the welfare of low income households located in both rural and urban areas (Gallina, 2004).
The challenge of integration: the case of Turkish migration to the EU
One of the major debates that accompa-ny the Turkish membership to the EU is its effect on labour migration. Between the opponent’s view that this could open the door to an unrestricted migration coming from a country with 72 million people, and the supporter’s view that sees that the young labour force migra-ting from Turkey can offset the effects of the rapidly ageing population in Europe, the complexity of the issue remains and the negotiations with the EU still stand a long way.
The official number of Turkish migrants in the EU is hard to find, the rough figure estimates them at around 4 million between migrants and refugees. 93% of those are concentrated in only four EU countries: Germany alone hosts about 70% of the Turks migrants; the remai-ning share is distributed between the
Source: Global Development Finance 2005: Mobilizing Finance and Managing Vulnerability**Calculations from World Development report 2006 and Global Development Finance 2005
2004**
1996 2000 2004* % of GDP % of exports
Egypt 3,1 2,9 3,0 4,0 39,0
Jordan 1,7 1,8 2,2 19,7 56,4
Morocco 2,2 2,2 3,6 7,2 37,1
Turkey 3,5 4,6 0,7 0,2 1,1
-85-
Netherlands (9%), France (8.7%), and Austria (4.4%). More than half of those migrants have joined those countries’ labour force and have contributed with a share of 0.7% of these countries’ GDP.
In addition to their large number in Europe, Turks constitute an economic power that is still underestimated on the national and international levels. According to a Turkish Research center, the amount of Turkish investment in the EU has increased by more than 50% in the past 7 years with a growing number of Turkish entrepreneurs (more than 6% of Turkish work force are entrepre-neurs).
The number of Turkish migrants to Germany is on the rise. The OECD esti-mates the Turkish citizens to be about 1.9 million (where 46% of those are women). More than 832,000 Turkish are working in this country (70% of Turkish migrants labour force is located in Germany) and contributing 2% to the country’s total GDP. However the Turkish residents are still facing difficul-ties integrating into the German society. Provoked by the former policy to treat Turks as ‘guests’, they have been isola-ted (especially women that belong to the most disadvantage group). Most of them
do not carry German passports and some do not even speak the language. The policy of rejecting integration was an impulse to the formation and deve-lopment of fundamentalist groups within the Turkish community.
A new Immigration law was introduced in January 2005 that calls to streamline immigration procedures, improve the integration of immigrants and ease entry for skilled workers in certain sectors. Despite the fact that this law is consi-dered a first step to integrate the Turks into the German society, it fails to abo-lish the temporary status of thousands of refugees, and doesn’t fully address integration and naturalization issues. Some suggests that there is a need to first integrate the existent residents into the society before admitting more migrants to avoid the risk of creating parallel societies.
The EU, and specially Germany, main fears are that by formalizing migration there is a risk of increasing the already existent unemployment problem in some European countries and that the type of skills of migrants does not match the need of their labor force. This justifies the high rates of unemployment (way above the countries’ averages) among
Table X21: Participation rate *in selected OECD countries. 2002-2003 average
Austria Belgium Switzerland Germany Denmark France Netherlands Sweden UK
of which Turkish 64,7 39,8 74,9 58,9 46,9 55,8 57,6 47,4 51,3
Women 41,6 22,3 61,7 40,4 - 30,4 45,1 - 24,8
Men 83,5 60,5 83,4 74,8 51,6 78,6 69,7 70,8 76,9
Note: The sign “-” indicates that the estimate is not statistically significant. *The participation rate refers to person aged 15 to 64 years who are in the labour force divided by the working age population.Source: OECD calculation based on The European Commission labour survey, 2005
-86-
Turkish migrants in some EU coun-tries, especially France and Belgium. On another front, some European coun-tries such as Ireland, Spain and the United Kingdom are admitting increasing numbers of immigrant workers because migrants bring skills unavailable locally and fill the large number of jobs in agri-culture, health, and services that natives are unwilling or unavailable to take.
On the other hand, some suggests that a slowdown (or suspension) in the Turkey’s accession process may have a substan-tial negative impact on the migration issue. From an economic point of view, slowing the process leads to low growth and increase in unemployment in Turkey. This might also slow or suspend the poli-tical and economic reform that has been ongoing in Turkey. This would increase the general feeling of insecurity and hence the number of potential migrants (legal or illegal) will increase.
Under the currently strict regimes, net migration from Turkey to the EU accounts for a minimum of 35,000 persons a year. It is expected that these trends will accelerate in the future if no regulations are set to formalize migration.
In a study to estimate the eventual immigration from Turkey to the EU when
Turkey becomes a full member, scena-rios are withdrawn for the period 2004 to 2030 based on the experiences of various groups. These scenarios estima-ted a net migration from Turkey to EU-15 until 2030 between 0.5 and 4.4 million, assuming free mobility of labor in about 10 years from now (figures that are way less than those estimated in case mem-bership in the EU is suspended)
Opening up of Turkey and its possi-ble accession to the EU represents a big challenge; however the undergoing development and the increasing integra-tion of Turkey into the world economy will diminish the role of migration. In the past few years, the Turkish govern-ment has started to take serious steps towards formulating and implementing the necessary EU migration policies. However it is clear that the quicker the debate begins, the more the political and economic expectations focusing on the growth of the Turkish economy will rein-force this tendency. The future challenge would be on how to integrate the Turkish immigrants already in Europe rather than focusing on the new migrants to the EU. It is even expected that some Turkish migrants would be willing to return back to their home country after the integration (following the examples of Greece, Spain and Portugal).
Table X22: Unemployment rate* in selected OECD countries. 2002-2003 average
Note: The sign “-” indicates that the estimate is not statistically significant. * The unemployment rate refers to persons aged 15 to 64 years who are in unemployed divided by the labour force.Source: OECD calculation based on The European Commission labour survey, 2005
Austria Belgium Switzerland Germany Denmark France Netherlands Sweden UK
Towards a Fair Euro Mediterranean Migration approach: Challenges and Opportunities
In the Barcelona Summit of November 2005, although the Summit chairman’s statement called for the “creation an area of mutual cooperation on migration, social integration, justice, and security and strengthening the management of regular migratory flows in a comprehen-sive manner beneficial to the peoples of both shores of the Mediterranean”. It appears that the negotiations in this field tend to focus mainly on the European concerns regarding the sub-ject of migration.
During negotiations the heads of states of the EU have put considerable empha-sis on the issues of combating illegal migration, regulating migration flows and social cohesion. This is reflected in the Summit’s final declaration which stipulated that the Euro Mediterranean partners will develop mechanisms for cooperation in the fight of illegal migra-tion including readmission agreements, combating human trafficking and capa-city building in border management.
In an attempt to draw guiding principles for a migration policy, the Barcelona Summit’s Five Year Work Programme acknowledged that “Migration, Social Integration, Justice and Security are issues of common interest in the Partnership, and should be addressed through a comprehensive and inte-grated approach”, and that the Euro-Mediterranean partnership will enhance co-operation in these fields to:
√ Promote legal migration opportuni-ties, work towards the facilitation of
the legal movement of individuals, recognizing that these constitute an opportunity for economic growth and a mean of improving links between countries, fair treatment and integra-tion policies for legal migrants, and facilitate the flow of remittance trans-fers and address ‘brain drain’;
√ Reduce significantly the level of illegal migration, trafficking in human beings and loss of life through hazardous sea and border crossings;
√ Continue to pursue the modernization and efficiency of the administration of justice and facilitate access to justice by citizens;
√ Reinforce judicial co-operation, inclu-ding on cross border issues.
In order to be able to reach a fair migra-tion policy, certain challenges need to be addressed. The new policy must answer the concerns of the EU regarding how to deal with combating illegal migrants (on bilateral basis and under the European Neighborhood Policy), social cohesion and integration of second generation migrants. But also, it has to take into consideration the windows of opportuni-ty for the MPs represented in demogra-phic gap in the EU, and the agreement and mode 4 of supply of services under GATS.
√ Firstly, it is noticed that “clan-destine” migration in the Mediterranean region has increased dramatically in the last decade, although European regula-tions and cross-border rules have been strengthened. Also, another new phe-nomenon which appears in the region is the transit migration, as most of the
-88-
Such non-governmental partners are important in two ways. First and fore-most, they function as direct partners in the implementation of policies. But they are perhaps even more important as political actors. They may influence the political climate and political outco-mes, and may be important agents in combating exclusion, discrimination, and xenophobia. (Penninx, 2004).
√ On another front, as highlighted before by FEMISE, the MPs can benefit from the window of opportunity which the contrast of demographic structures of European countries compared to MPs offer. For while Europe is ageing rapidly, the MPs enjoy population predominant by youth. If the labor force participa-tion rates remain constant in the EU, an ever-increasing share of the population will be inactive as a result of old age which will negatively affect the long term economic growth.
In order to determine the potential immigration needs of the current EU countries, the ILO performed a combi-ned demographic and economic analysis to assess how ageing would reduce the standard of living (as measured by per capita GDP).
For the purpose of the exercise the GDP per capita and hence the average per capita consumption level is targeted to increase in real terms by about 3 per-cent per annum. The analysis using a simulation model predicts a substantial labor shortage of about 38 million wor-kers by 2050, assuming a rise in labor productivity of 2.5 %. If productivity only increases by 2 % a year, the shor-tage grows to 88 million workers. The effect on the “gap between the targe-
Maghreb countries have turned into transit countries for migrants from Sub-Saharan Africa and Middle East to pass to European countries. Estimates show that annually about 100,000 to 120,000 cross the Mediterranean illegally, among those about 35,000 are from sub Saharan Africa (Baldwin, 2005). In 2003 9800 illegal migrant have been caught in Morocco alone, among them 6600 were from sub Saharan Africa.
The EU is intent on using the European Neighborhood and Partnership Instruments to intensify its cooperation with Mediterranean third countries on migration management. This coopera-tion will be country-specific or “differen-tiated”, in the European-Neighborhood-Policy manner of speaking.
√ Secondly, there is a very strong need for comprehensive migrants’ inte-gration policies. Primarily, migration policies have been primarily defensive and control-centered instead of proac-tive. Similarly, integration policies for immigrants have been reactive. In many cases, poor integration policy has contri-buted to negative perceptions of immi-grants, which in turn has led to the reinforcement of defensive immigration policies.
Here, numerous non-governmental actors can strongly influence the migrant’s inte-gration process. These vital institutional actors include churches, trade unions, employers’ organizations, political par-ties, the media, and other civil society actors. Government policies that aim at steering processes of settlement and integration should actively involve not only immigrants themselves, but also those important players in civil society.
ted standard of living and the one that is possible” would be substantial. Per capita GDP would be only 78% of the expected level by 2050 (ILO, 2004b).
√ Another opportunity that needs to be exploited by the MPs is the supply of services by a natural person under GATS mode 4. However, even by the modest standards of services liberali-zation, little was done on liberalizing the temporary movement of service suppliers and most countries made only limited commitments on mode 4. The EU tends to strict the Mode 4 liberalization to highly qualified workers only, as well as planning the management of Mode 4 immigration by Economic Needs Tests or quotas to avoid labor market shocks.
In the short term, the MPs need to analyze more thoroughly the full impli-cations of GATS Mode 4 and how they can benefit from it by orienting the negotiation towards the deepening of liberalization in this area in a way that gives the MPs access to the European labor market.
Hence, the new migration policy needs to be designed in such a way as to promote and encourage regulated non-permanent flows. This form of migration is dynamic, more equitable and insures continuous flows. Moreover, this non-permanent migration will ensure the fulfillment of the labor requirements of the European countries without causing social problems. In addition, if migration is conceived on a temporary basis, it can be designed in such a way as to enhance migrants’ skills thanks to the profes-sional experience they acquire abroad; migration could thus become part of a strategy for enhancing human capital in
-89-
countries of origin; in other words, tur-ning “brain drain” to “brain gain”.
Conclusion :
The cross-border movement of peo-ple is a substantial and widespread phe¬nomenon involving more than 10 million people a year over the past decade, as well as a growing number of countries (ILO, 2004c). However, a major gap in the current institutional structure is the absence of a multilateral framework for governing this matter.
From the World Commission on Social Dimension of Globalization’s perspec-tive, the lack of a multilateral framework on migration is a clear illustration of the imbalance in the current rules of the game. While the rights of foreign investment have been in¬creasingly strengthened in the rules set for the global economy, those of migrant wor-kers have received far less attention. Thus, a multilateral regime for the cross-border movement of people that makes the process more orderly and eliminates the exploitation of migrants could offer considerable gains to all.
Through the protracted process of ser-vices negotiations in the WTO (Doha, Cancun, Hong Kong), the GATS «Mode 4» provisions remain weak, very limited and restricted to the temporary move-ment of service providers and so covers only a tiny fraction of the cross-border movement of labor.
Much can be done to improve significant-ly upon the current situation. The issue of developing a multilateral framework to govern international migration should now be placed firmly on the international
-90-
agenda. The objectives of such a fra-mework should be (ILO, 2004c):
√ To facilitate mutually beneficial ways of increasing migration opportunities and ensure that the process is fair to both sending and receiving countries;
√ To make the process orderly, predic-table and legal;
√ To eliminate trafficking and other cur-rent abuses where women are espe-cially vulnerable;
√ To ensure full protection for the rights of migrant workers and facilitate their local integration;
√ To maximize the developmental bene-fits of international migration.
-91-
Notes
[1]: Informality is referred to enter-prises that do not respect legal procedures for the creation and exploitation of society, namely registration, license, social secu-rity, taxation, etc... Data esta-blished by Egyptian Labour Market survey (ELMS), 1998.
[2]: Source: Egyptian Labour Market survey (ELMS), 1998.
[3]: Formality is defined by three major characteristics: (i) being registered; (ii) possessing a license and (iii) holding recurrent accountancy.
[4]: The index is calculated as such:
where fai = value of factor i on the date of survey and fbi = value of factor i a year later.
[5]: This index was calculated accor-ding to values of each of these variables with: value (1) given to each expected growing variable. (0) for variables that should be sta-ble and (-1) for those that should decrease. The score for each enter-prise is standardized to belong to the interval [-100%; 100%].
[6]: It should be noted that Egypt witnessed a recession in 2003 and 2004, which affected the per-ception of enterprises.
[7]: Study FEM22-22, conducted by CEFI.
[8]: An enterprise here is considered as one turning towards export if at least 10% of its turnover is destined to the external market.
[9]: Analysis according to data col-lected on the occasion of annual surveys with public and private enterprises with more than 10 workers by the Turkish national statistics institute (level of sectors with four figure international clas-sification of industrial types).
[10]: Cf. FEM22-22, Cefi op. cit.. Firms that entered or exited during the period are obliterated.
[11]: Either imports/ (imports + pro-duction or turnover).
[12]: Study FEM22-20 conducted by ROSES.
[13]: Cf. Marc Lautier, Care and Cepii, study FEM22-34, conducted by Cepii. This section utilizes in cer-tain parts a summarized contribu-tion from Femise study written by Marc Lautier.
[14]: FEM22-22, Cefi, op. cit.[15]: Flexibility of employment growth
to real industrial added value. Also, for Morocco, an increase of 1 point of industrial added value created 1.13 employment between 1995 and 2001.
[16]: FEM22-34, Cepii, op. cit.[17]: FEM22-22, Cefi, op. cit.[18]: Commission of European
Communities. European Commission (2003). Economic and Competitiveness of the European Textile and Clothing sector in support of the Communication: the Future of the textiles and Clothing sector in an enlarged Europe. Commission Staff Working Paper, SEC(2003) 1345, Brussels, Belgium:3-4.
[19]: 99 among the first 500 industrial enterprises in Turkey, 16 among the first 50 of all mixed sectors in Morocco, 7 among the first 100 in Tunisia. Among 330 largest enter-prises of the sector at the global level, 13 are Turkish, 1 Israeli, 2 Egyptian and 1 Syria.
[20]: Figures of Association Marocain des Industries du Textile Habillement (AMITH).
[21]: Nordås, H. K.. The Global Textile and Clothing Industry post the Agreement on Textiles and Clothing.Discussion Paper n. 5, World Trade Organization, Geneva, Switzerland, 2004: 16.
[22]: Figures concerning Tunisia are much more difficult to find and are often not published.
[23]: Figures of the Haut Commissariat au Plan, economic notes.
[24]: Represents 1690 firms including 997 that registered foreign parti-cipation and 623 are totally held by foreigners.
[25]: This explains the advantage of NPI that succeeded in setting up the network. These countries
∑=
×−=
4
1
10041
1i bi
biai
fff
Index
-92-
have a piercing effect on the glo-bal clothing market by leaning on wage differential. Success of their clothing exports and utiliza-tion of imported fabrics expanded the emergence of local textile industry. The latter succeeded in manufacturing fabric in response to demands of local ready-made garment makers, after being subs-tituted to imports, these fabrics were exported. The “setting up of the network” (Cepii, 1978), was prolonged until the synthetic fiber industry was in turn an exporter.
[26]: Study FEM22-06, conducted by Federicco Cafe Center, Roskilde University
[27]: Study FEM22-02, conducted by Bilkent University.
[28]: Complete illustration of the metho-dology and results in FEM22-02 study, Bilkent Univ,. op. cit.
[29] : Study FEM22-36, conducted by Catt, EMMA network.
[30]: FEM22-36, Catt, op. cit.[31]: Estimation obtained from a revol-
ving model. The cost of transport is measured according to compi-lation of three indexes on com-munications, transport by train and by road.
[32]: According to the quality of roads, existence of deserts separating MCs are considered here, and development in opening borders between Morocco and Algeria.
02, Bilkent Univ. op. cit.[35]: According to FEM22-36, Catt, op. cit.[36]: Except India.[37] : They reflect not only accorded
preferences and degree of inte-gration of one country with ano-ther but equally the composition of their exchange flows. For example the case of Uruguay. This country mainly exports meat and its by-products. Preferential conditions were accorded to it by EU but also to Japan and AELE countries. But access to these countries’ mar-kets will not improve for Uruguay as long as it imposes high tariffs on these products.
[38]: The table is read as follows: glo-bally Jordan imposes an average of the right of 18.8% on products coming from Algeria.
[39]: The branch is defined as the group of fragmented enterprises manufacturing the same product; the sector regroups the enter-prises according to their princi-pal activity. Intra-branch (inter-branches) exchanges, exchange products coming from the same industrial branch (from different industrial branches).
[40]: Results will certainly be more con-trasted if employed tariffs here were not derived from TRAINS but from that developed by CEPII.
-93-
University of Essex (United Kingdom),
Migration Department, ILO and World
Bank, November 2005
Contributors: Lonba Abdelatif, Ben Ali Edriss,
Bahaa Ali El Dean, Ibrahim Awad, Heba
El-Laithy, Ahmed F. Ghoneim, Amer S.
Jabarin, Hanaa Kheir-El-Din, Alastair
McAuley, Sahar Nasr, Abdallah Shehata
FEM22-20: “Flexibilité du travail et concurren-
ce sur le marché des biens et services :
impact sur les conditions de travail et
le développement du secteur informel
en Algérie, au Maroc et en Tunisie”,
conducted by le ROSES, université de
Paris I, coord. Gérard Duchêne, Boris
Najman, in collaboration with CREAD
(Algeria), CREQ (Morocco) et ISTIS
(Tunisia); November 2005
Contributors: Fatima Boubekeur, Mohamed
Bougroum, Gérard Duchêne, Alexandra
Froment, Annie Garnero, Nasreddine
Hammouda, Aomar Ibourk, Boris
Najman, Hosni Nemsia
FEM22-22: “Identification des effets sur la
croissance et l’emploi des mécanis-
mes d’ajustement micro-éconbomique
de l’offre face à l’ouverture”, conducted
by CEFI, université de la Méditerranée,
coord. Patricia Augier, Michael Gasiorek,
in collaboration with INSEA (Morocco),
University of Sussex (United Kingdom);
September 2005
Contributors: Lahcen Achy, Patricia Augier,
Amine Basri, Novella Bottini, Marion
Dovis, Michael Gasiorek, A. Hassani,
A. Irali, Thomas Lagoarde-Segot, N.
Mounir, Teoman Pamukçu, Charles Lai-
Tong, Sandra Palméro, Nathalie Roux
FEM22-34: “Les perspectives de changement
sectoriel dans les pays méditerranéens:
quels secteurs de croissance après l’in-
dustrie légère?”, conducted by CEPII,
coord. Agnes Chevalier, Jean-Raphael
Chaponnière and Marc Lautier, in colla-
boration with CARE-Université de Rouen
Bibliography
List of the main Femise studies used for wri-
ting this report and of their main con-
tributors:
FEM22-02: “Impact of Liberalization of Trade in
Services: Banking, Telecommunications
and Maritime Transport in Egypt,
Morocco, Tunisia and Turkey”, conduc-
ted by Bilkent University, Center for
International Economics, coord. Sübidey
Togan in collaboration with Faculty of
Economics and Political Science, Cairo
University. (Egypt), INSEA (Morocco),
Université de Tunis (Tunisia); December
2005
Contributors: Driss Abbadi, Erkan Akdemir,
Lahcen Achy, Erdem Basçı, Hakan
Berument, Mongi Boughzala, Ahmed
F. Ghoneim, Hanaa Kheir-El-Din, Aykut
Kibritçioglu, Dhafer Saidane, Hala Sakr,
Sübidey Togan.
FEM22-06: “The Informal Economy Employment
Impacts Of Trade Liberalisation And
Increased Competition In Export
Markets: The North African Textile,
Clothing And Footwear Sector”, con-
ducted by Federico Caffè Centre,
Roskilde Univeristy Denmark, Dir.
Bruno Amoroso, Andrea Gallina, in col-
laboration with CREAD (Algeria), INSEA
(Morocco), University of Sussex (United
Kingdom), University of Tunis, Tunisia;
October 2005
Contributors: Bruno Amoroso, Bechir Chourou,
Bruno Cozzari, Andrea Gallina, Diana
Hunt, Mehdi Lahlou, Saïb Musette
FEM22-07: “Integration and enlargement of
the European Union, lessons for the Arab
region”, Center for European Studies,
Faculty of Economics and Political
Science, Cairo University, coord. Naglaa
El Ehwany, in collaboration with Faculty
of Law, Monofeya University (Egypt),
University of Jordan, Amman (Jordan),
-94-
(France), CEPN-Université de Paris 13
(France), ESSEC Tunis (Tunisia), Hebrew
University Jerusalem (Israel), University
of Granada (Spain); July 2005
Contributors: Wifak Barouni, José Camacho,
Jean-Raphael Chaponnière, Agnes
Chevalier, Marc Lautier, Juliette Milgram
Baleix, Mercedes Rodriguez Molina,
Alfred Tovias
FEM22-36: “Obstacles to South-South
Integration, to trade and to foreign
direct investment: the MENA countries
case”, conducted by CATT-Université de
Pau, EMMA network, coord. Jacques Le
Cacheux, in collaboration with University
of Granada; October 2005
Contributors: Antoine Bouët, Jamal Bouoiyour,
Marie-Laure Cheval, Sandy Dall’erba,
Fabrice Darrigues, Sylvain Dejean,
Aomar Ibourk, Saad Isseini, Miren
Lafourcade, Amina Lahrèche-Révil,
Jacques Le Cacheux, Juliette Milgram,
Serge Rey
FEM22-39: “South-South Trade Monetary and Financial Integration and the Euro-Mediterranean Partnership: An Empirical Investigation”, conducted by Institute of Financial Economics, American University of Beirut, Dir. Simon Neaime; June 2005
Contributors : Rima El-Kadi, Simon Neaime, Myra Yazbeck
ACHY L. (2002), « Labour market and growth in Morocco », Global Development Network.
ADAIR P. (2002), « L’économie informelle au Maghreb : une perspective compa-ratiste Algérie-Maroc», Contribution à la Première Université de Printemps des Economies Méditerranéennes et du Monde Arabe à Tanger, 25-27 avril.
AGENOR P-R. et EL AYNAOUI K. (2005), « Politiques du marché du travail et chômage au Maroc : une analyse quantitative », Revue d’Economie du Développement, n°1, mars.
AIT FARAJI S. et AMOR N. (2004), « Offre de travail au Maroc : situation et ten-dance », dans ETUDES ET METHODES, Revue de la DPEG, n°1, Ministère des finances et de la privatisation.
Baldwin E. (2004): ‘Mediterranean Migrations: Regionalisms versus Globalization’, Finisterra, Universidade de Lisboa
Baldwin E. (2005), “Migration In The Middle East And Mediterranean” A Regional Study prepared for the Global Commission on International Migration, Mediterranean Migration Observatory, University Research Institute for Urban Environment and Human Resources, Panteion University
BONNAZ H., COURTOT N. et NIVAT D. (1994), « Le contenu en emplois des échan-ges industriels de la France avec les pays en développement », Economie et Statistique, n°179-280, pp. 13-34.
BORJAS G. J., FREEMAN R. B. et KATZ L. F. (1991), « On the Labor Market Effects of Immigration and Trade », Working Paper Series, n° 3761, NBER.
BOUSSIDA S. (2004), « Ouverture com-merciale et emploi (cas des industries manufacturières tunisiennes », IEQ.
BURGESS S., Lane J. et Stevens D. (2000), « Job Flows, Worker Flows and Churning », Journal of Labor Economics, 18, 473-502.
CABALLERO R. J. et HAMMOUR M. L. (1996), “On the timing and efficiency of crea-tive destruction,” Quarterly Journal of Economics, 111, 805-852.
CERED (1997), Situation et perspectives démographiques du Maroc.
CORTE O. et JEAN S. (1995), « Echange international et marché du travail : une revue critique des méthodes d’analyse », Revue d’Economie Politique, 105, pp. 369-403.
Dasguta D, Nabli MK, Pissarides C et Varoudakis A (2003), “Making trade Work for Jobs : International evidence and lessons for MENA” World Bank, Departemental Working paper 27023, Juillet 2003.
DAVIS S. J. et HITWANGER J. (1992), « Gross job creation, gross job destruction and employment reallocation », Quaterly Journal of Economics, pp. 819-861.
DAVIS S., HALTIWANGER J. et SCHUH S. (1996), Job Creation and Destruction, MIT Press.
-95--95-
DRIVER C., KILPATRICK A. et NAIISBITT B. (1988), « The sensibility of estimated employment effect of input studies », Economic Modeling, pp. 145-150.
EDWARDS (1988), « Terms of trade, tariffs and labour market adjustment in deve-loping countries », World Bank Economic Review, vol 2, pp. 165-85.
Fargue P. (2005) Ed., “Mediterranean Migration 2005 Report”, Cooperation project on the social integration of immi-grants, migration, and the movement of persons, Financed by the European Commission, Robert Schumann Center, European University Institute
Fasano, U and, Rishi G, 2004. “Emerging Strains in GCC Labor Markets”, paper in Middle Eastern and North African Economies, electronic journal, Volume 6, Middle East Economic Association and Loyola University Chicago, September, 2004. http://www.luc.edu/publications/academic
FEMISE (2003), FEMISE 2003 Report on euro-Mediterranean partnership, http://www.femise.org
FEMISE (2004), Profil pays Maroc, Institut de la Méditerranée. http://www.femise.org
FONTAGNE L. et MIRZA D. (2003), « The Role of Demand in the Adjustment of Employment to Trade”, Paper presen-ted at the GEP conference on Trade and Labour Perspectives on Worker Turnover, University of Nottingham 27-28.6.2003.
Gallina A., Amoroso B. (2004), «A favourable macro-economic environment, innovati-ve financial instruments and interna-tional partner-ship to channel workers’ remittances towards the promotion of local development. Two case studies in Morocco and Tunisia», étude femise FEM21-08, http://www.femise.org
Gallina A. (2004), “Migration, financial flows and development in the Euro-Mediterranean area”, Research Report n.5 /2004, Federico Caffè Centre - Department of Social Sciences, Roskilde University
Girgis, M. (2002) “National Versus Migrant Workers in the GCC” in H. Handoussa and Z. Tzannatos (eds.), Employment
Creation and Social Protection in the Middle East and North Africa. Cairo: AUC Press.
Global Development Finance 2005: Mobilizing Finance and Managing Vulnerability, The World Bank, Washington DC
HAOUAS I., YAGOUBI M. et HESHMATI A. (2003), « The impacts of trade libera-lization on employment and wages in Tunisian Industries », Discussion Paper n°688.
ILO (2002), Yearbook of Labor Statistics 2002, The International Labor Organization, Geneva
ILO (2004a), Global Employment Trends 2004, The International Labor Organization, Geneva
ILO (2004b), “Towards a Fair Deal For Migrant Workers in the Global Economy”, International Labor Conference, 92nd Session, 2004, The International Labor Organization, Geneva
ILO (2004c), “A Fair Globalization: Creating Opportunities For all”, Global Commission on The Social Dimension of Globalization, The International Labor Organization, Geneva
Johnson S., Kaufmann D. et P. Zoido-Lobaton, (1998), « Corruption, Public Finances and the Unofficial Economy », World Bank Policy Research Working Paper no. 2169
LALL S. (2002), “The employment impact of globalisation in developing countries”, QEH Working Paper Series, n°93.
MALIRANTA M. (2003), “Micro level dynamics of productivity growth: An empirical analysis of the great leap in Finnish manufacturing productivity in 1975-2000,” Helsinki School of Economics, Doctoral Dissertations N° A-227.
Menegaldo F, Palméro S et Roux N (2004), Tendances de la spécialisation des pays méditerranéens et impact sur la crois-sance dans le cadre d’une comparaison Partenaires Méditerranéens- Pays de l’Est Européen, dans « Les effets des accords d’association sur l’industrie des Pays Partenaires Méditerranéens », Contrat et Rapport de recherche Forum Euro-Mediterranéen des Instituts de Sciences Economiques (FEMISE) (ME8/P7-4100/1B/97/0739-01) FEM21-21, sou-tenu par la Commission Européenne.
MILNER C. et WRIGHT P. (1998), « Modelling labour market adjustment to trade libe-
-96--96-
ralisation in an industrialising econo-my», The Economic Journal, 108, pp. 508-528.
NURMI S. (2004), “Openness to Trade and Employment Dynamics in Finnish Manufacturing”, Statistics Finland.
Palméro S et Roux N (2005), dynamiques sectorielles et emploi au maroc, in étude Femise FEM22-22.
Pennix R. (2004), “Integration: The Role of Communities, Institutions, and the State”, Migration Policy Institute, Washington DC
RAUCH J. E. et WEINHOLD D. (1997), « Openness, specialisation, end producti-vity growth in less developed countries », NBER Working Paper, 6131, March.
RIZWANUL I. (2003), « Labour Market Policies, Economic Growth and Poverty Reduction : Lessons and Non-lessons from the Comparative Experience of East, South-East and South Asia », Issues in Employment and Poverty, Discussion Paper 8, International Labour Office, Geneva.
SPIEZIA V. (2002), « Trade and employment : some empirical evidence », Paris, OCDE, draft for ILO project on Understanding Globalisation, Employment and Poverty Reduction.
VIVARELLI M. (2002), “Globalisation, skills and within-country inequality in deve-loping countries”, Genève,
Vostroknutova E., (2003), « Shadow Economy, Rent-Seeking Activities and the Perils of Reinforcement of the Rule of Law », William Davidson Institute Working Paper no. 578
WOOD A. (1995), « North South trade unem-ployment and inequality », Clarendon Press Oxford, Chapitres 5-8.