Exploration Targeting in a Business Context T. Campbell McCuaig – CET Pietro Guj – CET Jon Hronsky – Western Mining Services Richard Schodde – MinEx Consulting Fennoscandian Exploration and Mining 2009
Transcript
Exploration Targeting in a Business Context
T. Campbell McCuaig – CETPietro Guj – CET
Jon Hronsky – Western Mining ServicesRichard Schodde – MinEx Consulting
• The Mineral industry will be forced to undergo a paradigm shift over the next ten years to a focus on seeking quality greenfields discoveries, requiring:– Greater dependence on accurate conceptual targeting– Exploration systems that closely estimate probability of
success and monitor performance– Concomitant development of exploration technologies
that will allow us to explore new search spaces cost effectively
• The petroleum industry was forced to commence this shift over 30 years ago
We in the mineral industry are behind the times.
Topics to consider
• Drivers for change• Current industry practice misalignment with
future needs• Scale dependent targeting approaches• Corporate considerations and monitoring of
industry success
Drivers of change• Growing demand for mineral end energy
resources by society• Declining exploration success• Resource depletion outstrips replenishment
– Current resource base cannot meet this demand
• Depletion of residual search space• Need for targeting new provinces in areas of
challenging cover (new search space)• The expense of detection in this new search
space – need to target exploration moreeffectively
• Social change requiring a reduction of physical, social and environmental footprint (Europe!)
Minerals and energy demand:the case for the supercycle
Pyle, 2008GFC – major impact on industry funding, limited impact on demand!
Exploration effectiveness declining
7
McKeith (2009)
Challenge to maintain production levels
The graph for base metals tells the same story!
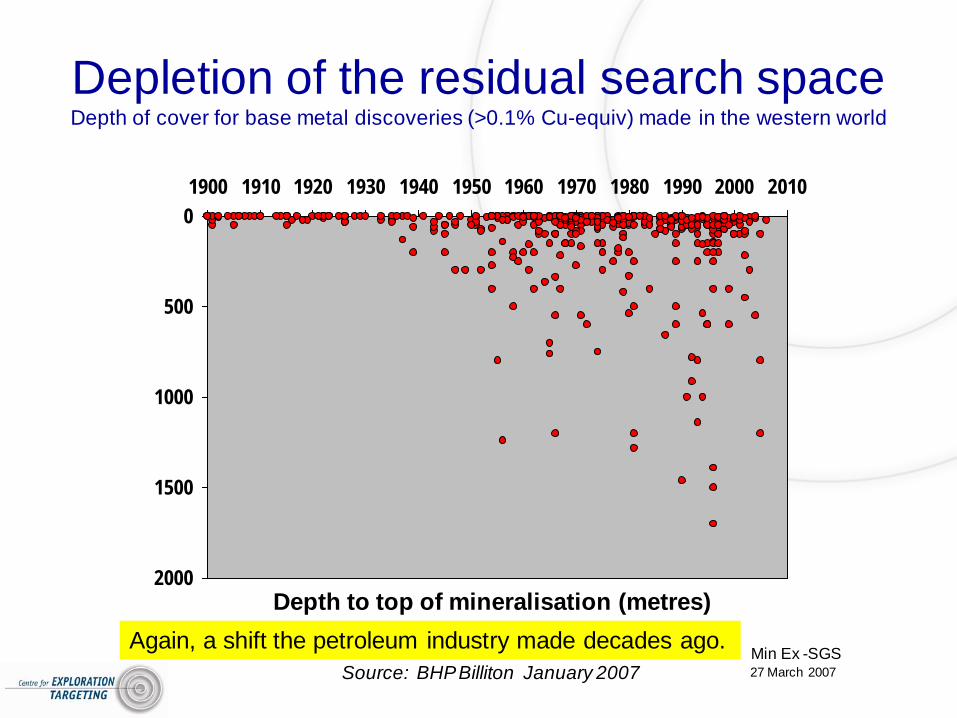
Depletion of the residual search spaceDepth of cover for base metal discoveries (>0.1% Cu-equiv) made in the western world
Min Ex -SGS27 March 2007Source: BHP Billiton January 2007
Depth to top of mineralisation (metres)Again, a shift the petroleum industry made decades ago.
Understanding the search space concept
• In any search space, the bulk of the metal is in a few large deposits
• The largest deposits in any search space are usually found early because they generally have the most obvious signatures
• Any given search space will progressively become exhausted over time, resulting in smaller and higher cost discoveries
• The most important discontinuities in the exploration business are those which significantly expand the search space through innovation– New technology (extraction and exploration)– New concepts (often linked to technology)
SEARCH SPACE OBSERVATION 1 :Most of the mineral industry's wealth is captured by a handful of giant deposits
0%
20%
40%
60%
80%
100%
0% 20% 40% 60% 80% 100%Cumulative Number of Deposits
Cumulative NPV @ 8% discount rate
Source : Derived from Mackenzie 1995
129 Deposits with total value of US$32Billion in 1994 dollars
Base Metal Mines discovered in Canada & Australia to 1988
BASE METALS2/3rds of wealth
comes from 10% of all projects
Hronsky (2004)
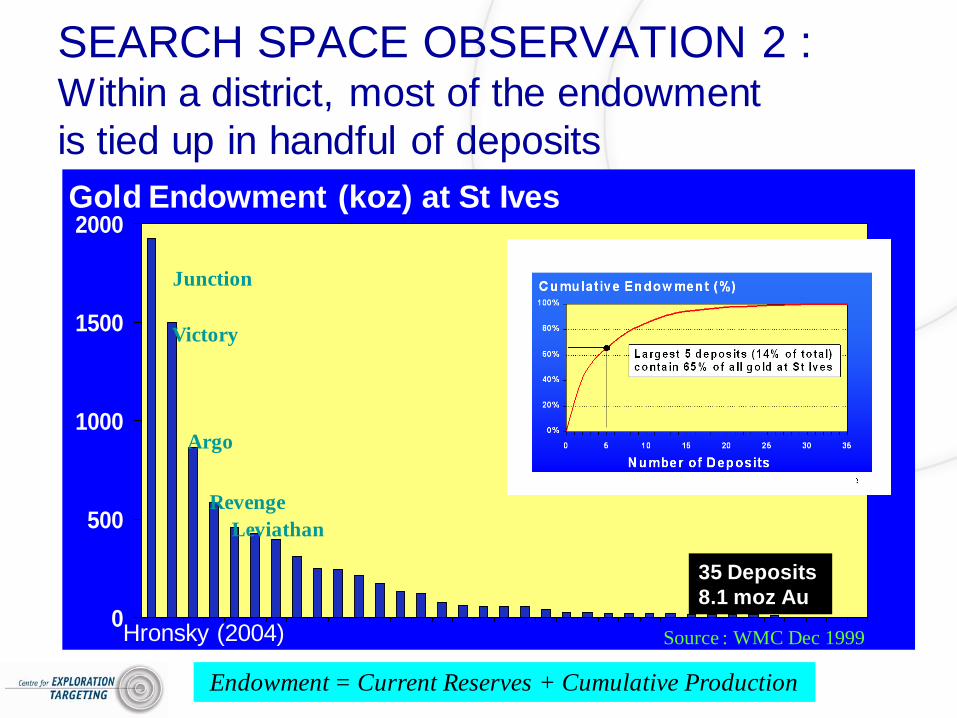
SEARCH SPACE OBSERVATION 2 :Within a district, most of the endowment is tied up in handful of deposits
0
500
1000
1500
2000
Junction
LeviathanRevenge
Argo
Victory
35 Deposits8.1 moz Au
Gold Endowment (koz) at St Ives
Endowment = Current Reserves + Cumulative Production
Source : WMC Dec 1999Hronsky (2004)
0.00.51.01.52.02.53.03.54.0
1960 1970 1980 1990 2000 2010
Minor (<10kt Ni)Moderate (10-100kt Ni)Major (100-1000kt Ni)Giant (>1000kt Ni)
Discovery Year
Total = 12.71mtexcluding 0.14mt in deposits with no
published discovery date
Source: R.Schodde (2004)
Mt Ni
Hronsky (2004)
SEARCH SPACE OBSERVATION 3 Largest deposits are generally found first - Yilgarn NiS
Greenfields
Brownfields
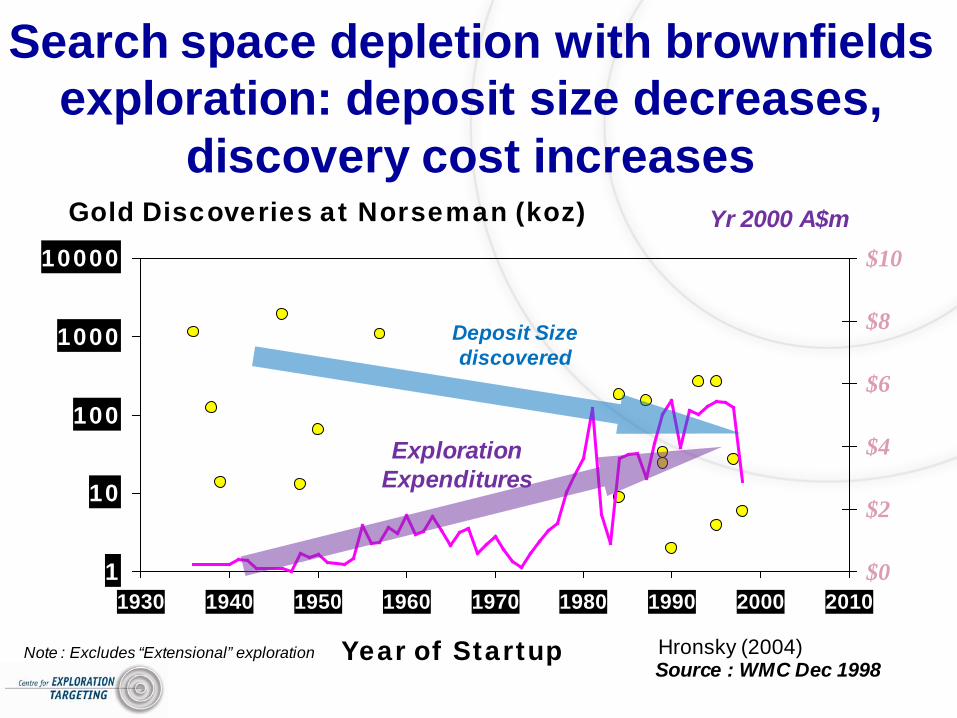
Search space depletion with brownfieldsexploration: deposit size decreases,
discovery cost increases
1
10
100
1000
10000
1930 1940 1950 1960 1970 1980 1990 2000 2010$0
$2
$4
$6
$8
$10
Year of Startup
Exploration Expenditures
Yr 2000 A$m
Note : Excludes “Extensional” exploration
Gold Discoveries at Norseman (koz)
Deposit Size discovered
Source : WMC Dec 1998Hronsky (2004)
New mineral provinces required
0
10
20
30
1900 1920 1940 1960 1980 2000 2020
Mine Production (mtpa Cu metal)
Sources: US Geological Survey (1900-83), Brook Hunt (1984 onwards)
Brook-Hunt Q3 2006 forecast
Copper consumption over the last 25 years accounted for half of all copper metal ever mined
in the world
World consumption over the next 25 years will exceed all of copper metal ever mined
to date
2005
1981
2030
Average 3.4% pa growth rate 1900-81 Average
2.0% pa 1982-2005
Average 3.2% pa
1986-2030
Schodde, 2007
Social pressures and deposit qualityPhysical and socio-economic footprintCarbon footprint
Success may look different in the future!- A focus on high quality deposits required
Current industry practice not inline with new paradigm
– External (equity market) and internal (remuneration packages and KPI) measures foster short-term thinking and short term results
– Results in focus on brownfields AT EXPENSE of greenfields
– Trend of majors away from exploration to acquisition, focus on extraction technologies
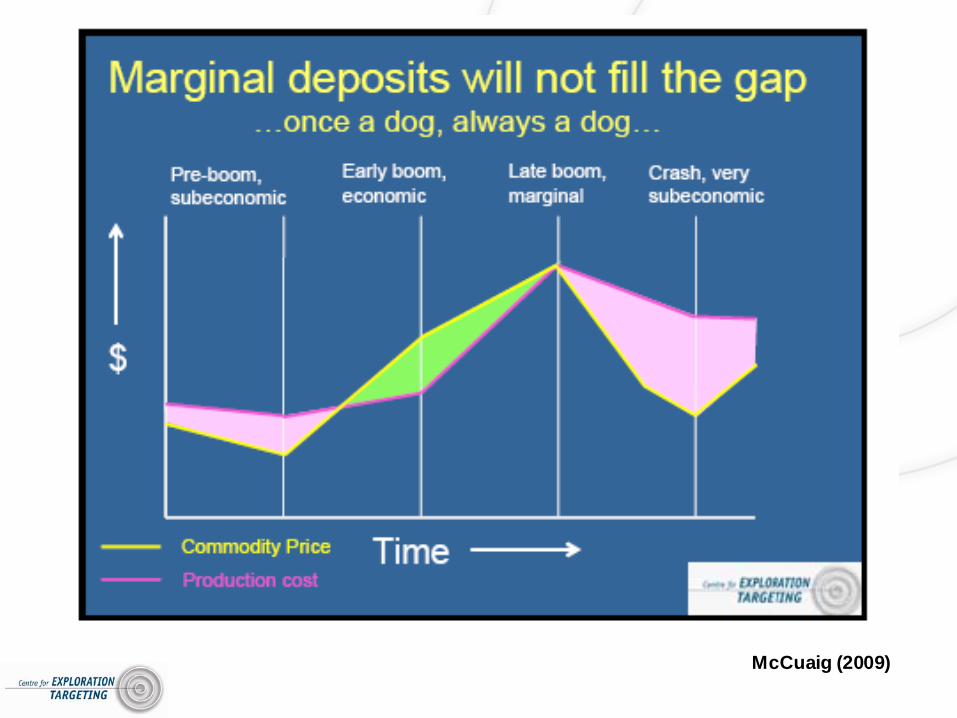
– Expectation that Juniors will fill the greenfields gap– A common belief that metal prices will sort out supply
All of these ideologies are fundamentally challenged looking to the future
Commitment to discovery: global non-ferrous exploration expenditures and metal prices
1989-2009
Sources: MEG and IAEA (for uranium 1989-2006)
US$ Billion of the day Relative Metal Price (1989 =1.0)
Richard Schodde
What is our real commitment to discovery?Long-Term Trend in Greenfields Exploration
Long-term trend
Juniors will not do the greenfields!
• Fundamental assumption is that greenfields exploration (and its inherent risks) will be outsourced to Juniors
• But structure of Juniors’ funding mitigates against greenfields exploration strategies
• Will metal prices simply sort it out? • There is a long list of marginal projects that could
potentially be economic with a sustained metal price rise
McCuaig (2009)
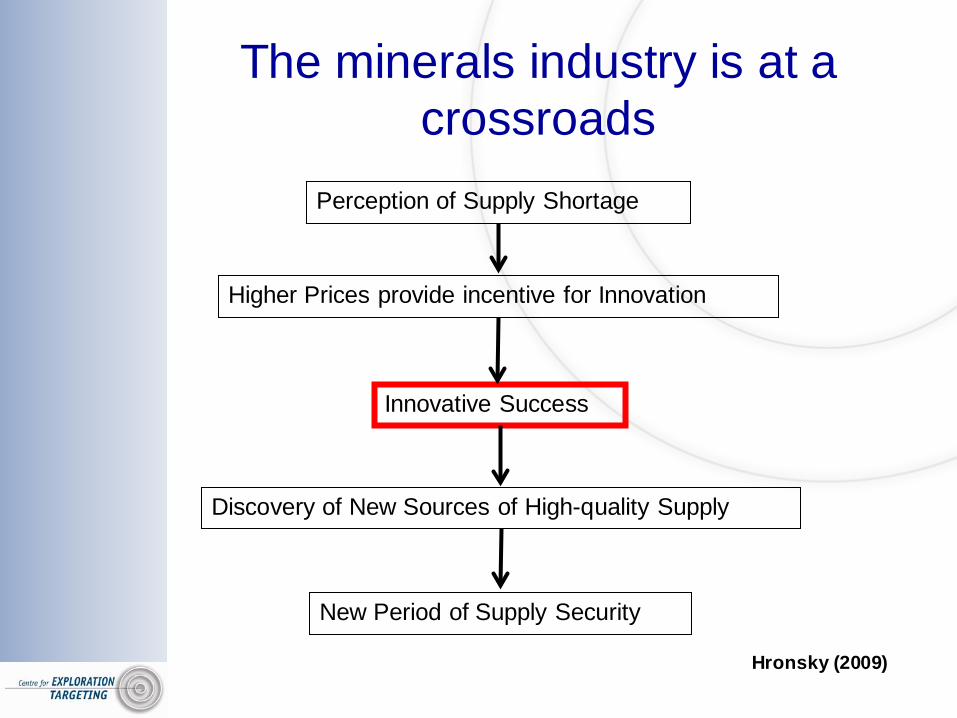
The minerals industry is at a crossroads
Perception of Supply Shortage
Higher Prices provide incentive for Innovation
Innovative Success
Discovery of New Sources of High-quality Supply
New Period of Supply Security
Hronsky (2009)
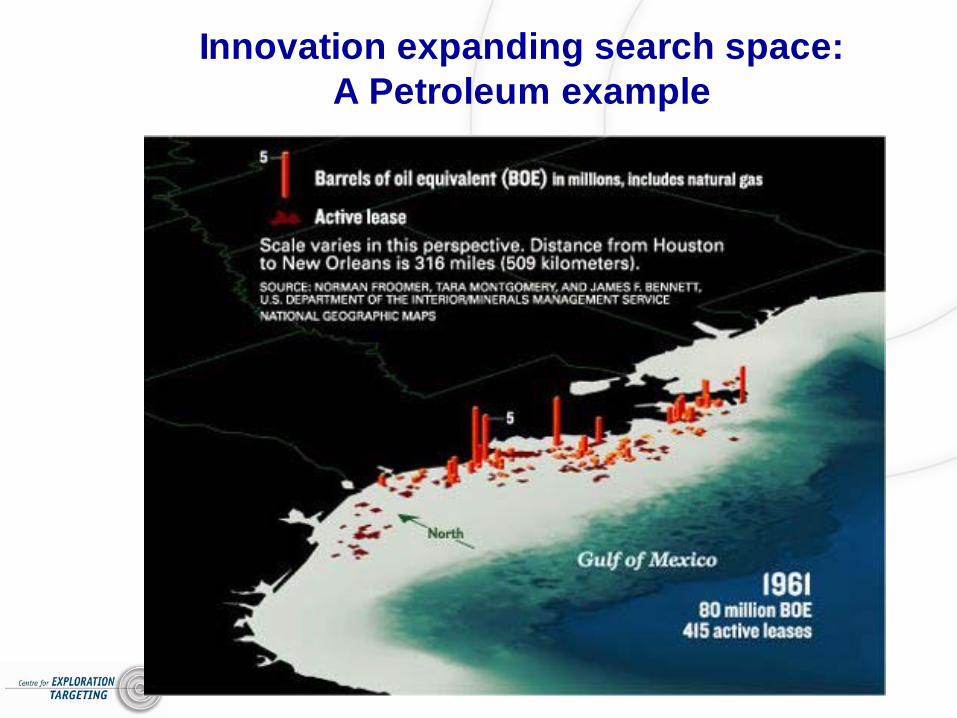
Innovation expanding search space:A Petroleum example
After 40 years of technology development…Think of this as mineral exploration under cover
The Minerals Example: Exploration Cost is the Key Barrier to Mining Deep High-Quality Orebodies
Hronsky (2005)
0
10
20
30
40
50
60
200 400 600 800 1000
DEPTH TO TOP OF OREBODY
IRR
(%)
0200400600800100012001400
NPV
(A$
M)
IRR NPV
Modelling for a Voisey’s Bay style orebody in remote WA(30 Mt @ 2.5% Ni, 2.0% Cu; 20m thick 60 degree dip)
Targeting new greenfields discoveries
• Our ability to mine at depth far outstrips our ability to explore at depth
• Requires an innovation in deep exploration technology• The key innovation is more accurate targeting of
mineralised volumes of rock under cover• Requires a shift from deposit model style concepts to
mineral system style concepts• Requires translation of understanding of mineral system
model into effective targeting model
Targeting approaches• Empirical
– correlations of geoscience datasets with known mineral deposits in well-explored, data-rich terranes
– Harder to apply in the new search space under cover
• Conceptual– Combination of geological elements from
mineral deposit models– mineral systems approaches
in reality, targeting approaches are a mixture between empirical and conceptual
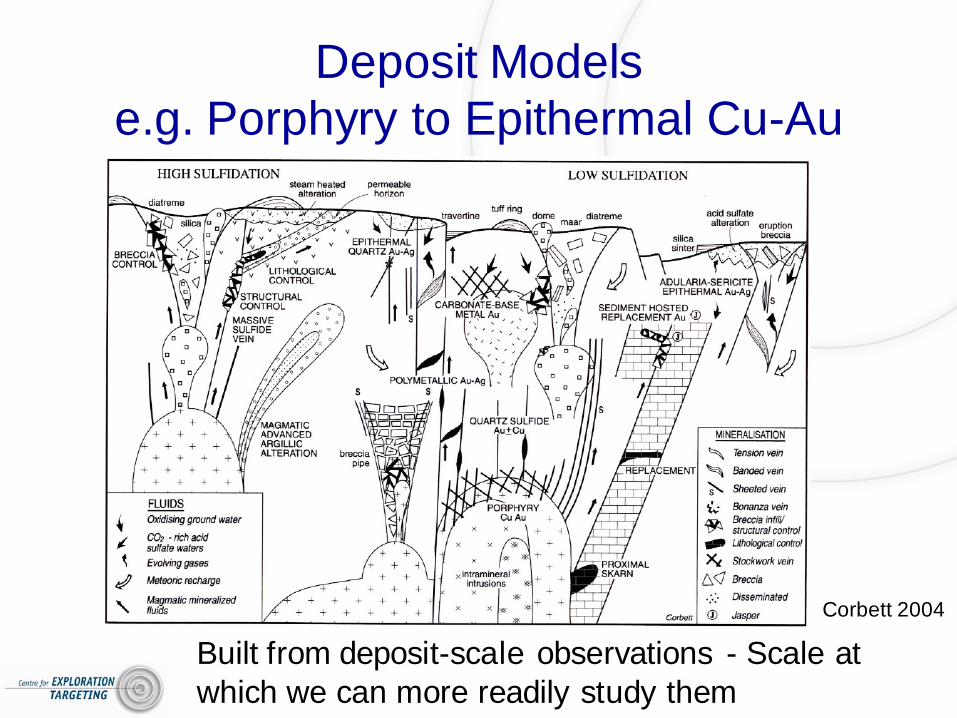
Deposit Modelse.g. Porphyry to Epithermal Cu-Au
Corbett 2004
Built from deposit-scale observations - Scale at which we can more readily study them
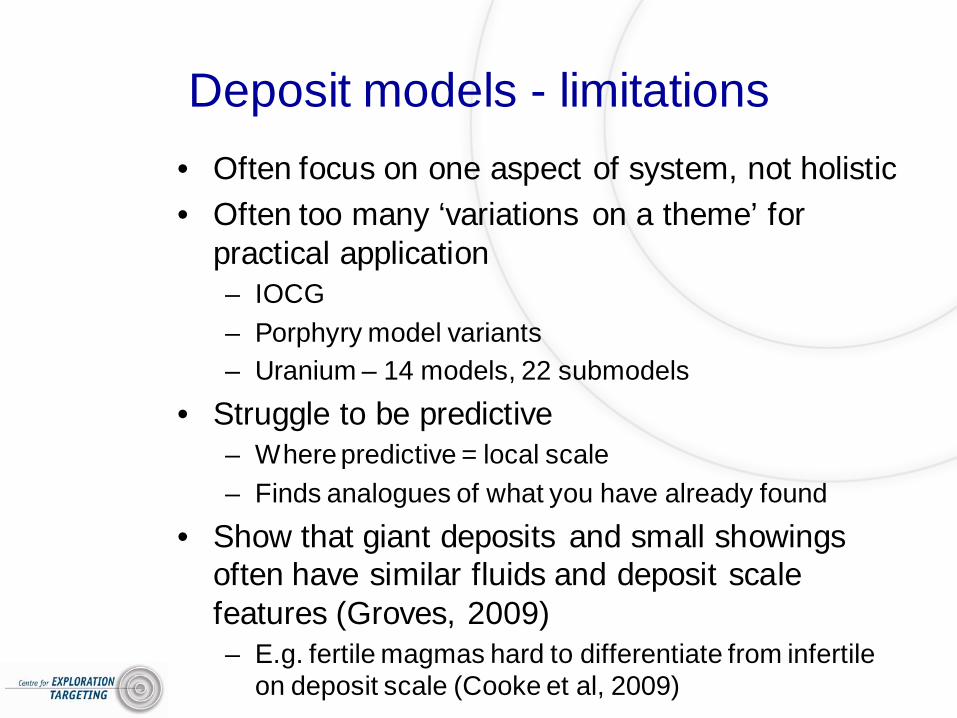
Deposit models - limitations• Often focus on one aspect of system, not holistic• Often too many ‘variations on a theme’ for
• Struggle to be predictive– Where predictive = local scale– Finds analogues of what you have already found
• Show that giant deposits and small showings often have similar fluids and deposit scale features (Groves, 2009)– E.g. fertile magmas hard to differentiate from infertile
on deposit scale (Cooke et al, 2009)
Deposit models struggle to be predictive
• We have a much better (albeit very incomplete) understanding of the processes controlling mineralisationthan 40 years ago
• So our targeting must be more effective, yes?– No– Find new deposits in brownfields, but struggle to find new ore
systems in greenfields terranes
• DEPOSIT MODELS ARE AT WRONG SCALE for large scale greenfields exploration decisions!
after McCuaig and Hronsky 2000
Prediction-detection tradeoff
LOWBROAD REGIONAL
PREDICTION
HIGH
PROSPECT SCALESCALE
RELA
TIVE
EFFE
CTI
VENE
SS DETECTION
Camp scale decision
A mineral systems approach
Focus must be on understanding the geological PROCESSES as opposed to CHARACTERISTICS
SEA LEVEL
INC
R. T
EM
PE
RA
TU
RE
WIT
H D
EP
TH
?
?
Sourcefor metals& brinesTiming
ofmovement
Migrationpathway -
rockinteractions
"Trap"controlled
by fluid-rockinteractions/P-T
"Seal"controlspathway
"Trap"controlled by
fluid-rockinteractions/P-T
fluid-fluidfluid-gas
Source - Release - Migration - Trap - Seal
Source(s) - Migration - Throttle - Scrubber
Critical Success Factors
Mass trapping
Mass scrubbing
Target Generation from Mineral Systems –Orogenic Au
Critical Processes (ranking level)
Constituent Processes (thinking level)
Targeting Elements (Geological features indicating the processes)Translation into mappable targeting criteria (proxies and predictor maps)
Source - fluid, magma, metals
Active Pathway
Physical throttle
Preservation
Reaction with wallrock reduces metal solubility
Pressure change induces chemical change and reduces solubility
Remote sensing response
Key alteration minerals
Rocks of favourable chemistry
lithogeochemistry
Recognise a chemical gradient
Weight by confidence, quality, support
Manually or through automated process query datasets for combination of evidence
Fluid Mixing
Chemical scrubber
Geophysical response
Solid geology interpretation
Pilbara Craton
Yilgarn Craton
Musgraves
Warakurna LIP
Craton margins
Tier 1 NiS deposits
Granitoid NdTM after Cassidy and Champion 2007
Controls on location of large mineral systems
Paleocraton margins
Yilgarn Au after Robert et al. 2005
Scale dependence of Targeting Elements - Au
McCuaig et al., in review OGR
Scale dependence of Targeting Elements – Komatiite Ni-Cu-S
McCuaig et al., in review OGR
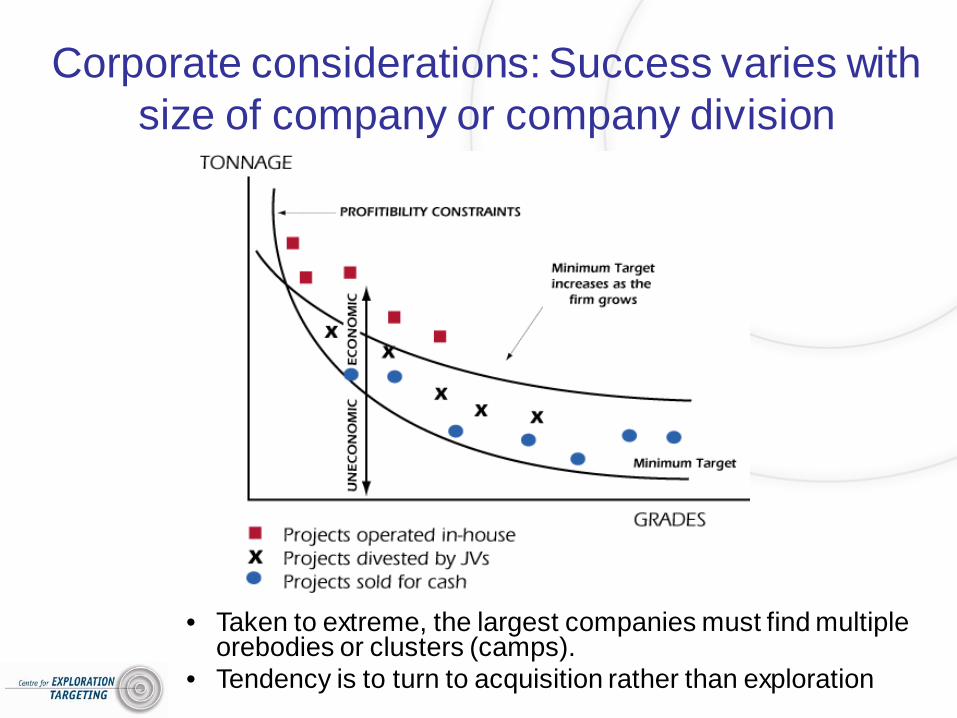
Corporate considerations: Success varies with size of company or company division
• Taken to extreme, the largest companies must find multiple orebodies or clusters (camps).
• Tendency is to turn to acquisition rather than exploration
Links to Targeting Strategy
• Any targeting strategy must be based on an understanding of the degree of depletion of the relevant search space (i.e. “exploration maturity”) for the target province (or district, or camp)
• Need to know when to walk away from an area (in a technical sense) – two requirements– Requires you know what success is TO YOU– Requires you can estimate residual endowment
• How can we estimate residual endowment?
300
200
100
01965 1970 1975 1980 1985 1990 1995 2000
Year of discovery
Komatiite-associated Ni-Cu deposits, Kambalda Region,Eastern Goldfields Province, Western Australia
Kt nickelmetal
production
andreserves
(2000)
Current endowmentInitial reserves
LARGEST DEPOSITS NORMALLY DISCOVERED
IN EARLY YEARS OF EXPLORATION IN
DISTRICT
Hronsky and Groves (2008)
Largest deposits found earlybut may not be recognised as largest! – how to tell?
Can we use this size-frequency relationship?
0
500
1000
1500
2000
Junction
LeviathanRevenge
Argo
Victory
35 Deposits8.1 moz Au
Gold Endowment (koz) at St Ives
Endowment = Current Reserves + Cumulative Production
US$ 0.25 M US$ 0.5 M US$ 0.75 MAverage cost of a greenfield exploration program
Preferred combination
Guj and Bartrop (2009) Based on MEG data of greenfieldsexploration spend and greenfields discoveries 1998-2004
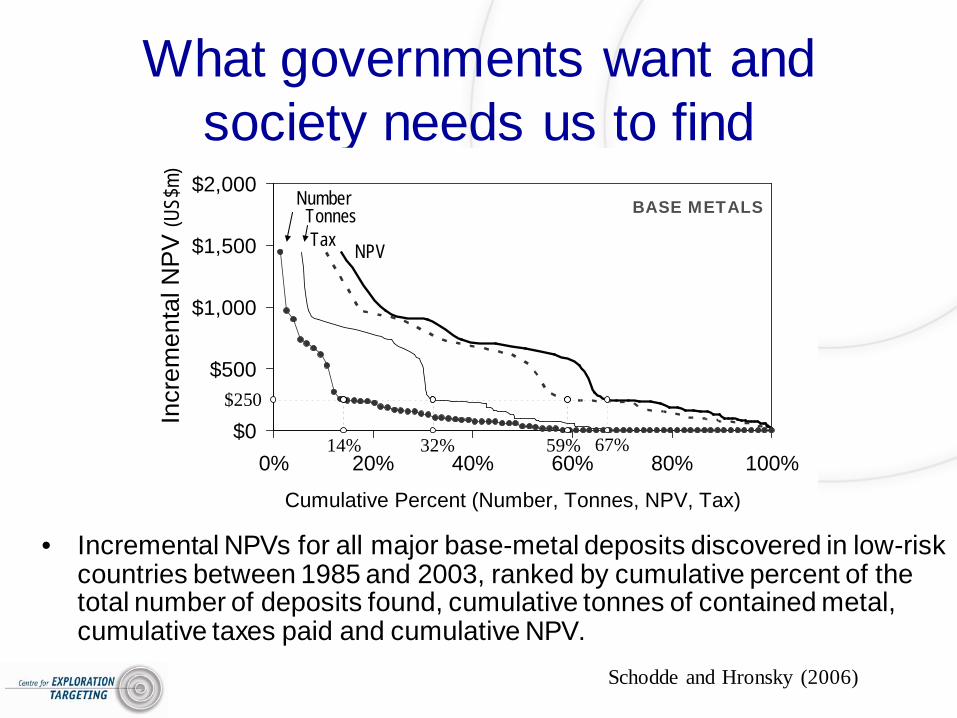
What governments want and society needs us to find
• Incremental NPVs for all major base-metal deposits discovered in low-risk countries between 1985 and 2003, ranked by cumulative percent of the total number of deposits found, cumulative tonnes of contained metal, cumulative taxes paid and cumulative NPV.
$0
$500
$1,000
$1,500
$2,000
0% 20% 40% 60% 80% 100%
Cumulative Percent (Number, Tonnes, NPV, Tax)
NPV
TonnesNumber
Tax
$250
67%32%14% 59%
BASE METALS
Incr
emen
tal N
PV (U
S$m)
Schodde and Hronsky (2006)
Conclusion
• The Mineral industry will be forced to undergo a paradigm shift over the next ten years to a focus on seeking quality greenfields discoveries– More dependence on accurate conceptual targeting– Exploration systems that closely estimate probability of
success and monitor performance– Development of exploration technologies that will allow
us to explore new search spaces cost effectively
• The petroleum industry was forced to commence this shift over 30 years ago