42
FUZZY-MONTE CARLO SIMULATION FOR RISK ANALYSIS IN INVESTMENT PROJECT EVALUATION FERDINAND MURNI HAMUNDU UNIVERSITI SAINS MALAYSIA 2011

FUZZY-MONTE CARLO SIMULATION FOR RISK ANALYSIS IN INVESTMENT PROJECT
EVALUATION
FERDINAND MURNI HAMUNDU
UNIVERSITI SAINS MALAYSIA 2011
FUZZY-MONTE CARLO SIMULATION FOR RISK
ANALYSIS IN INVESTMENT PROJECT EVALUATION
by
FERDINAND MURNI HAMUNDU
Thesis submitted in fulfillment of the requirements for the degree of
Master of Science
August 2011

ii
ACKNOWLEDGEMENTS
In the name of Allah SWT, the Most-Merciful, the All-Compassionate, Praise
be to Allah SWT, we seek His help and His forgiveness. Salawat and salaam for
Prophet Muhammad SAW, his family and his companions.
First and foremost, I would like to express my deep gratitude to my main
supervisors Professor Dr. Rahmat Budiarto for his encouragement, review, moral
support, and guidance. His endeavor becomes my source of energy to put more
efforts for completing my thesis. Likewise, I am also grateful to my co supervisor,
Dr. Vincent Khoo Kay Teong for his helps and comments during some events,
Professor Dr. Rosni Abdullah as the dean of School of Computer Sciences USM for
providing space to write this thesis.
I am also very thankful to all my lab mates especially to Armand, Rahmad,
and Erwin for his interesting discussions and supporting idea. To all my friends in
PPI-USM and FORKOMMI, I want to thanks to you guys, for your cooperation and
good friendship.
I am deeply appreciated the love and support of my wife Ayu Kustiani and
my daughter Malika Nur Syifa Hamundu for sharing every moment during living in
Penang with me. Thank you for your understanding what I have been doing to leave
you every day and night. My special thanks to my family especially for my father
Mahmud Hamundu and My mother Murni Alwi for their blessings, support, love and
prayers for my success.

iii
TABLE OF CONTENTS
ACKNOWLEDGEMENTS ......................................................................................... ii
TABLE OF CONTENTS ............................................................................................ iii
LIST OF TABLES ..................................................................................................... vii
LIST OF FIGURE ........................................................................................................ x
LIST OF ABBREVIATION ...................................................................................... xii
ABSTRAK. ............................................................................................................... xvi
ABSTRACT ............................................................................................................. xvii
CHAPTER 1 INTRODUCTION ................................................................................ 1
1.1 Background ........................................................................................................ 1
1.2 Problem Statement ............................................................................................. 3
1.3 Research Objectives ........................................................................................... 6
1.4 Thesis Contribution ............................................................................................ 6
1.5 Thesis Outline .................................................................................................... 7
CHAPTER 2 LITERATURE REVIEW ................................................................... 10
2.1 Investment Project Evaluation ......................................................................... 10
2.2 Capital Investment ........................................................................................... 12
2.2.1 Net Present Value (NPV) .......................................................................... 13
2.2.2 Internal Rate of Return (IRR) ................................................................... 15
2.3 Economic Model of Investment Project ........................................................... 17
2.4 Risk Management Concept .............................................................................. 20
2.4.1 Definition of Risk...................................................................................... 20
2.4.2 Risk Management Process ........................................................................ 22
2.4.3 Risk Management Planning ...................................................................... 24
2.4.4 Risk Identification ..................................................................................... 25
iv
2.4.5 Risk Analysis ............................................................................................ 26
2.4.6 Risk Response Planning ............................................................................ 28
2.5 Related Works in Risk Analysis for Investment Project Evaluation ............... 30
2.5.1 Monte Carlo Simulation ............................................................................ 31
2.5.2 Sensitivity Analysis................................................................................... 33
2.5.3 Analytic Hierarchy Process ....................................................................... 35
2.5.4 Fuzzy Inference System ............................................................................ 37
2.5.5 The Hybrid Technique .............................................................................. 44
2.6 Current Issue in Risk Analysis Works ............................................................. 46
2.7 Summary .......................................................................................................... 48
CHAPTER 3 RESEARCH METHODOLOGY ....................................................... 49
3.1 Problem Analysis ............................................................................................. 49
3.2 Requirement Analysis ..................................................................................... 52
3.3 The Solution Design for Risk Analysis in Investment Project Evaluation ..... 53
3.3.1 Qualitative Risk Analysis.......................................................................... 54
3.3.2 Quantitative Risk Analysis ........................................................................ 56
3.4 Validation Method and Implementation of the Solution Design to a Case
Study .............................................................................................................. 59
3.4.1 Secondary Data Collection ........................................................................ 60
3.4.2 Primary Data Collection ............................................................................ 61
3.5 Performance Analysis ...................................................................................... 61
3.6 Summary .......................................................................................................... 62
CHAPTER 4 THE DESIGN FOR RISK ANALYSIS IN INVESTMENT PROJECT
EVALUATION USING FUZZY-MONTE CARLO SIMULATION ....................... 63
4.1 The Architecture of Fuzzy Monte Carlo simulation for Risk Analysis ........... 63
4.2 Variable Identification ..................................................................................... 66
4.3 Knowledge Acquisition.................................................................................... 66

v
4.3.1 Determining the Derivation of Variables .................................................. 67
4.3.2 Fuzzy Inference System for Weighting Non Financial Factor ................. 68
4.4 Modeling of Risk Impact to Economic Model................................................. 70
4.5 Performing Simulation for Risk Analysis ........................................................ 72
4.6 Summary .......................................................................................................... 72
CHAPTER 5 CASE STUDY INVESTMENT PROJECT ........................................ 74
5.1 Waru-Juanda Toll Road Profile ....................................................................... 75
5.1.1 Background of the Project ......................................................................... 75
5.1.2 Technical Aspect of the Project ................................................................ 76
5.1.3 Operational Aspect of the Project ............................................................. 77
5.1.4 Financial Aspect of the Project…………………………………………. 80
5.1.5 Revenue in Year 2008 ............................................................................... 84
5.2 Economic Model of Waru-Juanda Toll Road Project ...................................... 85
5.2.1 Revenue Model ......................................................................................... 85
5.2.2 Cash Flow Model ...................................................................................... 86
5.2.3 Profit-Loss Model ..................................................................................... 86
5.3 Risk Factors in Toll Road Project .................................................................... 92
5.3.1 Identification of Waru Juand Toll Road Project Risk ............................... 93
5.3.2 Pairwise Comparison between Risk Using Analytic Hierarchy Process .. 95
5.4 Bridging the Non Financial Risk of Waru Juanda Toll Road Project ............ 105
5.4.1 The Impact of Interchange Ramp and Mass Transportation Moda ........ 105
5.4.2 Weighting of Decrease Rate for Traffic Volume .................................... 106
5.4.3 User Rating the Decrease Rate for Traffic Volume ................................ 108
5.5 The Financial Risk Variables ......................................................................... 110
5.5.1 Economic Indicator ................................................................................. 110
5.5.2 Elements of Project Cost ......................................................................... 115
5.5.3 Government Policy and Rule in Toll Tariff Determination .................... 116
5.6 Risk Analysis Model in Toll Road Investment Project.................................. 116
5.7 Simulation Scenarios...................................................................................... 118

vi
5.8 Summary ........................................................................................................ 119
CHAPTER 6 RESULT AND DISCUSSION ......................................................... 120
6.1 Probability Distribution of Cumulative Cash Flow ....................................... 121
6.2 Probability Distribution of Net Present Value ............................................... 127
6.3 Probability Distribution of Internal Rate of Return ....................................... 130
6.4 Risk Response Planning for Toll Road Investment Project in Indonesia ...... 133
6.4.1 Ensuring the Toll Tariff Rate accordance with Investment Planning ..... 134
6.4.2 Transfer of Land Acquisition Cost Risk to Government ........................ 134
6.4.3 Upgrade the Interchange Ramp............................................................... 135
6.5 Summary ........................................................................................................ 136
CHAPTER 7 CONCLUSION AND FUTURE WORKS ........................................ 137
7.1 Revisiting Research Contribution .................................................................. 137
7.2 Conclusions ................................................................................................... 138
7.3 Limitations and Future Works ....................................................................... 140
REFERENCES......................................................................................................... 142
APPENDIX A .......................................................................................................... 147
APPENDIX B .......................................................................................................... 158
LIST OF PUBLICATIONS ..................................................................................... 174

vii
LIST OF TABLES
Page
Table 2.1 Illustration of NPV Calculation 14 Table 2.1 (continued) 15 Illustration of NPV Calculation Table 2.2 Illustration of IRR Calculation 17 Table 3.1 Likert scale for Identifying Risk (Xu et al., 2010) 55 Table 3.1 (continued) 56
Likert scale for Identifying Risk (Xu et al., 2010) Table 3.2 Saaty Scale for Comparing Each Risk 56 (Zayed et al., 2008) Table 5.1 Waru-Juanda Toll Road Specification 77 Table 5.2 Projection of Traffic Volume per Class in Year 2008 78
(PT Citra Marga Nusaphala Persada, 2009) Table 5.3 Growth Assumptions Average Traffic Volume 78
(PT Citra Marga Nusaphala Persada, 2009) Table 5.4 Projection of Traffic Volume (2005-2050)(PT Citra Marga 79
Nusaphala Persada, 2009)
Table 5.5 Capital Structure per Year (PT Citra Marga Nusaphala 82
Persada, 2009) Table 5.6 Schedule of Investment Planning (PT Citra Marga Nusaphala 83 Persada, 2009) Table 5.7 Revenue Model of War-Juanda Toll Road Project 88 Table 5.8 Cash Flow Model of Waru-Juanda Toll Road Project (USD) 89 Table 5.8 (continued) 90 Cash Flow Model of Waru-Juanda Toll Road Project (USD) Table 5.9 Profit-Loss Model of Waru Juanda Toll Road Project (USD) 91 Table 5.10 Questionnaire Respondent 93 Table 5.11 Questionnaire Result of Risk and Sub-risk Assessment 94

viii
Table 5.11 (continued) 95 Questionnaire Result of Risk and Sub-risk Assessment Table 5.12 Pairwise Comparison Matrix of Main Risks 96 Table 5.13 Pairwise Comparison Matrix of Sub Risk in Government Policy 97 Risk Table 5.14 Pairwise Comparison Matrix of Sub Risk in Financial and 97 Economic Risks Table 5.15 Pairwise Comparison Matrix of Sub Risk in Risk During 98
Construction
Table 5.16 Pairwise Comparison Matrix of Sub risk in Investment 98 Cost Risk Table 5.17 Pairwise Comparison Matrix of Sub Risk in Design and 99
Construction Risk Table 5.18 Pairwise Comparison Matrix of Sub Risk in Materials, 99
Labor, and Equipment Risk
Table 5.19 Pairwise Comparison Matrix of Sub Risk in 100 Environmental Risk
Table 5.20 The Most Influence Risk in Waru Juand Toll Road Project 105 Table 5.21 Input for Rating the Decrease Rate for Traffic Volume 109 Table 5.22 Decreasing Rate for Traffic Volume 110 Table 5.23 Indonesian Inflation Rate 111 (Central Bank of Indonesia, 2009) Table 5.23 (continued) 112 Indonesian Inflation Rate (Central Bank of Indonesia, 2009) Table 5.24 Bank Interest Rate in Indonesia 113 (Central Bank of Indonesia, 2009) Table 5.25 Assumption of Expected Traffic Volume (vehicle/day) 114 Table 5.26 The Possibility of Land Acquisition Cost Increase 25% (USD) 115 Table 5.27 The Possibility of Land Acquisition Cost Increase 50% (USD) 115 Table 5.28 The Possibility of Toll Tariff Rate (USD per KM) 116
ix
Table 5.29 Simulation Scenarios 118 Table 5.29 (continued) 119 Simulation Scenarios Table 6.1 An Example of CCF Calculation in Cash Flow Model of 122
Waru Juanda Project
Table 6.1 (continued) 123 An Example of CCF Calculation in Cash Flow Model of Waru Juanda Project
Table 6.2 Percentiles of Probability Distribution CCF in year 2008 124 for All Scenarios (USD)
Table 6.3 Certainty Level of Loss for CCF in Year 2008 for 124 Each Scenario
Table 6.4 Percentiles of Probability Distribution CCF in year 2008 126 for All Scenarios (USD) by Monte Carlo Simulation
Table 6.5 Certainty Level of Loss for CCF in Year 2008 126 for Each Scenario by Monte Carlo Simulation
Table 6.6 Percentiles of Probability Distribution NPV 129 for All Scenarios (USD)
Table 6.7 Certainty Level of NPV above USD 0 for Each Scenario 129 Table 6.8 Percentiles of Probability Distribution IRR 131
for All Scenarios (%)
Table 6.9 Certainty Level of IRR above 12% for Each Scenario 132
x
LIST OF FIGURES
Page
Figure 2.1 Correlations of Risk Variables (Kerzner, 2003) 22 Figure 2.2 Flow Diagram of Risk Management Process (William, 2000) 23 Figure 2.3 Stages in Risk Identification (Zayed et al., 2008) 26 Figure 2.4 Components in Risk Analysis 27 Figure 2.5 Risk Response Option 30 Figure 2.6 Risk Analysis Process using MCS Method 33 Figure 2.7 The Graph of Sensitivity Analysis 34 Figure 2.8 Fuzzy Inference System 37 Figure 2.9 Mamdani Fuzzy Inference System 39 Figure 2.10 Fuzzification of Crisp Inputs 40 Figure 2.11 Membership Functions 40 Figure 2.12 Defuzzification of Outputs 43 Figure 3.1 First Part of Flow Chart for Risk Analysis in Investment Project 50 Evaluation Figure 3.2 Second Part of Flow Chart for Risk Analysis in Investment 51
Project Evaluation Figure 3.3 Third Part of Flow Chart for Risk Analysis in Investment Project 52 Evaluation Figure 3.4 Risk Analysis Process using Fuzzy Monte Carlo Simulation 59
Method Figure 3.5 Output validation process for Fuzzy Monte Carlo simulation 60 Figure 4.1 Fuzzy-Monte Carlo Simulation for Risk Analysis Framework 65 Figure 4.2 Knowledge Acquisition 67 Figure 4.3 Relationships between Risk and Attractiveness 70
Investment Parameters

xi
Figure 4.4 Risk Analysis Process using Fuzzy Monte Carlo Simulation 73 Method
Figure 5.1 Toll Road Network of East Java 76 (PT Citra Marga Nusaphala Persada, 2009)
Figure 5.2 Tree Diagram of Risk and Sub-risk Factors in 92 Toll Road Investment
Figure 5.3 Pie chart of questionnaire data acquisition 93 Figure 5.4 Probabilities of Main Risks 96 Figure 5.5 Probability of Sub Risk in Government Policy Risk 97 Figure 5.6 Probability of Sub Risk in Financial Risk and Economic 98 Figure 5.7 Probability of Sub Risk in Risk during Construction 98 Figure 5.8 Probability of Sub Risk in Construction Cost Risk 99 Figure 5.9 Probability of Sub Risk in the Design and construction 99 Figure 5.10 Probability of Sub Risk Material, Labor, and Equipment 100 Figure 5.11 Probability of Sub Risk in Environmental Risk 100 Figure 5.12 Overall Probability Risk for the Synthesis of Goal 104 Figure 5.13 Membership Function for Interchange and Ramp 106 Figure 5.14 Membership Function for Delivery Time 107
(Mass Transportation Moda)
Figure 5.15 Membership Function for Decrease Rate for Traffic Volume 107 Figure 5.16 Beta Distribution for Decrease Rate of Traffic Volume 109 Figure 5.17 Normal Distribution for Inflation Rate 112 Figure 5.18 Lognormal Distribution for SBI Interest Rate 113 Figure 6.1 Example of Decreased Traffic Volume for Group 1 Calculation 121

xii
LIST OF ABBREVIATION
NPV Net Present Value
IRR Internal Rate of Return
MCS Monte Carlo Simulation
FL Fuzzy Logic
AHP Analytic Hierarchy Process
CF Cash Flow
FMCS Fuzzy-Monte Carlo Simulation
CCF Cummulative Cash Flow
ROI Return of Investment
COC Cost of Capital
PI Profitabilty Index
NPW Net Present Worth
PV Present Value
NCF Net Cash Flow
ACF Annual Cash Flow
ROR Rate of Return
DCFOR Discounted Cash Flow Rate of Return
MARR Minimum Attractive Rate of Return
RMP Risk Management Plan
EA Earned Value
TPM Technical Performance Measurement
SVR Supper Vector Regression
BCR Benefit, Cost and Risk

xiii
PT Perseroan Terbatas (Limited Liability Company)
MERR Middle East Ring Road
PP Peraturan Pemerintah (Government Regulation)
PBB Pajak Bumi dan Bangunan (Land and Building Tax)
GR Government Rule and Policy Risk
RC Risk During Construction
FE Financial and Economic Risk
EN Environment Risk
TT Toll Tariff Rate Risk
IR Interchange and Ramp Risk
MT Mass Transportation Moda Risk
RT Rate of Toll Road Tax Risk
CP Change of Economic and Politic Policy Risk
IF Inflation Risk
UF USD Currency Rate Risk
BiR Bank Interest Rate Risk
MP Monopoly Risk
TV Traffic Volume Risk
WI Failure in Working and Maintenance Insurance
CL Contingent Liability Risk
CCR Construction Cost Risk
DR Construction Design Risk
ER Equipment Risk
LA Land Acquisition Risk
CC Construction Cost Risk
xiv
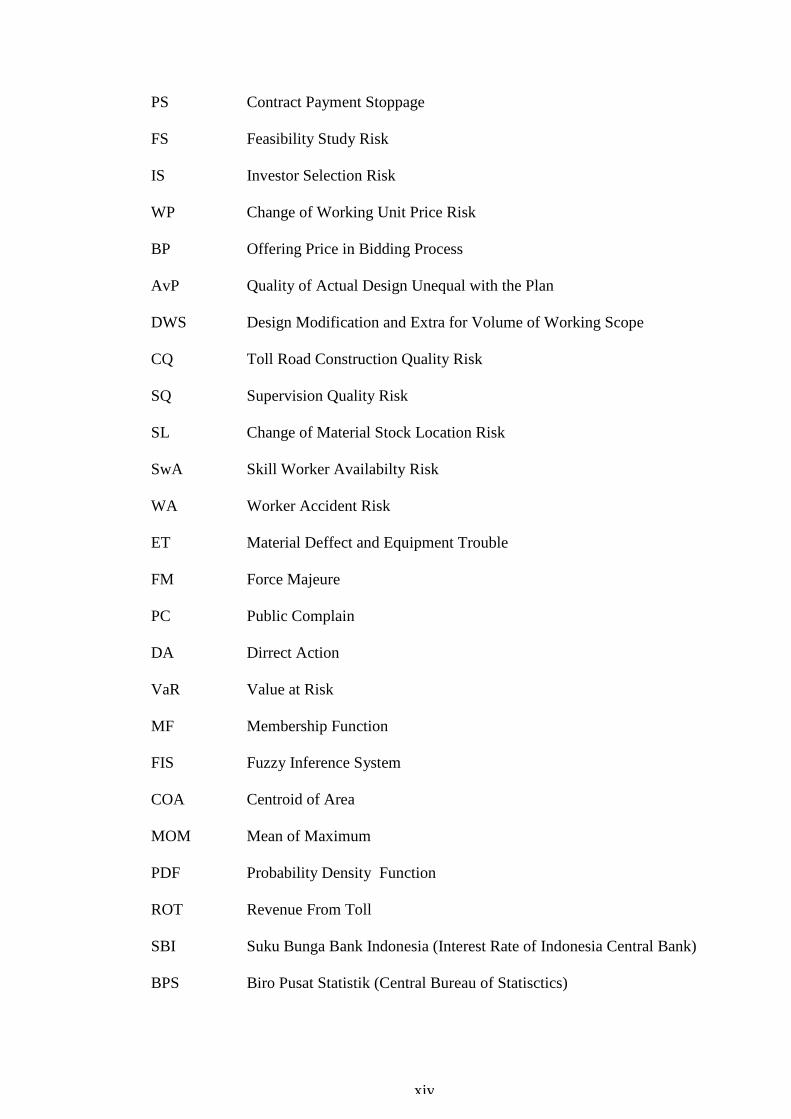
PS Contract Payment Stoppage
FS Feasibility Study Risk
IS Investor Selection Risk
WP Change of Working Unit Price Risk
BP Offering Price in Bidding Process
AvP Quality of Actual Design Unequal with the Plan
DWS Design Modification and Extra for Volume of Working Scope
CQ Toll Road Construction Quality Risk
SQ Supervision Quality Risk
SL Change of Material Stock Location Risk
SwA Skill Worker Availabilty Risk
WA Worker Accident Risk
ET Material Deffect and Equipment Trouble
FM Force Majeure
PC Public Complain
DA Dirrect Action
VaR Value at Risk
MF Membership Function
FIS Fuzzy Inference System
COA Centroid of Area
MOM Mean of Maximum
PDF Probability Density Function
ROT Revenue From Toll
SBI Suku Bunga Bank Indonesia (Interest Rate of Indonesia Central Bank)
BPS Biro Pusat Statistik (Central Bureau of Statisctics)

xv
IDR Indonesian Rupiahs
PPP Public Private Partnership
BOT Build Operate Transfer

xvi
SIMULASI FUZZY-MONTE CARLO UNTUK ANALISIS RISIKO PENILAIAN PROJEK PELABURAN
ABSTRAK
Untuk masa yang lama, memasukkan pengurusan risiko ke dalam rancangan
projek pelaburan telah menjadi kaedah yang popular bagi mengurangkan risiko
pelaburan. Walau bagaimanapun, masih ada masalah dalam analisis risiko, seperti
kesukaran untuk melibatkan risiko-risiko bukan kewangan dalam model ekonomi
untuk menilai projek pelaburan. Salah satu penyelesaian bagi pemodelan
ketidakpastian dan pengetahuan kualitatif adalah menggunakan logik kabur. Oleh itu,
tesis ini mencadangkan simulasi Fuzzy-Monte Carlo yang mampu menghubungkan
risiko kewangan dan bukan kewangan untuk mengunjur kebarangkalian aliran tunai
kumulatif (CCF), nilai kini bersih (NPV) dan kadar pulangan dalaman (IRR).
Dalam mewujudkan pendekatan yang dicadangkan, tesis ini menjalankan dua
kaedah. Pertama, analisis risiko kualitatif untuk mengenal pasti risiko-risiko penting
dengan menggunakan analitik proses hierarki (AHP). Kedua, mencari kesan risiko-
risiko penting bagi keluaran projek pelaburan melalui analisis risiko kuantitatif
dengan simulasi Fuzzy-Monte Carlo. Keluaran fuzzy dan data risiko kewangan
ditentukan dalam pengagihan kebarangkalian yang sesuai sebelum simulasi. Tesis ini
menjalankan simulasi penglibatan risiko dalam model ekonomi satu kajian kes
projek pelaburan bagi keperluan validasi. Keputusan simulasi menunjukkan
kepastian kerugian adalah 75% dengan julat rugi USD0-6,792,500 sebagai data
sebenar CCF pada tahun 2008. Tambahan pula, unjuran NPV dan IRR, dan juga
cadangan untuk perancangan tindakbalas risiko dibentangkan. Keputusan pendekatan
yang dicadangkan mengesahkan objektif penyelidikan ini bagi merapatkan risiko
kewangan dan bukan kewangan dalam analisis risiko penilaian projek pelaburan.
xvii
FUZZY-MONTE CARLO SIMULATION FOR RISK ANALYSIS IN
INVESTMENT PROJECT EVALUATION
ABSTRACT
For a long time, incorporating risk management into the investment project
plan has been a popular method in order to mitigate a risk of the investment.
However, the problem still exists in risk analysis, such as the difficulties to involve
the non-financial risks in an economic model for evaluating the investment project.
One of the solutions for modeling of imprecise and the qualitative knowledge is
employing fuzzy logic. Therefore, this thesis proposes Fuzzy-Monte Carlo
Simulation that is able to bridging the financial and non-financial risk for estimating
the probability of Cumulative Cash Flow (CCF), Net Present Value (NPV) and
Internal Rate of Return (IRR).
In order to realize the proposed solution, this thesis performs two methods.
Firstly, the qualitative risk analysis for identifying significant risks by using Analytic
Hierarchy Process (AHP). Secondly, the quantitative risk analysis to discover the
impact of the significant risks to the investment project output by using Fuzzy-Monte
Carlo Simulation. The fuzzy inference system output and historical data of financial
risks are assigned in appropriate of probability distribution before simulation. The
simulation conducted several scenarios of risk involvement in an economic model of
the case study project for validating our approach. The simulation result shows the
certainty of loss with a range of loss USD0-6,792,500 as actual data of CCF in year
2008 is 75%. Furthermore, the NPV and IRR estimation and also recommendation
for the risk response planning is presented. The results of the proposed solution
validate the objective of this work to bridging the financial and non financial risk for
risk analysis in investment project evaluation.

1
CHAPTER 1
INTRODUCTION
1.1 Background
Investment project is putting money into a project with the expectation of
gain attractive Net Present Value (NPV) and Internal Rate of Return (IRR) through
investment project evaluation (Borgonovo & Peccati, 2004). By deciding to invest in
a project, it means that the company is ready to spend money, time, and other
valuable resources (Sheng, 2008). However, every investment project is surrounded
by uncertainty or risks that potential affecting the project performance such as cost
increase, revenue decrease, and over time. The investment project that has not been
thoroughly analyzed can be highly risky with respect to the owner’s investment due
to the possibility of losing money is not within the owner's control (Ngai & Wat,
2005). Thus, the decision makers in the company have to produce an analysis that
incorporates the risks into the investment project for mitigating these risks that will
affect the project performance (Anthony, 2001; Bannerman, 2008; Finne, 2000).
The process for analyzing the risk or uncertainty factor is referred to risk
analysis. It is employed through the process of exploring all impact of the risks that
adversely affect the output of a project. Risk analysis is the vital connector between
systematic risk identification and realistic significance of risk response (Ngai & Wat,
2005; Zhao, Tong, & Sun, 2009). Indeed, risk analysis technique for an investment
project should consider the involvement risks that are multidimensional. Hastak
(2000) identified three risks levels: country, market and project in the risk assessment
system for international construction project evaluation. Chu (2009) defined the

2
financial and non-financial risks in corporate loan evaluation. Chen et al. (2009)
classified for evaluating information technology investment is under systematic risk
that contains financial markets risks and private risks such as team experience,
project complexity, planning and controlling.
Nonetheless, the risk analysis method that always used in an investment
project evaluation such as probability theory is limited to the financial dimension or
the factors that associated with any form of financing (Chiara & Garvin, 2008).
probability theory has been studied and applied to various areas of evaluation that
perform the economic model of investment decision by using Monte Carlo
Simulation (Hacura, Jadamus-Hacura, & Kocot, 2001). Unfortunately, this
simulation cannot involve the risks those are non-financial variables (Martinez,
2003). In fact, the risk that impact to project can be derived from the non-financial
risks as well. Typically, these non-financial risks are subjective, which were used by
decision makers in preliminary phase of the project life cycle to analyze the impact
of risk. The subjective approach constantly in linguistic term contains ambiguity data
that might lead to inaccurate representation of the uncertainty lack of historical data.
Therefore, a risk analysis which is able to handling the non-financial risks that have a
strong impact to the project performance of the investment project is necessary.
From above circumstances, there are two different conditions for handling the
uncertainty factors in risk analysis of an investment project:
a. The risks in the form of historical data, which is in a financial manner.
b. The non-financial risks, which is subjective or the sufficient historical data is
not available.

3
Fortunately, Fuzzy logic (Zadeh, 1965) provides an approach for handling
linguistic variables and solving processes when have to deal with imprecise,
uncertain and vague data. Fuzzy logic has been widely used because of its obvious
advantages of effectively dealing with uncertainty and capturing experts’ knowledge
on a specific problem and using its knowledge to make decisions. Many applications
of Fuzzy logic have been used successfully in several fields. For example, Bates and
Young (2003) deployed Fuzzy logic for medical decision-making in intensive care
units, predicting industrial construction labour productivity (Fayek & Oduba, 2005)
and cost estimating (Ahmed, Aminah Robinson, & AbouRizk, 2007).
In this research, risk analysis which can handle the financial risk and the non-
financial risk in an investment project is conducted. Hence, the hypothesis in this
thesis is the probabilistic and fuzzy logic approach can be used for risk analysis in an
investment project evaluation.
1.2 Problem Statement
The risk analysis in an investment project evaluation is necessary for
anticipating the possibility of cost increases and revenue decreases. For example, in
public investment project likes a toll road project, Rose (1998) argued that cost
increases, and revenue decreases have been a serious issue in Melbourne-Australia
during the early years of the toll road development program. The monte carlo
simulation is used by Rose (1998) to evaluate the impact of risk to the project output.
The relevant example of cost increases and revenue decreases as a serious issue in
the toll road project is the Chinese highway project (Zayed, Amer, & Pan, 2008). The
AHP is used by Zayed, et.al (2008) for determining the probability of occurrence of

4
various risk factors in the Chinese highway project. Among the many explanations,
unanticipated risks or unmanaged risks are two of the main causes of the cost
increase and revenue decrease in an investment project (Fatih & Cengiz, 2006).
Thus, the presence a correct risk management that consists of risk identification, risk
analysis, and risk response planning for mitigating the risk is required due to the
possibility of cost inincreases,nd revenue decreases always threaten the investment
project (Dey, 2002; Zhao, et al., 2009).
Generally, the risk analysis in investment project evaluation begins with
assessing the range of uncertain variables that influence to the project. The
assessment is attained from historical data and pure subjective judgments. Although
the analyst could get the historical data and expert’s statistics, an amount of
subjective assumptions is needed to be combined with this information for avoiding
the apprehension of not including possible scenarios of risk in evaluating the
attractiveness of the investment project. However, a number of non-financial risks
which are typically subjective are hard to be included in an economic model because
of the linguistic nature. Additionally, these risks are separately analyzed from a
financial risks and force decision-makers to be a subjective decision without taking
into account the overall effects on the project. William (2000) explains that the
decision-makers formulate a preliminary decision based on analysis of the non
financial risk, whether the project meets a certain scoring criterion, or it is simply
discarded. If the project is accepted, a detailed risk analysis of the financial
information is performed with an economic model. Otherwise, if the analysis of the
non financial risk decided that project could not be considered, then the economic
model is not conducted. Due to the separation of both analysis, it is possible that the
5
subjective decision performed at the beginning is inaccurate, reducing the importance
or eliminating the project as an investment opportunity (Jan Emblemsvåg, 2006). In
addition, the economics point of view can provide answers to many questions rather
than a just technical explanation that has no satisfying answer (Bojanc & Jerman-
Blazic, 2008).
The problems have been tried to be solved by bridging the financial and non-
financial risks for risk analysis in an investment project evaluation. For example,
Fatih and Cengiz (2006) consider multidimensional of nature risks in project risk
evaluation. They utilize the AHP as the multi criteria decision-making method that
associate with fuzzy set theory for evaluating project risk based on the heuristic
knowledge of experts. Dey (2010) combined AHP and Risk-Map to manage the
project risk. All of these methods above allow non-financial risk as well as financial
risk in one analysis to be considered in the decision-making process. However, these
methods do not measure the probability of potential loss in a numerical manner and
the divergence of the parameters of investment feasibility such as net present value
(NPV) and internal rate of return (IRR). The measurement actually can be obtained
by conducting an economic analysis (Bojanc & Jerman-Blazic, 2008).
Since the correct representation of uncertain variables highly affects the
reliability of the realistic output of investment project evaluation, having an approach
that can bridge the financial and non-financial risks for risk analysis and able to
conduct the risk management is very necessary for decision making. In this thesis,
Fuzzy-Monte Carlo Simulation (FMCS) for risk analysis is designed to build the
relationship among the financial and non-financial risks and provide the probability

6
of Cumulative Cash Flow (CCF), expected net present value (NPV) and Internal Rate
of Return (IRR) for each scenario of risk involvement with an intention to determine
the properly risk response planning according to the severity level of each risk.
1.3 Research Objectives
With the purpose of dealing to the problems as discussed in Section 1.1 and
1.2, the objectives of this research are specified as follows:
1. To develop a technique for identifying the significant risks that adversely affects
the investment project and an approach that can bridge the financial and non-
financial risks for risk analysis in investment project.
2. To discover the impact of risks on a case study investment project output in a
form of the probability distribution of Cumulative Cash Flow (CCF), Internal
Rate of Return (IRR), and expected Net Present Value (NPV) in order to know
the severity level of each risk and the reliability of the proposed approach.
3. To recommend the risk response planning for mitigating the risk in a case study
investment project according to severity level of each risk impact to the project.
1.4 Thesis Contribution
The main contribution of this thesis is a tool in quantitative risk analysis. This
thesis provides the method that can bridge financial and non-financial risk for
quantitative risk analysis. The major contributions in this thesis are:
a. Simplified mechanism for reducing exaggerates the range of variability of
uncertainties variables with the intention to obtain the significant financial and
non-financial risk by using Analytic Hierarchy Process (AHP).

7
b. Intelligent decision support system that can bridge the financial and non-
financial risks for risk analysis in an investment project by using Fuzzy Logic
and Monte Carlo Simulation.
c. Mathematical model for representing the influence of risk to economic analysis
of an investment project.
1.5 Thesis Outline
This thesis is organized into six chapters. The organization of each chapter is
outlined as follows:
Chapter 1 gives an introduction that corresponds to the main problem in risk
analysis of an investment project. The main problem is deep explored in the problem
statement, and the research objective is also stated in this chapter. At the end of this
chapter, this chapter present the contributions of our thesis with its relation to the
body of knowledge.
Chapter 2 is the literature review on investment project evaluation, describes the
process of investment decision-making, including the project budgeting aspect and
risk management. The literature review is referred to the description of how related
works in risk analysis is currently being performed with the methods that have been
used for evaluating an investment project, including their limitation.
Chapter 3 provide the research methodology, which contains of five main steps such
as problem analysis, comprehensive literature study, the development of a conceptual

8
design of risk analysis for the investment project, the validation of the conceptual
design via a case study of investment project, and performance analysis.
Chapter 4 describes a conceptual design of risk analysis for the investment project.
The design utilizes Fuzzy-Monte Carlo simulation for bridging financial and non-
financial risk factors with the intention to be quantitatively risk analysis.
Furthermore, the relationship between risk and attractiveness parameters of
investment project is discussed. Finally, mathematical model that represents the
relationship between risk impacts with the variables in the economic model is
formulated.
Chapter 5 implements the solution design to one case study project. It provides the
primary and secondary data of the project, including the knowledge acquisition and
mathematical model that represent the influence of financial and non financial risks
to an economic analysis of the case study project. Furthermore, this chapter provides
variable definitions and assumptions for the economic model. Finally, the simulation
scenario is established to measure the severity level of each risk that involve to the
project.
Chapter 6 present results from the simulation of the economic model of a case study
project in terms of probability of cumulative cash flow (CCF) in year 2008, net
present value (NPV) and internal rate of return (IRR). The result of cumulative cash
flow (CCF) in year 2008 is compared with the actual data of the case study project.
Furthermore, this chapter analyzes its forecast result of CCF, NPV and IRR in order
to obtain the severity level of each risk that involves to the project. Finally, the most

9
influence risk based on probability distribution of NPV, and IRR is compared to the
result of empirical study by using Analytic Hierarchy Process. Hence, the risk
response planning for mitigating risk of the case study project can be recommended.
Chapter 7 contains the conclusions, limitations, and recommendation for further
research in this thesis area.
10
CHAPTER 2
LITERATURE REVIEW
This Chapter provides literature review, which related to the risk analysis in
investment project evaluation. It begins with a description of what is the investment
project evaluation in Section 2.1, while the capital investment concept, including the
parameters that considered in the evaluation of investment project attractiveness is
described in Section 2.2. In Section 2.3, the concept of risk management such as
classification of risk, risk identification, risk analysis and risk response planning are
presented. After risk management is introduced, the economic model of an
investment project is discussed in section 2.4. The section that provides some related
works for risk analysis in investment project evaluation is discussed in Section 2.5.
The current issue regarding the risk analysis works is provided in Section 2.6.
Finally, the summary of this chapter will be provided in Section 2.7.
2.1 Investment Project Evaluation
Investment project is a long-term allocation of funds for disbursing project
costs to gain profitable returns in a form of interest, income (dividend), or
appreciation of the value of the project (Agar, 2005; Brennan, Constantinides,
Harris, & Stulz, 2003). According to the field of business management, the
investment decision or capital budgeting is one of the fundamental decisions of
business management which managers estimate will obtain a benefit from disbursing
the investment costs (Sullivan, 2003). The assets might be physical such as buildings,

11
information technology infrastructure or machinery, and intangible assets such as
patents, software, goodwill, which is used to produce streams of revenue.
With regard to evaluation, Rossi et al. (2004) defined that evaluation is a
series of activities incorporate understanding, measurement and assessment to
determine the value of an object. It is either a conscious or tacit process which aims
to establish the value of or the contribution made by a particular situation, and it can
also relate to the determination of worth of an object. Combining the definitions of
investment project and evaluation, investment project evaluation is understood as a
process for judging worth or forecasting the return of an investment project that is
carried out by one or more individuals in a particular organization, with a particular
objective, at a particular phase during a system’s life cycle, using one or more
particular methods (Borgonovo & Peccati, 2004). The understanding is fragmented
by identifying a number of separate, yet interrelated, contextual elements that are
determined based upon the circumstances of a particular situation. Brown (2005)
supported this view by noting that evaluation involves several elements, where all of
which must complement each other. These elements include such as what about what
the subject of the investment project, which aspects about the parameters or
measurement that is used for evaluating investment project attractiveness, when
about the time frame that is used for evaluating an investment project, who about the
people who have a role in investment project evaluation, and how about the
methodologies or tools that will be used for evaluating the investment project.
Before deciding to invest, the manager must verify whether the parameters of
the investment project attractiveness are positive or negative by using the marginal

12
cost of capital involving to that particular area of business. However, investment
comes with the risk of the loss of the principal sum. The investment that has not been
thoroughly analyzed can be highly risky with respect to the investor because the
possibility of losing money is not within the investor control. Therefore, a company
needs to consider the factors which have interdependencies to return of investment,
whether deliver profit or loss before deciding to undertake the project.
Investment project evaluation is conducted in the context of particular
organisational operating units or departments, within specific organisations,
operating under industrial sector and competitive conditions. In light of these
contextual influences, the following related element should be included in investment
project evaluation such as capital investment, parameters for evaluating the project
attractiveness which is measured by the economic model of investment project, and
risk management concept as well.
2.2 Capital Investment
Capital investment is the financial support to cover investment cost and
operational costs of the project (Dimov & Gedajlovic, 2010). With the purpose to
support the investment fund, companies can obtain the capital sourced from the
equity or debt from a bank loan (Agar, 2005). Debt source is obtained by borrowing
from outside of the company likes bank with the principal repaid at a stated interest
rate following a specified time schedule. Debt financing includes borrowing via
bonds, loans, and mortgages. Furthermore, the equity capital is corporate money
which is comprised such as the owner’s funds and retained earnings. Owners’ funds
are further classified as common and preferred stock proceeds or owners’ capital for

13
a private or non-stock-issuing company. Generally, a company combines the equity
capital and debt from a bank loan as the capital structure to disburse the project. The
debt from a bank loan is borrowed due to the unreliability of the equity as single
capital for covering all cost of a project. In addition, the benefit of capital investment
which is debt from a bank loan or obligation can force the aggressiveness of project
management for delivering good project performance in terms of the cost and time
efficiency (Tarquin & Blank, 2002). It is caused by the responsibility of the project
owner as debtors, who have to return not only the loan but also the interest rate of the
bank loan.
In practical, the utilization of these capitals should pay out the cost of capital
(COC). The COC can be used as the parameter to decide whether to accept or to
eliminate the investment in terms of a discount rate beside of evaluating the other
parameters such as net present value (NPV) and internal rate of return (IRR). There
are a lot of main economic parameters for budgeting such as Net Present Value
(NPV), Internal Rate of Return (IRR), Payback Period (PB), and Profitability Index
(PI). The parameters are usually used for project quality estimation, but in practice
they have different importance. It is earnestly shown in Kahraman et al. (2006) and
Bojanc (2008) that the most important parameters are NPV and IRR. Therefore, in
this thesis further consideration will be based only on the analysis of the NPV and
IRR.
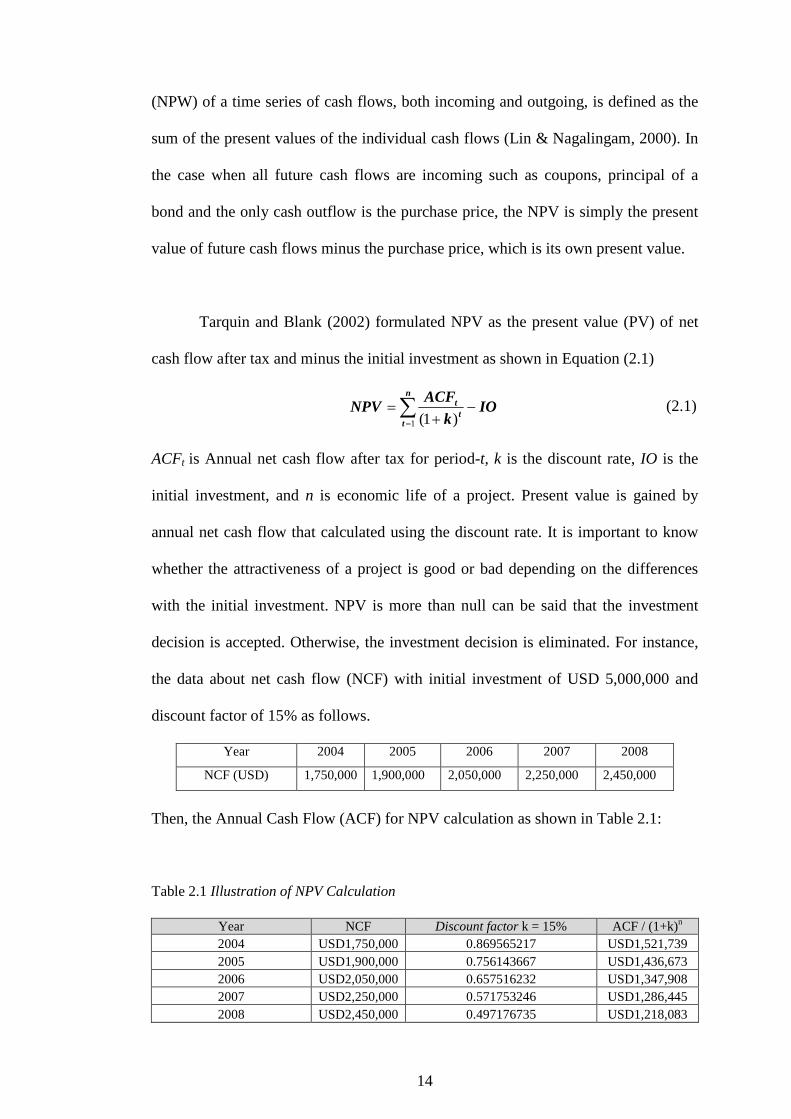
2.2.1 Net Present Value (NPV)
Net present value (NPV) is used to evaluate the profitability and
attractiveness level of an investment project (Bruce, 2003). NPV or net present worth
14
(NPW) of a time series of cash flows, both incoming and outgoing, is defined as the
sum of the present values of the individual cash flows (Lin & Nagalingam, 2000). In
the case when all future cash flows are incoming such as coupons, principal of a
bond and the only cash outflow is the purchase price, the NPV is simply the present
value of future cash flows minus the purchase price, which is its own present value.
Tarquin and Blank (2002) formulated NPV as the present value (PV) of net
cash flow after tax and minus the initial investment as shown in Equation (2.1)
IOk
ACFNPV
n
tt
t -+
= å=1 )1(
(2.1)
ACFt is Annual net cash flow after tax for period-t, k is the discount rate, IO is the
initial investment, and n is economic life of a project. Present value is gained by
annual net cash flow that calculated using the discount rate. It is important to know
whether the attractiveness of a project is good or bad depending on the differences
with the initial investment. NPV is more than null can be said that the investment
decision is accepted. Otherwise, the investment decision is eliminated. For instance,
the data about net cash flow (NCF) with initial investment of USD 5,000,000 and
discount factor of 15% as follows.
Year 2004 2005 2006 2007 2008
NCF (USD) 1,750,000 1,900,000 2,050,000 2,250,000 2,450,000
Then, the Annual Cash Flow (ACF) for NPV calculation as shown in Table 2.1:
Table 2.1 Illustration of NPV Calculation
Year NCF Discount factor k = 15% ACF / (1+k)n 2004 USD1,750,000 0.869565217 USD1,521,739 2005 USD1,900,000 0.756143667 USD1,436,673 2006 USD2,050,000 0.657516232 USD1,347,908 2007 USD2,250,000 0.571753246 USD1,286,445 2008 USD2,450,000 0.497176735 USD1,218,083
15
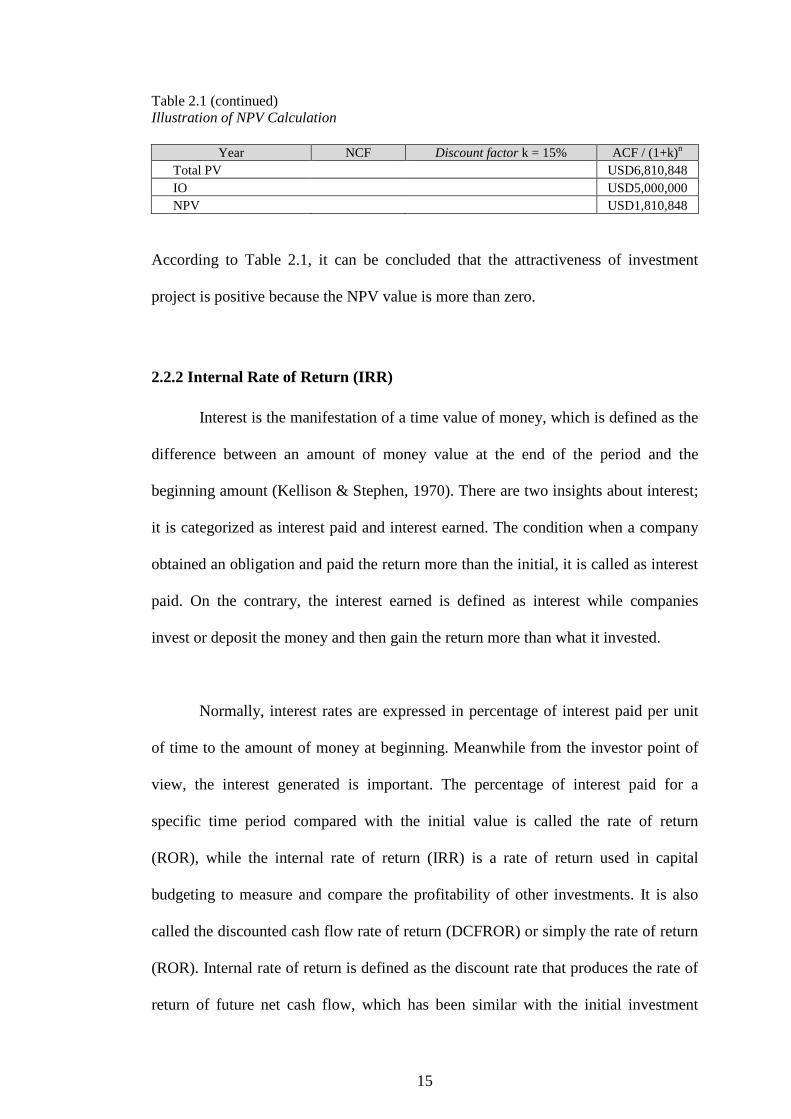
Table 2.1 (continued) Illustration of NPV Calculation
Year NCF Discount factor k = 15% ACF / (1+k)n Total PV USD6,810,848 IO USD5,000,000 NPV USD1,810,848
According to Table 2.1, it can be concluded that the attractiveness of investment
project is positive because the NPV value is more than zero.
2.2.2 Internal Rate of Return (IRR)
Interest is the manifestation of a time value of money, which is defined as the
difference between an amount of money value at the end of the period and the
beginning amount (Kellison & Stephen, 1970). There are two insights about interest;
it is categorized as interest paid and interest earned. The condition when a company
obtained an obligation and paid the return more than the initial, it is called as interest
paid. On the contrary, the interest earned is defined as interest while companies
invest or deposit the money and then gain the return more than what it invested.
Normally, interest rates are expressed in percentage of interest paid per unit
of time to the amount of money at beginning. Meanwhile from the investor point of
view, the interest generated is important. The percentage of interest paid for a
specific time period compared with the initial value is called the rate of return
(ROR), while the internal rate of return (IRR) is a rate of return used in capital
budgeting to measure and compare the profitability of other investments. It is also
called the discounted cash flow rate of return (DCFROR) or simply the rate of return
(ROR). Internal rate of return is defined as the discount rate that produces the rate of
return of future net cash flow, which has been similar with the initial investment

16
(Bruce, 2003). It is frequently used as a first step of the economic analysis to
determine the attractiveness of the project based on an accepted threshold value that
had been established. In the arithmetic manner, IRR is formulated as shown in
Equation (2.2) (Tarquin & Blank, 2002).
å= +
=n
tt
t
IRR
ACFIO
1 )1( (2.2)
ACFt is net cash flow after tax for period-t, IRR is the project internal rate of return,
IO is the initial investment, and n is economic life of a project.
In terms of investment decision criteria, the investment is accepted even if
IRR is equal or more than minimum attractive rate of return (MARR); otherwise, do
not accept the investment. Generally, a company sets the MARR value more than the
rate of return by Bank offering. MARR is determined by the financial management
department, and it is employed as the criteria for selecting which the project that will
be executed according to its rate of return (ROR). There are some steps for
determining the IRR, which are summarized as follows (Tarquin & Blank, 2002):
Step 1: Take randomized the discount rate and utilized it to calculate the present
value of net cash flow.
Step 2: Compare the discount rate in step 1 with the initial investment. If the
present value is similar with the initial investment, it means that the
discount rate in step 1 is its project IRR.
Step 3: Even if the present value of net cash flow is more or less than initial
investment, then scale up or scale down the discount rate which has taken
in step 1
Step 4: Calculate more the present value of net cash flow, and repeat the step 2.

17
The illustration of IRR calculation of variation for annual net cash flow is shown in
Table 2.2.
Table 2.2 Illustration of IRR Calculation
Description Amount Description Amount
Initial Investment -USD 3,817 Net cash flow in year-2 2,000 Net cash flow in year-1 1,000 Net cash flow in year-3 3,000
Completion 1. Test for i = 15%
NCF PV factor for i = 15% Present Value Net cash flow in year-1 1,000 0.870 870 Net cash flow in year-2 2,000 0.756 1,512 Net cash flow in year-3 3,000 0.658 1,974
Total PV 4,356 IO -3,817
2. Test for i = 20% Completion NCF PV factor for i = 20% Present Value
Net cash flow in year-1 1,000 0.833 833 Net cash flow in year-2 2,000 0.694 1,388 Net cash flow in year-3 3,000 0.579 1,737
Total PV 3,958 IO -3,817
3. Test for i = 22% Completion NCF PV factor for i = 22% Present Value
Net cash flow in year-1 1,000 0.820 820 Net cash flow in year-2 2,000 0.672 1,344 Net cash flow in year-3 3,000 0.551 1,653
Total PV 3,817 IO -3,817
According to Table 2.2, it can be concluded that a suitable IRR is 22%. Refer to the
rule; if the IRR of 22% is more than the MARR value, then the investment project is
feasible; otherwise the investment project is eliminated.
2.3 Economic Model of Investment Project
The process that is normally used to gain the important decision variables
such as net present value (NPV), internal rate of return (IRR), and debt service
coverage ratio is with the development an economic model of investment project.
This is referred to revenue model, cash flow model, profit-loss model with simple
annual model that derived into monthly or quarterly figures with all the numerical

18
information needed for calculating the probability of investment project
attractiveness (Ustundag, KilInç, & Cevikcan, 2010).
All the elements that influence the successful completion and profitable
operation of a project including the entire elements that influence the costs, revenues,
and returns of the project must be carefully analyzed. Hence, it is necessary to
construct a computer model, usually through the use of spreadsheet software, to
model and process the comprehensive list of numerical input assumptions and
provide the corresponding output figures that reflect the robustness and profitability
of the project. Generally, the model is built around an agreed base case. Additional
alternatives are then explored to perform sensitivity analysis and find the key
components that most affect the final objective.
The principle of economic models of the project begins as an initial
assessment of project feasibility and then evolves into later uses such as: (i)
determination of the optimum financing structure, (ii) support for ongoing
negotiations or as support of a competitive bidding process, and (iii) preparation of
sensitivity analysis for potential lenders and investor. Finally, the model then
becomes part of the loan agreement and the project documentation.
All economic models are unique to every project, unless the projects which
are very similar. There are no rules or standards governing the economic model form.
However, certain principles are the same with any model if all follow the accounting
principles of the calculation of the internal rate of return and net present value from

19
the expected projects cash flow. The different parts of the economic model use the
common principles such as follows (Bojanc & Jerman-Blazic, 2008).
a. Cover page that consist worksheet including the basic project information.
b. Assumptions that provides a text description of the main variables used in the
model. It is only used for information purpose or reporting
c. Key Inputs that includes all the manually input variables and switches that are
changed to perform different scenarios and sensitivity analysis. This part should
include timeline data, capital cost data, finance data, operating data, tax and
accounting data, and legal and administrative fees.
d. Key Results, which is created only for the purpose of showing the results of the
analysis such as Debt Coverage Ratios, Internal Rate of Return, Net Present
Value, Cash Flow and Book Income summaries
e. Capital Budget includes the costs from the development phase and the production
of construction or establishment phase. It also should include some minor
Operation and Maintenance costs
f. Draw Schedules that shows the cash outflow during the development and
construction phases, including the debt payments
g. Financing that includes all the information related to the financing and tax
projects. The terms of the short-term loan and the long-term loan
h. Debt Schedules that shows the calculation of the debt payments for all the
different loans according to their financing terms
i. Operating Assumptions that includes all the information associated with the
calculation of the expected output of the project; available capacity of the project
for its economic life; calculations of the estimated outputs that will be produced;
and fuel cost calculations. This worksheet is related to the long-term market

20
analysis of the country. At the end, it should calculate the Operating Revenues
for the estimated life of the project
j. Operating Expenses that includes a schedule of the estimated operating expenses
for the economic life of the project
k. Escalation Depreciation, which is developed for the calculation of the
corresponding depreciation of the equipment used in the project
l. Projections, which is an important thing in the economic model. It shows the
complete Cash Flow of the project, including the revenues, expenses, taxes, debt
service, and finally, the calculation of the Internal Rate of Return and Net Present
Value
2.4 Risk Management Concept
The risk is considered as a deviation from the project plan that may occur
unexpectedly. Although an activity or business is well planned, there is still
containing uncertainties, whether it will be run according to plan or not. It does not
matter how different or unique a project is; no doubt that every project contains some
degree of uncertainty and there is no risk-free project (Kaidi, Jimei, & Yanjun, 2009;
Tah & Carr, 2000). In terms of business side, the risks are managed to make sure that
the activities undertaken will benefit and there is no obstacle that causes the activity
ceased. The following section will describe the definition for the risk and the process
that include in the risk management.
2.4.1 Definition of Risk
Risk is the potential that a chosen action or activity (including the choice of
inaction) will lead to a loss (an undesirable outcome). There are two components in

21
risk (Anli & Cunbin, 2007) : (1) probability or likelihood of failed to reach a
particular outcome and (2) consequence or effect of failed to achieve the result. The
probability and consequence of risk should clearly determine to avoid the confusion
result in risk assessment. Other factors that may significantly help the emergence of
risk such as frequency of occurrence, time sensitivity, and dependence with the
appearance of other risks can also be used directly or indirectly in the risk ranking
methodology.
In the project point of view, risk is an uncertain event or condition which has
a positive or negative effect on project objectives (Galasyuk & Galasyuk, 2007).
Risk refers to the factors that produce the possibility of an objective project cannot
be achieved. Fortunately, some risks can be anticipated and controlled. Thus, risk
management should be an integral part of project management throughout the project
cycle. Conceptually, the risk for each event can be defined as a function of the
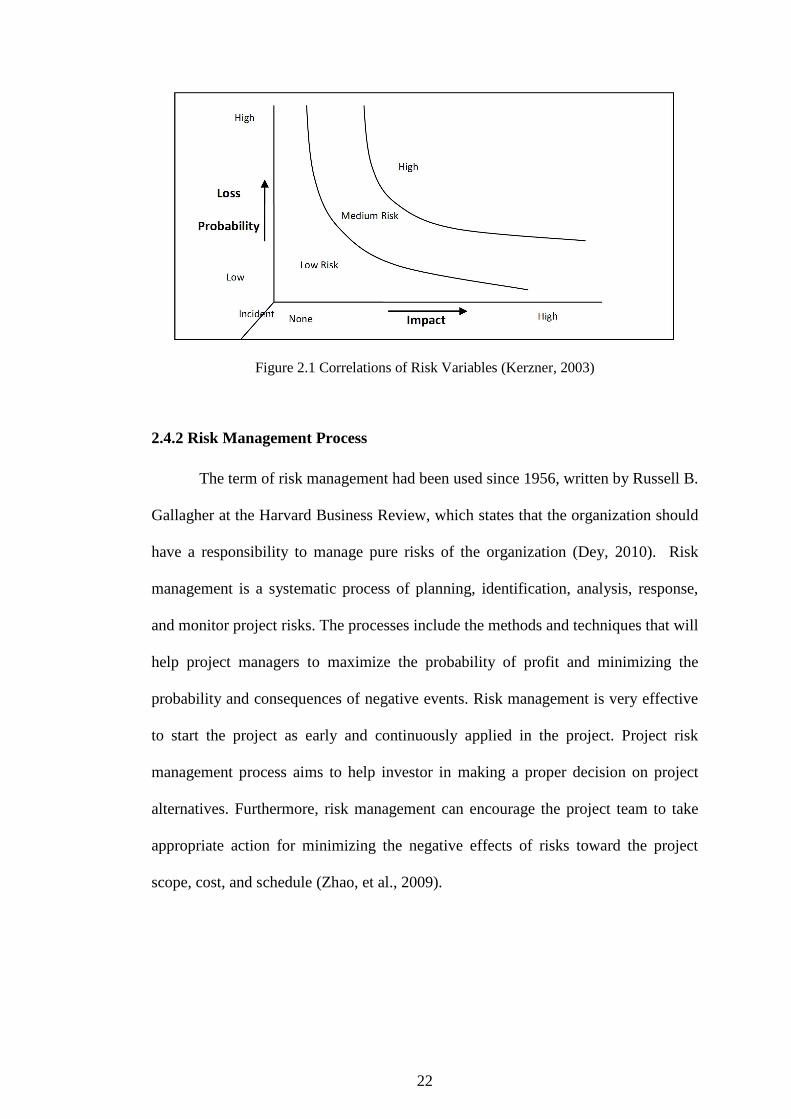
probability (likelihood) and consequences (impact). It s defined as follows.
Risk = f (probability, impact) (2.3)
In general, if the possibility or consequences increases then the risk will increase.
The correlation of risk variables is shown in Figure 2.1. Hence, both of them should
be considered in risk management.
22
Figure 2.1 Correlations of Risk Variables (Kerzner, 2003)
2.4.2 Risk Management Process
The term of risk management had been used since 1956, written by Russell B.
Gallagher at the Harvard Business Review, which states that the organization should
have a responsibility to manage pure risks of the organization (Dey, 2010). Risk
management is a systematic process of planning, identification, analysis, response,
and monitor project risks. The processes include the methods and techniques that will
help project managers to maximize the probability of profit and minimizing the
probability and consequences of negative events. Risk management is very effective
to start the project as early and continuously applied in the project. Project risk
management process aims to help investor in making a proper decision on project
alternatives. Furthermore, risk management can encourage the project team to take
appropriate action for minimizing the negative effects of risks toward the project
scope, cost, and schedule (Zhao, et al., 2009).
23
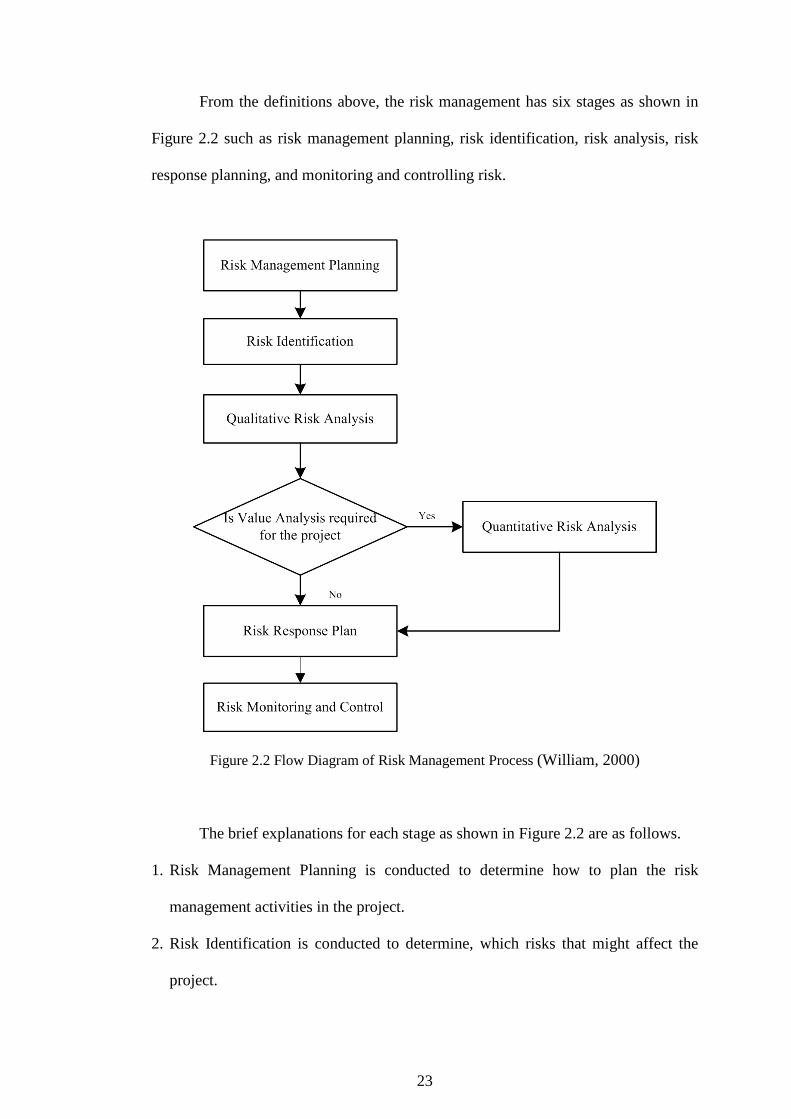
From the definitions above, the risk management has six stages as shown in
Figure 2.2 such as risk management planning, risk identification, risk analysis, risk
response planning, and monitoring and controlling risk.
Figure 2.2 Flow Diagram of Risk Management Process (William, 2000)
The brief explanations for each stage as shown in Figure 2.2 are as follows.
1. Risk Management Planning is conducted to determine how to plan the risk
management activities in the project.
2. Risk Identification is conducted to determine, which risks that might affect the
project.

24
3. Qualitative risk Analysis is conducted to develop qualitative analysis for
prioritizing the risks based on their effects to project objectives.
4. Quantitative risk Analysis is conducted to measure the likelihood and
consequences of the risk include calculating the implications to project objectives.
5. Risk Response Planning is conducted to develop procedures and techniques for
enhancing the opportunities and reduce threats to project objectives.
6. Risk Monitoring and Control is conducted to monitor the remaining risks,
identifying new risks, implement a plan to response the risk, and evaluate their
effect on the overall project time plan.
In the next sections, the stages of risk management processes are explained one by
one.
2.4.3 Risk Management Planning
Risk management planning is an activity that continues to repeat and embrace
the whole process of risk management that consist of identify, analyze, handle,
monitor and well-organized the document of risks that associated with the project.
Important outcome of the planning process is the risk management plan (RMP).
Since all projects involve some degree of risk, a project risk management planning is
necessary to define and document the procedures that will be used to manage risk
throughout the life of the project. The procedure used to manage risks is defined in
the planning stage, documented in the project risk management plan, and then
executed through the life of the project.
In risk management planning, the program manager should specify who is
responsible for managing the different areas of risk, how risks will be tracked


