FERRUM CRESCENT LIMITED (Incorporated and registered in Australia and registered as an external company in the Republic of South Africa) (Registration number A.C.N. 097 532 137) (External company registration number 2011/116305/10) Share code on the ASX: FCR Share code on AIM: FCR Share code on the JSE: FCR Australian ISIN: AU000000WRL8 South African ISIN: AU000000FCR2 Ferrum Crescent Limited ("Ferrum Crescent", the "Company" or the "Group") (ASX: FCR, AIM: FCR, JSE: FCR) 30 September 2016 Final Results for the Year Ended 30 June 2016 Ferrum Crescent Limited, the ASX, AIM and JSE quoted iron ore developer in Northern South Africa, today announces its final results for the year ended 30 June 2016. These will be posted to Shareholders in due course. A pdf copy of the full Accounts is available as a link to this announcement and on the Company’s website (www.ferrumcrescent.com) . Commenting on the final results Justin Tooth, Executive Chairman said: “2016 has been a key period for resetting Ferrum Crescent to be able to build real value for shareholders. The Company has seen a significant restructure in how it is operated, costs have been cut back and new skills made available to the Group. After careful review an option was signed on a suite of lead zinc assets in Spain that bring a significant pre-existing data package on projects in a strong performing commodity, in a politically stable region. I am also pleased with the work we have done on Moonlight and I look forward to announcing more new to the market from both of our projects, following the Boards decision to exercise the Spanish option and mobilisation to site about to begin.” For further information on the Company, please visit www.ferrumcrescent.com or contact: Ferrum Crescent Limited Justin Tooth, Executive Chairman Grant Button, Company Secretary T: +61 8 9474 2995 UK enquiries: Laurence Read (UK representative) T: +44 7557 672 432
Transcript
FERRUM CRESCENT LIMITED (Incorporated and registered in Australia and registered as an external company in the Republic of South Africa) (Registration number ACN 097 532 137) (External company registration number 201111630510) Share code on the ASX FCR Share code on AIM FCR Share code on the JSE FCR Australian ISIN AU000000WRL8 South African ISIN AU000000FCR2
Ferrum Crescent Limited
(Ferrum Crescent the Company or the Group)
(ASX FCR AIM FCR JSE FCR) 30 September 2016
Final Results for the Year Ended 30 June 2016
Ferrum Crescent Limited the ASX AIM and JSE quoted iron ore developer in Northern South Africa today announces its final results for the year ended 30 June
2016 These will be posted to Shareholders in due course
A pdf copy of the full Accounts is available as a link to this announcement and on the Companyrsquos website (wwwferrumcrescentcom)
Commenting on the final results Justin Tooth Executive Chairman said ldquo2016 has been a key period for resetting Ferrum Crescent to be able to build real value for shareholders The Company has seen a significant restructure in how it is operated costs have been cut back and new skills made available to the Group After careful review an option was signed on a suite of lead zinc assets in Spain that bring a significant pre-existing data package on projects in a strong performing commodity in a politically stable region I am also pleased with the work we have done on Moonlight and I look forward to announcing more new to the market from both of our projects following the Boards decision to exercise the Spanish option and mobilisation to site about to beginrdquo For further information on the Company please visit wwwferrumcrescentcom or contact Ferrum Crescent Limited
Justin Tooth Executive Chairman Grant Button Company Secretary T +61 8 9474 2995
UK enquiries
Laurence Read (UK representative) T +44 7557 672 432
Elliot Hance T +44 (0)20 7382 8300 Bravura Capital (Pty) Ltd (JSE Sponsor)
Doneacute Hattingh T (direct) +27 11 459 5037
The directors accept full responsibility for the information contained in this announcement The auditorrsquos unqualified report is available for inspection at the Companyrsquos registered office in Australia and at the Companyrsquos office at Block B Regent Hill Office Park cnr Leslie amp Turley Rds Lonehill 2062 for 28 business days from release of this announcement Extracts from the Companyrsquos Full audited Report and Accounts are set out below Introduction to the Group Ferrum Crescent Limited (ldquoFerrumrdquo ldquoFCRrdquo or the ldquoCompanyrdquo) is an Australian company listed on the Australian Securities Exchange (ASX FCR) and on the JSE Limited (JSE FCR) and quoted on the AIM market of the London Stock Exchange plc (AIM FCR) Review of operations and activities Ferrum seeks to capitalise on the future demand for high quality iron products worldwide by producing a premium material that can be used in the manufacture of steel in electric arc furnaces The Moonlight Deposit (upon which the Moonlight Project is based) is a magnetite deposit located on the farms Moonlight Gouda Fontein and Julietta in Limpopo Province in the north of South Africa (see Figure 2) and is the main operational focus for the Company Iron and Steel Industrial Corporation (South Africa) (ldquoIscorrdquo) which explored the Project in the 1980s and lsquo90s reported mineralisation capable of producing a concentrate grading at 687 iron At that time Iscor concluded that the deposit which was described as comparable to the worlds best was easily mineable due to its low waste-to-ore ratio The beneficiation attributes of Moonlight ore are extremely impressive with low-intensity magnetic separation considered suitable for optimum concentration Metallurgical tests on Moonlight material undertaken since then by Ferrum suggest that Iscors results are conservative that good metal recoveries can be achieved and that the resulting concentrates have a high iron content and only negligible impurities Grind sizes of between 125 to 250 microns produces recoveries of 42-45 and grades of 68-70 Fe Importantly the Moonlight material should be amenable to the manufacture of direct reduction (ldquoDRrdquo) grade iron pellets which are in high demand by modern steel manufacturers
Various key components of a BFS have already been concluded on the Project with significant milestones achieved to date including
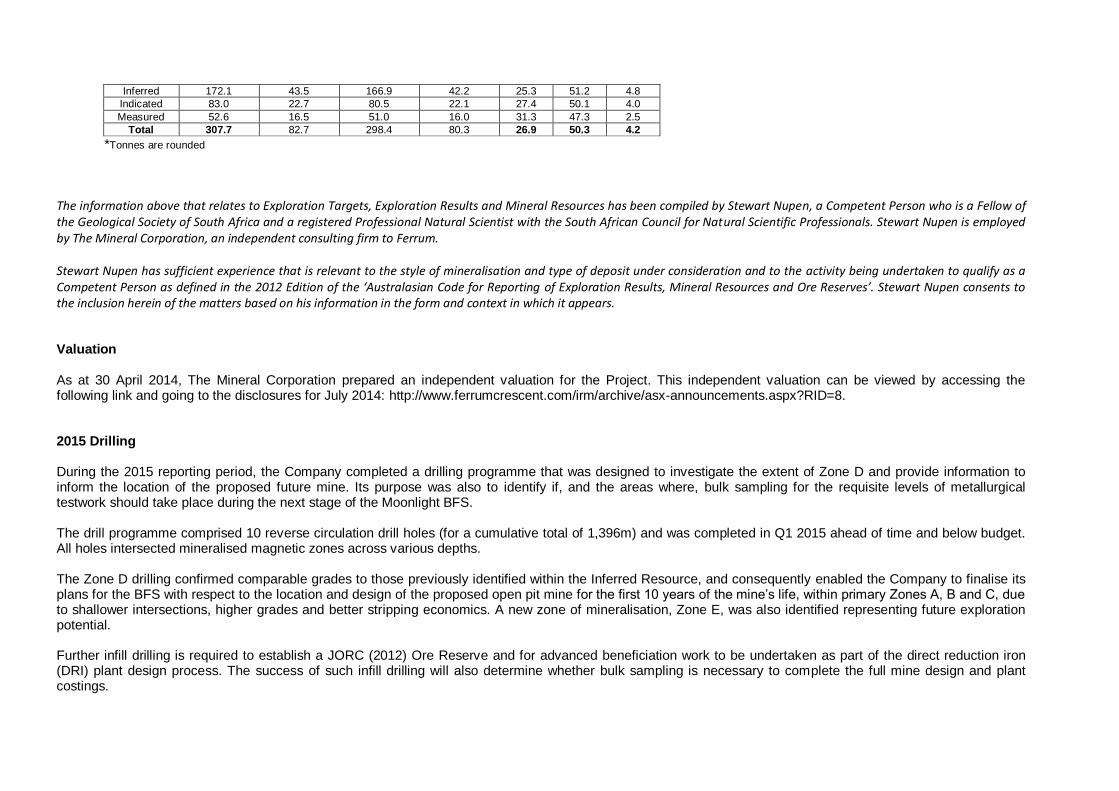
Definition and reporting of an independent JORC Code (2012) compliant Mineral Resource estimate of 3077Mt at 269 Fe of which the Inferred category is estimated to contain 1721Mt at 253 Fe the Indicated - 83Mt at 274 Fe and Measured - 526Mt at 313 Fe (May 2012)
30 year Mining Right granted
Environmental licence (EIA) in place for the Moonlight Project mining area (approved 4 April 2013)
Metallurgical test work indicates high quality product in excess of 69 iron and low deleterious elements possible
The Company is now seeking to progress the BFS work which will focus on the initial production of high grade magnetite concentrate in order to accelerate the projectrsquos production schedule As a potential producer of a high-grade iron ore product the final assessment of Moonlightrsquos capability to operate and process ore at an industrial scale is all important Metallurgists continue to work closely with geologists to identify key areas for representative sample selection for advanced metallurgical testing including a pilot test work programme Immediate test work will focus on optimising grind size vs iron recovery Future work will also focus on optimising the pelletising process including an assessment of temperature profiling and treatment times
Work to date on mine planning has been based on a contract mining model for site development overburden removal and general open pit mining activities A low stripping ratio is expected 115 during the early years of operations (relatively shallow dips with occurrence of up to 4 magnetite-bearing zones)
Feasibility study requirements that still need to be completed include
geotechnical drilling (part complete) mine design mine reserve estimation based on certain cut-off estimates and economic criteria and a final estimate of mining costs from an adjudicated tender process for contract mining
finalising pipeline route for environmental impact study completion
optimising pipeline design and costing (finalising rheology density and particle size distribution)
finalising negotiations with Eskom (power) for capital costs and tariffs once miningprocess demandschedules are finalised for the anticipated 50-60MW needed for concentrate production and
finalising negotiations with Transnet (rail and port) for planning and costing of loading unloading facilities wagon and locomotive requirements and port handling and storage costs Transnet will need to review the Projectrsquos infrastructure requirements as part of the feasibility component and finalisation of commercial arrangements and an appropriate area and connection at the port (Richards Bay) will need to be secured by the Company
Moonlight Project Concept Recognising that adding value within the country is a strategic preference for all mining operations within South Africa Ferrum has consistently planned for beneficiation and other value-adding processes to take place within the country Project concepts have previously included the production of pig iron at or near the Moonlight site However the Company now believes that the initial development concept for the Project is likely to involve mining at site and the production of an iron ore concentrate for transportation via a slurry pipeline to a dewatering and loading facility to be located in Thabazimbi The high grade product would initially be sold to the domestic market To this end Ferrum has received a Letter of Intent (ldquoLOIrdquo) for production offtake Future studies will also assess the requirements for the production of pellets and other agglomerated products for use in steel making Several future pelletiser sites and rail and port combinations have been considered and the Company has continued to seek confirmation from infrastructure providers (including rail port and power suppliers) of an allocation of future capacity for the Company During the 2012 financial year the South African Government announced that significant capital would be applied in upgrading the rail and port facilities that service the Waterberg Region which is close to where the Moonlight Deposit is situated These planned upgrades are strategically necessary to unlock the value of the Waterberg Region where the countryrsquos most significant remaining coal reserves are situated Accordingly rail power water and port facilities are all being upgraded as a matter of national priority Proposed Rail Upgrades to Waterberg Coal Sources
Figure 3 below contains a map showing the planned upgrades to the existing rail infrastructures considered to be the most likely to be used for the Moonlight Project The proposed loading facility would be situated near to the Thabazimbi railhead and export product would be railed to Richards Bay for shipping to customers in the Middle East and elsewhere During a recent meeting with Transnet it was agreed to continue to hold regular meetings in order to monitor progress on the rail infrastructure expansion project and for Ferrum to advise status of the proposed commencement of production at Moonlight
In June 2011 the Company entered into an offtake agreement with Swiss based Duferco SA a leading private company involved in the trading mining and end use of iron and steel products and raw materials for the steel industry Following due diligence on the mineral assets of the Company Duferco concluded that the Group should be able to produce direct reduction andor blast furnace pellets equal to or better than current world class product The offtake agreement with Duferco covers up to 6 Mpta of anticipated future iron ore pellet production from the Project Under the agreement Ferrum will sell Duferco all of its production available for export (in total 45 Mpta) and will give Duferco a right of first refusal over an additional 15 Mt per annum
In June 2015 South Africarsquos competition authorities approved with certain conditions a merger between Chinarsquos Hebei Iron and Steel Group Co and Duferco International Trading Holding which has certain subsidiaries in South Africa This transaction is not expected to affect the Companyrsquos pre-existing offtake agreement Environmental EIAs are currently being prepared for certain aspects of the Project including pipeline route and a product handling facility at Thabazimbi Environmental approvals are already in place in respect of all mining activities
Geology and Mineral Resources The Mineral Resources are currently located entirely on the farm Moonlight 111LR with significant potential for future expansion of the existing resource base within the Project area once all current work streams have been financed and completed In 2014 Mineral Corporation Consultancy Pty Ltd (ldquoThe Mineral Corporationrdquo) undertook an update of the Projectrsquos Mineral Resource estimate to the requirements of JORC (2012) having previously been reported in accordance with JORC (2004) It determined that the Mineral Resource classification criteria imposed in deriving the previous estimate were still valid Furthermore the additional reporting requirements contained in JORC (2012) have been fully complied with in its updated independent Mineral Resource estimate report Figure 4 Moonlight Deposit Geological Plan Link The Project has been explored in the past by Kumba Iron Ore Limited (KIOL) and more recently by the Company Drilling data from KIOL and three phases of Ferrum exploration inform the estimate The drilling comprised open-hole percussion reverse circulation (RC) percussion and diamond core drilling and was all drilled in a vertical orientation
A total of 122 RC holes and 89 diamond core holes were employed in the Mineral Resource estimate The Mineral Resource estimate is provided in the table below and the Mineral Resource estimation criteria as required in JORC (2012) and in Section 582 of the ASX Listing Rules are available on the following link wwwjorcdocsJORC_code_2012pdf
Category Mineral Resource Gross Mineral Resource Net (attributable to Ferrum
Crescent at 97)
Mineral Resource Grade
Tonne (Mt) Contained Fe (Mt)
Tonne (Mt) Contained Fe (Mt)
Fe () SiO2
() Al2O3 ()
Inferred 1721 435 1669 422 253 512 48
Indicated 830 227 805 221 274 501 40
Measured 526 165 510 160 313 473 25
Total 3077 827 2984 803 269 503 42
Tonnes are rounded
The information above that relates to Exploration Targets Exploration Results and Mineral Resources has been compiled by Stewart Nupen a Competent Person who is a Fellow of the Geological Society of South Africa and a registered Professional Natural Scientist with the South African Council for Natural Scientific Professionals Stewart Nupen is employed by The Mineral Corporation an independent consulting firm to Ferrum Stewart Nupen has sufficient experience that is relevant to the style of mineralisation and type of deposit under consideration and to the activity being undertaken to qualify as a Competent Person as defined in the 2012 Edition of the lsquoAustralasian Code for Reporting of Exploration Results Mineral Resources and Ore Reservesrsquo Stewart Nupen consents to the inclusion herein of the matters based on his information in the form and context in which it appears Valuation As at 30 April 2014 The Mineral Corporation prepared an independent valuation for the Project This independent valuation can be viewed by accessing the following link and going to the disclosures for July 2014 httpwwwferrumcrescentcomirmarchiveasx-announcementsaspxRID=8 2015 Drilling During the 2015 reporting period the Company completed a drilling programme that was designed to investigate the extent of Zone D and provide information to inform the location of the proposed future mine Its purpose was also to identify if and the areas where bulk sampling for the requisite levels of metallurgical testwork should take place during the next stage of the Moonlight BFS The drill programme comprised 10 reverse circulation drill holes (for a cumulative total of 1396m) and was completed in Q1 2015 ahead of time and below budget All holes intersected mineralised magnetic zones across various depths The Zone D drilling confirmed comparable grades to those previously identified within the Inferred Resource and consequently enabled the Company to finalise its plans for the BFS with respect to the location and design of the proposed open pit mine for the first 10 years of the minersquos life within primary Zones A B and C due to shallower intersections higher grades and better stripping economics A new zone of mineralisation Zone E was also identified representing future exploration potential Further infill drilling is required to establish a JORC (2012) Ore Reserve and for advanced beneficiation work to be undertaken as part of the direct reduction iron (DRI) plant design process The success of such infill drilling will also determine whether bulk sampling is necessary to complete the full mine design and plant costings
Following the future completion of all mine plan plant design and processing assessments the final stage of the BFS can then be progressed utilising the stand-alone project economics to establish optimal infrastructure agreements with the relevant local government agencies Infrastructure Ongoing planning discussions related to future infrastructure requirements which include rail facilities power and water have continued between the Company and South African infrastructure providers during the reporting period An LOI has been concluded whereby the final product will be sold in Thabazimbi to a local manufacturer which will greatly reduce the Companyrsquos reliance on rail to Richards Bay Community The Company has signed a Memorandum of Agreement with the Lephalale Local Municipality (ldquoLLMrdquo) The agreement defines the Companyrsquos role in assisting the local communities The Company will assist in skills development water scheme planning and developing select students to reach their full potential for future employment at the mine The Company will also participate in the Mayors Bursary scheme for 2016 school leavers LLM in turn is assisting the Company in obtaining historical geological information related to the Moonlight Project LLM will also assist the Company with any talks with foreign investors and demonstrate their commitment to the project as well as assisting the Company with all key stakeholders and service providers Meetings are held on a monthly basis with the Companyrsquos neighbouring communities the Ga Seleka and Ga Shonguane communities Project Schedule
The following are significant factors with respect to the advancement of the Moonlight Project
subject to funding the BFS can be completed within approximately 18-24 monthsrsquo work-time
30 to 36 month mine construction period currently envisaged
Projectrsquos schedule coincides with the South African Governmentrsquos infrastructure development plans and
Completion of the BFS is currently expected to cost approximately AUD12 ndash 14M Corporate On 16 July 2015 the Company announced an update in respect of the first funding payment due under the BFS financing agreement with Principle Monarchy Investments (Proprietary) Limited (ldquoPMIrdquo) for the development of the Moonlight Iron Ore Project in Limpopo Province South Africa PMI advised the Company that it had secured funds for the first R2M payment that was to be paid to the Company under the terms of the Memorandum of Understanding (ldquoMOUrdquo) signed on 5 May 2015
On 21 July 2015 PMI advised the Company that PMI had concluded a financing agreement which would enable PMI to fulfil all of its immediate commitments under the BFS financing agreement for the advancement of the project On 22 July 2015 the Company advised that an investing group had initially allocated funds to PMI in order to enable it to work with the Company over a 12 month period The Company emphasised to PMI that the scheduled first payment of R2M was still overdue and that the Company awaited access to the funding from PMI in order to advance the work on the BFS Operationally the Company announced that Hatch Goba had formally agreed to be engaged as the lead study consultant once funding had been received from PMI On 14 October 2015 the Company announced that the previously announced MOU with PMI to provide financing for the BFS for up to a 39 interest in Ferrum Iron Ore (Pty) Ltd (ldquoFIOrdquo) had been formally terminated with no scheduled payments having been received from PMI On 14 October 2015 the Company also announced that a BFS Farm-In Agreement had been concluded with Business Venture Investments No1709 (Proprietary) Limited (ldquoBVIrdquo) to form a joint venture for the completion of the bankable feasibility study (ldquoBFSrdquo) for the Moonlight Iron Ore Project The comprehensive Farm-In Agreement provides for the completion of all the requisite BFS workstreams to produce a full BFS on the project to a fixed timeline to be funded by BVI in return for up to a 43 equity interest in FIO the owner of the Moonlight Iron Ore Project The Farm-In Agreement is to be undertaken in two phases Phase 1 will cover a study on the best short term business case model based upon technical financial and committed domestic offtake details BVI is responsible for completing this study within 12 months Upon satisfactory completion of Phase 1 BVI will be entitled to 14 equity in FIO The Company may however elect (but is not obligated) to contribute R83M to reduce the equity interest of BVI to 10 A Shareholders Agreement is intended to be entered into and become effective after the completion of Phase 1 Phase 2 will commence upon satisfactory completion of Phase 1 and BVI will be afforded a total of 24 months in which to complete a full study on the best short term business case defined during Phase 1 Phase 2 will be carried out to a standard and include all matters required by international project and equity financiers including without limitation certain detailed deliverables agreed with the Company Upon satisfactory completion of Phase 2 BVI will earn a further 29 equity interest in FIO Should BVI not complete Phase 2 it will have earnt no further equity in FIO apart from that earnt in respect of completing Phase 1 On 14 January 2016 the Company announced that it had agreed with BVI to extend the timeline for completion of Phase 1 of the BFS by 3 months to 12 January 2017 This extension was in order for BVI to finalise the appointment of an internationally reputable engineering firm to manage the BFS On 16 February 2016 the Company announced that it had entered into an exclusive option and sale agreement for a staged option fee of up to GBP22500 with TH Crestgate GmbH (ldquoCrestgaterdquo) a private Swiss-based company to potentially acquire 100 per cent of its indirect wholly-owned subsidiary GoldQuest Iberica SL (ldquoGoldQuestrdquo) a private company incorporated in Spain which owns 100 percent of two lead-zinc exploration projects in the provinces of Leoacuten and Galicia in historic Spanish mining areas (ldquothe Iberian Projectsrdquo) to enable the Company to conduct due diligence on both GoldQuest and the Iberian Projects The exclusive option was valid until 31 July 2016 and if exercised the aggregate consideration payable for GoldQuest was approximately GBP465000 to be satisfied partly in cash (approximately GBP320000) and partly by the issue of 100000000 new ordinary shares in the capital of the Company The option was exercisable entirely at the Companyrsquos discretion (refer to note11 for the investment as at 30 June 2016) On 25 February 2016 the Company announced that it had received applications to subscribe for 149681797 new ordinary shares of no par value each at a price of GBP00012 per share to raise GBP 179618 before expenses Following admission the share capital of the Company comprised 772985191 ordinary shares
On 31 March 2016 the Company announced a strategic update and corporate restructuring focused on generating value from the Grouprsquos principal iron ore project in northern South Africa and the development of its value-accretive business model progressing initially with its option over the abovementioned Spanish lead-zinc projects (via the potential acquisition of GoldQuest The following Board changes were implemented Mr Justin Tooth assumed the role of Executive Chairman and Managing Director from his previous non-executive role Dr Evan Kirby joined the Board as a Non-Executive Director Mr Merlin Marr-Johnson was appointed as an adviser to the Board to assist with the progression of the potential Spanish lead-zinc projects Mr Tom Revy who was the Managing Director resigned Mr Bob Hair who was the Company Secretary resigned and Mr Grant Button an existing Non-Executive Director assumed the duties of Company Secretary On 12 April 2016 the Company announced that its comprehensive due diligence investigations on GoldQuest and the Iberian Projects had been completed The licences in respect of the Iberian Projects had been renewed for a further period of twelve months by the Government of Leoacuten further to the fulfilment of a basic work programme at the two sites On 27 April 2016 the Company announced that it had conditionally raised in aggregate GBP650000 before expenses through a placement via Beaufort Securities Limited (ldquoBeaufortrdquo) its agent a total of 403846154 new ordinary shares of no par value each and a direct subscription of 96153846 new ordinary shares both at a price of 013 pence per new ordinary share As part of the placement and subscription each investor was offered options on the basis of one option for every share subscribed pursuant to the placement and subscription Each option entitles the holder to subscribe for a further new ordinary share at a price of 0165 pence per share for an exercise period of two years from the date of admission of the abovementioned placing and subscription shares In addition the Company announced that it was issuing in aggregate a further 9807692 new ordinary shares in settlement of certain fees comprising 4807692 new ordinary shares to Beaufort at a deemed issue price of 013 pence per new ordinary share in settlement of Beaufortrsquos corporate brokering services of GBP6250 and 5000000 new ordinary shares to Crestgate at a deemed issue price of 013 pence in connection with the extension of certain escrow arrangements under the terms of the Companyrsquos option and sale agreement in respect of GoldQuest Following admission of a of the aforementioned new ordinary shares the total issued ordinary share capital of the Company was 1282791883 ordinary shares On 15 June 2016 the Company announced a corporate and operational update stating inter alia that
- the Board was actively evaluating engineering pathways for alternate production routes based on existing technologies and modelled on current equipment types which are in use at comparable mining operations including examining lower cost capex development options with potential partners utilising alternative methods for the transportation of concentrate rather than a pipeline
- discussions were being held with new potential off-take partners for the supply of concentrate
- the Company was seeking to recover certain third party historic geological data and core samples on both the Julietta and Moonlight licence areas
- that a Memorandum of Agreement and co-operation framework (ldquoMoArdquo) had been signed with the Mayor of the Lephalale Municipality situated in the Waterberg District of the Limpopo Province which serves to secure the necessary consents from local stakeholders for progression of the project into future development and
- that the Companyrsquos planned work programme to determine the extent of the mineralisation on the Iberian Projects was expected to commence shortly after the completion of the acquisition of GoldQuest
Option over Lead-Zinc Exploration Projects Spain On 16th February 2016 Ferrum Crescent entered into an Option to potentially acquire 100 per cent of GoldQuest Iberica SL (GoldQuest) GoldQuest a private company incorporated in Spain owns 100 per cent of two lead-zinc exploration projects (Toral and Lago) in the provinces of Leόn and Galicia in historic Spanish mining areas (the Iberian Projects) Further to an initial analysis of the Toral Projects assets the Company secured the Option to acquire GoldQuest for the following principal reasons middot The Board believes that analysis of the results from 42km of historic drilling together with limited additional exploration work can readily advance the Toral
Project middot Establishment of enhanced resource estimate and process recovery is considered to be highly feasible middot The Toral Projects asset is open to major reinterpretation The Board believes that the scale of the asset has been substantially underestimated previously and
will seek to re-examine the geological model The Toral Project area has historically been assessed as containing a single tabular zone of mineralisation at depths of 300-500m below surface Such simplistic historical modelling however excludes a large amount of normally critical data and following its due diligence enquiries the Company believes that the historic NI 43-101 resource estimate significantly under-estimates the mineral potential of the Toral Project The Company further believes that an initial low cost exploration work programme should be able to test the mineralisation in a series of parallel sub-vertical structures running from depth up to surface Utilising the existing data and applying an exploration process that takes into account key structural controls and the characteristics of existing nearby mines will be a key initial work programme priority Ferrum Crescents objective following the recent exercise of its Option on 22 September 2016to seek to establish a JORC compliant resource estimate at both the Toral Project and the Lago Project as well as re-examining the scale and continuity of mineralisation at the Toral Project Ferrum Crescents ultimate objective is to potentially establish a credible mineral reserve in a cost effective manner for consideration by potential future acquirers or development finance groups During the reporting period the Company carried out extensive geological and legal due diligence on GoldQuest and the Iberian Projects In carrying out its operations during the reporting period the Group has incurred a loss after income tax for the period from 1 July 2015 to 30 June 2016 of $1573533 (2015 loss of $2345860) The Group had net assets of $718659 (2015 $525522) as set out in the Statement of Financial Position
Significant changes in the Grouprsquos state of affairs There have been no significant changes in the state of affairs of the consolidated entity to the date of this report that have not otherwise been disclosed elsewhere in the Annual Report
Significant events after the reporting date There are subsequent events to report as follows
Subsequent to the Company entering into an exclusive option to acquire 100 percent of GoldQuest two nil-cost extensions were granted to Ferrum Crescent on 22 July 2016 and 31 August 2016 and on 22 September 2016 the option was exercised Accordingly Ferrum Crescent has now acquired 100 per cent of the share capital of GoldQuest GoldQuest owns 100 per cent of two lead-zinc exploration projects in the provinces of Leόn and Galicia in historic Spanish mining areas (the ldquoIberian Projectsrdquo) The consideration comprised GBP326500 in cash and the issue of 100 million new ordinary shares in the capital of Ferrum Crescent
Planned work programme to be overseen by the Companyrsquos Senior Project Adviser Merlin Marr-Johnson to comprise
- re-mapping of the main Toral Project area applying re-interpreted geological understanding of the regional controls on mineralisation
- in-fill surveys over the main prospect area where detailed soil geochemistry has not previously been conducted
- structural mapping of the existing adits outcrop and the nearby mineralisation occurrences in order to gauge the balance between local (not fully tested) and regional (well documented) controls on mineralisation
- re-logging of historical drill-core and re-assaying of areas where incomplete assays were taken previously in order to seek to identify potential new shallow high grade targets at the Toral Project
- creation of a revised geological model incorporating existing and new geological data (geochemistry structural interpretation assays logs maps) and
- generation of a highly targeted drill plan focused on high-grade near-surface ore shoots linking known surface occurrences and known high-grade mineralisation at depth for testing in 2017
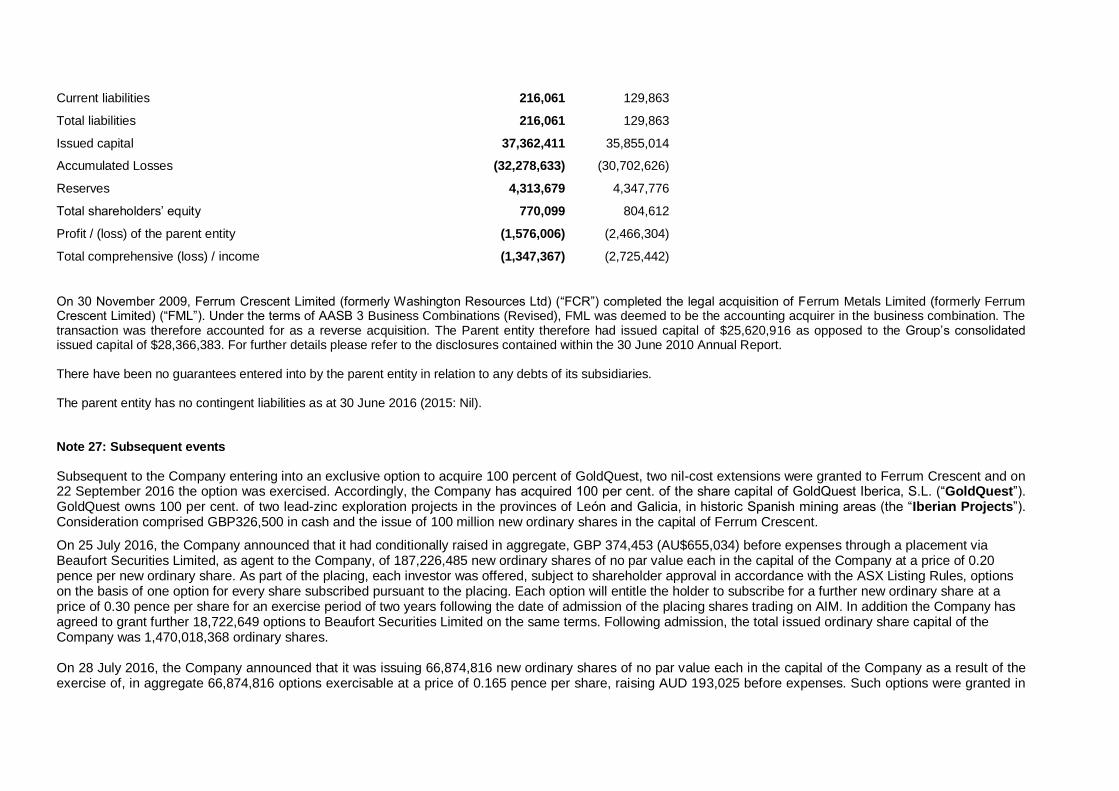
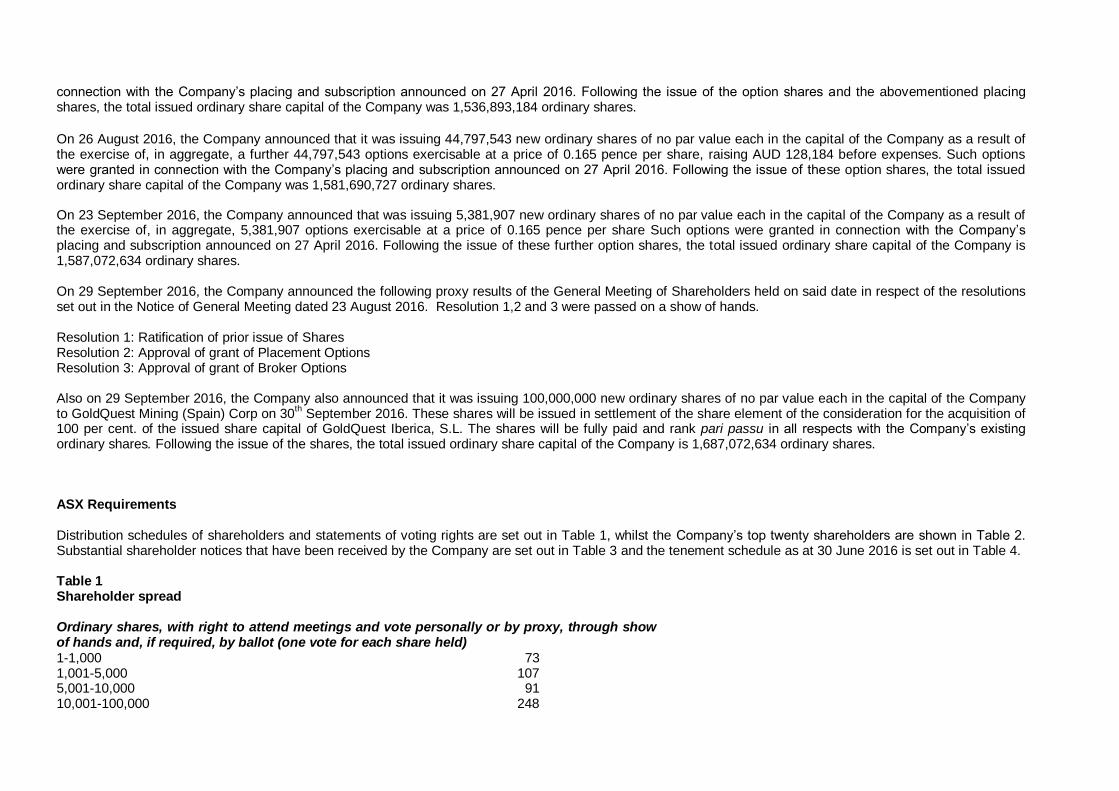
On 25 July 2016 the Company announced that it had conditionally raised in aggregate GBP 374453 before expenses through a placement via Beaufort Securities Limited as agent to the Company of 187226485 new ordinary shares of no par value each in the capital of the Company at a price of 020 pence per new ordinary share As part of the placing each investor was offered subject to shareholder approval in accordance with the ASX Listing Rules options on the basis of one option for every share subscribed pursuant to the placing Each option entitles the holder to subscribe for a further new ordinary share at a price of 030 pence per share for an exercise period of two years following the date of admission of the placing shares to trading on AIM In addition the Company agreed to grant a further 18722649 options to Beaufort Securities Limited on the same terms Following admission the total issued ordinary share capital of the Company was 1470018368 ordinary shares On 28 July 2016 the Company announced that it was issuing 66874816 new ordinary shares of no par value each in the capital of the Company as a result of the exercise of in aggregate 66874816 options exercisable at a price of 0165 pence per share Such options were granted in connection with the Companyrsquos placing and subscription announced on 27 April 2016 Following the issue of these option shares and the abovementioned placing shares the total issued ordinary share capital of the Company was 1536893184 ordinary shares
On 26 August 2016 the Company announced that it was issuing 44797543 new ordinary shares of no par value each in the capital of the Company as a result of the exercise of in aggregate a further 44797543 options exercisable at a price of 0165 pence per share Such options were granted in connection with the Companyrsquos placing and subscription announced on 27 April 2016 Following the issue of these option shares the total issued ordinary share capital of the Company was 1581690727 ordinary shares
On 23 September 2016 the Company announced that it was issuing 5381907 new ordinary shares of no par value each in the capital of the Company as a result of the exercise of in aggregate 5381907 options exercisable at a price of 0165 pence per share Such options were granted in connection with the Companyrsquos placing and subscription announced on 27 April 2016 Following the issue of the option shares the total issued ordinary share capital of the Company is 1587072634 ordinary shares
Likely developments and expected results
The Group will continue to carry out its business plans by
Exploring evaluating and if technically and economically feasible developing the Moonlight Project in Limpopo Province South Africa
Conducting its planned initial zinc exploration work programme on the Iberian Projects in Spain
Seeking further strategic acquisition opportunities within the exploration and mining industry to enter potentially into additional advanced projects that will add value to the Group and
Continuing to meet its statutory commitments relating to its exploration tenements and carrying out exploration of its exploration tenements in accordance with its stated strategy whilst carefully conserving the Grouprsquos cash reserves in order to be able to take advantage of value adding opportunities
There can be no guarantee either that further exploration of the Grouprsquos tenements will result in exploration success or that any potential additional strategic acquisition considered by the Directors to be likely to add value to the Group will become available to the Group Environmental regulation and performance
The Grouprsquos activities are subject to South African and Spanish legislation relating to the protection of the environment The Group is subject to significant environmental legal regulations in respect to its exploration and evaluation activities The relevant South African Act that we comply with is the (ldquoMPRDArdquo) Mineral and Petroleum Resources Development Act 2002 (Act No 28 of 2002)
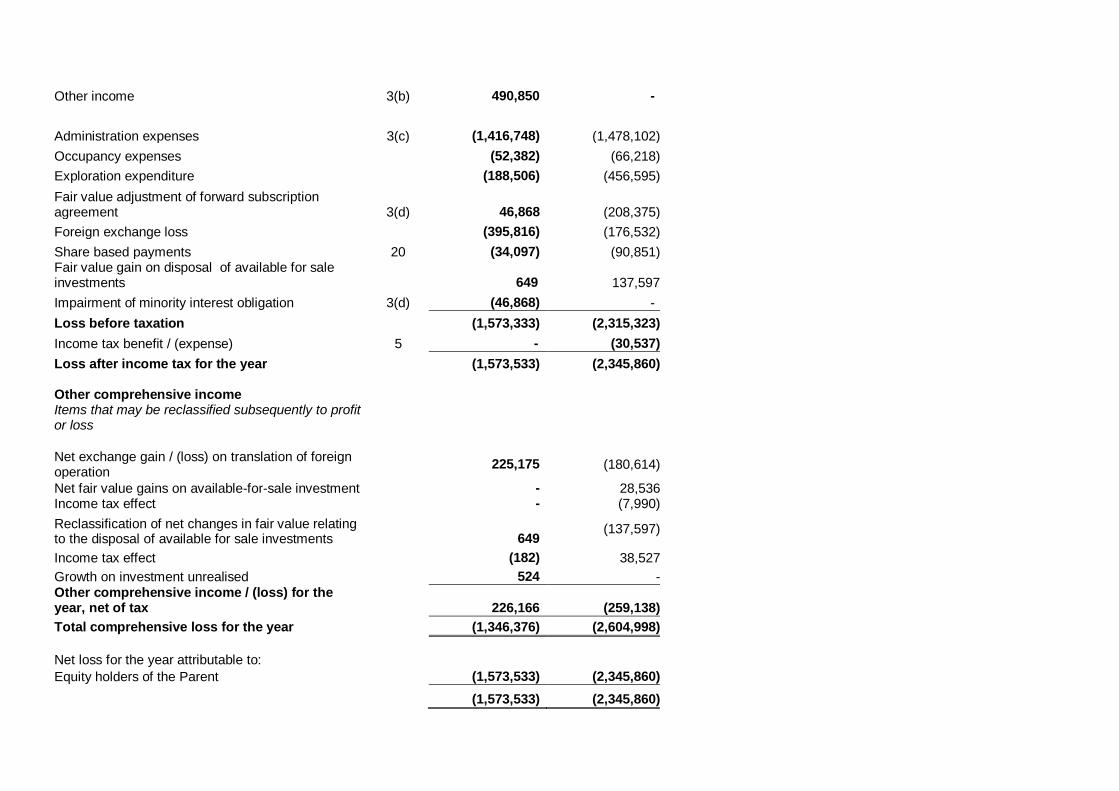
There have been no known breaches of these regulations and principles Consolidated Statement of Profit or Loss and Other Comprehensive Income For the year ended 30 June 2016
2016 2015
Note $ $
Revenue from continuing operations
Revenue 3(a) 22517 23753
Other income 3(b) 490850 -
Administration expenses 3(c) (1416748) (1478102)
Occupancy expenses (52382) (66218)
Exploration expenditure (188506) (456595)
Fair value adjustment of forward subscription agreement 3(d) 46868 (208375)
Foreign exchange loss (395816) (176532)
Share based payments 20 (34097) (90851) Fair value gain on disposal of available for sale investments 649 137597
Impairment of minority interest obligation 3(d) (46868) -
Loss before taxation (1573333) (2315323)
Income tax benefit (expense) 5 - (30537)
Loss after income tax for the year (1573533) (2345860) Other comprehensive income
Items that may be reclassified subsequently to profit or loss
Net exchange gain (loss) on translation of foreign operation
225175 (180614)
Net fair value gains on available-for-sale investment - 28536 Income tax effect - (7990)
Reclassification of net changes in fair value relating to the disposal of available for sale investments 649
(137597)
Income tax effect (182) 38527
Growth on investment unrealised 524 - Other comprehensive income (loss) for the year net of tax 226166 (259138)
Total comprehensive loss for the year (1346376) (2604998)
Net loss for the year attributable to
Equity holders of the Parent (1573533) (2345860)
(1573533) (2345860)
Total comprehensive loss for the period attributable to
Equity holders of the Parent (1346376) (2604998)
(1346376) (2604998)
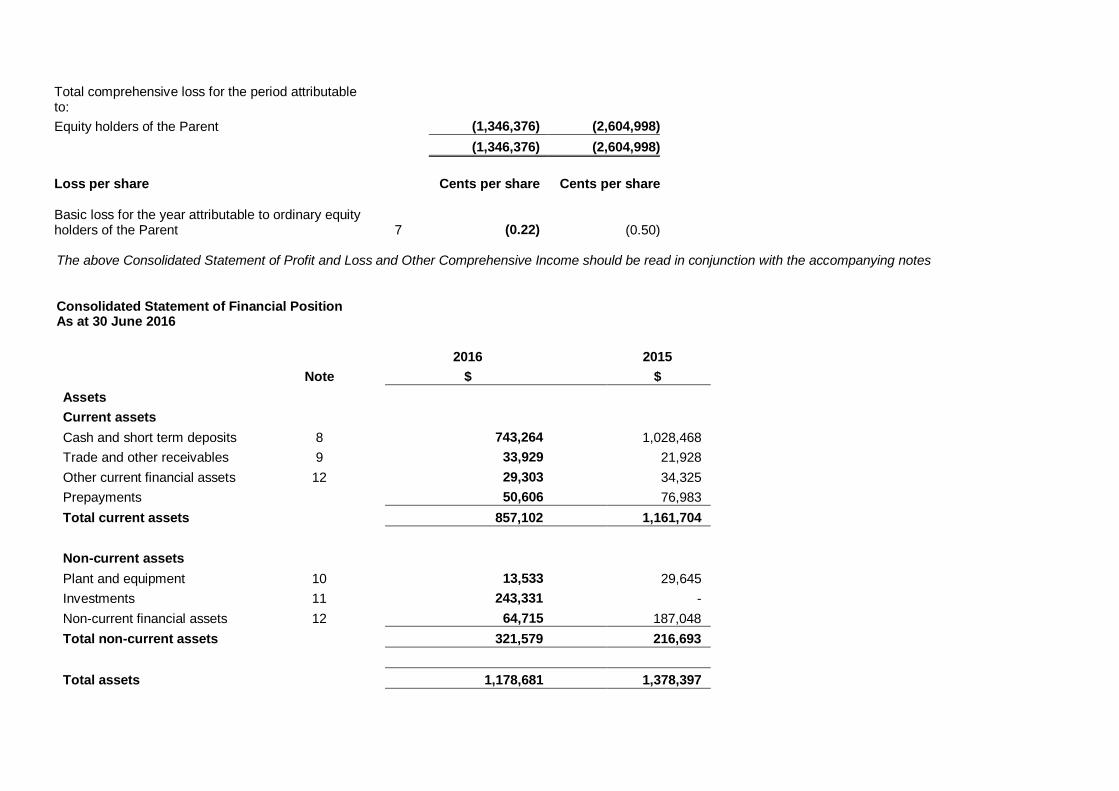
Loss per share Cents per share Cents per share Basic loss for the year attributable to ordinary equity holders of the Parent 7 (022) (050) The above Consolidated Statement of Profit and Loss and Other Comprehensive Income should be read in conjunction with the accompanying notes Consolidated Statement of Financial Position As at 30 June 2016
2016 2015
Note $ $
Assets
Current assets
Cash and short term deposits 8 743264 1028468
Trade and other receivables 9 33929 21928
Other current financial assets 12 29303 34325
Prepayments 50606 76983
Total current assets 857102 1161704
Non-current assets
Plant and equipment 10 13533 29645
Investments 11 243331 -
Non-current financial assets 12 64715 187048
Total non-current assets 321579 216693
Total assets 1178681 1378397
Liabilities and equity
Current liabilities
Trade and other payables 13 263827 168713
Payments received in advance 14 175722 629325
Provisions 15 20473 54837
Total current liabilities 460022 852875
Total liabilities 460022 852875
Equity
Contributed equity 16 33049490 31542093
Accumulated losses 19 (24424297) (22850764)
Reserves 18 (7906534) (8165807) Equity attributable to equity holders of the Parent 718659 525522
Total equity 718659 525522
Total equity and liabilities 1178681 1378397
This Consolidated Statement of Financial Position is to be read in conjunction with the accompanying notes Consolidated Statement of Cash Flows For the year ended 30 June 2016
2016 2015
Note $ $
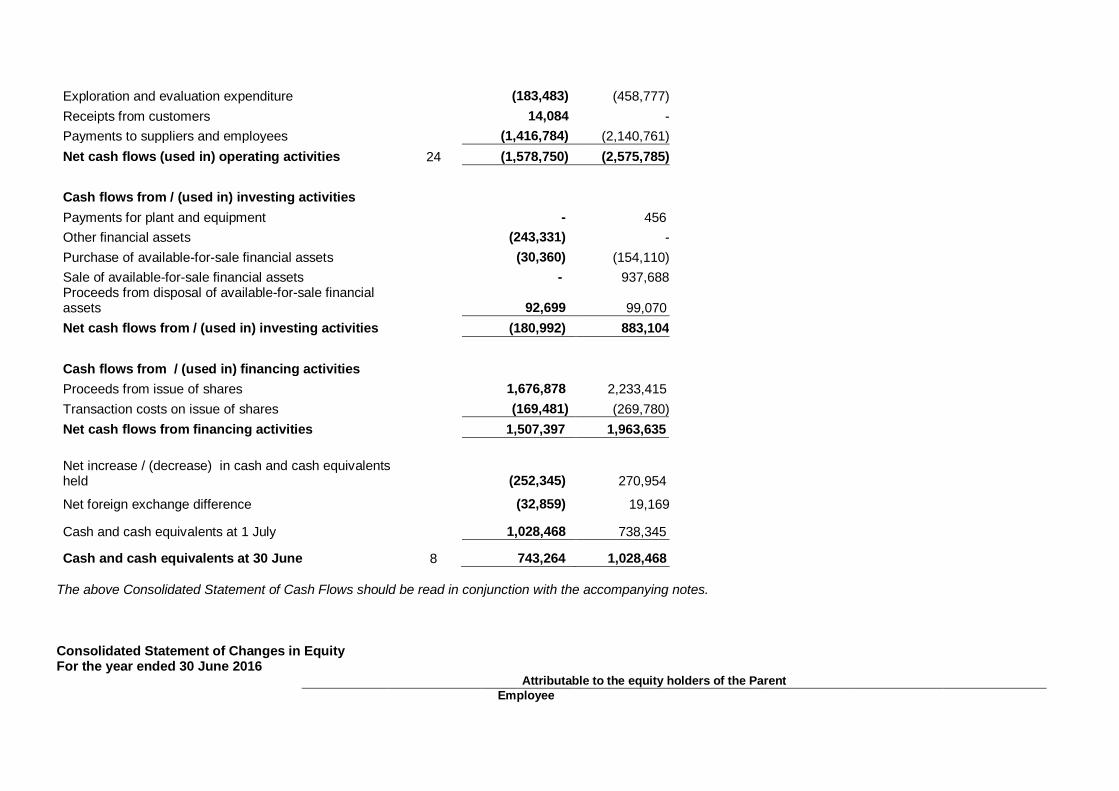
Cash flows from (used in) operating activities
Interest received 3191 10635
Income from available for sale investment 5242 13118
Exploration and evaluation expenditure (183483) (458777)
Receipts from customers 14084 -
Payments to suppliers and employees (1416784) (2140761)
Net cash flows (used in) operating activities 24 (1578750) (2575785)
Cash flows from (used in) investing activities
Payments for plant and equipment - 456
Other financial assets (243331) -
Purchase of available-for-sale financial assets (30360) (154110)
Sale of available-for-sale financial assets - 937688 Proceeds from disposal of available-for-sale financial assets 92699 99070
Net cash flows from (used in) investing activities (180992) 883104
Cash flows from (used in) financing activities
Proceeds from issue of shares 1676878 2233415
Transaction costs on issue of shares (169481) (269780)
Net cash flows from financing activities 1507397 1963635
Net increase (decrease) in cash and cash equivalents held (252345) 270954
Net foreign exchange difference (32859) 19169
Cash and cash equivalents at 1 July 1028468 738345
Cash and cash equivalents at 30 June 8 743264 1028468
The above Consolidated Statement of Cash Flows should be read in conjunction with the accompanying notes
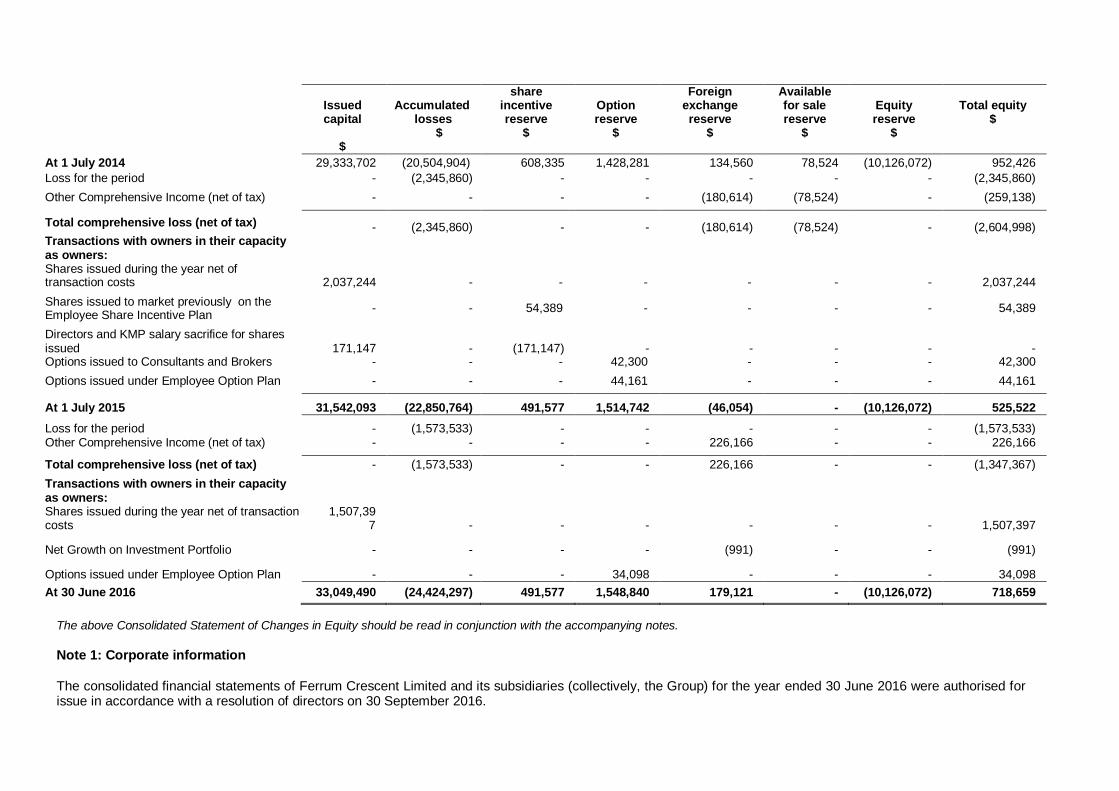
Consolidated Statement of Changes in Equity For the year ended 30 June 2016
Attributable to the equity holders of the Parent
Employee
Issued capital
$
Accumulated
losses $
share incentive reserve
$
Option reserve
$
Foreign exchange reserve
$
Available for sale reserve
$
Equity reserve
$
Total equity
$
At 1 July 2014 29333702 (20504904) 608335 1428281 134560 78524 (10126072) 952426
Loss for the period - (2345860) - - - - - (2345860)
Other Comprehensive Income (net of tax) - - - - (180614) (78524) - (259138)
Total comprehensive loss (net of tax) - (2345860) - - (180614) (78524) - (2604998) Transactions with owners in their capacity as owners Shares issued during the year net of transaction costs 2037244 - - - - - - 2037244
Shares issued to market previously on the Employee Share Incentive Plan
- - 54389 - - - - 54389
Directors and KMP salary sacrifice for shares issued 171147 - (171147) - - - - - Options issued to Consultants and Brokers - - - 42300 - - - 42300
Options issued under Employee Option Plan - - - 44161 - - - 44161
At 1 July 2015 31542093 (22850764) 491577 1514742 (46054) - (10126072) 525522
Loss for the period - (1573533) - - - - - (1573533) Other Comprehensive Income (net of tax) - - - - 226166 - - 226166
Total comprehensive loss (net of tax) - (1573533) - - 226166 - - (1347367)
Transactions with owners in their capacity as owners Shares issued during the year net of transaction costs
1507397 - - - - - - 1507397
Net Growth on Investment Portfolio - - - - (991) - - (991)
Options issued under Employee Option Plan - - - 34098 - - - 34098
At 30 June 2016 33049490 (24424297) 491577 1548840 179121 - (10126072) 718659
The above Consolidated Statement of Changes in Equity should be read in conjunction with the accompanying notes Note 1 Corporate information The consolidated financial statements of Ferrum Crescent Limited and its subsidiaries (collectively the Group) for the year ended 30 June 2016 were authorised for issue in accordance with a resolution of directors on 30 September 2016
Ferrum Crescent Limited the parent is a for profit company limited by shares incorporated in Australia whose shares are publicly traded on the Australian Stock Exchange (ASX) the London Stock Exchange (AIM) and the JSE Limited (JSE) Domicile Australia Registered Office lsquoG South Mill Centrersquo Suite 6 9 Bowman Street South Perth WA 6151 Note 2 Summary of significant accounting policies (a) Basis of preparation
The Financial Report is a general purpose financial report which has been prepared in accordance with the requirements of the Corporations Act 2001 Australian Accounting Standards and Interpretations and complies with other requirements of Australian law The accounting policies detailed below have been consistently applied to all of the years presented unless otherwise stated The financial statements are for the consolidated entity consisting of Ferrum Crescent Limited and its subsidiaries The Financial Report has also been prepared on a historical cost basis except for the forward subscription agreement and the available-for-sale (AFS) investments which have been measured at fair value All amounts are presented in Australian dollars unless otherwise stated
(b) Statement of compliance
The Financial Report complies with Australian Accounting Standards as issued by the Australian Accounting Standards Board and complies with International Financial Reporting Standards (IFRS) as issued by the International Accounting Standards Board (c) Adoption of new and revised standards
Ferrum Crescent Limited and its subsidiaries (lsquothe Grouprsquo) has adopted all new and amended Australian Standards and Interpretations mandatory for reporting periods beginning on or after 1 July 2015 including
AASB 2015-3 Amendments to Australian Accounting Standards arising from the withdrawal of AASB1031 Materiality
AASB 2015-5 Amendments to Australian Accounting Standards Investment Entities Applying the Consolidation Exception
The adoption of these standards and interpretations did not have any material effect on the financial position or performance of the Group
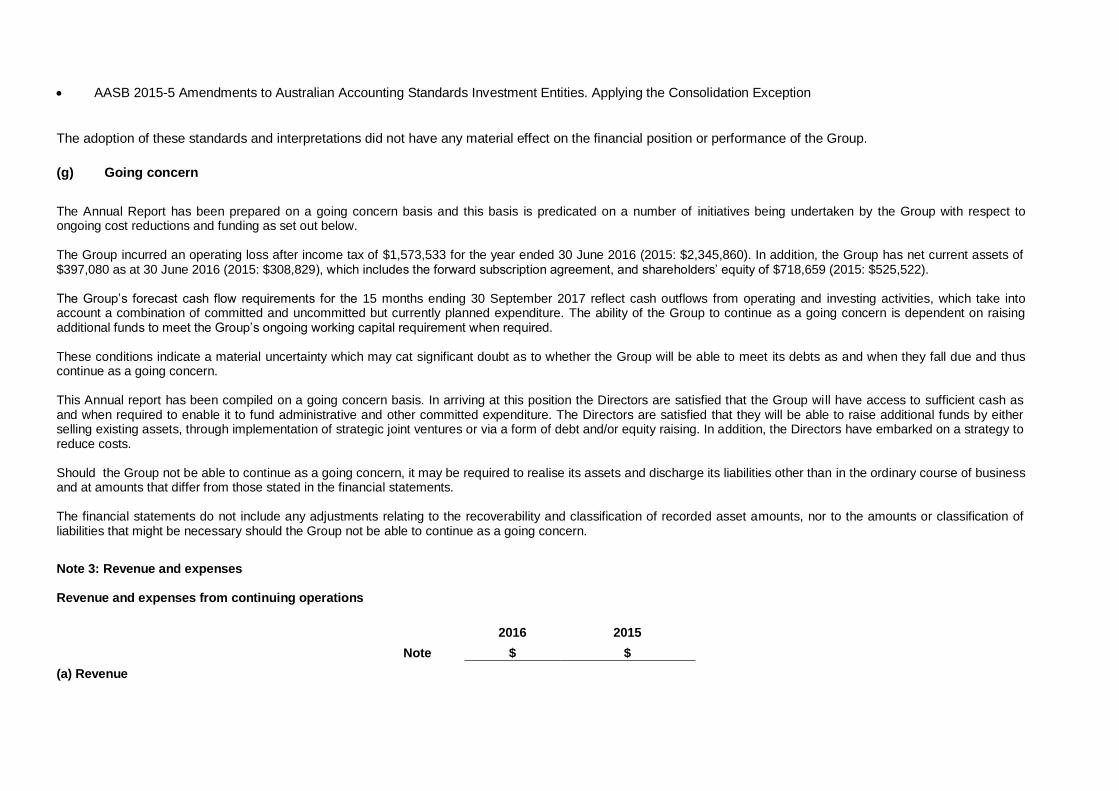
(g) Going concern
The Annual Report has been prepared on a going concern basis and this basis is predicated on a number of initiatives being undertaken by the Group with respect to ongoing cost reductions and funding as set out below The Group incurred an operating loss after income tax of $1573533 for the year ended 30 June 2016 (2015 $2345860) In addition the Group has net current assets of $397080 as at 30 June 2016 (2015 $308829) which includes the forward subscription agreement and shareholdersrsquo equity of $718659 (2015 $525522) The Grouprsquos forecast cash flow requirements for the 15 months ending 30 September 2017 reflect cash outflows from operating and investing activities which take into account a combination of committed and uncommitted but currently planned expenditure The ability of the Group to continue as a going concern is dependent on raising additional funds to meet the Grouprsquos ongoing working capital requirement when required These conditions indicate a material uncertainty which may cat significant doubt as to whether the Group will be able to meet its debts as and when they fall due and thus continue as a going concern This Annual report has been compiled on a going concern basis In arriving at this position the Directors are satisfied that the Group will have access to sufficient cash as and when required to enable it to fund administrative and other committed expenditure The Directors are satisfied that they will be able to raise additional funds by either selling existing assets through implementation of strategic joint ventures or via a form of debt andor equity raising In addition the Directors have embarked on a strategy to reduce costs Should the Group not be able to continue as a going concern it may be required to realise its assets and discharge its liabilities other than in the ordinary course of business and at amounts that differ from those stated in the financial statements The financial statements do not include any adjustments relating to the recoverability and classification of recorded asset amounts nor to the amounts or classification of liabilities that might be necessary should the Group not be able to continue as a going concern
Note 3 Revenue and expenses Revenue and expenses from continuing operations
2016 2015
Note $ $
(a) Revenue
Turnover 14084 -
Interest received 8433 23753
22517 23753
(b) Other Income
Income from third party advance payment 490850 -
490850 -
(c) Profit or loss
Other expenses include the following
Depreciation 11638 18580
Gain on disposal of plant and equipment (8609) -
Consulting services 243032 238053
Employment related
- Directors fees 386994 404228
- Wages 182207 171623
- Superannuation 39989 41595
Corporate 276747 271287
Travel 27868 62691
Other 256882 270045
1416748 1478102
(d) Fair value (losses)gains
Fair value (loss)gain on financial instrument 46868 (208375)
Impairment of minority interest obligation (46868)
- -
On 26 October 2010 various agreements were entered into in respect of the minority interest in the Moonlight Iron Project being managed by the companyrsquos subsidiary Ferrum Iron Ore (Pty) Ltd (ldquoFIOrdquo) Ferrum South Africa Pty Ltd (ldquoFSArdquo) a wholly owned subsidiary of the Ferrum Crescent Ltd (ldquoFCLrdquo) entered various agreements with Mkhombi Investments (Pty) Ltd (ldquoMIrdquo) and its holding company Mkhombi AmaMato (Pty) Ltd (ldquoMArdquo) for MI to become FIOrsquos BEE partner MA was to obtain 156 of the issued shares in FCL in
2 equal tranches of ZAR 75 million The South African Department of Mineral Resources (ldquoDMRrdquo) expressed its support of this transaction The first tranche was completed on 30 November 2012 and FCL issued 78 of its issued shares to MA Upon completion of the first tranche the Company legally owned directly and indirectly through its wholly owned subsidiary MI 97 of FIO with the remaining 3 held by the GaSeleka Community
Under the subscription agreement second tranche FCL will issue shares to MA equal to 78 of the issued share capital of the Company for ZAR 75 million The subscription agreement has been extended to 31 July 2019 The above financial asset was fair valued as at 30 June 2016 to nil The fair value was based on a probability weighted approach with the key assumptions being Ferrumrsquos share price foreign exchange rates and credit risk Note 4 Segment information Identification of Reportable Segments The Group has based its operating segment on the internal reports that are reviewed and used by the executive management team in assessing performance and in determining the allocation of resources The Group currently does not have production and is only involved in exploration As a consequence activities in the operating segment are identified by management based on the manner in which resources are allocated the nature of the resources provided and the identity of the manager and country of expenditure Information is reviewed on a whole of entity basis Based on these criteria the Group has only one operating segment being exploration and the segment operations and results are reported internally based on the accounting policies as described in Note 2 for the computation of the Grouprsquos results presented in this set of financial statements
Geographic Information
Note Australia South Africa Consolidation
2016 2015 2016 2015 2016 2015
$ $ $ $ $ $
Revenue from external customers
- 15727 14084 8026 14084 23753
Non - current assets 1011 amp 12 361 401 321218
216292 321579
216693
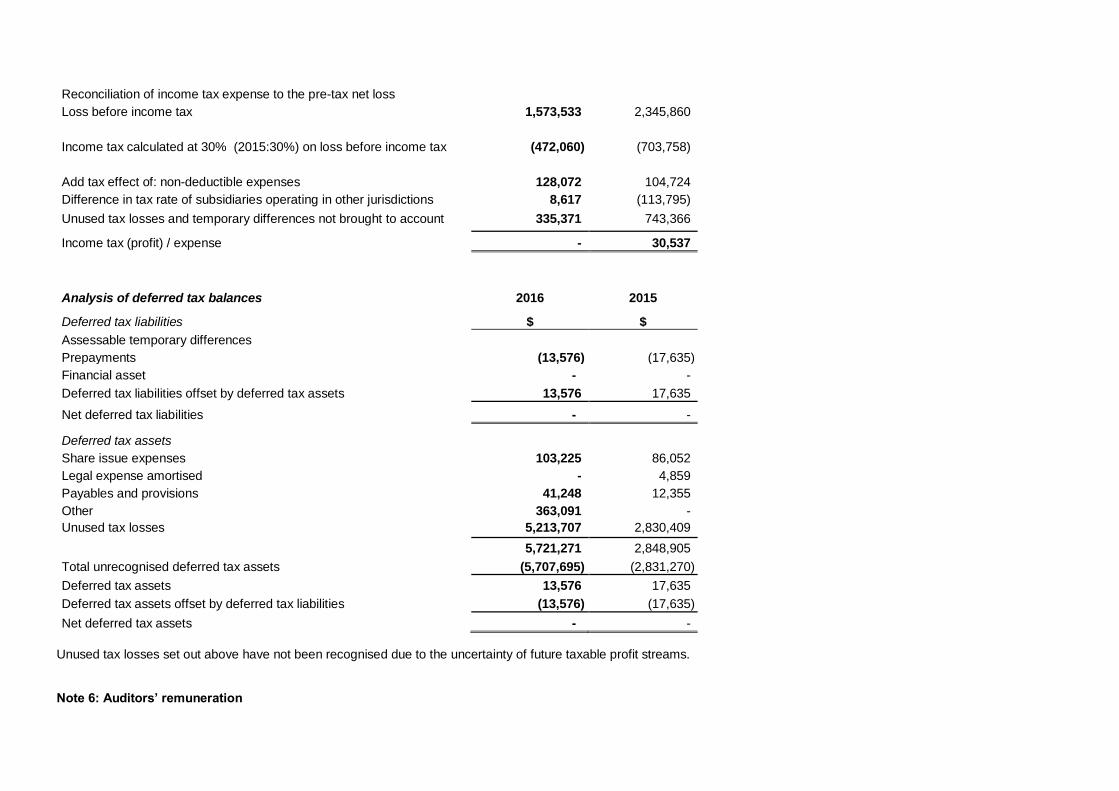
Note 5 Income tax expense
2016 2015
$ $
Reconciliation of income tax expense to the pre-tax net loss
Loss before income tax 1573533 2345860
Income tax calculated at 30 (201530) on loss before income tax (472060) (703758)
Add tax effect of non-deductible expenses 128072 104724
Difference in tax rate of subsidiaries operating in other jurisdictions 8617 (113795)
Unused tax losses and temporary differences not brought to account 335371 743366
Income tax (profit) expense - 30537
Analysis of deferred tax balances 2016 2015
Deferred tax liabilities $ $
Assessable temporary differences
Prepayments (13576) (17635)
Financial asset - -
Deferred tax liabilities offset by deferred tax assets 13576 17635
Net deferred tax liabilities - -
Deferred tax assets
Share issue expenses 103225 86052
Legal expense amortised - 4859
Payables and provisions 41248 12355
Other 363091 -
Unused tax losses 5213707 2830409
5721271 2848905
Total unrecognised deferred tax assets (5707695) (2831270)
Deferred tax assets 13576 17635
Deferred tax assets offset by deferred tax liabilities (13576) (17635)
Net deferred tax assets - -
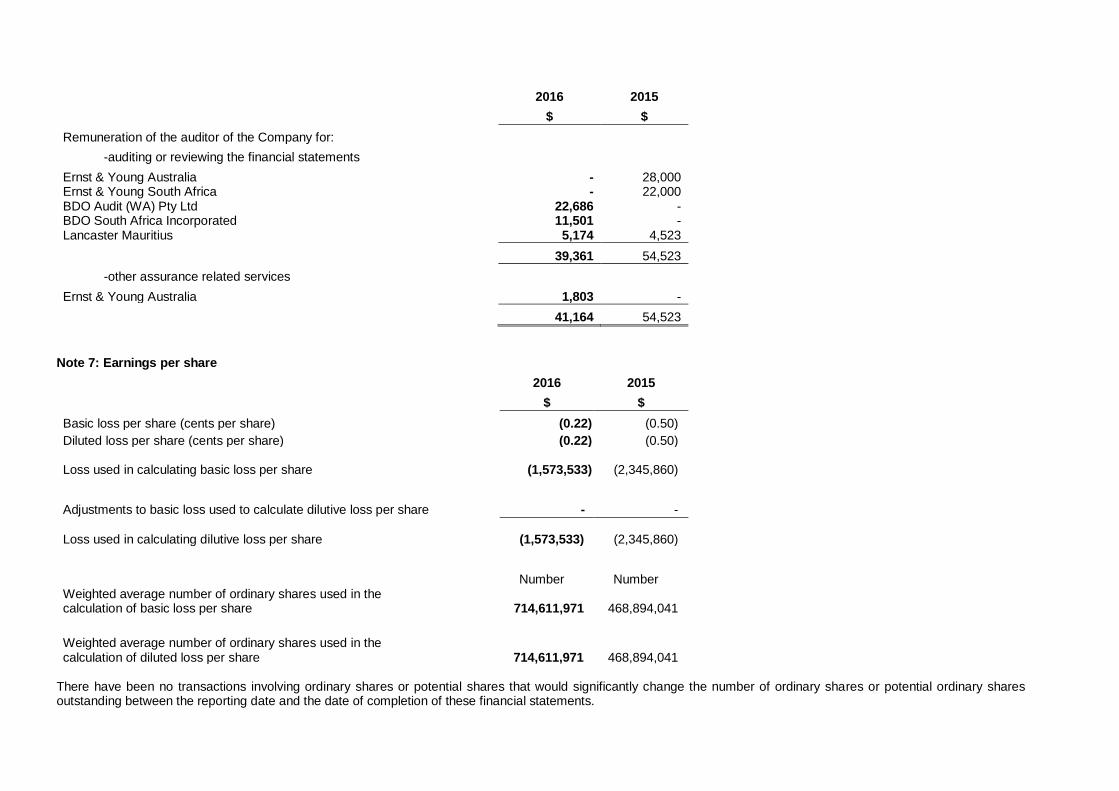
Unused tax losses set out above have not been recognised due to the uncertainty of future taxable profit streams Note 6 Auditorsrsquo remuneration
2016 2015
$ $
Remuneration of the auditor of the Company for
-auditing or reviewing the financial statements
Ernst amp Young Australia - 28000 Ernst amp Young South Africa - 22000 BDO Audit (WA) Pty Ltd 22686 - BDO South Africa Incorporated 11501 - Lancaster Mauritius 5174 4523
39361 54523
-other assurance related services
Ernst amp Young Australia 1803 -
41164 54523
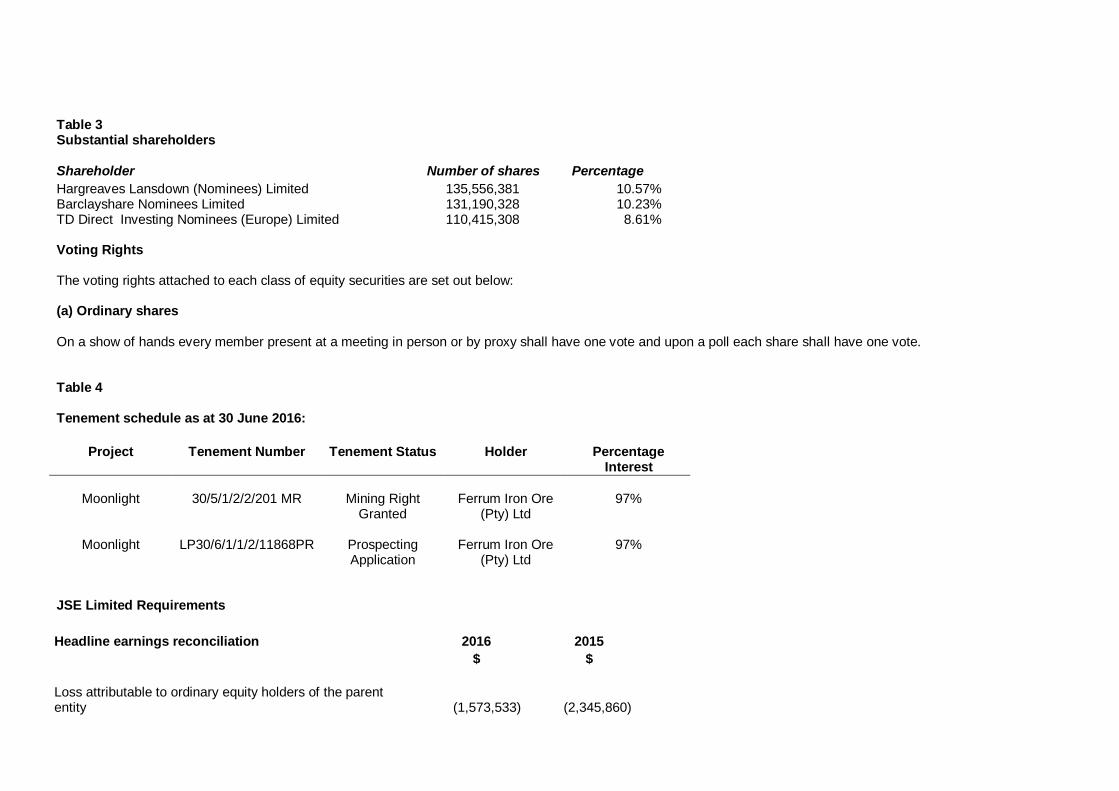
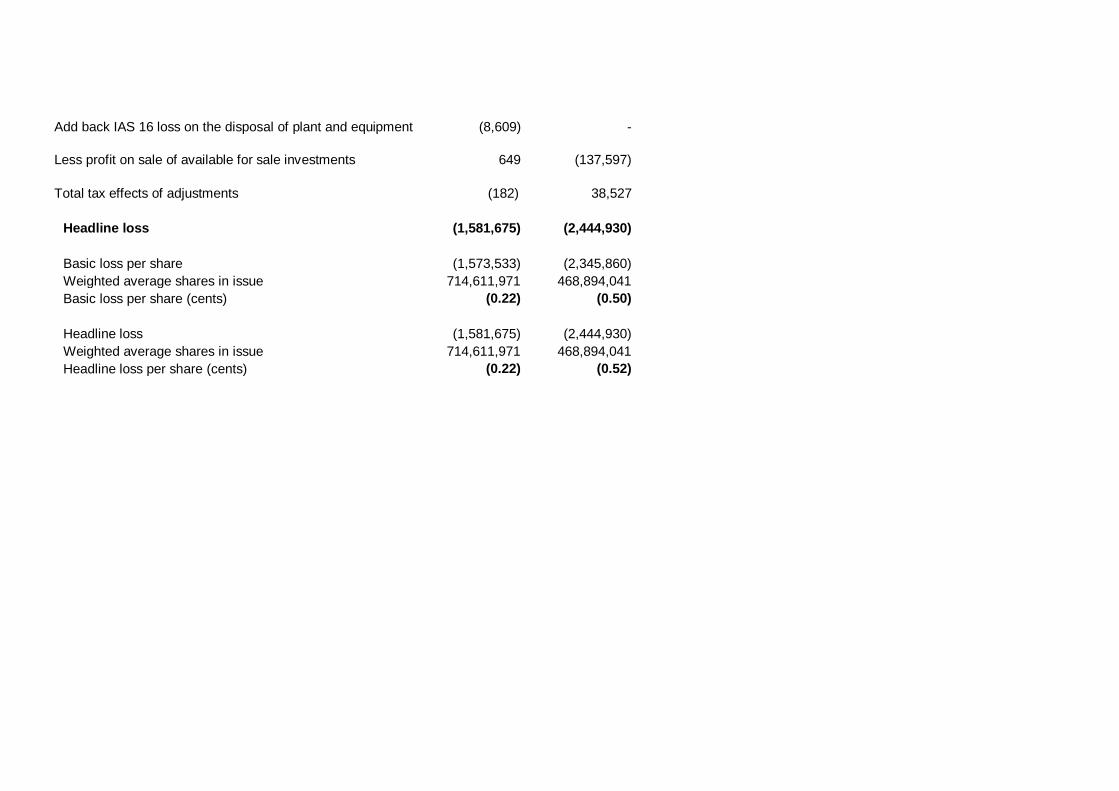
Note 7 Earnings per share
2016 2015
$ $
Basic loss per share (cents per share) (022) (050)
Diluted loss per share (cents per share) (022) (050) Loss used in calculating basic loss per share (1573533) (2345860)
Adjustments to basic loss used to calculate dilutive loss per share - -
Loss used in calculating dilutive loss per share (1573533) (2345860)
Number Number Weighted average number of ordinary shares used in the calculation of basic loss per share 714611971 468894041
Weighted average number of ordinary shares used in the calculation of diluted loss per share 714611971 468894041
There have been no transactions involving ordinary shares or potential shares that would significantly change the number of ordinary shares or potential ordinary shares outstanding between the reporting date and the date of completion of these financial statements
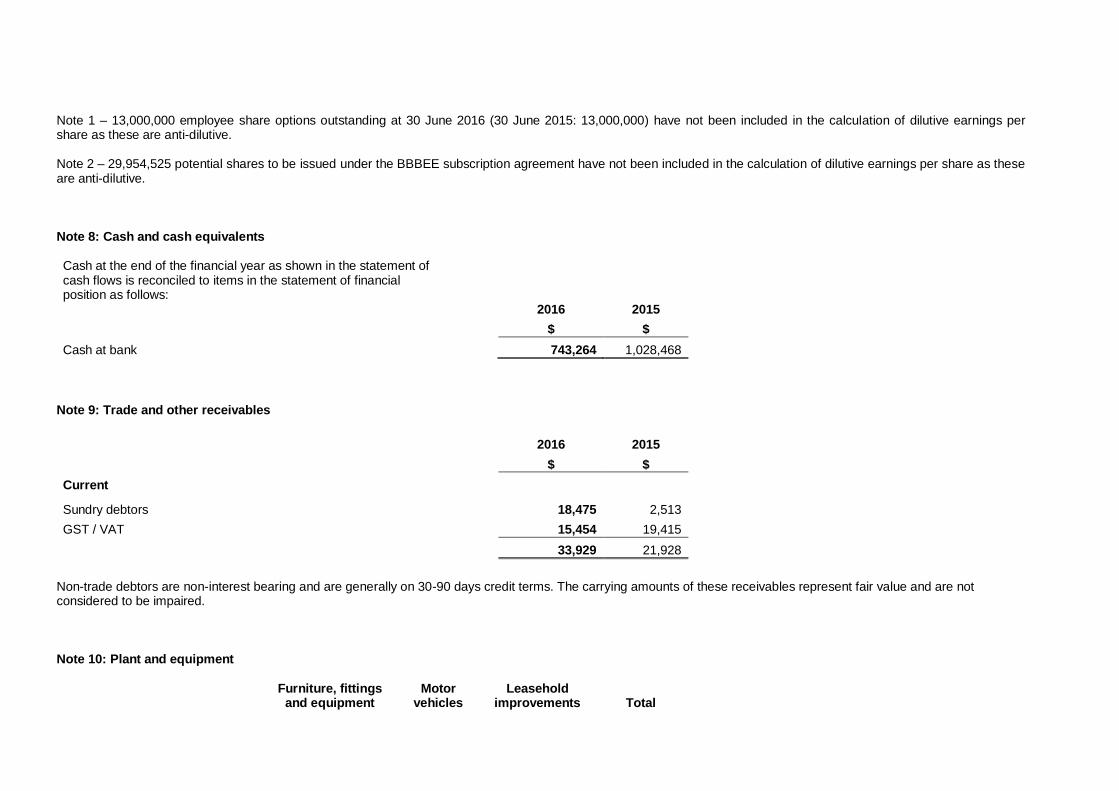
Note 1 ndash 13000000 employee share options outstanding at 30 June 2016 (30 June 2015 13000000) have not been included in the calculation of dilutive earnings per share as these are anti-dilutive Note 2 ndash 29954525 potential shares to be issued under the BBBEE subscription agreement have not been included in the calculation of dilutive earnings per share as these are anti-dilutive Note 8 Cash and cash equivalents
Cash at the end of the financial year as shown in the statement of cash flows is reconciled to items in the statement of financial position as follows
2016 2015
$ $
Cash at bank 743264 1028468
Note 9 Trade and other receivables
2016 2015
$ $
Current
Sundry debtors 18475 2513
GST VAT 15454 19415
33929 21928
Non-trade debtors are non-interest bearing and are generally on 30-90 days credit terms The carrying amounts of these receivables represent fair value and are not considered to be impaired
Note 10 Plant and equipment
Furniture fittings
and equipment
Motor
vehicles Leasehold
improvements
Total
$ $ $ $
Year ended 30 June 2016
Opening net carrying value 7474 8302 13869 29645 Disposals (274) 457 - 183 Depreciation charge for the year (3724) (7166) (748) (11638) Exchange differences (1028) (1592) (2036) (4657)
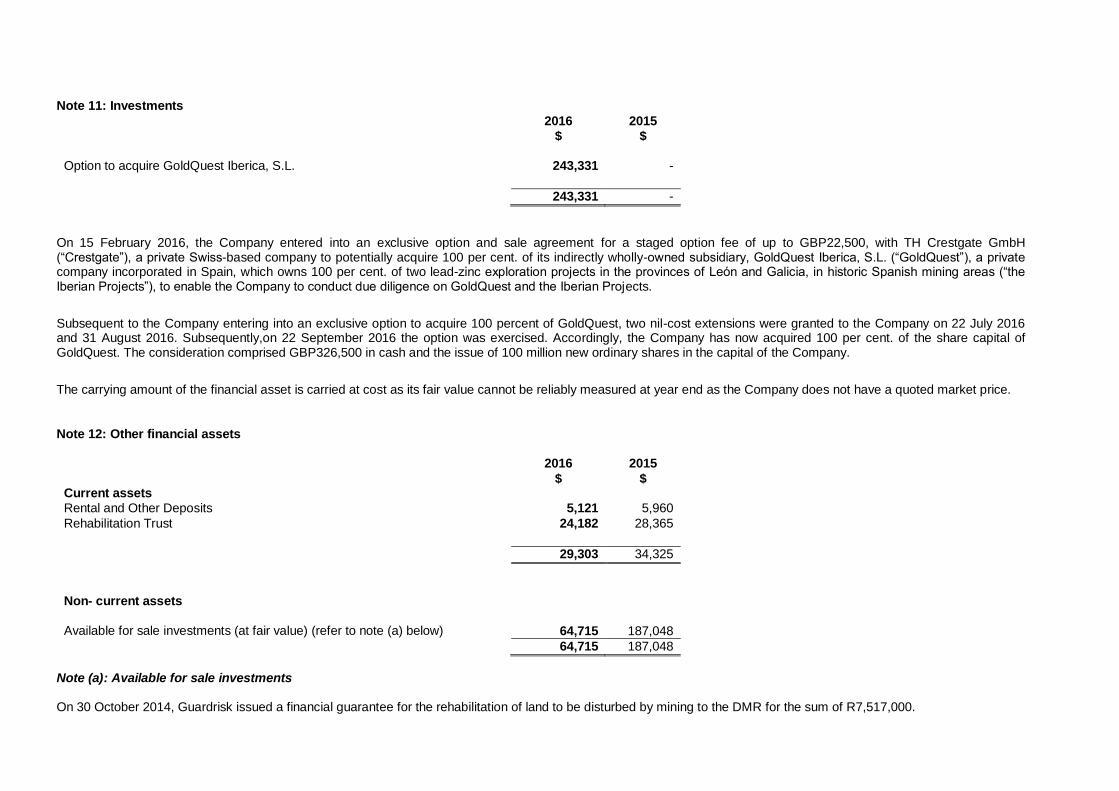
On 15 February 2016 the Company entered into an exclusive option and sale agreement for a staged option fee of up to GBP22500 with TH Crestgate GmbH (ldquoCrestgaterdquo) a private Swiss-based company to potentially acquire 100 per cent of its indirectly wholly-owned subsidiary GoldQuest Iberica SL (ldquoGoldQuestrdquo) a private company incorporated in Spain which owns 100 per cent of two lead-zinc exploration projects in the provinces of Leoacuten and Galicia in historic Spanish mining areas (ldquothe Iberian Projectsrdquo) to enable the Company to conduct due diligence on GoldQuest and the Iberian Projects
Subsequent to the Company entering into an exclusive option to acquire 100 percent of GoldQuest two nil-cost extensions were granted to the Company on 22 July 2016 and 31 August 2016 Subsequentlyon 22 September 2016 the option was exercised Accordingly the Company has now acquired 100 per cent of the share capital of GoldQuest The consideration comprised GBP326500 in cash and the issue of 100 million new ordinary shares in the capital of the Company
The carrying amount of the financial asset is carried at cost as its fair value cannot be reliably measured at year end as the Company does not have a quoted market price
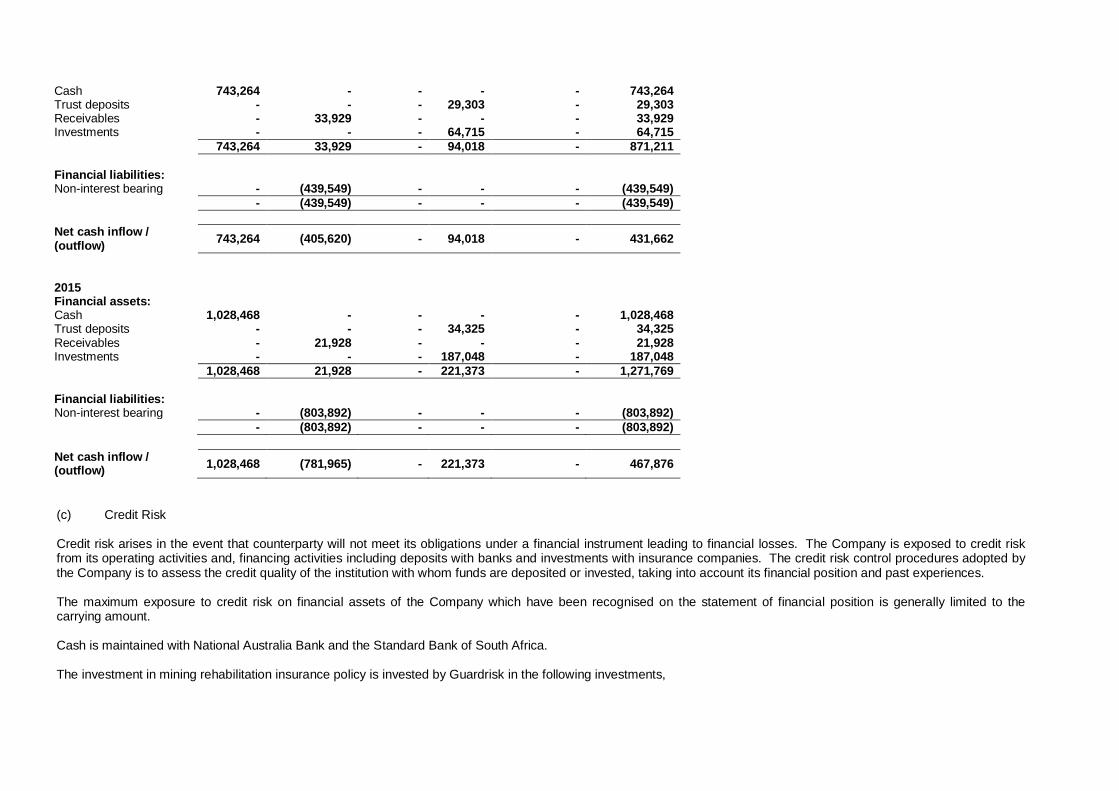
Note 12 Other financial assets
2016 2015 $ $ Current assets
Rental and Other Deposits 5121 5960
Rehabilitation Trust 24182 28365
29303 34325
Non- current assets
Available for sale investments (at fair value) (refer to note (a) below) 64715 187048
64715 187048
Note (a) Available for sale investments On 30 October 2014 Guardrisk issued a financial guarantee for the rehabilitation of land to be disturbed by mining to the DMR for the sum of R7517000
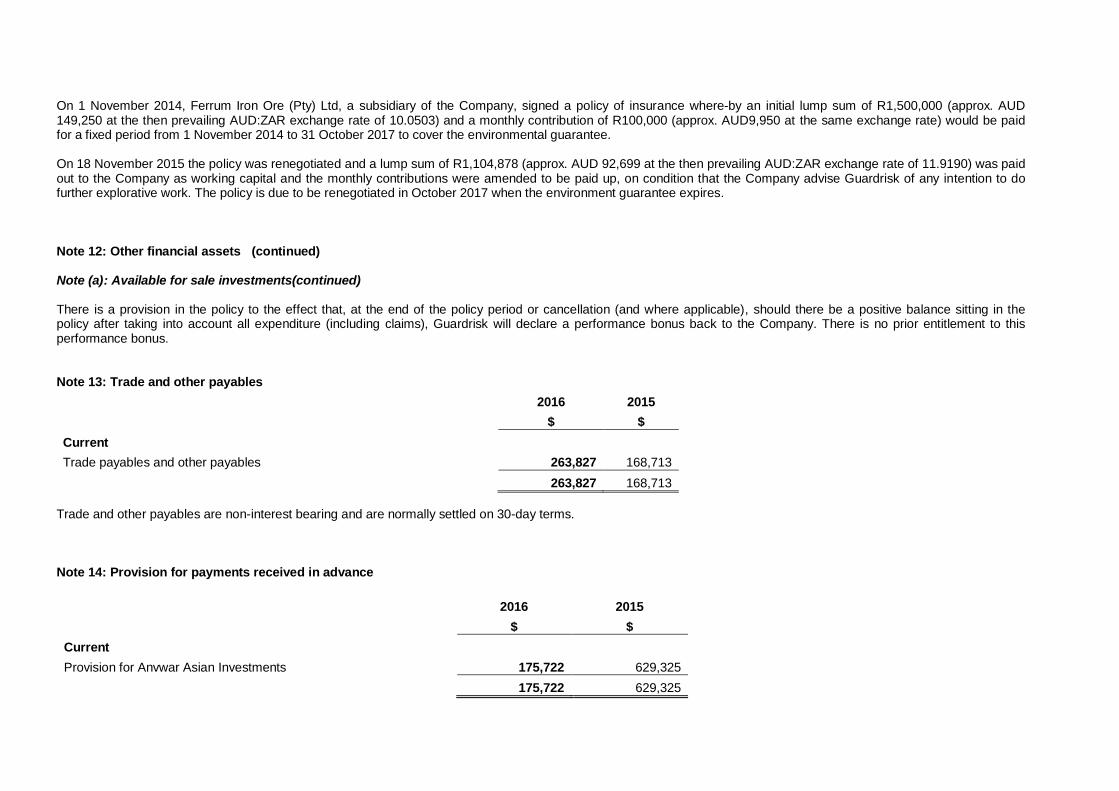
On 1 November 2014 Ferrum Iron Ore (Pty) Ltd a subsidiary of the Company signed a policy of insurance where-by an initial lump sum of R1500000 (approx AUD 149250 at the then prevailing AUDZAR exchange rate of 100503) and a monthly contribution of R100000 (approx AUD9950 at the same exchange rate) would be paid for a fixed period from 1 November 2014 to 31 October 2017 to cover the environmental guarantee On 18 November 2015 the policy was renegotiated and a lump sum of R1104878 (approx AUD 92699 at the then prevailing AUDZAR exchange rate of 119190) was paid out to the Company as working capital and the monthly contributions were amended to be paid up on condition that the Company advise Guardrisk of any intention to do further explorative work The policy is due to be renegotiated in October 2017 when the environment guarantee expires Note 12 Other financial assets (continued) Note (a) Available for sale investments(continued) There is a provision in the policy to the effect that at the end of the policy period or cancellation (and where applicable) should there be a positive balance sitting in the policy after taking into account all expenditure (including claims) Guardrisk will declare a performance bonus back to the Company There is no prior entitlement to this performance bonus Note 13 Trade and other payables
2016 2015
$ $
Current
Trade payables and other payables 263827 168713
263827 168713
Trade and other payables are non-interest bearing and are normally settled on 30-day terms Note 14 Provision for payments received in advance
2016 2015
$ $
Current
Provision for Anvwar Asian Investments 175722 629325
175722 629325
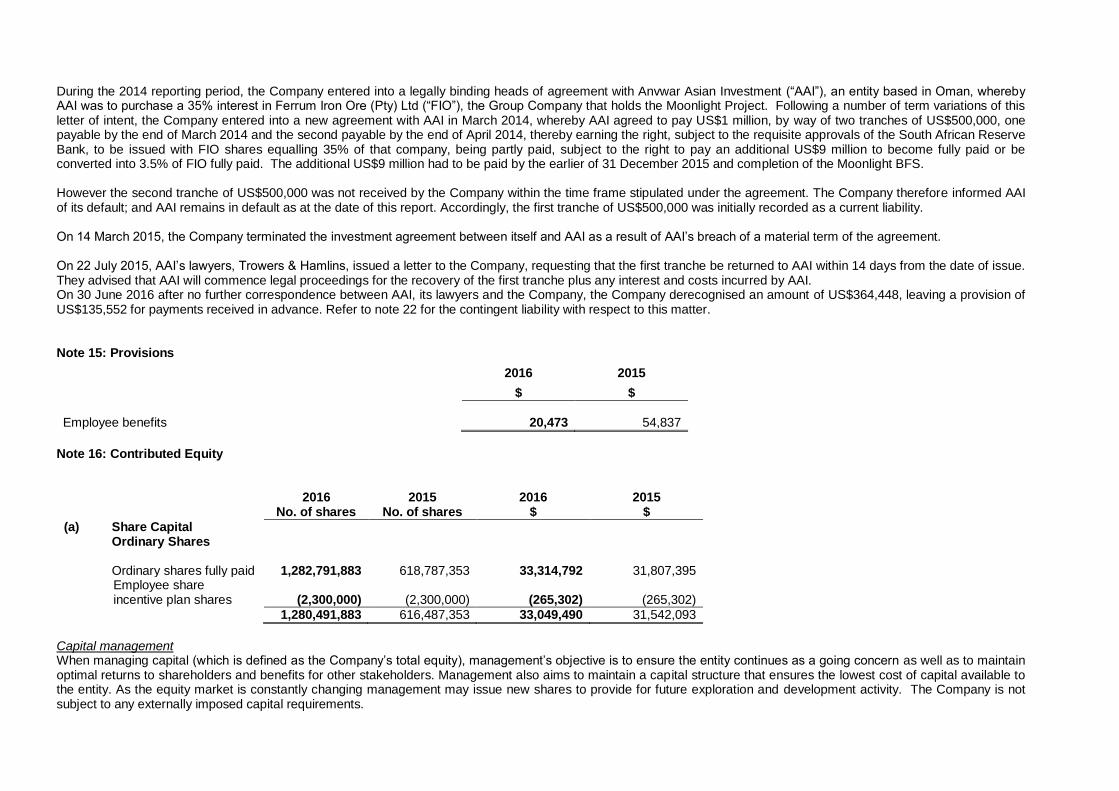
During the 2014 reporting period the Company entered into a legally binding heads of agreement with Anvwar Asian Investment (ldquoAAIrdquo) an entity based in Oman whereby AAI was to purchase a 35 interest in Ferrum Iron Ore (Pty) Ltd (ldquoFIOrdquo) the Group Company that holds the Moonlight Project Following a number of term variations of this letter of intent the Company entered into a new agreement with AAI in March 2014 whereby AAI agreed to pay US$1 million by way of two tranches of US$500000 one payable by the end of March 2014 and the second payable by the end of April 2014 thereby earning the right subject to the requisite approvals of the South African Reserve Bank to be issued with FIO shares equalling 35 of that company being partly paid subject to the right to pay an additional US$9 million to become fully paid or be converted into 35 of FIO fully paid The additional US$9 million had to be paid by the earlier of 31 December 2015 and completion of the Moonlight BFS However the second tranche of US$500000 was not received by the Company within the time frame stipulated under the agreement The Company therefore informed AAI of its default and AAI remains in default as at the date of this report Accordingly the first tranche of US$500000 was initially recorded as a current liability On 14 March 2015 the Company terminated the investment agreement between itself and AAI as a result of AAIrsquos breach of a material term of the agreement On 22 July 2015 AAIrsquos lawyers Trowers amp Hamlins issued a letter to the Company requesting that the first tranche be returned to AAI within 14 days from the date of issue They advised that AAI will commence legal proceedings for the recovery of the first tranche plus any interest and costs incurred by AAI On 30 June 2016 after no further correspondence between AAI its lawyers and the Company the Company derecognised an amount of US$364448 leaving a provision of US$135552 for payments received in advance Refer to note 22 for the contingent liability with respect to this matter Note 15 Provisions
incentive plan shares (2300000) (2300000) (265302) (265302)
1280491883 616487353 33049490 31542093
Capital management When managing capital (which is defined as the Companyrsquos total equity) managementrsquos objective is to ensure the entity continues as a going concern as well as to maintain optimal returns to shareholders and benefits for other stakeholders Management also aims to maintain a capital structure that ensures the lowest cost of capital available to the entity As the equity market is constantly changing management may issue new shares to provide for future exploration and development activity The Company is not subject to any externally imposed capital requirements
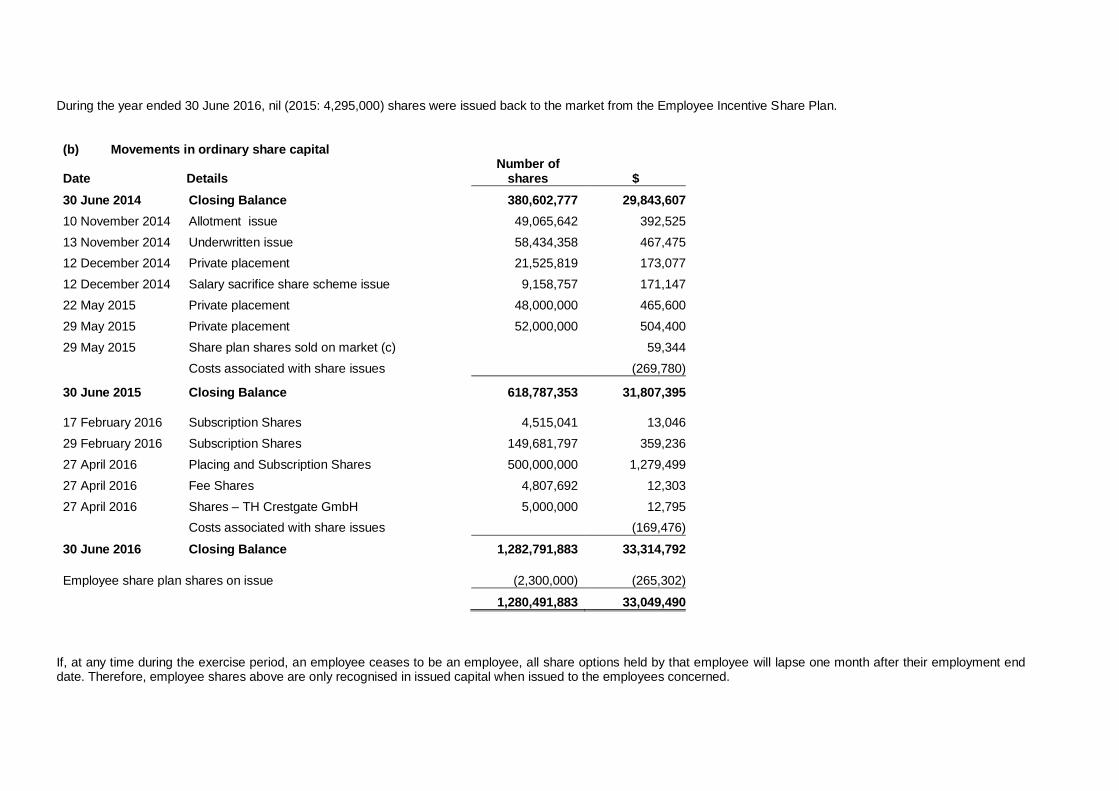
During the year ended 30 June 2016 nil (2015 4295000) shares were issued back to the market from the Employee Incentive Share Plan (b) Movements in ordinary share capital
Date Details Number of
shares $
30 June 2014 Closing Balance 380602777 29843607
10 November 2014 Allotment issue 49065642 392525
13 November 2014 Underwritten issue 58434358 467475
12 December 2014 Private placement 21525819 173077
12 December 2014 Salary sacrifice share scheme issue 9158757 171147
22 May 2015 Private placement 48000000 465600
29 May 2015 Private placement 52000000 504400
29 May 2015 Share plan shares sold on market (c) 59344
Costs associated with share issues (269780)
30 June 2015 Closing Balance 618787353 31807395
17 February 2016 Subscription Shares 4515041 13046
29 February 2016 Subscription Shares 149681797 359236
27 April 2016 Placing and Subscription Shares 500000000 1279499
27 April 2016 Fee Shares 4807692 12303
27 April 2016 Shares ndash TH Crestgate GmbH 5000000 12795
Costs associated with share issues (169476)
30 June 2016 Closing Balance 1282791883 33314792
Employee share plan shares on issue (2300000) (265302)
1280491883 33049490
If at any time during the exercise period an employee ceases to be an employee all share options held by that employee will lapse one month after their employment end date Therefore employee shares above are only recognised in issued capital when issued to the employees concerned
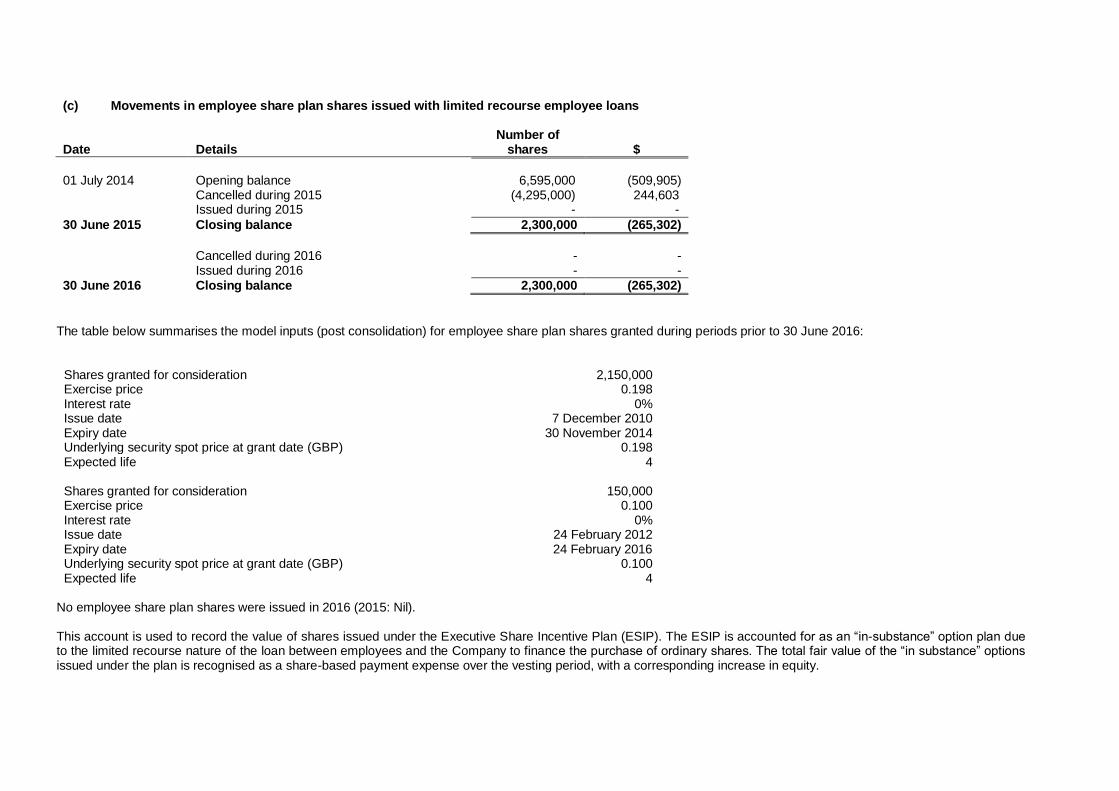
(c) Movements in employee share plan shares issued with limited recourse employee loans
Date Details Number of
shares $
01 July 2014 Opening balance 6595000 (509905) Cancelled during 2015 (4295000) 244603 Issued during 2015 - -
30 June 2015 Closing balance 2300000 (265302)
Cancelled during 2016 - - Issued during 2016 - -
30 June 2016 Closing balance 2300000 (265302)
The table below summarises the model inputs (post consolidation) for employee share plan shares granted during periods prior to 30 June 2016
Shares granted for consideration
2150000
Exercise price 0198 Interest rate 0 Issue date 7 December 2010 Expiry date 30 November 2014 Underlying security spot price at grant date (GBP) 0198 Expected life 4 Shares granted for consideration
150000
Exercise price 0100 Interest rate 0 Issue date 24 February 2012 Expiry date 24 February 2016 Underlying security spot price at grant date (GBP) 0100 Expected life 4
No employee share plan shares were issued in 2016 (2015 Nil) This account is used to record the value of shares issued under the Executive Share Incentive Plan (ESIP) The ESIP is accounted for as an ldquoin-substancerdquo option plan due to the limited recourse nature of the loan between employees and the Company to finance the purchase of ordinary shares The total fair value of the ldquoin substancerdquo options issued under the plan is recognised as a share-based payment expense over the vesting period with a corresponding increase in equity
Note 17 Listed Options
2016 2015
No of Options No of Options
Options
At year end the following options were on issue
- 21 November 2016 Options exercisable at 3 cents per share 500000 500000
- 19 February 2017 Options exercisable at 8 cents per share 2500000 2500000
- 2 February 2018 Options exercisable at GBP00075 per share 2000000 2000000
- 2 February 2018 Options exercisable at GBP002 per share 3000000 3000000
- 1 March 2018 Options exercisable at GBP00075 per share 2000000 2000000
- 1 March 2018 Options exercisable at GBP002 per share 3000000 3000000
- 12 May 2016 Unlisted options issued to investors 500000000 -
513000000 13000000
2016 2015
Movements in 21 November 2016 Options No of Options No of Options
Beginning of the financial year 500000 500000
Options issued during the year - -
Options cancelled during the year - -
End of the financial year 500000 500000
Movements in 19 February 2017 Options
Beginning of the financial year 2500000 2500000
Options issued during the year - -
Options cancelled during the year - -
End of the financial year 2500000 2500000
Movements in 2 February 2018 Options
Beginning of the financial year 5000000 -
Options issued during the year - 5000000
Options cancelled during the year - -
End of the financial year 5000000 5000000
Movements in 1 March 2018 Options
Beginning of the financial year 5000000 -
Options issued during the year - 5000000
Options cancelled during the year - -
End of the financial year 5000000 5000000
Movement in 12 May 2018 unlisted options issued to investors
Beginning of the financial year - -
Options issued during the year 500000000 -
Options cancelled during the year - -
End of the financial year 500000000 -
The table below summarises the model inputs (post consolidation) for investor options granted during the year ended 30 June 2016
Options granted for consideration
500000000
Exercise price (GBP) 000165 Issue date 12 May 2016 Expiry date 12 May 2018 Underlying security spot price at grant date (GBP) 000165 Expected life 2
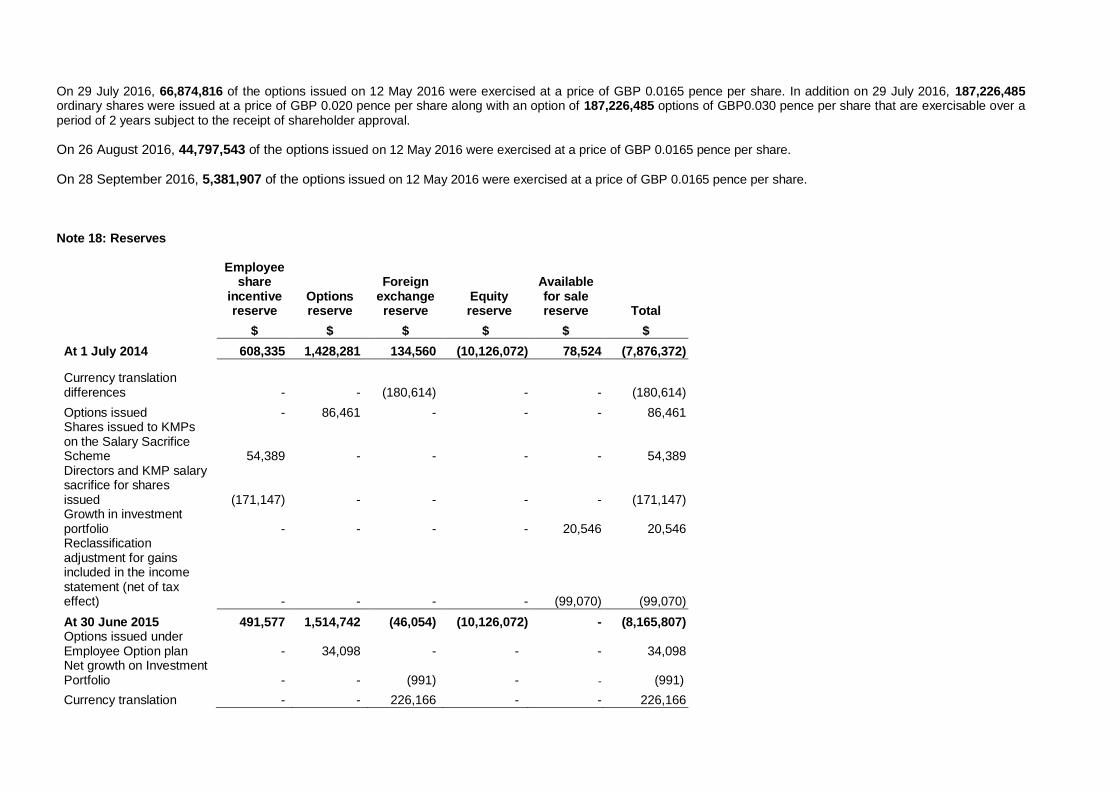
Movements after 30 June 2016
On 29 July 2016 66874816 of the options issued on 12 May 2016 were exercised at a price of GBP 00165 pence per share In addition on 29 July 2016 187226485 ordinary shares were issued at a price of GBP 0020 pence per share along with an option of 187226485 options of GBP0030 pence per share that are exercisable over a period of 2 years subject to the receipt of shareholder approval
On 26 August 2016 44797543 of the options issued on 12 May 2016 were exercised at a price of GBP 00165 pence per share
On 28 September 2016 5381907 of the options issued on 12 May 2016 were exercised at a price of GBP 00165 pence per share
Note 18 Reserves
Employee share
incentive reserve
Options reserve
Foreign
exchange reserve
Equity reserve
Available for sale reserve
Total
$ $ $ $ $ $
At 1 July 2014 608335 1428281 134560 (10126072) 78524 (7876372)
Options issued - 86461 - - - 86461 Shares issued to KMPs on the Salary Sacrifice Scheme 54389 - - - - 54389 Directors and KMP salary sacrifice for shares issued (171147) - - - - (171147) Growth in investment portfolio - - - - 20546 20546 Reclassification adjustment for gains included in the income statement (net of tax effect) - - - - (99070) (99070)
At 30 June 2015 491577 1514742 (46054) (10126072) - (8165807) Options issued under Employee Option plan - 34098 - - - 34098 Net growth on Investment Portfolio - - (991) - - (991)
Currency translation - - 226166 - - 226166
differences
At 30 June 2016 491577 1548840 179121 (10126072) - (7906534)
^This amount includes remuneration to KMPs and Directors that was accrued and will ultimately be settled in shares under the Companyrsquos salary sacrifice scheme
Nature and purpose of reserves
Employee share incentive reserve This reserve is used to record the value of equity benefits provided to employees consultants and directors as part of their remuneration under the Executive Share Incentive
Plan
Options reserve This reserve is used to record the value of options issued other than share-based payments to directors employees and consultants as part of their remuneration Foreign currency translation reserve The foreign currency translation reserve is used to record exchange differences arising from the translation of the financial statements of foreign subsidiaries Equity reserve The Equity reserve is used to record the acquisition of the non-controlling interest by the Group and to record differences between the carrying value of non-controlling interests and the consideration paid received where there has been a transaction involving non-controlling interests that do not result in a loss of control The reserve is attributable to the equity of the parent Available-for-sale reserve Used to record changes in the fair value of the Grouprsquos available-for-sale financial assets Note 19 Accumulated losses
2016 2015
$ $
Accumulated losses at the beginning of the financial year
(22850764) (20504904)
Net loss for the year (1573533) (2345860)
Accumulated losses at the end of the financial year (24424297) (22850764)
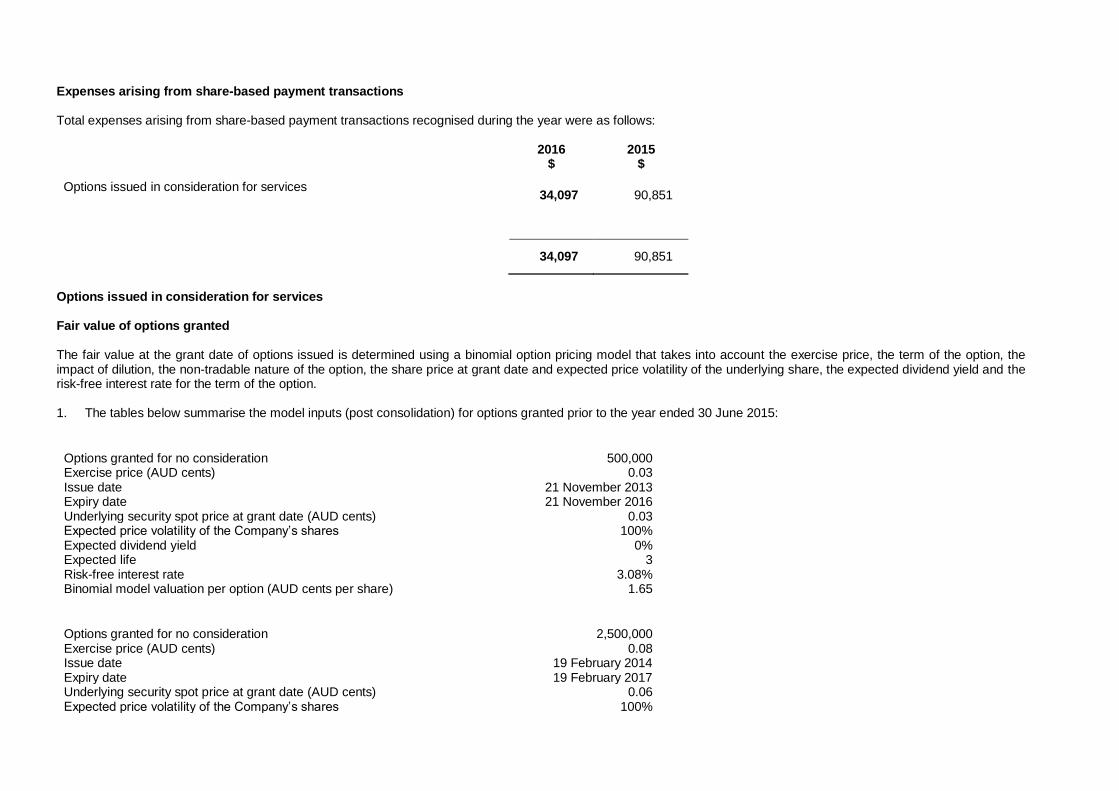
Note 20 Share based payments
Expenses arising from share-based payment transactions Total expenses arising from share-based payment transactions recognised during the year were as follows
2016
$ 2015
$
Options issued in consideration for services 34097 90851
34097 90851
Options issued in consideration for services Fair value of options granted The fair value at the grant date of options issued is determined using a binomial option pricing model that takes into account the exercise price the term of the option the impact of dilution the non-tradable nature of the option the share price at grant date and expected price volatility of the underlying share the expected dividend yield and the risk-free interest rate for the term of the option 1 The tables below summarise the model inputs (post consolidation) for options granted prior to the year ended 30 June 2015
Options granted for no consideration 500000 Exercise price (AUD cents) 003 Issue date 21 November 2013 Expiry date 21 November 2016 Underlying security spot price at grant date (AUD cents) 003 Expected price volatility of the Companyrsquos shares 100 Expected dividend yield 0 Expected life 3 Risk-free interest rate 308 Binomial model valuation per option (AUD cents per share) 165
Options granted for no consideration 2500000 Exercise price (AUD cents) 008 Issue date 19 February 2014 Expiry date 19 February 2017 Underlying security spot price at grant date (AUD cents) 006 Expected price volatility of the Companyrsquos shares 100
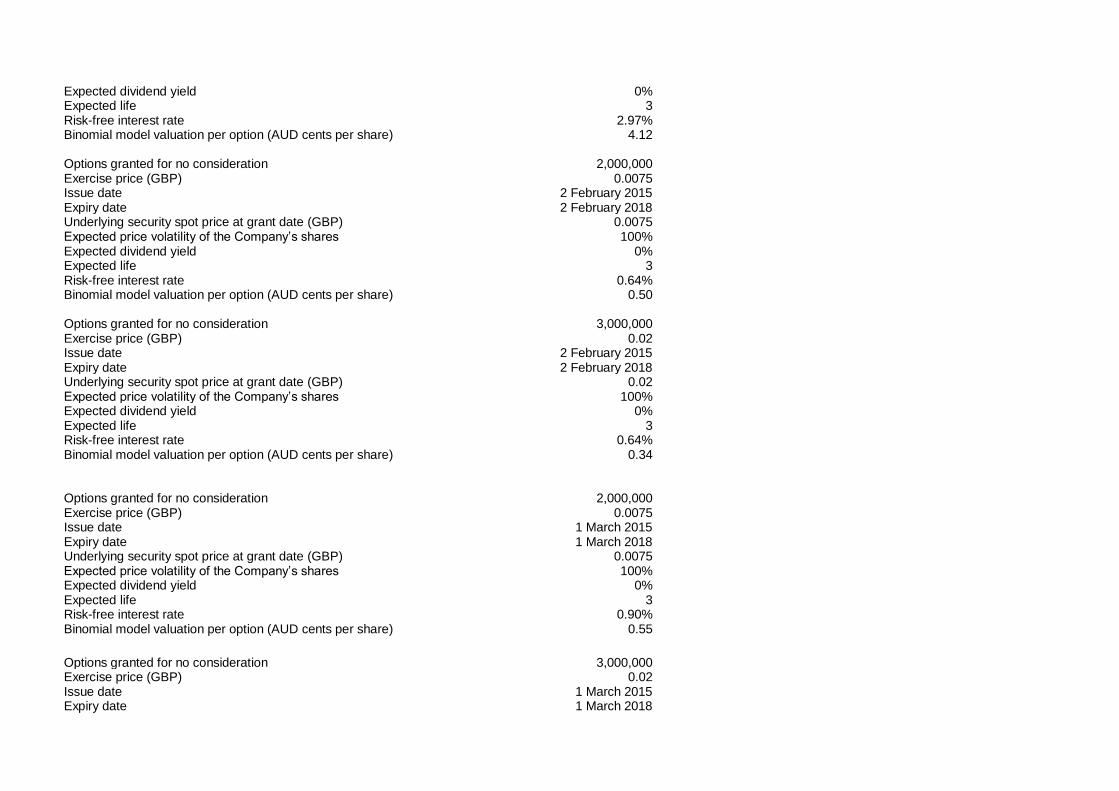
Expected dividend yield 0 Expected life 3 Risk-free interest rate 297 Binomial model valuation per option (AUD cents per share) 412
Options granted for no consideration 2000000 Exercise price (GBP) 00075 Issue date 2 February 2015 Expiry date 2 February 2018 Underlying security spot price at grant date (GBP) 00075 Expected price volatility of the Companyrsquos shares 100 Expected dividend yield 0 Expected life 3 Risk-free interest rate 064 Binomial model valuation per option (AUD cents per share) 050 Options granted for no consideration 3000000 Exercise price (GBP) 002 Issue date 2 February 2015 Expiry date 2 February 2018 Underlying security spot price at grant date (GBP) 002 Expected price volatility of the Companyrsquos shares 100 Expected dividend yield 0 Expected life 3 Risk-free interest rate 064 Binomial model valuation per option (AUD cents per share) 034
Options granted for no consideration 2000000 Exercise price (GBP) 00075 Issue date 1 March 2015 Expiry date 1 March 2018 Underlying security spot price at grant date (GBP) 00075 Expected price volatility of the Companyrsquos shares 100 Expected dividend yield 0 Expected life 3 Risk-free interest rate 090 Binomial model valuation per option (AUD cents per share) 055
Options granted for no consideration
3000000
Exercise price (GBP) 002 Issue date 1 March 2015 Expiry date 1 March 2018
Underlying security spot price at grant date (GBP) 002 Expected price volatility of the Companyrsquos shares 100 Expected dividend yield 0 Expected life 3 Risk-free interest rate 090 Binomial model valuation per option (AUD cents per share)
037
Movements
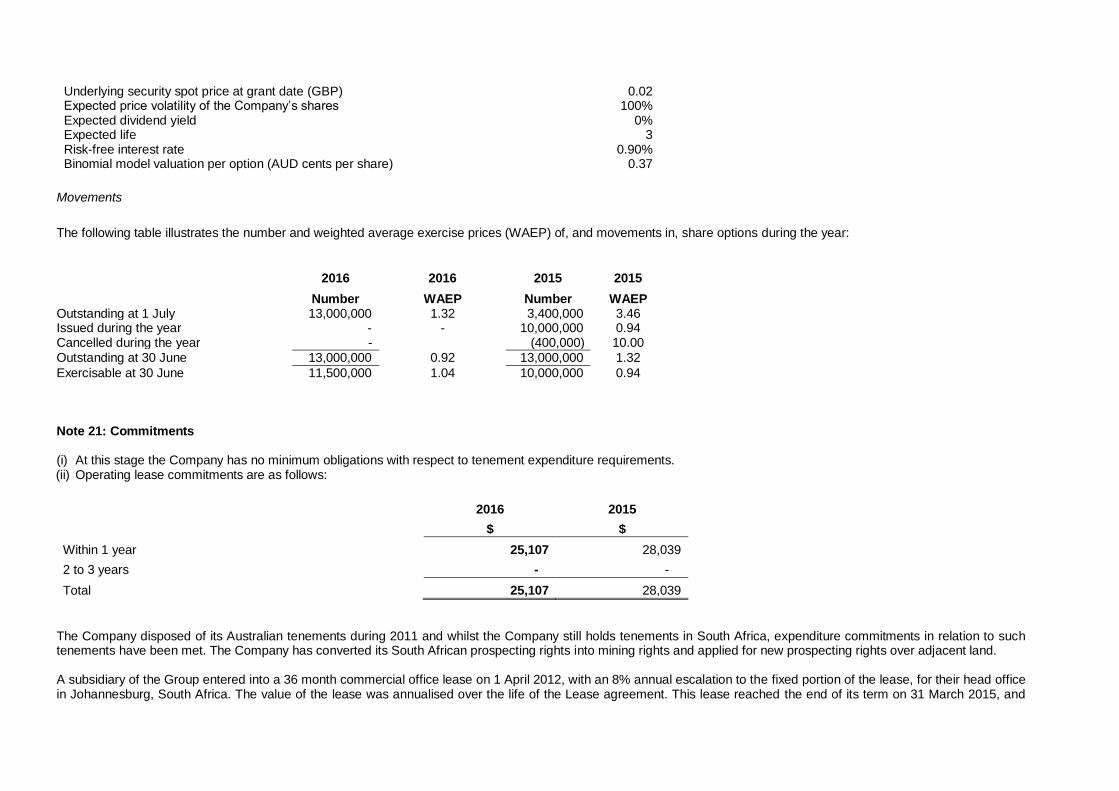
The following table illustrates the number and weighted average exercise prices (WAEP) of and movements in share options during the year
2016
Number
2016
WAEP
2015
Number
2015
WAEP Outstanding at 1 July 13000000 132 3400000 346 Issued during the year - - 10000000 094 Cancelled during the year - (400000) 1000
Outstanding at 30 June 13000000 092 13000000 132
Exercisable at 30 June 11500000 104 10000000 094 Note 21 Commitments
(i) At this stage the Company has no minimum obligations with respect to tenement expenditure requirements (ii) Operating lease commitments are as follows
2016 2015
$ $
Within 1 year 25107 28039
2 to 3 years - -
Total 25107 28039
The Company disposed of its Australian tenements during 2011 and whilst the Company still holds tenements in South Africa expenditure commitments in relation to such tenements have been met The Company has converted its South African prospecting rights into mining rights and applied for new prospecting rights over adjacent land A subsidiary of the Group entered into a 36 month commercial office lease on 1 April 2012 with an 8 annual escalation to the fixed portion of the lease for their head office in Johannesburg South Africa The value of the lease was annualised over the life of the Lease agreement This lease reached the end of its term on 31 March 2015 and
had a renewal period for a further 3 years commencing 1 April 2015 but was only renewed for a period of 1 year until 31 March 2016 During February 2016 the lease was renewed for a further period of 12 months until 31 March 2017 Note 22 Contingent liabilities
The Company received USD500000 from AAI during March 2014 as part of AAIrsquos advanced payment for a percentage ownership of the Companyrsquos subsidiary FIO The transaction was never formaly finalised and on 30 June 2016 the Company transferred the amount of USD364448 from provision for payments received in advance to sundry income to cover expenses incurred by the Company subsequent to AAIrsquos default leaving a value of US$135552 in provision for payments received in advance The matter is contingent liability as the likelihood of probable outflow is not considered remote at this point in time and the Company may be exposed to repay the investment amount of USD 500000 or part thereof subject to the Companyrsquos ability to prove its loss and damages suffered as a result of AAIrsquos breach of contract Note 23 Related party transactions Compensation of Key Management Personnel
2016 2015
$ $
Short-term employee benefits 716803 828463
Post-employment benefits 26849 37539
Share based payments 34097 85675
Termination benefits - -
777749 951678
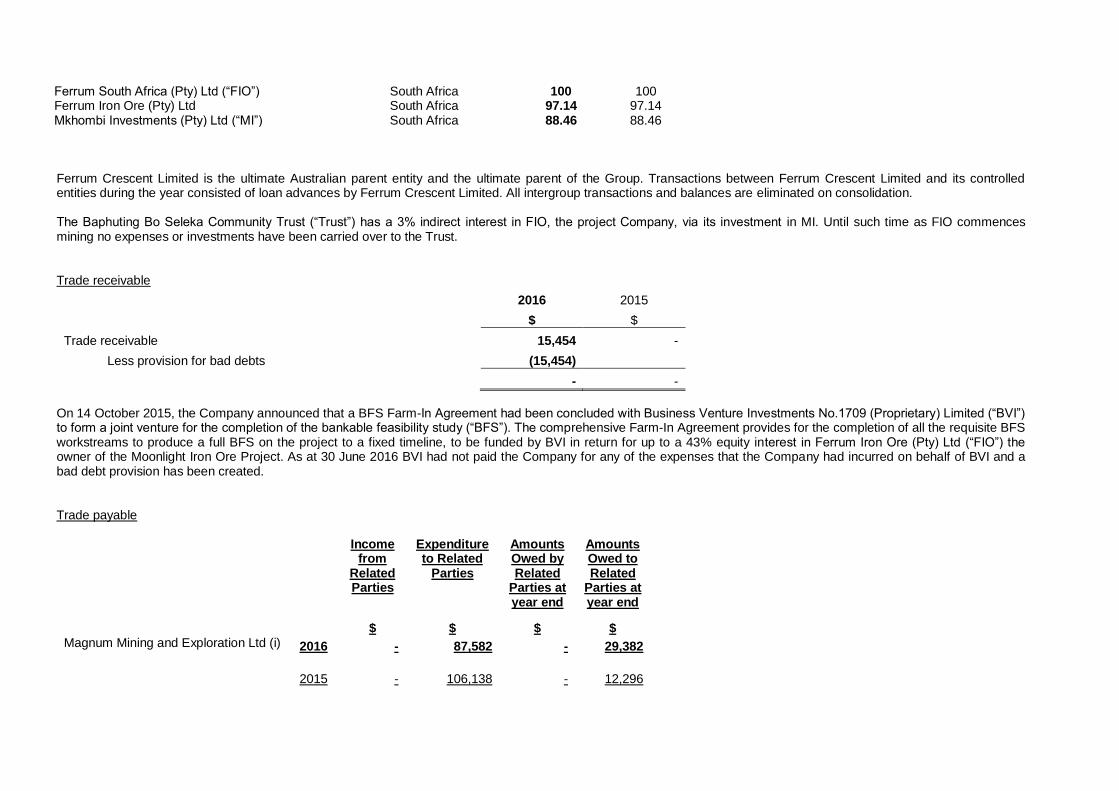
Transactions between related parties are on normal commercial terms and conditions and no more favourable than those available to other parties unless otherwise stated Subsidiaries The consolidated financial statements include the financial statements of Ferrum Crescent Limited and the subsidiaries listed in the following table
Ferrum South Africa (Pty) Ltd (ldquoFIOrdquo) South Africa 100 100 Ferrum Iron Ore (Pty) Ltd South Africa 9714 9714 Mkhombi Investments (Pty) Ltd (ldquoMIrdquo) South Africa 8846 8846 Ferrum Crescent Limited is the ultimate Australian parent entity and the ultimate parent of the Group Transactions between Ferrum Crescent Limited and its controlled entities during the year consisted of loan advances by Ferrum Crescent Limited All intergroup transactions and balances are eliminated on consolidation The Baphuting Bo Seleka Community Trust (ldquoTrustrdquo) has a 3 indirect interest in FIO the project Company via its investment in MI Until such time as FIO commences mining no expenses or investments have been carried over to the Trust Trade receivable
2016 2015
$ $
Trade receivable 15454 -
Less provision for bad debts (15454)
- -
On 14 October 2015 the Company announced that a BFS Farm-In Agreement had been concluded with Business Venture Investments No1709 (Proprietary) Limited (ldquoBVIrdquo) to form a joint venture for the completion of the bankable feasibility study (ldquoBFSrdquo) The comprehensive Farm-In Agreement provides for the completion of all the requisite BFS workstreams to produce a full BFS on the project to a fixed timeline to be funded by BVI in return for up to a 43 equity interest in Ferrum Iron Ore (Pty) Ltd (ldquoFIOrdquo) the owner of the Moonlight Iron Ore Project As at 30 June 2016 BVI had not paid the Company for any of the expenses that the Company had incurred on behalf of BVI and a bad debt provision has been created Trade payable
Income from
Related Parties
Expenditure to Related
Parties
Amounts Owed by Related
Parties at year end
Amounts Owed to Related
Parties at year end
$ $ $ $
Magnum Mining and Exploration Ltd (i) 2016 - 87582 - 29382
2015 - 106138 - 12296
(i) Mr G Button a non-executive director and company secretary for the Company is also a director of Magnum Mining and Exploration Ltd During the year Magnum Mining and Exploration Ltd received the above fees for office rental office running costs and staffing expenses These fees are based on normal commercial terms and conditions Loans to (from) related parties The following transactions were undertaken between the Company executive officers and director-related entities during 2016 and 2015
2016 2015
$ $
Consulting fees were paid or accrued to Camcove Pty Ltd a company of which Robert Hair is a director and shareholder 60000 60000 Consulting fees were paid or accrued to Tavistock Communications Limited a company of which Merlin Mar-Johnson is an Employee 15672 - Directors fees were paid or accrued to Metallurgical Management Services Pty Ltd a company of which Dr Evan Kirby is a director 7500 -
83172 60000
Note 24 Cash flow information
2016 2015
$ $
Reconciliation of cash flow from operations with loss from ordinary activities after income tax
Loss from ordinary activities after income tax (1573533) (2345860)
Depreciation 11638 18580
Loss (profit) on sale of plant and equipment (8609) -
Profit on sale of available for sale financial assets (649) (137597)
Fair value adjustment of forward subscription agreement - 208375
Share based payment compensation 34097 90851
Net foreign exchange differences 368404 (54155)
Movement of Bad debts 16056 -
Proceeds from third party funding (490850) - Changes in assets and liabilities
(Increase) decrease in receivables (12001) (174766)
(Increase) decrease in other operating assets 31399 (24758)
Increase (decrease) in payables and provisions 45298 (194914)
Cash flows used in operations (1578750) (2575785)
Note 25 Financial risk management objectives and policies
The Grouprsquos principal financial instruments comprise cash short term deposits held-for-trading and derivative instruments
The main purpose of the financial instruments is to finance the Grouprsquos operations The Company also has other financial instruments such as trade debtors and creditors which arise directly from its operations
The main risks arising from the Grouprsquos financial instruments are interest rate risk liquidity risk foreign currency risk and credit risk The board reviews and agrees policies for managing each of these risks and they are summarised below
(a) Interest Rate Risk The Grouprsquos exposure to interest rate risk which is the risk that a financial instrumentrsquos value will fluctuate as a result of changes in market interest rates and the effective weighted average interest rate for each class of financial assets and financial liabilities is set out in the following table Also included is the effect on profit and equity after tax if interest rates at that date had been 10 higher or lower with all other variables held constant as a sensitivity analysis The Group has not entered into any hedging activities to manage interest rate risk In regard to its interest rate risk the Group continuously analyses its exposure Within this analysis consideration is given to potential renewals of existing positions alternative investments and the mix of fixed and variable interest rates
Weighted Floating Fixed Non Interest Rate
Risk Sensitivity
Average Effective Interest Interest Interest
-10 +10
Interest Rate Rate Rate Bearing Total
Profit
Equity
Profit
Equity
$ $ $ $
$
$
$
$
2016
Financial Assets
Cash 005 730546 - 12718 743264 (319) - 319 -
Trust deposits 000 75 - 29229 29303 - - - -
Receivables 000 - - 33929 33929 - - - -
Investments 112 64715 - - 64715 (524) - 524 -
Financial asset 000 - - - - - - - -
Total Financial Assets 795336 - 75876 871211
Financial Liabilities
Trade and other payables - - 439549 439549 - - - -
Total Financial Assets 1055565 136490 79714 1271769
Financial Liabilities
Trade and other payables - - 803892 803892 - - - -
Total Financial Liabilities - - 803892 803892
A sensitivity of 10 has been selected as this is considered reasonable given the current level of both short term and long term Australian dollar interest rates A -10 sensitivity would move short term interest rates at 30 June 2016 from around 2 to 18 representing a 20 basis point downwards shift (1400 basis points net of tax) Based on the sensitivity analysis mainly interest revenue from variable rate deposits cash balances and investment is impacted resulting in a decrease or increase in overall income (b) Liquidity Risk The Group manages liquidity risk by maintaining sufficient cash reserves and marketable securities required to meet the current exploration and administration commitments through the continuous monitoring of actual cash flows Ultimate responsibility for liquidity risk management rests with the board of directors who have built an appropriate liquidity risk management framework for the management of the Grouprsquos short medium and long term funding and liquidity management requirements Less
(c) Credit Risk Credit risk arises in the event that counterparty will not meet its obligations under a financial instrument leading to financial losses The Company is exposed to credit risk from its operating activities and financing activities including deposits with banks and investments with insurance companies The credit risk control procedures adopted by the Company is to assess the credit quality of the institution with whom funds are deposited or invested taking into account its financial position and past experiences The maximum exposure to credit risk on financial assets of the Company which have been recognised on the statement of financial position is generally limited to the carrying amount Cash is maintained with National Australia Bank and the Standard Bank of South Africa The investment in mining rehabilitation insurance policy is invested by Guardrisk in the following investments
Type of Investment Type of interest
Unit trust ndash monthly contributing Floating interest rate
Unit trust ndash fixed investment (paid out during FY2016) Floating interest rate
Money market Floating interest rate
Current account Non-interest bearing
(d) Foreign Exchange Risk The Group undertakes certain transactions denominated in foreign currencies hence exposures to exchange rate fluctuations arise The carrying amount of the Grouprsquos foreign currency denominated monetary assets and monetary liabilities at the reporting date is as follows
Liabilities Assets 2016
$ 2015
$ 2016
$ 2015
$
Great British Pounds (GBP) (631013) (653422) 621213 670765 South African Rand (ZAR) (179) (16208) 179 16208 United States Dollars (USD) 15094 64679 - -
Foreign currency sensitivity analysis The Group is exposed to Great British Pound (GBP) United States Dollar (USD) and South African Rand (ZAR) currency fluctuations The following table details the Grouprsquos sensitivity to a 10 increase and decrease in the Australian Dollar (AUD) against the relevant currencies 10 is the sensitivity rate used when reporting foreign currency risk internally to key management personnel and represents managementrsquos assessment of the possible change in foreign exchange rates The sensitivity analysis includes only outstanding foreign currency denominated monetary items and adjusts their translation at the period end for a 10 change in foreign currency rates The sensitivity analysis includes cash balances held in GBP ZAR and USD which give rise to a foreign currency gain or loss on revaluation A positive number indicates an increase in profit and other equity where the AUD strengthens against the ZAR In relation to cash balances held in GBP a positive number indicates an increase in profit and other equity where the Australian Dollar strengthens against the respective currency For a weakening Australian Dollar against the respective currency there would be an equal and opposite impact on the profit and other equity and the balances below would be negative
2016 2015
Profit (loss) $
Equity increase (decrease)
$
Profit (loss)
$
Equity increase (decrease)
$
- AUD strengthens 10
- ZAR - GBP - USD
(18) (63101)
2890
18 63101 (2890)
(1621) (65342) 12268
1621 65342
(12268) AUD weakens 10
- ZAR - GBP - USD
18 63101 (2890)
(18) (63101)
2890
1621 65342
(12268)
(1621) (65342) 12268
(e) Fair value
The fair values of cash trade and other receivables and trade and other payables approximate their carrying values as a result of their short maturity or because they carry floating rates
(i) Fair value of financial instruments measured at fair value For financial instruments carried at fair value the Group adopts various methods in estimating fair value The methods comprise Level 1 ndash the fair value is calculated using quoted prices in an active market Level 2 ndash the fair value is estimated using inputs other than quoted prices included in Level 1 that are observable for the asset or liability either directly (as prices) or indirectly (derived from prices) Level 3 ndash the fair value is estimated using inputs for the asset or liability that are not based on observable market data
Jun 2016 Jun 2015
AUD AUD
Level 2
Available for sale financial assets 64715 187048
For financial instruments not quoted in active markets the Group uses valuation techniques such as other relevant models used by market participants which may include inputs derived from quoted prices in an active market (Level 2) These valuation techniques use both observable and unobservable market inputs Note 26 Parent Entity Information
2016 2015
$ $
Current assets 742467 934073
Total assets 986159 934474
On 30 November 2009 Ferrum Crescent Limited (formerly Washington Resources Ltd) (ldquoFCRrdquo) completed the legal acquisition of Ferrum Metals Limited (formerly Ferrum Crescent Limited) (ldquoFMLrdquo) Under the terms of AASB 3 Business Combinations (Revised) FML was deemed to be the accounting acquirer in the business combination The transaction was therefore accounted for as a reverse acquisition The Parent entity therefore had issued capital of $25620916 as opposed to the Grouprsquos consolidated issued capital of $28366383 For further details please refer to the disclosures contained within the 30 June 2010 Annual Report There have been no guarantees entered into by the parent entity in relation to any debts of its subsidiaries The parent entity has no contingent liabilities as at 30 June 2016 (2015 Nil) Note 27 Subsequent events
Subsequent to the Company entering into an exclusive option to acquire 100 percent of GoldQuest two nil-cost extensions were granted to Ferrum Crescent and on 22 September 2016 the option was exercised Accordingly the Company has acquired 100 per cent of the share capital of GoldQuest Iberica SL (ldquoGoldQuestrdquo) GoldQuest owns 100 per cent of two lead-zinc exploration projects in the provinces of Leόn and Galicia in historic Spanish mining areas (the ldquoIberian Projectsrdquo) Consideration comprised GBP326500 in cash and the issue of 100 million new ordinary shares in the capital of Ferrum Crescent
On 25 July 2016 the Company announced that it had conditionally raised in aggregate GBP 374453 (AU$655034) before expenses through a placement via Beaufort Securities Limited as agent to the Company of 187226485 new ordinary shares of no par value each in the capital of the Company at a price of 020 pence per new ordinary share As part of the placing each investor was offered subject to shareholder approval in accordance with the ASX Listing Rules options on the basis of one option for every share subscribed pursuant to the placing Each option will entitle the holder to subscribe for a further new ordinary share at a price of 030 pence per share for an exercise period of two years following the date of admission of the placing shares trading on AIM In addition the Company has agreed to grant further 18722649 options to Beaufort Securities Limited on the same terms Following admission the total issued ordinary share capital of the Company was 1470018368 ordinary shares On 28 July 2016 the Company announced that it was issuing 66874816 new ordinary shares of no par value each in the capital of the Company as a result of the exercise of in aggregate 66874816 options exercisable at a price of 0165 pence per share raising AUD 193025 before expenses Such options were granted in
Current liabilities 216061 129863
Total liabilities 216061 129863
Issued capital 37362411 35855014
Accumulated Losses (32278633) (30702626)
Reserves 4313679 4347776
Total shareholdersrsquo equity 770099 804612
Profit (loss) of the parent entity (1576006) (2466304)
Total comprehensive (loss) income (1347367) (2725442)
connection with the Companyrsquos placing and subscription announced on 27 April 2016 Following the issue of the option shares and the abovementioned placing shares the total issued ordinary share capital of the Company was 1536893184 ordinary shares
On 26 August 2016 the Company announced that it was issuing 44797543 new ordinary shares of no par value each in the capital of the Company as a result of the exercise of in aggregate a further 44797543 options exercisable at a price of 0165 pence per share raising AUD 128184 before expenses Such options were granted in connection with the Companyrsquos placing and subscription announced on 27 April 2016 Following the issue of these option shares the total issued ordinary share capital of the Company was 1581690727 ordinary shares
On 23 September 2016 the Company announced that was issuing 5381907 new ordinary shares of no par value each in the capital of the Company as a result of the exercise of in aggregate 5381907 options exercisable at a price of 0165 pence per share Such options were granted in connection with the Companyrsquos placing and subscription announced on 27 April 2016 Following the issue of these further option shares the total issued ordinary share capital of the Company is 1587072634 ordinary shares On 29 September 2016 the Company announced the following proxy results of the General Meeting of Shareholders held on said date in respect of the resolutions set out in the Notice of General Meeting dated 23 August 2016 Resolution 12 and 3 were passed on a show of hands Resolution 1 Ratification of prior issue of Shares Resolution 2 Approval of grant of Placement Options Resolution 3 Approval of grant of Broker Options Also on 29 September 2016 the Company also announced that it was issuing 100000000 new ordinary shares of no par value each in the capital of the Company to GoldQuest Mining (Spain) Corp on 30
th September 2016 These shares will be issued in settlement of the share element of the consideration for the acquisition of
100 per cent of the issued share capital of GoldQuest Iberica SL The shares will be fully paid and rank pari passu in all respects with the Companyrsquos existing ordinary shares Following the issue of the shares the total issued ordinary share capital of the Company is 1687072634 ordinary shares ASX Requirements Distribution schedules of shareholders and statements of voting rights are set out in Table 1 whilst the Companyrsquos top twenty shareholders are shown in Table 2 Substantial shareholder notices that have been received by the Company are set out in Table 3 and the tenement schedule as at 30 June 2016 is set out in Table 4
Table 1 Shareholder spread
Ordinary shares with right to attend meetings and vote personally or by proxy through show of hands and if required by ballot (one vote for each share held) 1-1000 73 1001-5000 107 5001-10000 91 10001-100000 248
100001 - and over 225
Total holders of ordinary shares Total number of ordinary shares
744 1282791883
Options with no right to attend meetings or vote personally or by proxy 1-1000 - 1001-5000 - 5001-10000 - 10001-100000 - 100001 - and over 26 Total holders of options Total number of options
26 513000000
Table 2 Top twenty shareholders
Shareholder Number of shares Percentage
Hargreaves Lansdown (Nominees) Limited 135556381 1057 Barclayshare Nominees Limited 131190328 1023 TD Direct Investing Nominees (Europe) Limited 110415308 861 HSDL Nominees Limited 89981899 702 Redmayne (Nominees) Limited 87434315 682 The Bank of New York (Nominees) Limited 42764600 334 Investor Nominees Limited 41961925 327 Rathbone Nominees Limited 34638909 270 Mr E F G Nealon 26484421 202 Mkhombi Amamato (Pty) Ltd 25281620 197 W B Nominees Limited 24624206 192 Citicorp Nominees Pty Ltd 23269017 181 HSBC Client Holdings Nominee (UK) Limited 22498050 175 IG Markets Limited 22407431 175 Lawshare Nominees Limited 22170630 173 JIM Nominees Limited 20714889 162 Wealth Nominees Limited 20265279 158 Vidacos Nominees Limited 17596041 137 Pershing Nominees Limited 16313425 127 Share Nominees Ltd 15232852 119
Voting Rights The voting rights attached to each class of equity securities are set out below (a) Ordinary shares On a show of hands every member present at a meeting in person or by proxy shall have one vote and upon a poll each share shall have one vote Table 4 Tenement schedule as at 30 June 2016
Project Tenement Number Tenement Status Holder Percentage
Interest
Moonlight 305122201 MR Mining Right
Granted Ferrum Iron Ore
(Pty) Ltd 97
Moonlight
LP30611211868PR Prospecting
Application Ferrum Iron Ore
(Pty) Ltd 97
JSE Limited Requirements
Headline earnings reconciliation 2016 2015
$ $
Loss attributable to ordinary equity holders of the parent entity (1573533) (2345860)
Add back IAS 16 loss on the disposal of plant and equipment (8609) -
Less profit on sale of available for sale investments 649 (137597)
Total tax effects of adjustments (182) 38527
Headline loss (1581675) (2444930)
Basic loss per share (1573533) (2345860)
Weighted average shares in issue 714611971 468894041
Basic loss per share (cents) (022) (050)
Headline loss (1581675) (2444930)
Weighted average shares in issue 714611971 468894041
Elliot Hance T +44 (0)20 7382 8300 Bravura Capital (Pty) Ltd (JSE Sponsor)
Doneacute Hattingh T (direct) +27 11 459 5037
The directors accept full responsibility for the information contained in this announcement The auditorrsquos unqualified report is available for inspection at the Companyrsquos registered office in Australia and at the Companyrsquos office at Block B Regent Hill Office Park cnr Leslie amp Turley Rds Lonehill 2062 for 28 business days from release of this announcement Extracts from the Companyrsquos Full audited Report and Accounts are set out below Introduction to the Group Ferrum Crescent Limited (ldquoFerrumrdquo ldquoFCRrdquo or the ldquoCompanyrdquo) is an Australian company listed on the Australian Securities Exchange (ASX FCR) and on the JSE Limited (JSE FCR) and quoted on the AIM market of the London Stock Exchange plc (AIM FCR) Review of operations and activities Ferrum seeks to capitalise on the future demand for high quality iron products worldwide by producing a premium material that can be used in the manufacture of steel in electric arc furnaces The Moonlight Deposit (upon which the Moonlight Project is based) is a magnetite deposit located on the farms Moonlight Gouda Fontein and Julietta in Limpopo Province in the north of South Africa (see Figure 2) and is the main operational focus for the Company Iron and Steel Industrial Corporation (South Africa) (ldquoIscorrdquo) which explored the Project in the 1980s and lsquo90s reported mineralisation capable of producing a concentrate grading at 687 iron At that time Iscor concluded that the deposit which was described as comparable to the worlds best was easily mineable due to its low waste-to-ore ratio The beneficiation attributes of Moonlight ore are extremely impressive with low-intensity magnetic separation considered suitable for optimum concentration Metallurgical tests on Moonlight material undertaken since then by Ferrum suggest that Iscors results are conservative that good metal recoveries can be achieved and that the resulting concentrates have a high iron content and only negligible impurities Grind sizes of between 125 to 250 microns produces recoveries of 42-45 and grades of 68-70 Fe Importantly the Moonlight material should be amenable to the manufacture of direct reduction (ldquoDRrdquo) grade iron pellets which are in high demand by modern steel manufacturers
Various key components of a BFS have already been concluded on the Project with significant milestones achieved to date including
Definition and reporting of an independent JORC Code (2012) compliant Mineral Resource estimate of 3077Mt at 269 Fe of which the Inferred category is estimated to contain 1721Mt at 253 Fe the Indicated - 83Mt at 274 Fe and Measured - 526Mt at 313 Fe (May 2012)
30 year Mining Right granted
Environmental licence (EIA) in place for the Moonlight Project mining area (approved 4 April 2013)
Metallurgical test work indicates high quality product in excess of 69 iron and low deleterious elements possible
The Company is now seeking to progress the BFS work which will focus on the initial production of high grade magnetite concentrate in order to accelerate the projectrsquos production schedule As a potential producer of a high-grade iron ore product the final assessment of Moonlightrsquos capability to operate and process ore at an industrial scale is all important Metallurgists continue to work closely with geologists to identify key areas for representative sample selection for advanced metallurgical testing including a pilot test work programme Immediate test work will focus on optimising grind size vs iron recovery Future work will also focus on optimising the pelletising process including an assessment of temperature profiling and treatment times
Work to date on mine planning has been based on a contract mining model for site development overburden removal and general open pit mining activities A low stripping ratio is expected 115 during the early years of operations (relatively shallow dips with occurrence of up to 4 magnetite-bearing zones)
Feasibility study requirements that still need to be completed include
geotechnical drilling (part complete) mine design mine reserve estimation based on certain cut-off estimates and economic criteria and a final estimate of mining costs from an adjudicated tender process for contract mining
finalising pipeline route for environmental impact study completion
optimising pipeline design and costing (finalising rheology density and particle size distribution)
finalising negotiations with Eskom (power) for capital costs and tariffs once miningprocess demandschedules are finalised for the anticipated 50-60MW needed for concentrate production and
finalising negotiations with Transnet (rail and port) for planning and costing of loading unloading facilities wagon and locomotive requirements and port handling and storage costs Transnet will need to review the Projectrsquos infrastructure requirements as part of the feasibility component and finalisation of commercial arrangements and an appropriate area and connection at the port (Richards Bay) will need to be secured by the Company
Moonlight Project Concept Recognising that adding value within the country is a strategic preference for all mining operations within South Africa Ferrum has consistently planned for beneficiation and other value-adding processes to take place within the country Project concepts have previously included the production of pig iron at or near the Moonlight site However the Company now believes that the initial development concept for the Project is likely to involve mining at site and the production of an iron ore concentrate for transportation via a slurry pipeline to a dewatering and loading facility to be located in Thabazimbi The high grade product would initially be sold to the domestic market To this end Ferrum has received a Letter of Intent (ldquoLOIrdquo) for production offtake Future studies will also assess the requirements for the production of pellets and other agglomerated products for use in steel making Several future pelletiser sites and rail and port combinations have been considered and the Company has continued to seek confirmation from infrastructure providers (including rail port and power suppliers) of an allocation of future capacity for the Company During the 2012 financial year the South African Government announced that significant capital would be applied in upgrading the rail and port facilities that service the Waterberg Region which is close to where the Moonlight Deposit is situated These planned upgrades are strategically necessary to unlock the value of the Waterberg Region where the countryrsquos most significant remaining coal reserves are situated Accordingly rail power water and port facilities are all being upgraded as a matter of national priority Proposed Rail Upgrades to Waterberg Coal Sources
Figure 3 below contains a map showing the planned upgrades to the existing rail infrastructures considered to be the most likely to be used for the Moonlight Project The proposed loading facility would be situated near to the Thabazimbi railhead and export product would be railed to Richards Bay for shipping to customers in the Middle East and elsewhere During a recent meeting with Transnet it was agreed to continue to hold regular meetings in order to monitor progress on the rail infrastructure expansion project and for Ferrum to advise status of the proposed commencement of production at Moonlight
In June 2011 the Company entered into an offtake agreement with Swiss based Duferco SA a leading private company involved in the trading mining and end use of iron and steel products and raw materials for the steel industry Following due diligence on the mineral assets of the Company Duferco concluded that the Group should be able to produce direct reduction andor blast furnace pellets equal to or better than current world class product The offtake agreement with Duferco covers up to 6 Mpta of anticipated future iron ore pellet production from the Project Under the agreement Ferrum will sell Duferco all of its production available for export (in total 45 Mpta) and will give Duferco a right of first refusal over an additional 15 Mt per annum
In June 2015 South Africarsquos competition authorities approved with certain conditions a merger between Chinarsquos Hebei Iron and Steel Group Co and Duferco International Trading Holding which has certain subsidiaries in South Africa This transaction is not expected to affect the Companyrsquos pre-existing offtake agreement Environmental EIAs are currently being prepared for certain aspects of the Project including pipeline route and a product handling facility at Thabazimbi Environmental approvals are already in place in respect of all mining activities
Geology and Mineral Resources The Mineral Resources are currently located entirely on the farm Moonlight 111LR with significant potential for future expansion of the existing resource base within the Project area once all current work streams have been financed and completed In 2014 Mineral Corporation Consultancy Pty Ltd (ldquoThe Mineral Corporationrdquo) undertook an update of the Projectrsquos Mineral Resource estimate to the requirements of JORC (2012) having previously been reported in accordance with JORC (2004) It determined that the Mineral Resource classification criteria imposed in deriving the previous estimate were still valid Furthermore the additional reporting requirements contained in JORC (2012) have been fully complied with in its updated independent Mineral Resource estimate report Figure 4 Moonlight Deposit Geological Plan Link The Project has been explored in the past by Kumba Iron Ore Limited (KIOL) and more recently by the Company Drilling data from KIOL and three phases of Ferrum exploration inform the estimate The drilling comprised open-hole percussion reverse circulation (RC) percussion and diamond core drilling and was all drilled in a vertical orientation
A total of 122 RC holes and 89 diamond core holes were employed in the Mineral Resource estimate The Mineral Resource estimate is provided in the table below and the Mineral Resource estimation criteria as required in JORC (2012) and in Section 582 of the ASX Listing Rules are available on the following link wwwjorcdocsJORC_code_2012pdf
Category Mineral Resource Gross Mineral Resource Net (attributable to Ferrum
Crescent at 97)
Mineral Resource Grade
Tonne (Mt) Contained Fe (Mt)
Tonne (Mt) Contained Fe (Mt)
Fe () SiO2
() Al2O3 ()
Inferred 1721 435 1669 422 253 512 48
Indicated 830 227 805 221 274 501 40
Measured 526 165 510 160 313 473 25
Total 3077 827 2984 803 269 503 42
Tonnes are rounded
The information above that relates to Exploration Targets Exploration Results and Mineral Resources has been compiled by Stewart Nupen a Competent Person who is a Fellow of the Geological Society of South Africa and a registered Professional Natural Scientist with the South African Council for Natural Scientific Professionals Stewart Nupen is employed by The Mineral Corporation an independent consulting firm to Ferrum Stewart Nupen has sufficient experience that is relevant to the style of mineralisation and type of deposit under consideration and to the activity being undertaken to qualify as a Competent Person as defined in the 2012 Edition of the lsquoAustralasian Code for Reporting of Exploration Results Mineral Resources and Ore Reservesrsquo Stewart Nupen consents to the inclusion herein of the matters based on his information in the form and context in which it appears Valuation As at 30 April 2014 The Mineral Corporation prepared an independent valuation for the Project This independent valuation can be viewed by accessing the following link and going to the disclosures for July 2014 httpwwwferrumcrescentcomirmarchiveasx-announcementsaspxRID=8 2015 Drilling During the 2015 reporting period the Company completed a drilling programme that was designed to investigate the extent of Zone D and provide information to inform the location of the proposed future mine Its purpose was also to identify if and the areas where bulk sampling for the requisite levels of metallurgical testwork should take place during the next stage of the Moonlight BFS The drill programme comprised 10 reverse circulation drill holes (for a cumulative total of 1396m) and was completed in Q1 2015 ahead of time and below budget All holes intersected mineralised magnetic zones across various depths The Zone D drilling confirmed comparable grades to those previously identified within the Inferred Resource and consequently enabled the Company to finalise its plans for the BFS with respect to the location and design of the proposed open pit mine for the first 10 years of the minersquos life within primary Zones A B and C due to shallower intersections higher grades and better stripping economics A new zone of mineralisation Zone E was also identified representing future exploration potential Further infill drilling is required to establish a JORC (2012) Ore Reserve and for advanced beneficiation work to be undertaken as part of the direct reduction iron (DRI) plant design process The success of such infill drilling will also determine whether bulk sampling is necessary to complete the full mine design and plant costings
Following the future completion of all mine plan plant design and processing assessments the final stage of the BFS can then be progressed utilising the stand-alone project economics to establish optimal infrastructure agreements with the relevant local government agencies Infrastructure Ongoing planning discussions related to future infrastructure requirements which include rail facilities power and water have continued between the Company and South African infrastructure providers during the reporting period An LOI has been concluded whereby the final product will be sold in Thabazimbi to a local manufacturer which will greatly reduce the Companyrsquos reliance on rail to Richards Bay Community The Company has signed a Memorandum of Agreement with the Lephalale Local Municipality (ldquoLLMrdquo) The agreement defines the Companyrsquos role in assisting the local communities The Company will assist in skills development water scheme planning and developing select students to reach their full potential for future employment at the mine The Company will also participate in the Mayors Bursary scheme for 2016 school leavers LLM in turn is assisting the Company in obtaining historical geological information related to the Moonlight Project LLM will also assist the Company with any talks with foreign investors and demonstrate their commitment to the project as well as assisting the Company with all key stakeholders and service providers Meetings are held on a monthly basis with the Companyrsquos neighbouring communities the Ga Seleka and Ga Shonguane communities Project Schedule
The following are significant factors with respect to the advancement of the Moonlight Project
subject to funding the BFS can be completed within approximately 18-24 monthsrsquo work-time
30 to 36 month mine construction period currently envisaged
Projectrsquos schedule coincides with the South African Governmentrsquos infrastructure development plans and
Completion of the BFS is currently expected to cost approximately AUD12 ndash 14M Corporate On 16 July 2015 the Company announced an update in respect of the first funding payment due under the BFS financing agreement with Principle Monarchy Investments (Proprietary) Limited (ldquoPMIrdquo) for the development of the Moonlight Iron Ore Project in Limpopo Province South Africa PMI advised the Company that it had secured funds for the first R2M payment that was to be paid to the Company under the terms of the Memorandum of Understanding (ldquoMOUrdquo) signed on 5 May 2015
On 21 July 2015 PMI advised the Company that PMI had concluded a financing agreement which would enable PMI to fulfil all of its immediate commitments under the BFS financing agreement for the advancement of the project On 22 July 2015 the Company advised that an investing group had initially allocated funds to PMI in order to enable it to work with the Company over a 12 month period The Company emphasised to PMI that the scheduled first payment of R2M was still overdue and that the Company awaited access to the funding from PMI in order to advance the work on the BFS Operationally the Company announced that Hatch Goba had formally agreed to be engaged as the lead study consultant once funding had been received from PMI On 14 October 2015 the Company announced that the previously announced MOU with PMI to provide financing for the BFS for up to a 39 interest in Ferrum Iron Ore (Pty) Ltd (ldquoFIOrdquo) had been formally terminated with no scheduled payments having been received from PMI On 14 October 2015 the Company also announced that a BFS Farm-In Agreement had been concluded with Business Venture Investments No1709 (Proprietary) Limited (ldquoBVIrdquo) to form a joint venture for the completion of the bankable feasibility study (ldquoBFSrdquo) for the Moonlight Iron Ore Project The comprehensive Farm-In Agreement provides for the completion of all the requisite BFS workstreams to produce a full BFS on the project to a fixed timeline to be funded by BVI in return for up to a 43 equity interest in FIO the owner of the Moonlight Iron Ore Project The Farm-In Agreement is to be undertaken in two phases Phase 1 will cover a study on the best short term business case model based upon technical financial and committed domestic offtake details BVI is responsible for completing this study within 12 months Upon satisfactory completion of Phase 1 BVI will be entitled to 14 equity in FIO The Company may however elect (but is not obligated) to contribute R83M to reduce the equity interest of BVI to 10 A Shareholders Agreement is intended to be entered into and become effective after the completion of Phase 1 Phase 2 will commence upon satisfactory completion of Phase 1 and BVI will be afforded a total of 24 months in which to complete a full study on the best short term business case defined during Phase 1 Phase 2 will be carried out to a standard and include all matters required by international project and equity financiers including without limitation certain detailed deliverables agreed with the Company Upon satisfactory completion of Phase 2 BVI will earn a further 29 equity interest in FIO Should BVI not complete Phase 2 it will have earnt no further equity in FIO apart from that earnt in respect of completing Phase 1 On 14 January 2016 the Company announced that it had agreed with BVI to extend the timeline for completion of Phase 1 of the BFS by 3 months to 12 January 2017 This extension was in order for BVI to finalise the appointment of an internationally reputable engineering firm to manage the BFS On 16 February 2016 the Company announced that it had entered into an exclusive option and sale agreement for a staged option fee of up to GBP22500 with TH Crestgate GmbH (ldquoCrestgaterdquo) a private Swiss-based company to potentially acquire 100 per cent of its indirect wholly-owned subsidiary GoldQuest Iberica SL (ldquoGoldQuestrdquo) a private company incorporated in Spain which owns 100 percent of two lead-zinc exploration projects in the provinces of Leoacuten and Galicia in historic Spanish mining areas (ldquothe Iberian Projectsrdquo) to enable the Company to conduct due diligence on both GoldQuest and the Iberian Projects The exclusive option was valid until 31 July 2016 and if exercised the aggregate consideration payable for GoldQuest was approximately GBP465000 to be satisfied partly in cash (approximately GBP320000) and partly by the issue of 100000000 new ordinary shares in the capital of the Company The option was exercisable entirely at the Companyrsquos discretion (refer to note11 for the investment as at 30 June 2016) On 25 February 2016 the Company announced that it had received applications to subscribe for 149681797 new ordinary shares of no par value each at a price of GBP00012 per share to raise GBP 179618 before expenses Following admission the share capital of the Company comprised 772985191 ordinary shares
On 31 March 2016 the Company announced a strategic update and corporate restructuring focused on generating value from the Grouprsquos principal iron ore project in northern South Africa and the development of its value-accretive business model progressing initially with its option over the abovementioned Spanish lead-zinc projects (via the potential acquisition of GoldQuest The following Board changes were implemented Mr Justin Tooth assumed the role of Executive Chairman and Managing Director from his previous non-executive role Dr Evan Kirby joined the Board as a Non-Executive Director Mr Merlin Marr-Johnson was appointed as an adviser to the Board to assist with the progression of the potential Spanish lead-zinc projects Mr Tom Revy who was the Managing Director resigned Mr Bob Hair who was the Company Secretary resigned and Mr Grant Button an existing Non-Executive Director assumed the duties of Company Secretary On 12 April 2016 the Company announced that its comprehensive due diligence investigations on GoldQuest and the Iberian Projects had been completed The licences in respect of the Iberian Projects had been renewed for a further period of twelve months by the Government of Leoacuten further to the fulfilment of a basic work programme at the two sites On 27 April 2016 the Company announced that it had conditionally raised in aggregate GBP650000 before expenses through a placement via Beaufort Securities Limited (ldquoBeaufortrdquo) its agent a total of 403846154 new ordinary shares of no par value each and a direct subscription of 96153846 new ordinary shares both at a price of 013 pence per new ordinary share As part of the placement and subscription each investor was offered options on the basis of one option for every share subscribed pursuant to the placement and subscription Each option entitles the holder to subscribe for a further new ordinary share at a price of 0165 pence per share for an exercise period of two years from the date of admission of the abovementioned placing and subscription shares In addition the Company announced that it was issuing in aggregate a further 9807692 new ordinary shares in settlement of certain fees comprising 4807692 new ordinary shares to Beaufort at a deemed issue price of 013 pence per new ordinary share in settlement of Beaufortrsquos corporate brokering services of GBP6250 and 5000000 new ordinary shares to Crestgate at a deemed issue price of 013 pence in connection with the extension of certain escrow arrangements under the terms of the Companyrsquos option and sale agreement in respect of GoldQuest Following admission of a of the aforementioned new ordinary shares the total issued ordinary share capital of the Company was 1282791883 ordinary shares On 15 June 2016 the Company announced a corporate and operational update stating inter alia that
- the Board was actively evaluating engineering pathways for alternate production routes based on existing technologies and modelled on current equipment types which are in use at comparable mining operations including examining lower cost capex development options with potential partners utilising alternative methods for the transportation of concentrate rather than a pipeline
- discussions were being held with new potential off-take partners for the supply of concentrate
- the Company was seeking to recover certain third party historic geological data and core samples on both the Julietta and Moonlight licence areas
- that a Memorandum of Agreement and co-operation framework (ldquoMoArdquo) had been signed with the Mayor of the Lephalale Municipality situated in the Waterberg District of the Limpopo Province which serves to secure the necessary consents from local stakeholders for progression of the project into future development and
- that the Companyrsquos planned work programme to determine the extent of the mineralisation on the Iberian Projects was expected to commence shortly after the completion of the acquisition of GoldQuest
Option over Lead-Zinc Exploration Projects Spain On 16th February 2016 Ferrum Crescent entered into an Option to potentially acquire 100 per cent of GoldQuest Iberica SL (GoldQuest) GoldQuest a private company incorporated in Spain owns 100 per cent of two lead-zinc exploration projects (Toral and Lago) in the provinces of Leόn and Galicia in historic Spanish mining areas (the Iberian Projects) Further to an initial analysis of the Toral Projects assets the Company secured the Option to acquire GoldQuest for the following principal reasons middot The Board believes that analysis of the results from 42km of historic drilling together with limited additional exploration work can readily advance the Toral
Project middot Establishment of enhanced resource estimate and process recovery is considered to be highly feasible middot The Toral Projects asset is open to major reinterpretation The Board believes that the scale of the asset has been substantially underestimated previously and
will seek to re-examine the geological model The Toral Project area has historically been assessed as containing a single tabular zone of mineralisation at depths of 300-500m below surface Such simplistic historical modelling however excludes a large amount of normally critical data and following its due diligence enquiries the Company believes that the historic NI 43-101 resource estimate significantly under-estimates the mineral potential of the Toral Project The Company further believes that an initial low cost exploration work programme should be able to test the mineralisation in a series of parallel sub-vertical structures running from depth up to surface Utilising the existing data and applying an exploration process that takes into account key structural controls and the characteristics of existing nearby mines will be a key initial work programme priority Ferrum Crescents objective following the recent exercise of its Option on 22 September 2016to seek to establish a JORC compliant resource estimate at both the Toral Project and the Lago Project as well as re-examining the scale and continuity of mineralisation at the Toral Project Ferrum Crescents ultimate objective is to potentially establish a credible mineral reserve in a cost effective manner for consideration by potential future acquirers or development finance groups During the reporting period the Company carried out extensive geological and legal due diligence on GoldQuest and the Iberian Projects In carrying out its operations during the reporting period the Group has incurred a loss after income tax for the period from 1 July 2015 to 30 June 2016 of $1573533 (2015 loss of $2345860) The Group had net assets of $718659 (2015 $525522) as set out in the Statement of Financial Position
Significant changes in the Grouprsquos state of affairs There have been no significant changes in the state of affairs of the consolidated entity to the date of this report that have not otherwise been disclosed elsewhere in the Annual Report
Significant events after the reporting date There are subsequent events to report as follows
Subsequent to the Company entering into an exclusive option to acquire 100 percent of GoldQuest two nil-cost extensions were granted to Ferrum Crescent on 22 July 2016 and 31 August 2016 and on 22 September 2016 the option was exercised Accordingly Ferrum Crescent has now acquired 100 per cent of the share capital of GoldQuest GoldQuest owns 100 per cent of two lead-zinc exploration projects in the provinces of Leόn and Galicia in historic Spanish mining areas (the ldquoIberian Projectsrdquo) The consideration comprised GBP326500 in cash and the issue of 100 million new ordinary shares in the capital of Ferrum Crescent
Planned work programme to be overseen by the Companyrsquos Senior Project Adviser Merlin Marr-Johnson to comprise
- re-mapping of the main Toral Project area applying re-interpreted geological understanding of the regional controls on mineralisation
- in-fill surveys over the main prospect area where detailed soil geochemistry has not previously been conducted
- structural mapping of the existing adits outcrop and the nearby mineralisation occurrences in order to gauge the balance between local (not fully tested) and regional (well documented) controls on mineralisation
- re-logging of historical drill-core and re-assaying of areas where incomplete assays were taken previously in order to seek to identify potential new shallow high grade targets at the Toral Project
- creation of a revised geological model incorporating existing and new geological data (geochemistry structural interpretation assays logs maps) and
- generation of a highly targeted drill plan focused on high-grade near-surface ore shoots linking known surface occurrences and known high-grade mineralisation at depth for testing in 2017
On 25 July 2016 the Company announced that it had conditionally raised in aggregate GBP 374453 before expenses through a placement via Beaufort Securities Limited as agent to the Company of 187226485 new ordinary shares of no par value each in the capital of the Company at a price of 020 pence per new ordinary share As part of the placing each investor was offered subject to shareholder approval in accordance with the ASX Listing Rules options on the basis of one option for every share subscribed pursuant to the placing Each option entitles the holder to subscribe for a further new ordinary share at a price of 030 pence per share for an exercise period of two years following the date of admission of the placing shares to trading on AIM In addition the Company agreed to grant a further 18722649 options to Beaufort Securities Limited on the same terms Following admission the total issued ordinary share capital of the Company was 1470018368 ordinary shares On 28 July 2016 the Company announced that it was issuing 66874816 new ordinary shares of no par value each in the capital of the Company as a result of the exercise of in aggregate 66874816 options exercisable at a price of 0165 pence per share Such options were granted in connection with the Companyrsquos placing and subscription announced on 27 April 2016 Following the issue of these option shares and the abovementioned placing shares the total issued ordinary share capital of the Company was 1536893184 ordinary shares
On 26 August 2016 the Company announced that it was issuing 44797543 new ordinary shares of no par value each in the capital of the Company as a result of the exercise of in aggregate a further 44797543 options exercisable at a price of 0165 pence per share Such options were granted in connection with the Companyrsquos placing and subscription announced on 27 April 2016 Following the issue of these option shares the total issued ordinary share capital of the Company was 1581690727 ordinary shares
On 23 September 2016 the Company announced that it was issuing 5381907 new ordinary shares of no par value each in the capital of the Company as a result of the exercise of in aggregate 5381907 options exercisable at a price of 0165 pence per share Such options were granted in connection with the Companyrsquos placing and subscription announced on 27 April 2016 Following the issue of the option shares the total issued ordinary share capital of the Company is 1587072634 ordinary shares
Likely developments and expected results
The Group will continue to carry out its business plans by
Exploring evaluating and if technically and economically feasible developing the Moonlight Project in Limpopo Province South Africa
Conducting its planned initial zinc exploration work programme on the Iberian Projects in Spain
Seeking further strategic acquisition opportunities within the exploration and mining industry to enter potentially into additional advanced projects that will add value to the Group and
Continuing to meet its statutory commitments relating to its exploration tenements and carrying out exploration of its exploration tenements in accordance with its stated strategy whilst carefully conserving the Grouprsquos cash reserves in order to be able to take advantage of value adding opportunities
There can be no guarantee either that further exploration of the Grouprsquos tenements will result in exploration success or that any potential additional strategic acquisition considered by the Directors to be likely to add value to the Group will become available to the Group Environmental regulation and performance
The Grouprsquos activities are subject to South African and Spanish legislation relating to the protection of the environment The Group is subject to significant environmental legal regulations in respect to its exploration and evaluation activities The relevant South African Act that we comply with is the (ldquoMPRDArdquo) Mineral and Petroleum Resources Development Act 2002 (Act No 28 of 2002)
There have been no known breaches of these regulations and principles Consolidated Statement of Profit or Loss and Other Comprehensive Income For the year ended 30 June 2016
2016 2015
Note $ $
Revenue from continuing operations
Revenue 3(a) 22517 23753
Other income 3(b) 490850 -
Administration expenses 3(c) (1416748) (1478102)
Occupancy expenses (52382) (66218)
Exploration expenditure (188506) (456595)
Fair value adjustment of forward subscription agreement 3(d) 46868 (208375)
Foreign exchange loss (395816) (176532)
Share based payments 20 (34097) (90851) Fair value gain on disposal of available for sale investments 649 137597
Impairment of minority interest obligation 3(d) (46868) -
Loss before taxation (1573333) (2315323)
Income tax benefit (expense) 5 - (30537)
Loss after income tax for the year (1573533) (2345860) Other comprehensive income
Items that may be reclassified subsequently to profit or loss
Net exchange gain (loss) on translation of foreign operation
225175 (180614)
Net fair value gains on available-for-sale investment - 28536 Income tax effect - (7990)
Reclassification of net changes in fair value relating to the disposal of available for sale investments 649
(137597)
Income tax effect (182) 38527
Growth on investment unrealised 524 - Other comprehensive income (loss) for the year net of tax 226166 (259138)
Total comprehensive loss for the year (1346376) (2604998)
Net loss for the year attributable to
Equity holders of the Parent (1573533) (2345860)
(1573533) (2345860)
Total comprehensive loss for the period attributable to
Equity holders of the Parent (1346376) (2604998)
(1346376) (2604998)
Loss per share Cents per share Cents per share Basic loss for the year attributable to ordinary equity holders of the Parent 7 (022) (050) The above Consolidated Statement of Profit and Loss and Other Comprehensive Income should be read in conjunction with the accompanying notes Consolidated Statement of Financial Position As at 30 June 2016
2016 2015
Note $ $
Assets
Current assets
Cash and short term deposits 8 743264 1028468
Trade and other receivables 9 33929 21928
Other current financial assets 12 29303 34325
Prepayments 50606 76983
Total current assets 857102 1161704
Non-current assets
Plant and equipment 10 13533 29645
Investments 11 243331 -
Non-current financial assets 12 64715 187048
Total non-current assets 321579 216693
Total assets 1178681 1378397
Liabilities and equity
Current liabilities
Trade and other payables 13 263827 168713
Payments received in advance 14 175722 629325
Provisions 15 20473 54837
Total current liabilities 460022 852875
Total liabilities 460022 852875
Equity
Contributed equity 16 33049490 31542093
Accumulated losses 19 (24424297) (22850764)
Reserves 18 (7906534) (8165807) Equity attributable to equity holders of the Parent 718659 525522
Total equity 718659 525522
Total equity and liabilities 1178681 1378397
This Consolidated Statement of Financial Position is to be read in conjunction with the accompanying notes Consolidated Statement of Cash Flows For the year ended 30 June 2016
2016 2015
Note $ $
Cash flows from (used in) operating activities
Interest received 3191 10635
Income from available for sale investment 5242 13118
Exploration and evaluation expenditure (183483) (458777)
Receipts from customers 14084 -
Payments to suppliers and employees (1416784) (2140761)
Net cash flows (used in) operating activities 24 (1578750) (2575785)
Cash flows from (used in) investing activities
Payments for plant and equipment - 456
Other financial assets (243331) -
Purchase of available-for-sale financial assets (30360) (154110)
Sale of available-for-sale financial assets - 937688 Proceeds from disposal of available-for-sale financial assets 92699 99070
Net cash flows from (used in) investing activities (180992) 883104
Cash flows from (used in) financing activities
Proceeds from issue of shares 1676878 2233415
Transaction costs on issue of shares (169481) (269780)
Net cash flows from financing activities 1507397 1963635
Net increase (decrease) in cash and cash equivalents held (252345) 270954
Net foreign exchange difference (32859) 19169
Cash and cash equivalents at 1 July 1028468 738345
Cash and cash equivalents at 30 June 8 743264 1028468
The above Consolidated Statement of Cash Flows should be read in conjunction with the accompanying notes
Consolidated Statement of Changes in Equity For the year ended 30 June 2016
Attributable to the equity holders of the Parent
Employee
Issued capital
$
Accumulated
losses $
share incentive reserve
$
Option reserve
$
Foreign exchange reserve
$
Available for sale reserve
$
Equity reserve
$
Total equity
$
At 1 July 2014 29333702 (20504904) 608335 1428281 134560 78524 (10126072) 952426
Loss for the period - (2345860) - - - - - (2345860)
Other Comprehensive Income (net of tax) - - - - (180614) (78524) - (259138)
Total comprehensive loss (net of tax) - (2345860) - - (180614) (78524) - (2604998) Transactions with owners in their capacity as owners Shares issued during the year net of transaction costs 2037244 - - - - - - 2037244
Shares issued to market previously on the Employee Share Incentive Plan
- - 54389 - - - - 54389
Directors and KMP salary sacrifice for shares issued 171147 - (171147) - - - - - Options issued to Consultants and Brokers - - - 42300 - - - 42300
Options issued under Employee Option Plan - - - 44161 - - - 44161
At 1 July 2015 31542093 (22850764) 491577 1514742 (46054) - (10126072) 525522
Loss for the period - (1573533) - - - - - (1573533) Other Comprehensive Income (net of tax) - - - - 226166 - - 226166
Total comprehensive loss (net of tax) - (1573533) - - 226166 - - (1347367)
Transactions with owners in their capacity as owners Shares issued during the year net of transaction costs
1507397 - - - - - - 1507397
Net Growth on Investment Portfolio - - - - (991) - - (991)
Options issued under Employee Option Plan - - - 34098 - - - 34098
At 30 June 2016 33049490 (24424297) 491577 1548840 179121 - (10126072) 718659
The above Consolidated Statement of Changes in Equity should be read in conjunction with the accompanying notes Note 1 Corporate information The consolidated financial statements of Ferrum Crescent Limited and its subsidiaries (collectively the Group) for the year ended 30 June 2016 were authorised for issue in accordance with a resolution of directors on 30 September 2016
Ferrum Crescent Limited the parent is a for profit company limited by shares incorporated in Australia whose shares are publicly traded on the Australian Stock Exchange (ASX) the London Stock Exchange (AIM) and the JSE Limited (JSE) Domicile Australia Registered Office lsquoG South Mill Centrersquo Suite 6 9 Bowman Street South Perth WA 6151 Note 2 Summary of significant accounting policies (a) Basis of preparation
The Financial Report is a general purpose financial report which has been prepared in accordance with the requirements of the Corporations Act 2001 Australian Accounting Standards and Interpretations and complies with other requirements of Australian law The accounting policies detailed below have been consistently applied to all of the years presented unless otherwise stated The financial statements are for the consolidated entity consisting of Ferrum Crescent Limited and its subsidiaries The Financial Report has also been prepared on a historical cost basis except for the forward subscription agreement and the available-for-sale (AFS) investments which have been measured at fair value All amounts are presented in Australian dollars unless otherwise stated
(b) Statement of compliance
The Financial Report complies with Australian Accounting Standards as issued by the Australian Accounting Standards Board and complies with International Financial Reporting Standards (IFRS) as issued by the International Accounting Standards Board (c) Adoption of new and revised standards
Ferrum Crescent Limited and its subsidiaries (lsquothe Grouprsquo) has adopted all new and amended Australian Standards and Interpretations mandatory for reporting periods beginning on or after 1 July 2015 including
AASB 2015-3 Amendments to Australian Accounting Standards arising from the withdrawal of AASB1031 Materiality
AASB 2015-5 Amendments to Australian Accounting Standards Investment Entities Applying the Consolidation Exception
The adoption of these standards and interpretations did not have any material effect on the financial position or performance of the Group
(g) Going concern
The Annual Report has been prepared on a going concern basis and this basis is predicated on a number of initiatives being undertaken by the Group with respect to ongoing cost reductions and funding as set out below The Group incurred an operating loss after income tax of $1573533 for the year ended 30 June 2016 (2015 $2345860) In addition the Group has net current assets of $397080 as at 30 June 2016 (2015 $308829) which includes the forward subscription agreement and shareholdersrsquo equity of $718659 (2015 $525522) The Grouprsquos forecast cash flow requirements for the 15 months ending 30 September 2017 reflect cash outflows from operating and investing activities which take into account a combination of committed and uncommitted but currently planned expenditure The ability of the Group to continue as a going concern is dependent on raising additional funds to meet the Grouprsquos ongoing working capital requirement when required These conditions indicate a material uncertainty which may cat significant doubt as to whether the Group will be able to meet its debts as and when they fall due and thus continue as a going concern This Annual report has been compiled on a going concern basis In arriving at this position the Directors are satisfied that the Group will have access to sufficient cash as and when required to enable it to fund administrative and other committed expenditure The Directors are satisfied that they will be able to raise additional funds by either selling existing assets through implementation of strategic joint ventures or via a form of debt andor equity raising In addition the Directors have embarked on a strategy to reduce costs Should the Group not be able to continue as a going concern it may be required to realise its assets and discharge its liabilities other than in the ordinary course of business and at amounts that differ from those stated in the financial statements The financial statements do not include any adjustments relating to the recoverability and classification of recorded asset amounts nor to the amounts or classification of liabilities that might be necessary should the Group not be able to continue as a going concern
Note 3 Revenue and expenses Revenue and expenses from continuing operations
2016 2015
Note $ $
(a) Revenue
Turnover 14084 -
Interest received 8433 23753
22517 23753
(b) Other Income
Income from third party advance payment 490850 -
490850 -
(c) Profit or loss
Other expenses include the following
Depreciation 11638 18580
Gain on disposal of plant and equipment (8609) -
Consulting services 243032 238053
Employment related
- Directors fees 386994 404228
- Wages 182207 171623
- Superannuation 39989 41595
Corporate 276747 271287
Travel 27868 62691
Other 256882 270045
1416748 1478102
(d) Fair value (losses)gains
Fair value (loss)gain on financial instrument 46868 (208375)
Impairment of minority interest obligation (46868)
- -
On 26 October 2010 various agreements were entered into in respect of the minority interest in the Moonlight Iron Project being managed by the companyrsquos subsidiary Ferrum Iron Ore (Pty) Ltd (ldquoFIOrdquo) Ferrum South Africa Pty Ltd (ldquoFSArdquo) a wholly owned subsidiary of the Ferrum Crescent Ltd (ldquoFCLrdquo) entered various agreements with Mkhombi Investments (Pty) Ltd (ldquoMIrdquo) and its holding company Mkhombi AmaMato (Pty) Ltd (ldquoMArdquo) for MI to become FIOrsquos BEE partner MA was to obtain 156 of the issued shares in FCL in
2 equal tranches of ZAR 75 million The South African Department of Mineral Resources (ldquoDMRrdquo) expressed its support of this transaction The first tranche was completed on 30 November 2012 and FCL issued 78 of its issued shares to MA Upon completion of the first tranche the Company legally owned directly and indirectly through its wholly owned subsidiary MI 97 of FIO with the remaining 3 held by the GaSeleka Community
Under the subscription agreement second tranche FCL will issue shares to MA equal to 78 of the issued share capital of the Company for ZAR 75 million The subscription agreement has been extended to 31 July 2019 The above financial asset was fair valued as at 30 June 2016 to nil The fair value was based on a probability weighted approach with the key assumptions being Ferrumrsquos share price foreign exchange rates and credit risk Note 4 Segment information Identification of Reportable Segments The Group has based its operating segment on the internal reports that are reviewed and used by the executive management team in assessing performance and in determining the allocation of resources The Group currently does not have production and is only involved in exploration As a consequence activities in the operating segment are identified by management based on the manner in which resources are allocated the nature of the resources provided and the identity of the manager and country of expenditure Information is reviewed on a whole of entity basis Based on these criteria the Group has only one operating segment being exploration and the segment operations and results are reported internally based on the accounting policies as described in Note 2 for the computation of the Grouprsquos results presented in this set of financial statements
Geographic Information
Note Australia South Africa Consolidation
2016 2015 2016 2015 2016 2015
$ $ $ $ $ $
Revenue from external customers
- 15727 14084 8026 14084 23753
Non - current assets 1011 amp 12 361 401 321218
216292 321579
216693
Note 5 Income tax expense
2016 2015
$ $
Reconciliation of income tax expense to the pre-tax net loss
Loss before income tax 1573533 2345860
Income tax calculated at 30 (201530) on loss before income tax (472060) (703758)
Add tax effect of non-deductible expenses 128072 104724
Difference in tax rate of subsidiaries operating in other jurisdictions 8617 (113795)
Unused tax losses and temporary differences not brought to account 335371 743366
Income tax (profit) expense - 30537
Analysis of deferred tax balances 2016 2015
Deferred tax liabilities $ $
Assessable temporary differences
Prepayments (13576) (17635)
Financial asset - -
Deferred tax liabilities offset by deferred tax assets 13576 17635
Net deferred tax liabilities - -
Deferred tax assets
Share issue expenses 103225 86052
Legal expense amortised - 4859
Payables and provisions 41248 12355
Other 363091 -
Unused tax losses 5213707 2830409
5721271 2848905
Total unrecognised deferred tax assets (5707695) (2831270)
Deferred tax assets 13576 17635
Deferred tax assets offset by deferred tax liabilities (13576) (17635)
Net deferred tax assets - -
Unused tax losses set out above have not been recognised due to the uncertainty of future taxable profit streams Note 6 Auditorsrsquo remuneration
2016 2015
$ $
Remuneration of the auditor of the Company for
-auditing or reviewing the financial statements
Ernst amp Young Australia - 28000 Ernst amp Young South Africa - 22000 BDO Audit (WA) Pty Ltd 22686 - BDO South Africa Incorporated 11501 - Lancaster Mauritius 5174 4523
39361 54523
-other assurance related services
Ernst amp Young Australia 1803 -
41164 54523
Note 7 Earnings per share
2016 2015
$ $
Basic loss per share (cents per share) (022) (050)
Diluted loss per share (cents per share) (022) (050) Loss used in calculating basic loss per share (1573533) (2345860)
Adjustments to basic loss used to calculate dilutive loss per share - -
Loss used in calculating dilutive loss per share (1573533) (2345860)
Number Number Weighted average number of ordinary shares used in the calculation of basic loss per share 714611971 468894041
Weighted average number of ordinary shares used in the calculation of diluted loss per share 714611971 468894041
There have been no transactions involving ordinary shares or potential shares that would significantly change the number of ordinary shares or potential ordinary shares outstanding between the reporting date and the date of completion of these financial statements
Note 1 ndash 13000000 employee share options outstanding at 30 June 2016 (30 June 2015 13000000) have not been included in the calculation of dilutive earnings per share as these are anti-dilutive Note 2 ndash 29954525 potential shares to be issued under the BBBEE subscription agreement have not been included in the calculation of dilutive earnings per share as these are anti-dilutive Note 8 Cash and cash equivalents
Cash at the end of the financial year as shown in the statement of cash flows is reconciled to items in the statement of financial position as follows
2016 2015
$ $
Cash at bank 743264 1028468
Note 9 Trade and other receivables
2016 2015
$ $
Current
Sundry debtors 18475 2513
GST VAT 15454 19415
33929 21928
Non-trade debtors are non-interest bearing and are generally on 30-90 days credit terms The carrying amounts of these receivables represent fair value and are not considered to be impaired
Note 10 Plant and equipment
Furniture fittings
and equipment
Motor
vehicles Leasehold
improvements
Total
$ $ $ $
Year ended 30 June 2016
Opening net carrying value 7474 8302 13869 29645 Disposals (274) 457 - 183 Depreciation charge for the year (3724) (7166) (748) (11638) Exchange differences (1028) (1592) (2036) (4657)
On 15 February 2016 the Company entered into an exclusive option and sale agreement for a staged option fee of up to GBP22500 with TH Crestgate GmbH (ldquoCrestgaterdquo) a private Swiss-based company to potentially acquire 100 per cent of its indirectly wholly-owned subsidiary GoldQuest Iberica SL (ldquoGoldQuestrdquo) a private company incorporated in Spain which owns 100 per cent of two lead-zinc exploration projects in the provinces of Leoacuten and Galicia in historic Spanish mining areas (ldquothe Iberian Projectsrdquo) to enable the Company to conduct due diligence on GoldQuest and the Iberian Projects
Subsequent to the Company entering into an exclusive option to acquire 100 percent of GoldQuest two nil-cost extensions were granted to the Company on 22 July 2016 and 31 August 2016 Subsequentlyon 22 September 2016 the option was exercised Accordingly the Company has now acquired 100 per cent of the share capital of GoldQuest The consideration comprised GBP326500 in cash and the issue of 100 million new ordinary shares in the capital of the Company
The carrying amount of the financial asset is carried at cost as its fair value cannot be reliably measured at year end as the Company does not have a quoted market price
Note 12 Other financial assets
2016 2015 $ $ Current assets
Rental and Other Deposits 5121 5960
Rehabilitation Trust 24182 28365
29303 34325
Non- current assets
Available for sale investments (at fair value) (refer to note (a) below) 64715 187048
64715 187048
Note (a) Available for sale investments On 30 October 2014 Guardrisk issued a financial guarantee for the rehabilitation of land to be disturbed by mining to the DMR for the sum of R7517000
On 1 November 2014 Ferrum Iron Ore (Pty) Ltd a subsidiary of the Company signed a policy of insurance where-by an initial lump sum of R1500000 (approx AUD 149250 at the then prevailing AUDZAR exchange rate of 100503) and a monthly contribution of R100000 (approx AUD9950 at the same exchange rate) would be paid for a fixed period from 1 November 2014 to 31 October 2017 to cover the environmental guarantee On 18 November 2015 the policy was renegotiated and a lump sum of R1104878 (approx AUD 92699 at the then prevailing AUDZAR exchange rate of 119190) was paid out to the Company as working capital and the monthly contributions were amended to be paid up on condition that the Company advise Guardrisk of any intention to do further explorative work The policy is due to be renegotiated in October 2017 when the environment guarantee expires Note 12 Other financial assets (continued) Note (a) Available for sale investments(continued) There is a provision in the policy to the effect that at the end of the policy period or cancellation (and where applicable) should there be a positive balance sitting in the policy after taking into account all expenditure (including claims) Guardrisk will declare a performance bonus back to the Company There is no prior entitlement to this performance bonus Note 13 Trade and other payables
2016 2015
$ $
Current
Trade payables and other payables 263827 168713
263827 168713
Trade and other payables are non-interest bearing and are normally settled on 30-day terms Note 14 Provision for payments received in advance
2016 2015
$ $
Current
Provision for Anvwar Asian Investments 175722 629325
175722 629325
During the 2014 reporting period the Company entered into a legally binding heads of agreement with Anvwar Asian Investment (ldquoAAIrdquo) an entity based in Oman whereby AAI was to purchase a 35 interest in Ferrum Iron Ore (Pty) Ltd (ldquoFIOrdquo) the Group Company that holds the Moonlight Project Following a number of term variations of this letter of intent the Company entered into a new agreement with AAI in March 2014 whereby AAI agreed to pay US$1 million by way of two tranches of US$500000 one payable by the end of March 2014 and the second payable by the end of April 2014 thereby earning the right subject to the requisite approvals of the South African Reserve Bank to be issued with FIO shares equalling 35 of that company being partly paid subject to the right to pay an additional US$9 million to become fully paid or be converted into 35 of FIO fully paid The additional US$9 million had to be paid by the earlier of 31 December 2015 and completion of the Moonlight BFS However the second tranche of US$500000 was not received by the Company within the time frame stipulated under the agreement The Company therefore informed AAI of its default and AAI remains in default as at the date of this report Accordingly the first tranche of US$500000 was initially recorded as a current liability On 14 March 2015 the Company terminated the investment agreement between itself and AAI as a result of AAIrsquos breach of a material term of the agreement On 22 July 2015 AAIrsquos lawyers Trowers amp Hamlins issued a letter to the Company requesting that the first tranche be returned to AAI within 14 days from the date of issue They advised that AAI will commence legal proceedings for the recovery of the first tranche plus any interest and costs incurred by AAI On 30 June 2016 after no further correspondence between AAI its lawyers and the Company the Company derecognised an amount of US$364448 leaving a provision of US$135552 for payments received in advance Refer to note 22 for the contingent liability with respect to this matter Note 15 Provisions
incentive plan shares (2300000) (2300000) (265302) (265302)
1280491883 616487353 33049490 31542093
Capital management When managing capital (which is defined as the Companyrsquos total equity) managementrsquos objective is to ensure the entity continues as a going concern as well as to maintain optimal returns to shareholders and benefits for other stakeholders Management also aims to maintain a capital structure that ensures the lowest cost of capital available to the entity As the equity market is constantly changing management may issue new shares to provide for future exploration and development activity The Company is not subject to any externally imposed capital requirements
During the year ended 30 June 2016 nil (2015 4295000) shares were issued back to the market from the Employee Incentive Share Plan (b) Movements in ordinary share capital
Date Details Number of
shares $
30 June 2014 Closing Balance 380602777 29843607
10 November 2014 Allotment issue 49065642 392525
13 November 2014 Underwritten issue 58434358 467475
12 December 2014 Private placement 21525819 173077
12 December 2014 Salary sacrifice share scheme issue 9158757 171147
22 May 2015 Private placement 48000000 465600
29 May 2015 Private placement 52000000 504400
29 May 2015 Share plan shares sold on market (c) 59344
Costs associated with share issues (269780)
30 June 2015 Closing Balance 618787353 31807395
17 February 2016 Subscription Shares 4515041 13046
29 February 2016 Subscription Shares 149681797 359236
27 April 2016 Placing and Subscription Shares 500000000 1279499
27 April 2016 Fee Shares 4807692 12303
27 April 2016 Shares ndash TH Crestgate GmbH 5000000 12795
Costs associated with share issues (169476)
30 June 2016 Closing Balance 1282791883 33314792
Employee share plan shares on issue (2300000) (265302)
1280491883 33049490
If at any time during the exercise period an employee ceases to be an employee all share options held by that employee will lapse one month after their employment end date Therefore employee shares above are only recognised in issued capital when issued to the employees concerned
(c) Movements in employee share plan shares issued with limited recourse employee loans
Date Details Number of
shares $
01 July 2014 Opening balance 6595000 (509905) Cancelled during 2015 (4295000) 244603 Issued during 2015 - -
30 June 2015 Closing balance 2300000 (265302)
Cancelled during 2016 - - Issued during 2016 - -
30 June 2016 Closing balance 2300000 (265302)
The table below summarises the model inputs (post consolidation) for employee share plan shares granted during periods prior to 30 June 2016
Shares granted for consideration
2150000
Exercise price 0198 Interest rate 0 Issue date 7 December 2010 Expiry date 30 November 2014 Underlying security spot price at grant date (GBP) 0198 Expected life 4 Shares granted for consideration
150000
Exercise price 0100 Interest rate 0 Issue date 24 February 2012 Expiry date 24 February 2016 Underlying security spot price at grant date (GBP) 0100 Expected life 4
No employee share plan shares were issued in 2016 (2015 Nil) This account is used to record the value of shares issued under the Executive Share Incentive Plan (ESIP) The ESIP is accounted for as an ldquoin-substancerdquo option plan due to the limited recourse nature of the loan between employees and the Company to finance the purchase of ordinary shares The total fair value of the ldquoin substancerdquo options issued under the plan is recognised as a share-based payment expense over the vesting period with a corresponding increase in equity
Note 17 Listed Options
2016 2015
No of Options No of Options
Options
At year end the following options were on issue
- 21 November 2016 Options exercisable at 3 cents per share 500000 500000
- 19 February 2017 Options exercisable at 8 cents per share 2500000 2500000
- 2 February 2018 Options exercisable at GBP00075 per share 2000000 2000000
- 2 February 2018 Options exercisable at GBP002 per share 3000000 3000000
- 1 March 2018 Options exercisable at GBP00075 per share 2000000 2000000
- 1 March 2018 Options exercisable at GBP002 per share 3000000 3000000
- 12 May 2016 Unlisted options issued to investors 500000000 -
513000000 13000000
2016 2015
Movements in 21 November 2016 Options No of Options No of Options
Beginning of the financial year 500000 500000
Options issued during the year - -
Options cancelled during the year - -
End of the financial year 500000 500000
Movements in 19 February 2017 Options
Beginning of the financial year 2500000 2500000
Options issued during the year - -
Options cancelled during the year - -
End of the financial year 2500000 2500000
Movements in 2 February 2018 Options
Beginning of the financial year 5000000 -
Options issued during the year - 5000000
Options cancelled during the year - -
End of the financial year 5000000 5000000
Movements in 1 March 2018 Options
Beginning of the financial year 5000000 -
Options issued during the year - 5000000
Options cancelled during the year - -
End of the financial year 5000000 5000000
Movement in 12 May 2018 unlisted options issued to investors
Beginning of the financial year - -
Options issued during the year 500000000 -
Options cancelled during the year - -
End of the financial year 500000000 -
The table below summarises the model inputs (post consolidation) for investor options granted during the year ended 30 June 2016
Options granted for consideration
500000000
Exercise price (GBP) 000165 Issue date 12 May 2016 Expiry date 12 May 2018 Underlying security spot price at grant date (GBP) 000165 Expected life 2
Movements after 30 June 2016
On 29 July 2016 66874816 of the options issued on 12 May 2016 were exercised at a price of GBP 00165 pence per share In addition on 29 July 2016 187226485 ordinary shares were issued at a price of GBP 0020 pence per share along with an option of 187226485 options of GBP0030 pence per share that are exercisable over a period of 2 years subject to the receipt of shareholder approval
On 26 August 2016 44797543 of the options issued on 12 May 2016 were exercised at a price of GBP 00165 pence per share
On 28 September 2016 5381907 of the options issued on 12 May 2016 were exercised at a price of GBP 00165 pence per share
Note 18 Reserves
Employee share
incentive reserve
Options reserve
Foreign
exchange reserve
Equity reserve
Available for sale reserve
Total
$ $ $ $ $ $
At 1 July 2014 608335 1428281 134560 (10126072) 78524 (7876372)
Options issued - 86461 - - - 86461 Shares issued to KMPs on the Salary Sacrifice Scheme 54389 - - - - 54389 Directors and KMP salary sacrifice for shares issued (171147) - - - - (171147) Growth in investment portfolio - - - - 20546 20546 Reclassification adjustment for gains included in the income statement (net of tax effect) - - - - (99070) (99070)
At 30 June 2015 491577 1514742 (46054) (10126072) - (8165807) Options issued under Employee Option plan - 34098 - - - 34098 Net growth on Investment Portfolio - - (991) - - (991)
Currency translation - - 226166 - - 226166
differences
At 30 June 2016 491577 1548840 179121 (10126072) - (7906534)
^This amount includes remuneration to KMPs and Directors that was accrued and will ultimately be settled in shares under the Companyrsquos salary sacrifice scheme
Nature and purpose of reserves
Employee share incentive reserve This reserve is used to record the value of equity benefits provided to employees consultants and directors as part of their remuneration under the Executive Share Incentive
Plan
Options reserve This reserve is used to record the value of options issued other than share-based payments to directors employees and consultants as part of their remuneration Foreign currency translation reserve The foreign currency translation reserve is used to record exchange differences arising from the translation of the financial statements of foreign subsidiaries Equity reserve The Equity reserve is used to record the acquisition of the non-controlling interest by the Group and to record differences between the carrying value of non-controlling interests and the consideration paid received where there has been a transaction involving non-controlling interests that do not result in a loss of control The reserve is attributable to the equity of the parent Available-for-sale reserve Used to record changes in the fair value of the Grouprsquos available-for-sale financial assets Note 19 Accumulated losses
2016 2015
$ $
Accumulated losses at the beginning of the financial year
(22850764) (20504904)
Net loss for the year (1573533) (2345860)
Accumulated losses at the end of the financial year (24424297) (22850764)
Note 20 Share based payments
Expenses arising from share-based payment transactions Total expenses arising from share-based payment transactions recognised during the year were as follows
2016
$ 2015
$
Options issued in consideration for services 34097 90851
34097 90851
Options issued in consideration for services Fair value of options granted The fair value at the grant date of options issued is determined using a binomial option pricing model that takes into account the exercise price the term of the option the impact of dilution the non-tradable nature of the option the share price at grant date and expected price volatility of the underlying share the expected dividend yield and the risk-free interest rate for the term of the option 1 The tables below summarise the model inputs (post consolidation) for options granted prior to the year ended 30 June 2015
Options granted for no consideration 500000 Exercise price (AUD cents) 003 Issue date 21 November 2013 Expiry date 21 November 2016 Underlying security spot price at grant date (AUD cents) 003 Expected price volatility of the Companyrsquos shares 100 Expected dividend yield 0 Expected life 3 Risk-free interest rate 308 Binomial model valuation per option (AUD cents per share) 165
Options granted for no consideration 2500000 Exercise price (AUD cents) 008 Issue date 19 February 2014 Expiry date 19 February 2017 Underlying security spot price at grant date (AUD cents) 006 Expected price volatility of the Companyrsquos shares 100
Expected dividend yield 0 Expected life 3 Risk-free interest rate 297 Binomial model valuation per option (AUD cents per share) 412
Options granted for no consideration 2000000 Exercise price (GBP) 00075 Issue date 2 February 2015 Expiry date 2 February 2018 Underlying security spot price at grant date (GBP) 00075 Expected price volatility of the Companyrsquos shares 100 Expected dividend yield 0 Expected life 3 Risk-free interest rate 064 Binomial model valuation per option (AUD cents per share) 050 Options granted for no consideration 3000000 Exercise price (GBP) 002 Issue date 2 February 2015 Expiry date 2 February 2018 Underlying security spot price at grant date (GBP) 002 Expected price volatility of the Companyrsquos shares 100 Expected dividend yield 0 Expected life 3 Risk-free interest rate 064 Binomial model valuation per option (AUD cents per share) 034
Options granted for no consideration 2000000 Exercise price (GBP) 00075 Issue date 1 March 2015 Expiry date 1 March 2018 Underlying security spot price at grant date (GBP) 00075 Expected price volatility of the Companyrsquos shares 100 Expected dividend yield 0 Expected life 3 Risk-free interest rate 090 Binomial model valuation per option (AUD cents per share) 055
Options granted for no consideration
3000000
Exercise price (GBP) 002 Issue date 1 March 2015 Expiry date 1 March 2018
Underlying security spot price at grant date (GBP) 002 Expected price volatility of the Companyrsquos shares 100 Expected dividend yield 0 Expected life 3 Risk-free interest rate 090 Binomial model valuation per option (AUD cents per share)
037
Movements
The following table illustrates the number and weighted average exercise prices (WAEP) of and movements in share options during the year
2016
Number
2016
WAEP
2015
Number
2015
WAEP Outstanding at 1 July 13000000 132 3400000 346 Issued during the year - - 10000000 094 Cancelled during the year - (400000) 1000
Outstanding at 30 June 13000000 092 13000000 132
Exercisable at 30 June 11500000 104 10000000 094 Note 21 Commitments
(i) At this stage the Company has no minimum obligations with respect to tenement expenditure requirements (ii) Operating lease commitments are as follows
2016 2015
$ $
Within 1 year 25107 28039
2 to 3 years - -
Total 25107 28039
The Company disposed of its Australian tenements during 2011 and whilst the Company still holds tenements in South Africa expenditure commitments in relation to such tenements have been met The Company has converted its South African prospecting rights into mining rights and applied for new prospecting rights over adjacent land A subsidiary of the Group entered into a 36 month commercial office lease on 1 April 2012 with an 8 annual escalation to the fixed portion of the lease for their head office in Johannesburg South Africa The value of the lease was annualised over the life of the Lease agreement This lease reached the end of its term on 31 March 2015 and
had a renewal period for a further 3 years commencing 1 April 2015 but was only renewed for a period of 1 year until 31 March 2016 During February 2016 the lease was renewed for a further period of 12 months until 31 March 2017 Note 22 Contingent liabilities
The Company received USD500000 from AAI during March 2014 as part of AAIrsquos advanced payment for a percentage ownership of the Companyrsquos subsidiary FIO The transaction was never formaly finalised and on 30 June 2016 the Company transferred the amount of USD364448 from provision for payments received in advance to sundry income to cover expenses incurred by the Company subsequent to AAIrsquos default leaving a value of US$135552 in provision for payments received in advance The matter is contingent liability as the likelihood of probable outflow is not considered remote at this point in time and the Company may be exposed to repay the investment amount of USD 500000 or part thereof subject to the Companyrsquos ability to prove its loss and damages suffered as a result of AAIrsquos breach of contract Note 23 Related party transactions Compensation of Key Management Personnel
2016 2015
$ $
Short-term employee benefits 716803 828463
Post-employment benefits 26849 37539
Share based payments 34097 85675
Termination benefits - -
777749 951678
Transactions between related parties are on normal commercial terms and conditions and no more favourable than those available to other parties unless otherwise stated Subsidiaries The consolidated financial statements include the financial statements of Ferrum Crescent Limited and the subsidiaries listed in the following table
Ferrum South Africa (Pty) Ltd (ldquoFIOrdquo) South Africa 100 100 Ferrum Iron Ore (Pty) Ltd South Africa 9714 9714 Mkhombi Investments (Pty) Ltd (ldquoMIrdquo) South Africa 8846 8846 Ferrum Crescent Limited is the ultimate Australian parent entity and the ultimate parent of the Group Transactions between Ferrum Crescent Limited and its controlled entities during the year consisted of loan advances by Ferrum Crescent Limited All intergroup transactions and balances are eliminated on consolidation The Baphuting Bo Seleka Community Trust (ldquoTrustrdquo) has a 3 indirect interest in FIO the project Company via its investment in MI Until such time as FIO commences mining no expenses or investments have been carried over to the Trust Trade receivable
2016 2015
$ $
Trade receivable 15454 -
Less provision for bad debts (15454)
- -
On 14 October 2015 the Company announced that a BFS Farm-In Agreement had been concluded with Business Venture Investments No1709 (Proprietary) Limited (ldquoBVIrdquo) to form a joint venture for the completion of the bankable feasibility study (ldquoBFSrdquo) The comprehensive Farm-In Agreement provides for the completion of all the requisite BFS workstreams to produce a full BFS on the project to a fixed timeline to be funded by BVI in return for up to a 43 equity interest in Ferrum Iron Ore (Pty) Ltd (ldquoFIOrdquo) the owner of the Moonlight Iron Ore Project As at 30 June 2016 BVI had not paid the Company for any of the expenses that the Company had incurred on behalf of BVI and a bad debt provision has been created Trade payable
Income from
Related Parties
Expenditure to Related
Parties
Amounts Owed by Related
Parties at year end
Amounts Owed to Related
Parties at year end
$ $ $ $
Magnum Mining and Exploration Ltd (i) 2016 - 87582 - 29382
2015 - 106138 - 12296
(i) Mr G Button a non-executive director and company secretary for the Company is also a director of Magnum Mining and Exploration Ltd During the year Magnum Mining and Exploration Ltd received the above fees for office rental office running costs and staffing expenses These fees are based on normal commercial terms and conditions Loans to (from) related parties The following transactions were undertaken between the Company executive officers and director-related entities during 2016 and 2015
2016 2015
$ $
Consulting fees were paid or accrued to Camcove Pty Ltd a company of which Robert Hair is a director and shareholder 60000 60000 Consulting fees were paid or accrued to Tavistock Communications Limited a company of which Merlin Mar-Johnson is an Employee 15672 - Directors fees were paid or accrued to Metallurgical Management Services Pty Ltd a company of which Dr Evan Kirby is a director 7500 -
83172 60000
Note 24 Cash flow information
2016 2015
$ $
Reconciliation of cash flow from operations with loss from ordinary activities after income tax
Loss from ordinary activities after income tax (1573533) (2345860)
Depreciation 11638 18580
Loss (profit) on sale of plant and equipment (8609) -
Profit on sale of available for sale financial assets (649) (137597)
Fair value adjustment of forward subscription agreement - 208375
Share based payment compensation 34097 90851
Net foreign exchange differences 368404 (54155)
Movement of Bad debts 16056 -
Proceeds from third party funding (490850) - Changes in assets and liabilities
(Increase) decrease in receivables (12001) (174766)
(Increase) decrease in other operating assets 31399 (24758)
Increase (decrease) in payables and provisions 45298 (194914)
Cash flows used in operations (1578750) (2575785)
Note 25 Financial risk management objectives and policies
The Grouprsquos principal financial instruments comprise cash short term deposits held-for-trading and derivative instruments
The main purpose of the financial instruments is to finance the Grouprsquos operations The Company also has other financial instruments such as trade debtors and creditors which arise directly from its operations
The main risks arising from the Grouprsquos financial instruments are interest rate risk liquidity risk foreign currency risk and credit risk The board reviews and agrees policies for managing each of these risks and they are summarised below
(a) Interest Rate Risk The Grouprsquos exposure to interest rate risk which is the risk that a financial instrumentrsquos value will fluctuate as a result of changes in market interest rates and the effective weighted average interest rate for each class of financial assets and financial liabilities is set out in the following table Also included is the effect on profit and equity after tax if interest rates at that date had been 10 higher or lower with all other variables held constant as a sensitivity analysis The Group has not entered into any hedging activities to manage interest rate risk In regard to its interest rate risk the Group continuously analyses its exposure Within this analysis consideration is given to potential renewals of existing positions alternative investments and the mix of fixed and variable interest rates
Weighted Floating Fixed Non Interest Rate
Risk Sensitivity
Average Effective Interest Interest Interest
-10 +10
Interest Rate Rate Rate Bearing Total
Profit
Equity
Profit
Equity
$ $ $ $
$
$
$
$
2016
Financial Assets
Cash 005 730546 - 12718 743264 (319) - 319 -
Trust deposits 000 75 - 29229 29303 - - - -
Receivables 000 - - 33929 33929 - - - -
Investments 112 64715 - - 64715 (524) - 524 -
Financial asset 000 - - - - - - - -
Total Financial Assets 795336 - 75876 871211
Financial Liabilities
Trade and other payables - - 439549 439549 - - - -
Total Financial Assets 1055565 136490 79714 1271769
Financial Liabilities
Trade and other payables - - 803892 803892 - - - -
Total Financial Liabilities - - 803892 803892
A sensitivity of 10 has been selected as this is considered reasonable given the current level of both short term and long term Australian dollar interest rates A -10 sensitivity would move short term interest rates at 30 June 2016 from around 2 to 18 representing a 20 basis point downwards shift (1400 basis points net of tax) Based on the sensitivity analysis mainly interest revenue from variable rate deposits cash balances and investment is impacted resulting in a decrease or increase in overall income (b) Liquidity Risk The Group manages liquidity risk by maintaining sufficient cash reserves and marketable securities required to meet the current exploration and administration commitments through the continuous monitoring of actual cash flows Ultimate responsibility for liquidity risk management rests with the board of directors who have built an appropriate liquidity risk management framework for the management of the Grouprsquos short medium and long term funding and liquidity management requirements Less
(c) Credit Risk Credit risk arises in the event that counterparty will not meet its obligations under a financial instrument leading to financial losses The Company is exposed to credit risk from its operating activities and financing activities including deposits with banks and investments with insurance companies The credit risk control procedures adopted by the Company is to assess the credit quality of the institution with whom funds are deposited or invested taking into account its financial position and past experiences The maximum exposure to credit risk on financial assets of the Company which have been recognised on the statement of financial position is generally limited to the carrying amount Cash is maintained with National Australia Bank and the Standard Bank of South Africa The investment in mining rehabilitation insurance policy is invested by Guardrisk in the following investments
Type of Investment Type of interest
Unit trust ndash monthly contributing Floating interest rate
Unit trust ndash fixed investment (paid out during FY2016) Floating interest rate
Money market Floating interest rate
Current account Non-interest bearing
(d) Foreign Exchange Risk The Group undertakes certain transactions denominated in foreign currencies hence exposures to exchange rate fluctuations arise The carrying amount of the Grouprsquos foreign currency denominated monetary assets and monetary liabilities at the reporting date is as follows
Liabilities Assets 2016
$ 2015
$ 2016
$ 2015
$
Great British Pounds (GBP) (631013) (653422) 621213 670765 South African Rand (ZAR) (179) (16208) 179 16208 United States Dollars (USD) 15094 64679 - -
Foreign currency sensitivity analysis The Group is exposed to Great British Pound (GBP) United States Dollar (USD) and South African Rand (ZAR) currency fluctuations The following table details the Grouprsquos sensitivity to a 10 increase and decrease in the Australian Dollar (AUD) against the relevant currencies 10 is the sensitivity rate used when reporting foreign currency risk internally to key management personnel and represents managementrsquos assessment of the possible change in foreign exchange rates The sensitivity analysis includes only outstanding foreign currency denominated monetary items and adjusts their translation at the period end for a 10 change in foreign currency rates The sensitivity analysis includes cash balances held in GBP ZAR and USD which give rise to a foreign currency gain or loss on revaluation A positive number indicates an increase in profit and other equity where the AUD strengthens against the ZAR In relation to cash balances held in GBP a positive number indicates an increase in profit and other equity where the Australian Dollar strengthens against the respective currency For a weakening Australian Dollar against the respective currency there would be an equal and opposite impact on the profit and other equity and the balances below would be negative
2016 2015
Profit (loss) $
Equity increase (decrease)
$
Profit (loss)
$
Equity increase (decrease)
$
- AUD strengthens 10
- ZAR - GBP - USD
(18) (63101)
2890
18 63101 (2890)
(1621) (65342) 12268
1621 65342
(12268) AUD weakens 10
- ZAR - GBP - USD
18 63101 (2890)
(18) (63101)
2890
1621 65342
(12268)
(1621) (65342) 12268
(e) Fair value
The fair values of cash trade and other receivables and trade and other payables approximate their carrying values as a result of their short maturity or because they carry floating rates
(i) Fair value of financial instruments measured at fair value For financial instruments carried at fair value the Group adopts various methods in estimating fair value The methods comprise Level 1 ndash the fair value is calculated using quoted prices in an active market Level 2 ndash the fair value is estimated using inputs other than quoted prices included in Level 1 that are observable for the asset or liability either directly (as prices) or indirectly (derived from prices) Level 3 ndash the fair value is estimated using inputs for the asset or liability that are not based on observable market data
Jun 2016 Jun 2015
AUD AUD
Level 2
Available for sale financial assets 64715 187048
For financial instruments not quoted in active markets the Group uses valuation techniques such as other relevant models used by market participants which may include inputs derived from quoted prices in an active market (Level 2) These valuation techniques use both observable and unobservable market inputs Note 26 Parent Entity Information
2016 2015
$ $
Current assets 742467 934073
Total assets 986159 934474
On 30 November 2009 Ferrum Crescent Limited (formerly Washington Resources Ltd) (ldquoFCRrdquo) completed the legal acquisition of Ferrum Metals Limited (formerly Ferrum Crescent Limited) (ldquoFMLrdquo) Under the terms of AASB 3 Business Combinations (Revised) FML was deemed to be the accounting acquirer in the business combination The transaction was therefore accounted for as a reverse acquisition The Parent entity therefore had issued capital of $25620916 as opposed to the Grouprsquos consolidated issued capital of $28366383 For further details please refer to the disclosures contained within the 30 June 2010 Annual Report There have been no guarantees entered into by the parent entity in relation to any debts of its subsidiaries The parent entity has no contingent liabilities as at 30 June 2016 (2015 Nil) Note 27 Subsequent events
Subsequent to the Company entering into an exclusive option to acquire 100 percent of GoldQuest two nil-cost extensions were granted to Ferrum Crescent and on 22 September 2016 the option was exercised Accordingly the Company has acquired 100 per cent of the share capital of GoldQuest Iberica SL (ldquoGoldQuestrdquo) GoldQuest owns 100 per cent of two lead-zinc exploration projects in the provinces of Leόn and Galicia in historic Spanish mining areas (the ldquoIberian Projectsrdquo) Consideration comprised GBP326500 in cash and the issue of 100 million new ordinary shares in the capital of Ferrum Crescent
On 25 July 2016 the Company announced that it had conditionally raised in aggregate GBP 374453 (AU$655034) before expenses through a placement via Beaufort Securities Limited as agent to the Company of 187226485 new ordinary shares of no par value each in the capital of the Company at a price of 020 pence per new ordinary share As part of the placing each investor was offered subject to shareholder approval in accordance with the ASX Listing Rules options on the basis of one option for every share subscribed pursuant to the placing Each option will entitle the holder to subscribe for a further new ordinary share at a price of 030 pence per share for an exercise period of two years following the date of admission of the placing shares trading on AIM In addition the Company has agreed to grant further 18722649 options to Beaufort Securities Limited on the same terms Following admission the total issued ordinary share capital of the Company was 1470018368 ordinary shares On 28 July 2016 the Company announced that it was issuing 66874816 new ordinary shares of no par value each in the capital of the Company as a result of the exercise of in aggregate 66874816 options exercisable at a price of 0165 pence per share raising AUD 193025 before expenses Such options were granted in
Current liabilities 216061 129863
Total liabilities 216061 129863
Issued capital 37362411 35855014
Accumulated Losses (32278633) (30702626)
Reserves 4313679 4347776
Total shareholdersrsquo equity 770099 804612
Profit (loss) of the parent entity (1576006) (2466304)
Total comprehensive (loss) income (1347367) (2725442)
connection with the Companyrsquos placing and subscription announced on 27 April 2016 Following the issue of the option shares and the abovementioned placing shares the total issued ordinary share capital of the Company was 1536893184 ordinary shares
On 26 August 2016 the Company announced that it was issuing 44797543 new ordinary shares of no par value each in the capital of the Company as a result of the exercise of in aggregate a further 44797543 options exercisable at a price of 0165 pence per share raising AUD 128184 before expenses Such options were granted in connection with the Companyrsquos placing and subscription announced on 27 April 2016 Following the issue of these option shares the total issued ordinary share capital of the Company was 1581690727 ordinary shares
On 23 September 2016 the Company announced that was issuing 5381907 new ordinary shares of no par value each in the capital of the Company as a result of the exercise of in aggregate 5381907 options exercisable at a price of 0165 pence per share Such options were granted in connection with the Companyrsquos placing and subscription announced on 27 April 2016 Following the issue of these further option shares the total issued ordinary share capital of the Company is 1587072634 ordinary shares On 29 September 2016 the Company announced the following proxy results of the General Meeting of Shareholders held on said date in respect of the resolutions set out in the Notice of General Meeting dated 23 August 2016 Resolution 12 and 3 were passed on a show of hands Resolution 1 Ratification of prior issue of Shares Resolution 2 Approval of grant of Placement Options Resolution 3 Approval of grant of Broker Options Also on 29 September 2016 the Company also announced that it was issuing 100000000 new ordinary shares of no par value each in the capital of the Company to GoldQuest Mining (Spain) Corp on 30
th September 2016 These shares will be issued in settlement of the share element of the consideration for the acquisition of
100 per cent of the issued share capital of GoldQuest Iberica SL The shares will be fully paid and rank pari passu in all respects with the Companyrsquos existing ordinary shares Following the issue of the shares the total issued ordinary share capital of the Company is 1687072634 ordinary shares ASX Requirements Distribution schedules of shareholders and statements of voting rights are set out in Table 1 whilst the Companyrsquos top twenty shareholders are shown in Table 2 Substantial shareholder notices that have been received by the Company are set out in Table 3 and the tenement schedule as at 30 June 2016 is set out in Table 4
Table 1 Shareholder spread
Ordinary shares with right to attend meetings and vote personally or by proxy through show of hands and if required by ballot (one vote for each share held) 1-1000 73 1001-5000 107 5001-10000 91 10001-100000 248
100001 - and over 225
Total holders of ordinary shares Total number of ordinary shares
744 1282791883
Options with no right to attend meetings or vote personally or by proxy 1-1000 - 1001-5000 - 5001-10000 - 10001-100000 - 100001 - and over 26 Total holders of options Total number of options
26 513000000
Table 2 Top twenty shareholders
Shareholder Number of shares Percentage
Hargreaves Lansdown (Nominees) Limited 135556381 1057 Barclayshare Nominees Limited 131190328 1023 TD Direct Investing Nominees (Europe) Limited 110415308 861 HSDL Nominees Limited 89981899 702 Redmayne (Nominees) Limited 87434315 682 The Bank of New York (Nominees) Limited 42764600 334 Investor Nominees Limited 41961925 327 Rathbone Nominees Limited 34638909 270 Mr E F G Nealon 26484421 202 Mkhombi Amamato (Pty) Ltd 25281620 197 W B Nominees Limited 24624206 192 Citicorp Nominees Pty Ltd 23269017 181 HSBC Client Holdings Nominee (UK) Limited 22498050 175 IG Markets Limited 22407431 175 Lawshare Nominees Limited 22170630 173 JIM Nominees Limited 20714889 162 Wealth Nominees Limited 20265279 158 Vidacos Nominees Limited 17596041 137 Pershing Nominees Limited 16313425 127 Share Nominees Ltd 15232852 119
Voting Rights The voting rights attached to each class of equity securities are set out below (a) Ordinary shares On a show of hands every member present at a meeting in person or by proxy shall have one vote and upon a poll each share shall have one vote Table 4 Tenement schedule as at 30 June 2016
Project Tenement Number Tenement Status Holder Percentage
Interest
Moonlight 305122201 MR Mining Right
Granted Ferrum Iron Ore
(Pty) Ltd 97
Moonlight
LP30611211868PR Prospecting
Application Ferrum Iron Ore
(Pty) Ltd 97
JSE Limited Requirements
Headline earnings reconciliation 2016 2015
$ $
Loss attributable to ordinary equity holders of the parent entity (1573533) (2345860)
Add back IAS 16 loss on the disposal of plant and equipment (8609) -
Less profit on sale of available for sale investments 649 (137597)
Total tax effects of adjustments (182) 38527
Headline loss (1581675) (2444930)
Basic loss per share (1573533) (2345860)
Weighted average shares in issue 714611971 468894041
Basic loss per share (cents) (022) (050)
Headline loss (1581675) (2444930)
Weighted average shares in issue 714611971 468894041
Headline loss per share (cents) (022) (052)
2016 2015
$ $
Remuneration of the auditor of the Company for
-auditing or reviewing the financial statements
Ernst amp Young Australia - 28000 Ernst amp Young South Africa - 22000 BDO Audit (WA) Pty Ltd 22686 - BDO South Africa Incorporated 11501 - Lancaster Mauritius 5174 4523
39361 54523
-other assurance related services
Ernst amp Young Australia 1803 -
41164 54523
Note 7 Earnings per share
2016 2015
$ $
Basic loss per share (cents per share) (022) (050)
Diluted loss per share (cents per share) (022) (050) Loss used in calculating basic loss per share (1573533) (2345860)
Adjustments to basic loss used to calculate dilutive loss per share - -
Loss used in calculating dilutive loss per share (1573533) (2345860)
Number Number Weighted average number of ordinary shares used in the calculation of basic loss per share 714611971 468894041
Weighted average number of ordinary shares used in the calculation of diluted loss per share 714611971 468894041
There have been no transactions involving ordinary shares or potential shares that would significantly change the number of ordinary shares or potential ordinary shares outstanding between the reporting date and the date of completion of these financial statements
Note 1 ndash 13000000 employee share options outstanding at 30 June 2016 (30 June 2015 13000000) have not been included in the calculation of dilutive earnings per share as these are anti-dilutive Note 2 ndash 29954525 potential shares to be issued under the BBBEE subscription agreement have not been included in the calculation of dilutive earnings per share as these are anti-dilutive Note 8 Cash and cash equivalents
Cash at the end of the financial year as shown in the statement of cash flows is reconciled to items in the statement of financial position as follows
2016 2015
$ $
Cash at bank 743264 1028468
Note 9 Trade and other receivables
2016 2015
$ $
Current
Sundry debtors 18475 2513
GST VAT 15454 19415
33929 21928
Non-trade debtors are non-interest bearing and are generally on 30-90 days credit terms The carrying amounts of these receivables represent fair value and are not considered to be impaired
Note 10 Plant and equipment
Furniture fittings
and equipment
Motor
vehicles Leasehold
improvements
Total
$ $ $ $
Year ended 30 June 2016
Opening net carrying value 7474 8302 13869 29645 Disposals (274) 457 - 183 Depreciation charge for the year (3724) (7166) (748) (11638) Exchange differences (1028) (1592) (2036) (4657)
On 15 February 2016 the Company entered into an exclusive option and sale agreement for a staged option fee of up to GBP22500 with TH Crestgate GmbH (ldquoCrestgaterdquo) a private Swiss-based company to potentially acquire 100 per cent of its indirectly wholly-owned subsidiary GoldQuest Iberica SL (ldquoGoldQuestrdquo) a private company incorporated in Spain which owns 100 per cent of two lead-zinc exploration projects in the provinces of Leoacuten and Galicia in historic Spanish mining areas (ldquothe Iberian Projectsrdquo) to enable the Company to conduct due diligence on GoldQuest and the Iberian Projects
Subsequent to the Company entering into an exclusive option to acquire 100 percent of GoldQuest two nil-cost extensions were granted to the Company on 22 July 2016 and 31 August 2016 Subsequentlyon 22 September 2016 the option was exercised Accordingly the Company has now acquired 100 per cent of the share capital of GoldQuest The consideration comprised GBP326500 in cash and the issue of 100 million new ordinary shares in the capital of the Company
The carrying amount of the financial asset is carried at cost as its fair value cannot be reliably measured at year end as the Company does not have a quoted market price
Note 12 Other financial assets
2016 2015 $ $ Current assets
Rental and Other Deposits 5121 5960
Rehabilitation Trust 24182 28365
29303 34325
Non- current assets
Available for sale investments (at fair value) (refer to note (a) below) 64715 187048
64715 187048
Note (a) Available for sale investments On 30 October 2014 Guardrisk issued a financial guarantee for the rehabilitation of land to be disturbed by mining to the DMR for the sum of R7517000
On 1 November 2014 Ferrum Iron Ore (Pty) Ltd a subsidiary of the Company signed a policy of insurance where-by an initial lump sum of R1500000 (approx AUD 149250 at the then prevailing AUDZAR exchange rate of 100503) and a monthly contribution of R100000 (approx AUD9950 at the same exchange rate) would be paid for a fixed period from 1 November 2014 to 31 October 2017 to cover the environmental guarantee On 18 November 2015 the policy was renegotiated and a lump sum of R1104878 (approx AUD 92699 at the then prevailing AUDZAR exchange rate of 119190) was paid out to the Company as working capital and the monthly contributions were amended to be paid up on condition that the Company advise Guardrisk of any intention to do further explorative work The policy is due to be renegotiated in October 2017 when the environment guarantee expires Note 12 Other financial assets (continued) Note (a) Available for sale investments(continued) There is a provision in the policy to the effect that at the end of the policy period or cancellation (and where applicable) should there be a positive balance sitting in the policy after taking into account all expenditure (including claims) Guardrisk will declare a performance bonus back to the Company There is no prior entitlement to this performance bonus Note 13 Trade and other payables
2016 2015
$ $
Current
Trade payables and other payables 263827 168713
263827 168713
Trade and other payables are non-interest bearing and are normally settled on 30-day terms Note 14 Provision for payments received in advance
2016 2015
$ $
Current
Provision for Anvwar Asian Investments 175722 629325
175722 629325
During the 2014 reporting period the Company entered into a legally binding heads of agreement with Anvwar Asian Investment (ldquoAAIrdquo) an entity based in Oman whereby AAI was to purchase a 35 interest in Ferrum Iron Ore (Pty) Ltd (ldquoFIOrdquo) the Group Company that holds the Moonlight Project Following a number of term variations of this letter of intent the Company entered into a new agreement with AAI in March 2014 whereby AAI agreed to pay US$1 million by way of two tranches of US$500000 one payable by the end of March 2014 and the second payable by the end of April 2014 thereby earning the right subject to the requisite approvals of the South African Reserve Bank to be issued with FIO shares equalling 35 of that company being partly paid subject to the right to pay an additional US$9 million to become fully paid or be converted into 35 of FIO fully paid The additional US$9 million had to be paid by the earlier of 31 December 2015 and completion of the Moonlight BFS However the second tranche of US$500000 was not received by the Company within the time frame stipulated under the agreement The Company therefore informed AAI of its default and AAI remains in default as at the date of this report Accordingly the first tranche of US$500000 was initially recorded as a current liability On 14 March 2015 the Company terminated the investment agreement between itself and AAI as a result of AAIrsquos breach of a material term of the agreement On 22 July 2015 AAIrsquos lawyers Trowers amp Hamlins issued a letter to the Company requesting that the first tranche be returned to AAI within 14 days from the date of issue They advised that AAI will commence legal proceedings for the recovery of the first tranche plus any interest and costs incurred by AAI On 30 June 2016 after no further correspondence between AAI its lawyers and the Company the Company derecognised an amount of US$364448 leaving a provision of US$135552 for payments received in advance Refer to note 22 for the contingent liability with respect to this matter Note 15 Provisions
incentive plan shares (2300000) (2300000) (265302) (265302)
1280491883 616487353 33049490 31542093
Capital management When managing capital (which is defined as the Companyrsquos total equity) managementrsquos objective is to ensure the entity continues as a going concern as well as to maintain optimal returns to shareholders and benefits for other stakeholders Management also aims to maintain a capital structure that ensures the lowest cost of capital available to the entity As the equity market is constantly changing management may issue new shares to provide for future exploration and development activity The Company is not subject to any externally imposed capital requirements
During the year ended 30 June 2016 nil (2015 4295000) shares were issued back to the market from the Employee Incentive Share Plan (b) Movements in ordinary share capital
Date Details Number of
shares $
30 June 2014 Closing Balance 380602777 29843607
10 November 2014 Allotment issue 49065642 392525
13 November 2014 Underwritten issue 58434358 467475
12 December 2014 Private placement 21525819 173077
12 December 2014 Salary sacrifice share scheme issue 9158757 171147
22 May 2015 Private placement 48000000 465600
29 May 2015 Private placement 52000000 504400
29 May 2015 Share plan shares sold on market (c) 59344
Costs associated with share issues (269780)
30 June 2015 Closing Balance 618787353 31807395
17 February 2016 Subscription Shares 4515041 13046
29 February 2016 Subscription Shares 149681797 359236
27 April 2016 Placing and Subscription Shares 500000000 1279499
27 April 2016 Fee Shares 4807692 12303
27 April 2016 Shares ndash TH Crestgate GmbH 5000000 12795
Costs associated with share issues (169476)
30 June 2016 Closing Balance 1282791883 33314792
Employee share plan shares on issue (2300000) (265302)
1280491883 33049490
If at any time during the exercise period an employee ceases to be an employee all share options held by that employee will lapse one month after their employment end date Therefore employee shares above are only recognised in issued capital when issued to the employees concerned
(c) Movements in employee share plan shares issued with limited recourse employee loans
Date Details Number of
shares $
01 July 2014 Opening balance 6595000 (509905) Cancelled during 2015 (4295000) 244603 Issued during 2015 - -
30 June 2015 Closing balance 2300000 (265302)
Cancelled during 2016 - - Issued during 2016 - -
30 June 2016 Closing balance 2300000 (265302)
The table below summarises the model inputs (post consolidation) for employee share plan shares granted during periods prior to 30 June 2016
Shares granted for consideration
2150000
Exercise price 0198 Interest rate 0 Issue date 7 December 2010 Expiry date 30 November 2014 Underlying security spot price at grant date (GBP) 0198 Expected life 4 Shares granted for consideration
150000
Exercise price 0100 Interest rate 0 Issue date 24 February 2012 Expiry date 24 February 2016 Underlying security spot price at grant date (GBP) 0100 Expected life 4
No employee share plan shares were issued in 2016 (2015 Nil) This account is used to record the value of shares issued under the Executive Share Incentive Plan (ESIP) The ESIP is accounted for as an ldquoin-substancerdquo option plan due to the limited recourse nature of the loan between employees and the Company to finance the purchase of ordinary shares The total fair value of the ldquoin substancerdquo options issued under the plan is recognised as a share-based payment expense over the vesting period with a corresponding increase in equity
Note 17 Listed Options
2016 2015
No of Options No of Options
Options
At year end the following options were on issue
- 21 November 2016 Options exercisable at 3 cents per share 500000 500000
- 19 February 2017 Options exercisable at 8 cents per share 2500000 2500000
- 2 February 2018 Options exercisable at GBP00075 per share 2000000 2000000
- 2 February 2018 Options exercisable at GBP002 per share 3000000 3000000
- 1 March 2018 Options exercisable at GBP00075 per share 2000000 2000000
- 1 March 2018 Options exercisable at GBP002 per share 3000000 3000000
- 12 May 2016 Unlisted options issued to investors 500000000 -
513000000 13000000
2016 2015
Movements in 21 November 2016 Options No of Options No of Options
Beginning of the financial year 500000 500000
Options issued during the year - -
Options cancelled during the year - -
End of the financial year 500000 500000
Movements in 19 February 2017 Options
Beginning of the financial year 2500000 2500000
Options issued during the year - -
Options cancelled during the year - -
End of the financial year 2500000 2500000
Movements in 2 February 2018 Options
Beginning of the financial year 5000000 -
Options issued during the year - 5000000
Options cancelled during the year - -
End of the financial year 5000000 5000000
Movements in 1 March 2018 Options
Beginning of the financial year 5000000 -
Options issued during the year - 5000000
Options cancelled during the year - -
End of the financial year 5000000 5000000
Movement in 12 May 2018 unlisted options issued to investors
Beginning of the financial year - -
Options issued during the year 500000000 -
Options cancelled during the year - -
End of the financial year 500000000 -
The table below summarises the model inputs (post consolidation) for investor options granted during the year ended 30 June 2016
Options granted for consideration
500000000
Exercise price (GBP) 000165 Issue date 12 May 2016 Expiry date 12 May 2018 Underlying security spot price at grant date (GBP) 000165 Expected life 2
Movements after 30 June 2016
On 29 July 2016 66874816 of the options issued on 12 May 2016 were exercised at a price of GBP 00165 pence per share In addition on 29 July 2016 187226485 ordinary shares were issued at a price of GBP 0020 pence per share along with an option of 187226485 options of GBP0030 pence per share that are exercisable over a period of 2 years subject to the receipt of shareholder approval
On 26 August 2016 44797543 of the options issued on 12 May 2016 were exercised at a price of GBP 00165 pence per share
On 28 September 2016 5381907 of the options issued on 12 May 2016 were exercised at a price of GBP 00165 pence per share
Note 18 Reserves
Employee share
incentive reserve
Options reserve
Foreign
exchange reserve
Equity reserve
Available for sale reserve
Total
$ $ $ $ $ $
At 1 July 2014 608335 1428281 134560 (10126072) 78524 (7876372)
Options issued - 86461 - - - 86461 Shares issued to KMPs on the Salary Sacrifice Scheme 54389 - - - - 54389 Directors and KMP salary sacrifice for shares issued (171147) - - - - (171147) Growth in investment portfolio - - - - 20546 20546 Reclassification adjustment for gains included in the income statement (net of tax effect) - - - - (99070) (99070)
At 30 June 2015 491577 1514742 (46054) (10126072) - (8165807) Options issued under Employee Option plan - 34098 - - - 34098 Net growth on Investment Portfolio - - (991) - - (991)
Currency translation - - 226166 - - 226166
differences
At 30 June 2016 491577 1548840 179121 (10126072) - (7906534)
^This amount includes remuneration to KMPs and Directors that was accrued and will ultimately be settled in shares under the Companyrsquos salary sacrifice scheme
Nature and purpose of reserves
Employee share incentive reserve This reserve is used to record the value of equity benefits provided to employees consultants and directors as part of their remuneration under the Executive Share Incentive
Plan
Options reserve This reserve is used to record the value of options issued other than share-based payments to directors employees and consultants as part of their remuneration Foreign currency translation reserve The foreign currency translation reserve is used to record exchange differences arising from the translation of the financial statements of foreign subsidiaries Equity reserve The Equity reserve is used to record the acquisition of the non-controlling interest by the Group and to record differences between the carrying value of non-controlling interests and the consideration paid received where there has been a transaction involving non-controlling interests that do not result in a loss of control The reserve is attributable to the equity of the parent Available-for-sale reserve Used to record changes in the fair value of the Grouprsquos available-for-sale financial assets Note 19 Accumulated losses
2016 2015
$ $
Accumulated losses at the beginning of the financial year
(22850764) (20504904)
Net loss for the year (1573533) (2345860)
Accumulated losses at the end of the financial year (24424297) (22850764)
Note 20 Share based payments
Expenses arising from share-based payment transactions Total expenses arising from share-based payment transactions recognised during the year were as follows
2016
$ 2015
$
Options issued in consideration for services 34097 90851
34097 90851
Options issued in consideration for services Fair value of options granted The fair value at the grant date of options issued is determined using a binomial option pricing model that takes into account the exercise price the term of the option the impact of dilution the non-tradable nature of the option the share price at grant date and expected price volatility of the underlying share the expected dividend yield and the risk-free interest rate for the term of the option 1 The tables below summarise the model inputs (post consolidation) for options granted prior to the year ended 30 June 2015
Options granted for no consideration 500000 Exercise price (AUD cents) 003 Issue date 21 November 2013 Expiry date 21 November 2016 Underlying security spot price at grant date (AUD cents) 003 Expected price volatility of the Companyrsquos shares 100 Expected dividend yield 0 Expected life 3 Risk-free interest rate 308 Binomial model valuation per option (AUD cents per share) 165
Options granted for no consideration 2500000 Exercise price (AUD cents) 008 Issue date 19 February 2014 Expiry date 19 February 2017 Underlying security spot price at grant date (AUD cents) 006 Expected price volatility of the Companyrsquos shares 100
Expected dividend yield 0 Expected life 3 Risk-free interest rate 297 Binomial model valuation per option (AUD cents per share) 412
Options granted for no consideration 2000000 Exercise price (GBP) 00075 Issue date 2 February 2015 Expiry date 2 February 2018 Underlying security spot price at grant date (GBP) 00075 Expected price volatility of the Companyrsquos shares 100 Expected dividend yield 0 Expected life 3 Risk-free interest rate 064 Binomial model valuation per option (AUD cents per share) 050 Options granted for no consideration 3000000 Exercise price (GBP) 002 Issue date 2 February 2015 Expiry date 2 February 2018 Underlying security spot price at grant date (GBP) 002 Expected price volatility of the Companyrsquos shares 100 Expected dividend yield 0 Expected life 3 Risk-free interest rate 064 Binomial model valuation per option (AUD cents per share) 034
Options granted for no consideration 2000000 Exercise price (GBP) 00075 Issue date 1 March 2015 Expiry date 1 March 2018 Underlying security spot price at grant date (GBP) 00075 Expected price volatility of the Companyrsquos shares 100 Expected dividend yield 0 Expected life 3 Risk-free interest rate 090 Binomial model valuation per option (AUD cents per share) 055
Options granted for no consideration
3000000
Exercise price (GBP) 002 Issue date 1 March 2015 Expiry date 1 March 2018
Underlying security spot price at grant date (GBP) 002 Expected price volatility of the Companyrsquos shares 100 Expected dividend yield 0 Expected life 3 Risk-free interest rate 090 Binomial model valuation per option (AUD cents per share)
037
Movements
The following table illustrates the number and weighted average exercise prices (WAEP) of and movements in share options during the year
2016
Number
2016
WAEP
2015
Number
2015
WAEP Outstanding at 1 July 13000000 132 3400000 346 Issued during the year - - 10000000 094 Cancelled during the year - (400000) 1000
Outstanding at 30 June 13000000 092 13000000 132
Exercisable at 30 June 11500000 104 10000000 094 Note 21 Commitments
(i) At this stage the Company has no minimum obligations with respect to tenement expenditure requirements (ii) Operating lease commitments are as follows
2016 2015
$ $
Within 1 year 25107 28039
2 to 3 years - -
Total 25107 28039
The Company disposed of its Australian tenements during 2011 and whilst the Company still holds tenements in South Africa expenditure commitments in relation to such tenements have been met The Company has converted its South African prospecting rights into mining rights and applied for new prospecting rights over adjacent land A subsidiary of the Group entered into a 36 month commercial office lease on 1 April 2012 with an 8 annual escalation to the fixed portion of the lease for their head office in Johannesburg South Africa The value of the lease was annualised over the life of the Lease agreement This lease reached the end of its term on 31 March 2015 and
had a renewal period for a further 3 years commencing 1 April 2015 but was only renewed for a period of 1 year until 31 March 2016 During February 2016 the lease was renewed for a further period of 12 months until 31 March 2017 Note 22 Contingent liabilities
The Company received USD500000 from AAI during March 2014 as part of AAIrsquos advanced payment for a percentage ownership of the Companyrsquos subsidiary FIO The transaction was never formaly finalised and on 30 June 2016 the Company transferred the amount of USD364448 from provision for payments received in advance to sundry income to cover expenses incurred by the Company subsequent to AAIrsquos default leaving a value of US$135552 in provision for payments received in advance The matter is contingent liability as the likelihood of probable outflow is not considered remote at this point in time and the Company may be exposed to repay the investment amount of USD 500000 or part thereof subject to the Companyrsquos ability to prove its loss and damages suffered as a result of AAIrsquos breach of contract Note 23 Related party transactions Compensation of Key Management Personnel
2016 2015
$ $
Short-term employee benefits 716803 828463
Post-employment benefits 26849 37539
Share based payments 34097 85675
Termination benefits - -
777749 951678
Transactions between related parties are on normal commercial terms and conditions and no more favourable than those available to other parties unless otherwise stated Subsidiaries The consolidated financial statements include the financial statements of Ferrum Crescent Limited and the subsidiaries listed in the following table
Ferrum South Africa (Pty) Ltd (ldquoFIOrdquo) South Africa 100 100 Ferrum Iron Ore (Pty) Ltd South Africa 9714 9714 Mkhombi Investments (Pty) Ltd (ldquoMIrdquo) South Africa 8846 8846 Ferrum Crescent Limited is the ultimate Australian parent entity and the ultimate parent of the Group Transactions between Ferrum Crescent Limited and its controlled entities during the year consisted of loan advances by Ferrum Crescent Limited All intergroup transactions and balances are eliminated on consolidation The Baphuting Bo Seleka Community Trust (ldquoTrustrdquo) has a 3 indirect interest in FIO the project Company via its investment in MI Until such time as FIO commences mining no expenses or investments have been carried over to the Trust Trade receivable
2016 2015
$ $
Trade receivable 15454 -
Less provision for bad debts (15454)
- -
On 14 October 2015 the Company announced that a BFS Farm-In Agreement had been concluded with Business Venture Investments No1709 (Proprietary) Limited (ldquoBVIrdquo) to form a joint venture for the completion of the bankable feasibility study (ldquoBFSrdquo) The comprehensive Farm-In Agreement provides for the completion of all the requisite BFS workstreams to produce a full BFS on the project to a fixed timeline to be funded by BVI in return for up to a 43 equity interest in Ferrum Iron Ore (Pty) Ltd (ldquoFIOrdquo) the owner of the Moonlight Iron Ore Project As at 30 June 2016 BVI had not paid the Company for any of the expenses that the Company had incurred on behalf of BVI and a bad debt provision has been created Trade payable
Income from
Related Parties
Expenditure to Related
Parties
Amounts Owed by Related
Parties at year end
Amounts Owed to Related
Parties at year end
$ $ $ $
Magnum Mining and Exploration Ltd (i) 2016 - 87582 - 29382
2015 - 106138 - 12296
(i) Mr G Button a non-executive director and company secretary for the Company is also a director of Magnum Mining and Exploration Ltd During the year Magnum Mining and Exploration Ltd received the above fees for office rental office running costs and staffing expenses These fees are based on normal commercial terms and conditions Loans to (from) related parties The following transactions were undertaken between the Company executive officers and director-related entities during 2016 and 2015
2016 2015
$ $
Consulting fees were paid or accrued to Camcove Pty Ltd a company of which Robert Hair is a director and shareholder 60000 60000 Consulting fees were paid or accrued to Tavistock Communications Limited a company of which Merlin Mar-Johnson is an Employee 15672 - Directors fees were paid or accrued to Metallurgical Management Services Pty Ltd a company of which Dr Evan Kirby is a director 7500 -
83172 60000
Note 24 Cash flow information
2016 2015
$ $
Reconciliation of cash flow from operations with loss from ordinary activities after income tax
Loss from ordinary activities after income tax (1573533) (2345860)
Depreciation 11638 18580
Loss (profit) on sale of plant and equipment (8609) -
Profit on sale of available for sale financial assets (649) (137597)
Fair value adjustment of forward subscription agreement - 208375
Share based payment compensation 34097 90851
Net foreign exchange differences 368404 (54155)
Movement of Bad debts 16056 -
Proceeds from third party funding (490850) - Changes in assets and liabilities
(Increase) decrease in receivables (12001) (174766)
(Increase) decrease in other operating assets 31399 (24758)
Increase (decrease) in payables and provisions 45298 (194914)
Cash flows used in operations (1578750) (2575785)
Note 25 Financial risk management objectives and policies
The Grouprsquos principal financial instruments comprise cash short term deposits held-for-trading and derivative instruments
The main purpose of the financial instruments is to finance the Grouprsquos operations The Company also has other financial instruments such as trade debtors and creditors which arise directly from its operations
The main risks arising from the Grouprsquos financial instruments are interest rate risk liquidity risk foreign currency risk and credit risk The board reviews and agrees policies for managing each of these risks and they are summarised below
(a) Interest Rate Risk The Grouprsquos exposure to interest rate risk which is the risk that a financial instrumentrsquos value will fluctuate as a result of changes in market interest rates and the effective weighted average interest rate for each class of financial assets and financial liabilities is set out in the following table Also included is the effect on profit and equity after tax if interest rates at that date had been 10 higher or lower with all other variables held constant as a sensitivity analysis The Group has not entered into any hedging activities to manage interest rate risk In regard to its interest rate risk the Group continuously analyses its exposure Within this analysis consideration is given to potential renewals of existing positions alternative investments and the mix of fixed and variable interest rates
Weighted Floating Fixed Non Interest Rate
Risk Sensitivity
Average Effective Interest Interest Interest
-10 +10
Interest Rate Rate Rate Bearing Total
Profit
Equity
Profit
Equity
$ $ $ $
$
$
$
$
2016
Financial Assets
Cash 005 730546 - 12718 743264 (319) - 319 -
Trust deposits 000 75 - 29229 29303 - - - -
Receivables 000 - - 33929 33929 - - - -
Investments 112 64715 - - 64715 (524) - 524 -
Financial asset 000 - - - - - - - -
Total Financial Assets 795336 - 75876 871211
Financial Liabilities
Trade and other payables - - 439549 439549 - - - -
Total Financial Assets 1055565 136490 79714 1271769
Financial Liabilities
Trade and other payables - - 803892 803892 - - - -
Total Financial Liabilities - - 803892 803892
A sensitivity of 10 has been selected as this is considered reasonable given the current level of both short term and long term Australian dollar interest rates A -10 sensitivity would move short term interest rates at 30 June 2016 from around 2 to 18 representing a 20 basis point downwards shift (1400 basis points net of tax) Based on the sensitivity analysis mainly interest revenue from variable rate deposits cash balances and investment is impacted resulting in a decrease or increase in overall income (b) Liquidity Risk The Group manages liquidity risk by maintaining sufficient cash reserves and marketable securities required to meet the current exploration and administration commitments through the continuous monitoring of actual cash flows Ultimate responsibility for liquidity risk management rests with the board of directors who have built an appropriate liquidity risk management framework for the management of the Grouprsquos short medium and long term funding and liquidity management requirements Less
(c) Credit Risk Credit risk arises in the event that counterparty will not meet its obligations under a financial instrument leading to financial losses The Company is exposed to credit risk from its operating activities and financing activities including deposits with banks and investments with insurance companies The credit risk control procedures adopted by the Company is to assess the credit quality of the institution with whom funds are deposited or invested taking into account its financial position and past experiences The maximum exposure to credit risk on financial assets of the Company which have been recognised on the statement of financial position is generally limited to the carrying amount Cash is maintained with National Australia Bank and the Standard Bank of South Africa The investment in mining rehabilitation insurance policy is invested by Guardrisk in the following investments
Type of Investment Type of interest
Unit trust ndash monthly contributing Floating interest rate
Unit trust ndash fixed investment (paid out during FY2016) Floating interest rate
Money market Floating interest rate
Current account Non-interest bearing
(d) Foreign Exchange Risk The Group undertakes certain transactions denominated in foreign currencies hence exposures to exchange rate fluctuations arise The carrying amount of the Grouprsquos foreign currency denominated monetary assets and monetary liabilities at the reporting date is as follows
Liabilities Assets 2016
$ 2015
$ 2016
$ 2015
$
Great British Pounds (GBP) (631013) (653422) 621213 670765 South African Rand (ZAR) (179) (16208) 179 16208 United States Dollars (USD) 15094 64679 - -
Foreign currency sensitivity analysis The Group is exposed to Great British Pound (GBP) United States Dollar (USD) and South African Rand (ZAR) currency fluctuations The following table details the Grouprsquos sensitivity to a 10 increase and decrease in the Australian Dollar (AUD) against the relevant currencies 10 is the sensitivity rate used when reporting foreign currency risk internally to key management personnel and represents managementrsquos assessment of the possible change in foreign exchange rates The sensitivity analysis includes only outstanding foreign currency denominated monetary items and adjusts their translation at the period end for a 10 change in foreign currency rates The sensitivity analysis includes cash balances held in GBP ZAR and USD which give rise to a foreign currency gain or loss on revaluation A positive number indicates an increase in profit and other equity where the AUD strengthens against the ZAR In relation to cash balances held in GBP a positive number indicates an increase in profit and other equity where the Australian Dollar strengthens against the respective currency For a weakening Australian Dollar against the respective currency there would be an equal and opposite impact on the profit and other equity and the balances below would be negative
2016 2015
Profit (loss) $
Equity increase (decrease)
$
Profit (loss)
$
Equity increase (decrease)
$
- AUD strengthens 10
- ZAR - GBP - USD
(18) (63101)
2890
18 63101 (2890)
(1621) (65342) 12268
1621 65342
(12268) AUD weakens 10
- ZAR - GBP - USD
18 63101 (2890)
(18) (63101)
2890
1621 65342
(12268)
(1621) (65342) 12268
(e) Fair value
The fair values of cash trade and other receivables and trade and other payables approximate their carrying values as a result of their short maturity or because they carry floating rates
(i) Fair value of financial instruments measured at fair value For financial instruments carried at fair value the Group adopts various methods in estimating fair value The methods comprise Level 1 ndash the fair value is calculated using quoted prices in an active market Level 2 ndash the fair value is estimated using inputs other than quoted prices included in Level 1 that are observable for the asset or liability either directly (as prices) or indirectly (derived from prices) Level 3 ndash the fair value is estimated using inputs for the asset or liability that are not based on observable market data
Jun 2016 Jun 2015
AUD AUD
Level 2
Available for sale financial assets 64715 187048
For financial instruments not quoted in active markets the Group uses valuation techniques such as other relevant models used by market participants which may include inputs derived from quoted prices in an active market (Level 2) These valuation techniques use both observable and unobservable market inputs Note 26 Parent Entity Information
2016 2015
$ $
Current assets 742467 934073
Total assets 986159 934474
On 30 November 2009 Ferrum Crescent Limited (formerly Washington Resources Ltd) (ldquoFCRrdquo) completed the legal acquisition of Ferrum Metals Limited (formerly Ferrum Crescent Limited) (ldquoFMLrdquo) Under the terms of AASB 3 Business Combinations (Revised) FML was deemed to be the accounting acquirer in the business combination The transaction was therefore accounted for as a reverse acquisition The Parent entity therefore had issued capital of $25620916 as opposed to the Grouprsquos consolidated issued capital of $28366383 For further details please refer to the disclosures contained within the 30 June 2010 Annual Report There have been no guarantees entered into by the parent entity in relation to any debts of its subsidiaries The parent entity has no contingent liabilities as at 30 June 2016 (2015 Nil) Note 27 Subsequent events
Subsequent to the Company entering into an exclusive option to acquire 100 percent of GoldQuest two nil-cost extensions were granted to Ferrum Crescent and on 22 September 2016 the option was exercised Accordingly the Company has acquired 100 per cent of the share capital of GoldQuest Iberica SL (ldquoGoldQuestrdquo) GoldQuest owns 100 per cent of two lead-zinc exploration projects in the provinces of Leόn and Galicia in historic Spanish mining areas (the ldquoIberian Projectsrdquo) Consideration comprised GBP326500 in cash and the issue of 100 million new ordinary shares in the capital of Ferrum Crescent
On 25 July 2016 the Company announced that it had conditionally raised in aggregate GBP 374453 (AU$655034) before expenses through a placement via Beaufort Securities Limited as agent to the Company of 187226485 new ordinary shares of no par value each in the capital of the Company at a price of 020 pence per new ordinary share As part of the placing each investor was offered subject to shareholder approval in accordance with the ASX Listing Rules options on the basis of one option for every share subscribed pursuant to the placing Each option will entitle the holder to subscribe for a further new ordinary share at a price of 030 pence per share for an exercise period of two years following the date of admission of the placing shares trading on AIM In addition the Company has agreed to grant further 18722649 options to Beaufort Securities Limited on the same terms Following admission the total issued ordinary share capital of the Company was 1470018368 ordinary shares On 28 July 2016 the Company announced that it was issuing 66874816 new ordinary shares of no par value each in the capital of the Company as a result of the exercise of in aggregate 66874816 options exercisable at a price of 0165 pence per share raising AUD 193025 before expenses Such options were granted in
Current liabilities 216061 129863
Total liabilities 216061 129863
Issued capital 37362411 35855014
Accumulated Losses (32278633) (30702626)
Reserves 4313679 4347776
Total shareholdersrsquo equity 770099 804612
Profit (loss) of the parent entity (1576006) (2466304)
Total comprehensive (loss) income (1347367) (2725442)
connection with the Companyrsquos placing and subscription announced on 27 April 2016 Following the issue of the option shares and the abovementioned placing shares the total issued ordinary share capital of the Company was 1536893184 ordinary shares
On 26 August 2016 the Company announced that it was issuing 44797543 new ordinary shares of no par value each in the capital of the Company as a result of the exercise of in aggregate a further 44797543 options exercisable at a price of 0165 pence per share raising AUD 128184 before expenses Such options were granted in connection with the Companyrsquos placing and subscription announced on 27 April 2016 Following the issue of these option shares the total issued ordinary share capital of the Company was 1581690727 ordinary shares
On 23 September 2016 the Company announced that was issuing 5381907 new ordinary shares of no par value each in the capital of the Company as a result of the exercise of in aggregate 5381907 options exercisable at a price of 0165 pence per share Such options were granted in connection with the Companyrsquos placing and subscription announced on 27 April 2016 Following the issue of these further option shares the total issued ordinary share capital of the Company is 1587072634 ordinary shares On 29 September 2016 the Company announced the following proxy results of the General Meeting of Shareholders held on said date in respect of the resolutions set out in the Notice of General Meeting dated 23 August 2016 Resolution 12 and 3 were passed on a show of hands Resolution 1 Ratification of prior issue of Shares Resolution 2 Approval of grant of Placement Options Resolution 3 Approval of grant of Broker Options Also on 29 September 2016 the Company also announced that it was issuing 100000000 new ordinary shares of no par value each in the capital of the Company to GoldQuest Mining (Spain) Corp on 30
th September 2016 These shares will be issued in settlement of the share element of the consideration for the acquisition of
100 per cent of the issued share capital of GoldQuest Iberica SL The shares will be fully paid and rank pari passu in all respects with the Companyrsquos existing ordinary shares Following the issue of the shares the total issued ordinary share capital of the Company is 1687072634 ordinary shares ASX Requirements Distribution schedules of shareholders and statements of voting rights are set out in Table 1 whilst the Companyrsquos top twenty shareholders are shown in Table 2 Substantial shareholder notices that have been received by the Company are set out in Table 3 and the tenement schedule as at 30 June 2016 is set out in Table 4
Table 1 Shareholder spread
Ordinary shares with right to attend meetings and vote personally or by proxy through show of hands and if required by ballot (one vote for each share held) 1-1000 73 1001-5000 107 5001-10000 91 10001-100000 248
100001 - and over 225
Total holders of ordinary shares Total number of ordinary shares
744 1282791883
Options with no right to attend meetings or vote personally or by proxy 1-1000 - 1001-5000 - 5001-10000 - 10001-100000 - 100001 - and over 26 Total holders of options Total number of options
26 513000000
Table 2 Top twenty shareholders
Shareholder Number of shares Percentage
Hargreaves Lansdown (Nominees) Limited 135556381 1057 Barclayshare Nominees Limited 131190328 1023 TD Direct Investing Nominees (Europe) Limited 110415308 861 HSDL Nominees Limited 89981899 702 Redmayne (Nominees) Limited 87434315 682 The Bank of New York (Nominees) Limited 42764600 334 Investor Nominees Limited 41961925 327 Rathbone Nominees Limited 34638909 270 Mr E F G Nealon 26484421 202 Mkhombi Amamato (Pty) Ltd 25281620 197 W B Nominees Limited 24624206 192 Citicorp Nominees Pty Ltd 23269017 181 HSBC Client Holdings Nominee (UK) Limited 22498050 175 IG Markets Limited 22407431 175 Lawshare Nominees Limited 22170630 173 JIM Nominees Limited 20714889 162 Wealth Nominees Limited 20265279 158 Vidacos Nominees Limited 17596041 137 Pershing Nominees Limited 16313425 127 Share Nominees Ltd 15232852 119
Voting Rights The voting rights attached to each class of equity securities are set out below (a) Ordinary shares On a show of hands every member present at a meeting in person or by proxy shall have one vote and upon a poll each share shall have one vote Table 4 Tenement schedule as at 30 June 2016
Project Tenement Number Tenement Status Holder Percentage
Interest
Moonlight 305122201 MR Mining Right
Granted Ferrum Iron Ore
(Pty) Ltd 97
Moonlight
LP30611211868PR Prospecting
Application Ferrum Iron Ore
(Pty) Ltd 97
JSE Limited Requirements
Headline earnings reconciliation 2016 2015
$ $
Loss attributable to ordinary equity holders of the parent entity (1573533) (2345860)
Add back IAS 16 loss on the disposal of plant and equipment (8609) -
Less profit on sale of available for sale investments 649 (137597)
Total tax effects of adjustments (182) 38527
Headline loss (1581675) (2444930)
Basic loss per share (1573533) (2345860)
Weighted average shares in issue 714611971 468894041
Basic loss per share (cents) (022) (050)
Headline loss (1581675) (2444930)
Weighted average shares in issue 714611971 468894041
Headline loss per share (cents) (022) (052)
$ $ $ $
Year ended 30 June 2016
Opening net carrying value 7474 8302 13869 29645 Disposals (274) 457 - 183 Depreciation charge for the year (3724) (7166) (748) (11638) Exchange differences (1028) (1592) (2036) (4657)
On 15 February 2016 the Company entered into an exclusive option and sale agreement for a staged option fee of up to GBP22500 with TH Crestgate GmbH (ldquoCrestgaterdquo) a private Swiss-based company to potentially acquire 100 per cent of its indirectly wholly-owned subsidiary GoldQuest Iberica SL (ldquoGoldQuestrdquo) a private company incorporated in Spain which owns 100 per cent of two lead-zinc exploration projects in the provinces of Leoacuten and Galicia in historic Spanish mining areas (ldquothe Iberian Projectsrdquo) to enable the Company to conduct due diligence on GoldQuest and the Iberian Projects
Subsequent to the Company entering into an exclusive option to acquire 100 percent of GoldQuest two nil-cost extensions were granted to the Company on 22 July 2016 and 31 August 2016 Subsequentlyon 22 September 2016 the option was exercised Accordingly the Company has now acquired 100 per cent of the share capital of GoldQuest The consideration comprised GBP326500 in cash and the issue of 100 million new ordinary shares in the capital of the Company
The carrying amount of the financial asset is carried at cost as its fair value cannot be reliably measured at year end as the Company does not have a quoted market price
Note 12 Other financial assets
2016 2015 $ $ Current assets
Rental and Other Deposits 5121 5960
Rehabilitation Trust 24182 28365
29303 34325
Non- current assets
Available for sale investments (at fair value) (refer to note (a) below) 64715 187048
64715 187048
Note (a) Available for sale investments On 30 October 2014 Guardrisk issued a financial guarantee for the rehabilitation of land to be disturbed by mining to the DMR for the sum of R7517000
On 1 November 2014 Ferrum Iron Ore (Pty) Ltd a subsidiary of the Company signed a policy of insurance where-by an initial lump sum of R1500000 (approx AUD 149250 at the then prevailing AUDZAR exchange rate of 100503) and a monthly contribution of R100000 (approx AUD9950 at the same exchange rate) would be paid for a fixed period from 1 November 2014 to 31 October 2017 to cover the environmental guarantee On 18 November 2015 the policy was renegotiated and a lump sum of R1104878 (approx AUD 92699 at the then prevailing AUDZAR exchange rate of 119190) was paid out to the Company as working capital and the monthly contributions were amended to be paid up on condition that the Company advise Guardrisk of any intention to do further explorative work The policy is due to be renegotiated in October 2017 when the environment guarantee expires Note 12 Other financial assets (continued) Note (a) Available for sale investments(continued) There is a provision in the policy to the effect that at the end of the policy period or cancellation (and where applicable) should there be a positive balance sitting in the policy after taking into account all expenditure (including claims) Guardrisk will declare a performance bonus back to the Company There is no prior entitlement to this performance bonus Note 13 Trade and other payables
2016 2015
$ $
Current
Trade payables and other payables 263827 168713
263827 168713
Trade and other payables are non-interest bearing and are normally settled on 30-day terms Note 14 Provision for payments received in advance
2016 2015
$ $
Current
Provision for Anvwar Asian Investments 175722 629325
175722 629325
During the 2014 reporting period the Company entered into a legally binding heads of agreement with Anvwar Asian Investment (ldquoAAIrdquo) an entity based in Oman whereby AAI was to purchase a 35 interest in Ferrum Iron Ore (Pty) Ltd (ldquoFIOrdquo) the Group Company that holds the Moonlight Project Following a number of term variations of this letter of intent the Company entered into a new agreement with AAI in March 2014 whereby AAI agreed to pay US$1 million by way of two tranches of US$500000 one payable by the end of March 2014 and the second payable by the end of April 2014 thereby earning the right subject to the requisite approvals of the South African Reserve Bank to be issued with FIO shares equalling 35 of that company being partly paid subject to the right to pay an additional US$9 million to become fully paid or be converted into 35 of FIO fully paid The additional US$9 million had to be paid by the earlier of 31 December 2015 and completion of the Moonlight BFS However the second tranche of US$500000 was not received by the Company within the time frame stipulated under the agreement The Company therefore informed AAI of its default and AAI remains in default as at the date of this report Accordingly the first tranche of US$500000 was initially recorded as a current liability On 14 March 2015 the Company terminated the investment agreement between itself and AAI as a result of AAIrsquos breach of a material term of the agreement On 22 July 2015 AAIrsquos lawyers Trowers amp Hamlins issued a letter to the Company requesting that the first tranche be returned to AAI within 14 days from the date of issue They advised that AAI will commence legal proceedings for the recovery of the first tranche plus any interest and costs incurred by AAI On 30 June 2016 after no further correspondence between AAI its lawyers and the Company the Company derecognised an amount of US$364448 leaving a provision of US$135552 for payments received in advance Refer to note 22 for the contingent liability with respect to this matter Note 15 Provisions
incentive plan shares (2300000) (2300000) (265302) (265302)
1280491883 616487353 33049490 31542093
Capital management When managing capital (which is defined as the Companyrsquos total equity) managementrsquos objective is to ensure the entity continues as a going concern as well as to maintain optimal returns to shareholders and benefits for other stakeholders Management also aims to maintain a capital structure that ensures the lowest cost of capital available to the entity As the equity market is constantly changing management may issue new shares to provide for future exploration and development activity The Company is not subject to any externally imposed capital requirements
During the year ended 30 June 2016 nil (2015 4295000) shares were issued back to the market from the Employee Incentive Share Plan (b) Movements in ordinary share capital
Date Details Number of
shares $
30 June 2014 Closing Balance 380602777 29843607
10 November 2014 Allotment issue 49065642 392525
13 November 2014 Underwritten issue 58434358 467475
12 December 2014 Private placement 21525819 173077
12 December 2014 Salary sacrifice share scheme issue 9158757 171147
22 May 2015 Private placement 48000000 465600
29 May 2015 Private placement 52000000 504400
29 May 2015 Share plan shares sold on market (c) 59344
Costs associated with share issues (269780)
30 June 2015 Closing Balance 618787353 31807395
17 February 2016 Subscription Shares 4515041 13046
29 February 2016 Subscription Shares 149681797 359236
27 April 2016 Placing and Subscription Shares 500000000 1279499
27 April 2016 Fee Shares 4807692 12303
27 April 2016 Shares ndash TH Crestgate GmbH 5000000 12795
Costs associated with share issues (169476)
30 June 2016 Closing Balance 1282791883 33314792
Employee share plan shares on issue (2300000) (265302)
1280491883 33049490
If at any time during the exercise period an employee ceases to be an employee all share options held by that employee will lapse one month after their employment end date Therefore employee shares above are only recognised in issued capital when issued to the employees concerned
(c) Movements in employee share plan shares issued with limited recourse employee loans
Date Details Number of
shares $
01 July 2014 Opening balance 6595000 (509905) Cancelled during 2015 (4295000) 244603 Issued during 2015 - -
30 June 2015 Closing balance 2300000 (265302)
Cancelled during 2016 - - Issued during 2016 - -
30 June 2016 Closing balance 2300000 (265302)
The table below summarises the model inputs (post consolidation) for employee share plan shares granted during periods prior to 30 June 2016
Shares granted for consideration
2150000
Exercise price 0198 Interest rate 0 Issue date 7 December 2010 Expiry date 30 November 2014 Underlying security spot price at grant date (GBP) 0198 Expected life 4 Shares granted for consideration
150000
Exercise price 0100 Interest rate 0 Issue date 24 February 2012 Expiry date 24 February 2016 Underlying security spot price at grant date (GBP) 0100 Expected life 4
No employee share plan shares were issued in 2016 (2015 Nil) This account is used to record the value of shares issued under the Executive Share Incentive Plan (ESIP) The ESIP is accounted for as an ldquoin-substancerdquo option plan due to the limited recourse nature of the loan between employees and the Company to finance the purchase of ordinary shares The total fair value of the ldquoin substancerdquo options issued under the plan is recognised as a share-based payment expense over the vesting period with a corresponding increase in equity
Note 17 Listed Options
2016 2015
No of Options No of Options
Options
At year end the following options were on issue
- 21 November 2016 Options exercisable at 3 cents per share 500000 500000
- 19 February 2017 Options exercisable at 8 cents per share 2500000 2500000
- 2 February 2018 Options exercisable at GBP00075 per share 2000000 2000000
- 2 February 2018 Options exercisable at GBP002 per share 3000000 3000000
- 1 March 2018 Options exercisable at GBP00075 per share 2000000 2000000
- 1 March 2018 Options exercisable at GBP002 per share 3000000 3000000
- 12 May 2016 Unlisted options issued to investors 500000000 -
513000000 13000000
2016 2015
Movements in 21 November 2016 Options No of Options No of Options
Beginning of the financial year 500000 500000
Options issued during the year - -
Options cancelled during the year - -
End of the financial year 500000 500000
Movements in 19 February 2017 Options
Beginning of the financial year 2500000 2500000
Options issued during the year - -
Options cancelled during the year - -
End of the financial year 2500000 2500000
Movements in 2 February 2018 Options
Beginning of the financial year 5000000 -
Options issued during the year - 5000000
Options cancelled during the year - -
End of the financial year 5000000 5000000
Movements in 1 March 2018 Options
Beginning of the financial year 5000000 -
Options issued during the year - 5000000
Options cancelled during the year - -
End of the financial year 5000000 5000000
Movement in 12 May 2018 unlisted options issued to investors
Beginning of the financial year - -
Options issued during the year 500000000 -
Options cancelled during the year - -
End of the financial year 500000000 -
The table below summarises the model inputs (post consolidation) for investor options granted during the year ended 30 June 2016
Options granted for consideration
500000000
Exercise price (GBP) 000165 Issue date 12 May 2016 Expiry date 12 May 2018 Underlying security spot price at grant date (GBP) 000165 Expected life 2
Movements after 30 June 2016
On 29 July 2016 66874816 of the options issued on 12 May 2016 were exercised at a price of GBP 00165 pence per share In addition on 29 July 2016 187226485 ordinary shares were issued at a price of GBP 0020 pence per share along with an option of 187226485 options of GBP0030 pence per share that are exercisable over a period of 2 years subject to the receipt of shareholder approval
On 26 August 2016 44797543 of the options issued on 12 May 2016 were exercised at a price of GBP 00165 pence per share
On 28 September 2016 5381907 of the options issued on 12 May 2016 were exercised at a price of GBP 00165 pence per share
Note 18 Reserves
Employee share
incentive reserve
Options reserve
Foreign
exchange reserve
Equity reserve
Available for sale reserve
Total
$ $ $ $ $ $
At 1 July 2014 608335 1428281 134560 (10126072) 78524 (7876372)
Options issued - 86461 - - - 86461 Shares issued to KMPs on the Salary Sacrifice Scheme 54389 - - - - 54389 Directors and KMP salary sacrifice for shares issued (171147) - - - - (171147) Growth in investment portfolio - - - - 20546 20546 Reclassification adjustment for gains included in the income statement (net of tax effect) - - - - (99070) (99070)
At 30 June 2015 491577 1514742 (46054) (10126072) - (8165807) Options issued under Employee Option plan - 34098 - - - 34098 Net growth on Investment Portfolio - - (991) - - (991)
Currency translation - - 226166 - - 226166
differences
At 30 June 2016 491577 1548840 179121 (10126072) - (7906534)
^This amount includes remuneration to KMPs and Directors that was accrued and will ultimately be settled in shares under the Companyrsquos salary sacrifice scheme
Nature and purpose of reserves
Employee share incentive reserve This reserve is used to record the value of equity benefits provided to employees consultants and directors as part of their remuneration under the Executive Share Incentive
Plan
Options reserve This reserve is used to record the value of options issued other than share-based payments to directors employees and consultants as part of their remuneration Foreign currency translation reserve The foreign currency translation reserve is used to record exchange differences arising from the translation of the financial statements of foreign subsidiaries Equity reserve The Equity reserve is used to record the acquisition of the non-controlling interest by the Group and to record differences between the carrying value of non-controlling interests and the consideration paid received where there has been a transaction involving non-controlling interests that do not result in a loss of control The reserve is attributable to the equity of the parent Available-for-sale reserve Used to record changes in the fair value of the Grouprsquos available-for-sale financial assets Note 19 Accumulated losses
2016 2015
$ $
Accumulated losses at the beginning of the financial year
(22850764) (20504904)
Net loss for the year (1573533) (2345860)
Accumulated losses at the end of the financial year (24424297) (22850764)
Note 20 Share based payments
Expenses arising from share-based payment transactions Total expenses arising from share-based payment transactions recognised during the year were as follows
2016
$ 2015
$
Options issued in consideration for services 34097 90851
34097 90851
Options issued in consideration for services Fair value of options granted The fair value at the grant date of options issued is determined using a binomial option pricing model that takes into account the exercise price the term of the option the impact of dilution the non-tradable nature of the option the share price at grant date and expected price volatility of the underlying share the expected dividend yield and the risk-free interest rate for the term of the option 1 The tables below summarise the model inputs (post consolidation) for options granted prior to the year ended 30 June 2015
Options granted for no consideration 500000 Exercise price (AUD cents) 003 Issue date 21 November 2013 Expiry date 21 November 2016 Underlying security spot price at grant date (AUD cents) 003 Expected price volatility of the Companyrsquos shares 100 Expected dividend yield 0 Expected life 3 Risk-free interest rate 308 Binomial model valuation per option (AUD cents per share) 165
Options granted for no consideration 2500000 Exercise price (AUD cents) 008 Issue date 19 February 2014 Expiry date 19 February 2017 Underlying security spot price at grant date (AUD cents) 006 Expected price volatility of the Companyrsquos shares 100
Expected dividend yield 0 Expected life 3 Risk-free interest rate 297 Binomial model valuation per option (AUD cents per share) 412
Options granted for no consideration 2000000 Exercise price (GBP) 00075 Issue date 2 February 2015 Expiry date 2 February 2018 Underlying security spot price at grant date (GBP) 00075 Expected price volatility of the Companyrsquos shares 100 Expected dividend yield 0 Expected life 3 Risk-free interest rate 064 Binomial model valuation per option (AUD cents per share) 050 Options granted for no consideration 3000000 Exercise price (GBP) 002 Issue date 2 February 2015 Expiry date 2 February 2018 Underlying security spot price at grant date (GBP) 002 Expected price volatility of the Companyrsquos shares 100 Expected dividend yield 0 Expected life 3 Risk-free interest rate 064 Binomial model valuation per option (AUD cents per share) 034
Options granted for no consideration 2000000 Exercise price (GBP) 00075 Issue date 1 March 2015 Expiry date 1 March 2018 Underlying security spot price at grant date (GBP) 00075 Expected price volatility of the Companyrsquos shares 100 Expected dividend yield 0 Expected life 3 Risk-free interest rate 090 Binomial model valuation per option (AUD cents per share) 055
Options granted for no consideration
3000000
Exercise price (GBP) 002 Issue date 1 March 2015 Expiry date 1 March 2018
Underlying security spot price at grant date (GBP) 002 Expected price volatility of the Companyrsquos shares 100 Expected dividend yield 0 Expected life 3 Risk-free interest rate 090 Binomial model valuation per option (AUD cents per share)
037
Movements
The following table illustrates the number and weighted average exercise prices (WAEP) of and movements in share options during the year
2016
Number
2016
WAEP
2015
Number
2015
WAEP Outstanding at 1 July 13000000 132 3400000 346 Issued during the year - - 10000000 094 Cancelled during the year - (400000) 1000
Outstanding at 30 June 13000000 092 13000000 132
Exercisable at 30 June 11500000 104 10000000 094 Note 21 Commitments
(i) At this stage the Company has no minimum obligations with respect to tenement expenditure requirements (ii) Operating lease commitments are as follows
2016 2015
$ $
Within 1 year 25107 28039
2 to 3 years - -
Total 25107 28039
The Company disposed of its Australian tenements during 2011 and whilst the Company still holds tenements in South Africa expenditure commitments in relation to such tenements have been met The Company has converted its South African prospecting rights into mining rights and applied for new prospecting rights over adjacent land A subsidiary of the Group entered into a 36 month commercial office lease on 1 April 2012 with an 8 annual escalation to the fixed portion of the lease for their head office in Johannesburg South Africa The value of the lease was annualised over the life of the Lease agreement This lease reached the end of its term on 31 March 2015 and
had a renewal period for a further 3 years commencing 1 April 2015 but was only renewed for a period of 1 year until 31 March 2016 During February 2016 the lease was renewed for a further period of 12 months until 31 March 2017 Note 22 Contingent liabilities
The Company received USD500000 from AAI during March 2014 as part of AAIrsquos advanced payment for a percentage ownership of the Companyrsquos subsidiary FIO The transaction was never formaly finalised and on 30 June 2016 the Company transferred the amount of USD364448 from provision for payments received in advance to sundry income to cover expenses incurred by the Company subsequent to AAIrsquos default leaving a value of US$135552 in provision for payments received in advance The matter is contingent liability as the likelihood of probable outflow is not considered remote at this point in time and the Company may be exposed to repay the investment amount of USD 500000 or part thereof subject to the Companyrsquos ability to prove its loss and damages suffered as a result of AAIrsquos breach of contract Note 23 Related party transactions Compensation of Key Management Personnel
2016 2015
$ $
Short-term employee benefits 716803 828463
Post-employment benefits 26849 37539
Share based payments 34097 85675
Termination benefits - -
777749 951678
Transactions between related parties are on normal commercial terms and conditions and no more favourable than those available to other parties unless otherwise stated Subsidiaries The consolidated financial statements include the financial statements of Ferrum Crescent Limited and the subsidiaries listed in the following table
Ferrum South Africa (Pty) Ltd (ldquoFIOrdquo) South Africa 100 100 Ferrum Iron Ore (Pty) Ltd South Africa 9714 9714 Mkhombi Investments (Pty) Ltd (ldquoMIrdquo) South Africa 8846 8846 Ferrum Crescent Limited is the ultimate Australian parent entity and the ultimate parent of the Group Transactions between Ferrum Crescent Limited and its controlled entities during the year consisted of loan advances by Ferrum Crescent Limited All intergroup transactions and balances are eliminated on consolidation The Baphuting Bo Seleka Community Trust (ldquoTrustrdquo) has a 3 indirect interest in FIO the project Company via its investment in MI Until such time as FIO commences mining no expenses or investments have been carried over to the Trust Trade receivable
2016 2015
$ $
Trade receivable 15454 -
Less provision for bad debts (15454)
- -
On 14 October 2015 the Company announced that a BFS Farm-In Agreement had been concluded with Business Venture Investments No1709 (Proprietary) Limited (ldquoBVIrdquo) to form a joint venture for the completion of the bankable feasibility study (ldquoBFSrdquo) The comprehensive Farm-In Agreement provides for the completion of all the requisite BFS workstreams to produce a full BFS on the project to a fixed timeline to be funded by BVI in return for up to a 43 equity interest in Ferrum Iron Ore (Pty) Ltd (ldquoFIOrdquo) the owner of the Moonlight Iron Ore Project As at 30 June 2016 BVI had not paid the Company for any of the expenses that the Company had incurred on behalf of BVI and a bad debt provision has been created Trade payable
Income from
Related Parties
Expenditure to Related
Parties
Amounts Owed by Related
Parties at year end
Amounts Owed to Related
Parties at year end
$ $ $ $
Magnum Mining and Exploration Ltd (i) 2016 - 87582 - 29382
2015 - 106138 - 12296
(i) Mr G Button a non-executive director and company secretary for the Company is also a director of Magnum Mining and Exploration Ltd During the year Magnum Mining and Exploration Ltd received the above fees for office rental office running costs and staffing expenses These fees are based on normal commercial terms and conditions Loans to (from) related parties The following transactions were undertaken between the Company executive officers and director-related entities during 2016 and 2015
2016 2015
$ $
Consulting fees were paid or accrued to Camcove Pty Ltd a company of which Robert Hair is a director and shareholder 60000 60000 Consulting fees were paid or accrued to Tavistock Communications Limited a company of which Merlin Mar-Johnson is an Employee 15672 - Directors fees were paid or accrued to Metallurgical Management Services Pty Ltd a company of which Dr Evan Kirby is a director 7500 -
83172 60000
Note 24 Cash flow information
2016 2015
$ $
Reconciliation of cash flow from operations with loss from ordinary activities after income tax
Loss from ordinary activities after income tax (1573533) (2345860)
Depreciation 11638 18580
Loss (profit) on sale of plant and equipment (8609) -
Profit on sale of available for sale financial assets (649) (137597)
Fair value adjustment of forward subscription agreement - 208375
Share based payment compensation 34097 90851
Net foreign exchange differences 368404 (54155)
Movement of Bad debts 16056 -
Proceeds from third party funding (490850) - Changes in assets and liabilities
(Increase) decrease in receivables (12001) (174766)
(Increase) decrease in other operating assets 31399 (24758)
Increase (decrease) in payables and provisions 45298 (194914)
Cash flows used in operations (1578750) (2575785)
Note 25 Financial risk management objectives and policies
The Grouprsquos principal financial instruments comprise cash short term deposits held-for-trading and derivative instruments
The main purpose of the financial instruments is to finance the Grouprsquos operations The Company also has other financial instruments such as trade debtors and creditors which arise directly from its operations
The main risks arising from the Grouprsquos financial instruments are interest rate risk liquidity risk foreign currency risk and credit risk The board reviews and agrees policies for managing each of these risks and they are summarised below
(a) Interest Rate Risk The Grouprsquos exposure to interest rate risk which is the risk that a financial instrumentrsquos value will fluctuate as a result of changes in market interest rates and the effective weighted average interest rate for each class of financial assets and financial liabilities is set out in the following table Also included is the effect on profit and equity after tax if interest rates at that date had been 10 higher or lower with all other variables held constant as a sensitivity analysis The Group has not entered into any hedging activities to manage interest rate risk In regard to its interest rate risk the Group continuously analyses its exposure Within this analysis consideration is given to potential renewals of existing positions alternative investments and the mix of fixed and variable interest rates
Weighted Floating Fixed Non Interest Rate
Risk Sensitivity
Average Effective Interest Interest Interest
-10 +10
Interest Rate Rate Rate Bearing Total
Profit
Equity
Profit
Equity
$ $ $ $
$
$
$
$
2016
Financial Assets
Cash 005 730546 - 12718 743264 (319) - 319 -
Trust deposits 000 75 - 29229 29303 - - - -
Receivables 000 - - 33929 33929 - - - -
Investments 112 64715 - - 64715 (524) - 524 -
Financial asset 000 - - - - - - - -
Total Financial Assets 795336 - 75876 871211
Financial Liabilities
Trade and other payables - - 439549 439549 - - - -
Total Financial Assets 1055565 136490 79714 1271769
Financial Liabilities
Trade and other payables - - 803892 803892 - - - -
Total Financial Liabilities - - 803892 803892
A sensitivity of 10 has been selected as this is considered reasonable given the current level of both short term and long term Australian dollar interest rates A -10 sensitivity would move short term interest rates at 30 June 2016 from around 2 to 18 representing a 20 basis point downwards shift (1400 basis points net of tax) Based on the sensitivity analysis mainly interest revenue from variable rate deposits cash balances and investment is impacted resulting in a decrease or increase in overall income (b) Liquidity Risk The Group manages liquidity risk by maintaining sufficient cash reserves and marketable securities required to meet the current exploration and administration commitments through the continuous monitoring of actual cash flows Ultimate responsibility for liquidity risk management rests with the board of directors who have built an appropriate liquidity risk management framework for the management of the Grouprsquos short medium and long term funding and liquidity management requirements Less
(c) Credit Risk Credit risk arises in the event that counterparty will not meet its obligations under a financial instrument leading to financial losses The Company is exposed to credit risk from its operating activities and financing activities including deposits with banks and investments with insurance companies The credit risk control procedures adopted by the Company is to assess the credit quality of the institution with whom funds are deposited or invested taking into account its financial position and past experiences The maximum exposure to credit risk on financial assets of the Company which have been recognised on the statement of financial position is generally limited to the carrying amount Cash is maintained with National Australia Bank and the Standard Bank of South Africa The investment in mining rehabilitation insurance policy is invested by Guardrisk in the following investments
Type of Investment Type of interest
Unit trust ndash monthly contributing Floating interest rate
Unit trust ndash fixed investment (paid out during FY2016) Floating interest rate
Money market Floating interest rate
Current account Non-interest bearing
(d) Foreign Exchange Risk The Group undertakes certain transactions denominated in foreign currencies hence exposures to exchange rate fluctuations arise The carrying amount of the Grouprsquos foreign currency denominated monetary assets and monetary liabilities at the reporting date is as follows
Liabilities Assets 2016
$ 2015
$ 2016
$ 2015
$
Great British Pounds (GBP) (631013) (653422) 621213 670765 South African Rand (ZAR) (179) (16208) 179 16208 United States Dollars (USD) 15094 64679 - -
Foreign currency sensitivity analysis The Group is exposed to Great British Pound (GBP) United States Dollar (USD) and South African Rand (ZAR) currency fluctuations The following table details the Grouprsquos sensitivity to a 10 increase and decrease in the Australian Dollar (AUD) against the relevant currencies 10 is the sensitivity rate used when reporting foreign currency risk internally to key management personnel and represents managementrsquos assessment of the possible change in foreign exchange rates The sensitivity analysis includes only outstanding foreign currency denominated monetary items and adjusts their translation at the period end for a 10 change in foreign currency rates The sensitivity analysis includes cash balances held in GBP ZAR and USD which give rise to a foreign currency gain or loss on revaluation A positive number indicates an increase in profit and other equity where the AUD strengthens against the ZAR In relation to cash balances held in GBP a positive number indicates an increase in profit and other equity where the Australian Dollar strengthens against the respective currency For a weakening Australian Dollar against the respective currency there would be an equal and opposite impact on the profit and other equity and the balances below would be negative
2016 2015
Profit (loss) $
Equity increase (decrease)
$
Profit (loss)
$
Equity increase (decrease)
$
- AUD strengthens 10
- ZAR - GBP - USD
(18) (63101)
2890
18 63101 (2890)
(1621) (65342) 12268
1621 65342
(12268) AUD weakens 10
- ZAR - GBP - USD
18 63101 (2890)
(18) (63101)
2890
1621 65342
(12268)
(1621) (65342) 12268
(e) Fair value
The fair values of cash trade and other receivables and trade and other payables approximate their carrying values as a result of their short maturity or because they carry floating rates
(i) Fair value of financial instruments measured at fair value For financial instruments carried at fair value the Group adopts various methods in estimating fair value The methods comprise Level 1 ndash the fair value is calculated using quoted prices in an active market Level 2 ndash the fair value is estimated using inputs other than quoted prices included in Level 1 that are observable for the asset or liability either directly (as prices) or indirectly (derived from prices) Level 3 ndash the fair value is estimated using inputs for the asset or liability that are not based on observable market data
Jun 2016 Jun 2015
AUD AUD
Level 2
Available for sale financial assets 64715 187048
For financial instruments not quoted in active markets the Group uses valuation techniques such as other relevant models used by market participants which may include inputs derived from quoted prices in an active market (Level 2) These valuation techniques use both observable and unobservable market inputs Note 26 Parent Entity Information
2016 2015
$ $
Current assets 742467 934073
Total assets 986159 934474
On 30 November 2009 Ferrum Crescent Limited (formerly Washington Resources Ltd) (ldquoFCRrdquo) completed the legal acquisition of Ferrum Metals Limited (formerly Ferrum Crescent Limited) (ldquoFMLrdquo) Under the terms of AASB 3 Business Combinations (Revised) FML was deemed to be the accounting acquirer in the business combination The transaction was therefore accounted for as a reverse acquisition The Parent entity therefore had issued capital of $25620916 as opposed to the Grouprsquos consolidated issued capital of $28366383 For further details please refer to the disclosures contained within the 30 June 2010 Annual Report There have been no guarantees entered into by the parent entity in relation to any debts of its subsidiaries The parent entity has no contingent liabilities as at 30 June 2016 (2015 Nil) Note 27 Subsequent events
Subsequent to the Company entering into an exclusive option to acquire 100 percent of GoldQuest two nil-cost extensions were granted to Ferrum Crescent and on 22 September 2016 the option was exercised Accordingly the Company has acquired 100 per cent of the share capital of GoldQuest Iberica SL (ldquoGoldQuestrdquo) GoldQuest owns 100 per cent of two lead-zinc exploration projects in the provinces of Leόn and Galicia in historic Spanish mining areas (the ldquoIberian Projectsrdquo) Consideration comprised GBP326500 in cash and the issue of 100 million new ordinary shares in the capital of Ferrum Crescent
On 25 July 2016 the Company announced that it had conditionally raised in aggregate GBP 374453 (AU$655034) before expenses through a placement via Beaufort Securities Limited as agent to the Company of 187226485 new ordinary shares of no par value each in the capital of the Company at a price of 020 pence per new ordinary share As part of the placing each investor was offered subject to shareholder approval in accordance with the ASX Listing Rules options on the basis of one option for every share subscribed pursuant to the placing Each option will entitle the holder to subscribe for a further new ordinary share at a price of 030 pence per share for an exercise period of two years following the date of admission of the placing shares trading on AIM In addition the Company has agreed to grant further 18722649 options to Beaufort Securities Limited on the same terms Following admission the total issued ordinary share capital of the Company was 1470018368 ordinary shares On 28 July 2016 the Company announced that it was issuing 66874816 new ordinary shares of no par value each in the capital of the Company as a result of the exercise of in aggregate 66874816 options exercisable at a price of 0165 pence per share raising AUD 193025 before expenses Such options were granted in
Current liabilities 216061 129863
Total liabilities 216061 129863
Issued capital 37362411 35855014
Accumulated Losses (32278633) (30702626)
Reserves 4313679 4347776
Total shareholdersrsquo equity 770099 804612
Profit (loss) of the parent entity (1576006) (2466304)
Total comprehensive (loss) income (1347367) (2725442)
connection with the Companyrsquos placing and subscription announced on 27 April 2016 Following the issue of the option shares and the abovementioned placing shares the total issued ordinary share capital of the Company was 1536893184 ordinary shares
On 26 August 2016 the Company announced that it was issuing 44797543 new ordinary shares of no par value each in the capital of the Company as a result of the exercise of in aggregate a further 44797543 options exercisable at a price of 0165 pence per share raising AUD 128184 before expenses Such options were granted in connection with the Companyrsquos placing and subscription announced on 27 April 2016 Following the issue of these option shares the total issued ordinary share capital of the Company was 1581690727 ordinary shares
On 23 September 2016 the Company announced that was issuing 5381907 new ordinary shares of no par value each in the capital of the Company as a result of the exercise of in aggregate 5381907 options exercisable at a price of 0165 pence per share Such options were granted in connection with the Companyrsquos placing and subscription announced on 27 April 2016 Following the issue of these further option shares the total issued ordinary share capital of the Company is 1587072634 ordinary shares On 29 September 2016 the Company announced the following proxy results of the General Meeting of Shareholders held on said date in respect of the resolutions set out in the Notice of General Meeting dated 23 August 2016 Resolution 12 and 3 were passed on a show of hands Resolution 1 Ratification of prior issue of Shares Resolution 2 Approval of grant of Placement Options Resolution 3 Approval of grant of Broker Options Also on 29 September 2016 the Company also announced that it was issuing 100000000 new ordinary shares of no par value each in the capital of the Company to GoldQuest Mining (Spain) Corp on 30
th September 2016 These shares will be issued in settlement of the share element of the consideration for the acquisition of
100 per cent of the issued share capital of GoldQuest Iberica SL The shares will be fully paid and rank pari passu in all respects with the Companyrsquos existing ordinary shares Following the issue of the shares the total issued ordinary share capital of the Company is 1687072634 ordinary shares ASX Requirements Distribution schedules of shareholders and statements of voting rights are set out in Table 1 whilst the Companyrsquos top twenty shareholders are shown in Table 2 Substantial shareholder notices that have been received by the Company are set out in Table 3 and the tenement schedule as at 30 June 2016 is set out in Table 4
Table 1 Shareholder spread
Ordinary shares with right to attend meetings and vote personally or by proxy through show of hands and if required by ballot (one vote for each share held) 1-1000 73 1001-5000 107 5001-10000 91 10001-100000 248
100001 - and over 225
Total holders of ordinary shares Total number of ordinary shares
744 1282791883
Options with no right to attend meetings or vote personally or by proxy 1-1000 - 1001-5000 - 5001-10000 - 10001-100000 - 100001 - and over 26 Total holders of options Total number of options
26 513000000
Table 2 Top twenty shareholders
Shareholder Number of shares Percentage
Hargreaves Lansdown (Nominees) Limited 135556381 1057 Barclayshare Nominees Limited 131190328 1023 TD Direct Investing Nominees (Europe) Limited 110415308 861 HSDL Nominees Limited 89981899 702 Redmayne (Nominees) Limited 87434315 682 The Bank of New York (Nominees) Limited 42764600 334 Investor Nominees Limited 41961925 327 Rathbone Nominees Limited 34638909 270 Mr E F G Nealon 26484421 202 Mkhombi Amamato (Pty) Ltd 25281620 197 W B Nominees Limited 24624206 192 Citicorp Nominees Pty Ltd 23269017 181 HSBC Client Holdings Nominee (UK) Limited 22498050 175 IG Markets Limited 22407431 175 Lawshare Nominees Limited 22170630 173 JIM Nominees Limited 20714889 162 Wealth Nominees Limited 20265279 158 Vidacos Nominees Limited 17596041 137 Pershing Nominees Limited 16313425 127 Share Nominees Ltd 15232852 119
Voting Rights The voting rights attached to each class of equity securities are set out below (a) Ordinary shares On a show of hands every member present at a meeting in person or by proxy shall have one vote and upon a poll each share shall have one vote Table 4 Tenement schedule as at 30 June 2016
Project Tenement Number Tenement Status Holder Percentage
Interest
Moonlight 305122201 MR Mining Right
Granted Ferrum Iron Ore
(Pty) Ltd 97
Moonlight
LP30611211868PR Prospecting
Application Ferrum Iron Ore
(Pty) Ltd 97
JSE Limited Requirements
Headline earnings reconciliation 2016 2015
$ $
Loss attributable to ordinary equity holders of the parent entity (1573533) (2345860)
Add back IAS 16 loss on the disposal of plant and equipment (8609) -
Less profit on sale of available for sale investments 649 (137597)
Total tax effects of adjustments (182) 38527
Headline loss (1581675) (2444930)
Basic loss per share (1573533) (2345860)
Weighted average shares in issue 714611971 468894041
Basic loss per share (cents) (022) (050)
Headline loss (1581675) (2444930)
Weighted average shares in issue 714611971 468894041
Headline loss per share (cents) (022) (052)
Note 11 Investments
2016 2015 $ $
Option to acquire GoldQuest Iberica SL 243331 -
243331 -
On 15 February 2016 the Company entered into an exclusive option and sale agreement for a staged option fee of up to GBP22500 with TH Crestgate GmbH (ldquoCrestgaterdquo) a private Swiss-based company to potentially acquire 100 per cent of its indirectly wholly-owned subsidiary GoldQuest Iberica SL (ldquoGoldQuestrdquo) a private company incorporated in Spain which owns 100 per cent of two lead-zinc exploration projects in the provinces of Leoacuten and Galicia in historic Spanish mining areas (ldquothe Iberian Projectsrdquo) to enable the Company to conduct due diligence on GoldQuest and the Iberian Projects
Subsequent to the Company entering into an exclusive option to acquire 100 percent of GoldQuest two nil-cost extensions were granted to the Company on 22 July 2016 and 31 August 2016 Subsequentlyon 22 September 2016 the option was exercised Accordingly the Company has now acquired 100 per cent of the share capital of GoldQuest The consideration comprised GBP326500 in cash and the issue of 100 million new ordinary shares in the capital of the Company
The carrying amount of the financial asset is carried at cost as its fair value cannot be reliably measured at year end as the Company does not have a quoted market price
Note 12 Other financial assets
2016 2015 $ $ Current assets
Rental and Other Deposits 5121 5960
Rehabilitation Trust 24182 28365
29303 34325
Non- current assets
Available for sale investments (at fair value) (refer to note (a) below) 64715 187048
64715 187048
Note (a) Available for sale investments On 30 October 2014 Guardrisk issued a financial guarantee for the rehabilitation of land to be disturbed by mining to the DMR for the sum of R7517000
On 1 November 2014 Ferrum Iron Ore (Pty) Ltd a subsidiary of the Company signed a policy of insurance where-by an initial lump sum of R1500000 (approx AUD 149250 at the then prevailing AUDZAR exchange rate of 100503) and a monthly contribution of R100000 (approx AUD9950 at the same exchange rate) would be paid for a fixed period from 1 November 2014 to 31 October 2017 to cover the environmental guarantee On 18 November 2015 the policy was renegotiated and a lump sum of R1104878 (approx AUD 92699 at the then prevailing AUDZAR exchange rate of 119190) was paid out to the Company as working capital and the monthly contributions were amended to be paid up on condition that the Company advise Guardrisk of any intention to do further explorative work The policy is due to be renegotiated in October 2017 when the environment guarantee expires Note 12 Other financial assets (continued) Note (a) Available for sale investments(continued) There is a provision in the policy to the effect that at the end of the policy period or cancellation (and where applicable) should there be a positive balance sitting in the policy after taking into account all expenditure (including claims) Guardrisk will declare a performance bonus back to the Company There is no prior entitlement to this performance bonus Note 13 Trade and other payables
2016 2015
$ $
Current
Trade payables and other payables 263827 168713
263827 168713
Trade and other payables are non-interest bearing and are normally settled on 30-day terms Note 14 Provision for payments received in advance
2016 2015
$ $
Current
Provision for Anvwar Asian Investments 175722 629325
175722 629325
During the 2014 reporting period the Company entered into a legally binding heads of agreement with Anvwar Asian Investment (ldquoAAIrdquo) an entity based in Oman whereby AAI was to purchase a 35 interest in Ferrum Iron Ore (Pty) Ltd (ldquoFIOrdquo) the Group Company that holds the Moonlight Project Following a number of term variations of this letter of intent the Company entered into a new agreement with AAI in March 2014 whereby AAI agreed to pay US$1 million by way of two tranches of US$500000 one payable by the end of March 2014 and the second payable by the end of April 2014 thereby earning the right subject to the requisite approvals of the South African Reserve Bank to be issued with FIO shares equalling 35 of that company being partly paid subject to the right to pay an additional US$9 million to become fully paid or be converted into 35 of FIO fully paid The additional US$9 million had to be paid by the earlier of 31 December 2015 and completion of the Moonlight BFS However the second tranche of US$500000 was not received by the Company within the time frame stipulated under the agreement The Company therefore informed AAI of its default and AAI remains in default as at the date of this report Accordingly the first tranche of US$500000 was initially recorded as a current liability On 14 March 2015 the Company terminated the investment agreement between itself and AAI as a result of AAIrsquos breach of a material term of the agreement On 22 July 2015 AAIrsquos lawyers Trowers amp Hamlins issued a letter to the Company requesting that the first tranche be returned to AAI within 14 days from the date of issue They advised that AAI will commence legal proceedings for the recovery of the first tranche plus any interest and costs incurred by AAI On 30 June 2016 after no further correspondence between AAI its lawyers and the Company the Company derecognised an amount of US$364448 leaving a provision of US$135552 for payments received in advance Refer to note 22 for the contingent liability with respect to this matter Note 15 Provisions
incentive plan shares (2300000) (2300000) (265302) (265302)
1280491883 616487353 33049490 31542093
Capital management When managing capital (which is defined as the Companyrsquos total equity) managementrsquos objective is to ensure the entity continues as a going concern as well as to maintain optimal returns to shareholders and benefits for other stakeholders Management also aims to maintain a capital structure that ensures the lowest cost of capital available to the entity As the equity market is constantly changing management may issue new shares to provide for future exploration and development activity The Company is not subject to any externally imposed capital requirements
During the year ended 30 June 2016 nil (2015 4295000) shares were issued back to the market from the Employee Incentive Share Plan (b) Movements in ordinary share capital
Date Details Number of
shares $
30 June 2014 Closing Balance 380602777 29843607
10 November 2014 Allotment issue 49065642 392525
13 November 2014 Underwritten issue 58434358 467475
12 December 2014 Private placement 21525819 173077
12 December 2014 Salary sacrifice share scheme issue 9158757 171147
22 May 2015 Private placement 48000000 465600
29 May 2015 Private placement 52000000 504400
29 May 2015 Share plan shares sold on market (c) 59344
Costs associated with share issues (269780)
30 June 2015 Closing Balance 618787353 31807395
17 February 2016 Subscription Shares 4515041 13046
29 February 2016 Subscription Shares 149681797 359236
27 April 2016 Placing and Subscription Shares 500000000 1279499
27 April 2016 Fee Shares 4807692 12303
27 April 2016 Shares ndash TH Crestgate GmbH 5000000 12795
Costs associated with share issues (169476)
30 June 2016 Closing Balance 1282791883 33314792
Employee share plan shares on issue (2300000) (265302)
1280491883 33049490
If at any time during the exercise period an employee ceases to be an employee all share options held by that employee will lapse one month after their employment end date Therefore employee shares above are only recognised in issued capital when issued to the employees concerned
(c) Movements in employee share plan shares issued with limited recourse employee loans
Date Details Number of
shares $
01 July 2014 Opening balance 6595000 (509905) Cancelled during 2015 (4295000) 244603 Issued during 2015 - -
30 June 2015 Closing balance 2300000 (265302)
Cancelled during 2016 - - Issued during 2016 - -
30 June 2016 Closing balance 2300000 (265302)
The table below summarises the model inputs (post consolidation) for employee share plan shares granted during periods prior to 30 June 2016
Shares granted for consideration
2150000
Exercise price 0198 Interest rate 0 Issue date 7 December 2010 Expiry date 30 November 2014 Underlying security spot price at grant date (GBP) 0198 Expected life 4 Shares granted for consideration
150000
Exercise price 0100 Interest rate 0 Issue date 24 February 2012 Expiry date 24 February 2016 Underlying security spot price at grant date (GBP) 0100 Expected life 4
No employee share plan shares were issued in 2016 (2015 Nil) This account is used to record the value of shares issued under the Executive Share Incentive Plan (ESIP) The ESIP is accounted for as an ldquoin-substancerdquo option plan due to the limited recourse nature of the loan between employees and the Company to finance the purchase of ordinary shares The total fair value of the ldquoin substancerdquo options issued under the plan is recognised as a share-based payment expense over the vesting period with a corresponding increase in equity
Note 17 Listed Options
2016 2015
No of Options No of Options
Options
At year end the following options were on issue
- 21 November 2016 Options exercisable at 3 cents per share 500000 500000
- 19 February 2017 Options exercisable at 8 cents per share 2500000 2500000
- 2 February 2018 Options exercisable at GBP00075 per share 2000000 2000000
- 2 February 2018 Options exercisable at GBP002 per share 3000000 3000000
- 1 March 2018 Options exercisable at GBP00075 per share 2000000 2000000
- 1 March 2018 Options exercisable at GBP002 per share 3000000 3000000
- 12 May 2016 Unlisted options issued to investors 500000000 -
513000000 13000000
2016 2015
Movements in 21 November 2016 Options No of Options No of Options
Beginning of the financial year 500000 500000
Options issued during the year - -
Options cancelled during the year - -
End of the financial year 500000 500000
Movements in 19 February 2017 Options
Beginning of the financial year 2500000 2500000
Options issued during the year - -
Options cancelled during the year - -
End of the financial year 2500000 2500000
Movements in 2 February 2018 Options
Beginning of the financial year 5000000 -
Options issued during the year - 5000000
Options cancelled during the year - -
End of the financial year 5000000 5000000
Movements in 1 March 2018 Options
Beginning of the financial year 5000000 -
Options issued during the year - 5000000
Options cancelled during the year - -
End of the financial year 5000000 5000000
Movement in 12 May 2018 unlisted options issued to investors
Beginning of the financial year - -
Options issued during the year 500000000 -
Options cancelled during the year - -
End of the financial year 500000000 -
The table below summarises the model inputs (post consolidation) for investor options granted during the year ended 30 June 2016
Options granted for consideration
500000000
Exercise price (GBP) 000165 Issue date 12 May 2016 Expiry date 12 May 2018 Underlying security spot price at grant date (GBP) 000165 Expected life 2
Movements after 30 June 2016
On 29 July 2016 66874816 of the options issued on 12 May 2016 were exercised at a price of GBP 00165 pence per share In addition on 29 July 2016 187226485 ordinary shares were issued at a price of GBP 0020 pence per share along with an option of 187226485 options of GBP0030 pence per share that are exercisable over a period of 2 years subject to the receipt of shareholder approval
On 26 August 2016 44797543 of the options issued on 12 May 2016 were exercised at a price of GBP 00165 pence per share
On 28 September 2016 5381907 of the options issued on 12 May 2016 were exercised at a price of GBP 00165 pence per share
Note 18 Reserves
Employee share
incentive reserve
Options reserve
Foreign
exchange reserve
Equity reserve
Available for sale reserve
Total
$ $ $ $ $ $
At 1 July 2014 608335 1428281 134560 (10126072) 78524 (7876372)
Options issued - 86461 - - - 86461 Shares issued to KMPs on the Salary Sacrifice Scheme 54389 - - - - 54389 Directors and KMP salary sacrifice for shares issued (171147) - - - - (171147) Growth in investment portfolio - - - - 20546 20546 Reclassification adjustment for gains included in the income statement (net of tax effect) - - - - (99070) (99070)
At 30 June 2015 491577 1514742 (46054) (10126072) - (8165807) Options issued under Employee Option plan - 34098 - - - 34098 Net growth on Investment Portfolio - - (991) - - (991)
Currency translation - - 226166 - - 226166
differences
At 30 June 2016 491577 1548840 179121 (10126072) - (7906534)
^This amount includes remuneration to KMPs and Directors that was accrued and will ultimately be settled in shares under the Companyrsquos salary sacrifice scheme
Nature and purpose of reserves
Employee share incentive reserve This reserve is used to record the value of equity benefits provided to employees consultants and directors as part of their remuneration under the Executive Share Incentive
Plan
Options reserve This reserve is used to record the value of options issued other than share-based payments to directors employees and consultants as part of their remuneration Foreign currency translation reserve The foreign currency translation reserve is used to record exchange differences arising from the translation of the financial statements of foreign subsidiaries Equity reserve The Equity reserve is used to record the acquisition of the non-controlling interest by the Group and to record differences between the carrying value of non-controlling interests and the consideration paid received where there has been a transaction involving non-controlling interests that do not result in a loss of control The reserve is attributable to the equity of the parent Available-for-sale reserve Used to record changes in the fair value of the Grouprsquos available-for-sale financial assets Note 19 Accumulated losses
2016 2015
$ $
Accumulated losses at the beginning of the financial year
(22850764) (20504904)
Net loss for the year (1573533) (2345860)
Accumulated losses at the end of the financial year (24424297) (22850764)
Note 20 Share based payments
Expenses arising from share-based payment transactions Total expenses arising from share-based payment transactions recognised during the year were as follows
2016
$ 2015
$
Options issued in consideration for services 34097 90851
34097 90851
Options issued in consideration for services Fair value of options granted The fair value at the grant date of options issued is determined using a binomial option pricing model that takes into account the exercise price the term of the option the impact of dilution the non-tradable nature of the option the share price at grant date and expected price volatility of the underlying share the expected dividend yield and the risk-free interest rate for the term of the option 1 The tables below summarise the model inputs (post consolidation) for options granted prior to the year ended 30 June 2015
Options granted for no consideration 500000 Exercise price (AUD cents) 003 Issue date 21 November 2013 Expiry date 21 November 2016 Underlying security spot price at grant date (AUD cents) 003 Expected price volatility of the Companyrsquos shares 100 Expected dividend yield 0 Expected life 3 Risk-free interest rate 308 Binomial model valuation per option (AUD cents per share) 165
Options granted for no consideration 2500000 Exercise price (AUD cents) 008 Issue date 19 February 2014 Expiry date 19 February 2017 Underlying security spot price at grant date (AUD cents) 006 Expected price volatility of the Companyrsquos shares 100
Expected dividend yield 0 Expected life 3 Risk-free interest rate 297 Binomial model valuation per option (AUD cents per share) 412
Options granted for no consideration 2000000 Exercise price (GBP) 00075 Issue date 2 February 2015 Expiry date 2 February 2018 Underlying security spot price at grant date (GBP) 00075 Expected price volatility of the Companyrsquos shares 100 Expected dividend yield 0 Expected life 3 Risk-free interest rate 064 Binomial model valuation per option (AUD cents per share) 050 Options granted for no consideration 3000000 Exercise price (GBP) 002 Issue date 2 February 2015 Expiry date 2 February 2018 Underlying security spot price at grant date (GBP) 002 Expected price volatility of the Companyrsquos shares 100 Expected dividend yield 0 Expected life 3 Risk-free interest rate 064 Binomial model valuation per option (AUD cents per share) 034
Options granted for no consideration 2000000 Exercise price (GBP) 00075 Issue date 1 March 2015 Expiry date 1 March 2018 Underlying security spot price at grant date (GBP) 00075 Expected price volatility of the Companyrsquos shares 100 Expected dividend yield 0 Expected life 3 Risk-free interest rate 090 Binomial model valuation per option (AUD cents per share) 055
Options granted for no consideration
3000000
Exercise price (GBP) 002 Issue date 1 March 2015 Expiry date 1 March 2018
Underlying security spot price at grant date (GBP) 002 Expected price volatility of the Companyrsquos shares 100 Expected dividend yield 0 Expected life 3 Risk-free interest rate 090 Binomial model valuation per option (AUD cents per share)
037
Movements
The following table illustrates the number and weighted average exercise prices (WAEP) of and movements in share options during the year
2016
Number
2016
WAEP
2015
Number
2015
WAEP Outstanding at 1 July 13000000 132 3400000 346 Issued during the year - - 10000000 094 Cancelled during the year - (400000) 1000
Outstanding at 30 June 13000000 092 13000000 132
Exercisable at 30 June 11500000 104 10000000 094 Note 21 Commitments
(i) At this stage the Company has no minimum obligations with respect to tenement expenditure requirements (ii) Operating lease commitments are as follows
2016 2015
$ $
Within 1 year 25107 28039
2 to 3 years - -
Total 25107 28039
The Company disposed of its Australian tenements during 2011 and whilst the Company still holds tenements in South Africa expenditure commitments in relation to such tenements have been met The Company has converted its South African prospecting rights into mining rights and applied for new prospecting rights over adjacent land A subsidiary of the Group entered into a 36 month commercial office lease on 1 April 2012 with an 8 annual escalation to the fixed portion of the lease for their head office in Johannesburg South Africa The value of the lease was annualised over the life of the Lease agreement This lease reached the end of its term on 31 March 2015 and
had a renewal period for a further 3 years commencing 1 April 2015 but was only renewed for a period of 1 year until 31 March 2016 During February 2016 the lease was renewed for a further period of 12 months until 31 March 2017 Note 22 Contingent liabilities
The Company received USD500000 from AAI during March 2014 as part of AAIrsquos advanced payment for a percentage ownership of the Companyrsquos subsidiary FIO The transaction was never formaly finalised and on 30 June 2016 the Company transferred the amount of USD364448 from provision for payments received in advance to sundry income to cover expenses incurred by the Company subsequent to AAIrsquos default leaving a value of US$135552 in provision for payments received in advance The matter is contingent liability as the likelihood of probable outflow is not considered remote at this point in time and the Company may be exposed to repay the investment amount of USD 500000 or part thereof subject to the Companyrsquos ability to prove its loss and damages suffered as a result of AAIrsquos breach of contract Note 23 Related party transactions Compensation of Key Management Personnel
2016 2015
$ $
Short-term employee benefits 716803 828463
Post-employment benefits 26849 37539
Share based payments 34097 85675
Termination benefits - -
777749 951678
Transactions between related parties are on normal commercial terms and conditions and no more favourable than those available to other parties unless otherwise stated Subsidiaries The consolidated financial statements include the financial statements of Ferrum Crescent Limited and the subsidiaries listed in the following table
Ferrum South Africa (Pty) Ltd (ldquoFIOrdquo) South Africa 100 100 Ferrum Iron Ore (Pty) Ltd South Africa 9714 9714 Mkhombi Investments (Pty) Ltd (ldquoMIrdquo) South Africa 8846 8846 Ferrum Crescent Limited is the ultimate Australian parent entity and the ultimate parent of the Group Transactions between Ferrum Crescent Limited and its controlled entities during the year consisted of loan advances by Ferrum Crescent Limited All intergroup transactions and balances are eliminated on consolidation The Baphuting Bo Seleka Community Trust (ldquoTrustrdquo) has a 3 indirect interest in FIO the project Company via its investment in MI Until such time as FIO commences mining no expenses or investments have been carried over to the Trust Trade receivable
2016 2015
$ $
Trade receivable 15454 -
Less provision for bad debts (15454)
- -
On 14 October 2015 the Company announced that a BFS Farm-In Agreement had been concluded with Business Venture Investments No1709 (Proprietary) Limited (ldquoBVIrdquo) to form a joint venture for the completion of the bankable feasibility study (ldquoBFSrdquo) The comprehensive Farm-In Agreement provides for the completion of all the requisite BFS workstreams to produce a full BFS on the project to a fixed timeline to be funded by BVI in return for up to a 43 equity interest in Ferrum Iron Ore (Pty) Ltd (ldquoFIOrdquo) the owner of the Moonlight Iron Ore Project As at 30 June 2016 BVI had not paid the Company for any of the expenses that the Company had incurred on behalf of BVI and a bad debt provision has been created Trade payable
Income from
Related Parties
Expenditure to Related
Parties
Amounts Owed by Related
Parties at year end
Amounts Owed to Related
Parties at year end
$ $ $ $
Magnum Mining and Exploration Ltd (i) 2016 - 87582 - 29382
2015 - 106138 - 12296
(i) Mr G Button a non-executive director and company secretary for the Company is also a director of Magnum Mining and Exploration Ltd During the year Magnum Mining and Exploration Ltd received the above fees for office rental office running costs and staffing expenses These fees are based on normal commercial terms and conditions Loans to (from) related parties The following transactions were undertaken between the Company executive officers and director-related entities during 2016 and 2015
2016 2015
$ $
Consulting fees were paid or accrued to Camcove Pty Ltd a company of which Robert Hair is a director and shareholder 60000 60000 Consulting fees were paid or accrued to Tavistock Communications Limited a company of which Merlin Mar-Johnson is an Employee 15672 - Directors fees were paid or accrued to Metallurgical Management Services Pty Ltd a company of which Dr Evan Kirby is a director 7500 -
83172 60000
Note 24 Cash flow information
2016 2015
$ $
Reconciliation of cash flow from operations with loss from ordinary activities after income tax
Loss from ordinary activities after income tax (1573533) (2345860)
Depreciation 11638 18580
Loss (profit) on sale of plant and equipment (8609) -
Profit on sale of available for sale financial assets (649) (137597)
Fair value adjustment of forward subscription agreement - 208375
Share based payment compensation 34097 90851
Net foreign exchange differences 368404 (54155)
Movement of Bad debts 16056 -
Proceeds from third party funding (490850) - Changes in assets and liabilities
(Increase) decrease in receivables (12001) (174766)
(Increase) decrease in other operating assets 31399 (24758)
Increase (decrease) in payables and provisions 45298 (194914)
Cash flows used in operations (1578750) (2575785)
Note 25 Financial risk management objectives and policies
The Grouprsquos principal financial instruments comprise cash short term deposits held-for-trading and derivative instruments
The main purpose of the financial instruments is to finance the Grouprsquos operations The Company also has other financial instruments such as trade debtors and creditors which arise directly from its operations
The main risks arising from the Grouprsquos financial instruments are interest rate risk liquidity risk foreign currency risk and credit risk The board reviews and agrees policies for managing each of these risks and they are summarised below
(a) Interest Rate Risk The Grouprsquos exposure to interest rate risk which is the risk that a financial instrumentrsquos value will fluctuate as a result of changes in market interest rates and the effective weighted average interest rate for each class of financial assets and financial liabilities is set out in the following table Also included is the effect on profit and equity after tax if interest rates at that date had been 10 higher or lower with all other variables held constant as a sensitivity analysis The Group has not entered into any hedging activities to manage interest rate risk In regard to its interest rate risk the Group continuously analyses its exposure Within this analysis consideration is given to potential renewals of existing positions alternative investments and the mix of fixed and variable interest rates
Weighted Floating Fixed Non Interest Rate
Risk Sensitivity
Average Effective Interest Interest Interest
-10 +10
Interest Rate Rate Rate Bearing Total
Profit
Equity
Profit
Equity
$ $ $ $
$
$
$
$
2016
Financial Assets
Cash 005 730546 - 12718 743264 (319) - 319 -
Trust deposits 000 75 - 29229 29303 - - - -
Receivables 000 - - 33929 33929 - - - -
Investments 112 64715 - - 64715 (524) - 524 -
Financial asset 000 - - - - - - - -
Total Financial Assets 795336 - 75876 871211
Financial Liabilities
Trade and other payables - - 439549 439549 - - - -
Total Financial Assets 1055565 136490 79714 1271769
Financial Liabilities
Trade and other payables - - 803892 803892 - - - -
Total Financial Liabilities - - 803892 803892
A sensitivity of 10 has been selected as this is considered reasonable given the current level of both short term and long term Australian dollar interest rates A -10 sensitivity would move short term interest rates at 30 June 2016 from around 2 to 18 representing a 20 basis point downwards shift (1400 basis points net of tax) Based on the sensitivity analysis mainly interest revenue from variable rate deposits cash balances and investment is impacted resulting in a decrease or increase in overall income (b) Liquidity Risk The Group manages liquidity risk by maintaining sufficient cash reserves and marketable securities required to meet the current exploration and administration commitments through the continuous monitoring of actual cash flows Ultimate responsibility for liquidity risk management rests with the board of directors who have built an appropriate liquidity risk management framework for the management of the Grouprsquos short medium and long term funding and liquidity management requirements Less
(c) Credit Risk Credit risk arises in the event that counterparty will not meet its obligations under a financial instrument leading to financial losses The Company is exposed to credit risk from its operating activities and financing activities including deposits with banks and investments with insurance companies The credit risk control procedures adopted by the Company is to assess the credit quality of the institution with whom funds are deposited or invested taking into account its financial position and past experiences The maximum exposure to credit risk on financial assets of the Company which have been recognised on the statement of financial position is generally limited to the carrying amount Cash is maintained with National Australia Bank and the Standard Bank of South Africa The investment in mining rehabilitation insurance policy is invested by Guardrisk in the following investments
Type of Investment Type of interest
Unit trust ndash monthly contributing Floating interest rate
Unit trust ndash fixed investment (paid out during FY2016) Floating interest rate
Money market Floating interest rate
Current account Non-interest bearing
(d) Foreign Exchange Risk The Group undertakes certain transactions denominated in foreign currencies hence exposures to exchange rate fluctuations arise The carrying amount of the Grouprsquos foreign currency denominated monetary assets and monetary liabilities at the reporting date is as follows
Liabilities Assets 2016
$ 2015
$ 2016
$ 2015
$
Great British Pounds (GBP) (631013) (653422) 621213 670765 South African Rand (ZAR) (179) (16208) 179 16208 United States Dollars (USD) 15094 64679 - -
Foreign currency sensitivity analysis The Group is exposed to Great British Pound (GBP) United States Dollar (USD) and South African Rand (ZAR) currency fluctuations The following table details the Grouprsquos sensitivity to a 10 increase and decrease in the Australian Dollar (AUD) against the relevant currencies 10 is the sensitivity rate used when reporting foreign currency risk internally to key management personnel and represents managementrsquos assessment of the possible change in foreign exchange rates The sensitivity analysis includes only outstanding foreign currency denominated monetary items and adjusts their translation at the period end for a 10 change in foreign currency rates The sensitivity analysis includes cash balances held in GBP ZAR and USD which give rise to a foreign currency gain or loss on revaluation A positive number indicates an increase in profit and other equity where the AUD strengthens against the ZAR In relation to cash balances held in GBP a positive number indicates an increase in profit and other equity where the Australian Dollar strengthens against the respective currency For a weakening Australian Dollar against the respective currency there would be an equal and opposite impact on the profit and other equity and the balances below would be negative
2016 2015
Profit (loss) $
Equity increase (decrease)
$
Profit (loss)
$
Equity increase (decrease)
$
- AUD strengthens 10
- ZAR - GBP - USD
(18) (63101)
2890
18 63101 (2890)
(1621) (65342) 12268
1621 65342
(12268) AUD weakens 10
- ZAR - GBP - USD
18 63101 (2890)
(18) (63101)
2890
1621 65342
(12268)
(1621) (65342) 12268
(e) Fair value
The fair values of cash trade and other receivables and trade and other payables approximate their carrying values as a result of their short maturity or because they carry floating rates
(i) Fair value of financial instruments measured at fair value For financial instruments carried at fair value the Group adopts various methods in estimating fair value The methods comprise Level 1 ndash the fair value is calculated using quoted prices in an active market Level 2 ndash the fair value is estimated using inputs other than quoted prices included in Level 1 that are observable for the asset or liability either directly (as prices) or indirectly (derived from prices) Level 3 ndash the fair value is estimated using inputs for the asset or liability that are not based on observable market data
Jun 2016 Jun 2015
AUD AUD
Level 2
Available for sale financial assets 64715 187048
For financial instruments not quoted in active markets the Group uses valuation techniques such as other relevant models used by market participants which may include inputs derived from quoted prices in an active market (Level 2) These valuation techniques use both observable and unobservable market inputs Note 26 Parent Entity Information
2016 2015
$ $
Current assets 742467 934073
Total assets 986159 934474
On 30 November 2009 Ferrum Crescent Limited (formerly Washington Resources Ltd) (ldquoFCRrdquo) completed the legal acquisition of Ferrum Metals Limited (formerly Ferrum Crescent Limited) (ldquoFMLrdquo) Under the terms of AASB 3 Business Combinations (Revised) FML was deemed to be the accounting acquirer in the business combination The transaction was therefore accounted for as a reverse acquisition The Parent entity therefore had issued capital of $25620916 as opposed to the Grouprsquos consolidated issued capital of $28366383 For further details please refer to the disclosures contained within the 30 June 2010 Annual Report There have been no guarantees entered into by the parent entity in relation to any debts of its subsidiaries The parent entity has no contingent liabilities as at 30 June 2016 (2015 Nil) Note 27 Subsequent events
Subsequent to the Company entering into an exclusive option to acquire 100 percent of GoldQuest two nil-cost extensions were granted to Ferrum Crescent and on 22 September 2016 the option was exercised Accordingly the Company has acquired 100 per cent of the share capital of GoldQuest Iberica SL (ldquoGoldQuestrdquo) GoldQuest owns 100 per cent of two lead-zinc exploration projects in the provinces of Leόn and Galicia in historic Spanish mining areas (the ldquoIberian Projectsrdquo) Consideration comprised GBP326500 in cash and the issue of 100 million new ordinary shares in the capital of Ferrum Crescent
On 25 July 2016 the Company announced that it had conditionally raised in aggregate GBP 374453 (AU$655034) before expenses through a placement via Beaufort Securities Limited as agent to the Company of 187226485 new ordinary shares of no par value each in the capital of the Company at a price of 020 pence per new ordinary share As part of the placing each investor was offered subject to shareholder approval in accordance with the ASX Listing Rules options on the basis of one option for every share subscribed pursuant to the placing Each option will entitle the holder to subscribe for a further new ordinary share at a price of 030 pence per share for an exercise period of two years following the date of admission of the placing shares trading on AIM In addition the Company has agreed to grant further 18722649 options to Beaufort Securities Limited on the same terms Following admission the total issued ordinary share capital of the Company was 1470018368 ordinary shares On 28 July 2016 the Company announced that it was issuing 66874816 new ordinary shares of no par value each in the capital of the Company as a result of the exercise of in aggregate 66874816 options exercisable at a price of 0165 pence per share raising AUD 193025 before expenses Such options were granted in
Current liabilities 216061 129863
Total liabilities 216061 129863
Issued capital 37362411 35855014
Accumulated Losses (32278633) (30702626)
Reserves 4313679 4347776
Total shareholdersrsquo equity 770099 804612
Profit (loss) of the parent entity (1576006) (2466304)
Total comprehensive (loss) income (1347367) (2725442)
connection with the Companyrsquos placing and subscription announced on 27 April 2016 Following the issue of the option shares and the abovementioned placing shares the total issued ordinary share capital of the Company was 1536893184 ordinary shares
On 26 August 2016 the Company announced that it was issuing 44797543 new ordinary shares of no par value each in the capital of the Company as a result of the exercise of in aggregate a further 44797543 options exercisable at a price of 0165 pence per share raising AUD 128184 before expenses Such options were granted in connection with the Companyrsquos placing and subscription announced on 27 April 2016 Following the issue of these option shares the total issued ordinary share capital of the Company was 1581690727 ordinary shares
On 23 September 2016 the Company announced that was issuing 5381907 new ordinary shares of no par value each in the capital of the Company as a result of the exercise of in aggregate 5381907 options exercisable at a price of 0165 pence per share Such options were granted in connection with the Companyrsquos placing and subscription announced on 27 April 2016 Following the issue of these further option shares the total issued ordinary share capital of the Company is 1587072634 ordinary shares On 29 September 2016 the Company announced the following proxy results of the General Meeting of Shareholders held on said date in respect of the resolutions set out in the Notice of General Meeting dated 23 August 2016 Resolution 12 and 3 were passed on a show of hands Resolution 1 Ratification of prior issue of Shares Resolution 2 Approval of grant of Placement Options Resolution 3 Approval of grant of Broker Options Also on 29 September 2016 the Company also announced that it was issuing 100000000 new ordinary shares of no par value each in the capital of the Company to GoldQuest Mining (Spain) Corp on 30
th September 2016 These shares will be issued in settlement of the share element of the consideration for the acquisition of
100 per cent of the issued share capital of GoldQuest Iberica SL The shares will be fully paid and rank pari passu in all respects with the Companyrsquos existing ordinary shares Following the issue of the shares the total issued ordinary share capital of the Company is 1687072634 ordinary shares ASX Requirements Distribution schedules of shareholders and statements of voting rights are set out in Table 1 whilst the Companyrsquos top twenty shareholders are shown in Table 2 Substantial shareholder notices that have been received by the Company are set out in Table 3 and the tenement schedule as at 30 June 2016 is set out in Table 4
Table 1 Shareholder spread
Ordinary shares with right to attend meetings and vote personally or by proxy through show of hands and if required by ballot (one vote for each share held) 1-1000 73 1001-5000 107 5001-10000 91 10001-100000 248
100001 - and over 225
Total holders of ordinary shares Total number of ordinary shares
744 1282791883
Options with no right to attend meetings or vote personally or by proxy 1-1000 - 1001-5000 - 5001-10000 - 10001-100000 - 100001 - and over 26 Total holders of options Total number of options
26 513000000
Table 2 Top twenty shareholders
Shareholder Number of shares Percentage
Hargreaves Lansdown (Nominees) Limited 135556381 1057 Barclayshare Nominees Limited 131190328 1023 TD Direct Investing Nominees (Europe) Limited 110415308 861 HSDL Nominees Limited 89981899 702 Redmayne (Nominees) Limited 87434315 682 The Bank of New York (Nominees) Limited 42764600 334 Investor Nominees Limited 41961925 327 Rathbone Nominees Limited 34638909 270 Mr E F G Nealon 26484421 202 Mkhombi Amamato (Pty) Ltd 25281620 197 W B Nominees Limited 24624206 192 Citicorp Nominees Pty Ltd 23269017 181 HSBC Client Holdings Nominee (UK) Limited 22498050 175 IG Markets Limited 22407431 175 Lawshare Nominees Limited 22170630 173 JIM Nominees Limited 20714889 162 Wealth Nominees Limited 20265279 158 Vidacos Nominees Limited 17596041 137 Pershing Nominees Limited 16313425 127 Share Nominees Ltd 15232852 119
Voting Rights The voting rights attached to each class of equity securities are set out below (a) Ordinary shares On a show of hands every member present at a meeting in person or by proxy shall have one vote and upon a poll each share shall have one vote Table 4 Tenement schedule as at 30 June 2016
Project Tenement Number Tenement Status Holder Percentage
Interest
Moonlight 305122201 MR Mining Right
Granted Ferrum Iron Ore
(Pty) Ltd 97
Moonlight
LP30611211868PR Prospecting
Application Ferrum Iron Ore
(Pty) Ltd 97
JSE Limited Requirements
Headline earnings reconciliation 2016 2015
$ $
Loss attributable to ordinary equity holders of the parent entity (1573533) (2345860)
Add back IAS 16 loss on the disposal of plant and equipment (8609) -
Less profit on sale of available for sale investments 649 (137597)
Total tax effects of adjustments (182) 38527
Headline loss (1581675) (2444930)
Basic loss per share (1573533) (2345860)
Weighted average shares in issue 714611971 468894041
Basic loss per share (cents) (022) (050)
Headline loss (1581675) (2444930)
Weighted average shares in issue 714611971 468894041
Headline loss per share (cents) (022) (052)
Financial asset 000 - - - - - - - -
Total Financial Assets 795336 - 75876 871211
Financial Liabilities
Trade and other payables - - 439549 439549 - - - -
Total Financial Assets 1055565 136490 79714 1271769
Financial Liabilities
Trade and other payables - - 803892 803892 - - - -
Total Financial Liabilities - - 803892 803892
A sensitivity of 10 has been selected as this is considered reasonable given the current level of both short term and long term Australian dollar interest rates A -10 sensitivity would move short term interest rates at 30 June 2016 from around 2 to 18 representing a 20 basis point downwards shift (1400 basis points net of tax) Based on the sensitivity analysis mainly interest revenue from variable rate deposits cash balances and investment is impacted resulting in a decrease or increase in overall income (b) Liquidity Risk The Group manages liquidity risk by maintaining sufficient cash reserves and marketable securities required to meet the current exploration and administration commitments through the continuous monitoring of actual cash flows Ultimate responsibility for liquidity risk management rests with the board of directors who have built an appropriate liquidity risk management framework for the management of the Grouprsquos short medium and long term funding and liquidity management requirements Less
(c) Credit Risk Credit risk arises in the event that counterparty will not meet its obligations under a financial instrument leading to financial losses The Company is exposed to credit risk from its operating activities and financing activities including deposits with banks and investments with insurance companies The credit risk control procedures adopted by the Company is to assess the credit quality of the institution with whom funds are deposited or invested taking into account its financial position and past experiences The maximum exposure to credit risk on financial assets of the Company which have been recognised on the statement of financial position is generally limited to the carrying amount Cash is maintained with National Australia Bank and the Standard Bank of South Africa The investment in mining rehabilitation insurance policy is invested by Guardrisk in the following investments
Type of Investment Type of interest
Unit trust ndash monthly contributing Floating interest rate
Unit trust ndash fixed investment (paid out during FY2016) Floating interest rate
Money market Floating interest rate
Current account Non-interest bearing
(d) Foreign Exchange Risk The Group undertakes certain transactions denominated in foreign currencies hence exposures to exchange rate fluctuations arise The carrying amount of the Grouprsquos foreign currency denominated monetary assets and monetary liabilities at the reporting date is as follows
Liabilities Assets 2016
$ 2015
$ 2016
$ 2015
$
Great British Pounds (GBP) (631013) (653422) 621213 670765 South African Rand (ZAR) (179) (16208) 179 16208 United States Dollars (USD) 15094 64679 - -
Foreign currency sensitivity analysis The Group is exposed to Great British Pound (GBP) United States Dollar (USD) and South African Rand (ZAR) currency fluctuations The following table details the Grouprsquos sensitivity to a 10 increase and decrease in the Australian Dollar (AUD) against the relevant currencies 10 is the sensitivity rate used when reporting foreign currency risk internally to key management personnel and represents managementrsquos assessment of the possible change in foreign exchange rates The sensitivity analysis includes only outstanding foreign currency denominated monetary items and adjusts their translation at the period end for a 10 change in foreign currency rates The sensitivity analysis includes cash balances held in GBP ZAR and USD which give rise to a foreign currency gain or loss on revaluation A positive number indicates an increase in profit and other equity where the AUD strengthens against the ZAR In relation to cash balances held in GBP a positive number indicates an increase in profit and other equity where the Australian Dollar strengthens against the respective currency For a weakening Australian Dollar against the respective currency there would be an equal and opposite impact on the profit and other equity and the balances below would be negative
2016 2015
Profit (loss) $
Equity increase (decrease)
$
Profit (loss)
$
Equity increase (decrease)
$
- AUD strengthens 10
- ZAR - GBP - USD
(18) (63101)
2890
18 63101 (2890)
(1621) (65342) 12268
1621 65342
(12268) AUD weakens 10
- ZAR - GBP - USD
18 63101 (2890)
(18) (63101)
2890
1621 65342
(12268)
(1621) (65342) 12268
(e) Fair value
The fair values of cash trade and other receivables and trade and other payables approximate their carrying values as a result of their short maturity or because they carry floating rates
(i) Fair value of financial instruments measured at fair value For financial instruments carried at fair value the Group adopts various methods in estimating fair value The methods comprise Level 1 ndash the fair value is calculated using quoted prices in an active market Level 2 ndash the fair value is estimated using inputs other than quoted prices included in Level 1 that are observable for the asset or liability either directly (as prices) or indirectly (derived from prices) Level 3 ndash the fair value is estimated using inputs for the asset or liability that are not based on observable market data
Jun 2016 Jun 2015
AUD AUD
Level 2
Available for sale financial assets 64715 187048
For financial instruments not quoted in active markets the Group uses valuation techniques such as other relevant models used by market participants which may include inputs derived from quoted prices in an active market (Level 2) These valuation techniques use both observable and unobservable market inputs Note 26 Parent Entity Information
2016 2015
$ $
Current assets 742467 934073
Total assets 986159 934474
On 30 November 2009 Ferrum Crescent Limited (formerly Washington Resources Ltd) (ldquoFCRrdquo) completed the legal acquisition of Ferrum Metals Limited (formerly Ferrum Crescent Limited) (ldquoFMLrdquo) Under the terms of AASB 3 Business Combinations (Revised) FML was deemed to be the accounting acquirer in the business combination The transaction was therefore accounted for as a reverse acquisition The Parent entity therefore had issued capital of $25620916 as opposed to the Grouprsquos consolidated issued capital of $28366383 For further details please refer to the disclosures contained within the 30 June 2010 Annual Report There have been no guarantees entered into by the parent entity in relation to any debts of its subsidiaries The parent entity has no contingent liabilities as at 30 June 2016 (2015 Nil) Note 27 Subsequent events
Subsequent to the Company entering into an exclusive option to acquire 100 percent of GoldQuest two nil-cost extensions were granted to Ferrum Crescent and on 22 September 2016 the option was exercised Accordingly the Company has acquired 100 per cent of the share capital of GoldQuest Iberica SL (ldquoGoldQuestrdquo) GoldQuest owns 100 per cent of two lead-zinc exploration projects in the provinces of Leόn and Galicia in historic Spanish mining areas (the ldquoIberian Projectsrdquo) Consideration comprised GBP326500 in cash and the issue of 100 million new ordinary shares in the capital of Ferrum Crescent
On 25 July 2016 the Company announced that it had conditionally raised in aggregate GBP 374453 (AU$655034) before expenses through a placement via Beaufort Securities Limited as agent to the Company of 187226485 new ordinary shares of no par value each in the capital of the Company at a price of 020 pence per new ordinary share As part of the placing each investor was offered subject to shareholder approval in accordance with the ASX Listing Rules options on the basis of one option for every share subscribed pursuant to the placing Each option will entitle the holder to subscribe for a further new ordinary share at a price of 030 pence per share for an exercise period of two years following the date of admission of the placing shares trading on AIM In addition the Company has agreed to grant further 18722649 options to Beaufort Securities Limited on the same terms Following admission the total issued ordinary share capital of the Company was 1470018368 ordinary shares On 28 July 2016 the Company announced that it was issuing 66874816 new ordinary shares of no par value each in the capital of the Company as a result of the exercise of in aggregate 66874816 options exercisable at a price of 0165 pence per share raising AUD 193025 before expenses Such options were granted in
Current liabilities 216061 129863
Total liabilities 216061 129863
Issued capital 37362411 35855014
Accumulated Losses (32278633) (30702626)
Reserves 4313679 4347776
Total shareholdersrsquo equity 770099 804612
Profit (loss) of the parent entity (1576006) (2466304)
Total comprehensive (loss) income (1347367) (2725442)
connection with the Companyrsquos placing and subscription announced on 27 April 2016 Following the issue of the option shares and the abovementioned placing shares the total issued ordinary share capital of the Company was 1536893184 ordinary shares
On 26 August 2016 the Company announced that it was issuing 44797543 new ordinary shares of no par value each in the capital of the Company as a result of the exercise of in aggregate a further 44797543 options exercisable at a price of 0165 pence per share raising AUD 128184 before expenses Such options were granted in connection with the Companyrsquos placing and subscription announced on 27 April 2016 Following the issue of these option shares the total issued ordinary share capital of the Company was 1581690727 ordinary shares
On 23 September 2016 the Company announced that was issuing 5381907 new ordinary shares of no par value each in the capital of the Company as a result of the exercise of in aggregate 5381907 options exercisable at a price of 0165 pence per share Such options were granted in connection with the Companyrsquos placing and subscription announced on 27 April 2016 Following the issue of these further option shares the total issued ordinary share capital of the Company is 1587072634 ordinary shares On 29 September 2016 the Company announced the following proxy results of the General Meeting of Shareholders held on said date in respect of the resolutions set out in the Notice of General Meeting dated 23 August 2016 Resolution 12 and 3 were passed on a show of hands Resolution 1 Ratification of prior issue of Shares Resolution 2 Approval of grant of Placement Options Resolution 3 Approval of grant of Broker Options Also on 29 September 2016 the Company also announced that it was issuing 100000000 new ordinary shares of no par value each in the capital of the Company to GoldQuest Mining (Spain) Corp on 30
th September 2016 These shares will be issued in settlement of the share element of the consideration for the acquisition of
100 per cent of the issued share capital of GoldQuest Iberica SL The shares will be fully paid and rank pari passu in all respects with the Companyrsquos existing ordinary shares Following the issue of the shares the total issued ordinary share capital of the Company is 1687072634 ordinary shares ASX Requirements Distribution schedules of shareholders and statements of voting rights are set out in Table 1 whilst the Companyrsquos top twenty shareholders are shown in Table 2 Substantial shareholder notices that have been received by the Company are set out in Table 3 and the tenement schedule as at 30 June 2016 is set out in Table 4
Table 1 Shareholder spread
Ordinary shares with right to attend meetings and vote personally or by proxy through show of hands and if required by ballot (one vote for each share held) 1-1000 73 1001-5000 107 5001-10000 91 10001-100000 248
100001 - and over 225
Total holders of ordinary shares Total number of ordinary shares
744 1282791883
Options with no right to attend meetings or vote personally or by proxy 1-1000 - 1001-5000 - 5001-10000 - 10001-100000 - 100001 - and over 26 Total holders of options Total number of options
26 513000000
Table 2 Top twenty shareholders
Shareholder Number of shares Percentage
Hargreaves Lansdown (Nominees) Limited 135556381 1057 Barclayshare Nominees Limited 131190328 1023 TD Direct Investing Nominees (Europe) Limited 110415308 861 HSDL Nominees Limited 89981899 702 Redmayne (Nominees) Limited 87434315 682 The Bank of New York (Nominees) Limited 42764600 334 Investor Nominees Limited 41961925 327 Rathbone Nominees Limited 34638909 270 Mr E F G Nealon 26484421 202 Mkhombi Amamato (Pty) Ltd 25281620 197 W B Nominees Limited 24624206 192 Citicorp Nominees Pty Ltd 23269017 181 HSBC Client Holdings Nominee (UK) Limited 22498050 175 IG Markets Limited 22407431 175 Lawshare Nominees Limited 22170630 173 JIM Nominees Limited 20714889 162 Wealth Nominees Limited 20265279 158 Vidacos Nominees Limited 17596041 137 Pershing Nominees Limited 16313425 127 Share Nominees Ltd 15232852 119
Voting Rights The voting rights attached to each class of equity securities are set out below (a) Ordinary shares On a show of hands every member present at a meeting in person or by proxy shall have one vote and upon a poll each share shall have one vote Table 4 Tenement schedule as at 30 June 2016
Project Tenement Number Tenement Status Holder Percentage
Interest
Moonlight 305122201 MR Mining Right
Granted Ferrum Iron Ore
(Pty) Ltd 97
Moonlight
LP30611211868PR Prospecting
Application Ferrum Iron Ore
(Pty) Ltd 97
JSE Limited Requirements
Headline earnings reconciliation 2016 2015
$ $
Loss attributable to ordinary equity holders of the parent entity (1573533) (2345860)
Add back IAS 16 loss on the disposal of plant and equipment (8609) -
Less profit on sale of available for sale investments 649 (137597)
Total tax effects of adjustments (182) 38527
Headline loss (1581675) (2444930)
Basic loss per share (1573533) (2345860)
Weighted average shares in issue 714611971 468894041
Basic loss per share (cents) (022) (050)
Headline loss (1581675) (2444930)
Weighted average shares in issue 714611971 468894041
Headline loss per share (cents) (022) (052)
100001 - and over 225
Total holders of ordinary shares Total number of ordinary shares
744 1282791883
Options with no right to attend meetings or vote personally or by proxy 1-1000 - 1001-5000 - 5001-10000 - 10001-100000 - 100001 - and over 26 Total holders of options Total number of options
26 513000000
Table 2 Top twenty shareholders
Shareholder Number of shares Percentage
Hargreaves Lansdown (Nominees) Limited 135556381 1057 Barclayshare Nominees Limited 131190328 1023 TD Direct Investing Nominees (Europe) Limited 110415308 861 HSDL Nominees Limited 89981899 702 Redmayne (Nominees) Limited 87434315 682 The Bank of New York (Nominees) Limited 42764600 334 Investor Nominees Limited 41961925 327 Rathbone Nominees Limited 34638909 270 Mr E F G Nealon 26484421 202 Mkhombi Amamato (Pty) Ltd 25281620 197 W B Nominees Limited 24624206 192 Citicorp Nominees Pty Ltd 23269017 181 HSBC Client Holdings Nominee (UK) Limited 22498050 175 IG Markets Limited 22407431 175 Lawshare Nominees Limited 22170630 173 JIM Nominees Limited 20714889 162 Wealth Nominees Limited 20265279 158 Vidacos Nominees Limited 17596041 137 Pershing Nominees Limited 16313425 127 Share Nominees Ltd 15232852 119
Voting Rights The voting rights attached to each class of equity securities are set out below (a) Ordinary shares On a show of hands every member present at a meeting in person or by proxy shall have one vote and upon a poll each share shall have one vote Table 4 Tenement schedule as at 30 June 2016
Project Tenement Number Tenement Status Holder Percentage
Interest
Moonlight 305122201 MR Mining Right
Granted Ferrum Iron Ore
(Pty) Ltd 97
Moonlight
LP30611211868PR Prospecting
Application Ferrum Iron Ore
(Pty) Ltd 97
JSE Limited Requirements
Headline earnings reconciliation 2016 2015
$ $
Loss attributable to ordinary equity holders of the parent entity (1573533) (2345860)
Add back IAS 16 loss on the disposal of plant and equipment (8609) -
Less profit on sale of available for sale investments 649 (137597)
Total tax effects of adjustments (182) 38527
Headline loss (1581675) (2444930)
Basic loss per share (1573533) (2345860)
Weighted average shares in issue 714611971 468894041
Basic loss per share (cents) (022) (050)
Headline loss (1581675) (2444930)
Weighted average shares in issue 714611971 468894041
Headline loss per share (cents) (022) (052)
Add back IAS 16 loss on the disposal of plant and equipment (8609) -
Less profit on sale of available for sale investments 649 (137597)
Total tax effects of adjustments (182) 38527
Headline loss (1581675) (2444930)
Basic loss per share (1573533) (2345860)
Weighted average shares in issue 714611971 468894041
Basic loss per share (cents) (022) (050)
Headline loss (1581675) (2444930)
Weighted average shares in issue 714611971 468894041