110
FESTA D4: Common Vision regarding cooperative systems FOTs 21 May 2008
FESTA
D4: Common Vision regarding cooperative systems FOTs
21 May 2008

Grant agreement no.: 214853Workpackage: WP4 Cooperative Systems & InfrastructureTasks: T4.3 Common vision regarding cooperative systems FOTsDeliverable no.: D4 Document title: FESTA – D4 Cooperative Systems Deliverable nature: PublicDeliverable status: Final to consortium leader
Consortium:
Centro Ricerche Fiat, University of Leeds, BMW Forschung und Technik GmbH, Daimler AG, Gie Recherches et etudes PSA Renault, Volvo Car Corporation, Volvo Technology Corporation, Robert Bosch GmbH, A.D.C. Automotive Distance Control Systems GmbH, Delphi France SAS, Loughborough University, Chalmers University of Technology, Institut National de Recherche sur les Transports et leur Sécurité INRETS, Statens Väg- och Transportforskningsinstitut VTI, Nederlandse Organisatie voor toegepast-natuurwetenschappelijk onderzoek TNO, Bundesanstalt fuer Strassenwesen BASt, Valtion Teknillinen Tutkimuskeskus VTT, INFOBLU SPA, Orange France, European Road Transport Telematics Implementation Coordination Organisation ERTICO, Universitaet zu Koeln
Disclaimer:
The FESTA Support Action has been funded by the European Commission DG Information Society and Media in the 7th Framework Programme. The content of this publication is the sole responsibility of the project partners listed herein and does not necessarily represent the view of the European Commission or its services.
2

Table of contentsTable of contents..............................................................................................................................................3
Glossary............................................................................................................................................................4
1 Introduction.............................................................................................................................................6
1.1 The case of Cooperative Systems....................................................................................................7
2 General Methodology adapted to cooperative systems FOT...................................................................8
2.1 Step 1: Selection of Functions/Systems relevant for Cooperative System FOTs..............................8
2.2 Step 2: Definition of use cases and situations...............................................................................10
2.3 Step 3: Identification of the Research Questions..........................................................................13
2.4 Step 4: Creation of Hypotheses.....................................................................................................15
2.4.1 Deriving hypotheses from the scenarios...................................................................................15
2.4.2 The six areas of impact..........................................................................................................1516
2.4.3 Prioritising the hypotheses...................................................................................................1617
2.5 Step 5: Link Hypotheses with indicators for quantitative analyses...............................................17
3 Conclusions & Recommendations for the Cooperative Systems............................................................18
4 References.............................................................................................................................................19
ANNEX A
Selection of Cooperative System Functions, Use Cases, Research Questions and Hypotheses………….. Error: Reference source not found 0
3

GlossarySubject Definition
function implementation of a set of rules to achieve a specified goal
Unambiguously defined partial behaviour of one or more electronic control units.
system a combination of hardware and software enabling one or more functionsSet of elements (at least sensor, controller, and actuator) in relation with each other according to design. An element of a system can be another system at the same time. Then, it is called subsystem which can be a controlling or controlled system or which can contain hardware, software and manual operations.
use case target condition in which a system is expected to behave according to a specified function
situationa combination of certain characteristics of a use case. Situations can be derived from use cases compiling a reasonable permutation of the use cases characteristics
scenario a use case in a specific situation
research question general question to be answered by compiling and testing related specific hypotheses
hypothesis specific question which can be tested with statistical means by analysing measures and performance indicators.
baseline scenario with system under evaluation "turned off".
performance indicator
Performance Indicators are quantitative or qualitative measurements, agreed on beforehand, expressed as a percentage, index, rate or other value, which is monitored at regular or irregular intervals and can be compared to one or more criteria.
event "Singularities" based on a combination of measures and/or pre-processed measures. Can extend over time. One or several
4

preconditions must be fulfilled.
trigger "Marker" in the data, indicating instances that can be of interest for research.
metric
measure
A measure can either be direct or pre-processed. A direct measure is logged directly from a sensor, while a pre-processed measure is a combination of different direct or other pre-processed measures. A measure does not have a “denominator” which makes it comparable to other instances of the same measure or to external criteria.
FOT aka Field Operational Test
fleet of vehiclesvehicles DO have some kind of data acquisition system onboard (consequence: pure questionnaire based analysis without online data acqu. System is NOT an FOT)
on-vehicle sensors data Data collected via on-vehicle sensors.
subjective data Data collected from the drivers/passengers.
Situational Variable
Situational Variables are not necessarily directly relevant for Performance Indicators or Derived Measures, but they provide key background information that complements the driver behaviour data and is sometimes needed to derive the driver behaviour data.
data acquisition
The process of sampling or recording data (real world data) for computer processing. Includes acquisition of pure sensor data, as well as acquisition of data from real-time and off-line services, and subjective data.
latency
A latent period: the time between stimulus and response. In data acquisition generally the time between real world event (or stimulus) and the recording of that event.
sensor
A device that responds to a physical stimulus (as heat, light, sound, pressure, magnetism, or a particular motion) and transmits a resulting impulse which can be read by an instrument/observer.
Vehicle busAn in-vehicle internal communications network that connects different components and modules.
tripIncludes the sequence from the vehicle ignition key being turned on until it is turned off (even if the vehicle is not moving during this time frame).
event data recorder
A logging device that, when triggered by an event such as a crash, stores the information about the few seconds leading up to the event (and throughout the event).
upload Transfer of data from client to a server.
download Transfer of data from server to a client.
5

1 IntroductionThe objective of an FOT is to evaluate in-vehicle functions based on Information Communication Technology (ICT) in order to address specific research questions. These research questions can be related to safety, environment, mobility, traffic efficiency, usage, and acceptance. By addressing the research questions, FOTs promise to furnish the major stakeholders (customers, public authorities, OEMs, suppliers, and the scientific community) with valuable information able to improve their policy-making and market strategies. Individuating the most relevant functions and connected hypothesis to successfully address the above-mentioned research questions is one of the major challenges in an FOT. In this deliverable, the process of individuating the vehicle functions to be tested in an FOT and the relevant connected hypotheses will be elucidated. Specifically, the reader will be guided in the process of 1) selecting the vehicle functions to be tested, 2) defining the connected use cases to test these vehicle functions, 3) identifying the research questions related to these use cases, 4) formulating the hypothesis associated to these research questions, and 5) linking these hypothesis to the correspondent performance indicators. The FOT chain shows specifically the steps reported above (see Figure 1.1).
In the last few years, the number of ICT functions available on standard vehicles has been rapidly increasing. ICT functions are intrinsically designed to provide the driver with new, additional information. However, the extent to which this increased amount of information from these ICT functions results in clear and positive effects on safety, environment, mobility, usage, and
Function Identification and Description
Performance Indicators
Use Cases
Research Questions and Hypotheses
Measures and Sensors
Study Design
Research Question and Hypotheses Analysis
Socio-Economic Impact Assessment
System and Function Analysis
Ethical and Legal Issues
Impl
emen
tatio
n P
lan
Database
Performance IndicatorsMeasures
Data Decoding
Data Acquisition
Data Analysis
The FOT Chain
Figure 1.1: The FOT chain and the relevant steps from function identification to hypotheses covered by this deliverable.
6

acceptance in real traffic situation is unknown. FOTs warrant to evaluate, for the first time, these ICT functions in a real traffic situation during naturalistic driving. In this handbook we refer to 1) in-vehicle, 2) cooperative, and 3) nomadic systems intended as a combination of hardware and software enabling one or more ICT functions. Depending on the different systems implementing a specific function, different challenges may have to be faced during the FOT design.
1.1 The case of Cooperative Systems
Communication technology has enabled a new class of information and warnings in cars witch are more precise in terms of time and location. Infrastructure based information tells the driver for example what is the appropriate speed or warns the driver in case of ice on the road or fog behind the corner. The applications described in the attached XLS file are developed in several C2X projects under the 6 th
Framework Programme. Namely: CVIS, PReVENT, SAFESPOT and WATCHOVER.
The main initial objective for C2X was to increase road safety. The development of safety-critical C2C systems in Europe has been mainly promoted by the Car-to Car Communication Consortium (C2C-CC) which supports Dedicated Short Range Communication (DSRC) systems operating at 5.9 GHz on the IEEE 802.11p standard. A wider variety of information into vehicles will be available with CALM (Continuous Air interface for Long and medium range communication) architecture. The CALM architecture supports multiple communication channels and it manages seamless handover between channels to ensure continuous connectivity to the vehicle. For example, if a car is connected to the internet using WIFI and travels to a region where WIFI is no longer available, the CALM architecture is automatically switching over to 3G. The latest version of CALM, used by CVIS supports also C2C-CC safety-critical communication using the 5.9 GHz channel.
C2X communications requires a large number of technical systems and sub-systems, including both in-vehicle and roadside architecture, to work together in harmony. These systems can be grouped in three areas:
Collecting data from vehiclesFor C2V and C2I applications, data needs to be collected from vehicles in order to provide real-time support.
Transmitting data to vehiclesFor vehicles to act in response to al live event, data must be transmitted to them from another vehicle or from roadside infrastructure.
Presenting relevant information to the driverIn vehicle information has to be presented according to the ESOP guidelines, it should be reliable and valid.
7

2 General Methodology adapted to cooperative systems FOTThe main advantage of an FOT is that it has the potential to give insight in system performance in naturalistic driving situations, as free as possible from any artefact resulting from noticeable measurement equipment or observers in the car. Therefore the first step when planning an FOT is to identify systems and functions where considerable knowledge about their impacts and effects in realistic (driving) situations is of major interest, but is still lacking (see Section 2.1). Another domain for FOTs is the area of systems and functions which need a certain penetration rate to work at all, like especially cooperative system.
After the identification of the functions and system, which should be tested in an FOT, the goal is to define statistically testable hypotheses and find measurable indicators to test the hypotheses. To reach this goal, several steps need to be taken, starting from a description of the functions down to an adequate level of detail (see Section 2.1). This means that the main aspects of the functions, its intended benefits and the intrinsic limitations have to be described to fully understand objectives and limitations and to derive reasonable use cases.
Secondly, these use cases need to be defined (see Section 2.2). Use cases are a means to describe the boundary conditions under which a function is intended to be analysed. A general starting point is given by the functional specifications from the function description part. But it might also be of interest how a function performs when certain preconditions are not met and to identify unintended and unforeseen effects.
Starting from the use case definitions specific research questions need to be identified (see Section 2.3). Research questions are general question to be answered by compiling and testing related specific hypotheses. While research questions are phrased as real questions ending with a question mark, hypotheses are statements which can either be true or false. This will be tested by statistical means (see Chapter 9). One might already have a very clear idea from the beginning which hypotheses are to be tested in a very specific situation during the FOT. However, this very focused view might result in an extreme limited experimental design, where important unintended effects will not be considered. The process to define hypotheses developed in FESTA aims to prevent these potential issues (see Section 2.4).
Finally, hypotheses can only be tested by means of reasonable indicators (see Section 2.5).
These steps are shown as parts of the complete FOT and are elaborated further in the following sections. The Annex consists of the results of the FESTA methodology to identify functions and systems and to develop hypotheses for the experimental design. All steps, from the description of the systems and functions, the development of use cases and scenarios, as well as the research questions and hypotheses and the proposal of related performance indicators have been accomplished. This Annex2 shall provide an example on how to proceed according to the proposed FESTA methodology.
2.1 Step 1: Selection of Functions/Systems relevant for Cooperative System FOTsUsually it is quite clear from the beginning what functions or at least what type of functions will be the object of an FOT. However, to select the specific functions but also in case the type of functions has not yet been decided, a Stakeholders Analysis is recommended. During this analysis, the needs of the different stakeholders need to be identified and merged into a common requirements description. Stakeholders are those whose interests are affected by the issue or those whose activities strongly affect the issue, those who possess information, resources and expertise needed for strategy formulation and implementation,
8

and those who control relevant implementations or instruments, like customers, public authorities, OEMs, suppliers, and the scientific community. It is of vital importance that all relevant stakeholders are included in the analysis to guarantee that the selection process will not itself bias from the beginning the appraisal of the gained results.
It is recommended to evaluate the stakeholders’ needs by means of questionnaires, workshops or well documented interviews of stakeholders’ representatives. It is also quite important to describe the selection process sufficiently to prevent from misjudgement.
The basis for all following steps is a sufficient description of the selected functions. For these purposes a spreadsheet template has been prepared and is presented in the Annex2 to collect the necessary information. It provides two main parts: First, the functional classification, where a short high level description of the main aspects of the function should be given. This information is usually provided through the system specifications given by the system vendor or OEM. The second part of the description comprises of limitations, boundary conditions and additional information which is necessary to understand how the function works.
The boundary conditions part describes where and under which circumstances the system/ function will operate according to its specifications, where the FOT should take place and which type of data needs to be recorded during the FOT to enable a good interpretation of the results. It consists of:
Infrastructure requirements, cooperative systems and nomadic device requirements. Here all required actors besides the actual system need to mentioned, which might have an impact on system performance, service availability or similar. It is intended to trigger the consideration of factors which are external to the system/ function under evaluation;
Demographical Requirements/ Driver Requirements: Especially the user or driver recruitment needs to take into account, whether a function is particularly designed for a specific group of users or drivers. Drivers differ on a large variety of characteristics, which may all have an influence on how they drive and use different systems and services. These differences may be important to take into account when planning a FOT. Four categories of driver characteristics may be distinguished:
o Demographic characteristics: gender, age, country, educational level, income, socio-cultural background, life and living situation, etc.;
o Driving experience, and driving situation and motivation: experience in years and in mileage, professional, tourist, with or without passengers and children etc.;
o Personality traits and physical characteristics: sensation seeking, locus of control, cognitive skills, physical impairments or weaknesses etc.;
o Attitudes and intentions: attitudes towards safety, environment, technology etc.
Geographical Requirements/ Road Context: This description is necessary for systems which, concerning their functionality, depend strongly on the horizontal or vertical curves of the road layout or on the road type. For example, certain speed limit information systems depend largely on the availability of speed limit information in a digital map, which is up to now only commercially available on high class roads.
Geographical Requirements/ environmental restrictions: Certain systems are especially designed for specific environmental conditions or, on the other hand, specifications might indicate that the
9

system under evaluation will not work under certain environmental conditions. In this case the location of the FOT needs to be selected carefully and the relevant data must be recorded during the FOT. e. g., most of the functions using perception system will be affected by adverse weather conditions. If this is the case it is necessary to log respective data and take it into account for later data analysis.
Geographical Requirements/ Traffic Context: The performance of certain systems might depend on the traffic context, that is, the traffic density (e. g. given by the Level of Service) or might even be designed to work in specific traffic densities only. Like the other geographical requirements, this needs to be taken into account when an FOT is planned, performed and the data is analysed.
Other Limitations: All other limitations need to be mentioned, which might have considerable impact on the performance of functions or systems, since these limitations have major impact on the experimental design and data analysis.
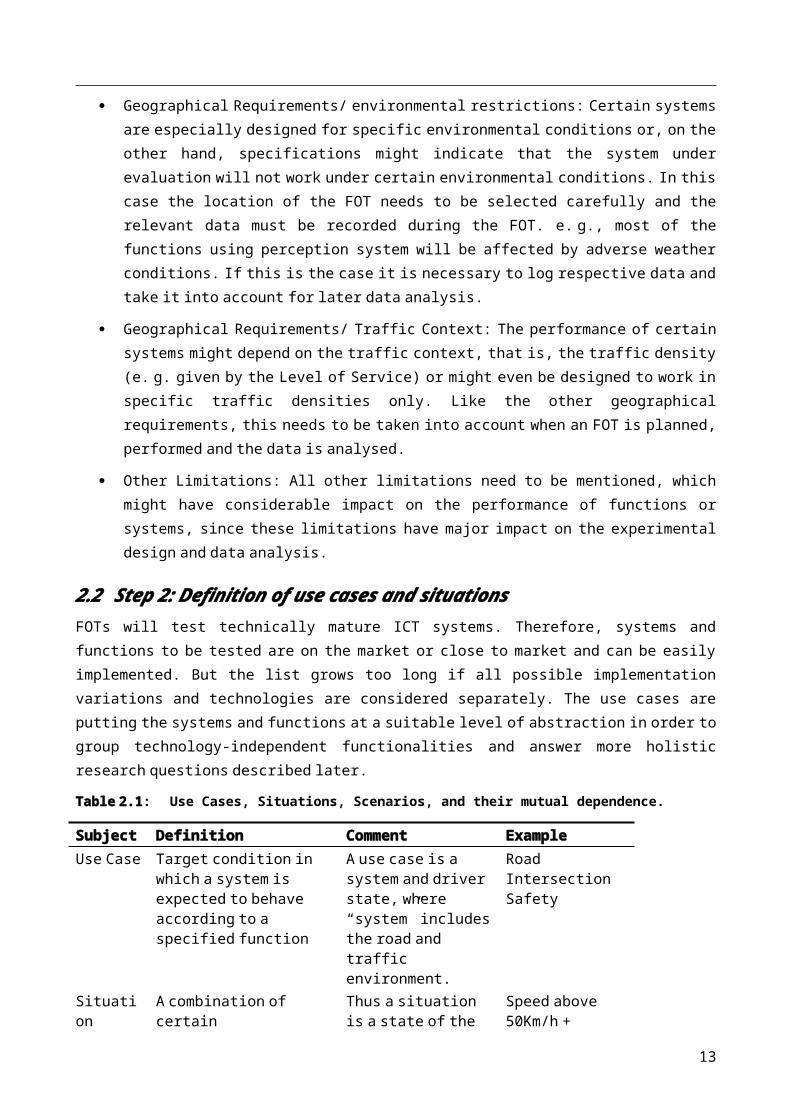
2.2 Step 2: Definition of use cases and situationsFOTs will test technically mature ICT systems. Therefore, systems and functions to be tested are on the market or close to market and can be easily implemented. But the list grows too long if all possible implementation variations and technologies are considered separately. The use cases are putting the systems and functions at a suitable level of abstraction in order to group technology-independent functionalities and answer more holistic research questions described later.
Table 2.1: Use Cases, Situations, Scenarios, and their mutual dependence.
Subject Definition Comment ExampleUse Case Target condition in which a
system is expected to behave according to a specified function
A use case is a system and driver state, where “system” includes the road and traffic environment.
Road Intersection Safety
Situation A combination of certain characteristics of a use case. Situations can be derived from use cases compiling a reasonable permutation of the use cases characteristics.
Thus a situation is a state of the environment or system.
Speed above 50Km/h +foggy day
Scenario A use case in a specific situation
Use case + situation = scenario
Car crossing withspeed below 50Km/h +foggy day
A use case is a textual presentation or a story about the usage of the system told from an end user’s perspective. Jacobson et al (1995) defined the use cases: “When a user uses the system, she or he will perform a behaviourally related sequence of transactions in a dialogue with the system. We call such a special sequence a use case.” Use cases are technology-independent and the implementation of the system is not described. Use cases provide a tool for people with different background (e. g. software developers and non-technology oriented people) to communicate with each other. Use cases form the basic test case set for the system testing. There are number of different ways to define a use case. Use cases in FESTA are
10
very general descriptions, like e. g. “car following”. This general description needs to be refined to a reasonable level of detail. This refinement is done by describing so called situations (see Table 2.1). It is the detailed scenario description which triggers the development of specific hypotheses for later analysis.
The situational descriptors are selected in a way that relevant information can be gathered to distinguish between main differences while evaluating systems. The situational descriptors can be distinguished in static and dynamic, while the static describe attributes which will not change significantly during one ride of the vehicle, like age or gender of the driver. Nevertheless this information needs to be stated, since it is one of the main inputs to filter the huge amounts of data in the later stage of data analysis. The second part of attributes is dynamic, since it can change during a ride of the vehicle, like the system action status (system on or off), the traffic conditions, road characteristics or the environmental situation.
The situations are defined as a combination of certain characteristics of a use case. Situations can be derived from use cases compiling a reasonable permutation of the use cases characteristics. The identification of possible situations was covered from three viewpoints:
1. systems and vehicle specification,
2. environmental conditions specification and
3. Driver characteristics and status specification.
The situational descriptors in FESTA conforms the following structure:
IDENTIFICATION AND DESCRIPTION
Use case name A name for identification purposes.
Description General description of the use cases with necessary depth of information to get a quick overview.
Occurrence Information about the anticipated quantity of occurrences has implications for the amount of data to analyse.
SYSTEMS AND VEHICLES
System status Depending on the hypotheses the analysis might concentrate on situations where the system is activated or present.Example: ON/OFF (baseline) or IDLE/ON/OFF
System action status Depending on the hypotheses the analysis might want to compare the driving performance between different system statuses, e. g. whether the system is actively controlling the vehicle or not.Example: acting/ not acting (meaning e. g. ACC controlling car speed or not)
System/ function characteristics
Depending on the hypotheses an analysis of system or driver performance with respect to special system/ function characteristics might be conducted, e. g. differences in system performance between nomadic devices (phone, Smartphone, PND,...) or depending on the vehicle type.Example: passenger vehicle/ truck/ bus
Interaction between systems
System and especially driver behaviour might change depending on whether the system under evaluation is the only active support system or whether interactions between two or more systems are foreseen.Example: interaction between Blind Spot Warning and Lane Departure Warning.
11

ENVIRONMENTAL CONDITIONS
Traffic conditions Performance of some systems might differ depending on traffic density. Others might only be reasonable with a minimal traffic density.Example: Level of Service A and B
Environmental situation
System performance differs depending on lighting and weather conditions like rain/ snowfall/ icy roads, etc.Example: normal/ adverse weather conditions
Road characteristics e. g. type of road gradient, super elevation, curvature, curviness, …, since some systems are dedicated to improve driving performance in curves etc.Example: urban roads/ rural roads/ highways
Geographical characteristics
Information about geographical characteristics relevant for testing the systems. Example: mountained/ flat areas, metropolises with high street canyons.
DRIVER CHARACTERISTICS AND STATUS
Driver specification Characteristics of the users have an impact on the driving performance. Even if no specific impacts are expected of certain characteristics, some outcomes may be explained better with more knowledge about the participants. A minimum set of data such as age, gender, income group and educational level is easy to gather from participants. Information about driving experience is also important. For further understanding of driver behaviour one may consider to use questionnaires on attitudes, driving behaviour and personality traits.
A well-known questionnaire about (self-reported) driving behaviour is the Driver Behaviour Questionnaire (DBQ). Some widely used personality tests are the Five Factor Model (FFM) test and the Traffic Locus of Control (T-LOC) test. Special attention may be given to the personality trait of sensation seeking, which is correlated with risky driving. The Sensation Seeking Scale (SSS) measures this trait. These questionnaires are available in many different languages, but they are not always standardized, and cultural differences may play a role. Personality traits are very easy to measure, just by administering a short questionnaire. However, the concepts and interrelations of factors are very complex, and results should be treated with caution.
When evaluating the acceptance and use of new systems in the car, drivers’ acceptability of technology is important. Both social and practical aspects play a role. Technology acceptance has different dimensions, such as diffusion of technology in the drivers’ reference group, the intention of using the technology, and the context of use (both personal and interpersonal). Measuring acceptability can be realized via (existing) standardized questionnaires, in-depth interviews before and after “use” (driving), and focus groups.
Driver status Mindset of the driverExample: attentive/ distracted/ impaired
Purpose, distance, Describes the different attributes of a trip (time between ignition on and
12
duration ignition off). All three aspects have an impact on driver behaviour and hence on patterns in the data.
A set of basic rules has been set for the design of the situations for an FOT:
1. Complementary: situations are not allowed to overlap.
2. Entirety: the sum of all situations should describe the complete use case.
3. Baseline: The same situation without the use of the systems (system off or non-present) is defined as the baseline. The baseline is the basis for the benefit assessment of the system and the comparison between systems. Therefore, for the same use case, there can be many baselines depending on the number of situations.
4. Comparability: functions compared in an FOT need to have the same use case and therefore same baseline and situations.
5. Variability of situation parameters: depending on the point of view (user, trip, vehicle, single FOT, multiple FOTs, etc…), attributes describing a situation can vary considerably or not.
This list is non-exhaustive and might be extended if necessary.
Finally, out of all the possible situations, one will need to select the relevant ones for scenarios of interest in an FOT. The scenarios are defined as a use case in a specific situation and therefore one or more scenarios should be considered from each use case. All other situations should be considered out of the scope of the FOT study. However, if possible data should still be collected in all situations in case an alternative study would like to reuse the same data.
During FESTA a list of functions and use cases was produced based on technically mature ICT systems and functions on the market. The list was consolidated based on the feedback from a stakeholders workshop and a dedicated questionnaire.
The process of defining the use cases will help the FOT for the next steps: the definition of the research questions and hypotheses and finally the identification of the needed indicators. The scenarios as they are defined at this stage of the FOT are not detailed enough for data analysis purposes. For this reason, after the definition of the indicators, the scenarios (and their situations) will need to be further described in terms of events for data analysis purposes. Only then, the scenarios can be classified with a quantitative measurement tools in function of the defined indicators.
2.3 Step 3: Identification of the Research QuestionsThe research questions specific to an FOT can only be identified once the overall goal of an FOT has been established.
In general terms the goal of any FOT is to investigate the impacts of mature ICT technologies in real use. The core Research Questions should therefore focus on impacts but there are other questions that ‘surround’ this core. The range of possible questions is listed below. This list below should be considered a first step in any FOT and not a comprehensive set of questions.
LEVEL OF SYSTEM USAGE
Which factors affect usage of the functions? Examples are
13

Purpose of journeys where system is used Familiarity with routes where system is used Portion of journey for which system is used Types of road on which system is used Traffic density Headway Weather condition Ambient lighting
How do driver characteristics affect usage of the functions? Examples are Personal characteristics ( e. g. age, vision) Socio-economic characteristics ( e. g. family, friends, employment status) Journey-related characteristics ( e. g. other car occupants, shared driving)
IMPACTS OF SYSTEM USAGE
What are the impacts on safety? exposure risk of accident or injury incidents and near accidents accidents?
What are the impacts on personal mobility? individual driving behaviour travel behaviour Comfort
What are the impacts on traffic efficiency? traffic flow (speed, travel time, punctuality) traffic volume Accessibility
What are the impacts on the environment? CO2 emissions Particles Noise
IMPLICATIONS OF MEASURED IMPACTS
What are the implications for policy? Policy decisions Laws, directives & enforcement Future funding Public authority implications Emergency service implications
What are the implications for business models? Predictions for system uptake User expectations Pricing models
What are the implications for system design & development? HMI design & usability
14

Perceived value of service Device design Communications networks Interoperability issues
What are the implications for the public Public information/education Changes in legislation Inclusive access to systems Data protection
2.4 Step 4: Creation of HypothesesOnce the key research questions for the FOT have been identified, hypotheses can be derived. The process of formulating hypotheses translates the general research questions into more specific and statistically testable hypotheses.
There is no process that can assure that all the “correct” hypotheses are formulated. To a large extent, creating hypotheses is an intuitive process, in which a combination of knowledge and judgement is applied. Nevertheless, a number of recommendations can be made about how this process should be conducted. These recommendations have been tested in a FESTA workshop and modified based on the experience of and feedback from that workshop.
Two complementary ways to develop hypotheses have been used. Both ways need to be followed, while it is not of importance which step is taken first. One of the steps follows the sequential check of specific areas in which functions can have an impact; the other step is fully based on the description of specific scenarios. While the one step results mainly in general hypotheses, the other step triggers the development of very specific hypotheses in specific driving situations or scenarios.
2.4.1 Deriving hypotheses from the scenariosThe main reasoning to describe functions, their use cases, situations and scenarios in detail according to Steps 1 and 2 is to trigger the generation of hypotheses for very specific scenarios. The hypotheses generation should be conducted by a team of experts, consisting of human factors experts, development engineers and traffic engineers and all of them need to fully understand the functions/ systems with all aspects and limitations.
Scenarios should be covered systematically. It is recommended that a structured approach be used and that the situations are checked sequentially for related hypotheses.
2.4.2 The six areas of impactThe six areas of impact defined by FESTA are based on Draskóczy et al. (1998). Although this approach was originally designed for formulating hypotheses on traffic safety impacts, it is in fact equally applicable for efficiency and environmental impacts.
The six areas are:
Direct effects of a system on the user and driving.
Indirect (behavioural adaptation) effects of the system on the user.
15

Indirect (behavioural adaptation) effects of the system on the non-user (imitating effect).
Modification of interaction between users and non-users (including vulnerable road users).
Modifying accident consequences ( e. g. by improving rescue, etc. — note that this can effect efficiency and environment as well as safety).
Effects of combination with other systems.
It is not of particular importance to which of these areas a particular hypotheses is allocated. The six areas are instead to be used as a checklist to ensure consideration of multiple aspects of system impact.
In applying this procedure, it should be noted that:
Area 1 includes the human-machine interaction aspects of system use.
The driving task (see Table 2.2) can be defined, following Michon (1985) into the three levels of strategic, tactical and control (operational) aspects.
Consideration should be given to such mediating factors as user/driver state, experience, journey purpose, etc.
It should also be noted that the effects of system use may be:
Short-term or long-term in terms of duration and
Intended or unintended in terms of system design.
This additional step for hypotheses generation assures that very general hypotheses are not forgotten as well as hypotheses on unintended, short term and long term effects. It is intended to serve as a means for crosschecking.
Table 2.2: Levels of the Driving Task by Michon (1985)
Level Explanation/ exampleStrategic Finding the way through a road network (navigation) including
Modifying modal choice Modifying route choice Modifying exposure (frequency and/or length of travel)
Tactical e. g. changing lanes, keeping the vehicle on the lanes, including modifying speed choice
Control/ Operational Maintaining speed/ headway and distance to other vehicles
2.4.3 Prioritising the hypothesesThe prioritization among the generated hypotheses is a difficult process. No specific advice can be given on how to proceed, but there are some general guidelines:
A complete list of the hypotheses that have been developed should be recorded. If it is considered that some are too trivial or too expensive to address in the subsequent study design and data collection, the reasons for not covering them should be recorded. In general, it should be left to the judgement of the experts acting as hypotheses generators which hypotheses are likely to reflect the real driving situation. Those should then be prioritized, keeping in mind that also unintended effects are very important.
16

2.5 Step 5: Link Hypotheses with indicators for quantitative analyses Some of the hypotheses will already incorporate an indicator which needs to be measured, e. g. a very concrete hypothesis like “The function will increase time-to-collision (TTC)”. In this case it is obvious which indicator to choose, while the method to measure TTC might include complicated procedures and/ or costly measurement equipment. Chapter 5 in the FESTA Handbook gives an overview about many reasonable indicators. One should consider these indicators when planning the experimental design, since a detailed description how to calculate the indicators from measurements is also provided.
Other hypotheses might be rather unspecific, but still reasonable after rephrasing into testable ones. This rephrasing goes hand in hand with the identification of related reasonable indicators. For example, a hypothesis like “The function will increase lane changing performance” is not directly testable, since “lane change performance” is not an indicator itself. Hence, surrogate measures must be identified to evaluate lane change performance. These surrogate measures or indicators can e. g. be found in publications of corresponding research projects. If appropriate information cannot be found or is not accessible, new performance indicators need to be developed. Those indicators and the measurement methodology must be valid, reliable and sensitive, that is, the measurement must actually measure what it is supposed to measure, they must be reproducible and the measurands must be sensitive to changes of the variable. A sensitivity analysis should be performed beforehand during a pilot study to make sure that the new performance indicator is suitable. When one or more surrogate measures have been identified, the initial hypothesis can be reformulated into one or more testable hypotheses. In the above mentioned example, reasonable indicators associated to “lane change performance” might be: use of turning indicator or the number of lane change warnings. The initial hypothesis will then be reformulated into: “The system will increase the use of the turning indicator.” and “During the system use, the number of lane departure warnings will decrease.”. The next step is then to evaluate how the indicators “use of turning indicator” and “lane departure warnings” can be measured. In this context, D 2.1 provides useful information.
17

3 Conclusions & Recommendations for the Cooperative SystemsExpected difficulties while performing an FOT for cooperative systems:
Cooperative systems have some geographical limitations. High frequency communication is limited by the line of sight and this is limited by topography!
How much radio propagation is dampened by atmosphere depends on the output power of the radios but bad weather might reduce the communication range a little.
Communication will use its own (communication congestion control), that is power control for reduction of range and avoiding redundant messages by intelligent protocols.
In the case of C2C applications, the end user can only benefit if there are a large number of similar-equipped vehicles. This is a burden on FOTs for cooperative systems as well. It will be necessary to establish well defined scenarios with application relevant situations and the presence of equipped cars.
It is most likely that the initial market drive will be for C2I-based applications until there is a critical mass of equipped cars on the road. Filed operational tests will asses the technological and business feasibility.
18

4 References
Draskóczy, M., Carsten, O. and Kulmala, R. (1998). Road safety guidelines. Deliverable B5.2 of CODE project (TR1103). Atkins Wootton Jeffreys, Birmingham, UK.
Michon, J.A. (1985). A critical review of driver behaviour models. In Evans, L. and Schwing, R. G. (Eds.), Human Behavior and Traffic Safety. Plenum Press, New York, pp. 485-520.
Ivar Jacobson, Stefan Bylund, Patrick Jonsson, and Staffan Ehneboom, “Modeling With Use Cases: Using contracts and use cases to build plugable architectures”, JOOP (May 1995, Vol. 8 No. 2)
Abhishek, V. (2008). EUROPEAN TELEMATICS & ITS, A progress report on V2X communication in Europe
ESOP 99 Commission of the European Communities (1999), Commission Recommendation of 21 December 1999 on safe and efficient in-vehicle information and communication systems: A European statement of principles on human machine interface. Doc no C(1999) 4786, 2000/53/EC
19

Annex A
A.1 Systems and Functions
A.1.1 Hazard Warning
System Name and Abbreviation Function Classification KEY
Hazard Warning Cooperative System C01
Connected Use Cases Connected Hypotheses
USE_COOPS_01 RQ_HW1RQ_HW2RQ_HW3
Description c2c & i2c communication system
Functionality System detects hazards, communicates them by store and forward or networking mechanisms. Drivers are informed about obstacles or hazards on the road ahead, if they are on the critical path. The system tackles bad friction and reduced visibility situations, as well as obstacle cars. Information from road side units especially at work zones or dangerous spots serves as an infrastructure channel.
System/ function is designed to?Need addressed and potential benefits
Driver is aware of approaching critical situation and better prepared to react appropriate. Driver is more relaxed.
Boun
dary
Con
ditio
ns
Infrastructure requirements Other equipped cars sending information, infrastructure sending local information about work zones and hazardous spots.
Demographical requirements/ driver requirements
n/ a
Road context The specific geometry of some geographical areas may make communication hard.
Environmental restrictions Bad weather may interfere with cooperative communication.
Traffic context bad weather conditions, equipped cars
Other limitations It cannot be guaranteed that a warning is given, because detection and communication depends on other cars in that area. It has to be proved by relevance checks or other vehicles that the warning is valid.
20

A.1.2 Decentralised Floating Car Data
System Name and Abbreviation Function Classification KEY
Decentralised Floating Car Data Cooperative System C02
Connected Use Cases Connected Hypotheses
USE_DFCD_0 RQ_DFCD1RQ_DFCD2RQ_DFCD3RQ_DFCD4
Description c2c & c2i & i2c communication system
Functionality The DFCD traffic information is used as input for the vehicle navigation system to obtain an optimal dynamic routing to the destination. It is complementary to the established systems such as RDS-TMC. Furthermore, the driver is informed about hazardous situations such as an end traffic jam behind a curve or stopped vehicles ahead. The system can also provide detailed information on the position of the vehicle inside the traffic jam and the estimated remaining time to pass through it. An uplink/downlink channel to a traffic server helps at low equipment rates and combines DFCD and RDS-TMC messages.
System/ function are designed to?Need addressed and potential benefits
Decentralized Floating Car Data (DFCD) is based on inter-vehicle and infrastructure communication. The application informs drivers of traffic jams ahead and improves the individual travel times by choosing alternative routes and traffic efficiency in general by better use of the road network. Vehicles exchange data on the local traffic situation by broadcast communication. Gaps, in which no direct vehicle-to-vehicle communication partner is available, are closed by communication with oncoming vehicles, or infrastructure. In this way, up to date traffic information can be obtained for a large local area (e.g. >50 km) even if only a low fraction of all vehicles is equipped with the inter-vehicle communication. Multi-hop routing on the network layer is not required.
Boun
dary
Con
ditio
ns
Infrastructure requirements Equipped cars and infrastructure channel.
Demographical requirements/ driver requirements
n/ a
Road context The specific geometry of some geographical areas may make communication hard.
Environmental restrictions Bad weather may interfere with cooperative communication.
Traffic context dense traffic, traffic jams, equipped cars
Other limitations It cannot be guaranteed that a warning is given, because detection and communication depends on other cars in that area. It has to be proved by relevance checks or other vehicles that the information is valid.
21

A.1.3 Road Intersection Safety
System Name and Abbreviation Function Classification KEY
Road Intersection Safety Cooperative System C03
Connected Use Cases Connected Hypotheses
USE_RIS_0 RQ_RIS1RQ_RIS2RQ_RIS3
Description c2c & c2i & i2c communication system
Functionality Lateral safety applications (LATC) are addressing the avoidance of the risk of lateral collision through an early warning to the driver. Specifically for road intersection safety, the focus is on accident avoidance (when already occurred), support in case of obstructed view and right-of-way denial. Two types of urban intersections can occur: the first type with infrastructure sensors and V2I communication ; the second type (longer term) assuming all of the involved vehicles having V2V capabilities implemented (with or without the support of the infrastructure)
System/ function is designed to?Need addressed and potential benefits
Driver is aware of approaching critical situation and better prepared to react appropriate. Driver is more relaxed.
Boun
dary
Con
ditio
ns
Infrastructure requirements Infrastructure sends information about accident occurred, denial of right-of-way; other equipped cars broadcast its presence.
Demographical requirements/ driver requirements
n/ a
Road context Intersections with/without right of way, with functioning/ non-functioning lights (eventually simulated)The specific geometry of some geographical areas may make communication hard.
Environmental restrictions low light for reduced perception of trafficBad weather may interfere with cooperative communication."
Traffic context dense traffic, non-functioning traffic lights, equipped cars
Other limitations It cannot be guaranteed that a warning is given, because detection and communication depends on other cars in that area. It has to be proved by relevance checks or other vehicles that the information is valid.
22

A.1.4 Curve Warning
System Name and Abbreviation Function Classification KEY
Curve Warning Cooperative System C04
Connected Use Cases Connected Hypotheses
USE_CW_0 RQ_CW_1
Description c2c & c2i & i2c communication system
Functionality Road departure applications (RODP) are related to the sharing with other vehicles of the information of a slippery road status, or a bad road condition (can be due to weather condition, ice, fog...), or other factors – especially in curve - that may lead to the risk of a road departure. Specifically, for curve warning, information is gathered and delivered with a sufficient anticipation to the driver about the road curvature and the adequate speed to keep in the specific black spot. Conditions that may dynamically change the speed and the trajectory to keep in the curve (road works, static obstacles) are also provided.
System/ function is designed to?Need addressed and potential benefits
Driver is aware of approaching critical situation and better prepared to react appropriate. Driver is more relaxed.
Boun
dary
Con
ditio
ns
Infrastructure requirements Vehicle sends information to infrastructure (transponder) on speed adopted in curve
Demographical requirements/ driver requirements
n/ a
Road context Rural roads, with sharp curves.The specific geometry of some geographical areas may make communication hard.
Environmental restrictions Bad weather may interfere with cooperative communication.
Traffic context bad weather conditions, equipped vehicles
Other limitations It cannot be guaranteed that a warning is given, because detection and communication depends on other cars in that area. It has to be proved by relevance checks or other vehicles that the information is valid.
23

A.1.5 Cooperative Collision Warning
System Name and Abbreviation Function Classification KEY
Cooperative Collision Warning Cooperative System C05
Connected Use Cases Connected Hypotheses
UC_CCW_01 RQ_CCW1RQ_CCW2
Description The cooperative collision warning function warns the driver of a possible collision with ahead-driving (or standing) vehicle.
Functionality "The cooperative collision warning function warns the driver of a possible collision with ahead-driving (or standing) vehicle. Vehicles driving ahead permanently send their exact position and, preferably, velocity and acceleration data. The driver’s vehicle can identify dangerous situations and warn the driver. A two level functional concept (warning/intervention) will adapt to the different danger potential depending on the distance between the own vehicle and the ahead-driving vehicle:• Warning driver of a possible collision (when reaching braking distance to position of ahead-driving vehicles)• Autonomous intervention if drivers do not react properly"
System/ function is designed to?Need addressed and potential benefits
Mitigation and avoidance of tailgate and head-on accidents
Boun
dary
Con
ditio
ns
Infrastructure requirements Position, kinematics and braking information are permanently transmitted by other vehicles.
Demographical requirements/ driver requirements
n/ a
Road context The specific geometry of some geographical areas may make communication hard.
Environmental restrictions "Bad weather may interfere with cooperative communication."
Traffic context n/ a
Other limitations n/ a
24

A.1.6 Cooperative Low Friction Warning
System Name and Abbreviation Function Classification KEY
Cooperative Low Friction Warning Cooperative System C06
Connected Use Cases Connected Hypotheses
UC_LFW_01 RQ_LFW1
Description Cooperative Low friction warning function informs the driver about the presence of parts with low friction (snow, ice, etc.) on the road ahead.
Functionality "Low friction warning function informs the driver about the presence of parts with low friction (snow, ice, etc.) on the road ahead. If the received data also contains position information the driver can be warned in front of such a road part in due time.The detection of low µ parts can be obtained from µ-estimations made by the ESP-ECU of vehicles ahead or oncoming. Alternatively, the information can directly be obtained from a suitable infrastructure like a road weather information service."
System/ function is designed to?Need addressed and potential benefits
Prevent accidents and indicidents due to slippery areas. Increase performance for existing safety systems, like ESP, Collision mitigation/avoidance systems.
Boun
dary
Con
ditio
ns
Infrastructure requirements Information on weather conditions and ice on the road are permanently transmitted by infrastructure or other vehicles.
Demographical requirements/ driver requirements
n/ a
Road context The specific geometry of some geographical areas may make communication hard.
Environmental restrictions Should be tested in areas with frequent rain or snow or in winter season. Bad weather may interfere with cooperative communication.
Traffic context n/ a
Other limitations The algorithm determining the probability of crossing may depend on presence of zebra crossing in the digital maps inside the vehicle. As a consequence this function can be limited any time the map are not accurate.
25

A.1.7 Cooperative Lane Change Aid
System Name and Abbreviation Function Classification KEY
Cooperative Lane Change Aid Cooperative System C07
Connected Use Cases Connected Hypotheses
UC_LCA_01UC_LCA_02
RQ_LCA1
Description The cooperative lane change aid function warns the driver in case of intended lane changes in the presence of vehicles on the destination lane.
Functionality This function supports two sub-functionalities, information on traffics density in a certain area and information on traffic light signals ahead. Traffic density information are collected from infrastructure beacons and displayed inside the navigation display. Based on this information the driver can choose by his own a different route to his destination.The traffic lights information provides the signal status and the time, when the next green light phase will occur. With this information the driver can adapt his speed to support optimized traffic flow.
System/ function is designed to?Need addressed and potential benefits
Support of foresight driving, in particular in urban areas, to reduce waiting time, queues and therefore fuel consumption.
Boun
dary
Con
ditio
ns
Infrastructure requirements Infrastructure support is necessary to get data of traffic density and traffic lights incl. time until phase change.
Demographical requirements/ driver requirements
n/ a
Road context Urban areasThe specific geometry of some geographical areas may make communication hard.
Environmental restrictions Bad weather may interfere with cooperative communication.
Traffic context n/ a
Other limitations n/ a
26

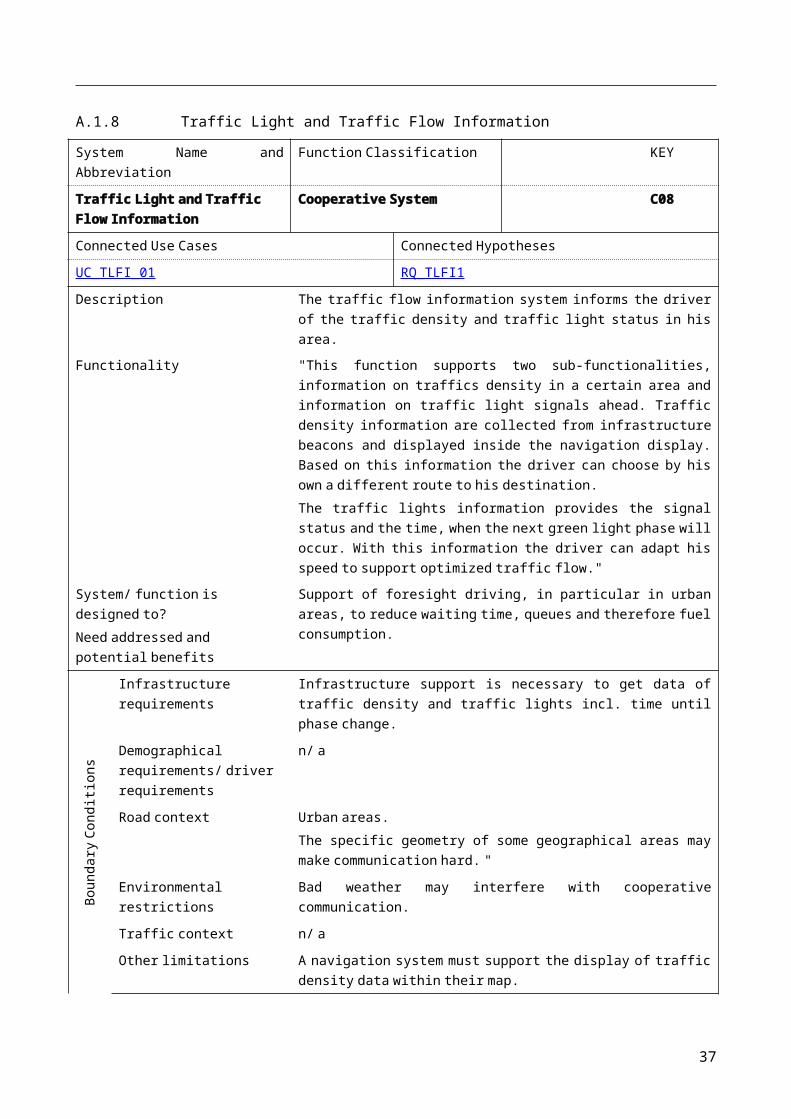
A.1.8 Traffic Light and Traffic Flow Information
System Name and Abbreviation Function Classification KEY
Traffic Light and Traffic Flow Information
Cooperative System C08
Connected Use Cases Connected Hypotheses
UC_TLFI_01 RQ_TLFI1
Description The traffic flow information system informs the driver of the traffic density and traffic light status in his area.
Functionality "This function supports two sub-functionalities, information on traffics density in a certain area and information on traffic light signals ahead. Traffic density information are collected from infrastructure beacons and displayed inside the navigation display. Based on this information the driver can choose by his own a different route to his destination.The traffic lights information provides the signal status and the time, when the next green light phase will occur. With this information the driver can adapt his speed to support optimized traffic flow."
System/ function is designed to?Need addressed and potential benefits
Support of foresight driving, in particular in urban areas, to reduce waiting time, queues and therefore fuel consumption.
Boun
dary
Con
ditio
ns
Infrastructure requirements Infrastructure support is necessary to get data of traffic density and traffic lights incl. time until phase change.
Demographical requirements/ driver requirements
n/ a
Road context Urban areas.The specific geometry of some geographical areas may make communication hard. "
Environmental restrictions Bad weather may interfere with cooperative communication.
Traffic context n/ a
Other limitations A navigation system must support the display of traffic density data within their map.
27

A.1.9 Vulnerable Road User Accidents Avoidance
System Name and Abbreviation Function Classification KEY
Vulnerable Road User Accidents Avoidance
Cooperative System C09
Connected Use Cases Connected Hypotheses
UC_VRUAA_01UC_VRUAA_02UC_VRUAA_03
H_S19_01 H_S19_02 H_S19_03 H_S19_04H_S19_05 H_S19_06 H_S19_07 H_S19_08H_S19_09 H_S19_10 H_S19_11 H_S19_12H_S19_13 H_S19_14 H_S19_15 H_S19_16H_S19_17 H_S19_18 H_S19_19
Description This function warns the driver when there is a sufficiently high probability that the trajectory of a vulnerable road user and the trajectory of the ego-vehicle will collide
Functionality This function warns the driver depending on the probability that a vulnerable user will cross the ego-vehicle trajectory in order to avoid a collision. Information about the vulnerable road user is obtained from cooperative communication from another vehicle and/or an infrastructure and/or a vulnerable road user...
System/ function is designed to?Need addressed and potential benefits
Prevent accidents and incidents between vulnerable road users and vehicles.
Boun
dary
Con
ditio
ns
Infrastructure requirements Infrastructure and/or other vehicle able to recognize and/or broadcast vulnerable user information and other vehicles information are needed for this function to work.
Demographical requirements/ driver requirements
n/ a
Road context The specific geometry of some geographical areas may make communication hard.
Environmental restrictions "Bad weather may interfere with cooperative communication."
Traffic context High density traffic may limit the ability of recognizing vulnerable road users.
Other limitations The algorithm determining the probability of crossing might depend on presence of pedestrian crossing in the digital maps inside the vehicle. As a consequence this function can be limited any time the map are not accurate.
28

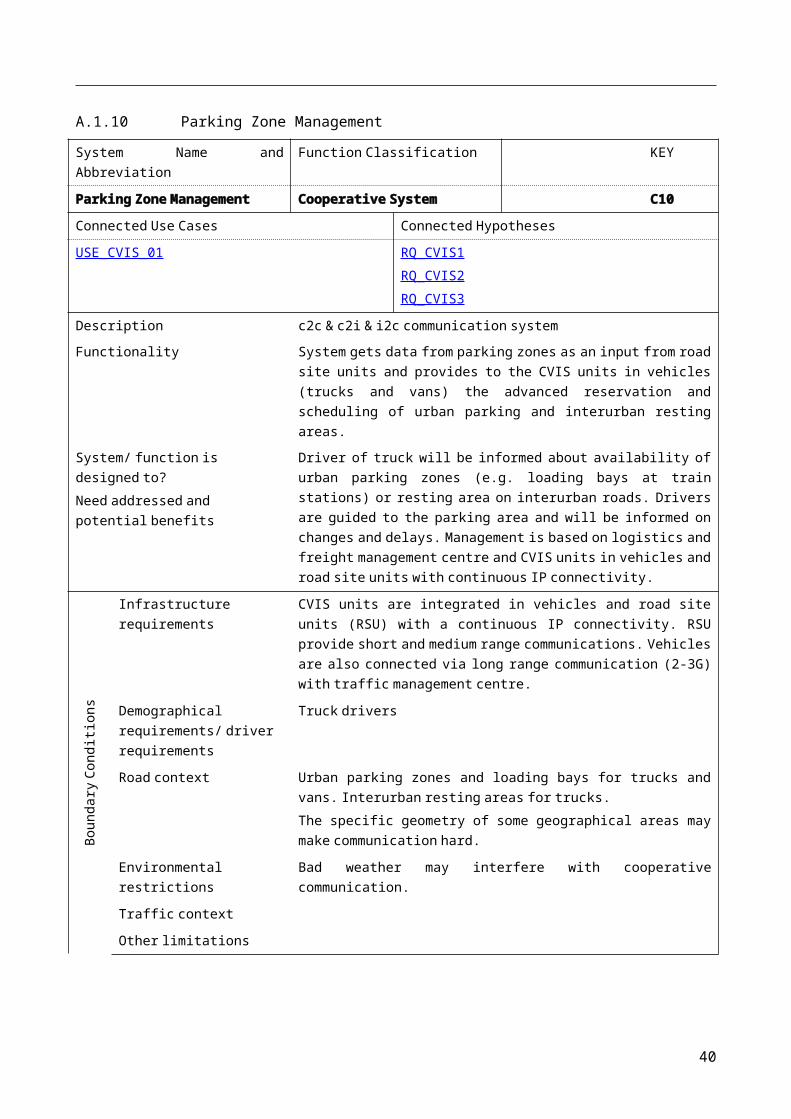
A.1.10 Parking Zone Management
System Name and Abbreviation Function Classification KEY
Parking Zone Management Cooperative System C10
Connected Use Cases Connected Hypotheses
USE_CVIS_01 RQ_CVIS1RQ_CVIS2RQ_CVIS3
Description c2c & c2i & i2c communication system
Functionality System gets data from parking zones as an input from road site units and provides to the CVIS units in vehicles (trucks and vans) the advanced reservation and scheduling of urban parking and interurban resting areas.
System/ function is designed to?Need addressed and potential benefits
Driver of truck will be informed about availability of urban parking zones (e.g. loading bays at train stations) or resting area on interurban roads. Drivers are guided to the parking area and will be informed on changes and delays. Management is based on logistics and freight management centre and CVIS units in vehicles and road site units with continuous IP connectivity.
Boun
dary
Con
ditio
ns
Infrastructure requirements CVIS units are integrated in vehicles and road site units (RSU) with a continuous IP connectivity. RSU provide short and medium range communications. Vehicles are also connected via long range communication (2-3G) with traffic management centre.
Demographical requirements/ driver requirements
Truck drivers
Road context Urban parking zones and loading bays for trucks and vans. Interurban resting areas for trucks. The specific geometry of some geographical areas may make communication hard.
Environmental restrictions Bad weather may interfere with cooperative communication.
Traffic context
Other limitations
29

A.1.11 City Guardian
System Name and Abbreviation Function Classification KEY
City Guardian Cooperative System C11
Connected Use Cases Connected Hypotheses
USE_CVIS_02 RQ_CVIS2
Description c2c & c2i & i2c communication system
Functionality Road site units (RSU) provides access rights for road sections, intersections, lanes, tunnels, parking areas, etc to trucks and other vehicles. System will monitor, route and query vehicles with dangerous goods, oversize transports or other specific transport vehicles.
System/ function is designed to?Need addressed and potential benefits
Vehicle (driver) gets access rights from road site units (RSU) to road sections, intersections, lanes, tunnels, parking areas, etc.. Access could be restricted for vehicles with dangerous goods. Vehicles get routing information and guidance from a control centre. The control centre monitors, plans and queries dangerous and oversize good transports. In the case of violation of access rights public authorities will be informed to take countermeasures.
Boun
dary
Con
ditio
ns
Infrastructure requirements CVIS units are integrated in vehicles and road site units (RSU) with a continuous IP connectivity. RSU provide short and medium range communications. Vehicles are also connected via long range communication (2-3G) with traffic management centre.
Demographical requirements/ driver requirements
Truck drivers and drivers of specific vehicles
Road context City entrance.The specific geometry of some geographical areas may make communication hard.
Environmental restrictions Bad weather may interfere with cooperative communication.
Traffic context
Other limitations
30

A.1.12 Speed Advice
System Name and Abbreviation Function Classification KEY
Speed Advice Cooperative System C12
Connected Use Cases Connected Hypotheses
USE_CVIS_03 RQ_CVIS1RQ_CVIS2RQ_CVIS3RQ_CVIS6
Description c2c & c2i & i2c communication system
Functionality Road site units (RSU) provide actual traffic regulations and advice to vehicles and drivers. In-vehicle display show dynamic traffic signs to drivers and informs about actual, dynamic speed advice and lane specific speed limits.
System/ function is designed to?Need addressed and potential benefits
In-vehicle display of dynamic traffic signs and on-board provision of actual traffic regulations and advices.
Boun
dary
Con
ditio
ns
Infrastructure requirements CVIS units are integrated in vehicles and road site units (RSU) with a continuous IP connectivity. RSU provide short and medium range communications. Vehicles are also connected via long range communication (2-3G) with traffic management centre.
Demographical requirements/ driver requirements
n/ a
Road context The specific geometry of some geographical areas may make communication hard.
Environmental restrictions Bad weather may interfere with cooperative communication.
Traffic context
Other limitations
31

A.1.13 Traffic prioritization
System Name and Abbreviation Function Classification KEY
Traffic prioritization Cooperative System C13
Connected Use Cases Connected Hypotheses
USE_CVIS_04 RQ_CVIS1RQ_CVIS3RQ_CVIS5RQ_CVIS6
Description c2c & c2i & i2c communication system
Functionality Road site units (RSU) receive authorization from specific vehicles (e.g. emergency vehicles with sirens) and give them priority (e.g. green wave) at a series of intersections equipped with traffic lights. RSU informs vehicles in the vicinity about emergency case. System will monitor, route emergency vehicles.
System/ function is designed to?Need addressed and potential benefits
Green wave will be provided to emergency vehicles. Drivers in the vicinity will be informed about emergency case.
Boun
dary
Con
ditio
ns
Infrastructure requirements CVIS units are integrated in vehicles and road site units (RSU) with a continuous IP connectivity. RSU provide short and medium range communications. Vehicles are also connected via long range communication (2-3G) with traffic management centre.
Demographical requirements/ driver requirements
Drivers of emergency vehicles
Road context Urban areas with traffic lights at intersections The specific geometry of some geographical areas may make communication hard.
Environmental restrictions "Bad weather may interfere with cooperative communication."
Traffic context
Other limitations
32

A.1.14 Dynamic allocation of lanes and road sections
System Name and Abbreviation Function Classification KEY
Dynamic allocation of lanes and road sections
Cooperative System C14
Connected Use Cases Connected Hypotheses
USE_CVIS_05 RQ_CVIS1RQ_CVIS3RQ_CVIS5RQ_CVIS6
Description c2c & c2i & i2c communication system
Functionality Road site units (RSU) provide access rights or restrictions for the usage of specific lanes and road sections to vehicles and drivers. In-vehicle display shows to the driver the dynamic lane and road section specific access rights and warns in the case of violation.
System/ function is designed to?Need addressed and potential benefits
Dynamic allocation of bus lanes and specific road intersections for individual and public transport to optimise the overall traffic flow. Road sections and specific lanes may also be used for traffic in both directions to channel traffic of commuters.
Boun
dary
Con
ditio
ns
Infrastructure requirements CVIS units are integrated in vehicles and road site units (RSU) with a continuous IP connectivity. RSU provide short and medium range communications. Vehicles are also connected via long range communication (2-3G) with traffic management centre.
Demographical requirements/ driver requirements
Drivers of public transport vehicles
Road context Urban areas with specific lanes for public transportThe specific geometry of some geographical areas may make communication hard.
Environmental restrictions Bad weather may interfere with cooperative communication.
Traffic context
Other limitations
33

A.1.15 Informing driver about current speed limit
System Name and Abbreviation Function Classification KEY
Informing driver about current speed limit
Cooperative System C15
Connected Use Cases Connected Hypotheses
CV-UC-SP3.2-0017CV-UC-SP3.2-0011
RQ_CVIS2RQ_CVIS4
Description c2c & c2i & i2c communication system
Functionality The cooperative systems keeps informed the driver about the suggested speed to keep all the traffic flow fluid and harmonised in the highway or interurban road section he/she is travelling.
System/ function is designed to?Need addressed and potential benefits
The traffic is harmonised and fluid, the headway is kept under control to achieve minimum risk of accidents, lowering the probability of congestions, lowering pollution.
Boun
dary
Con
ditio
ns
Infrastructure requirements CVIS units are integrated in vehicles and road site units (RSU) with a continuous IP connectivity. RSU provide short and medium range communications. Vehicles are also connected via long range communication (2-3G) with traffic management centre.
Demographical requirements/ driver requirements
n/a
Road context Interurban roads, motorways.The specific geometry of some geographical areas may make communication hard.
Environmental restrictions Bad weather may interfere with cooperative communication.
Traffic context
Other limitations
34

A.2 Use Cases
A.2.1 USE_COOPS_01
Use Case Name and Abbreviation KEY
USE_COOPS_01 UC_01
Connected Systems Connected Hypotheses
Hazard Warning RQ_HW1RQ_HW2RQ_HW3
Description System detects hazards, communicates them by store and forward or networking mechanisms. Drivers are informed about obstacles or hazards on the road ahead, if they are on the critical path. The system tackles bad friction and reduced visibility situations, as well as obstacle cars. Information from road side units especially at work zones or dangerous spots serves as an infrastructure channel.
Syst
em a
nd
Vehi
cle
Spec
ifica
tion System Status ON
System Action Status No active control - information only
Vehicle Characteristics Performance is independent from vehicle characteristics
Interaction between Systems n/ a
Envi
ronm
enta
l Spe
cific
ation
s Traffic Conditions Quality of hazard warnings depends up to a certain degree on traffic density. Without minimum number of vehicles = traffic density * equipment rate no proper support is feasible. Store and forward of messages within a certain distance or time interval is assumed.
Environmental Situation Source of information is bad visibility, slippery road, obstacles, and road works. Thus support is best under bad weather conditions.
Road Characteristics On curved roads with bad foresight the benefit is higher than on wide straight roads.
Geographical Characteristics System should be tested in winter with ice and snow or heavy rain.
Driv
er Driver Specification normal sample of driver population
Driver Status n/ a
Frequency rare
A.2.2 USE_DFCD_0
Use Case Name and Abbreviation KEY
USE_DFCD_0 UC_02
Connected Systems Connected Hypotheses
Decentralised Floating Car Data RQ_DFCD1RQ_DFCD2RQ_DFCD3RQ_DFCD4
Description The DFCD traffic information is used as input for the vehicle navigation
35

system to obtain an optimal dynamic routing to the destination. It is complementary to the established systems such as RDS-TMC. Furthermore, the driver is informed about hazardous situations such as an end traffic jam behind a curve or stopped vehicles ahead. The system can also provide detailed information on the position of the vehicle inside the traffic jam and the estimated remaining time to pass through it. An uplink/downlink channel to a traffic server helps at low equipment rates and combines DFCD and RDS-TMC messages.
Syst
em a
nd
Vehi
cle
Spec
ifica
tion System Status ON
System Action Status No active control - information only
Vehicle Characteristics Performance is independent from vehicle characteristics
Interaction between Systems n/ a
Envi
ronm
enta
l Spe
cific
ation
s
Traffic Conditions Quality of traffic information depends up to a certain degree on traffic density. Without minimum number of vehicles = traffic density * equipment rate no proper support is feasible. Store and forward of messages within a certain distance or time interval is assumed. Infrastructure information uplink and downlink to and from a traffic centre overcome problems with low equipment rates.
Environmental Situation Source of information is speed, travel times, and traffic jams. Thus support is best for heavy traffic.
Road Characteristics System is useful on autobahns and highways or other overcrowded stretches of road.
Geographical Characteristics n/ a
Driv
er Driver Specification normal sample of driver population
Driver Status n/ a
Frequency rare
36
A.2.3 USE_RIS_0
Use Case Name and Abbreviation KEY
USE_RIS_0 UC_03
Connected Systems Connected Hypotheses
Road Intersection Safety RQ_RIS1RQ_RIS2RQ_RIS3
Description Lateral safety applications (LATC) are addressing the avoidance of the risk of lateral collision through an early warning to the driver. Specifically for road intersection safety, the focus is on accident avoidance (when already occurred), support in case of obstructed view and right-of-way denial. Two types of urban intersections can occur: the first type with infrastructure sensors and V2I communication ; the second type (longer term) assuming all of the involved vehicles having V2V capabilities implemented (with or without the support of the infrastructure)
Syst
em a
nd
Vehi
cle
Spec
ifica
tion System Status ON
System Action Status No active control - information only. Maybe control over speed?
Vehicle Characteristics Performance is independent from vehicle characteristics
Interaction between Systems Interaction with Hazard Warning?
Envi
ronm
enta
l Sp
ecifi
catio
ns
Traffic Conditions Quality of accident warning propagation messages depends on the equipment rate of vehicles or intersections. Store and forward of messages within a certain distance or time interval is assumed.
Environmental Situation Less visibility will increase the importance of the system.
Road Characteristics n/ a
Geographical Characteristics Different typologies of intersections: with traffic signals, right of way
Driv
er Driver Specification normal sample of driver population
Driver Status n/ a
Frequency rare
37

A.2.4 USE_SO_0
Use Case Name and Abbreviation KEY
USE_SO_0 UC_04
Connected Systems Connected Hypotheses
RQ_SO_1
Description Lateral safety applications (LATC) are addressing the avoidance of the risk of lateral collision through an early warning to the driver. Specifically for safe overtaking, the focus is on prevention of collision among vehicles in an overtake situation (integration of blind spot and early notification to the preceding driver of the intention to overtake of the vehicle behind). Road user at particular risk are PTWs.
Syst
em a
nd
Vehi
cle
Spec
ifica
tion
System Status ON
System Action Status No active control - information only. Maybe control over speed?
Vehicle Characteristics Performance depends on type of vehicle (e.g. commercial heavy vehicle, PTW)
Interaction between Systems Interaction with Hazard Warning?
Envi
ronm
enta
l Sp
ecifi
catio
ns
Traffic Conditions Quality of system depends on the traffic: low traffic may lead to less attention; high traffic increases probability of presence of other vehicles but increases driver attention.
Environmental Situation Less visibility will increase the importance of the system.
Road Characteristics n/ a
Geographical Characteristics Highways are the preferred situation
Driv
er Driver Specification n/ a
Driver Status n/ a
Frequency rare
38

A.2.5 USE_CW_0
Use Case Name and Abbreviation KEY
USE_CW_0 UC_05
Connected Systems Connected Hypotheses
Curve Warning RQ_CW_1
Description Road departure applications (RODP) are related to the sharing with other vehicles of the information of a slippery road status, or a bad road condition (can be due to weather condition, ice, fog...), or other factors – especially in curve - that may lead to the risk of a road departure. Specifically, for curve warning, information is gathered and delivered with a sufficient anticipation to the driver about the road curvature and the adequate speed to keep in the specific black spot. Conditions that may dynamically change the speed and the trajectory to keep in the curve (road works, static obstacles) are also provided.
Syst
em a
nd
Vehi
cle
Spec
ifica
tion
System Status ON
System Action Status No active control - information only. Maybe control over speed?
Vehicle Characteristics Performance depends on type of vehicle (e.g. commercial heavy vehicle, PTW)
Interaction between Systems Interaction with Hazard Warning?
Envi
ronm
enta
l Sp
ecifi
catio
ns
Traffic Conditions Traffic should have a minimal density, to allow estimation of speed under the same weather conditions.
Environmental Situation Weather conditions may have an impact on the correct speed in curve. Thus traffic should have a minimal density.
Road Characteristics Rural roads with sharp curves
Geographical Characteristics Rural roads
Driv
er Driver Specification passenger vehicle drivers and PTW drivers
Driver Status n/ a
Frequency rare
39
A.2.6 UC_CCW_01
Use Case Name and Abbreviation KEY
UC_CCW_01 UC_06
Connected Systems Connected Hypotheses
Cooperative Collision Warning RQ_CCW1RQ_CCW2
Description Cooperative Collision Warning: The vehicle under test is driving with activated system.
Syst
em a
nd
Vehi
cle
Spec
ifica
tion
System Status ON
System Action Status n/ a
Vehicle Characteristics passenger vehicletruck
Interaction between Systems n/ a
Envi
ronm
enta
l Sp
ecifi
catio
ns
Traffic Conditions Other traffic members with activated system are necessary to get proper functionality
Environmental Situation n/ a
Road Characteristics n/ a
Geographical Characteristics Urban vs. extra-urban areas should be considered
Driv
er Driver Specification normal sample of driver population
Driver Status n/ a
Frequency rare
40

A.2.7 UC_LFW_01
Use Case Name and Abbreviation KEY
UC_LFW_01 UC_07
Connected Systems Connected Hypotheses
Cooperative Low Friction Warning RQ_LFW1
Description Cooperative Low Friction Warning: The vehicle under test is driving with activated system.
Syst
em a
nd
Vehi
cle
Spec
ifica
tion
System Status ON
System Action Status n/ a
Vehicle Characteristics passenger vehicletruck
Interaction between Systems Interaction with stability control system possible
Envi
ronm
enta
l Sp
ecifi
catio
ns
Traffic Conditions Other traffic members with activated system are necessary to get proper functionality
Environmental Situation n/ a
Road Characteristics n/ a
Geographical Characteristics n/ a
Driv
er Driver Specification Age and gender of drivers should be considered
Driver Status n/ a
Frequency rare
41

A.2.8 UC_LCA_01
Use Case Name and Abbreviation KEY
UC_LCA_01 UC_08
Connected Systems Connected Hypotheses
Cooperative Lane Change Aid RQ_LCA1
Description Cooperative Lane Change Aid in urban areas: The vehicle under test is driving with activated system.
Syst
em a
nd
Vehi
cle
Spec
ifica
tion
System Status ON
System Action Status n/ a
Vehicle Characteristics passenger vehicletruck
Interaction between Systems n/ a
Envi
ronm
enta
l Sp
ecifi
catio
ns
Traffic Conditions Other traffic members with activated system are necessary to get proper functionality
Environmental Situation n/ a
Road Characteristics Function is assisting the driver only on roads with more then one lane per direction.
Geographical Characteristics Optimized for assistance in urban area
Driv
er Driver Specification n/ a
Driver Status n/ a
Frequency rare
42

A.2.9 UC_LCA_02
Use Case Name and Abbreviation KEY
UC_LCA_02 UC_09
Connected Systems Connected Hypotheses
Cooperative Lane Change Aid RQ_LCA1
Description Cooperative Lane Change Aid on highways: The vehicle under test is driving with activated system.
Syst
em a
nd
Vehi
cle
Spec
ifica
tion
System Status ON
System Action Status n/ a
Vehicle Characteristics passenger vehicletruck
Interaction between Systems n/ a
Envi
ronm
enta
l Sp
ecifi
catio
ns
Traffic Conditions Other traffic members with activated system are necessary to get proper functionality
Environmental Situation n/ a
Road Characteristics n/ a
Geographical Characteristics Optimized for assistance on highways
Driv
er Driver Specification Age and gender of drivers should be considered
Driver Status n/ a
Frequency rare
43
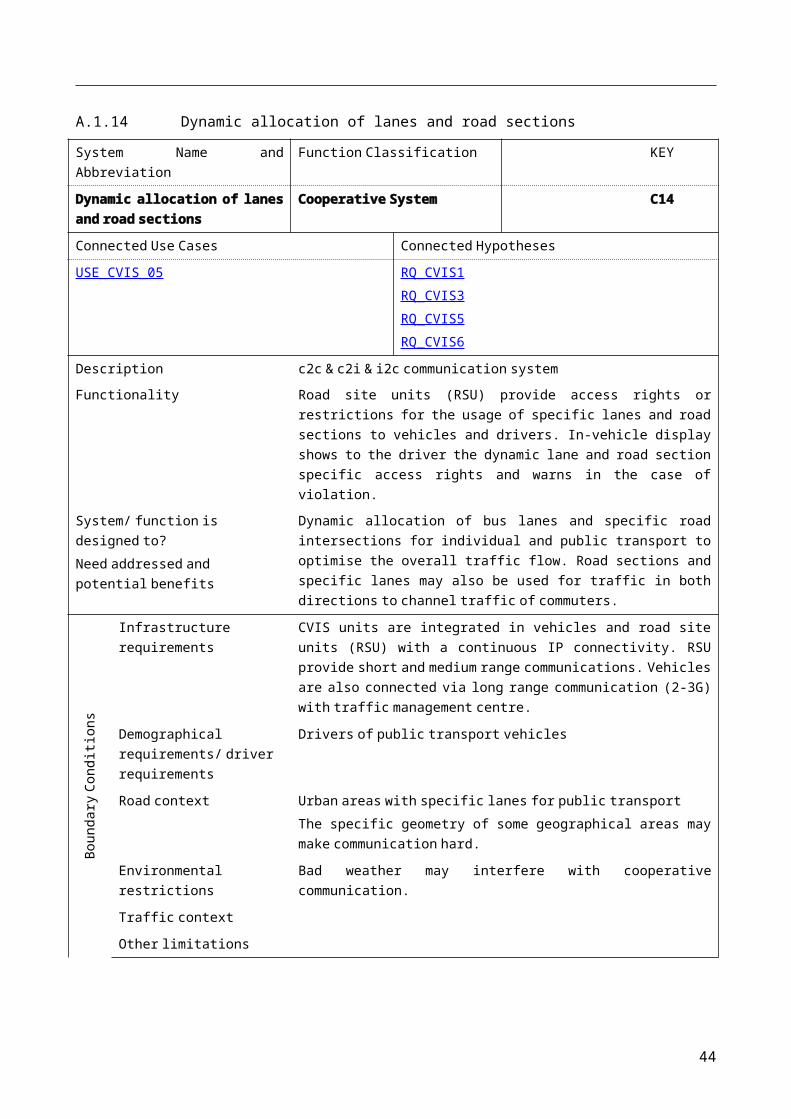
A.2.10 UC_TLFI_01
Use Case Name and Abbreviation KEY
UC_TLFI_01 UC_10
Connected Systems Connected Hypotheses
Traffic Light and Traffic Flow Information RQ_TLFI1
Description Traffic Light and Traffic Flow Information: The vehicle under test is driving with activated system.
Syst
em a
nd V
ehic
le
Spec
ifica
tion
System Status ONOFF
System Action Status n/ a
Vehicle Characteristics Passenger carTruckBusmotorcycle
Interaction between Systems Interaction with other traffic information systems could be possible.
Envi
ronm
enta
l Sp
ecifi
catio
ns Traffic Conditions n/ a
Environmental Situation n/ a
Road Characteristics n/ a
Geographical Characteristics Optimized for assistance in urban area
Driv
er Driver Specification Age and gender of drivers should be considered
Driver Status n/ a
Frequency rare
44

A.2.11 UC_VRUAA_01
Use Case Name and Abbreviation KEY
UC_VRUAA_01 UC_11
Connected Systems Connected Hypotheses
Vulnerable Road User Accidents Avoidance H_S19_01 H_S19_02 H_S19_03 H_S19_04H_S19_05 H_S19_06 H_S19_07 H_S19_08H_S19_09 H_S19_10 H_S19_11 H_S19_12H_S19_13 H_S19_14 H_S19_15 H_S19_16H_S19_17 H_S19_18 H_S19_19
Description The ego-vehicle under test is driving with activated function and it is approaching a zebra crossing.
Syst
em a
nd V
ehic
le S
peci
ficati
on
System Status ONOFF
System Action Status n/ a
Vehicle Characteristics Passenger carTruckBusmotorcycle
Interaction between Systems Interaction with other traffic information systems could be possible especially at HMI level.
Envi
ronm
enta
l Spe
cific
ation
s Traffic Conditions Other vehicles and/or infrastructure may be necessary for the cooperative application to work.
Environmental Situation Driver ability to see a pedestrian may depend on visibility. As a consequence, this function may have a higher impact on safety when visibility is low.
Road Characteristics A pedestrian crossing must be present.
Geographical Characteristics Depending on the different driving habits in different countries, vehicles may be more or less prone to slow down in proximity of a zebra crossing independently from the warning.
Driv
er
Driver Specification Age, gender, experience, level of distraction and drowsiness should be considered.
Driver Status n/ a
Frequency rare
45

A.2.12 UC_VRUAA_02
Use Case Name and Abbreviation KEY
UC_VRUAA_02 UC_12
Connected Systems Connected Hypotheses
Vulnerable Road User Accidents Avoidance H_S19_01 H_S19_02 H_S19_03 H_S19_04H_S19_05 H_S19_06 H_S19_07 H_S19_08H_S19_09 H_S19_10 H_S19_11 H_S19_12H_S19_13 H_S19_14 H_S19_15 H_S19_16H_S19_17 H_S19_18 H_S19_19
Description The ego-vehicle under test is driving with activated function and a pedestrian is in the proximity with intention of crossing the ego-vehicle trajectory.
Syst
em a
nd V
ehic
le S
peci
ficati
on
System Status ONOFF
System Action Status n/ a
Vehicle Characteristics Passenger carTruckBusmotorcycle
Interaction between Systems Interaction with other traffic information systems could be possible especially at HMI level.
Envi
ronm
enta
l Spe
cific
ation
s
Traffic Conditions "Other vehicles and/or infrastructure may necessary for the cooperative application to work.One or more pedestrian need to be in proximity of the ego-vehicle."
Environmental Situation Pedestrian recognition may depend on cameras. As a consequence, different environment situations such as fog, rain, snow should be tested.
Road Characteristics Urban road are probably more likely to have pedestrian crossing.
Geographical Characteristics Depending on the different driving habits in different countries, vehicles may be more or less prone to slow down when a pedestrian is on the border of the road independently from the warning.
Driv
er
Driver Specification Age, gender, experience, level of distraction and drowsiness should be considered.
Driver Status n/ a
Frequency rare
46
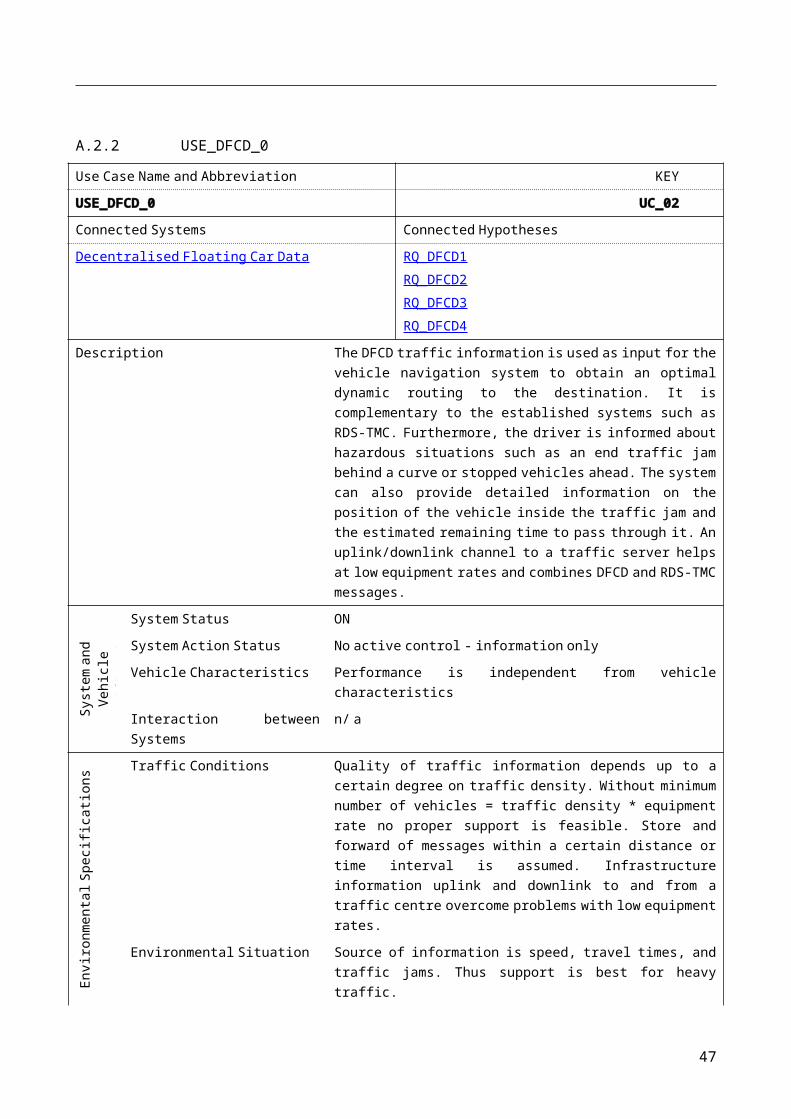
A.2.13 UC_VRUAA_03
Use Case Name and Abbreviation KEY
UC_VRUAA_03 UC_13
Connected Systems Connected Hypotheses
Vulnerable Road User Accidents Avoidance H_S19_01 H_S19_02 H_S19_03 H_S19_04H_S19_05 H_S19_06 H_S19_07 H_S19_08H_S19_09 H_S19_10 H_S19_11 H_S19_12H_S19_13 H_S19_14 H_S19_15 H_S19_16H_S19_17 H_S19_18 H_S19_19
Description The ego-vehicle under test is driving with activated function and its trajectory and a vulnerable road user trajectory are colliding.
Syst
em a
nd V
ehic
le S
peci
ficati
on
System Status ONOFF
System Action Status n/ a
Vehicle Characteristics Passenger carTruckBusmotorcycle
Interaction between Systems Interaction with other traffic information systems could be possible especially at HMI level.
Envi
ronm
enta
l Spe
cific
ation
s
Traffic Conditions A vulnerable road user following a trajectory potentially colliding with the ego-vehicle should be present. The ego-vehicle should get the information about the vulnerable road user trajectory from a cooperative communication (either an infrastructure, or another vehicle, or the vulnerable road user itself).
Environmental Situation "Pedestrian recognition may depend on cameras. As a consequence, different environment situations such as fog, rain, snow should be tested.However, driver ability to see a vulnerable road user may depend on visibility. As a consequence, this function may have a higher impact on safety when visibility is low."
Road Characteristics Road geometry can influence vulnerable road user recognition from the driver. As a consequence, roads with geometry (such as slope and curvature) which makes harder to have a good visibility may be the best candidate for showing this function effectiveness.
Geographical Characteristics Depending on the different countries, the density of vulnerable road users on the road and the road geometry can be different and impact the function performance.
Driv
er
Driver Specification Age, gender, experience, level of distraction and drowsiness should be considered.
Driver Status n/ a
Frequency rare
A.2.14 USE_CVIS_01
47

Use Case Name and Abbreviation KEY
USE_CVIS_01 UC_14
Connected Systems Connected Hypotheses
Parking Zone Management RQ_CVIS1RQ_CVIS2RQ_CVIS3
Description Parking Zone Management: The vehicle under test is driving with activated system.
Syst
em a
nd V
ehic
le
Spec
ifica
tion
System Status ONOFF
System Action Status Control via Road Side Unit or Control Centre
Vehicle Characteristics TruckVan
Interaction between Systems n/ a
Envi
ronm
enta
l Sp
ecifi
catio
ns
Traffic Conditions n/ a
Environmental Situation Source of information is bad visibility, slippery road, obstacles, and road works. Thus support is best under bad weather conditions.
Road Characteristics Urban parking zones and interurban rest areas
Geographical Characteristics Parking zones and resting areas
Driv
er Driver Specification normal sample of truck drivers
Driver Status n/ a
Frequency rare
48

A.2.15 USE_CVIS_02
Use Case Name and Abbreviation KEY
USE_CVIS_02 UC_15
Connected Systems Connected Hypotheses
City Guardian RQ_CVIS2
Description City Guardian: The vehicle under test is driving with activated system.
Syst
em a
nd V
ehic
le
Spec
ifica
tion
System Status ONOFF
System Action Status Control via Road Side Unit or Control Centre
Vehicle Characteristics TruckSpecial vehicles
Interaction between Systems n/ a
Envi
ronm
enta
l Sp
ecifi
catio
ns Traffic Conditions n/ a
Environmental Situation n/ a
Road Characteristics Tunnels, bridges, highway checkpoints
Geographical Characteristics Checkpoints at city entrance
Driv
er Driver Specification normal sample of truck drivers
Driver Status n/ a
Frequency rare
49

A.2.16 USE_CVIS_03
Use Case Name and Abbreviation KEY
USE_CVIS_03 UC_16
Connected Systems Connected Hypotheses
Speed Advice RQ_CVIS1RQ_CVIS2RQ_CVIS3RQ_CVIS6
Description Speed Advice: The vehicle under test is driving with activated system.
Syst
em a
nd V
ehic
le
Spec
ifica
tion
System Status ONOFF
System Action Status Control via Road Side Unit or Control Centre
Vehicle Characteristics Passenger vehicletruck
Interaction between Systems Interaction between local RSU based control and control centre
Envi
ronm
enta
l Sp
ecifi
catio
ns
Traffic Conditions n/ a
Environmental Situation Source of information is speed, travel times, and traffic jams. Thus support is best for heavy traffic.
Road Characteristics Road stretches with Variable Message Signs
Geographical Characteristics n/ a
Driv
er Driver Specification normal sample of driver population
Driver Status n/ a
Frequency rare
50

A.2.17 USE_CVIS_04
Use Case Name and Abbreviation KEY
USE_CVIS_04 UC_17
Connected Systems Connected Hypotheses
Traffic prioritization RQ_CVIS1RQ_CVIS3RQ_CVIS5RQ_CVIS6
Description Traffic prioritization: The vehicle under test is driving with activated system.
Syst
em a
nd V
ehic
le
Spec
ifica
tion
System Status ONOFF
System Action Status Control via Road Side Unit or Control Centre
Vehicle Characteristics Emergency vehiclepassenger vehicletruck
Interaction between Systems Interaction between local RSU based control and control centre information
Envi
ronm
enta
l Sp
ecifi
catio
ns
Traffic Conditions Other traffic members with activated system are necessary to get proper functionality
Environmental Situation n/ a
Road Characteristics System is useful in crowed and traffic jammed urban stretches of road
Geographical Characteristics urban areas with intersections equipped with traffic lights
Driv
er Driver Specification drivers of emergency vehicles and normal sample of drivers
Driver Status n/ a
Frequency rare
51
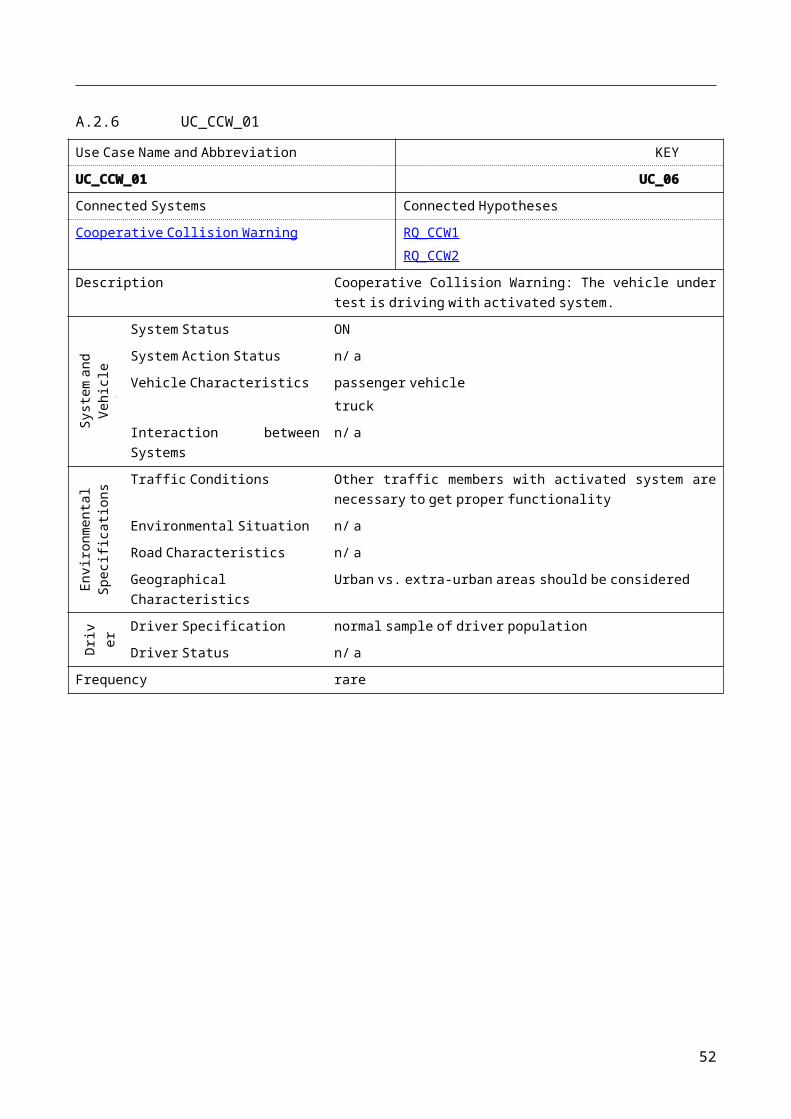
A.2.18 USE_CVIS_05
Use Case Name and Abbreviation KEY
USE_CVIS_05 UC_18
Connected Systems Connected Hypotheses
Dynamic allocation of lanes and road sections RQ_CVIS1RQ_CVIS3RQ_CVIS5RQ_CVIS6
Description Dynamic allocation of lanes and road sections: The vehicle under test is driving with activated system.
Syst
em a
nd V
ehic
le
Spec
ifica
tion
System Status ONOFF
System Action Status Control via Road Side Unit or Control Centre
Vehicle Characteristics Passenger vehicleTruckbus
Interaction between Systems Interaction between VMS and control centre information
Envi
ronm
enta
l Sp
ecifi
catio
ns
Traffic Conditions Other traffic members with activated system are necessary to get proper functionality
Environmental Situation n/ a
Road Characteristics System is useful in crowed and traffic jammed urban stretches of road
Geographical Characteristics urban areas with specific lanes for public transport
Driv
er Driver Specification sample of bus drivers and normal sample of drivers
Driver Status n/ a
Frequency rare
52

A.2.19 CV-UC-SP3.2-0017
Use Case Name and Abbreviation KEY
CV-UC-SP3.2-0017 UC_19
Connected Systems Connected Hypotheses
Informing driver about current speed limit RQ_CVIS2RQ_CVIS4
Description Informing driver about current speed limit: The vehicle under test is driving with activated system.
Syst
em a
nd V
ehic
le
Spec
ifica
tion
System Status ONOFF
System Action Status Control via Road Side Unit or Control Centre
Vehicle Characteristics Passenger vehicleTruckbus
Interaction between Systems Interaction among vehicle, traffic control centres, service centre
Envi
ronm
enta
l Sp
ecifi
catio
ns Traffic Conditions n/ a
Environmental Situation n/ a
Road Characteristics Application achieve better results on interurban roads and motorways
Geographical Characteristics Interurban roads and motorways
Driv
er Driver Specification normal sample of driver population
Driver Status n/ a
Frequency rare
53
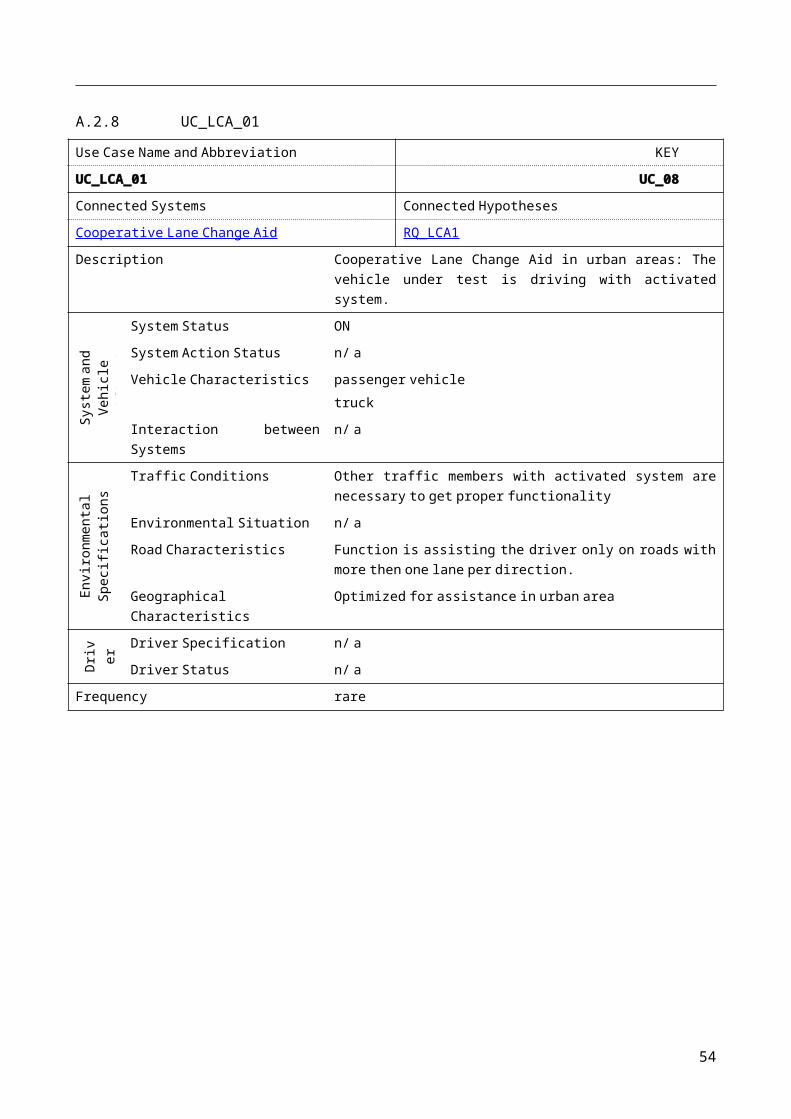
A.2.20 CV-UC-SP3.2-0011
Use Case Name and Abbreviation KEY
CV-UC-SP3.2-0011 UC_20
Connected Systems Connected Hypotheses
RQ_CVIS1RQ_CVIS2RQ_CVIS3RQ_CVIS7
Description On trip cooperation: The vehicle under test is driving with activated system.
Syst
em a
nd V
ehic
le
Spec
ifica
tion
System Status ONOFF
System Action Status Control via Road Side Unit or Control Centre
Vehicle Characteristics Passenger vehicleTruckbus
Interaction between Systems Interaction among vehicle, traffic control centres, service centre
Envi
ronm
enta
l Sp
ecifi
catio
ns Traffic Conditions n/ a
Environmental Situation n/ a
Road Characteristics Application achieve better results on interurban roads and motorways
Geographical Characteristics Interurban roads and motorways
Driv
er Driver Specification normal sample of driver population
Driver Status n/ a
Frequency rare
54
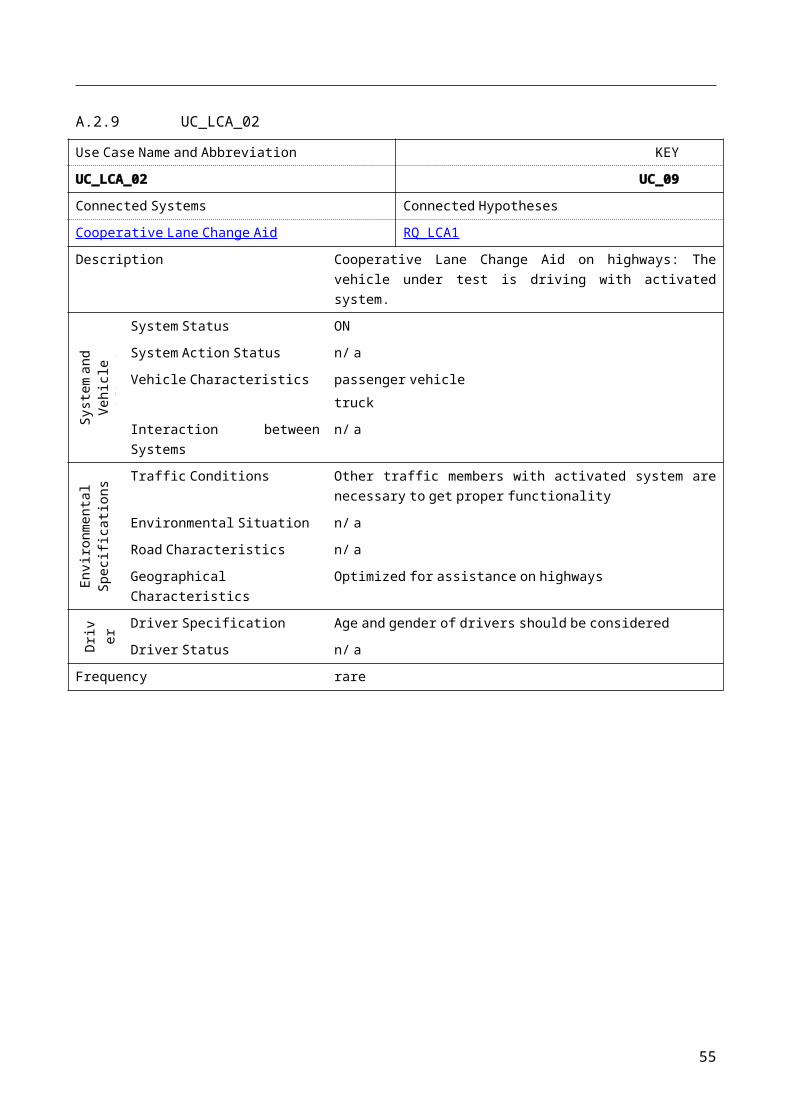
A.3 Research Questions and HypothesesHypothesis KEY
Approaching critical situation or obstacles driver is prepared to react. RQ_HW1
Related Research Question
Related System Hazard Warning
Related Use Case USE_COOPS_01
Proposed indicator approaching speed to critical situations or obstaclesBrake reaction time on critical situations or obstaclesBrake force on critical situations or obstacles is lower or is higher
Estim
ated
impa
ct o
n
Traffic Safety and safety related driving performance
+Less accidents, because drivers are prepared to react.
Environmental impacts + Less accidents lead to fewer accident related congestions,
resulting in less emmission.
Transport and traffic efficiency + Less accidents lead to fewer accident related congestions.
Usage, acceptance and trust
Hypothesis KEY
Driver is more relaxed RQ_HW2
Related Research Question
Related System Hazard Warning
Related Use Case USE_COOPS_01
Proposed indicator Workload
Estim
ated
impa
ct o
n
Traffic Safety and safety related driving performance
+Reduced workload enables better anticipation of irregular situations.
Environmental impacts
Transport and traffic efficiency
Usage, acceptance and trust + If the systems reduced workload, drivers are likely to accept
and trust it.
55

Hypothesis KEY
Driver is more incautious RQ_HW3
Related Research Question
Related System Hazard Warning
Related Use Case USE_COOPS_01
Proposed indicator approaching speed to critical situations or obstacles,Brake reaction time on critical situations or obstaclesBrake force on critical situations or obstacles is lower or is higher
Estim
ated
impa
ct o
n
Traffic Safety and safety related driving performance
-The driver expectation that he always will be warned for not for seen hazards could cause inattentive driving.
Environmental impacts
Transport and traffic efficiency
Usage, acceptance and trust
Hypothesis KEY
With system less time in traffic jams RQ_DFCD1
Related Research Question
Related System Decentralised Floating Car Data
Related Use Case USE_DFCD_0
Proposed indicator Quotient: estimated driving time at beginning / effective driving time is greater with DFCD then without DFCD or Quotient: estimated driving time at beginning / effective driving time is smaller with DFCD then without DFCD
Estim
ated
impa
ct o
n
Traffic Safety and safety related driving performance
Environmental impacts + The informed driver will spend less time driving from origin to
destination.
Transport and traffic efficiency + The fewer additional vehicles are part of a congestion, the
sooner it might break up.
Usage, acceptance and trust + Effective avoidance of congestions might lead to a high
acceptance of the system
56
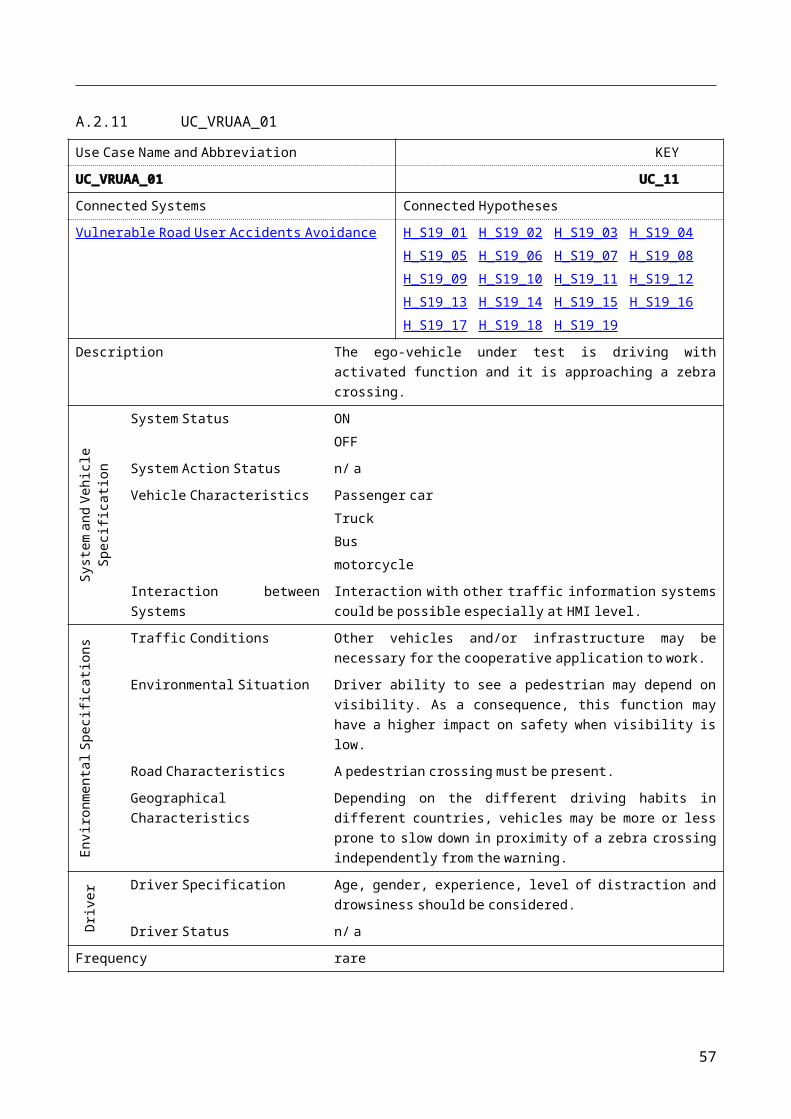
Hypothesis KEY
Driving with system is more relaxed RQ_DFCD2
Related Research Question
Related System Decentralised Floating Car Data
Related Use Case USE_DFCD_0
Proposed indicator Workload
Estim
ated
impa
ct o
n
Traffic Safety and safety related driving performance
+Driving is more relaxed, because the driver needs less attention finding the best route.
Environmental impacts
Transport and traffic efficiency
Usage, acceptance and trust + High acceptance is expected for a system providing means for
less stressful driving.
Hypothesis KEY
Total driving time is longer RQ_DFCD3
Related Research Question
Related System Decentralised Floating Car Data
Related Use Case USE_DFCD_0
Proposed indicator Quotient: estimated driving time at beginning / effective driving time is greater with DFCD then without DFCD or Quotient: estimated driving time at beginning / effective driving time is smaller with DFCD then without DFCD
Estim
ated
impa
ct o
n
Traffic Safety and safety related driving performance
Environmental impacts - If the information is not correct it might lead to a longer
driving time.
Transport and traffic efficiency - Increased travel times imply less efficient travel.
Usage, acceptance and trust - If a system results in considerable longer travel times, low
acceptance might be the result.
57
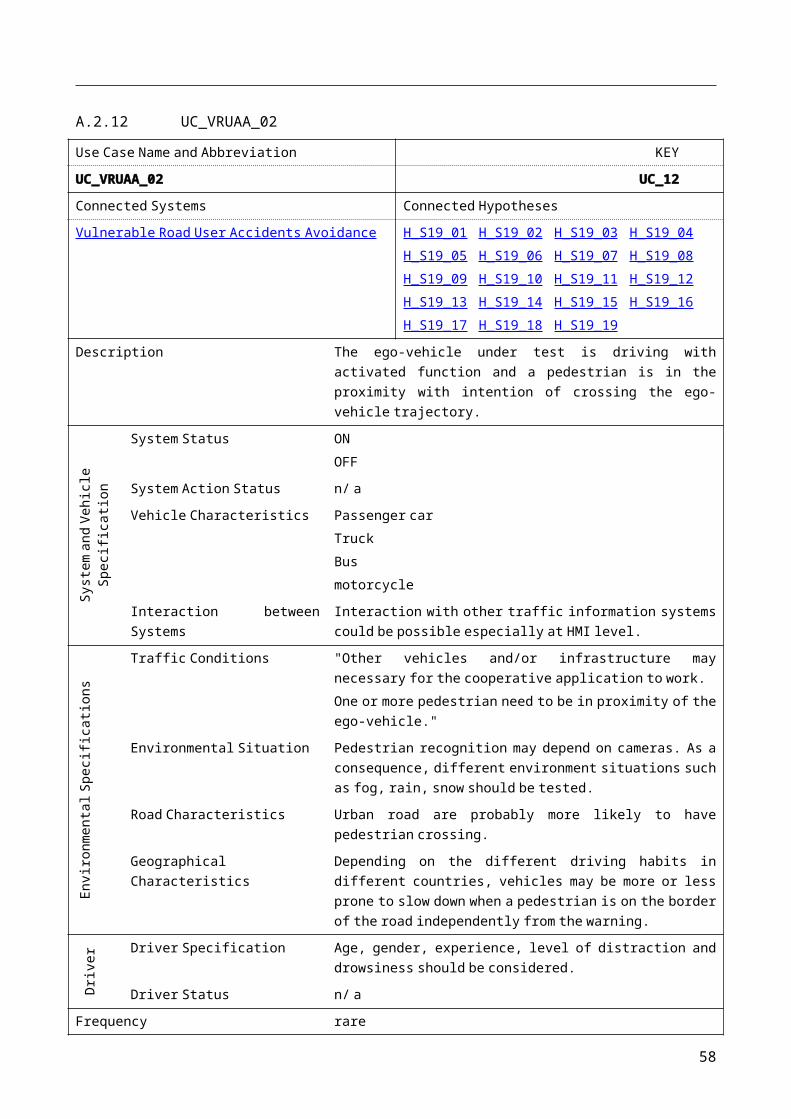
Hypothesis KEY
DFCD has no effect on driving time RQ_DFCD4
Related Research Question
Related System Decentralised Floating Car Data
Related Use Case USE_DFCD_0
Proposed indicator approaching speed to critical situations or obstaclesBrake reaction time on critical situations or obstacles Brake force on critical situations or obstacles is lower or is higher
Estim
ated
impa
ct o
n
Traffic Safety and safety related driving performance
Environmental impacts
Transport and traffic efficiency
Usage, acceptance and trust
Hypothesis KEY
Approaching critical situation driver is prepared to react. RQ_RIS1
Related Research Question
Related System Road Intersection Safety
Related Use Case USE_RIS_0
Proposed indicator approaching speed to critical situations or obstacles
Estim
ated
impa
ct o
n
Traffic Safety and safety related driving performance
+Less accidents, because drivers are prepared to react earlier.
Environmental impacts
Transport and traffic efficiency
Usage, acceptance and trust
58

Hypothesis KEY
Driver is more relaxed RQ_RIS2
Related Research Question
Related System Road Intersection Safety
Related Use Case USE_RIS_0
Proposed indicator Workload
Estim
ated
impa
ct o
n
Traffic Safety and safety related driving performance
+Reduced workload enables better anticipation of irregular situations.
Environmental impacts
Transport and traffic efficiency
Usage, acceptance and trust + If the systems reduced workload, drivers are likely to accept
and trust it.
Hypothesis KEY
Driver is always supported RQ_RIS3
Related Research Question
Related System Road Intersection Safety
Related Use Case USE_RIS_0
Proposed indicator
Estim
ated
impa
ct o
n
Traffic Safety and safety related driving performance
+Less accidents, because drivers is prepared to react.
Environmental impacts
Transport and traffic efficiency
Usage, acceptance and trust + If the systems reduced workload, drivers are likely to accept
and trust it.
59

Hypothesis KEY
This function will reduce the number of accidents and near accidents on overtaking manoeuvres. RQ_SO_1
Related Research Question
Related System
Related Use Case USE_SO_0
Proposed indicator
Estim
ated
impa
ct o
n
Traffic Safety and safety related driving performance
+Less accidents, because the driver will cancel overtaking manoeuvres in time.
Environmental impacts + Less accidents lead to less accident related congestions,
resulting in fewer emmissions
Transport and traffic efficiency + Less accidents lead to less accident related congestions,
resulting in lower travel time.
Usage, acceptance and trust
Hypothesis KEY
This function will reduce the number of road departure events. RQ_CW_1
Related Research Question
Related System Curve Warning
Related Use Case USE_CW_0
Proposed indicator
Estim
ated
impa
ct o
n
Traffic Safety and safety related driving performance
+Less accidents, because drivers will reduce speed.
Environmental impacts + Less accidents lead to less accident related congestions,
resulting in fewer emmissions
Transport and traffic efficiency + Less accidents lead to less accident related congestions,
resulting in lower travel time.
Usage, acceptance and trust
60

Hypothesis KEY
Cooperative Collision Warning system reduces the number or severity of accidents RQ_CCW1
Related Research Question
Related System Cooperative Collision Warning
Related Use Case UC_CCW_01
Proposed indicator
Estim
ated
impa
ct o
n
Traffic Safety and safety related driving performance
+Less severe accidents, because drivers is prepared to react.
Environmental impacts + Less severe accidents might lead to less severe congestions.
Transport and traffic efficiency + Less severe accidents might lead to less severe congestions,
resulting in less delay.
Usage, acceptance and trust
Hypothesis KEY
The driver will be alienated when he gets a collision warning where the obstacle is invisible. RQ_CCW2
Related Research Question
Related System Cooperative Collision Warning
Related Use Case UC_CCW_01
Proposed indicator
Estim
ated
impa
ct o
n
Traffic Safety and safety related driving performance
Environmental impacts
Transport and traffic efficiency
Usage, acceptance and trust - The driver might be confused when he gets a warning and he
does not understand the reason.
61

Hypothesis KEY
Cooperative Low Friction Warning system reduces the number or severity of accidents RQ_LFW1
Related Research Question
Related System Cooperative Low Friction Warning
Related Use Case UC_LFW_01
Proposed indicator
Estim
ated
impa
ct o
n
Traffic Safety and safety related driving performance
+Reduced number of accidents.
Environmental impacts + Less accidents lead to less accident related congestions,
resulting in fewer emmissions
Transport and traffic efficiency + Less accidents lead to less accident related congestions,
resulting in lower travel time.
Usage, acceptance and trust
Hypothesis KEY
Cooperative Lane Change Aid system reduces the number or severity of accidents RQ_LCA1
Related Research Question
Related System Cooperative Lane Change Aid
Related Use Case UC_LCA_01UC_LCA_02
Proposed indicator
Estim
ated
impa
ct o
n
Traffic Safety and safety related driving performance
+Reduced number of accidents.
Environmental impacts + Less accidents lead to less accident related congestions,
resulting in fewer emmissions
Transport and traffic efficiency + Less accidents lead to less accident related congestions,
resulting in lower travel time.
Usage, acceptance and trust
62

Hypothesis KEY
Continuously driving with Traffic Light and Traffic Flow Information reduces travel time and fuel consumption
RQ_TLFI1
Related Research Question
Related System Traffic Light and Traffic Flow Information
Related Use Case UC_TLFI_01
Proposed indicator
Estim
ated
impa
ct o
n
Traffic Safety and safety related driving performance
+Reduced travel time reduces exposure to risk of having an accident.
Environmental impacts + Reduced CO2 emission.
Transport and traffic efficiency + Reduced travel time
Usage, acceptance and trust
Hypothesis KEY
This function will decrease the number of incidents and accidents between vulnerable road users and vehicles.
H_S19_01
Related Research Question
Related System Vulnerable Road User Accidents Avoidance
Related Use Case UC_VRUAA_01UC_VRUAA_02UC_VRUAA_03
Proposed indicator Number of incidents and accidents from questionnaires, police reports, and video analysis.
Estim
ated
impa
ct o
n
Traffic Safety and safety related driving performance
+ Reduced number of accidents that involve vulnerable road users
Environmental impacts
Transport and traffic efficiency
Usage, acceptance and trust + or -
Will be either a plus or minus depending on the level of missed and/or false alarms, which are critical parameters especially in urban context where the number of vulnerable road users is high and not all of them are to be identified as a potential risk.
63
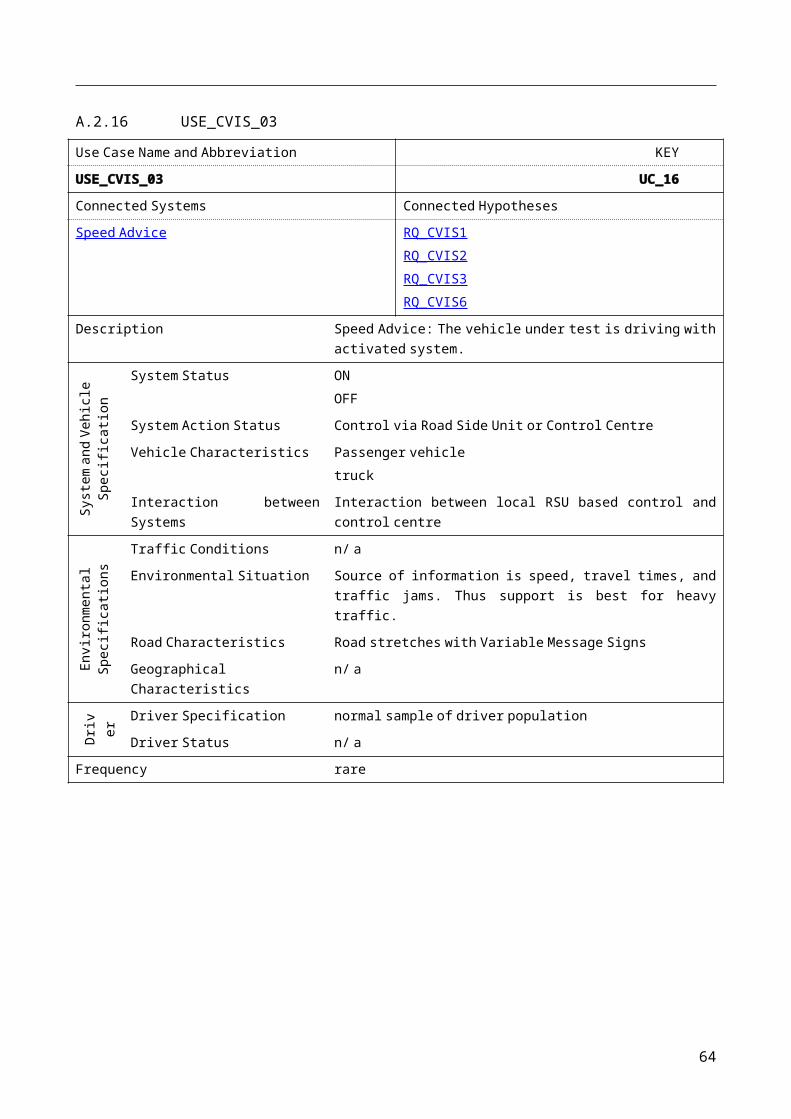
Hypothesis KEY
This function will decrease vehicle speed when a warning is issued. H_S19_02
Related Research Question
Related System Vulnerable Road User Accidents Avoidance
Related Use Case UC_VRUAA_01UC_VRUAA_02UC_VRUAA_03
Proposed indicator Mean spot speed, Mean speed
Estim
ated
impa
ct o
n
Traffic Safety and safety related driving performance
+Reduced number of accidents.
Environmental impacts + Reduced mean speed reduces emmission
Transport and traffic efficiency + Reduced mean speed results in higher usage of the available
capacity of road networks
Usage, acceptance and trust
Hypothesis KEY
This function impact will be higher in urban road and where road geometry and environment conditions impair visibility.
H_S19_03
Related Research Question
Related System Vulnerable Road User Accidents Avoidance
Related Use Case UC_VRUAA_01UC_VRUAA_02UC_VRUAA_03
Proposed indicator Mean spot speed
Estim
ated
impa
ct o
n
Traffic Safety and safety related driving performance
+Reduced number of accidents.
Environmental impacts
Transport and traffic efficiency
Usage, acceptance and trust
64

Hypothesis KEY
This function will increase awareness of pedestrian crossing risk in specific locations, thus inducing the driver to slow down even without a warning in these locations.
H_S19_04
Related Research Question
Related System Vulnerable Road User Accidents Avoidance
Related Use Case UC_VRUAA_01UC_VRUAA_02UC_VRUAA_03
Proposed indicator Mean spot speed, Number of incidents and accidents
Estim
ated
impa
ct o
n
Traffic Safety and safety related driving performance
+Reduced number of accidents.
Environmental impacts
Transport and traffic efficiency
Usage, acceptance and trust
Hypothesis KEY
This function will increase driver reliance on the function and increase risk of incidents/accidents with vulnerable users when missing to warn the driver or not available.
H_S19_05
Related Research Question
Related System Vulnerable Road User Accidents Avoidance
Related Use Case UC_VRUAA_01UC_VRUAA_02UC_VRUAA_03
Proposed indicator Mean spot speed, Number of incidents and accidents
Estim
ated
impa
ct o
n
Traffic Safety and safety related driving performance
+Reduced number of accidents.
Environmental impacts
Transport and traffic efficiency
Usage, acceptance and trust
65
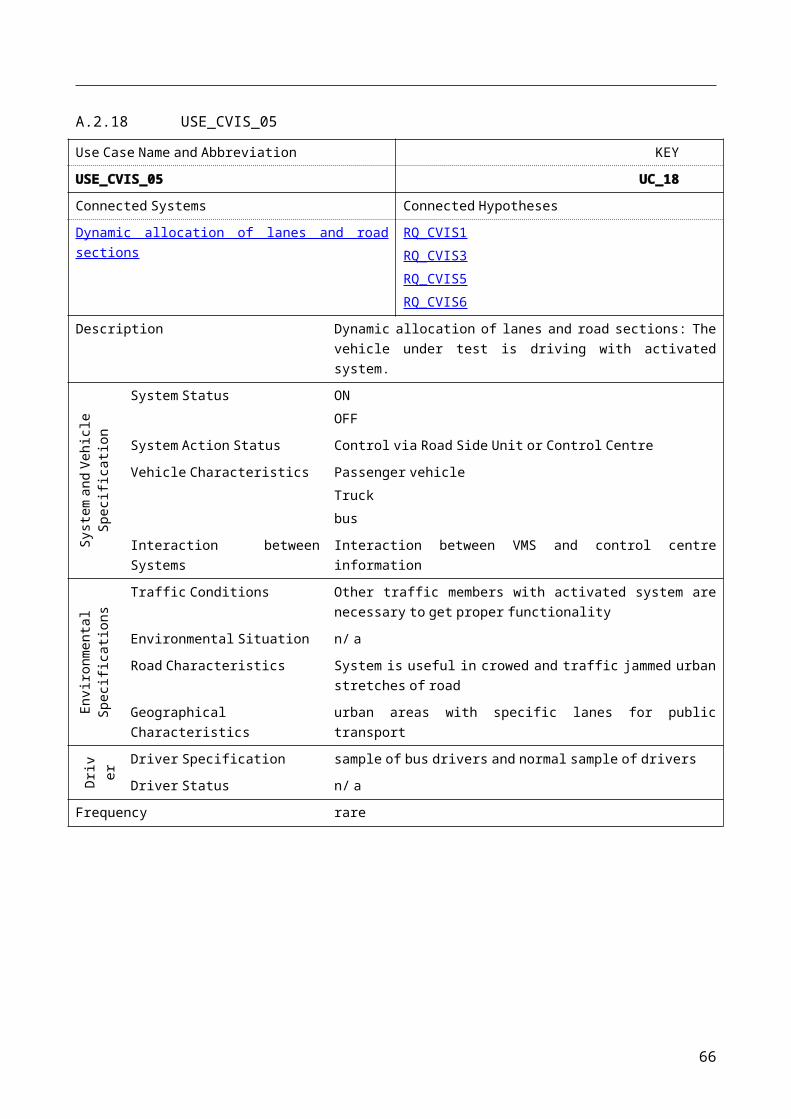
Hypothesis KEY
This function will increase driver load by augmenting the amount of HMI information H_S19_06
Related Research Question
Related System Vulnerable Road User Accidents Avoidance
Related Use Case UC_VRUAA_01UC_VRUAA_02UC_VRUAA_03
Proposed indicator Workload
Estim
ated
impa
ct o
n
Traffic Safety and safety related driving performance
-The function might increase the risk of accidents especially in situations with high workload.
Environmental impacts
Transport and traffic efficiency
Usage, acceptance and trust -
Increased amount of information might lead to information overflow for the driver, resulting in reduced acceptance of the overall vehicle system.
Hypothesis KEY
This function impact will be higher when the driver is not alert or is drowsy. H_S19_07
Related Research Question
Related System Vulnerable Road User Accidents Avoidance
Related Use Case UC_VRUAA_01UC_VRUAA_02UC_VRUAA_03
Proposed indicator Driver alertness
Estim
ated
impa
ct o
n
Traffic Safety and safety related driving performance
+Reduced number of accidents.
Environmental impacts
Transport and traffic efficiency
Usage, acceptance and trust
66

Hypothesis KEY
This function will influence the driver route planning: the driver may decide to avoid roads where vulnerable road users are often crossing.
H_S19_08
Related Research Question
Related System Vulnerable Road User Accidents Avoidance
Related Use Case UC_VRUAA_01UC_VRUAA_02UC_VRUAA_03
Proposed indicator Route from GPS, Route from GPS, Questionnaire
Estim
ated
impa
ct o
n
Traffic Safety and safety related driving performance
+Reduced number of accidents.
Environmental impacts - Function might lead to longer travel routes and higher travel
time, increasing emmisions.
Transport and traffic efficiency -
Function might lead to longer travel routes and higher travel time, increasing the time in traffic and hence the usage of the traffic system
Usage, acceptance and trust
Hypothesis KEY
This function will be turned off in urban roads because too annoying. H_S19_09
Related Research Question
Related System Vulnerable Road User Accidents Avoidance
Related Use Case UC_VRUAA_01UC_VRUAA_02UC_VRUAA_03
Proposed indicator Questionnaire, Function activation
Estim
ated
impa
ct o
n
Traffic Safety and safety related driving performance
Environmental impacts
Transport and traffic efficiency
Usage, acceptance and trust - Function will not be used.
67

Hypothesis KEY
Vulnerable users will start to rely on the vehicles stopping because using this function and pay less attention while crossing.
H_S19_10
Related Research Question
Related System Vulnerable Road User Accidents Avoidance
Related Use Case UC_VRUAA_01UC_VRUAA_02UC_VRUAA_03
Proposed indicator Number of read-end incidents from videos, Indicator for over-reliance
Estim
ated
impa
ct o
n
Traffic Safety and safety related driving performance
-Higher accident risk.
Environmental impacts
Transport and traffic efficiency
Usage, acceptance and trust - Misuse from the vulnerable road users.
Hypothesis KEY
Car not equipped with this function will be annoyed by the equipped-car slowing down and try to pass when not safe or drive more aggressively.
H_S19_11
Related Research Question
Related System Vulnerable Road User Accidents Avoidance
Related Use Case UC_VRUAA_01UC_VRUAA_02UC_VRUAA_03
Proposed indicator Acceleration and GPS from following vehicles.
Estim
ated
impa
ct o
n
Traffic Safety and safety related driving performance
-Unneccessary and dangerous overtaking maneuvres at pedestrian crossings
Environmental impacts
Transport and traffic efficiency
Usage, acceptance and trust - Inadequate behaviour change of users with not equipped cars.
68

Hypothesis KEY
This function will have a higher penetration among drivers who often use the road as vulnerable road users or have relatives who are normally vulnerable road users.
H_S19_12
Related Research Question
Related System Vulnerable Road User Accidents Avoidance
Related Use Case UC_VRUAA_01UC_VRUAA_02UC_VRUAA_03
Proposed indicator
Estim
ated
impa
ct o
n
Traffic Safety and safety related driving performance
+High penetration of equipped vehicles on roads with high pedestrain densitiy
Environmental impacts
Transport and traffic efficiency
Usage, acceptance and trust
Hypothesis KEY
This function will have a higher penetration for small trucks who often deliver in urban areas. H_S19_13
Related Research Question
Related System Vulnerable Road User Accidents Avoidance
Related Use Case UC_VRUAA_01UC_VRUAA_02UC_VRUAA_03
Proposed indicator
Estim
ated
impa
ct o
n
Traffic Safety and safety related driving performance
+High penetration of equipped vehicles on roads with high pedestrain densitiy
Environmental impacts
Transport and traffic efficiency
Usage, acceptance and trust
69

Hypothesis KEY
This function will increase the probability of traffic jams especially during rush hours in city centres.
H_S19_14
Related Research Question
Related System Vulnerable Road User Accidents Avoidance
Related Use Case UC_VRUAA_01UC_VRUAA_02UC_VRUAA_03
Proposed indicator Mean speed in traffic flow,
Estim
ated
impa
ct o
n
Traffic Safety and safety related driving performance
Environmental impacts
Transport and traffic efficiency - Reduced traffic efficiency.
Usage, acceptance and trust
Hypothesis KEY
This function will increase the probability of rear-end incidents. H_S19_15
Related Research Question
Related System Vulnerable Road User Accidents Avoidance
Related Use Case UC_VRUAA_01UC_VRUAA_02UC_VRUAA_03
Proposed indicator Number of read-end incidents from videos,
Estim
ated
impa
ct o
n
Traffic Safety and safety related driving performance
+Higher accident risk.
Environmental impacts
Transport and traffic efficiency
Usage, acceptance and trust
70

Hypothesis KEY
This function will be more useful for elderly drivers than for young drivers. H_S19_16
Related Research Question
Related System Vulnerable Road User Accidents Avoidance
Related Use Case UC_VRUAA_01UC_VRUAA_02UC_VRUAA_03
Proposed indicator Questionnaire
Estim
ated
impa
ct o
n
Traffic Safety and safety related driving performance
+Support for elderly driver to preceive the surrounding traffic situation.
Environmental impacts
Transport and traffic efficiency
Usage, acceptance and trust
Hypothesis KEY
This function will decrease the probability of distraction in urban roads. H_S19_17
Related Research Question
Related System Vulnerable Road User Accidents Avoidance
Related Use Case UC_VRUAA_01UC_VRUAA_02UC_VRUAA_03
Proposed indicator Driver alertness
Estim
ated
impa
ct o
n
Traffic Safety and safety related driving performance
-Higher accident risk.
Environmental impacts
Transport and traffic efficiency
Usage, acceptance and trust
71

Hypothesis KEY
This function will be more useful in bad weather or low visibility conditions. H_S19_18
Related Research Question
Related System Vulnerable Road User Accidents Avoidance
Related Use Case UC_VRUAA_01UC_VRUAA_02UC_VRUAA_03
Proposed indicator Mean spot speed, Weather conditions
Estim
ated
impa
ct o
n
Traffic Safety and safety related driving performance
+Support for drivers to preceive the surrounding traffic situation.
Environmental impacts
Transport and traffic efficiency
Usage, acceptance and trust
Hypothesis KEY
This function will be more useful for busses than for trucks and cars. H_S19_19
Related Research Question
Related System Vulnerable Road User Accidents Avoidance
Related Use Case UC_VRUAA_01UC_VRUAA_02UC_VRUAA_03
Proposed indicator Questionnaire
Estim
ated
impa
ct o
n
Traffic Safety and safety related driving performance
+Support for drivers to preceive the surrounding traffic situation, especially in the are of bus stops with a high pedestrian density
Environmental impacts
Transport and traffic efficiency
Usage, acceptance and trust
72
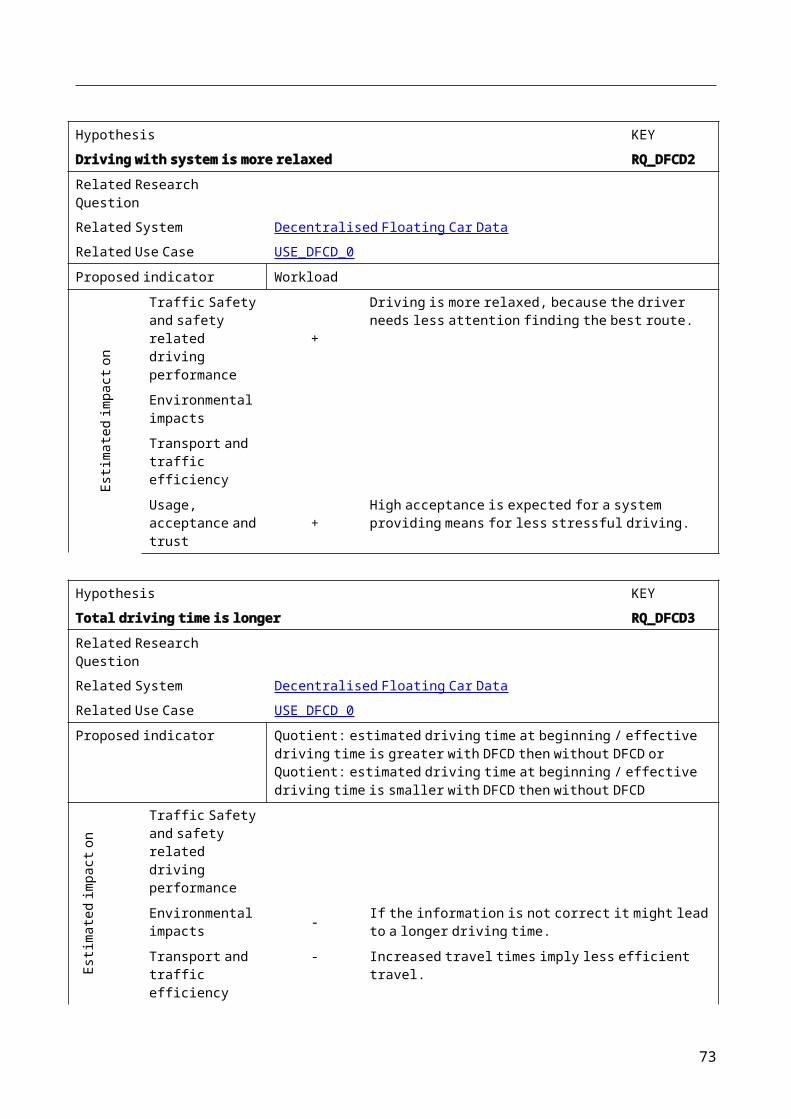
Hypothesis KEY
Vehicles equipped with this function are less time in traffic RQ_CVIS1
Related Research Question
Related System Parking Zone ManagementSpeed AdviceTraffic prioritizationDynamic allocation of lanes and road sections
Related Use Case USE_CVIS_01USE_CVIS_03USE_CVIS_04USE_CVIS_05CV-UC-SP3.2-0011
Proposed indicator
Estim
ated
impa
ct o
n
Traffic Safety and safety related driving performance
+Less exposure to traffic means less probablity to have an accident
Environmental impacts + Reduced CO2 emission.
Transport and traffic efficiency + More efficient use of the traffic systems
Usage, acceptance and trust
73

Hypothesis KEY
The driver is more relaxed when such a system is installed RQ_CVIS2
Related Research Question
Related System Parking Zone ManagementCity GuardianSpeed AdviceInforming driver about current speed limit
Related Use Case USE_CVIS_01USE_CVIS_02USE_CVIS_03CV-UC-SP3.2-0017CV-UC-SP3.2-0011
Proposed indicator Workload
Estim
ated
impa
ct o
n
Traffic Safety and safety related driving performance
+Reduced workload enables better anticipation of irregular situations.
Environmental impacts
Transport and traffic efficiency
Usage, acceptance and trust
74

Hypothesis KEY
The driver can calculate a more reliable time of arrival RQ_CVIS3
Related Research Question
Related System Parking Zone ManagementTraffic prioritizationDynamic allocation of lanes and road sections
Related Use Case USE_CVIS_01USE_CVIS_03USE_CVIS_04USE_CVIS_05CV-UC-SP3.2-0011
Proposed indicator approaching speed to critical situations or obstacles
Estim
ated
impa
ct o
n
Traffic Safety and safety related driving performance
+
Environmental impacts
Transport and traffic efficiency
Usage, acceptance and trust +
Hypothesis KEY
Reduction of possible traffic accidents RQ_CVIS4
Related Research Question
Related System Informing driver about current speed limit
Related Use Case CV-UC-SP3.2-0017
Proposed indicator
Estim
ated
impa
ct o
n
Traffic Safety and safety related driving performance
+Less accidents, because drivers will reduce speed.
Environmental impacts
Transport and traffic efficiency
Usage, acceptance and trust
75

Hypothesis KEY
Driver is prepared to react by approaching of prioritized vehicles RQ_CVIS5
Related Research Question
Related System Traffic prioritizationDynamic allocation of lanes and road sections
Related Use Case USE_CVIS_04USE_CVIS_05
Proposed indicator
Estim
ated
impa
ct o
n
Traffic Safety and safety related driving performance
+Less accidents, because drivers are prepared to react.
Environmental impacts
Transport and traffic efficiency
Usage, acceptance and trust
Hypothesis KEY
Increased traffic throughput RQ_CVIS6
Related Research Question
Related System Speed AdviceTraffic prioritizationDynamic allocation of lanes and road sections
Related Use Case USE_CVIS_03USE_CVIS_04USE_CVIS_05
Proposed indicator
Estim
ated
impa
ct o
n
Traffic Safety and safety related driving performance
Environmental impacts 0
Using the available capacity more efficient means less emission per vehicle, but might also result in higher overall emmisions, since more traffic might be induced
Transport and traffic efficiency + Higher traffic efficiency.
Usage, acceptance and trust
76

Hypothesis KEY
Additional information while driving/ travelling may change drivers route planning RQ_CVIS7
Related Research Question
Related System
Related Use Case CV-UC-SP3.2-0011
Proposed indicator
Estim
ated
impa
ct o
n
Traffic Safety and safety related driving performance
Environmental impacts
Transport and traffic efficiency + Higher traffic efficiency.
Usage, acceptance and trust
77


