Fetal Size in a Rural Melanesian Population with Minimal Risk Factors for Growth Restriction:
An Observational Ultrasound Study from Papua New Guinea
Holger W. Unger,† Stephan Karl,† Regina A. Wangnapi, Peter Siba, Glen Mola, Jane Walker, Ivo Mueller,Maria Ome, and Stephen J. Rogerson*
Department of Medicine, Royal Melbourne Hospital, University of Melbourne, Parkville, Australia; Walter and Eliza Hall Institute (WEHI),Parkville, Australia; Papua New Guinea Institute of Medical Research, Goroka, Papua New Guinea; Department of Obstetrics and Gynaecology,
University of Papua New Guinea, Port Moresby, Papua New Guinea; Royal Infirmary of Edinburgh, Edinburgh, United Kingdom;Barcelona Centre for International Health Research (CRESIB), Barcelona, Spain
Abstract. We conducted a prospective longitudinal study of fetal size in rural Papua New Guinea (PNG) involving439 ultrasound-dated singleton pregnancies with no obvious risk factors for growth restriction. Sonographically estimatedfetal weights (EFWs; N = 788) and birth weights (N = 376) were included in a second-order polynomial regression model(optimal fit) to generate fetal weight centiles. Means for specific fetal biometric measurements were also estimated. Fetalweight centiles from a healthy PNG cohort were consistently lower than those derived from Caucasian and Congolesepopulations, which overestimated the proportion of fetuses measuring small for gestational age (SGA; < 10th centile).Tanzanian and global reference centiles (Caucasian weight reference adapted to our PNG cohort) were more similar tothose observed in our cohort, but the global reference underestimated SGA. Individual biometric measurements did notdiffer significantly from other cohorts. In rural PNG, a locally derived nomogram may be most appropriate for detectionof SGA fetuses.
INTRODUCTION
Fetal growth and size differ between populations depend-ing on their ethnic composition, socioeconomic status, andgeographical location,1,2 and the importance of each factoris subject to ongoing debate.3,4 The International Fetal andNewborn Growth Consortium (INTERGROWTH)-21 studyassesses fetal growth in cohorts with no obvious risk factorsfor fetal growth restriction (FGR) in eight geographical areas,including Kenya and India, with the aim of developing globalstandards for optimal fetal growth.5
The most commonly used ultrasound-estimated fetalweight (EFW), birth weight (BW), and size reference charts(nomograms) are derived from industrialized and largelyCaucasian populations,6–9 and they may not be appropriatein all populations1; particularly, their ability to accuratelydetect FGR may be limited.10 A definitive diagnosis of FGRis made when serial ultrasound scans show a persistent down-ward deviation from the expected growth trajectory. In devel-oping countries, limited availability means that most pregnantwomen will have only one growth scan (if any). An EFWbelow the 10th centile on first scan (defined as small forgestational age [SGA]) indicates that the fetus is either con-stitutionally small or indeed, suffers from FGR.11 Detectionof SGA fetuses will identify pregnancies at risk of FGR andadverse pregnancy outcomes, including low BW and perinataldeath, permitting interventions to be delivered before mor-bid placental insufficiency leads to irreversible or terminalfetal compromise.The use of weight centiles derived from Caucasian popula-
tions may overestimate the number of fetuses who areSGA.1,12,13 This could result in unnecessary intervention for alarge number of pregnancies rather than targeting those fetusesthat are truly growth-restricted, a disadvantageous scenario forlow-income countries with strained health services. To over-
come this problem, either currently available nomogramsshould be adjusted to local conditions, or fetal growth stan-dards should be derived from the relevant populations.1,12,13
Similar to the INTERGROWTH-21 collaboration, thisstudy evaluated fetal growth in rural Melanesian populationsto generate a regional fetal weight reference, which was sub-sequently compared with charts derived from other popula-tions. We also compared individual biometric parameterswith reference values published for other populations.
MATERIALS AND METHODS
Study setting and population. This prospective longitudinalcohort study was designed to monitor fetal growth in an eth-nic Melanesian population with uncomplicated term pregnan-cies to generate a population-specific weight chart. Theresearch was conducted from November of 2009 to Februaryof 2013 at six health facilities in Madang Province in coastalPapua New Guinea (PNG). An enrollment chart is given inFigure 1. Briefly, women with singleton pregnancies < 25 ges-tational weeks (GWs) by clinical gestational assessment(including ultrasound confirmation) with no known comor-bidities and absence of fetal abnormality on scan who wereavailable for follow-up scans and delivery at a participatinghealth facility were invited to join the study. All participantswere simultaneously enrolled in a randomized clinical trialinvestigating the impact of intermittent preventive treatmentin pregnancy with azithromycin (AZ) and sulphadoxine-pyrimethamine (SP) on BW (Figure 1).14 Women were pro-vided with insecticide-treated bed nets at recruitment andreceived either a single treatment course of SP and chloro-quine or up to three monthly courses of SP-AZ.To generate a cohort of healthy pregnancies for this ultra-
sound study, women were subsequently excluded if theirpregnancy outcome was unknown (lost to follow-up) or theirpregnancy was complicated by factors known to affectgrowth, including intrauterine fetal death, pre-term delivery(< 37 GW), hypertensive disorders of pregnancy, severe protein-energy undernutrition, severe anemia (hemoglobin < 7 g/dL
*Address correspondence to Stephen J. Rogerson, Post Office, RoyalMelbourne Hospital, Parkville, VIC 3051, Australia. E-mail:[email protected]†These authors contributed equally.
178
at any stage during pregnancy), syphilis, malaria, and smoking.Protein-energy malnutrition was defined as a mid-upper armcircumference < 22 cm, syphilis was defined as a positive Trep-onema pallidum hemagglutination test (TPHA) (Syphicheck-WB; Qualpro Diagnostics, Verna, Goa, India) and reactiverapid plasma reagin test (RPR) (irrespective of titer) at pre-natal booking, and malaria was defined as the presence ofmalaria parasites detected by light microscopy on a standardperipheral blood smear at any stage during pregnancy. Data onmaternal human immunodeficiency virus (HIV) infection wasunavailable: prevalence at the provincial hospital prenatal clinicwas 1.1% during the study period. Testing for gestational dia-betes was only undertaken if clinically suspected by hospitalstaff. Clinical and demographic data were collected at recruit-ment, at subsequent scheduled clinical trial visits, and duringunscheduled morbidity visits. At delivery, infant sex was docu-mented, and BWs were measured using an electronic scale(Cupid 1; Charder Medical, Taichung City, Taiwan; precisionto 10 g). Weight measurements were excluded from analysesif collected > 24 hours postpartum.
Ethics. All women provided informed consent. Ethicalapproval for this research protocol and the parent clinical trialwas obtained from the Institutional Review Board of thePNG Institute of Medical Research, the PNG MedicalResearch Advisory Council, and the Melbourne Health HumanResearch Ethics Committee. Details of the clinical trial aredescribed elsewhere.14
Ultrasound assessment. Participants were encouraged toattend three scan visits (at enrollment, late second trimester,and mid-third trimester) and deliver at a participating healthfacility. This design attempted to strike a balance betweenadequately covering fetal growth from the second trimesteruntil delivery and accommodating the participant’s sociogeo-graphical situation. Most participants lived rurally at consid-erable distances from participating clinics and found itdifficult to attend more than two times. Only a small numberof EFWs were collected at term.Ultrasound examinations were undertaken by two clini-
cians trained in obstetric ultrasound and fetal biometry(H.W.U. and M.O.) using a portable ultrasound scanner
Figure 1. Flow chart of participants in the ultrasound study (Madang Province, PNG, 2009–2013). IPTp = intermittent preventive treatmentin pregnancy.
FETAL SIZE IN RURAL PAPUA NEW GUINEA 179
with a 2- to 5-MHz convex abdominal probe (Logiqbook XP;General Electric Medical Systems, Hatfield, Hertfordshire,United Kingdom). Still images of all measurements were storedand managed using K-Pacs viewing software, version 1.6. Thefetal biometric parameters crown-rump length (CRL), abdomi-nal circumference (AC), head circumference (HC), and femurlength (FL) were measured.15,16 The average of two measure-ments (three for CRL) was used when available. AC wasmeasured using the ellipse facility (extreme perimeter of a well-magnified circular section) in images that displayed a lateralspine, a short segment of the umbilical vein in the anterior third,and the stomach bubble.17 HC was evaluated using the ellipsefacility of the ultrasound machine (outer border of fetal skull)from adequately magnified still images of horizontally placedhead views that were oval in shape and symmetrical with a cen-trally positioned falx cerebri and adequate views of the thalamusand cavum septum pellucidum.17 FL was measured fromadequately magnified horizontal stills and only included theossified diaphysis.17
At the first ultrasound visit, gestational age (GA) in dayswas estimated in accordance with the British Medical Ultra-sound Society guidelines using dating standards derived froma Caucasian population.15 When available, CRL measure-ments were used to estimate GA until 75 mm (13 GW +4 days).16 In the second trimester, GA was estimated usingthe HC (FL if HC unavailable) until 24 GW + 6 days.15 Thebiparietal diameter was not used for dating or growth assess-ments.18 Measurements from enrollment scans were used todefine GA. Dating standards for Melanesian populations areunavailable. However, research suggests that variation in fetalgrowth because of ethnic differences may be minimal untilmid-second trimester,19,20 although this is not a unanimousfinding.21,22 Recall and reporting of last menstrual period andcharacteristics of menstrual cycles were often unreliable inour cohort, precluding corroboration of these dates by sono-graphic GA estimation. Despite considerable efforts toencourage early presentation, few women presented < 14GW: late presentation to prenatal clinic is common in PNG.23
EFWs in grams were calculated from the combination ofAC, HC, and FL measurements using the Hadlock formula:log10 (EFW) = 1.326 – 0.00326 + AC + FL + 0.0107 + HC +0.0438 + AC + 0.158 + FL.24 Where acceptable head mea-surements were unavailable, we used the alternative formula,log10 (EFW) = 1.304 + 0.05281 +AC + 0.1938 + FL – 0.004 +AC + FL, which was also derived by Hadlock and others.24
We assessed performance of the Hadlock formula to predictactual BW in our cohort by adopting two methods (termed Aand B) previously described by Schmiegelow and others13
given that the number of women who underwent a scan atterm in our cohort was equally small. Method A estimatedBW by extrapolating from the last available EFW value andassuming a weight gain of 24.2 g per day from mid-secondtrimester.25 Method B adopted the proportionality formulaby Mongelli and Gardosi26 using median weight estimates forour population from adjusted Hadlock charts derived as perthe work by Mikolajczyk and others.1 Our PNG-adjustedglobal reference was based on BW measurements from 108newborns delivered at 40 GW + 0 days – 40 GW + 6 days witha mean BW of 3,122 g and an SD of 10.9%, which wasassumed constant for any given GA.1 Of note, these newbornswere also part of this ultrasound cohort. Prediction assess-ments were undertaken using EFWs measured within 60 days
of BW measurement only. Estimated and actual BWswere normally distributed, allowing for calculation of themean percentage difference and analysis as per Bland andAltman.27 Estimated BWs were not used for developmentof the fetal weight nomogram.Interobserver variability was assessed by comparing mea-
surements taken from 10 randomly selected fetuses, andissues regarding measurement precision were addressed.A random selection of image stills (approximately 10% ofeach measurement) underwent external quality control byan obstetric radiologist based at the Royal Infirmary ofEdinburgh (J.W.): 92.5% of images fulfilled the criteria forinclusion in subsequent analyses.15 A sample size calculationwas not performed for this substudy, because the cohort sizewas determined by the number of healthy women presentingat an appropriate gestation and the availability of scanningequipment and trained personnel.Data analyses. Data were double-entered into FoxPro, ver-
sion 9.0 (Microsoft, Redmond, WA). Statistical analyses wereperformed using Stata, version 12.0 (StataCorp, CollegeStation, TX) andMathematica, version 9.0 (WolframResearch,Champaign, IL). Charts and graphs were generated usingMathematica and Prism, version 6.0 (GraphPad Software,La Jolla, CA).Bland and Altman27 methods of analysis were used to com-
pare measured BW with extrapolated estimates (methods Aand B described above). In short, the differences of BWestimates derived by either method and the measured BWswere plotted over their averages.27 Mean percentage differ-ence and 95% confidence levels of agreement were derived.The fetal weight nomogram was a hybrid chart developedfrom both EFW and observed BW. In brief, EFW/BW valueswere transformed to their decadic logarithms, which werenormally distributed. Logarithmic EFW/BW fit very wellto a second-order polynomial function of GA (R2 > 0.99).Residual errors (raw and studentized) from the fit of theregression model were plotted against GA and assessed fornormality of distribution.The 10th, 50th, and 90th fetal weight centiles for GWs 25–
40 derived from our cohort were compared with those derivedfrom Caucasian, Congolese, and Tanzanian populations6,12,13
as well as PNG-adjusted global reference centiles as per thework by Mikolajczyk and others.1 Growth curves weresuperimposed, and percentage differences for the 10th, 50th,and 90th centiles were plotted. We compared the proportionof newborns with a BW measurement and GA £ 40 GWs thatwould be categorized as SGA for each reference chart.Additional analyses included a comparison of AC, FL, and
HC sizes in our population with fetal size references from anurban PNG population,28 a Hong Kong Chinese population,2
and two European (largely Caucasian) populations.7–9,29 Forthis analysis, we selected a cross-sectional sample (one mea-surement per fetus) from the overall number of sonographicmeasurements taken in the participant population. Sampleswere selected such that the number of observations was maxi-mally dispersed over gestation to enable the best possible dis-tribution of values for statistical analysis. We opted for thisapproach given that calibration of an adequate multilevelmodel to account for within-subject variation would requiremore than three measurements per fetus.30 Third-order poly-nomials were fitted to the fetal biometry indices as described inprevious studies.2,29 Confidence bands were derived by fitting
180 UNGER, KARL AND OTHERS
quadratic models to the SDs observed at each GW. Z scoresper GWwere calculated using the 50th centiles from aforemen-tioned published reference populations (urban PNG, Chinese,French, and United Kingdom) and plotted together with themean and SD derived from our model for comparison.2,29
RESULTS
Of 727 women enrolled, 288 women were excluded, becausethey experienced at least one condition that could haveaffected fetal growth or had incomplete data for adequatefetal size estimation, leaving 439 singleton fetuses for analysis(Figure 1). Participants underwent a total of 810 scans, and376 newborns had their weight measured within 24 hours ofdelivery. Maternal and newborn characteristics are shown inTable 1. Notably, 50% of women were primigravidae. Two-thirds of women (275 of 439) underwent two or more ultra-sound scans, with a mean of 69 days (SD ± 30.7; range = 7–168)between scans. The Hadlock formula predicted actual BWmoderately well. The mean absolute prediction error (meanpercentage difference) of estimated BW compared withobserved BW was 217 (8.4%) and 284 g (10.3%) for methodsA and B, respectively, with the estimated BW overestimatingactual BW (Supplemental Figure 1). The estimated BW waswithin ± 15% of actual BW for 70.8% (method A) and 64.1%(method B) of newborns. The median interval between lastEFW and birth was 43 days for both methods.Fetal weight chart. In total, 417 women had two or more
weight measurements (788 EFWs and 376 BWs) and wereincluded in the generation of the fetal weight nomogram (Sup-plemental Table 1): most EFWs were available for GWs 18–35.The fitted regression equations for the mean and SD of log-transformed weights (in grams) and GA (in exact weeks) were
Using this model, weight centiles (2.5, 10, 25, 50, 75, 90, and97.5) were generated for GWs 14–43 (Table 2). These centileswere subsequently plotted together with the raw EFW/BWvalues (Figure 2): 9.5% of actual weight measurements werebelow the 10th centile, and 9.5% of actual weight measure-ments were above the 90th centile. Raw and studentized resid-uals of EFW/BW from the model were plotted against GA,and dispersion around zero was assessed to ensure adequacyof the decadic log transformation (Supplemental Figure 2).Comparison of fetal weight nomograms from different
populations. Figure 3 allows for visual comparison of the esti-mated 10th, 50th, and 90th weight centiles from our cohortwith those from the PNG-adjusted global reference and otherreference populations.1,12,13,24 Reference charts derived fromCaucasian and Congolese women had consistently higher10th weight centiles from 30 GWs onward, and percentagedifferences increased until term compared with our nomogram(Figure 4). Tanzanian reference intervals would diagnose asimilar proportion of fetuses as SGA as our chart (Figures 3
and 4). The PNG-adjusted global reference chart classified asmaller number of fetuses as SGA until 37 GWs comparedwith our nomogram (Figure 4). Of note, 10th centile referencevalues from Congolese and Tanzanian cohorts and this cohortwere derived after exponentiation, which results in a slightupward shift of the centile: values are approximately 1%lower when the 10th centile is calculated assuming a constantpercentage SD (Supplemental Figure 3).We found that 50th centiles of fetal weight were consistently
higher in the Caucasian reference from 25 GWs onward, andthe percentage difference in mean weight between Caucasian
and PNG fetuses increased to 18.5% at term. Medians of fetalweight tended to be lower in the early third trimester andhigher in the late third trimester in Congolese and Tanzanianreference charts compared with our chart, and medians of thePNG-adjusted global reference were consistently lower for theduration of the entire gestational time period of comparison.Differences in all centiles were most marked when our chartwas compared with that derived from a Caucasian population.There was an overall trend of centiles in our cohort beinghigher at earlier and lower at later gestation compared withcomparator centiles, apart from the 10th centile of the Tanza-nian reference, which was similar to our cohort throughout thegestational time frame of comparison.Among 327 (87.0%) newborns with a valid BW measure-
ment, the proportion with SGA was 11.9% (39) using ourequation, 16.2% (53) using Tanzanian reference values, 16.5%(54) using PNG-adjusted global reference values, 29.1% (95)using Congolese reference values, and 35.2% (115) usingCaucasian reference values.
Table 1
Characteristics of mothers and infants in the PNG fetal biometrycohort (N = 439)
Characteristics Mean ± SD (range) or percentage (n)
Comparison of individual biometric measurements. In total,439 AC and FL and 434 HC ultrasound-derived biometricmeasurements (one per pregnancy) were selected to generatecentile equations for our cohort (Supplemental Table 1). Mostbiometric measurements were obtained between GWs 16–35
(Supplemental Table 1). The best fit models for each measure-ment to GA were achieved using a third-order polynomial(all biometric measurements in millimeters) (Figure 5):
+ 9:98865 +GA − 73:19415 ðR2 > 0:99Þ:We compared values for our population with reference
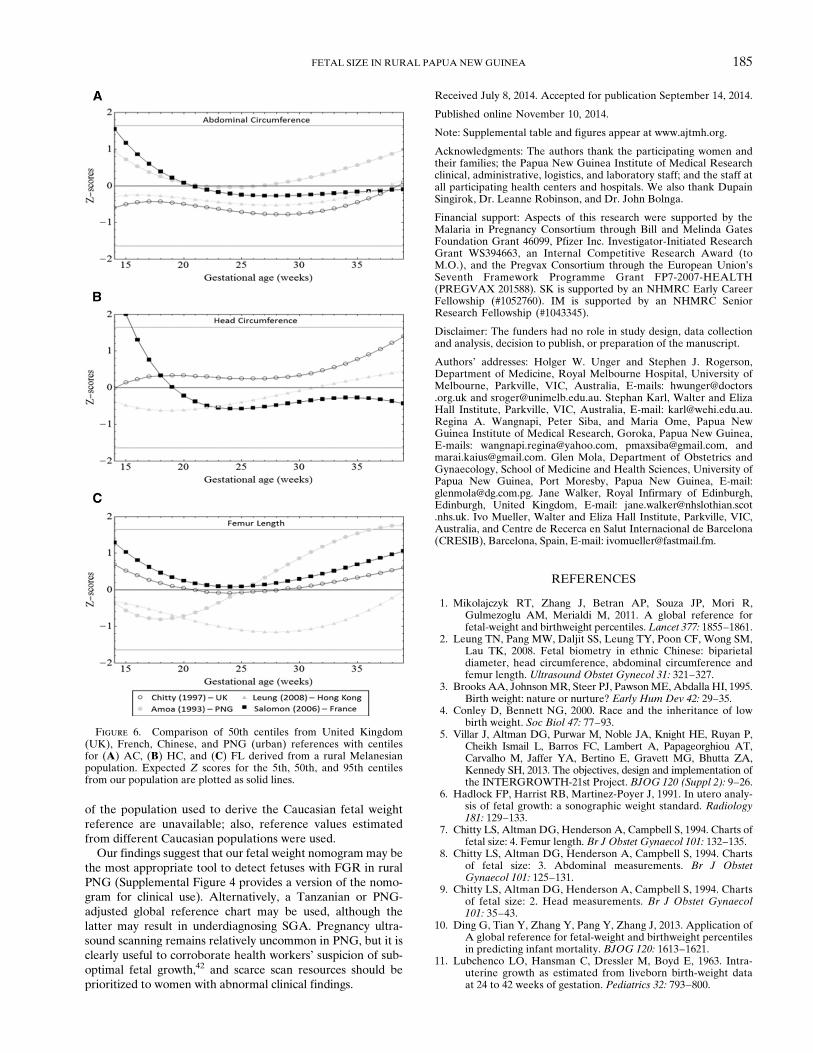
values previously published for PNG (FL and AC), China,France, and the United Kingdom (Figure 6).2,7–9,28,29 AC ref-erence measurements from other populations were within1 SD of our measurements for most GWs, although measure-ments were higher in the French population compared withour population at earlier gestation. HC reference values weresimilar from 22–35 GWs for all populations but considerablyhigher in a French reference before 17 GWs and a UnitedKingdom reference after 38 GWs. FL measurements of aChinese population were > 1 SD below our mean (25–32 GWs), and an urban PNG population had FL measure-ments > 1 SD above our mean from 31 GWs onward.
DISCUSSION
We generated a fetal weight nomogram and estimates offetal size from a cohort of rural PNG women with minimalrisk factors for FGR. Melanesians are not included in cur-rent multicenter studies evaluating optimal fetal growth.5
Our fetal weight centiles were most similar to a Tanzanianpopulation and markedly lower than the widely used Cauca-sian reference (Hadlock),6 use of which overestimated SGAin rural PNG. A comparison of 50th centiles for individualbiometric measurements (AC, HC, and FL) from PNGwith those derived from other populations did not showmajor differences.Most ultrasound studies from developing countries, includ-
ing our study, report fetal size centiles lower than thosein largely Caucasian populations from industrialized coun-tries.1,12,13,31 This could be because of differences in geneticgrowth potential, a reflection of intergenerational (epige-netic) legacies of suboptimal fetal and infant growth relatedto malnutrition or malaria, or because of unknown environ-mental factors causing FGR or altering fetal fat accumula-tion in particular. There was a flattening of weight centilestoward term in this cohort and a Tanzanian cohort, whereasgrowth centiles in Caucasian and Congolese nomogramsremained quasilinear until delivery (Figure 3). This mightbe driven by differences in end pregnancy growth velocitybetween populations.31,32
However, the findings of this research must be interpretedin light of its potential limitations. First, we may not haveeliminated all causes of FGR, which may underestimate opti-mal (standard) fetal weight centiles5; also, we did not adjustfor factors that may promote fetal growth (e.g., SP-AZ treat-ment). Inclusion criteria of comparator studies with regards toFGR risk also differed, with some studies not excluding riskfactors, such as protein-energy malnutrition and malaria.12
Figure 2. EFW and BW measurements and fitted 2.5th, 10th,25th, 50th, 75th, 90th, and 97.5th fetal weight centiles for GWs15–43.
182 UNGER, KARL AND OTHERS
Second, reliable data on last menstrual period were largelyunavailable, which could lead to lower mean fetal weights byGA.33,34 Third, late presentation to the prenatal clinic, a fre-quent occurrence in PNG, precluded pregnancy dating usingCRL in most participants. Error margins of GA estimatesbased on fetal biometry increase with advancing GA,15,19 andan episode of FGR before a dating measurement will under-estimate GA, translating into lower fetal weight centiles.However, exclusion of pregnancies affected by severe mater-nal disease, congenital abnormalities, and stillbirth shouldhave somewhat limited the number of fetuses that may havesuffered early-onset FGR in this cohort. Similarly, one-halfof our women were primigravidae, which is associated withlower mean BWs,35 and we observed a relatively high propor-tion of female fetuses,12 potentially resulting in a downwardbias of our fetal weight centiles. Furthermore, our nomogramis a hybrid derived from both EFW and BW, because it wasnot possible for most women to be scanned near term. Previ-ous research suggests that this is a valid alternative,36,37 and10th centiles are similar between actual BW and EFW in termpregnancies in North American cohorts.38 However, becauseof the aforementioned shortcomings with estimating GA,some infants in the cohort may have been pre-term deliveries,potentially lowering the mean of the curve.38 The inclusion ofBW may also explain the flattening of the curve toward termthat was observed in our reference chart and the Tanzanian(hybrid) reference chart: there were no marked differences in
third trimester growth velocities when Congolese and Cauca-sian centiles (EFW only) were compared.12 Fourth, exponen-tiation resulted in an upward shift of our 10th percentilevalues by 1% (Supplemental Figure 3).Use of the Hadlock or Congolese references in our popula-
tion would result in overdiagnosing SGA, whereas 10th centilesfrom a Tanzanian reference were comparable with our cohort,and the PNG-adjusted global reference underestimated SGA.This suggests that locally derived centiles may be most appro-priate. In the absence of population-specific references, useof the global reference is a reasonable alternative, keepingin mind the potential risk of missing an SGA fetus. Thepopulation-adjusted global reference requires a minimum of100 BWs from ultrasound-dated uncomplicated singleton termpregnancies, a challenge in itself to achieve in some develop-ing countries settings, notwithstanding the advantages ofgenerating population-specific references. The PNG-adjustedglobal reference underestimated PNG means and 10thcentiles, which suggests that assumptions made to generate itmay not fully apply to our population.1 For instance, althoughvariation of fetal weight was relatively constant across GAwhen expressed as a percentage of the fetal weight residualsin our cohort (Supplemental Figure 3), it was smaller (10.9%)compared with global reference assumptions.1,6
The Hadlock formula for estimating fetal weights over-estimated actual BW in term pregnancies in our populationand other developing world populations.12,13 In our study, this
Figure 3. Locally derived fetal weight centiles (Figure 2 information shown in dark gray shading) compared with centiles from the (A) thePNG-adjusted global reference,1 (B) a Caucasian reference,6 (C) a Tanzanian reference,13 and (D) a Congolese reference.12
FETAL SIZE IN RURAL PAPUA NEW GUINEA 183
may be explained by the relatively wide time intervals betweenlast EFW and actual BW and the methodologies used toapproximate BW from last measured EFW; however, trendswere similar in studies from Tanzania and the DemocraticRepublic of Congo.12,13 It is, hence, conceivable that theHadlock formula somehow fails to capture differences in fetalsize, growth, and body fat percentage in developing world pop-ulations, particularly toward term.39 We hope that currentresearch will provide answers to this important question.17
In a subanalysis, we compared centiles for AC, HC, and FL(ultrasound only) from our cohort with those from other pop-ulations (Figure 5). The small number of measurements
restricted a meaningful comparison to the 16- to 35-GW inter-val (Table 2). Z scores of three biometric measurements werewithin 1 SD of most comparison populations, apart fromlower mean FLs in a Hong Kong Chinese population. Thiscorroborates findings from a similar comparison conducted inThailand.40 Mean FLs observed in urban PNG were higherthan our findings after 30 GWs. This may because their cohortcontained a higher percentage of Papuans/Polynesians thanour cohort, but it could also be because they used biparietaldiameters for dating and performed cross-sectional analysis ofa longitudinal dataset.15,41 We did not observe higher AC Zscores in Caucasian references compared with our cohort,which could have explained lower fetal weight centiles. How-ever, a direct comparison is not possible, because AC data
Figure 4. Percentage difference in the (A) 10th, (B) 50th, and(C) 90th fetal weight centiles derived from a rural PNG cohort,Caucasian, Congolese, and Tanzanian weight references, and aPNG-adjusted global reference.
Figure 5. Raw biometric data (millimeters) with 2.5th, 10th,50th, 90th and 97.5th fitted centiles for (A) AC (N = 439), (B) FL(N = 439), and (C) HC (N = 434).
184 UNGER, KARL AND OTHERS
of the population used to derive the Caucasian fetal weightreference are unavailable; also, reference values estimatedfrom different Caucasian populations were used.Our findings suggest that our fetal weight nomogrammay be
the most appropriate tool to detect fetuses with FGR in ruralPNG (Supplemental Figure 4 provides a version of the nomo-gram for clinical use). Alternatively, a Tanzanian or PNG-adjusted global reference chart may be used, although thelatter may result in underdiagnosing SGA. Pregnancy ultra-sound scanning remains relatively uncommon in PNG, but it isclearly useful to corroborate health workers’ suspicion of sub-optimal fetal growth,42 and scarce scan resources should beprioritized to women with abnormal clinical findings.
Received July 8, 2014. Accepted for publication September 14, 2014.
Published online November 10, 2014.
Note: Supplemental table and figures appear at www.ajtmh.org.
Acknowledgments: The authors thank the participating women andtheir families; the Papua New Guinea Institute of Medical Researchclinical, administrative, logistics, and laboratory staff; and the staff atall participating health centers and hospitals. We also thank DupainSingirok, Dr. Leanne Robinson, and Dr. John Bolnga.
Financial support: Aspects of this research were supported by theMalaria in Pregnancy Consortium through Bill and Melinda GatesFoundation Grant 46099, Pfizer Inc. Investigator-Initiated ResearchGrant WS394663, an Internal Competitive Research Award (toM.O.), and the Pregvax Consortium through the European Union’sSeventh Framework Programme Grant FP7-2007-HEALTH(PREGVAX 201588). SK is supported by an NHMRC Early CareerFellowship (#1052760). IM is supported by an NHMRC SeniorResearch Fellowship (#1043345).
Disclaimer: The funders had no role in study design, data collectionand analysis, decision to publish, or preparation of the manuscript.
Authors’ addresses: Holger W. Unger and Stephen J. Rogerson,Department of Medicine, Royal Melbourne Hospital, University ofMelbourne, Parkville, VIC, Australia, E-mails: [email protected] and [email protected]. Stephan Karl, Walter and ElizaHall Institute, Parkville, VIC, Australia, E-mail: [email protected] A. Wangnapi, Peter Siba, and Maria Ome, Papua NewGuinea Institute of Medical Research, Goroka, Papua New Guinea,E-mails: [email protected], [email protected], [email protected]. Glen Mola, Department of Obstetrics andGynaecology, School of Medicine and Health Sciences, University ofPapua New Guinea, Port Moresby, Papua New Guinea, E-mail:[email protected]. Jane Walker, Royal Infirmary of Edinburgh,Edinburgh, United Kingdom, E-mail: [email protected]. Ivo Mueller, Walter and Eliza Hall Institute, Parkville, VIC,Australia, and Centre de Recerca en Salut Internacional de Barcelona(CRESIB), Barcelona, Spain, E-mail: [email protected].
REFERENCES
1. Mikolajczyk RT, Zhang J, Betran AP, Souza JP, Mori R,Gulmezoglu AM, Merialdi M, 2011. A global reference forfetal-weight and birthweight percentiles.Lancet 377: 1855–1861.
2. Leung TN, Pang MW, Daljit SS, Leung TY, Poon CF, Wong SM,Lau TK, 2008. Fetal biometry in ethnic Chinese: biparietaldiameter, head circumference, abdominal circumference andfemur length. Ultrasound Obstet Gynecol 31: 321–327.
3. Brooks AA, JohnsonMR, Steer PJ, PawsonME, Abdalla HI, 1995.Birth weight: nature or nurture? Early Hum Dev 42: 29–35.
4. Conley D, Bennett NG, 2000. Race and the inheritance of lowbirth weight. Soc Biol 47: 77–93.
5. Villar J, Altman DG, Purwar M, Noble JA, Knight HE, Ruyan P,Cheikh Ismail L, Barros FC, Lambert A, Papageorghiou AT,Carvalho M, Jaffer YA, Bertino E, Gravett MG, Bhutta ZA,Kennedy SH, 2013. The objectives, design and implementation ofthe INTERGROWTH-21st Project. BJOG 120 (Suppl 2): 9–26.
6. Hadlock FP, Harrist RB, Martinez-Poyer J, 1991. In utero analy-sis of fetal growth: a sonographic weight standard. Radiology181: 129–133.
10. Ding G, Tian Y, Zhang Y, Pang Y, Zhang J, 2013. Application ofA global reference for fetal-weight and birthweight percentilesin predicting infant mortality. BJOG 120: 1613–1621.
11. Lubchenco LO, Hansman C, Dressler M, Boyd E, 1963. Intra-uterine growth as estimated from liveborn birth-weight dataat 24 to 42 weeks of gestation. Pediatrics 32: 793–800.
Figure 6. Comparison of 50th centiles from United Kingdom(UK), French, Chinese, and PNG (urban) references with centilesfor (A) AC, (B) HC, and (C) FL derived from a rural Melanesianpopulation. Expected Z scores for the 5th, 50th, and 95th centilesfrom our population are plotted as solid lines.
FETAL SIZE IN RURAL PAPUA NEW GUINEA 185
12. Landis SH, Ananth CV, Lokomba V, Hartmann KE, Thorp JM Jr,Horton A, Atibu J, Ryder RW, Tshefu A, Meshnick SR, 2009.Ultrasound-derived fetal size nomogram for a sub-SaharanAfrican population: a longitudinal study. Ultrasound ObstetGynecol 34: 379–386.
13. Schmiegelow C, Scheike T, Oesterholt M, Minja D, Pehrson C,Magistrado P, Lemnge M, Rasch V, Lusingu J, TheanderTG, Nielsen BB, 2012. Development of a fetal weight chartusing serial trans-abdominal ultrasound in an East Africanpopulation: a longitudinal observational study. PLoS ONE7: e44773.
14. ClinicalTrials.gov, 2013. Intermittent Preventive Treatment withAzithromycin-Containing Regimens in Pregnant Women inPapua New Guinea (IPTp in PNG). Available at: http://www.clinicaltrials.gov/show/NCT01136850. Accessed February 1, 2014.
16. Sanders R, Winder T, 2007. Clinical Sonography: A PractialGuide. Baltimore, MD: Lippincott, Williams & Wilkins.
17. Papageorghiou AT, Sarris I, Ioannou C, Todros T, Carvalho M,Pilu G, Salomon LJ, 2013. Ultrasound methodology usedto construct the fetal growth standards in the INTER-GROWTH-21st Project. BJOG 120 (Suppl 2): 27–32.
18. Hadlock FP, Deter RL, Carpenter RJ, Park SK, 1981. Estimatingfetal age: effect of head shape on BPD. AJR Am J Roentgenol137: 83–85.
19. Salpou D, Kirserud T, Rasmussen S, Johnsen S, 2008. Fetal ageassessment based on 2nd trimester ultrasound in Africa andthe effect of ethnicity. BMC Pregnancy Childbirth 8: 48.
20. Hadlock FP, Harrist RB, Shah YP, King DE, Park SK, SharmanRS, 1987. Estimating fetal age using multiple parameters:a prospective evaluation in a racially mixed population. Am JObstet Gynecol 156: 955–957.
21. Mastrobattista JM, Pschirrer ER, Hamrick MA, Glaser AM,Schumacher V, Shirkey BA, Wicklund CA, Hollier LM, 2004.Humerus length evaluation in different ethnic groups. J Ultra-sound Med 23: 227–231.
22. Bottomley C, Daemen A, Mukri F, Papageorghiou AT, Kirk E,Pexsters A, De Moor B, Timmerman D, Bourne T, 2009.Assessing first trimester growth: the influence of ethnic back-ground and maternal age. Hum Reprod 24: 284–290.
23. Vallely LM, Homiehombo P, Kelly AM, Vallely A, Homer CS,Whittaker A, 2013. Exploring women’s perspectives of accessto care during pregnancy and childbirth: a qualitative studyfrom rural Papua New Guinea. Midwifery 29: 1222–1229.
24. Hadlock FP, Harrist RB, Sharman RS, Deter RL, Park SK, 1985.Estimation of fetal weight with the use of head, body, andfemur measurements–a prospective study. Am J ObstetGynecol 151: 333–337.
25. de Jong CL, Francis A, van Geijn HP, Gardosi J, 1999. Fetalgrowth rate and adverse perinatal events. Ultrasound ObstetGynecol 13: 86–89.
27. Bland JM, Altman DG, 1999. Measuring agreement in methodcomparison studies. Stat Methods Med Res 8: 135–160.
28. Amoa AB, Wapi J, Klufio CA, 1993. Longitudinal fetal biometryof normal pregnant Melanesian Papua New Guineans to con-struct standards of reference for Papua New Guinea. P N GMed J 36: 219–227.
29. Salomon LJ, Duyme M, Crequat J, Brodaty G, Talmant C, FriesN, Althuser M, 2006. French fetal biometry: reference equa-tions and comparison with other charts. Ultrasound ObstetGynecol 28: 193–198.
30. Royston P, 1995. Calculation of unconditional and conditionalreference intervals for foetal size and growth from longitudinalmeasurements. Stat Med 14: 1417–1436.
31. Merialdi M, Caulfield LE, Zavaleta N, Figueroa A, Costigan KA,Dominici F, Dipietro JA, 2005. Fetal growth in Peru: compar-isons with international fetal size charts and implicationsfor fetal growth assessment. Ultrasound Obstet Gynecol 26:123–128.
32. Overpeck MD, Hediger ML, Zhang J, Trumble AC, KlebanoffMA, 1999. Birth weight for gestational age of Mexican Americaninfants born in the United States.Obstet Gynecol 93: 943–947.
33. Kramer MS, McLean FH, Boyd ME, Usher RH, 1988. Thevalidity of gestational age estimation by menstrual datingin term, preterm, and postterm gestations. JAMA 260:3306–3308.
34. Savitz DA, Terry JW Jr, Dole N, Thorp JM Jr, Siega-Riz AM,Herring AH, 2002. Comparison of pregnancy dating by lastmenstrual period, ultrasound scanning, and their combination.Am J Obstet Gynecol 187: 1660–1666.
35. Kramer MS, 1987. Determinants of low birth weight: methodo-logical assessment and meta-analysis. Bull World Health Organ65: 663–737.
36. Bernstein IM, Mohs G, Rucquoi M, Badger GJ, 1996. Case forhybrid “fetal growth curves”: a population-based estimationof normal fetal size across gestational age. J Matern Fetal Med5: 124–127.
37. Fry AG, Bernstein IM, Badger GJ, 2002. Comparison of fetalgrowth estimates based on birth weight and ultrasound refer-ences. J Matern Fetal Neonatal Med 12: 247–252.
38. Zhang J, Sun K, 2013. Invited commentary: the incrementalvalue of customization in defining abnormal fetal growthstatus. Am J Epidemiol 178: 1309–1312.
39. Carberry AE, Raynes-Greenow CH, Turner RM, Jeffery HE,2013. Customized versus population-based birth weight chartsfor the detection of neonatal growth and perinatal morbidityin a cross-sectional study of term neonates. Am J Epidemiol178: 1301–1308.
40. Rijken MJ, Mulder EJ, Papageorghiou AT, Thiptharakun S, WahN, Paw TK, Dwell SL, Visser GH, Nosten FH, McGready R,2012. Quality of ultrasound biometry obtained by local healthworkers in a refugee camp on the Thai-Burmese border. Ultra-sound Obstet Gynecol 40: 151–157.
41. Ioannou C, Talbot K, Ohuma E, Sarris I, Villar J, Conde-Agudelo A, Papageorghiou AT, 2012. Systematic review ofmethodology used in ultrasound studies aimed at creatingcharts of fetal size. BJOG 119: 1425–1439.
42. Mola GD, Kombuk B, Amoa AB, 2011. Poor weight gain in latethird trimester: a predictor of poor perinatal outcome for termdeliveries? P N G Med J 54: 164–173.