FFC and Engro Foods Ration Analysis:United we stayed right from the word ³go´. Devotion and coordination is what made this taskhappen. Though it was tiresome sometimes but it was our eagerness to prove something which kept us going on and on. And finally we have been able to reach at a point where we can say with all our enthusiasm that ³yes, we did it!´ For a blessed soil like ours, the worth of a fertilizer company became a motive behind ourselection of Engro Chemicals Pvt. Ltd. and Fauji Fertilizer Company for comparison purposes. Our research revealed to us that Engro Chemicals Ltd. holds a stronger position as compared to its counterpart. And ratio analysis also supports the fact discussed earlier. Tables and graphs are also included to make this comparison more clear and to enhance the understanding of the numerical figures attained from ratio analysis. We have put our heart and soul to hold a fair comparison but there is always a room forimprovement. So we are quite right to adopt an optimistic approach to believe that Mrs. Labiba Sheikh will ignore our mere mistakes, if found, because ³to err is human´. Group MembersCOMPANY NAME Engro Chemicals Ltd. Fauji Fertilizer Co. YEARS200520062007200520062007CURRENT RATIOS1.79 1.56 3.11 1.094 .897 0.942 ACID TEST RATIO1.10 1.31 0.26 1. 01 0.81 0.89 DEBT EQUITY RATIO (%) 108.33 31.58 38.9 20.48 8.70 7.53 DEBT RATIO.48 .25 .18 0.76 0.53 0.57 TIME INTEREST EARNED12.5 7.18 8.92 11.92 14.94 12.22 INVENTORY TURN OVERRATIO11.1 9.4 10.1 16.41 16.1 22.95 INVENTORY HOLDING PERIOD32 38 36 21.93 22.36 15.7 NET FIXED ASSETS TURNOVER RATIO1.4437 1.5148 1.9397 1.44 1.7 1.54
United we stayed right from the word ³go´. Devotion and coordination is what made this task happen. Though it was tiresome sometimes but it was our eagerness to prove something whichkept us going on and on. And finally we have been able to reach at a point where we can say
with all our enthusiasm that ³yes, we did it!´
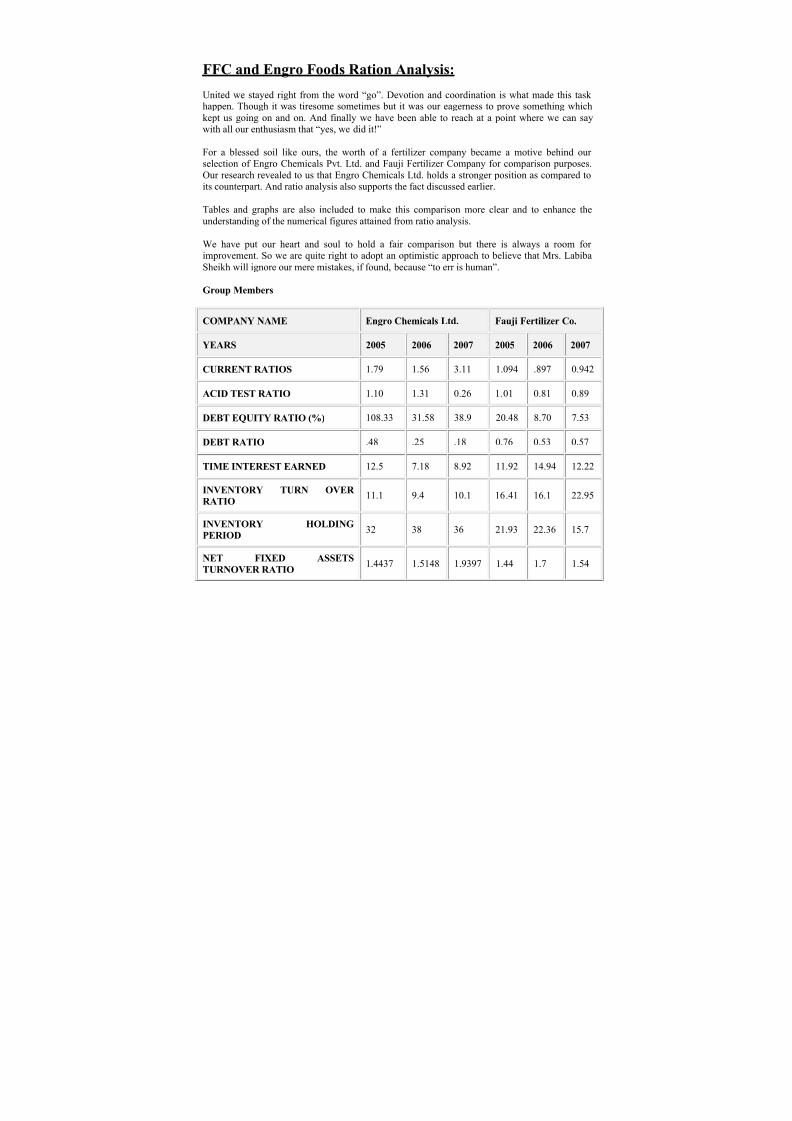
For a blessed soil like ours, the worth of a fertilizer company became a motive behind our selection of Engro Chemicals Pvt. Ltd. and Fauji Fertilizer Company for comparison purposes.Our research revealed to us that Engro Chemicals Ltd. holds a stronger position as compared toits counterpart. And ratio analysis also supports the fact discussed earlier.
Tables and graphs are also included to make this comparison more clear and to enhance theunderstanding of the numerical figures attained from ratio analysis.
We have put our heart and soul to hold a fair comparison but there is always a room for
improvement. So we are quite right to adopt an optimistic approach to believe that Mrs. LabibaSheikh will ignore our mere mistakes, if found, because ³to err is human´.
Group Members
COMPANY NAME Engro Chemicals Ltd. Fauji Fertilizer Co.
YEARS 2005 2006 2007 2005 2006 2007
CURRENT RATIOS 1.79 1.56 3.11 1.094 .897 0.942
ACID TEST RATIO 1.10 1.31 0.26 1.01 0.81 0.89
DEBT EQUITY RATIO (%) 108.33 31.58 38.9 20.48 8.70 7.53
DEBT RATIO .48 .25 .18 0.76 0.53 0.57
TIME INTEREST EARNED 12.5 7.18 8.92 11.92 14.94 12.22
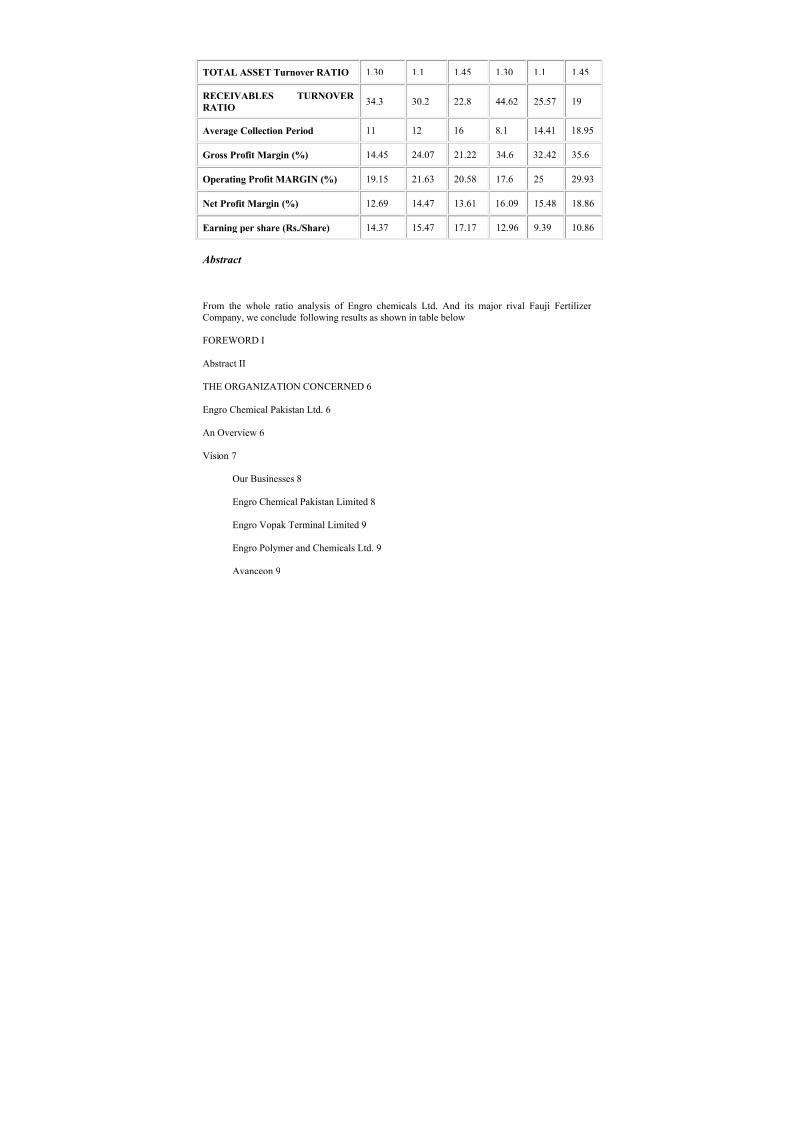
Net Profit Margin (%) 12.69 14.47 13.61 16.09 15.48 18.86
Earning per share (Rs./Share) 14.37 15.47 17.17 12.96 9.39 10.86
Abstract
From the whole ratio analysis of Engro chemicals Ltd. And its major rival Fauji Fertilizer Company, we conclude following results as shown in table below
Engro Chemical Pakistan Limited is a fertilizer company which is of their concern that has been
introduced right below. They are going to make a full-fledge financial analysis of this fertilizer company in order to check its financial situation in the market. The analysis of each and everymajor ratio has been involved in this financial analysis. Then furthermore the interpretation of each and every ratio has been given to elaborate it.
An Overview
Search for oil by Pak Stanvac, an Esso/Mobil joint venture in 1957, led to the discovery Of Marigas field situated near Daharki -- a small town in upper Sindh province. Esso was the first tostudy this development in detail and propose the establishment of a urea plant in that area.
The proposal was approved by the government in 1964, which led to a fertilizer plant agreementsigned in December that year. Subsequently in 1965, the Esso Pakistan Fertilizer CompanyLimited was incorporated, with 75% of the shares owned by Esso and 25% by the general public.The construction of a urea plant commenced at Daharki the following year with the annualcapacity of 173,000 tons and production commenced in 1968. At US $ 43 million, it was thesingle largest foreign investment by an MNC in the country.
A full-fledged marketing organization was established which undertook agronomic programs toeducate the farmers of Pakistan. As the nation¶s first fertilizer brand, Engro (then Esso) helpedmodernize traditional farming practices to boost farm yields, directly impacting the quality of life
not only for farmers and their families, but for the community at large. As a result of theseefforts, consumption of fertilizers increased in Pakistan, paving the way for the Company¶s branded urea called "Engro", an acronym for "Energy for Growth".
As part of an international name change program, Esso became Exxon in 1978 and the companywas renamed Exxon Chemical Pakistan Limited. The company continued to prosper as itrelentlessly pursued productivity gains and strived to attain professional excellence.
In 1991, Exxon decided to divest its fertilizer business on a global basis. The employees of Exxon Chemical Pakistan Limited, in partnership with leading international and local financialinstitutions bought out Exxon¶s 75 percent equity. This was at the time and perhaps still is themost successful employee buy-out in the corporate history of Pakistan. Renamed as EngroChemical Pakistan Limited, the Company has gone from strength to strength, reflected in its
consistent financial performance, growth of the core fertilizer business and diversification intoother fields.
Investment in people, process solutions and resource conservation initiatives has reduced energyuse per ton of urea by a third, whilst increasing urea production nearly six-fold since 1968. Notonly does this save money, it stretches non-renewable energy sources and mitigates the impact of waste. Along the way, a major milestone in plant capacity upgrade coincided with the employeeled buy-out; innovatively optimizing our resources, Engro re-located fertilizer manufacturing plants from the UK and US to its Daharki plant site ± an international first. Our pioneering spiritcontinues in our social investments, exemplified by the only snake-bite treatment facility in theGhotki region and the first telemedicine intervention in the country.
Wing
Vision
"To be the premier Pakistani enterprise with a global reach, passionately pursuing value creationfor all stakeholders."
Our Diverse Colors of Excellence
Our Businesses
The years since Exxon became Engro have been both exciting and rewarding for theOrganization and its people. Challenges have been overcome, goals achieved and new goals set.Engro today stands recognized as a successful business operation and a role model for doing business in Pakistan.
The Company¶s current manufacturing base includes urea name plate capacity of 975,000 tons per annum and blended fertilizer (NPK) capacity of 160,000 tons per year. A premier brand andnationwide presence ensure sellout production. Additionally, the company imports and sells phosphatic fertilizers for balanced fertility and improved farm yields. Engro¶s share of Pakistan¶s phosphates market mirrors or exceeds its urea market share.
Expansion plans include a new urea plant of 1.3 million tons annual capacity, also at Daharki.The US$ 1 billion project is well underway and on track for commercial production in mid 2010.
This addition will increase Engro¶s urea market share to 35% from 19% at present.
Engro Vopak Terminal Limited
50:50 Joint Ventures with Royal Vopak - a Netherlands based global leader in terminaloperations. EVTL operates a bulk liquid chemical terminal at Port Qasim, Karachi. It has animpeccable safety record of handling a range of chemicals and LPG for over 10 years.
EVTL is building Pakistan¶s first cryogenic Ethylene storage facility and expects to be ready byearly 2009. Given its experience with gasses, cryogenics, a brown field location and internationaloperating standards, EVTL is well-positioned to build a LNG terminal, being pursued by theGovernment of Pakistan.
Engro Polymer and Chemicals Ltd.
EPCL is undergoing expansion involving PVC production increase of 50,000 tones (currentcapacity: 100,000 tons p.a. and back integration through setting up of an EDC/VCM plant and a
Chlor alkali plant. These initiatives are expected to conclude in phases by first half of 2009. AtPort Qasim, this 56% Engro owned Company is involved in manufacturing, marketing andselling Polyvinyl Chloride (PVC).
Avanceon
A 63% owned subsidiary of Engro, EIAL is the leading global automation business, providing process & control solutions. It also offers Power & Energy Management software solutions aswell as High-End software that integrate production and business applications. Previouslyoperating in Pakistan and UAE, they have now penetrated in the USA market with the merger of ENGRO Innovative and Advance Automation. Advance Automation is an award winningtechnology solutions provider to manufacturers in North American and has been awarded as theSystem Integrator of the Year 2007 by Control Engineering.
Synchronizing to a single brand worldwide with all the engineering Standards, processes, brandidentity and global brand recognition was a huge task and due to various different cultural factorsit was even complex then perceived.
After days of hard work AVANCEON emerged as the new name and the true GlobalAutomation Player. The new company name will help to reinforce the single brand identity thathas emerged over the last 16 days as the two formerly separate companies have successfullyworked to become a single global enterprise.
Engro Foods Limited (EFL)
Engro Foods, a wholly owned subsidiary had its first full year of operations in 2007. TheCompany continued expanding with additions to brand portfolio, milk production and
distribution capacities.
The portfolio now includes four impressive brands; Olper's milk, Olper¶s cream, Olwell andTarang. Olper¶s market share peaked at 17% during 2007. EFL operates two dairy processing factories located in Sukkur, and Sahiwal. The company¶s milk collection network now boasts over 700 village milk collectors and 400 milk collection centers. Covering 2400villages across Pakistan, the activities of the Company touch the lives of almost 51,000 farmers.
An exciting new venture is the diversification of dairy portfolio into ice cream. Work hascommenced full throttle for detailed engineering and market study with a view to launch of firstice cream in 2009. Also on EFL slate is the establishment of a dairy farm with milking expectedto start in second quarter 2009.
Engro Energy Limited (EEL)
This wholly owned subsidiary is setting up an Independent Power Plant near Qadirpur in Sindh;Targeting 2009 for commercial operations, the power project will have a net output of 217 MW.The plant will utilize low heating value permeate gas from Qadirpur gas field which is currently
being flared.
Engro Eximp (Pvt.) Limited
Engro Eximp (Pvt.) Limited is a wholly owned subsidiary in the trading business of fertilizer imports.
Spectrum of our products & services products & services
Products & Services
Our wide spectrum of products and services clearly shows the diversity in our Businesses, eachone designed to make life better for our customers
F ertilizers
by E ngro Chemical Pakistan Limited
Aduct line that focuses on balanced crop nutrition and higher yield for the farmer
ENGRO UREA is a trusted high grade fertilizer containing 46% Nitrogen (N), with moderatehydroscopicity. It has a pH value of 6.8 (organic molecule) and is suitable for all crops on allsoils. Engro Urea is an excellent source of Nitrogen for the vast majority of cultivated soils of
Pakistan.
Phosphatic Fertilizers
Engro DAP: contains 46% P2O5 and 18% N. More than 90% of Phosphate (P) is water soluble.It has a pH value of 7.33 and is a good source of P fertilizer for all crops. It is an equally goodsource on problem soils (saline sodic) with coarse texture. On an overall basis it suits to about90% soils of the country.
Engro Zorawar: is one of the highest grade phosphatic fertilizers. It is acidic in reaction (pH >=3.5) and contains 52% P2O5 of which more than 90% is water soluble, while the rest is citratesoluble. In addition to P, it contains 12% N, 2% sulphur and 1% calcium. It is a beneficialfertilizer for all crops on all soils of Pakistan and produces excellent results on alkaline soils, dueto its acidic
the acidic pH of Engro Zorawar also tends to slow down the rapid conversion of soluble P towater insoluble compounds, keeping it plant available for a longer period of time.
Engro Phosphate: is brown colored mono ammonium phosphate with 11% nitrogen and 52% phosphorus. It is being marketed as relatively cheaper alternate of DAP.
Blended Fertilizers
Engro Zarkhez: is homogenously granulated fertilizer which maximizes crop yield by providing balanced nutrition for a wide variety of crops through the uniform availability of Nitrogen, Phosphorous and Potassium. Engro Zarkhez grades are specially produced to suit therequirements of individual crops and soils, and provide convenience to the farmer through readyavailability of precise quantities of primary nutrients.
Engro Zarkhez fertilizers have low moisture content, high crush strength; 2mm-4mm granulesize and free flowing nature - attributes which ensure excellent handling and applicationcharacteristics.
Engro NP: it provides 22% nitrogen, and 20% phosphorus. ECPL entered into NP business in2005 to cater the need of its customers for this established category. Primary focus area for ENPmarketing is South Zone (Sindh).
Micro Nutrients
Zingro: Zinc Sulphate, a highly effective and potent fertilizer which primarily targets Zincdeficiency in crops like Rice, Potato, Maize, Sugar cane, Wheat, Cotton, vegetables and fruits.Zingro increases crop yield and enhances crop appearance.
PVC
a synthetic resin composed of repeating units of vinyl chloride. It is very versatile and is used ina wide variety of products
Chemical handling & Storage
By E ngro Vopak T erminal Limited
A state of the art jetty and terminal at Port Qasim, Karachi for handling and storage of LPG and bulk liquid chemicals
Industrial by Avanceon (formerly known as E ngro Innovative Automation Pvt. Limited)
Providing process control solutions to your industrial units
Market leader in industrial automation business providing process control solutions to Industrialunits. It offers Power & Energy Management Software solutions as well as High end Softwarethat integrate production and business application. Providing process control solutions to your
industrial units
Industrial Automation
Market leader in industrial automation business providing process control solutions to
Industrial units. It offers Power & Energy Management Software solutions as well as
High end Software that integrate production and business application.
Providing process control solutions to industrial units and management software solutions
F oods by E ngro F oods Limited
Olper¶s: Standardized at 3.5% fat, Olper¶s is a premium, UHT all-purpose milk.
Olwell HCLF: (High Calcium, Low Fat) Olwell is a premium quality milk for the healthconscience.
Olper¶s Cream: UHT Cream standardized at 40% fat
Tarang: Liquid tea whitener
State of the art dairy processing plant
Our 217 MW Power Plant.
Power Generation by E ngro E nergy Limited
Engro identified a Power Project based on low BTU, high H2S gas from
Qadirpur gas Field. The project is unique as it will convert low BTU high sulphur content permeate gas, which is currently being wasted and flared, into 217 MW electric power Converting wasted flare gas into energy at the 217 MW Power Plants
Improvisation through Six Sigma: the legend leads again
Employee development is one of the pivotal areas for Organizational development. ToOrganizational competence levels, new training programs encompassing PerformanceManagement, Leadership, and Competency Development are introduced.
Engro is among the first Pakistani companies implementing six sigma across all areas andutilizing it as a management system to execute its strategic objectives. Among the focus areas,employee development is the most critical and six sigma is leveraged to help bring out the best inour people. Employees will drive improvements in other areas; speed, innovation, perfection andin becoming world class professionals.
Six Sigma¶s robust problem solving methodology and statistical toolkit allows the company to benchmark processes against global standards in a language that is comparable across anyindustry or function. It helps ensure that Engro sustains its promise of delivering high quality products and services to its customers ± on time, every time.
Packing & The finished product is packed with the utmost care by trained personnel, and loaded directly into containers for export purposes. All packing and loading is done under strict supervision, whilemaintaining maximum quality and safety standards. To facilitate their customers, they provideyarn packed in 100Lbs and 50Lbs sea-worthy export cartons. They also have facility to provide
customers with polythene film shrink wrapped Pallet packing to specially accommodatecustomers in Europe/USA and help them reduce the labor handling costs.
Business practice
Our Advisory Capacity
Principal Operations Committee
The following committees act at the operation level in an advisory capacity to the Chief Executive Officer, providing recommendations relating to business and employee Matters:
Management Committee is responsible for review and endorsement of long term strategic plans, capital and expense budgets, development and stewardship of business plans andreviewing the effectiveness of risk management processes and internal control.
Corporate HSE Committee is responsible for providing leadership and strategic guidance on all
Health, Safety and Environment (HSE) improvement initiatives and has stewardshipresponsibility for monitoring compliance against regulatory standards and selected international benchmarks.
COED Committee is responsible for the review of Compensation, Organization and EmployeeDevelopment (COED) matters of all people excluding employee Directors and Senior Executives.
Throughout the 40 plus years of Engro¶s history, our people have come up with ideas anddetermination that drove the company forward in all sorts of times.
Corporate Governance
Engro¶s governance structure responds to the industry¶s best practices demands Ensuring that allaspects with respect to economic, environmental and social obligations are fully considered and business decisions are taken after evaluating their impact on The Company¶s triple bottom line -People, Planet and Profits.
Compliance Statement
The Board of Directors has throughout the year 2007 complied with the µCode of CorporateGovernance¶ contained in the listing requirements of the stock exchanges and the µCorporate andFinancial Reporting framework¶ of the Securities and Exchange Commission of Pakistan.
Risk Management Process
In 2007, the Management Committee undertook a review of major financial and operating risks
faced by the business.
Internal Control Framework
Responsibility: The Board is ultimately responsible for Engro¶s system of internal control andfor reviewing its effectiveness. However, such a system is designed to manage rather than
eliminate the risk of failure to achieve business objectives, and can provide only reasonable andnot absolute assurance against material misstatement or loss.
The Board, whilst maintaining its overall responsibility for managing risk within the Company,
has delegated the detailed design and operation of the system of internal controls to the Chief Executive
.
Framework: The Company maintains an established control framework comprising clear structures, authority limits, and accountabilities, well-understood policies and procedures and budgeting and review processes.
The Board establishes corporate strategy and the Company¶s business objectives. Divisionalmanagement integrates these objectives into divisional business strategies with supportingfinancial objectives. All policies and control procedures are documented in manuals
Review: The Board meets quarterly to consider Engro¶s financial performance, financial andoperating budgets and forecasts, business growth and development plans, capital expenditure proposals and other key performance indicatoThe Board Audit Committee receives reports on the system of internal financial controls fromthe external and internal auditors and reviews the process for monitoring the effectiveness of
internal controls.
There is a company wide policy governing appraisal and approval of investment expenditure andasset disposals. Post completion reviews are performed on all material investment expenditure.
Audit: Engro has an Internal Audit function. The Board Audit Committee annually reviews theappropriateness of resources and authority of this function. The Head of Internal Audit reportsdirectly to the Audit Committee on the results of its work.
The Internal Audit function carries out reviews on the financial, operational and compliancecontrols, and reports on findings to the Chief Executive and the divisional management. Allmaterial issues are reported to the Board Audit Committee which approves the audit program, based on an annual risk assessment of the operating areas. To underpin the effectiveness of
controls, it is Engro¶s policy to attract, retain and develop staff of high caliber and integrity inappropriate disciplines. There is an annual appraisal process, which assesses employee performance against agreed objectives and identifies necessary training to maintain and enhancestandards of performance.
Values that we live by
Core ValuesOur employees' performance can only flourish in a sound work environment. That is whyENGRO is committed to supporting its leadership culture through systems and policies thatfoster open communication, maintain employee and partner privacy, and assure
Employee health and safety.
SAF ETY, HE ALTH & E NVIRONM E N T
We will manage and utilize resources and operations in such a way that the safety and health of our people, our neighbors. Our customers and our visitors are ensured. We believe our safety,health and environmental responsibilities extend beyond protection and enhancement of our ownfacilities, and we are concerned about the distribution, use and after use disposal of our products.
ETH ICS AN D IN TE GRI TY we do care how results are achieved and will demonstrate honest and ethical behavior in all our activities. Choosing the course of highest integrity is our intent and we will establish andmaintain the highest professional and personal standards. A well-founded reputation for scrupulous dealing is itself a priceless asset.
L E A DE RS H IP we have leaders of high integrity. Energy and enthusiasm that have the necessary managerial, professional and people skills to inspire a group or an organization to set high goals and achievethem willingly. We believe that leadership skills need to be strengthened at all levels within our organization and that managerial and professional competence is a necessary foundation.
QUALI TY &CON T INUOUS IMPR E M E N T we believe that quality and a relentless commitment to continuous improvement are essential to
our ongoing success. To this end, we define quality as understanding the customer'sexpectations, agreeing on performance and value, and providing products and services that meetexpectations 100 percent of the time. Our motto is, "Quality in all we do."
E N TH USIAS T IC PURSUI T OF PROF I T
successfully discharging our responsibilities to our shareholders to enhance the long-term profitability and growth of our company provides the best basis for our career security andmeaningful personal growth. We can best accomplish this by consistently meeting theexpectations of our customers and providing them with value.
EXTE RNAL & COMMUNI TY INVOLV E M E N T We believe that society must have industrial organizations that it can trust. Trust and Confidenceare earned by our performance, by open and direct communication, and by active involvement inthe communities in which we live and conduct our business."
CAN D I D & OP E N COMMUNICAT IONS
We value communications that are courteous, candid and open and that enable each of us to doour jobs more effectively by providing information that contributes to the quality of our judgment and decision making. Effective communication should also provide the means for gaining understanding of the company's overall objectives and plans and of the thinking behindthem.
E NJOY M E N T & F UN We believe that excitement, satisfaction and recognition are essential elements of a healthy,creative and high-performing work environment. Having fun in our work should be a normalexperience for everyone.
INNOVAT ION Success requires us to continually strive to produce break through ideas that result in improvedsolutions and services to customers. We encourage challenges to the status quo and seek organizational environments in which ideas are generated, nurtured and developed.
IN D IVI DUAL GROW TH & DE V E LOPM E N T we strongly believe in the dignity and value of people. We must consistently treat each other with respect and strive to create an organizational environment in which individuals areencouraged and empowered to contribute, grow and develop themselves and help to developeach other.
TE AMWORK & T N E RS H IP we believe that high-performing teams containing appropriate diversity can achieve whatindividuals alone cannot. Consciously using the diversity of style. Approach and skills afforded by teams is strength we must continue building into our organization.
D IV E RSI TY & IN TE RNAT IONAL F OCUS We value differences in gender, race, nationality, culture, personality and style because diverse
solutions, approaches and structures are more likely to meet the needs of customers and achieveour business goals.Corporate Responsibility Report
Our employees bring expertise and dedication to the workplace
Our People
More than 700 employees bring expertise and dedication to the workplace. We value eachemployee, value their input and views. Continuously striving to become employer of choice, we provide a workplace where people feel confident, valued and inspired.
The Organization of Comparison
Fauji Fertilizer Company
The organization with whom the comparison of Engro Chemical Pakistan Limited is to be doneis FFC Limited. The comparison can only be done by making the financial analysis of this particular Fertilizer Companies in a similar way in which the analysis of Engro Chemical
Pakistan Limited is to be done by first of all calculating all the major five ratios and interpretingthem one by one thereby gaining a position to make a comparison become their financialsituation.
An Overview
With a vision to acquire self - sufficiency in fertilizer production in the country, FFC wasincorporated in 1978 as a private limited company. This was a joint venture between FaujiFoundation (a leading charitable trust in Pakistan) and Haldor Topsoe A/S of Denmark.
The initial authorized capital of the company was 813.9 Million Rupees. The present sharecapital of the company stands at Rs. 3.0 Billion. Additionally, FFC has Rs. 1.0 Billion stakes inthe subsidiary Fauji Fertilizer Bin Qasim Limited (formerly FFC-Jordan Fertilizer CompanyLimited).
FFC commenced commercial production of urea in 1982 with annual capacity of 570,000 metrictons.
Through De-Bottle Necking (DBN) program, the production capacity of the existing plantincreased to 695,000 metric tons per year.
Production capacity was enhanced by establishing a second plant in 1993 with annual capacity of 635,000 metric tons of urea.
FFC participated as a major shareholder in a new DAPS/Urea manufacturing complex with participation of major international/national institutions. The new company Fauji Fertilizer BinQasim Limited (formerly FFC-Jordan Fertilizer Company Limited) commenced commercial production with effect from January 01, 2000. The facility is designed to produce 551,000 metrictons of urea and 445,500 metric tons of DAP.
This excellent performance was due to hard work and dedication of all employees and the progressive approach and support from the top management.
In the year 2002, FFC acquired ex Pak Saudi Fertilizers Limited (PSFL) Urea Plant situated at
Mirpur Mathelo, District Ghotki from National Fertilizer Corporation (NFC) through privatization process of the Government of Pakistan.
This acquisition at Rs. 8,151 million represents one of the largest industrial sector transactions inPakistan
Mission Statement
FFC's mission is to sustain its role as the leader in industrial and agricultural advancement
of Pakistan by setting and achieving new and higher goals and taking initiatives. TheCompany is committed to ensuring safe and conducive work environment, providing high
quality products and allied services to its customers and profitable returns to its shareholders.
RATIO ANALYSIS
(Engro Chemical Pakistan Ltd.)
Ratios simply mean a number expressed in terms of another. A ratio is a statistical yardstick bymean of which relationship between two or various figures can be compared or measured. ThusRatio Analysis shows the relationship between accounting data. Ratio can be found out by
dividing on number by another number. Ratio analysis is an important and age old technique of financial analysis. Following are some of the advantages of ratio analysis.
Advantages:
· It simplifies the comprehension of financial statements.
· Ratios tell the whole story of changes in the financial condition of the business.
· It provides data for inter-company comparison. Makes inter-companycomparison possible
· Ratio analysis also makes possible comparison of the performance of differentdivisions of the company. The ratios are helpful in deciding about their efficiencyor otherwise in the past and likely performance in the future.
· Ratios highlight the factors associated with successful and unsuccessfulcompany. They also reveal strong companies and weak company¶s, over-valuedunder-valued companies.
· It helps in planning and forecasting. Ratios can assist management, in itsfunction of forecasting, planning, co-ordination, control and communications.
· It helps in investment decisions in the case of investors and lending decisions inthe case of investors and lending decisions in the case of bankers¶ etc.
T ypes of Ratios Analysis
Let us now have a detailed analysis of all the following four ratios for Engro chemicals PakistanLtd:
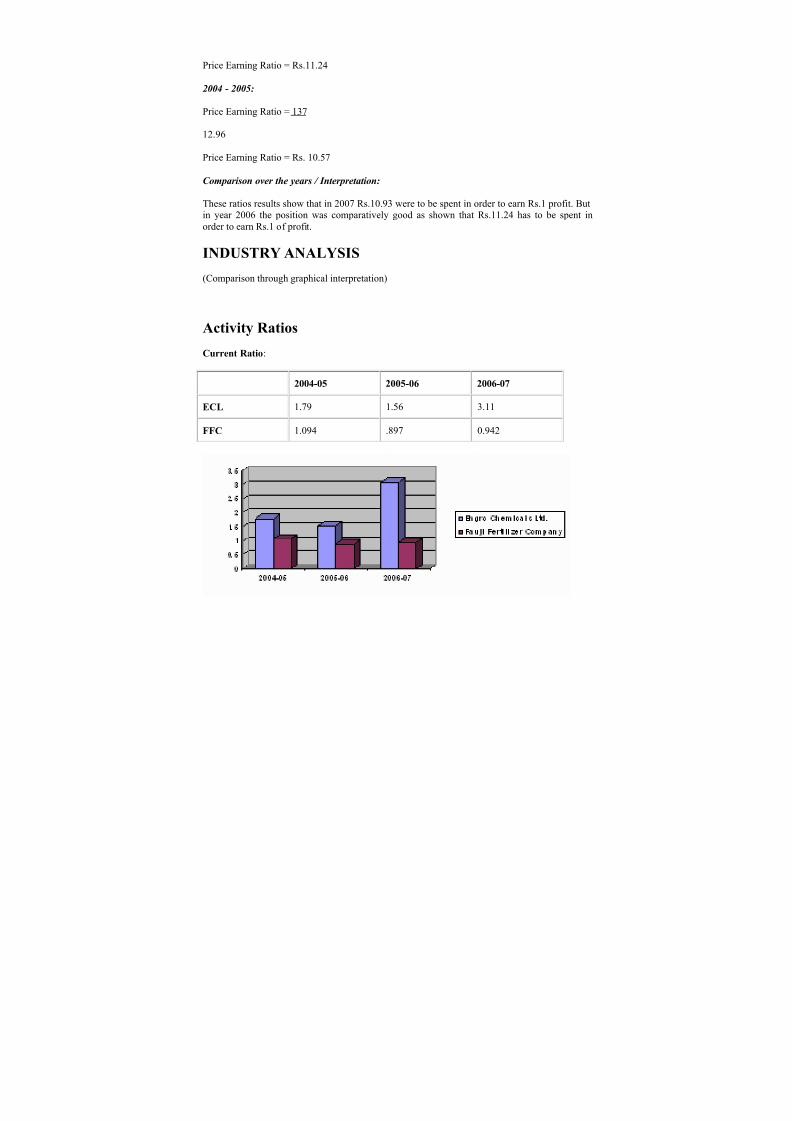
Current Ratio is equal to current assets divided by current liabilities
Current Ratio = Current Assets
Current Liabilities
2006 ± 2007:
Current Ratio = 16397198000
5264674000
Current Ratio = 3.11
2005 - 2006:
Current Ratio = 5684446000
3642415000
Current Ratio = 1.56
2004 - 2005:
Current Ratio = 5011555000
2800094000
Current Ratio = 1.79
Comparison over the years / Interpretation:
Current ratio is a general and quick measured of liquidity of company. It represents the margin of safety or cushion available to the auditor. It is the index of the company¶s financial stability. It isalso an index of the financial solvency and index of strength of working capital.
The current ratio of the company is increasing over the years right from 2004-07 constantly, thatis, it was 1.79 in 2004-05 and it is 3.11 in 2006-07.
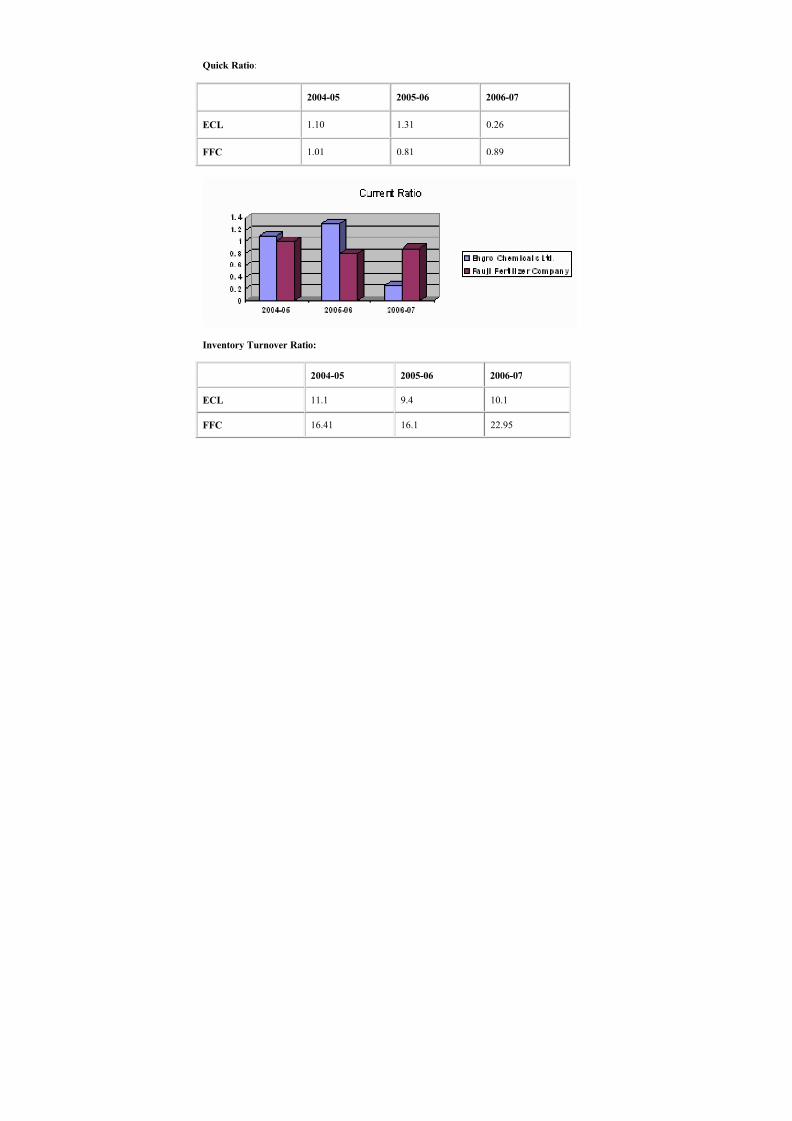
Acid Test (Quick) ratio is equal to Current assets fewer inventories divided by current liabilities.It gives more liquid amount of assets to cover your liabilities.
Quick Ratio = Current assets ± Inventories
Current liabilities
2006 ± 2007:
Quick Ratio = 16397198000±2690153000
5264674000
Quick Ratio = 0.26
2005 - 2006:
Quick Ratio = 5684446000± 923448000
3642415000
Quick Ratio = 1.31
2004 - 2005:
Quick Ratio = 5011555000± 1922982000
2800094000
Quick Ratio = 1.10
Comparison over the years / Interpretation:
The quick test ratio is a very useful measuring of the liquidity position of the company. It means
that company¶s ability to pay its short-term obligations or current liabilities immediately and is amore rigorous test of liquidity than the current ratio.
The quick ratio of the company as is shown by the above calculations is not consistent, anddecreasing with large percentage that is, the company is getting lesser and lesser liquid currentassets to cover its current liabilities.
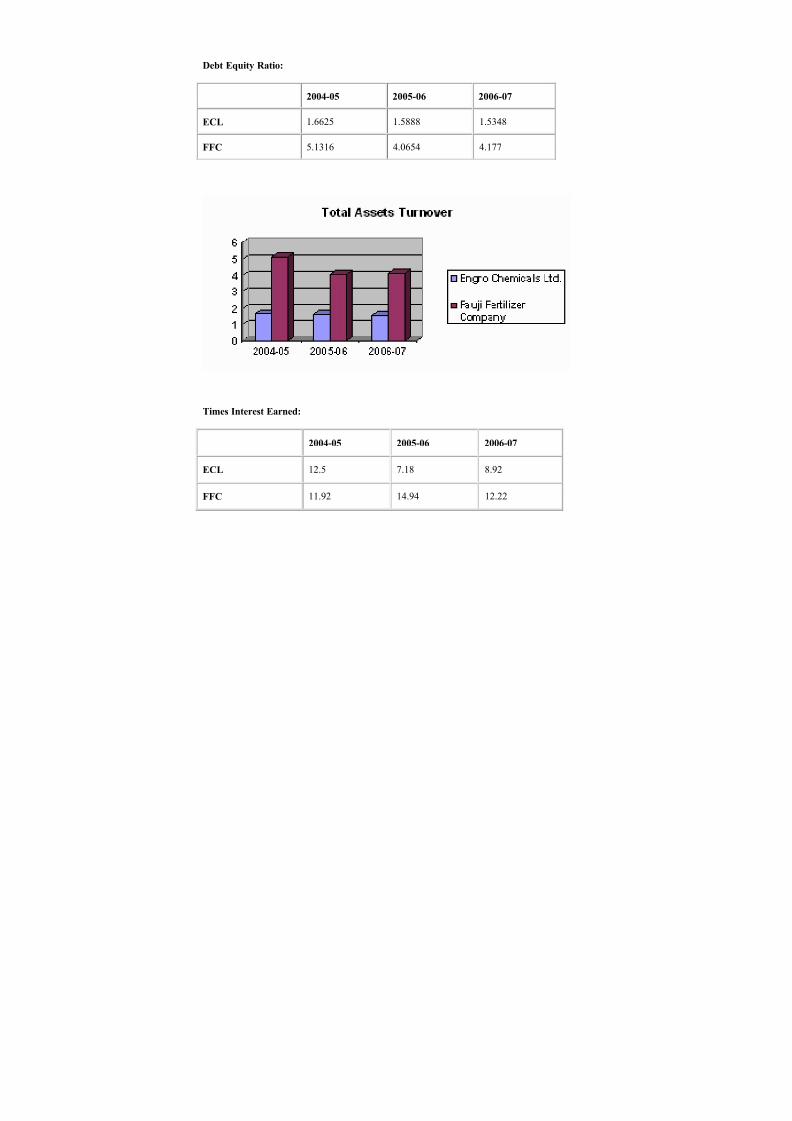
Debt equity ratio is equal to long term debts divided by stockholder¶s equity.
Debt Equity ratio = Long Term Debts
Stockholder¶s equity
2006 ± 2007:
Debt equity ratio = 17410060000
1934692000
Debt equity ratio = 1.5348
2005 - 2006:
Debt equity ratio = 370,501,304
233,187,729
Debt equity ratio = 1.588
2004 - 2005:
Debt equity ratio = 316,314,578000
190,255,511000
Debt equity ratio = 1.6625
Comparison over the years / Interpretation:
This ratio indicates the proprietor¶s claims of owners and outsiders against the company¶s assets.The purpose is to get an idea of the cushion available to outsiders and the liquidity of the
company. The interpretation of the ratio depends upon the financial and business policy of thecompany.
The debt ratio of the company has decreased gradually over the years right from 2004-07 whichis actually a positive sign for the company.
Debt Equity ratio increment is a negative point to management that the more of their business isfinanced by debts this will increase their financial charges or interest expense and company¶s
liquidity and hence decreasing the company¶s profit. The lower the ratio the higher thecompany¶s financing that is provided by the shareholders and larger the creditors cushion(margin of protection) in the extent of shrinkage of assets values or outright loss.
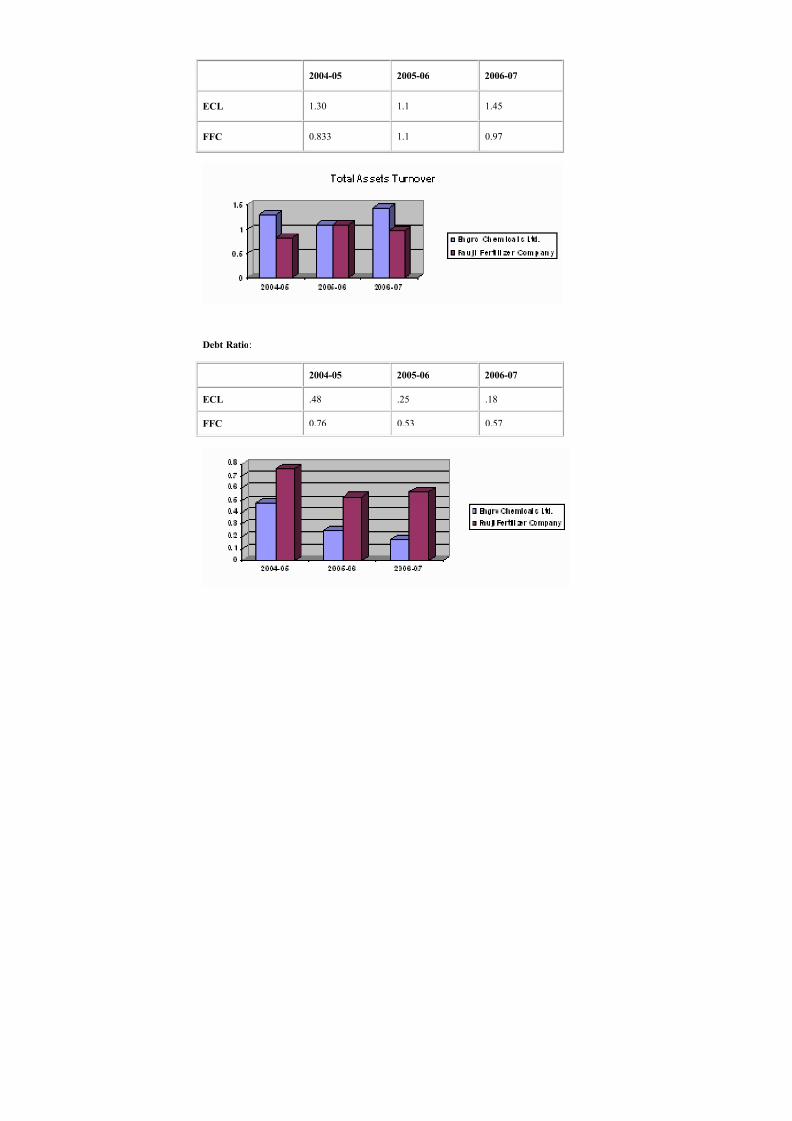
Debt Ratio:
Debt ratio is equal to total liabilities divided by total assets.
It can be defined as how much sufficient our assets are in retrieving the total debts. The debtratio of the company has been decreasing quite intensively almost over the last three years asshown clearly by the above calculations.
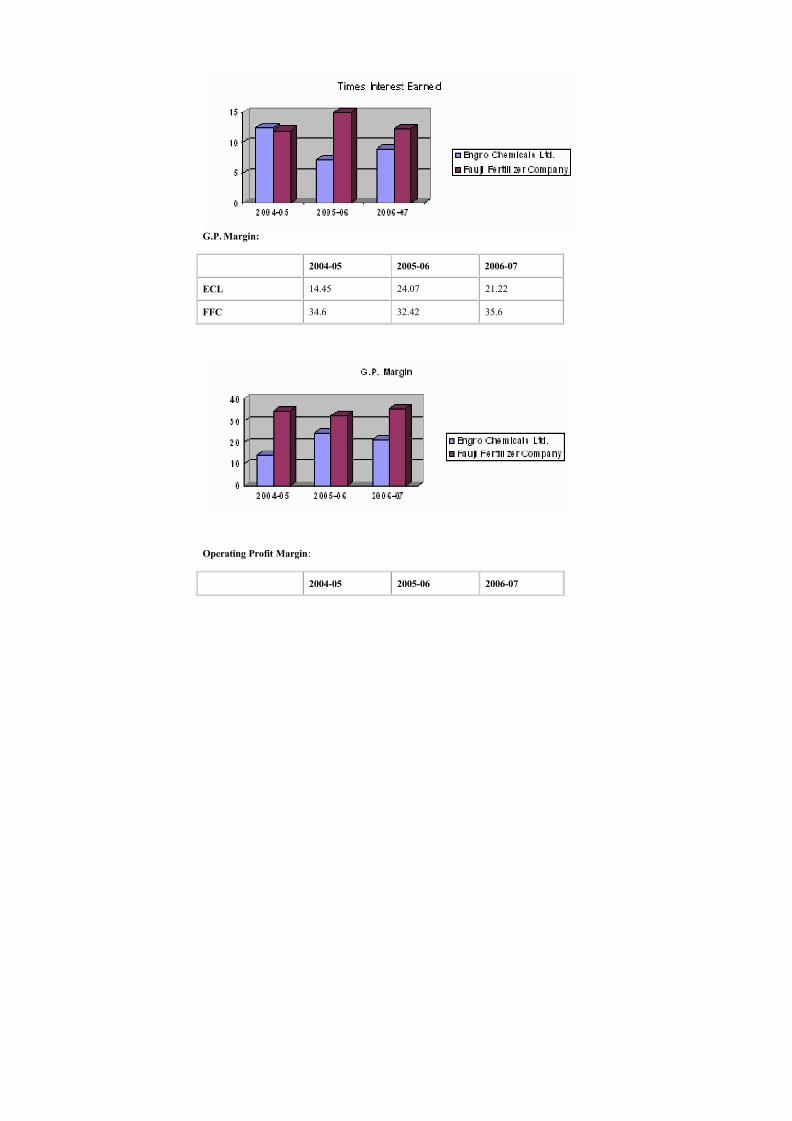
Times Interest Earned (Coverage Ratio):
It briefs that how many times the company has earned the interest. Or how many times thecompany has user it's earning before interest and taxes to cover the interest expense.
Times Interest Earned = Profit before Interest and Taxes
Interest Expense
2006 ± 2007:
Interest coverage Ratio = 4770535000
535023000
Interest Coverage Ratio = 8.92 times
2005 - 2006:
Interest coverage Ratio = 2602207000
362551000
Interest Coverage Ratio = 7.18 times
2004 - 2005:
Interest coverage Ratio = 34996421000
280070000
Interest Coverage Ratio = 12.5 times
Comparison over the years / Interpretation:
The interest coverage ratio is a very important from the lender point of view. It indicates thenumber of times interest is covered by the profit available to pay interest charges. It is an indexof the financial strength of the enterprise. A high ratio assures the lender a regular and periodic
interest income. But weakness of the ratio may create some problems for the company¶sfinancial manager in raising funds from the debts sources.
The no. of times the company earns interest has fluctuated dramatically, that is, it was 12.5 in2005, decreased down to 7.18 in 2006 and to rise up to 8.92 in 2007.
Activity Ratios
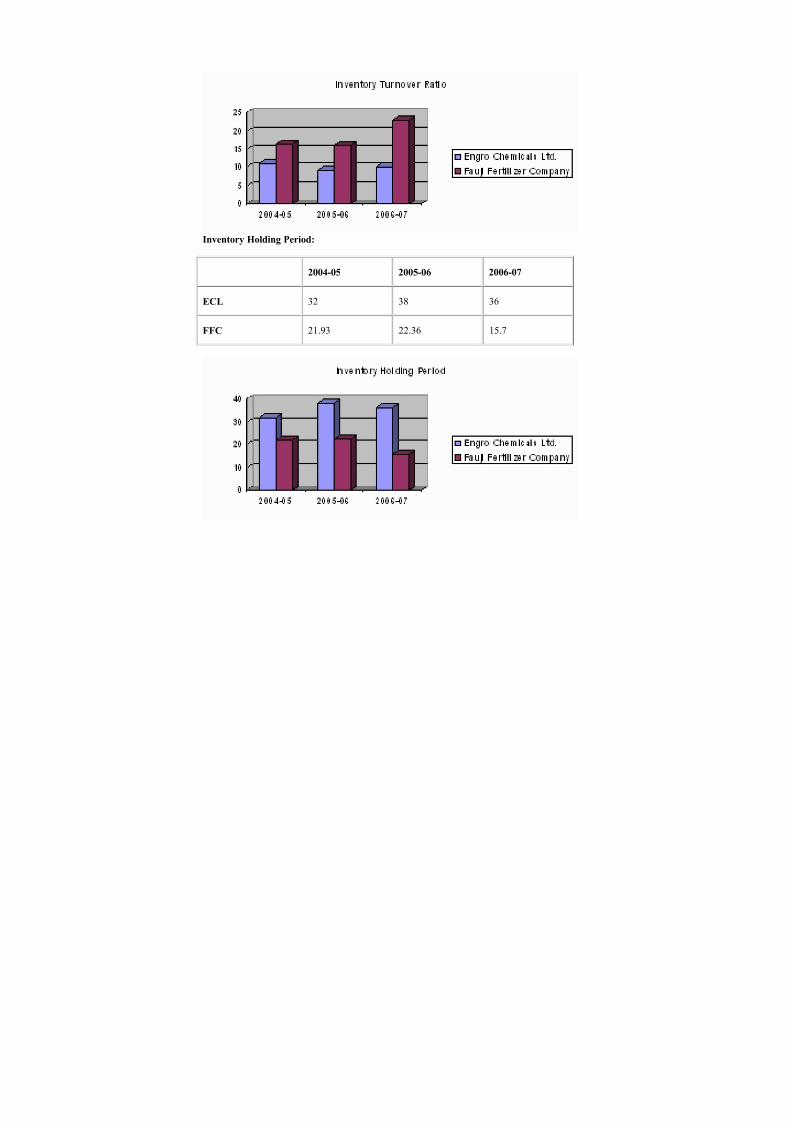
Inventory Turnover Ratio:
Inventory Turnover Ratio is equal to Cost of Goods Sold divided by Average Inventory.
Inventory Turnover ratio = Cost of Goods Sold Avg. Inventory
2006-2007
Inventory Turnover Ratio = 18262793000 1808192327
Inventory Turnover Ratio = 10.1 times
2005 ± 2006
Inventory Turnover Ratio = 13364524000
1421757872
Inventory Turnover Ratio = 9.4 times
2004 - 2005:
Inventory Turnover Ratio = 14332824000
1291245405
Inventory Turnover Ratio = 11.1 times
Comparison over the years / Interpretation:
Inventory turn over ratio measures the velocity of conversion of stock into sales. In other wordshow rapidly inventory is turning into receivables through sales.
In 2006 it was 9.4 times and in 2007 it was 10.1 times. In 2006 the ratio was low because of over investment in inventories. In year 2007 it is better that is 10.1 times in the year, which is quitegood because of good management.
Inventory holding period in days is equal to number of days in a year divided by inventoryturnover ratio.
Inventory Holding Period in Days = No. of days in a year
Inventory Turnover ratio
2006 ± 2007 :
Inventory turnover in days = 360
10.1
Inventory turnover in days = 36 days
2005 - 2006 :
Inventory turnover in days = 360
9.4
Inventory turnover in days = 38 days
2004 - 2005 :
Inventory turnover in days = 360
11.1
Inventory turnover in days = 32 days
Comparison over the years / Interpretation:
Inventory turn over ratio measures the velocity of conversion of stock into sales. In other wordshow rapidly inventory is turning into receivables through sales.
In 2006 it was 38 days times and in 2007 it was 36 days. In year 2006 it was quite good and in2007 it is better that is 36 days in a year to move inventory through sales, which is quite good
because of good management and polices.
Net F ixed Assets T urnover Ratio:
Net Fixed assts turnover ratio is obtained by dividing sales with net fixed assets, where,
(Net fixed assets = Total fixed Assets ± Accumulated Depreciation)
Fixed asset turnover ratio measures sales productivity and plant and equipment utilization. It isclear that this ratio is rising from 2006 which is 1.5 to 1.93 in 2007
Total asset turnover ratio measures that how much sales are generated through the total assets of the organization.
Total Asset Turnover Ratio = Sales
Total assets
2006 ± 2007 :
Total asset turnover ratio= 23183222000
15980816000
Total asset turnover ratio = 1.45 times
2005 - 2006 :
Total asset turnover ratio = 17601783000
15980816000
Total asset turnover ratio = 1.1 times
2004 - 2005 :
Total asset turnover ratio = 18276277000
14111630000
Total asset turnover ratio = 1.30 times
Comparison over the years / Interpretation:
It shows that company must manage its total assets efficiently and should generate maximumsales through their proper utilization. As the ratio, increases there are more revenue generated per rupee of total investment in asset. The company ability to produce a large volume of sales on asmall total asset based is an important part of the company¶s overall performance in terms of profits. In 2007, 2006. The ratio was 1.1, 1.45 times respectively. In 2007, the ratio indicates that
it is producing RS 1.45 sales per
Rupees of investment in total assets. So as time is going by this ratio is increasing which meanscompany performance is up to mark in terms of profits.
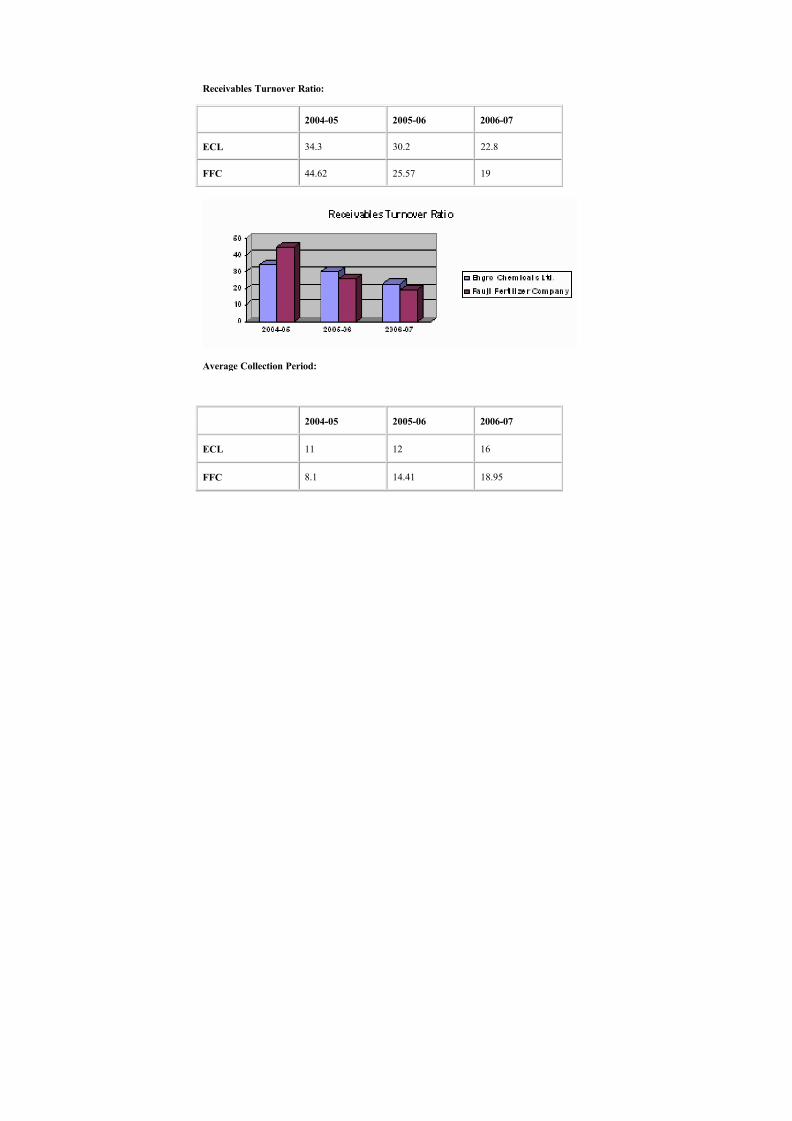
Receivables T urnover Ratio:
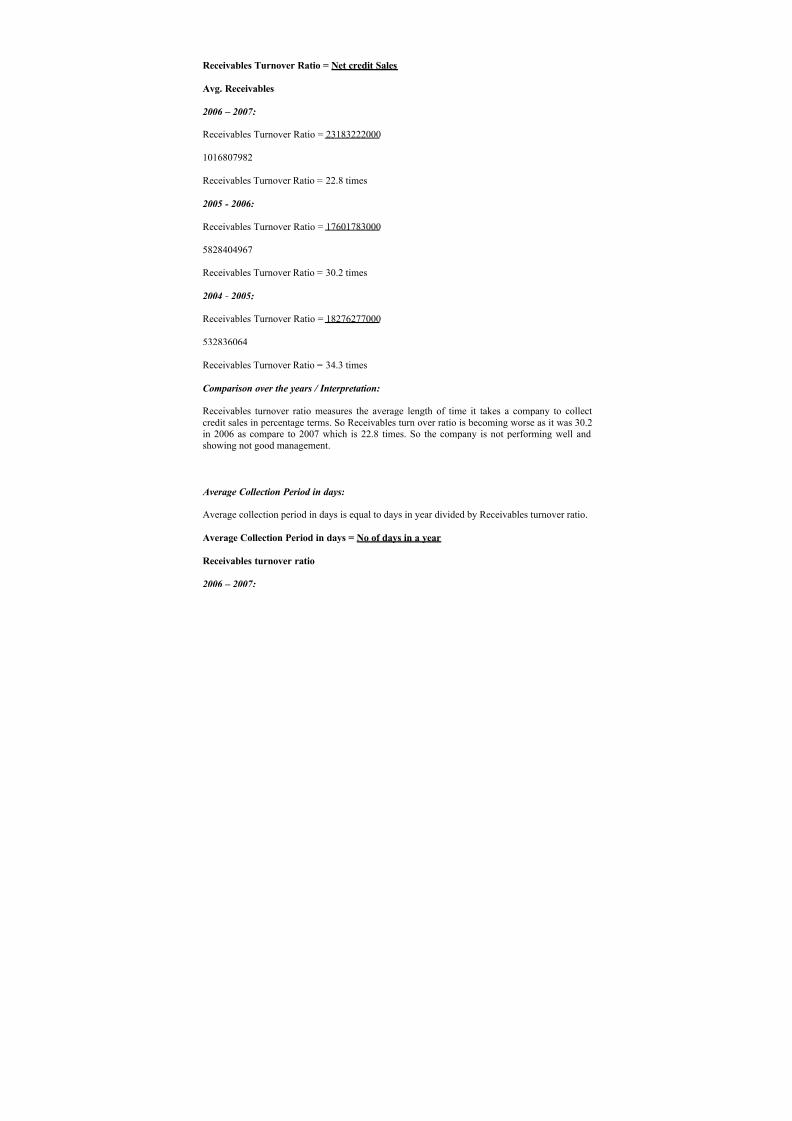
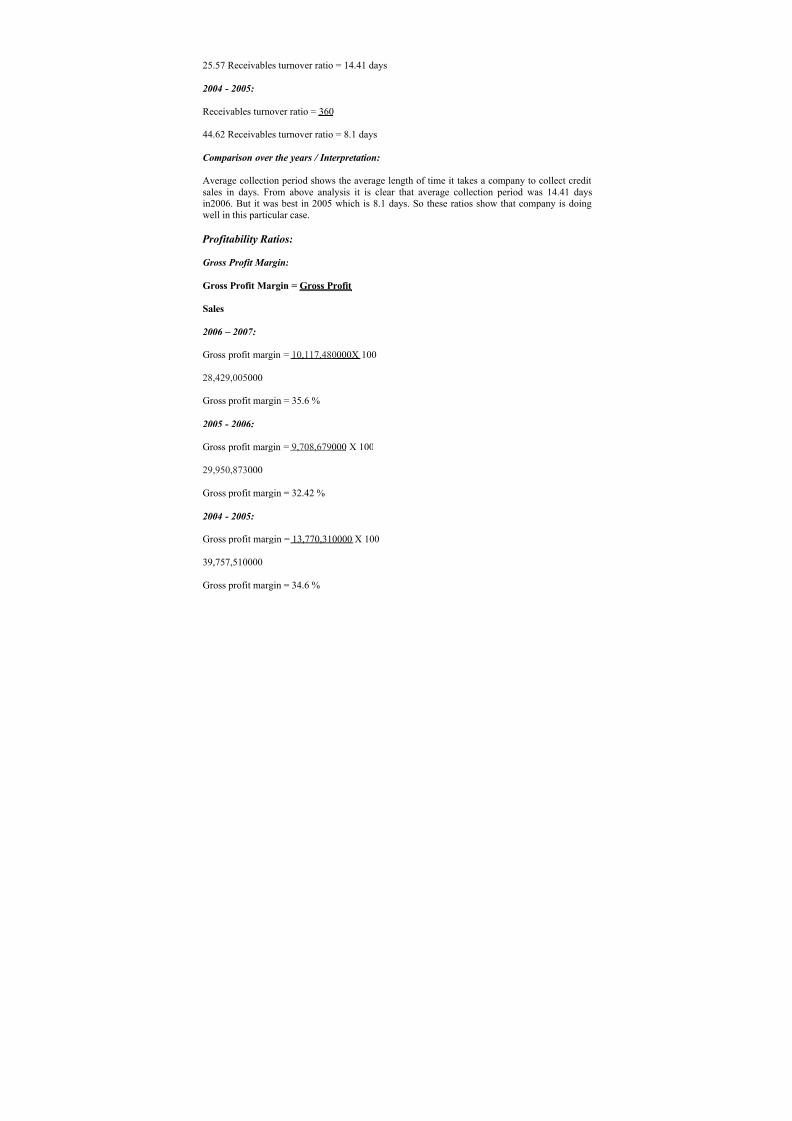
Receivables turnover ratio is equal to net credit sales divided by average receivables.
Receivables turnover ratio measures the average length of time it takes a company to collectcredit sales in percentage terms. So Receivables turn over ratio is becoming worse as it was 30.2in 2006 as compare to 2007 which is 22.8 times. So the company is not performing well andshowing not good management.
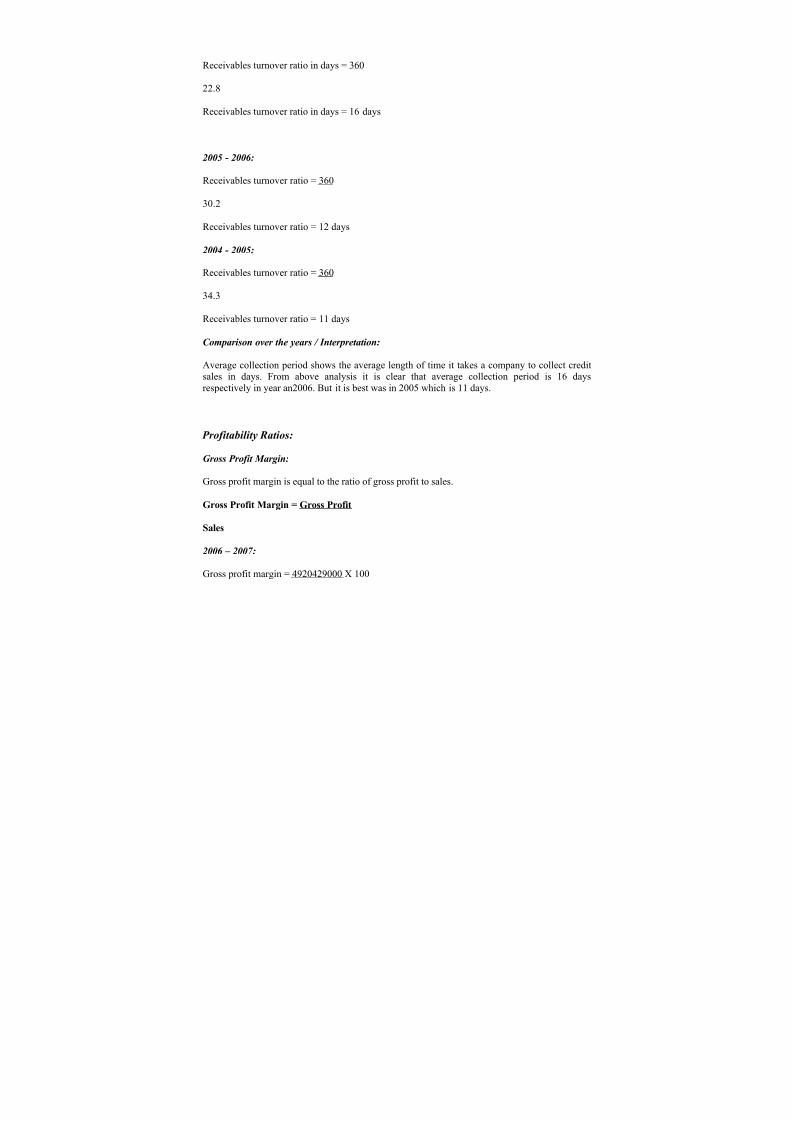
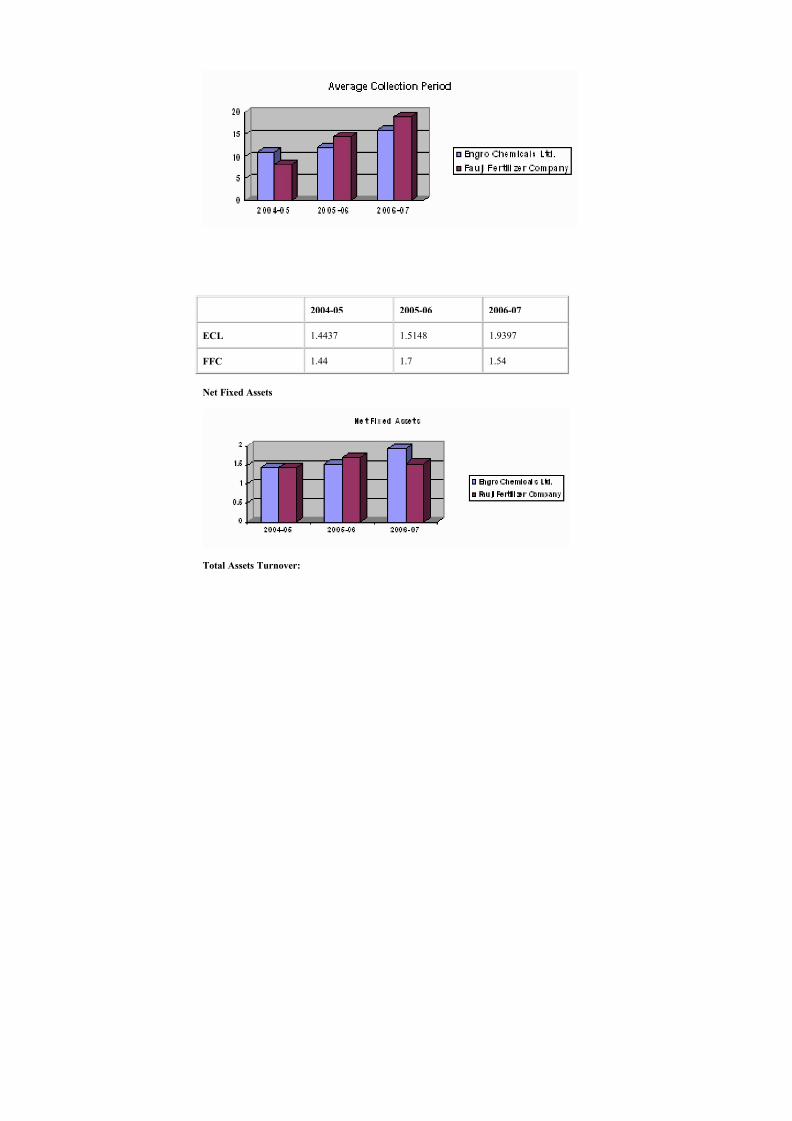
Average Collection Period in days:
Average collection period in days is equal to days in year divided by Receivables turnover ratio.
Average Collection Period in days = No of days in a year
Average collection period shows the average length of time it takes a company to collect credit
sales in days. From above analysis it is clear that average collection period is 16 daysrespectively in year an2006. But it is best was in 2005 which is 11 days.
Profitability Ratios:
Gross Profit Margin:
Gross profit margin is equal to the ratio of gross profit to sales.
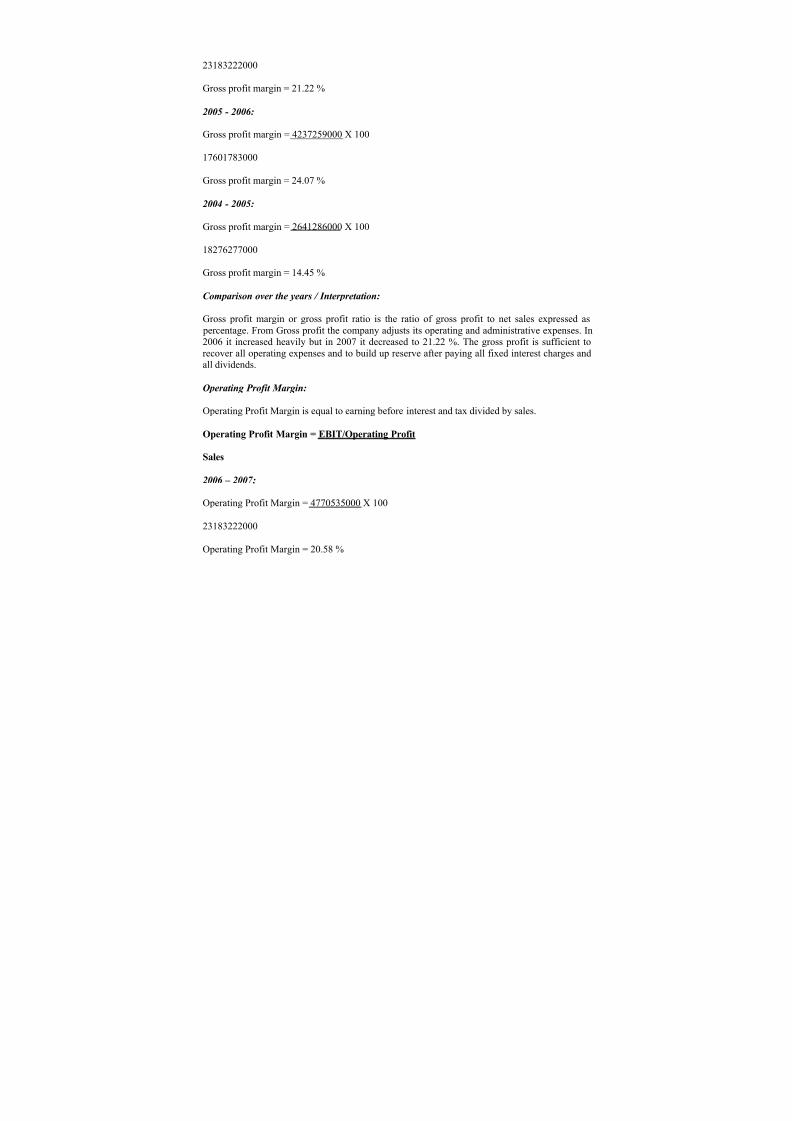
Gross profit margin or gross profit ratio is the ratio of gross profit to net sales expressed as percentage. From Gross profit the company adjusts its operating and administrative expenses. In2006 it increased heavily but in 2007 it decreased to 21.22 %. The gross profit is sufficient torecover all operating expenses and to build up reserve after paying all fixed interest charges andall dividends.
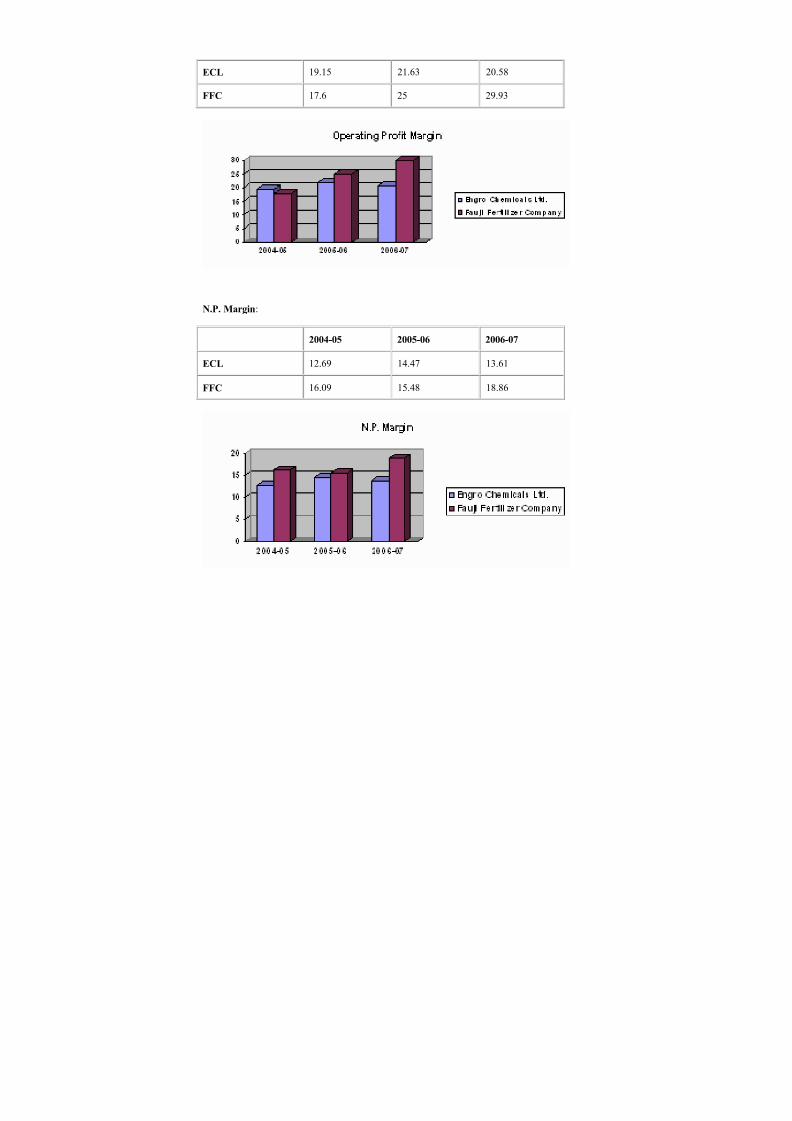
Operating Profit Margin:
Operating Profit Margin is equal to earning before interest and tax divided by sales.
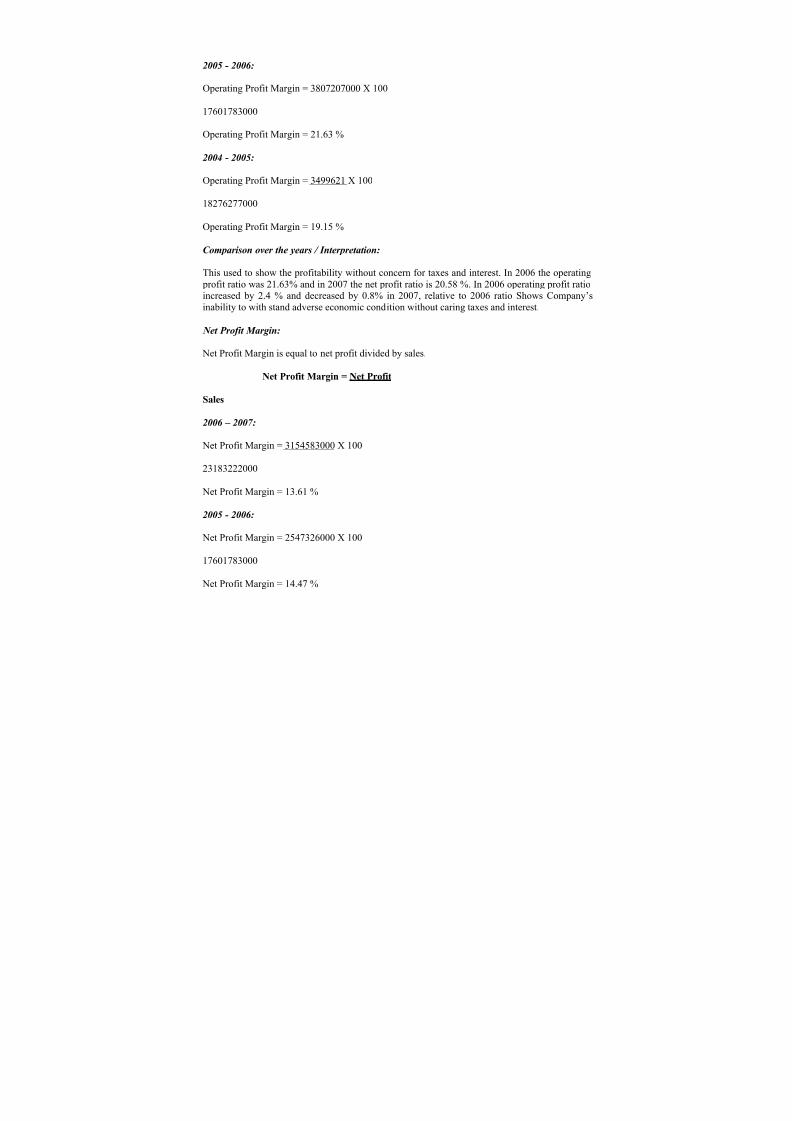
This used to show the profitability without concern for taxes and interest. In 2006 the operating profit ratio was 21.63% and in 2007 the net profit ratio is 20.58 %. In 2006 operating profit ratioincreased by 2.4 % and decreased by 0.8% in 2007, relative to 2006 ratio Shows Company¶sinability to with stand adverse economic condition without caring taxes and interest.
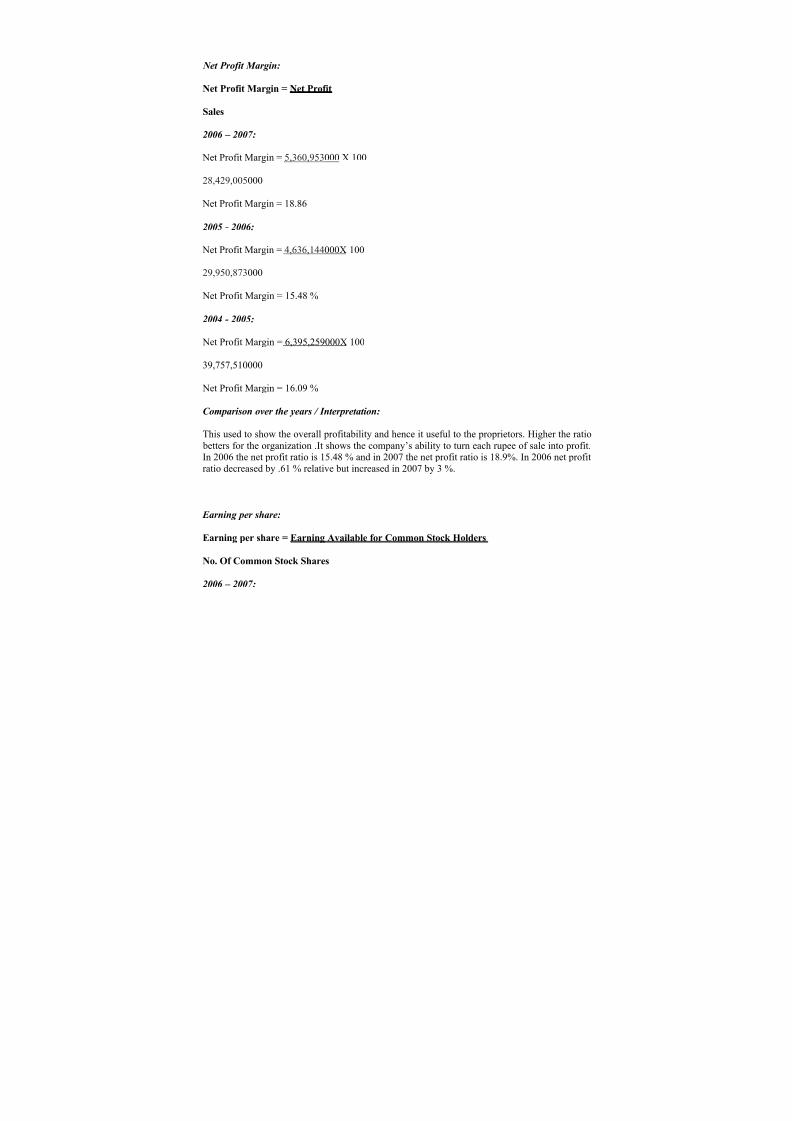
Net Profit Margin:
Net Profit Margin is equal to net profit divided by sales.
This used to show the overall profitability and hence it useful to the proprietors. Higher the ratio betters for the organization .It shows the company¶s ability to turn each rupee of sale into profit.In 2006 the net profit ratio was 14.47 % and in 2007 the net profit ratio is 13.61%. In 2006 net profit ratio increased by 1.7 % relative to 2005. But in 2007 it decreased slightly and remained13.61 %.
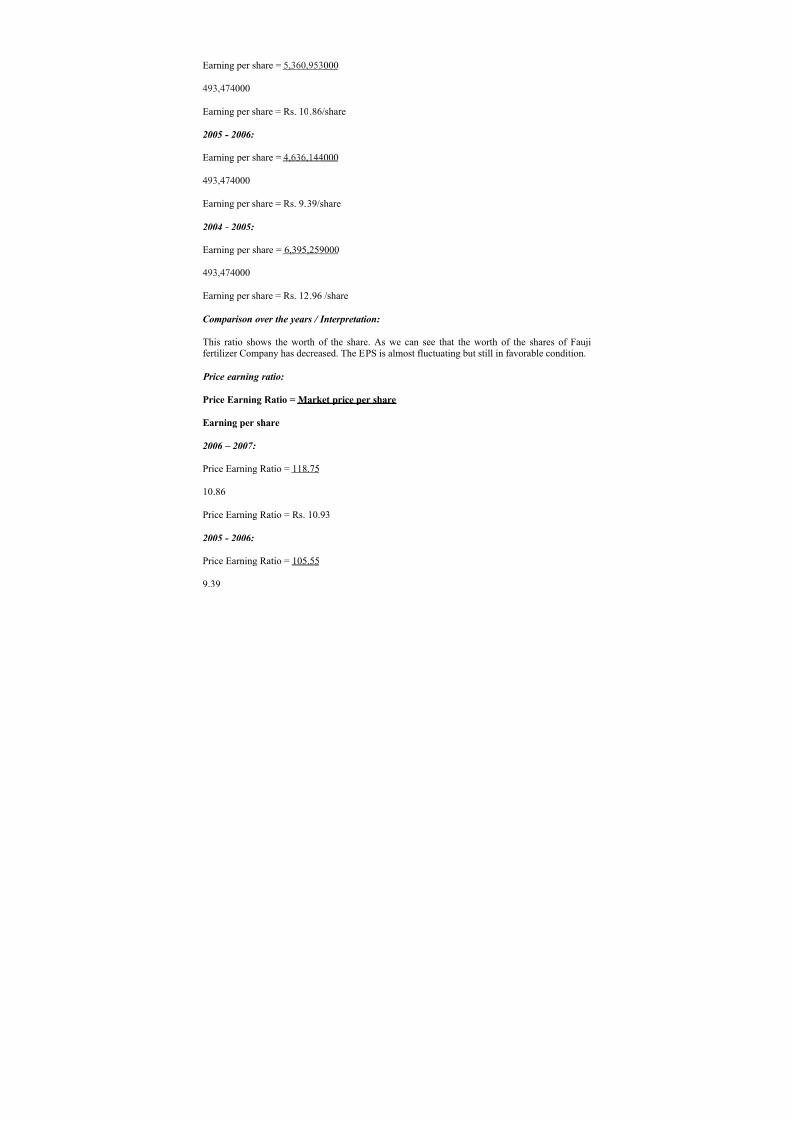
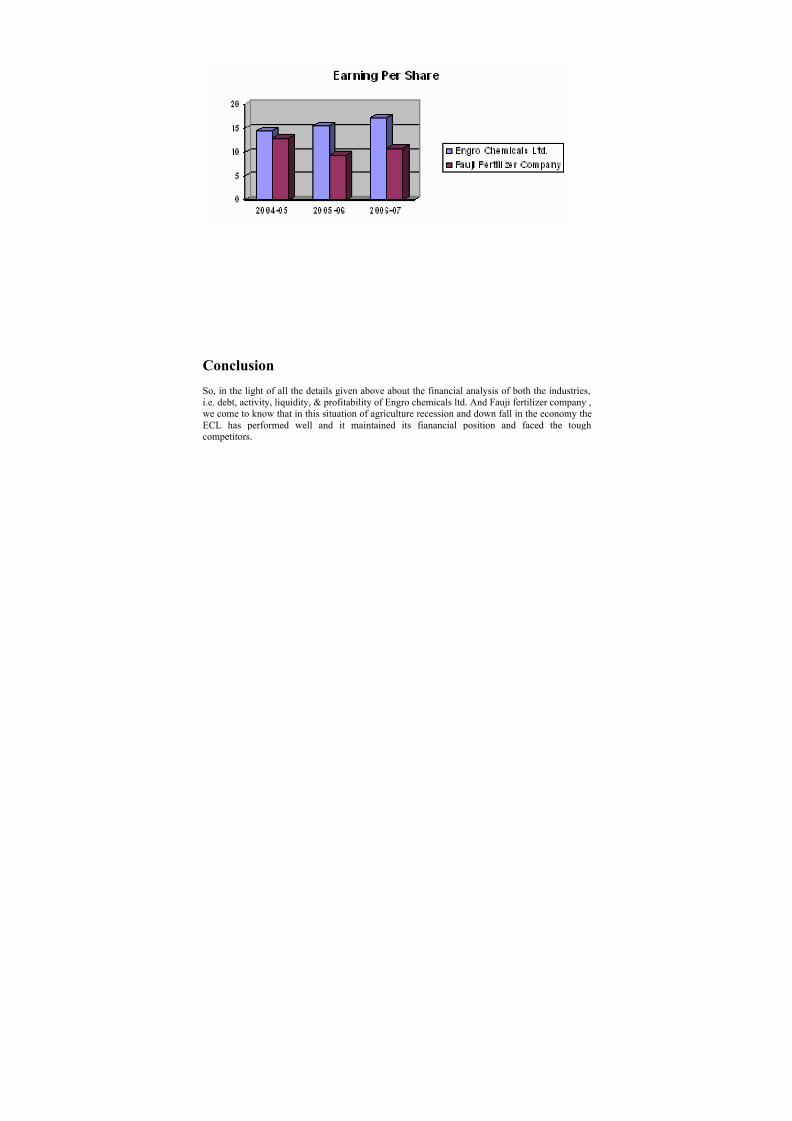
E arning per share:
This ratio shows that how much amount per share does a common stock holder attains.
Earning per share = Earning Available for Common Stock Holders
This ratio shows the worth of the share. As we can see that the worth of the shares of EngroChemical has increased. EPS is increasing at a constant rate, which are good signs for theinvestors.
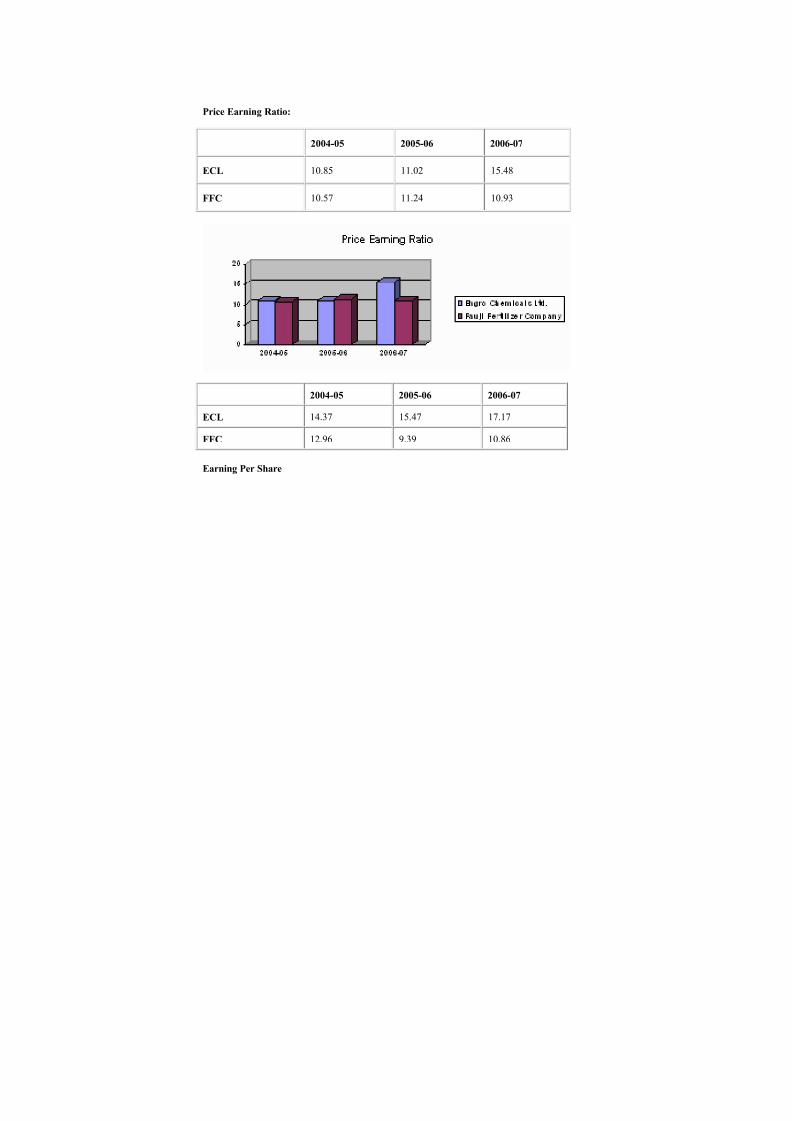
Price earning ratio:
It equals to the ratio of market price per share divided by earning per share.
Price Earning Ratio = Market price per share
Earning per share
2006 ± 2007 :
Price Earning Ratio = 265.79
17.17
Price Earning Ratio = Rs. 15.48
2005 - 2006 :
Price Earning Ratio = 170.48
15.47
Price Earning Ratio = Rs. 11.02
2004 - 2005 :
Price Earning Ratio = 155.92
14.37
Price Earning Ratio = Rs. 10.85
Comparison over the years / Interpretation:
In 2006 the situation, slightly become worse as compared to 2005. But in 2007, these ratiosresults Rs.15.48 were to be spent in order to earn Rs.1 profit.
Current ratio is a general and quick measured of liquidity of company. It represents the margin of safety or cushion available to the auditor. It is the index of the company¶s financial stability. It isalso an index of the financial solvency and index of strength of working capital.
Company's Current ratio has been decreasing gradually over the year¶s right from the 2005 to2007.
The quick test ratio is a very useful measuring of the liquidity position of the company. It meansthat company¶s ability to pay its short-term obligations or current liabilities immediately and is a
more rigorous test of liquidity than the current ratio.
The calculations above clearly show that the quick ratio of the company has been not constantover the years due to the changes in pre paids and inventories. But it increased in 2007 ascompared to 2006, which is positive point for the company.
This ratio indicates the proprietor¶s claims of owners and outsiders against the company¶s assets.The purpose is to get an idea of the cushion available to outsiders and the liquidity of thecompany. The interpretation of the ratio depends upon the financial and business policy of thecompany.
Debt Equity shows the relationship between the external equities or outside funds and internalequities and shareholder¶s funds. The debt equity ratio of the company has been decreasing over the years from 2005 to 2006 but in 2007 it increased, with maximum in the year 2004-05 therebydecreasing in the next year and increasing finally.
Debt Equity ratio increment is a negative point to management that the more of their business isfinanced by debts this will increase their financial charges or interest expense and company¶sliquidity and hence decreasing the company¶s profit. The lower the ratio the higher thecompany¶s financing that is provided by the shareholders and larger the creditors cushion(margin of protection) in the extent of shrinkage of assets values or outright loss.
It can be defined as how much sufficient our assets are in retrieving the total debts. We canobserve in our analysis that the debt ratio of the company is decreasing over the year which is a
good sign for the company, that is, the company uses less of its total liabilities for its currentassets.
T imes Interest E arned (Coverage Ratio):
Times Interest Earned = Profit before Interest and Taxes
The interest coverage ratio is a very important from the lender point of view. It indicates thenumber of times interest is covered by the profit available to pay interest charges. It is an indexof the financial strength of the enterprise. A high ratio assures the lender a regular and periodicinterest income. But weakness of the ratio may create some problems for the company¶sfinancial manager in raising funds from the debts sources.
The no. of times the company earns its interest fluctuates from over the year¶s right from 2005 to2007. The times interest earned by the company in 2007 returned a lot to the level where it wasin 2005.
Inventory turn over ratio measures the velocity of conversion of stock into sales. In other wordshow rapidly inventory is turning into receivables through sales.
In 2006 it was 16.1 times and in 2007 it was 22.95 times. In 2006 the ratio was low because of over investment in inventories. In year 2007 it is better that is 22.95 times in the year, which isquite good because of good management and polices.
Inventory H olding Period in days:
Inventory Holding Period in days = No of days in a year
Inventory turn over ratio measures the velocity of conversion of stock into sales. In other wordshow rapidly inventory is turning into receivables through sales.
In 2005 it was 21.93 days and in 2007 it was 15.7 days. In year 2007 it is quite good and in 2006it was better that is 22.36 days in a year to move inventory through sales, which is quite good
because of good management and polices.
Net F ixed Assets T urnover Ratio:
Net Fixed Asset Turnover Ratio = Sales
Net Fixed assets
2006 ± 2007 :
Fixed asset turnover ratio= 28,429,005000
18429779000
Fixed asset turnover ratio = 1.54 times
2005 - 2006 :
Fixed asset turnover ratio = 29,950,873000
17665694000
Fixed asset turnover ratio = 1.7 times
2004 - 2005 :
Fixed asset turnover ratio = 39,757,510000
27547005000
Fixed asset turnover ratio = 1.44 times
Comparison over the years / Interpretation:
Fixed asset turnover ratio measures sales productivity and plant and equipment utilization. It isclear that this ratio is increasing from 1.44 times in 2005 to 2006 which is 1.7and decreased to1.54 in 2007
It shows that companies must manage its total assets efficiently and should generate maximumsales through their proper utilization. As the ratio, increases there are more revenue generated per rupee of total investment in asset. The company ability to produce a large volume of sales on asmall total asset based is an important part of the company¶s overall performance in terms of profits. In 2007, & 2006 the ratio was 0.97, 1.10 times respectively. In 2007, the ratio indicatesthat it is producing RS .97 sales per
Rupees of investment in total assets. So as time is going by this ratio is fluctuating which meanscompany performance is not up to mark in terms of profits.
1171132000 Receivables Turnover Ratio = 25.57times
2004 - 2005 :
Receivables Turnover Ratio = 39,757,510000
890,874000
Receivables Turnover Ratio = 44.62 times
Comparison over the years / Interpretation:
Receivables turnover ratio measures the average length of time it takes a company to collectcredit sales in percentage terms. So Receivables is better in 2006 is 25.57 times as compare to2007, which is 19 times
Average Collection Period in days:
Average Collection Period in days = Days in a year
Receivables turnover ratio
2006 ± 2007 :
Receivables turnover ratio in days = 360
19 Receivables turnover ratio in days = 18.95 days
Average collection period shows the average length of time it takes a company to collect creditsales in days. From above analysis it is clear that average collection period was 14.41 daysin2006. But it was best in 2005 which is 8.1 days. So these ratios show that company is doingwell in this particular case.
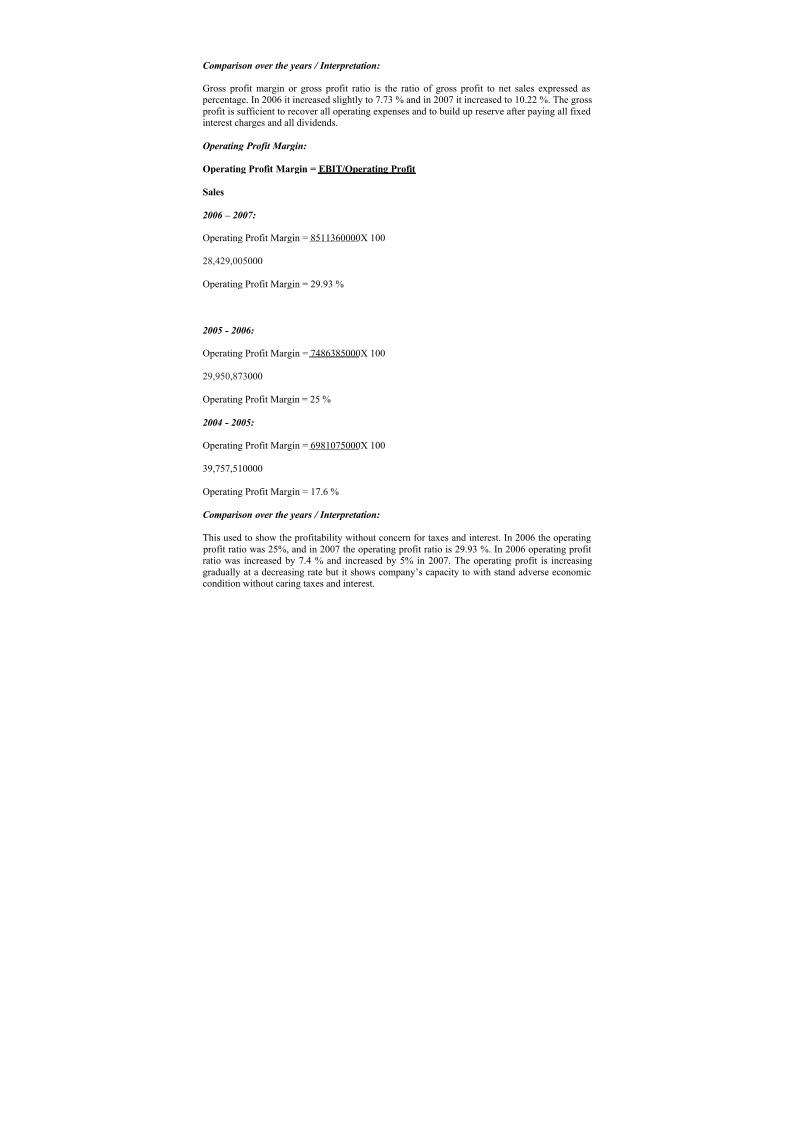
Gross profit margin or gross profit ratio is the ratio of gross profit to net sales expressed as percentage. In 2006 it increased slightly to 7.73 % and in 2007 it increased to 10.22 %. The gross profit is sufficient to recover all operating expenses and to build up reserve after paying all fixed
interest charges and all dividends.
Operating Profit Margin:
Operating Profit Margin = EBIT/Operating Profit
Sales
2006 ± 2007 :
Operating Profit Margin = 8511360000X 100
28,429,005000
Operating Profit Margin = 29.93 %
2005 - 2006 :
Operating Profit Margin = 7486385000X 100
29,950,873000
Operating Profit Margin = 25 %
2004 - 2005 :
Operating Profit Margin = 6981075000X 100
39,757,510000
Operating Profit Margin = 17.6 %
Comparison over the years / Interpretation:
This used to show the profitability without concern for taxes and interest. In 2006 the operating profit ratio was 25%, and in 2007 the operating profit ratio is 29.93 %. In 2006 operating profitratio was increased by 7.4 % and increased by 5% in 2007. The operating profit is increasinggradually at a decreasing rate but it shows company¶s capacity to with stand adverse economiccondition without caring taxes and interest.
This used to show the overall profitability and hence it useful to the proprietors. Higher the ratio betters for the organization .It shows the company¶s ability to turn each rupee of sale into profit.In 2006 the net profit ratio is 15.48 % and in 2007 the net profit ratio is 18.9%. In 2006 net profitratio decreased by .61 % relative but increased in 2007 by 3 %.
E arning per share:
Earning per share = Earning Available for Common Stock Holders
This ratio shows the worth of the share. As we can see that the worth of the shares of Faujifertilizer Company has decreased. The EPS is almost fluctuating but still in favorable condition.
These ratios results show that in 2007 Rs.10.93 were to be spent in order to earn Rs.1 profit. Butin year 2006 the position was comparatively good as shown that Rs.11.24 has to be spent inorder to earn Rs.1 of profit.
So, in the light of all the details given above about the financial analysis of both the industries,i.e. debt, activity, liquidity, & profitability of Engro chemicals ltd. And Fauji fertilizer company ,we come to know that in this situation of agriculture recession and down fall in the economy theECL has performed well and it maintained its fianancial position and faced the toughcompetitors.