• r Fhght Assessment of the Onboa d Propulsion System Model for the Performance Seeking Control Algorithm on an F-15 Aircraft John S. Orme Gerard S. Schkolnik NASA Dryden Flight Research Center Edwards, California Technical Memorandum 4705 July 1995 https://ntrs.nasa.gov/search.jsp?R=19950025004 2018-07-16T02:24:32+00:00Z
Transcript
• rFhght Assessment of the Onboa dPropulsion System Model for thePerformance Seeking Control
Astronautics, Inc. No copyright is asserted in the United States underTitle 17,U.S. Code. The U.S. Government has a royalty-free license toexercise all rights under the copyright claimed herein forGovernmental CDpbpurposes. All other rights are reserved by the copyright owner.
nozzle throat area, in 2
- environmental control system bleed air
drag
plenum bleed drag
1AmericanInstitute of Aeronautics and Astronautics
CDtfim
CIW
D
DINL
DNOZ
DSTAB
EPR
Vex
Fc
FN
FNP
FPR
FPRctar¢
FPRdis
FPR i
FPRo
FPRRe
FR
H
M
Ni
NIC2
N2
Nx
PD
PLA
PS2
Pr
combined inlet spillage and trim drag
compressor inlet variable guide vane
angle, deg
total aircraft drag, lb
incremental inlet spillage drag, lb
nozzle drag, Ib
incremental stabilator and inlet cowl trim
drag, lb
engine pressure ratio, PT6 IPT2
excess thrust, lb
gross thrust, lb
net thrust, lb
net propulsive force, lb
fan pressure ratio, PT2.5/PT2
off schedule C/VV factor
inlet distortion factor
installed stall line FPR
operating FPR
Reynolds factor
ram drag, lb
pressure altitude, ft
Mach
fan rotor speed, rpm
fan rotor speed, corrected to station 2, rpm
compressor rotor speed, rpm
longitudinal acceleration, g
percent difference, percent
power lever angle, deg
Static pressure at engine face, psi
total pressure, psi
RCW
SMF
SMHC
SSVM
SVM
TSFC
Tr
Vr
WA CC
WCfan
WChpc
WF
WFA/B
w:a.
Wt
Wto
Wt:
P
A3
11
Subscripts
meas
model
Superscript
Prefix
A
2
rear compressor variable vanes, deg
fan stall margin
high-pressure compressor stall margin
steady-state variable model
state variable model
thrust specific fuel consumption, sec -!
total temperature, °R
true airspeed, kn
DEEC-calculated corrected fan airflow,Ib/sec
corrected fan airflow, Ib/sec
corrected high pressure compressor
airflow, lb/sec
gas generator fuel flow, lb/hr
afterburner fuel flow, Ib/hr
fan airflow, lb/sec
aircraft weight, ib
zero fuel aircraft weight, lb
total indicated fuel weight, lb
angle of attack, deg
angle of sideslip, deg
inlet cowl angle, deg
inlet third ramp angle, deg
random effects
measured value
modeled value
postflight model-predicted value
perturbation or difference
AmericanInstitute of Aeronauticsand Astronautics
$0ffix, PW1128 Engine Station Numbers (fig. 2)
fan inlet or engine face
2.5 compressor inlet
compressor discharge
4 combustor exit
4.5 low-pressure turbine inlet
6 augmentor inlet
7 exhaust nozzle throat
Introduction
Optimizing the integrated control variables is an
important way to improve the performance of an
airplane. For example, the Advanced Engine Control
System (ADECS), flight tested by NASA in the early
1980's, was the first to use digitally communicated
information between the flight control and enginecontrol computers to increase engine performance. I A
shortcoming of the ADECS design was that it was based
on predetermined control schedules. This shortcoming
made the system unable to distinguish and optimize for
unique operating characteristics between different
engines of the same class (for example, two F100
engines with different levels of degradation).
Recently, an advanced optimization routine, called
Performance Seeking Control (PSC), was flownonboard a NASA F-15 aircraft. 2 The PSC is a
(fig. 1). The DFRC modified the F-15 airplane to theHighly Integrated Digital Electronic Control (HIDEC)
for the purpose of integrated control research. Unique
HIDEC features include a digital electronic flight
control system (DEFCS), two Pratt & Whitney (PW)
(West Palm Beach, Florida) F100-PW-1128 engines
with digital controls, and the digital data buses.
EC90 312- 3
Fig. 1. The F-15 highly integrated digital electroniccontrol aircraft.
American Institute of Aeronautics and Astronautics
Additional information on the F-15 airplane can befound in ref. 1.
Figure 2 shows the F100-PW-1128 engine. This low-
bypass ratio, twin-spool, afterburning turbofan engine isa derivative of the F100-PW-100 engine. The engine is
controlled by a full-authority digital electronic engine
control (DEEC) that is similar to the current production
F100-PW-220 engine controller. The DEEC provides
open-loop scheduling and closed-loop feedback control
of corrected fan speed (NIc2) and engine pressure ratio
(EPR) by way of the fuel flow (WF) and the nozzle area
(A_,). The compressor inlet variable guide vane (CIVV)
and rear compressor variable vane (RCVV) positions arescheduled with rotor speeds using open-loop control.The DEEC software has been modified to accommodate
PSC trim commands; however, the normal DEEC
control loops, such as Nlc2 and EPR, have not
been modified. Reference 13 gives a more detailed
description of the PW1128 engine.
Performance Seeking Control Algorithm.
The PSC as developed by MDA and PW and installedon the NASA F-15 HIDEC aircraft is a model-
based, adaptive algorithm which performs real-time
optimization of the propulsion system during quasi-
steady-state operation. Information available from the
onboard airdata, flight control, and engine control
digital computers is shared with the PSC software.
Essentially, the algorithm consists of an estimation
routine to update propulsion models and an optimization
routine to optimize the controlled variables.
The PSC algorithm and software was hosted on a
Vehicle Management System Computer (VMSC).
Figure 3 summarizes implementation of the PSC
algorithm into the HIDEC aircraft. The three major
algorithm elements as they reside in the VMSC consist
of the identification, modeling, and optimization
components. Four optimization modes were used during
the flight testing. They are the (1) maximum thrust modefor enhanced aircraft acceleration, (2) minimum fuel
mode for improved fuel efficiency during cruise, (3)
minimum turbine temperature mode for extendingengine life during cruise, and (4) rapid decelerationmode for reductions in time to decelerate from
supersonic to subsonic conditions. Each of these modes
produced beneficial performance improvements, 6-I° but
all the accrued benefits equally rely upon on accurate
in-flight thrust calculation. Modes 1 and 4 seek tomaximize or minimize FNP, or thrust, respectively.
Meanwhile, modes 2 and 3 are required to maintain a
constant referenced level of thrust as an optimization
constraint. Thus, errors in the FNP calculation will
affect the results for all the optimization modes.
The entire PSC algorithm is duplicated for left and
right propulsion systems, and no cross communicationexists between the models, identification, or
Combuster
High-pressureturbine
Low-pressureturbine Afterburner
//
TT2 N1 N2 PT4 TT4.5 DEEC sensors
CIW RCVV WF WFAB
Fig. 2. The F100-PW-1128 engine with digital electronic engine control.
4American Institute of Aeronautics and Astronautics
PSCcontrolledvariables
950200
Flight measurements
VehicleMana_lementSystem Computer
Foreground I Backgroundprocessing h
LoopingIdentification I Modeling Optimization _
PSCcontlolGffectors:1. Inlet cowl 5. Corefuel flow Optimalpropulsiontrims2. Thirdramp 6. Afterburnerfuel flow from theVMSC3. Variablevanes 7. Nozzlethroat area
4. Variablevanes 3 4 5 6 7 J950201
Fig. 3. The PSC implementation and process flow diagram.
optimization. The PSC trims are applied to the
propulsion system approximately five times a second
subsonically and two times a second supersonically. The
reduced trim rate application during supersonic
operation is the result of including the large inlet model.
Detailed descriptions of the PSC algorithm have beenreported,7, 8, 14 so only selected aspects related to model
validation are described in the following subsections.
Identification
The adaptive feature of the PSC algorithm is
primarily provided by a Kalman filter (Kf), which
attempts to match an onboard compact propulsion
system model (CPSM) to the characteristics of the
actual engine. The filter estimates five component
deviation parameters (CDP) that represent deviations
from nominal engine operation. These parameters
consist of low spool efficiency adder, high spoolefficiency adder, fan airflow adder, compressor airflow
adder, and high turbine area adder.15 Input to the Kf wasconstrained to the suite of sensors for the standard
DEEC measurements (fig. 2).
Kalman filter estimates of the CDP comprise a set of
intermediate variables passed to the modeling portion of
the PSC algorithm. The model is incrementally adjusted
with the CDP to more nearly accurately match
measured engine operation. This adaptive feature allows
for the PSC optimization to be applied to any F100
series engine independent of state of degradation.
The CDP are defined to be zero for a nominal engine
(that is, an engine exactly like the model). The CDP are
sensitive to any measured difference from the nominalengine including engine-to-engine variations, engine
deterioration, measurement bias, Reynolds effects, and
modeling errors. 5 The influence of any single effect onthe CDP cannot be identified because of the limitednumber of measurements available from the standard
DEEC.16
Modeling
The second major component of the PSC algorithm is
the CPSM. The CPSM integrates separate steady-state
models of the engine and inlet. The engine model
consists of the piece-wise linear Steady-State Variable
Model (SSVM) and nonlinear engine model. The
current linear point model is scheduled with flight
measurements. The CDP are included as input to theSSVM to improve modeling accuracy.
The SSVM is the only part of the modeling to be
adjusted with input from the Kf. Engine parameter
sensitivity to changes in control effectors and CDP is
stored for each point model. Because the PSC controller
usually trims the engine off its nominal operating line,
5AmericanInstitute of Aeronautics and Astronautics
the SSVMalso accountsfor off-nominalengineoperation.
Following completionof the linear SSVMcalculation,additionalnonlinearcalculationsaremade.Nonlinearcalculationsuseacombinationof analyticalequationsandempiricallyderiveddatatables.Inputtothe nonlinearroutinesincludesmeasurementsandSSVMoutput.If a variableisboth measuredandestimated,the flight measurementis usedin thenonlinearcalculations.AmongthenonlinearoutputareFNP, its force components, and SMF. Net propulsive
force and SMF are important parameters for the PSC
optimization.
A compact inlet model provides calculated inletperformance for the variable three-ramp F-15 inlet.
During subsonic operation, inlet performance is
characterized by inlet pressure recovery and inlet
spillage drag. Because the inlet ramps are considered
optimized for subsonic operation, the inlet ramps are not
commanded by PSC subsonically. At supersonic
conditions, however, PSC commands the inlet ramps to
achieve the desired performance goal. For supersonicoperation, inlet performance includes incremental
stabilator trim drag and the inlet stability margins of
shock displacement ratio and percent critical mass flow.
Because of the additional performance considerations at
supersonic conditions, the CPSM includes a morecomplicated and detailed version of the F-15 inlet
model during supersonic operation. Integration of theengine and inlet is accomplished by passing the SSVM
output of fan airflow to the inlet model as an input, and
inlet model-estimated pressure recovery is sent to the
SSVM and nonlinear engine model.
Optimization
Information of the CPSM-modeled plant is passed tothe optimization logic for optimal trim determination.
Certain CPSM output variables are treated as
constraints. Others are treated as an objective or cost
function. The FNP is used as an equality constraint for
the minimum fuel and minimum turbine temperaturemodes. Maximum FNP and minimum FNP are the
objectives of the maximum thrust and rapid deceleration
modes, respectively. Certain important constraints, such
as SMF, must not be allowed to become negative. A
feasible solution (that is, one that does not violate any of
*Yonke, William A. and Nobbs, Steven G., Performance Seeking
Control (PSC) Final Report, MDC 94B0003, McDonnell Douglas
Aerospace, St. Louis, Missouri, Jan. 1994. This report is not available
to the public. Contact the authors with queries regarding this report.
the constraints) is sought by the optimization logic with
successive calls to the CPSM between trim application.
Optimal trims are applied when the objective function
improves and after a predetermined number of calls tothe CPSM, referred to as looping• Optimal trim rate
depends upon flight condition and the number of loops.
At subsonic conditions, there are six loops to each
optimization cycle. At supersonic conditions, there are
three loops per cycle. It takes longer to complete three
loops supersonically than it does to complete six loops
subsonically. This difference is primarily caused by
inclusion of the larger compact inlet model and theadditional controls for inlet ramps and afterburner fuel
flow. Timing of the six-loop subsonic operation was
between 0.2 to 0.3 sec. For the supersonic three-loop
process, timing was between 0.5 and 0.7 sec.
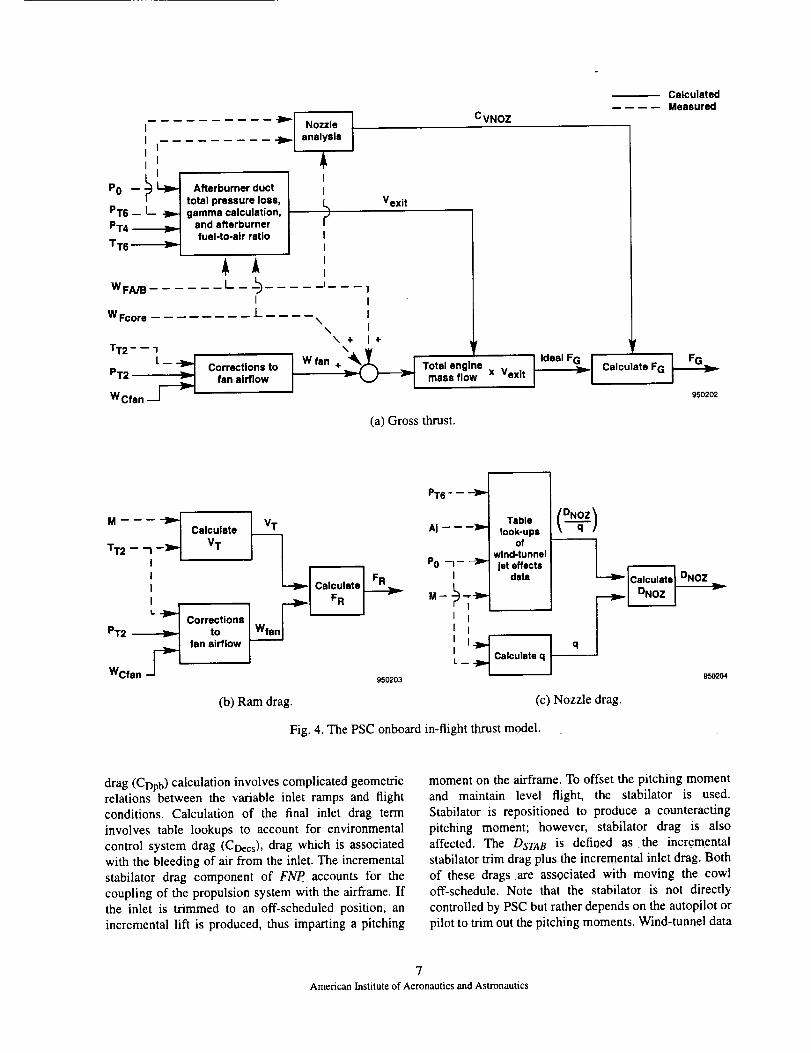
Net Propulsive Force Assessment Technique
Because the FNP calculation is given special attention
in this report, a closer look at the calculation is
warranted. Referring to figures 4(a)-4(e), calculations
for gross thrust (FG), ram drag (FR), nozzle drag(DNoz), inlet drag (DINL), and incremental stabilator
drag (DsTAB) are combined in equation 1 to define FNP.
FNP = FG - FR - DNOZ - DINL - DSTAB (1)
The different propulsion-related forces in equation 1
are assumed to act along the flightpath. This assumption
is reasonable for low angles of attack.
The PSC method of in-flight thrust calculation, likethe TI'W, is derived from an energy balance through the
engine and uses measured parameters as well as known
engine characteristics. As adopted for application to the
F100-PW-1128 engines, inputs to the "IqAV calculation
were limited to available production instrumentation.
Thus, a number of inputs to the TTW calculation are
taken directly from the SSVM outputs• These
parameters are the model predicted fan airflow (WCfan),augrnentor inlet total temperature (TT6), combustor exittotal pressure (PT4), and engine face total pressure
(PT2)- Table lookups, analytical gas dynamic equations,
and empirically derived equations are used in the
computation of F G.
The FR is defined and calculated as the product of true
airspeed, VT, and fan airflow, Wfan. The DNOZ ismodeled as a table look-up of wind-tunnel jet effects
data and scheduled with flight-measured input. The
DIN L is composed of three drag terms: CDtrim, CDpb, andCDecs. The inlet spillage drag combined with trim drag
is modeled and referred to as CDtri m. The plenum bleed
6American Institute of Aeronautics and Astronautics
III I
I I
P0 -- _ _ Afterburner ducttotal pressure loss,
PT6 -- L--_ t gamma calculation,PT4 _1 and afterburner
may be presented as a percentage of measured values;
however, any percentage error calculation containing a
denominator that approaches zero may be misleading.As described in the Results and Discussion section, the
• AFexme,s levels approach zero at some flight conditions.Thus, calculations with _kFeXmeasin the denominator willbe inflated. To alleviate the potential for misinterpreting
the results, modeling accuracy will be presented in
terms of percentage of full-scale measured Fex. The
Fexmeas value is taken from the test completed without
the PSC optimization selected, or (Nx × Wt)off. Keep inmind the percentage difference (PD) value does not
represent conventional modeling error. Note also that
PD values are less than percentage error values. The PD
was calculated according to equation 6.
PD = [(AFexmodeI - l_FeXmeas)[(NxM Wt)off] x 100 (6)
A secondary benefit of reporting modeling accuracyin terms of full-scale Fex is that PD analysis results can
be directly applied to the prior PSC findings. Forexample, prior findings identified a 10 percent AFex
increase for maximum thrust mode operation at Mach0.7 and an altitude of 30,000 ft. The PD results indicate
a 2 percent level of AFex modeling accuracy at this
condition. Thus, bounds on the optimization results maynow be given. The maximum thrust mode achieves
between an 8- to 12-percent increase in Fex.
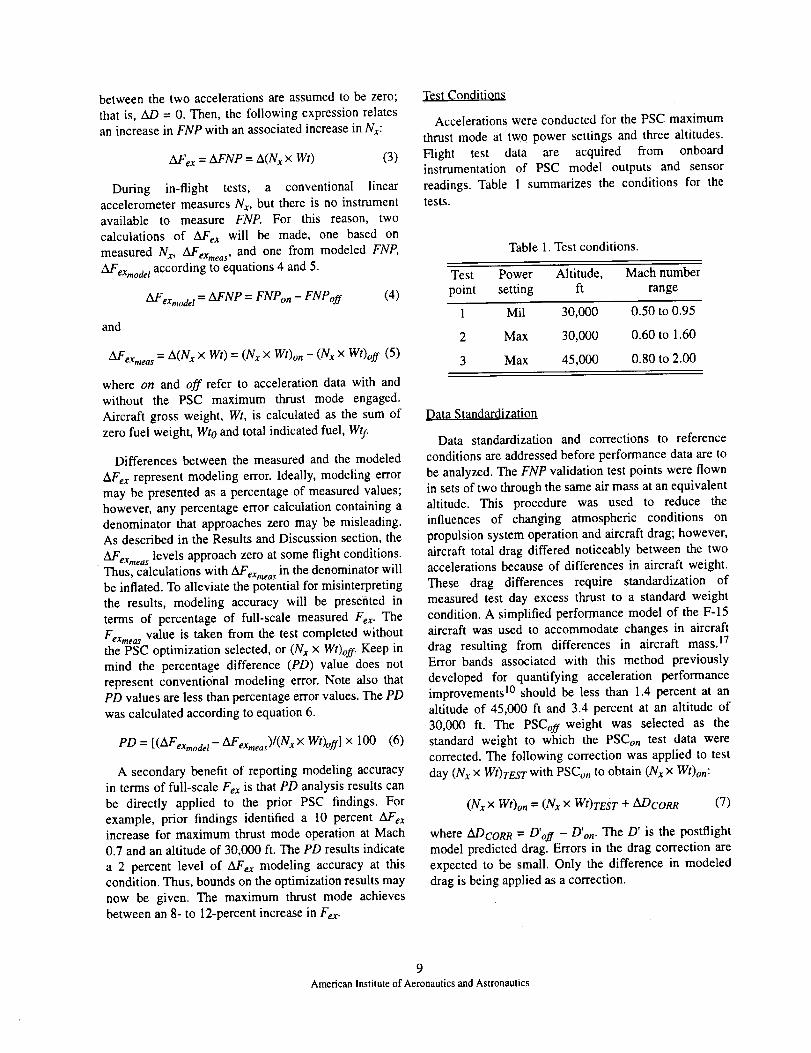
TCZt Condi¢iQn_
Accelerations were conducted for the PSC maximum
thrust mode at two power settings and three altitudes.
Hight test data are acquired from onboard
instrumentation of PSC model outputs and sensor
readings. Table ! summarizes the conditions for thetests.
Table I. Test conditions.
Test Power Altitude, Mach number
point setting ft range
1 Mil 30,000 0.50 to 0.95
2 Max 30,000 0.60 to 1.60
3 Max 45,000 0.80 to 2.00
Data Standardization
Data standardization and corrections to reference
conditions are addressed before performance data are to
be analyzed. The FNP validation test points were flown
in sets of two through the same air mass at an equivalent
altitude. This procedure was used to reduce the
influences of changing atmospheric conditions on
propulsion system operation and aircraft drag; however,
aircraft total drag differed noticeably between the two
accelerations because of differences in aircraft weight.These drag differences require standardization of
measured test day excess thrust to a standard weight
condition. A simplified performance model of the F-15
aircraft was used to accommodate changes in aircraftdrag resulting from differences in aircraft mass. 17
Error bands associated with this method previously
developed for quantifying acceleration performanceimprovements 10 should be less than 1.4 percent at an
altitude of 45,000 ft and 3.4 percent at an altitude of
30,000 ft. The PSCoff weight was selected as thestandard weight to which the PSCon test data were
corrected. The following correction was applied to test
day (N x x Wt)TEST With PSCon to obtain (N x x Wt)on:
(Nx x Wt)o n = (N x x Wt)resr + ADcoRR (7)
where ADcoRR = D'off - D'on. The D' is the postflightmodel predicted drag. Errors in the drag correction are
expected to be small. Only the difference in modeleddrag is being applied as a correction.
9
AmericanInstituteof Aeronautics and Astronautics
Uncertainty Analysis
Measurement uncertainty of z_d_exmeas must be known
if Fexmeas is to be considered the true value ofcomparison for _kFexmodel. To that end, an uncertaintyanalysis was performed to gauge the significance of
measurement errors on the lXFexmeas calculation. Table 2
lists the measured inputs to the _kFexmeas calculation.Measurement of Nx has a manufacturer's quoted
precision of _+0.50 percent full-scale. The precision of
the total indicated fuel weight, Wtf was +3.50 percentfull-scale. Aircraft empty weight, obtained in special
weight and balance tests, has a -l-0.07 percent full-scale
precision.
Measurement uncertainty of zXFexmeas was less than1.15 percent at test condition 1. This test representstypical data to be analyzed for excess thrust modeling
accuracy. Levels of uncertainty are expected to be
similarly small for the other test conditions.
Table 2. Measurement ranges and uncertainties of
AFex input parameters.
Uncertainty, percent
Parameter Range of full scale
Nx -1 to 1 g _+0.50
Wto 0 to 280,000 lb 2-0.07
Wry 0 to 10,800 Ib .+.3.50
fan pressure ratio (FPR). If FPR is increased at a
constant airflow, then stall margin is reduced (fig. 5(a)).
Reduced stall margin was observed and reported for
three of the PSC optimization modes, 7 especially at
subsonic flight conditions. Individual components of the
stall margin calculation can not be assessed because of
the insufficient information available during flight test.
Even so, reviewing the methodology of the PSC SMF
model to understand the possible sources of error isworthwhile.
The PSC incorporates the PW stability audit
methodology that assesses the effects shown in
figure 5(a) to predict SME Base stall line data obtained
from engine testing at Arnold Engineering DevelopmentCenter (AEDC) (Tullahoma, Tennessee) of a one-sixthscale F-15 model in 1970-1971 were tabulated and
stored onboard the VMSC.1 A base stall line definition
is determined in real-time with SSVM-corrected fan
airflow as input to a table lookup. The base stall line is
adjusted by a Reynolds factor (AFPRRe), CIVV factor
(FPRcwv), random effects, 1"1,and distortion effects(AFPRdis) to calculate the installed stall line. The
AFPRRe accounts for off-design airflow temperature and
density. A decrease in Reynolds number lowers the fan
stall line by decreasing its fan pressure ratio, FPR. The
FPRctvv describes the effects of off-schedule guide
vanes. Opening the variable guide vanes of the fanreduces the FPR of the stall line. The random effects
include a l-percent margin for engine-to-engine
variations and a 1-percent margin for control tolerances.
Fan Stall Margin Assessment Technique
Engine stability margin is expressed in terms of stall
margin remaining. Stall margin is defined as the
difference between the stall and operating pressure
ratio, at constant airflow, divided by the reference
(operating) pressure ratio. Stall margin may be defined
for the fan and for the compressor, but only the SMF is
described in this report. Fan stall margin is one of the
critical parameters output from the CPSM. This margin
is used as a constraint during the optimization process.Calculated stall margin must never be allowed to
become negative while optimizing the selected
performance index. A negative calculated stall marginmay cause the engine to stall. The intentional fan stall
test was conducted to quantify the overall accuracy ofthe PSC SMF model.
Much of the performance gain achieved by PSC at
subsonic speeds is accomplished by uptrimming the
engine pressure ratio (EPR), effectively increasing the
Because there are no known means of determining
random effects in-flight, r I is fixed at a constant 2
percent. Distortion effects are made to adjust the stall
line for distorted airflow entering the engine face. ThePSC uses an inlet distortion model which takes into
account angle of attack, ex, angle of sideslip, [3, Mach
number, and compressor inlet variable vane angle.Tabulated results from the AEDC tests were
incorporated as part of the PSC inlet distortion model.An increase in AFPRdis also causes the stall line FPR tobe reduced. All decrements to the base stall line are
determined in real-time by the PSC model.
Besides adjustments to the base stall line, a fixed
amount of stall margin buffer is added to the nominal
operating line. Pratt & Whitney suggested this addition
as a safety precaution to prevent stalling because of
uncertainties in the audit methodology and to increase
the buffer against the statistical nature of stalls.
Implementation of the minimum allowable stall margin
remaining has been as a fixed value of 4 percent at all
dry power settings and 6 percent at maximum
afterburner power. At partial afterburner power settings,
10American Institute of Aeronautics and Astronautics
Figure 6 shows the inputs and calculation process for
FPRi. The operating fan pressure ratio is defined as
FPR
Base stall line ---_ / ..,,,-"
/ __'ll%_S._''-- _ Installed stall line
,*"_ _,_'__ Available Ior uptrim _ "*
o_ _' _s_ _- /
"__ _'_ Nominal operating line
Wcfan
(a) Typical operating conditions.
950207
I I
18%
If
5%
2%-'-<
Without PSC With PSC
Remaining
Augmentor sequencing
Worst case inlet distortion
Random
Margin available
for uptrlm
#6%
!2%
Remaining
Inlet distortion
Random
950208
(b) Stall margin available for maximum afterburner power at Mach 0.9 and an altitude of 30,000 ft during cruise.
Fig. 5. Fan stall margin audit for the F100-PW-1128 engines during the PSC program.
11American Institute of Aeronautics and Astronautics
CalculatedMeasured
Wcfan
PT2 -)_
TT2
NIC2 - -- 7- -- --]m,-
IIII
I_ _ _),..
cwv - - T - -IIIII
c( -),-
M -)"-
Engine-to enginevariations ""-
Control tolerances _-]IP-
Base stall line
Reynolds factor, AFPRRe
ClVV factor, FPRcIvv
Distortion effects, AFPRdi s
Random effects,TI
(Assumed constant)
b
b
b
Fig. 6. The PSC onboard in-flight installed stall line calculation.
Installed stall line, FPR i
950209
12American Institute of Aeronautics and Astronautics
FPR o = PT2.5/PT2 (9)
where PT2.5 is determined from the SSVM, and PT2 is
output from the compact inlet model. Fan stall margin isdefined as
SMF = [FPRi - FPRo] /FPRo (10)
Intenliono! Fan Stall Method
Procedurally, fan stalls must be intentionally induced
because the PW F100 class of engines are proven to be
robust with respect to encountering stall and are very
unlikely to stall without some assistance. Errors in
estimated SMF will be determined by comparing SMFvalues at the time of a stall event. To reduce the
likelihood of a single bad data point, the test was
repeated so that a total of four stalls were evaluated.
Test Conditions
A steady-state cruise flight condition of Mach 0.9 andaltitude of 30,000 ft was chosen as the test condition tominimize the effect of outside factors and allow for a
very controlled test. For the test engine to be stalled,
power was set at maximum afterburner, while the other,
nontest engine was modulated to maintain constant
Mach number. A preprogrammed set of progressively
increasing EPR trim values was selected until a fan stallwas detected. Mach 0.9 and an altitude of 30,000 ft is
the engine design point. At this condition, no AFPRRe
adjustment is made. Inlet distortion is expected to verysmall at this condition. The variable vanes are on
schedule and not trimmed so that no FPRclvv
adjustments will be made. With these conditions, theSMF model provides its most accurate estimates.
Results and Discussion
Test results of the excess thrust test and the
intentional fan stall test are discussed in the following
subsections. The tests were designed to assess the FNP
and SMF modeling accuracy of the PSC algorithm.
Exce_
Figure 7 shows a comparison of two back-to-backaccelerations for test condition 1 with and without the
PSC maximum thrust mode selected. The curve labeled
PSCon is with maximum thrust mode selected. The
curve labeled PSCoff is without maximum thrust modeselected. Time to accelerate from Mach 0.5 to Mach
0.95 is reduced by 12 sec or about 15 percent with PSC,
as illustrated by the PSCon curve of figure 7(a). The
roughly 0.03-g increase of N x (fig. 7(b)) results from
significant increases in FNP (fig. 8(a)). The FNP gains
are achieved by uptrimming the engine and operating
with reduced SMF (fig. 7(c)).
Machnumber
12sec1.0-- _ PSCoff
.6
.5 I I I I I0 20 40 60 80
Time, sec 950210
(a) Measured Mach number.
Nx, g
.4
.3
.2
.1.5
PSC off--- PSC on
_I [ I I I
.6 .7 .8 .g 1.0Mach number
950211
(b) Measured longitudinal acceleration.
30_ _ PSC off
stall margin,
percent 10_-- .... . ...... ......__OI I I I "'i "-° I
Fig. 7. Maximum thrust mode optimization results attest condition 1.
The model and the measured values of Fex show
sustained increases from PSC maximum thrust mode
application for most of the run. Measured increase in
13American Institute of Aeronautics and Astronautics
Fex is nearly 1000 lb at Mach 0.7 (fig. 8(b)). At the same
Mach number, the model predicts 850 lb of increase in
FNP (fig. 8(a)). Throughout the acceleration, AFex,,odet
is predicted less than Z_FeXmeas.A maximum temperaturelimit causes the Fex increases to taper off somewhat nearthe end of the acceleration.
Figure 8(c) illustrates the PD between measured and
modeled AFex. Model accuracy is at 2 percent or less ofmeasured baseline excess thrust for most of the Mach
number range. As Mach 0.95 is approached, PD
increases to nearly 4 percent. Modeling accuracy is
expected to degrade above Mach 0.95 where the value
and uncertainty in propulsion system drag increase.
FNP,Ib
m pS c Off
--- PSC on
---- Difference between
15,000 _ffa_nd PSC on
10,000 _'_
5,0001 I I I t I
AFNP, Ib 1000_ ................... _--...
°r 5°_5r _ 17 18 _,AFexm°del ..... 1.0
Mach number950213
(a) Modeled increase in FNP.
15,000 r -- - PSC on/ ---- Difference between
N x x Wt, Ib _ ....... PSC off and PSC on
or 10,000 r
Fexmeas 5,000 [ J [ I I I
A(N x orWt), Ib 1000_ ....................500 "_"
AFexmeas 0 L I I I I.5 .6 .7 .8 .9 1.0
Mach number950214
(b) Measured increase in Fex.
':Fpercent
0 t_._ _..----_.5 .6
J
.7 .8 .9 1.0
Mech number950215
(c) Percent difference of modeled to measured increasein excess thrust.
Fig. 8. Excess thrust results at test condition 1.
Figures 9(a)-9(c) present comparison plots of the
measured to modeled AFex and PD for test condition 2.
The AFex levels lie between zero near Mach 1.0 and
2000 lb at higher Mach numbers. The level of accuracy
is less than 2 percent from low subsonic until around
Mach 1.3. At which point, modeling accuracy worsens
to reach about 10 percent above Mach 1.45.
FNP,Ib
-- PSC off
--- PSC on
50,000 r -"- Difference between
25,000
oI I I I I 1
AFNP, Ib 20001---__ ./ ......
or 10001__ .-'--'_ _ ...."AFexmodel 0 _," I " .-J .... " I t I
.6 •8 1.0 1.2 1.4 1.6
Mech number950216
(a) Modeled increase in FNP.
r -- PSC off
50'000 / --- PSC on
or / ---- Difference between
Nx x Wt, Ib 25,000Fexmeas
01 I I I I I
A(N x orWt), Ib 2000 I-- ...10001-- ..------.. i""'--" "'-J
'SFexmeas OF. I ""q- .-''" t I I.6 .8 1.0 1.2 1.4 1.6
Mach number950217
(b) Measured increase in Fex.
PD, 1
percentI I 1 I
6 .8 1.0 1.2 1.4 1.6
Mach number950218
(c) Percent difference of modeled to measured increasein excess thrust.
Fig. 9. Excess thrust results at test condition 2.
Results for test point 3 show Fex increases of about
1000 lb for most of the acceleration (figs. 10(a)-10(c)).Modeling accuracy is generally within 3 percent belowMach 1.7. From Mach 1.7 to Mach 2.0 the level of
14American Institute of Aeronautics and Astronautics
accuracy steadily deteriorates with a maximum
difference of over 10 percent at Mach 2.0.
FNP,Ib
PSC off
50,000 --- PSC onr-.- Differencebetween
25,000t_
0 ] I I I I ] I
AFNP, Ib 2000 F _._*"'_I _ ""° - =
or 1000 .----....
_Fexmode! 0 [ I "1_._ t I.8 1.0 1.2 1.4 1.6 1.8 2.0
Optimization of Turbofan Engines, NASA TM-4551,1993.
17Orme, John S., Digital Performance Simulation
Models of the F-15, F-16XL, F-18, F-104, TACT F-111,
X-29, and Hypersonic Research Vehicle, NASATM- 104244, 1992.
17
American Institute of Aeronautics and Astronautics
REPORT DOCUMENTATION PAGE Form ApprovedOMB No. 0704-0188
iiii
Publtc repealing burden for this collection of information is estimated to average 1 hour per response, including the time for reviewing instructions, searching existing data sources,
gathering and maintaining the data needed, and completing and reviewing the collection of information. Send comments regarding this burden estimate or any other aspect o! this col-
lection of information, including suggestions for reducing this burden, to Washington Headquarters Services, Directorate for Information Operations and Reports, 1215 Jefferson Davis
Highway, Suite 1204, Arlington, VA 22202-4302, and to the Office of Management and Budget, Paperwork Reduction Project (0704-0188), Washington, DC 20503
1. AGENCY USE ONLY (Leave blank) 2. REPORT DATE 3. REPORT TYPE AND DATES COVERED
July 1995 Technical Memorandum4. TITLE AND SUBTITLE 5. FUNDING NUMBERS
Flight Assessment of the Onboard Propulsion System Model for the Perfor-
mance Seeking Control Algorithm on an F-15 Aircraft
Presented as AIAA 95-2361 at the 31 st AIAA/ASME/SAE/ASEE Joint Propulsion Conference, San Diego,
California, July 10-12, 1995.
12e.DISTRIBUTION/AVAILABILITYSTATEMENT
Unclassified--Unlimited
Subject Category 07
12b. DISTRIBUTION CODE
13. ABSTRACT (Maximum 200 words)
Performance Seeking Control (PSC), an onboard, adaptive, real-time optimization algorithm, relies upon an
onboard propulsion system model. Flight results illustrated propulsion system performance improvements as
calculated by the model. These improvements were subject to uncertainty arising from modeling error. Thus to
quantify uncertainty in the PSC performance improvements, modeling accuracy must be assessed. A flight test
approach to verify PSC-predicted increases in thrust (FNP) and absolute levels of fan stall margin is developed
and applied to flight test data. Application of the excess thrust technique shows that increases of FNP agree to
within 3 percent of full-scale measurements for most conditions. Accuracy to these levels is significant because
uncertainty bands may now be applied to the performance improvements provided by PSC. Assessment of PSCfan stall margin modeling accuracy was completed with analysis of in-flight stall tests. Results indicate that the
model overestimates the stall margin by between 5 to 10 percent. Because PSC achieves performance gains by
using available stall margin, this overestimation may represent performance improvements to be recovered with
increased modeling accuracy. Assessment of thrust and stall margin modeling accuracy provides a critical piece
for a comprehensive understanding of PSC's capabilities and limitations.