39
FHWA/AASHTO Wave Task Force Plan of Action A Briefing by Joe Krolak, P.E. Senior Hydraulic Engineer Federal Highway Administration 14 February 2007

FHWA/AASHTO Wave Task ForcePlan of Action
A Briefing by
Joe Krolak, P.E.Senior Hydraulic Engineer
Federal Highway Administration
14 February 2007

Caveats
Discussions of Laws (lawyers)
Regulations (more lawyers)
Policy (even more lawyers)
… can be dangerous for the Hydraulic Engineer …

Background
FHWA Organization
Headquarters
Division Offices 50 States, District of Columbia, Puerto Rico
3 Federal Lands Divisions
Turner Fairbanks Highway Research Center
Resource Centers
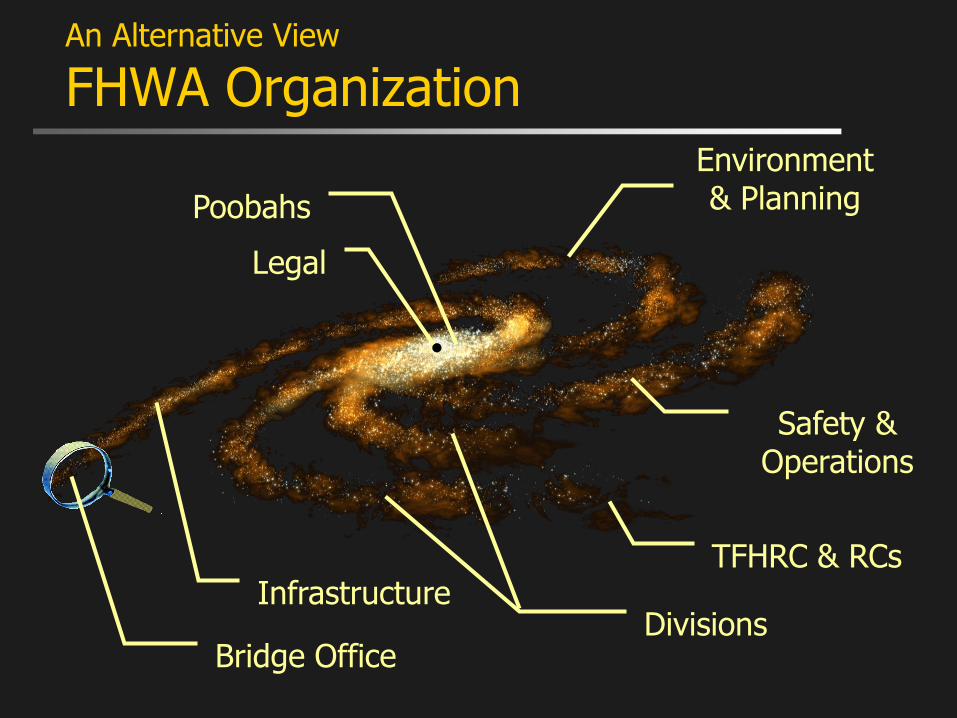
An Alternative View
FHWA Organization
Legal
Bridge Office
Poobahs
Divisions
Environment & Planning
Infrastructure
Safety & Operations
TFHRC & RCs

Background
Highway “Players”
State DOTs Standards, Guidance, and Procedures
Allowable Loads on bridges
Design frequency of bridges
Adopts AASHTO when appropriate
Funds Research
AASHTO Represents State DOTs (funded by States)
Subcommittee on Bridges and Structures
Special Committee on Hydrology and Hydraulics
Standards, Guidance, and Procedures
Funds Research (NCHRP)
FHWA Policy, Standards, Guidance, and Procedures
Tied to Federal-aid monies 80% - 20% cost sharing
90% - 10% on Interstates
100% emergency relief
Can adopt AASHTO into regulations
Funds Research
Congress

What‟s the Status Quo?
Bridge Design Frequency
Typical Design Use 25 to 50-year return
period
Consider freeboard
Peak flow
Does not consider unsteady flow
waves
Why? National Bridge Inventory
600,000 bridges
475,000 over waterways
Approximately 95% of those riverine

Example: FHWA Headquarters
Bridge Office Setup
Coast
al
Tunnels
Geote
chnic
al
Hydra
ulic
s
Bridge S
ecu
rity
Direct
or
/ Adm
in
Bridge
Str
uct
ure
s
Bridge
Managem
ent
AASH
TO
& L
RFD
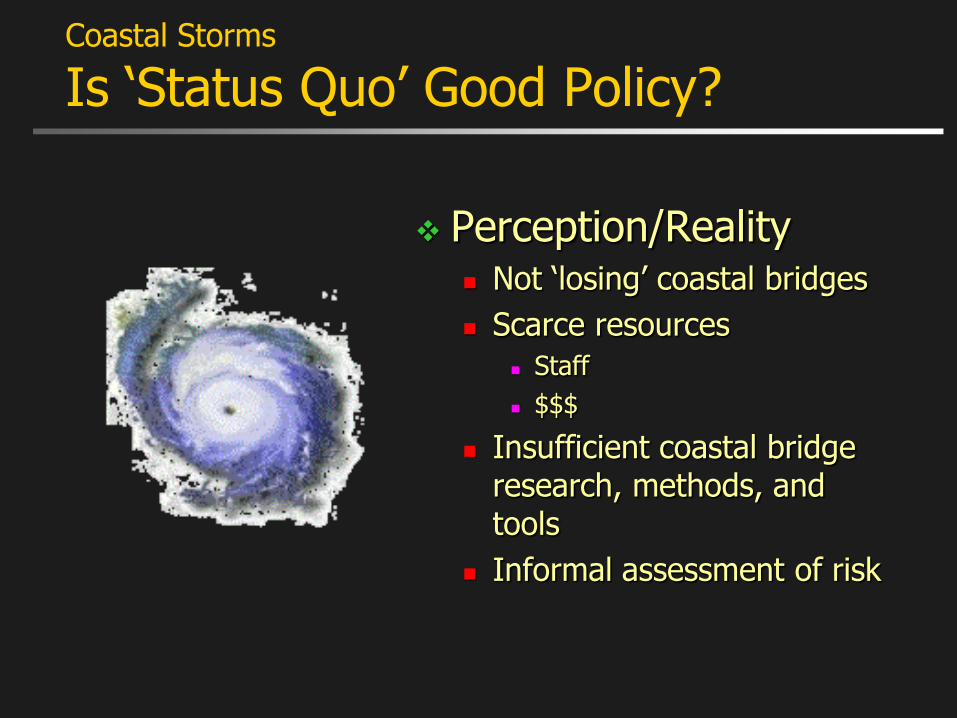
Coastal Storms
Is „Status Quo‟ Good Policy?
Perception/Reality Not „losing‟ coastal bridges
Scarce resources
Staff
$$$
Insufficient coastal bridge research, methods, and tools
Informal assessment of risk
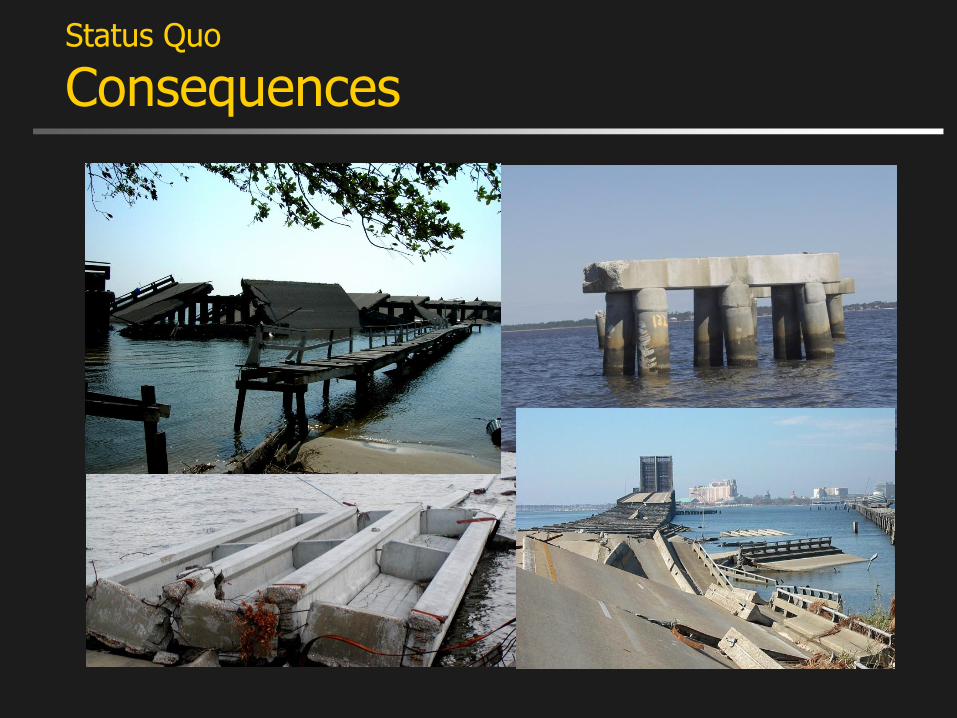
Status Quo
Consequences

Consequences
Ivan: I-10 Escambia Bay
Storm Surge Design stillwater level = 11.7 ft
Waves Significant wave height = 6.5 ft
Maximum wave height = 13.0 ft
Maximum wave elevation = 21.2 ft
Peak period = 3.2 seconds
Probabilistic characterization About the 200-year event
Replacement bridge Built to maximum surge + wave
$200 million

Consequences
Katrina: US-90 Biloxi Bay
Storm Surge Design stillwater level = 20 ft
Waves Significant wave height = 6.2 ft
Maximum wave height = 10.6 ft
Maximum wave elevation = 27.2 ft
Peak period = 5.1 seconds
Probabilistic characterization Slightly greater than 100-year event
Replacement bridge Built to maximum surge + wave
$250 million
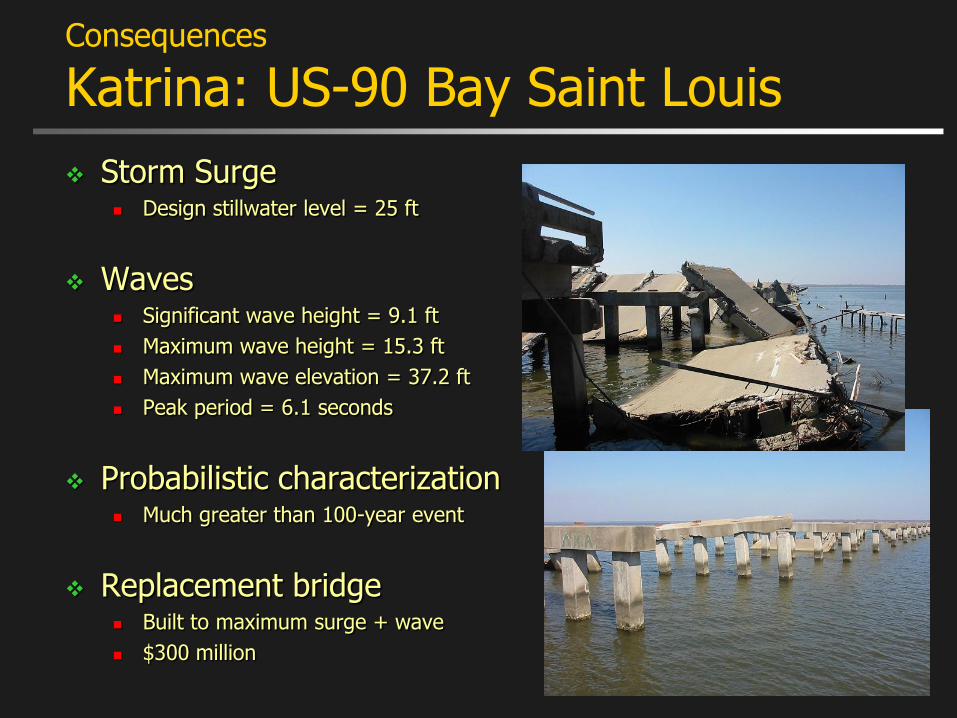
Consequences
Katrina: US-90 Bay Saint Louis
Storm Surge Design stillwater level = 25 ft
Waves Significant wave height = 9.1 ft
Maximum wave height = 15.3 ft
Maximum wave elevation = 37.2 ft
Peak period = 6.1 seconds
Probabilistic characterization Much greater than 100-year event
Replacement bridge Built to maximum surge + wave
$300 million

Consequences
Katrina: I-10 Lake Pontchartrain
Storm Surge Design stillwater level = 12 ft
Waves Significant wave height = 6.0 ft
Maximum wave height = 12.6 ft
Maximum wave elevation = 22.8 ft
Peak period = unknown
Probabilistic characterization Katrina about a 130-year event
Used extreme event
Replacement bridge Built to extreme event surge + wave
$600 million

Consequences
What to Do?
PolicyIntent of a specific Section
“Prevent coastal bridge failure …”
Technical Advisory & GuidanceProvide Guidance on how to achieve Policy
Research, Documents, & SpecsProcedures on how to achieve Guidance
Given: Legislative & Regulatory Authority
Plan of ActionHow FHWA will
proceed with Policy,Guidance,
and Procedures

Plan of Action
GOAL
A proposed set of studies, technology transfer activities, and policies to fully achieve a rational approach that addresses wave force, storm surge, and scour vulnerabilities in existing and new structures

Plan of Action
Incentives
Storm Events may be Increasing
Public Safety
Loss of Life
Loss of access
>1000 structures?
Economics
Several $billion ER
Lost capacity
Political
Congress will act

Plan of Action
Initial Efforts
FHWA Wave Force Workshop University of South Alabama
HEC-25 “Highways in Coastal Environment” Numerical & Physical Modeling
TFHRC research Vulnerability & hazards assessment
DOT Vulnerability screening Probabilistic wave force assessment Time dependent / wave synergistic scour Use of coastal models
AASHTO LFRD specifications Coastal H&H specifications NCHRP
Others
Focused?
Plan of Action
Focused Direction!
Joint FHWA-AASHTO Task Force
Work together to address technical issues
design specifications
implementation measures
Multidisciplinary structural
coastal
hydraulic
geotechnical
Composition FHWA
State DOT
Academia
Consulting
Task Force Approach
Worked well in other bridges related issues:
Seismic
Vessel collision
Extreme events

Plan of Action
Task Force Membership
State DOT PartnersBridge EngineersMitch Carr – MS DOT vacant
Hydraulic EngineersRick Renna – FDOTDave Henderson – NCDOTKevin Flora – CALTRANS
Academic PartnersRobert Dalrymple – JHUDavid Kriebel – USNASpencer Rogers – NCS
FHWA PartnersKornel Kerenyi – TFHRCShoukry Elnahal – RCJoe Krolak – HIBT
Greg Perfetti – NCDOT – Chair
Tom Everett – FHWA – vice-Chair

Plan of Action
Approach
Pooled Fund Project (on-going) Coastal State DOTs & FHWA
Bridges Vulnerable to Coastal StormsDevelopment of Guide Specifications
Handbook of Retrofit Options
Modjeski & Masters John Kulicki, PI
Other Team members Moffatt & Nicols (Jeffrey Sheldon/John Headland)
OEA (Max Sheppard)
D‟Appolonia (James Withiam)
Dennis Mertz

Plan of Action
Scope & Focus
Present Fixed Bridges
Constituents storm surge
hydrodynamic forces*
scour
Future Movable Bridges
Roadway embankments
Ancillary structures (signs, signals, lights)
National & Coastal Orientation
*wave impact, uplift, and buoyancy Douglass, 2005

Plan of Action
Pieces of the Puzzle
State of Practice Damaging Waves
Size, Period, Frequency, Cycles, Probability of occurrence Where and how do they cause damage?
Wave and water loads and forces What are they? Where and how do they act on structure and substructure?
Vulnerable Bridges Which are they? How do you determine (screen) these? What is the risk?
Potential mitigation and retrofit measures Older bridges v. New bridges
Gordian Knot "policy-guidance-technical document--who-does-what-and
when--show-me-the-money”

Plan of Action
State of Practice
Headland, Allsopp, 2005

Plan of Action
Design Frequency
Interim Guidance
Help out Gulf States directly affected by Katrina Allowing them to rebuild
structures
State DOT standards would have required them to rebuild to same elevation as Katrina destroyed
FHWA showed a way to use our regulations to avoid this
Codified same approach used after Ivan at I-10 Escambia Bay, Florida

Plan of Action
Wave Forensics
Conceptualization
Douglass, 2006

Plan of Action
Wave Forensics
Numerical Modeling
Sheppard/Chen, 2005-2006

Plan of Action
Wave Forensics
Wave Tank Modeling
Edge, 2006

Plan of Action
Wave Forensics
Wave Tank Modeling
Sheppard, 2007

Plan of Action
Wave Forensics
Wave Tank Modeling
Sheppard, 2007

Plan of Action
Wave Forensics
Field Work
Douglass, et. al., 2006

Plan of Action
Wave Forensics
Field Work
Kulicki, et. al., 2006

Plan of Action
Wave Forces

Plan of Action
Vulnerability
Hazard Characterization Storm Surge
Waves
Joint Probability
Risk Analyses Seismic & Other approaches
Bridge Screening Multi-level screening

Plan of Action
Retrofit Options
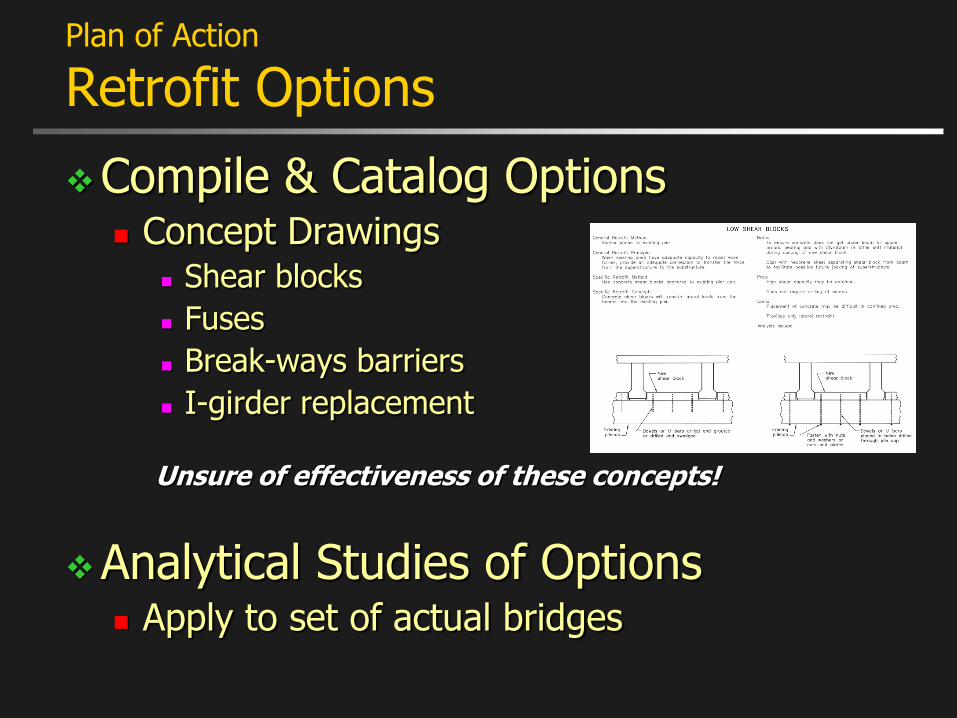
Compile & Catalog Options
Plan of Action
Retrofit Options
Compile & Catalog Options Concept Drawings
Shear blocks
Fuses
Break-ways barriers
I-girder replacement
Unsure of effectiveness of these concepts!
Analytical Studies of Options Apply to set of actual bridges

Plan of Action
Desired Results
Guide Specification Incorporate into LFRD specs
Risk and Vulnerability
Balloted by AASHTO
Retrofit Handbook Programmatic component
Screening methods
Standard sheets and drawings

Plan of Action
Timeline
Research - ongoing
Wave Force Approach – February 2007
Retrofit Options – March 2007
Analytical Study of Retrofits – April 2007
Draft Guide Specification – October 2007
Retrofit Handbook – October 2007
Final Reports – November 2007
All dates subject to change

Questions?

Acknowledgments & Credits University of South Alabama
Dr. Scott Douglass
Dr. Jim Chen
Texas A&M Dr. Billy Edge
OEA Dr. Max Sheppard
Dr. Mark Gosling
Moffatt & Nichol John Headland
Jeff Sheldon
HR Wallingford William Allsopp
Florida DOT Rick Renna
William Nickas
North Carolina DOT Dave Henderson
Delaware DOT Dennis Shea
USACE
NOAA
FEMA
FHWA Fred Skaer
Tom Everett
Jorge Pagan
Kornel Kerenyi
Jeffrey Ger
Phil Thompson (ret)


