Fiber-optic confocal microscope: FOCON Tim Dabbs and Monty Glass A new design for a reflecting fiber-optic confocal microscope, FOCON, is presented in which the beam splitter of a conventional confocal microscope is replaced by a fiber-optic splitter, and the core of a single-mode fiber takes the place of both the source and detector pinholes. It is shown that FOCON has the same resolution characteristics as a conventional confocal microscope, and requires fewer optical components and only rough alignment. The microscope is robust and can be rapidly scanned in the x,y, and z directions through the simple movement of the end of an optical fiber. Key words: Confocal microscopy, fiber optics, resolution, scanning microscopy. Introduction A confocal microscope is a diffraction-limited scanning- spot microscope in which both the light source and the detector usually take the form of micrometer- scale pinholes. An image of an object is built up in a pointwise fashion by scanning the diffraction-limited spot across the surface of the object in a technique similar to that used in scanning-electron microscopy. The basis of operation of the confocal microscope is now well documented in the literature.1-' 0 As a result of its geometry, the confocal microscope has 30% better lateral resolution than conventional scanning-spot microscopes and the more common broad-viewing area microscopes.1" 4 By reducing the size of the detector pinhole, we have experimentally confirmed 5 the theoretically calculated 4 improvement in lateral resolution as confocality is approached. The resolution improvement of a confocal micro- scope over that of conventional microscopes in the axial (z) direction is more dramatic. 6 The high axial resolution of a confocal microscope, which can also be regarded as a reduction in the depth of field, gives rise to a number of extremely useful applications, includ- ing optical sectioning, three-dimensional imaging, high-resolution imaging of rough surfaces, and sur- face profilometry. 7 -10 Although the concept of confocal microscopy was described in 1961 by Minsky," it was not until 1968 The authors are with the Sydney Laboratory, Commonwealth Scientific and Industrial Research Organization Division of Wool Technology, 1-11 Anzac Avenue, Ryde, New South Wales, 2112 Australia. Received 13 February 1991. 0003-6935/92/163030-06$05.00/0. c 1992 Optical Society of America. that the first practical instrument was built,' 2 and it is only in the last decade that confocal microscopy has become popular. Although a number of commer- cially available confocal microscopes are now on the market, the technology is young and still evolving. The two major areas of potential improvement are the use and alignment of conventional pinhole sources and detectors, and techniques for scanning the beam with respect to the object under study. Scanning the spot relative to the object is common for rapid lateral (x-y) scanning in conventional confo- cal microscopes; various methods have been used, including acousto-optic beam deflection, galvanomet- ric mirror scanning, rotating-polygon mirror scan- ning, and mechanical scanning of the focusing lens, as well as techniques based on the rotating Nipkow disk.1' 5 The major drawback of these spot-scan- ning techniques is that off-axis lens aberrations must be minimized and corrections are required for the off-axis light transmission reduction. This require- ment usually necessitates the use of complicated multilens optics.' Until now, the only practical way of scanning the spot in the z direction was to scan mechanically one or more of the elements that made up the focusing lens. Because of the mass of these elements, such scanning is relatively slow. Except for specimens of low mass and high rigidity, scanning the object in all three directions, whilst optically simple, is unfortunately slow. The conventional micrometer-sized pinholes that are normally used in confocal microscopes present a number of practical difficulties. Unacceptable signal attenuation and aberration may occur if the source pinhole is misaligned with respect to the laser. Mis- alignment of the detector pinhole is more critical, with even submicrometer movements resulting in aberrations and loss of resolution. In addition, there 3030 APPLIED OPTICS / Vol. 31, No. 16 / 1 June 1992
Transcript
Fiber-optic confocal microscope: FOCON
Tim Dabbs and Monty Glass
A new design for a reflecting fiber-optic confocal microscope, FOCON, is presented in which the beamsplitter of a conventional confocal microscope is replaced by a fiber-optic splitter, and the core of asingle-mode fiber takes the place of both the source and detector pinholes. It is shown that FOCON hasthe same resolution characteristics as a conventional confocal microscope, and requires fewer opticalcomponents and only rough alignment. The microscope is robust and can be rapidly scanned in the x, y,and z directions through the simple movement of the end of an optical fiber.
A confocal microscope is a diffraction-limited scanning-spot microscope in which both the light source andthe detector usually take the form of micrometer-scale pinholes. An image of an object is built up in apointwise fashion by scanning the diffraction-limitedspot across the surface of the object in a techniquesimilar to that used in scanning-electron microscopy.The basis of operation of the confocal microscope isnow well documented in the literature.1-' 0
As a result of its geometry, the confocal microscopehas 30% better lateral resolution than conventionalscanning-spot microscopes and the more commonbroad-viewing area microscopes.1"4 By reducing thesize of the detector pinhole, we have experimentallyconfirmed5 the theoretically calculated4 improvementin lateral resolution as confocality is approached.
The resolution improvement of a confocal micro-scope over that of conventional microscopes in theaxial (z) direction is more dramatic.6 The high axialresolution of a confocal microscope, which can also beregarded as a reduction in the depth of field, gives riseto a number of extremely useful applications, includ-ing optical sectioning, three-dimensional imaging,high-resolution imaging of rough surfaces, and sur-face profilometry. 7-10
Although the concept of confocal microscopy wasdescribed in 1961 by Minsky," it was not until 1968
The authors are with the Sydney Laboratory, CommonwealthScientific and Industrial Research Organization Division of WoolTechnology, 1-11 Anzac Avenue, Ryde, New South Wales, 2112Australia.
Received 13 February 1991.0003-6935/92/163030-06$05.00/0.c 1992 Optical Society of America.
that the first practical instrument was built,' 2 and itis only in the last decade that confocal microscopy hasbecome popular. Although a number of commer-cially available confocal microscopes are now on themarket, the technology is young and still evolving.The two major areas of potential improvement arethe use and alignment of conventional pinhole sourcesand detectors, and techniques for scanning the beamwith respect to the object under study.
Scanning the spot relative to the object is commonfor rapid lateral (x-y) scanning in conventional confo-cal microscopes; various methods have been used,including acousto-optic beam deflection, galvanomet-ric mirror scanning, rotating-polygon mirror scan-ning, and mechanical scanning of the focusing lens, aswell as techniques based on the rotating Nipkowdisk.1' 5 The major drawback of these spot-scan-ning techniques is that off-axis lens aberrations mustbe minimized and corrections are required for theoff-axis light transmission reduction. This require-ment usually necessitates the use of complicatedmultilens optics.' Until now, the only practical wayof scanning the spot in the z direction was to scanmechanically one or more of the elements that madeup the focusing lens. Because of the mass of theseelements, such scanning is relatively slow. Exceptfor specimens of low mass and high rigidity, scanningthe object in all three directions, whilst opticallysimple, is unfortunately slow.
The conventional micrometer-sized pinholes thatare normally used in confocal microscopes present anumber of practical difficulties. Unacceptable signalattenuation and aberration may occur if the sourcepinhole is misaligned with respect to the laser. Mis-alignment of the detector pinhole is more critical,with even submicrometer movements resulting inaberrations and loss of resolution. In addition, there
is the ever-present problem of dust obstruction, whichleads to effects that are similar to pinhole misalign-ment.
In theory, misalignment problems can be largelyovercome, by using the same pinhole for both sourceand detector. By reducing unwanted backreflec-tions, Kino and Xiao used the same pinhole for thesource and detector,15 but to date such systems havebeen mechanically complex, poorly budgeted for light,and inadequately adapted to scanning in the axialdirection.
Fiber-Optic Confocal Microscope Design: FOCON
Generally speaking, there are simple fiber-optic re-placements for many types of bulk-optic components.By noting that the core of a single-mode fiber acts in amanner similar to a conventional pinhole,'6 and byreplacing the beam splitter in the conventional confo-cal microscope with a fiber coupler, a much simplerconfocal microscope design, termed FOCON,emerges.17 In the FOCON design shown in Fig. 1,the source and detector pinholes are replaced by onesingle-mode fiber core. In operation, illuminationfrom the laser source of wavelength A is injected intoport 1 of the 2 x 1 single-mode optical fiber couplerand emerges from the fiber core at the end of port 2 ofthe coupler. In this instance, the single-mode coreat the end of port 2 acts as a pinhole source ofmonochromatic light with an approximately Gaus-sian intensity profile.18 Some of this light is col-lected by the collimating lens and focused into adiffraction-limited spot by a high-quality focusinglens. If the numerical aperture of the collimatinglens matches or is greater than that of the fiber, mostof the light emerging from the fiber is captured, andthe light throughput of the microscope is maximized.However, as we discuss later, this does not result intrue confocal operation.
Signal light that is scattered and reflected by anobject placed at the diffraction-limited spot is col-lected by the focusing lens, and is then injected by thecollimating lens into the single-mode fiber core at theend of port 2 of the coupler. Part of this light isdirected to port 3 of the coupler, where it is detected.
Illumination light
Here, the core of radius rp at the end of port 2 of thecoupler acts as a detector pinhole and the ratio of thenumerical aperture of the collimating lens to the sizeof the fiber core usually determines the degree ofconfocality of the system. To achieve a fully confocalsystem, we must ensure that the numerical apertureof the collimating lens is quite low. Using theconfocal criterion4 that the normalized pinhole size
u = 2rrr, sin()/X (1)
must be less than 0.5, we find that the numericalaperture of the collimator for fully confocal operationis given by
sin(a) < 0.25X/(rrrp). (2)
Generally, this numerical aperture is less than that ofthe fiber, so a significant portion of the illuminatinglight that emerges from the fiber is not captured bythe collimating lens.
One potential problem, the back reflection from thefiber tip at the end of port 2 (Fig. 1), can be minimizedby cleaving or polishing the face of the fiber at anangle. If this procedure is followed, we must reori-ent the fiber-tip axis to ensure a uniform intensitydistribution about the optical axis of the collimatingand focusing lenses. A polarization-splitting tech-nique and possibly an antireflection coating can fur-ther reduce this back reflection to the point where itis of similar magnitude to the Rayleigh backscatter inthe fiber.
Experiment
To test the FOCON design, we first showed that theaxial and lateral resolution characteristics were simi-lar to those of a conventional confocal microscope.To this end, we set up the hardware as shown in Fig.1, where 632.8-nm light from a He-Ne laser was usedas the illumination source. To ensure single-modeoperation, we used a silica-based glass fiber with acore diameter of 4 ,um and a nominal numericalaperture of 0.1. The fiber tip was angle polished toreduce backreflection problems. A 5 x microscopeobjective with a 0.1 numerical aperture was chosen asthe focusing lens (lens 5 x a, Table I), and a range of
Collimating Focusingx, y, z scanning lens lens
Fig. 1. Schematic diagram of the FOCON design for a confocalmicroscope.
Table 1. Lens Numerical Apertures,
Collimating FocusingLens Lens
Olympus Effective Effective GraphLens NA NA NA NA v Symbol
objectives were used as collimators. In most cases,as we see from Table I, the effective numericalapertures of the collimating and focusing lenses werenot the same as the manufacturer's values. Thisdissimilarity existed because of mismatches betweencollimator and focuser backapertures or fiber andcollimator numerical apertures (see the Discussionsection). The effective numerical apertures of thelenses and the single-mode optical fiber were deter-mined by measuring the divergence half-angle at the1%-intensity level in the far field.
To measure the lateral resolution of FOCON, wescanned an ideal point object across the focuseddiffraction-limited spot and monitored the detectorsignal. Using a previously developed technique,5 wemagnified the diffraction-limited spot 200 times byusing a 5 x microscope objective and a folded pathlength of 6.75 m. As a result, we used a 100-pm-diameter pinhole that was placed hard against amirror as our ideal point reflector and scanned itthrough the magnified image of the diffraction-limited spot. The lateral scan radius r112 , correspond-ing to the half-power points at the detector, was thenused to obtain the normalized lateral signal width,4
V112 = 2rrr/ 2 sin(u.')/x, (3)
while the normalized detector pinhole size was calcu-lated from Eq. (1). This procedure was carried outwith each of the microscope objectives listed in TableI as the collimator, and the results were graphed asshown in Fig. 2. The theoretically predicted curve4
is shown for comparison.To measure the axial resolution of FOCON, we
scanned a front surface mirror axially through focusand logged the signal at the detector. The axial scanhalf-width, Z1/2, corresponding to the half-power points
1.5
cq.9
00U)a)
cco
-J
a)N
co
0z
1.0
0.5
0.00 2
Normalized Pinhole Size, vp
Fig. 2. Graph of the theoretical4 (solid curve) and experimentallateral resolution of FOCON as a function of normalized pinholesize; for graph-symbol definitions see Tabl I.
at the detector, was then used to obtain the normal-ized axial resolution 4
87rz/2 sin2(a'/2)u1 , 2 = (4)
This procedure was repeated by using each of thelenses appearing in Table I as the collimator, and theresults were plotted as shown in Fig. 3. The theoret-ical prediction4 (solid curve) is shown for comparison.Figure 4 shows two of the axial scan intensity plots.
The axial scanning capability of FOCON was dem-onstrated by finding the relationship between theaxial position of the diffraction-limited spot and theaxial position of port 2 of the coupler. The appara-tus was set up as for the axial resolution experimentsdescribed above. For these alignment and scanningexperiments, however, we determined the axial posi-tion of the diffraction-limited spot by finding themaximum signal at the detector during an axialtraverse of the mirror through the spot. This spotposition was determined for a number of locations onport 2 of the coupler about the on-axis collimatedposition. The results obtained by using the 1.5 xlens as the collimator and the 5 x a lens as thefocusing lens are shown in Fig. 5(a), whereas thoseobtained by using the 5 xa lens as the collimator andthe 10x lens as the focusing lens are shown in Fig.5(b).
Discussion
In Figs. 2 and 3, within experimental error, themeasured lateral and axial resolutions near the prac-tical confocal pinhole size limit, vp = 0.5, are thesame as the theoretically predicted values. There-fore, provided that the correct collimating lens ischosen for the effective fiber pinhole size, FOCON can
0U)a)
Cl:
a)N
it
0z
4
2
00 2
Normalized Pinhole Size, vp
Fig. 3. Graph of the theoretical4 (solid curve) and experimentalaxial resolution of FOCON as a function of normalized pinholesize; for graph-symbol definitions, see Table I.
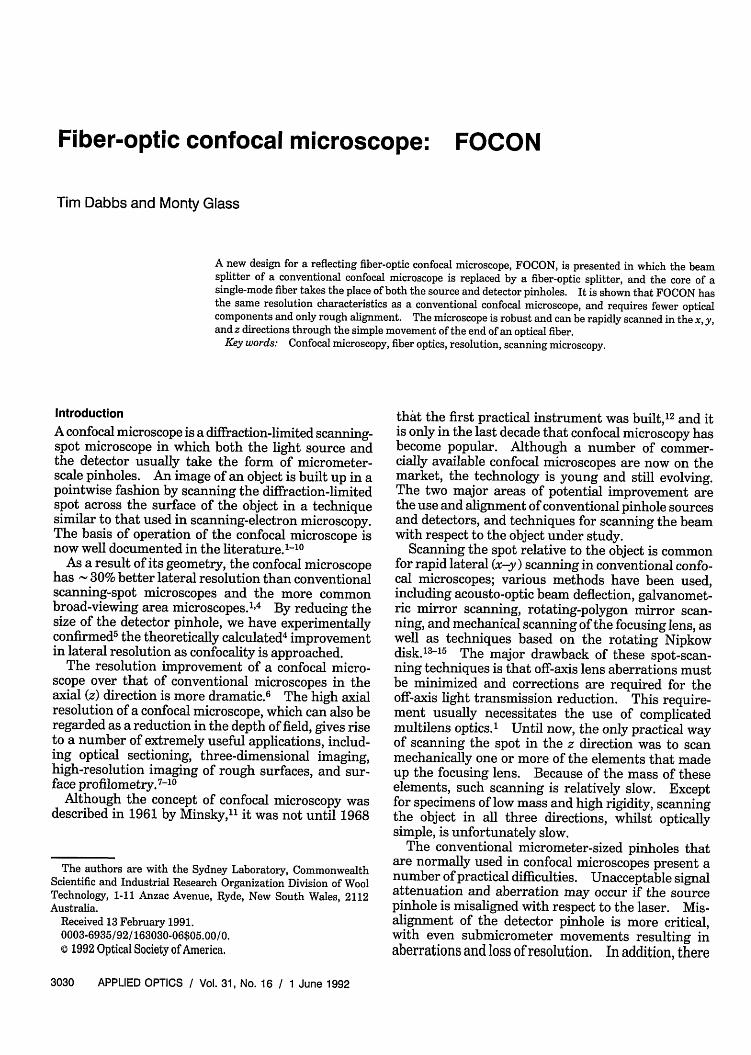
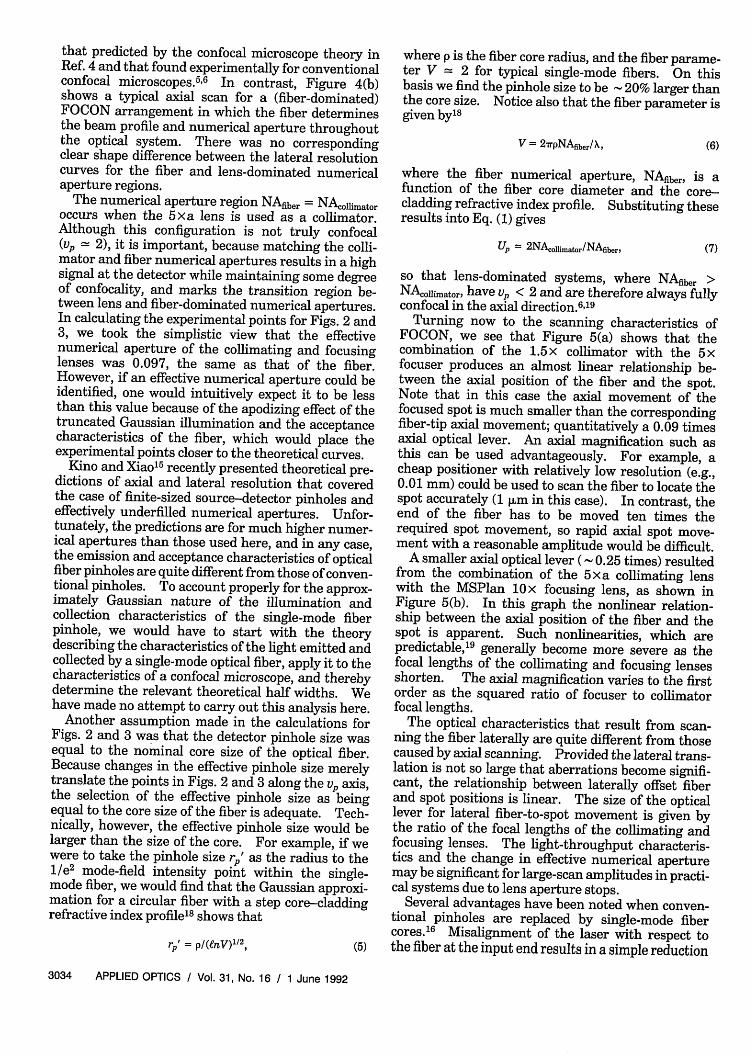
Fig. 4. Graphs of the signal at the detector resulting from theaxial scan of a mirror through the diffraction-limited spot of a
FOCON setup; (a) NAfiber > NAcollimating and (b) NAcoiiimating >
NAfibern
be regarded as a fully confocal microscope. Awayfrom the confocal limit there is significant departurefrom theoretical predictions, which can be explainedby considering two regimes of operation.
In the region NAfiber > NAcolimator which corre-sponds to the use of the 1.5x, 2.5x, and the 5xbcollimating lenses, vp < 2. For these collimatinglenses, the numerical apertures and beam diametersof the optical system are lens dominated as thebackaperture of the collimating or focusing lensdetermines the effective beam diameter. Becausethe numerical aperture of the fiber is significantlygreater than the effective numerical aperture of thecollimating lens, quite a lot of the illuminating light islost; the resulting top-hat intensity profile of thebeam is as assumed in the theory.4 Therefore, onewould expect only small departures from the theoret-ical predictions for both the lateral and the axialresolutions.
An examination of Figs. 2 and 3 confirms that,although the experimental values for vp << 2 followthe same trends as the theoretical predictions, thepoints on the graph generally lie above the curves, asfound in previous resolution studies.3 5 6 This degra-dation can be accounted for if the effective numericalapertures of the collimating lenses, and particularlythe focusing lenses, differ slightly from those used inthe calculations. Such effective numerical aperturechanges may be attributed to lens apodization.6
The region NAfiber < NAcoiimator is created by therelatively high numerical aperture collimating lenses,the 10x and 20x. The numerical aperture of the
N.*'
-3.0 0 3.0Fiber Position (mm)
2~~~~~ 2.0
-2.0Fiber Position (mm)
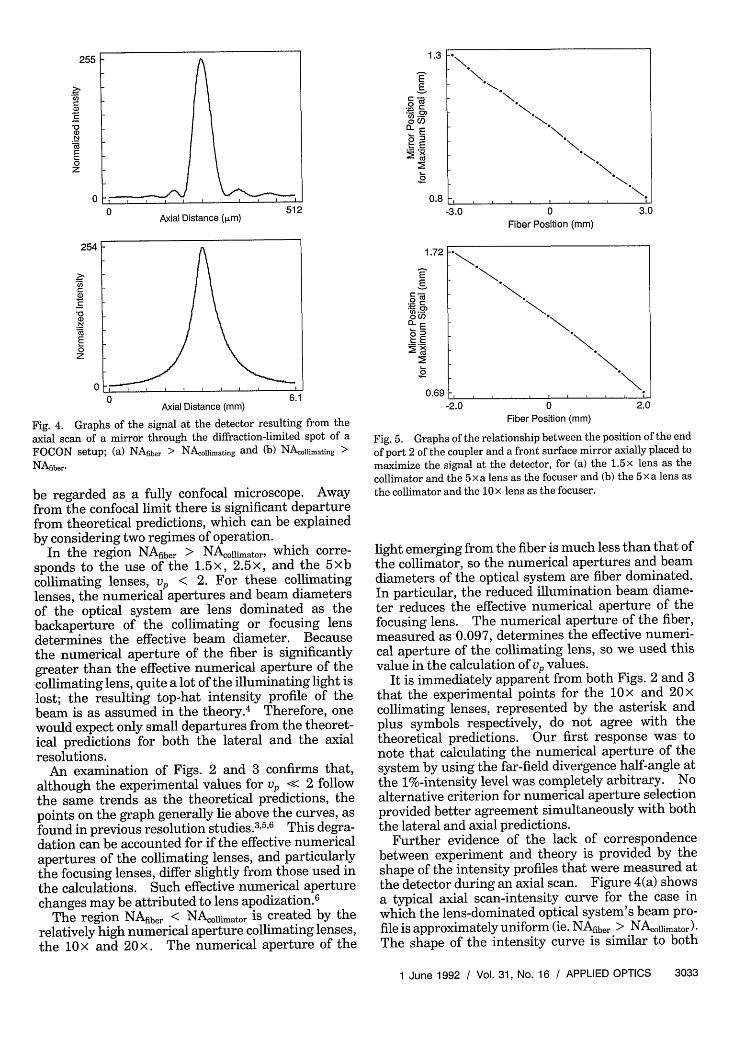
Fig. 5. Graphs of the relationship between the position of the endof port 2 of the coupler and a front surface mirror axially placed tomaximize the signal at the detector, for (a) the 1.5x lens as thecollimator and the 5 x a lens as the focuser and (b) the 5 x a lens as
the collimator and the 1 Ox lens as the focuser.
light emerging from the fiber is much less than that ofthe collimator, so the numerical apertures and beamdiameters of the optical system are fiber dominated.In particular, the reduced illumination beam diame-ter reduces the effective numerical aperture of thefocusing lens. The numerical aperture of the fiber,measured as 0.097, determines the effective numeri-cal aperture of the collimating lens, so we used thisvalue in the calculation of vp values.
It is immediately apparent from both Figs. 2 and 3that the experimental points for the 10x and 20xcollimating lenses, represented by the asterisk andplus symbols respectively, do not agree with thetheoretical predictions. Our first response was tonote that calculating the numerical aperture of thesystem by using the far-field divergence half-angle atthe 1%-intensity level was completely arbitrary. Noalternative criterion for numerical aperture selectionprovided better agreement simultaneously with boththe lateral and axial predictions.
Further evidence of the lack of correspondencebetween experiment and theory is provided by theshape of the intensity profiles that were measured atthe detector during an axial scan. Figure 4(a) showsa typical axial scan-intensity curve for the case inwhich the lens-dominated optical system's beam pro-file is approximately uniform (ie. NAfiber > NAcolihmator).The shape of the intensity curve is similar to both
that predicted by the confocal microscope theory inRef. 4 and that found experimentally for conventionalconfocal microscopes.5 6 In contrast, Figure 4(b)shows a typical axial scan for a (fiber-dominated)FOCON arrangement in which the fiber determinesthe beam profile and numerical aperture throughoutthe optical system. There was no correspondingclear shape difference between the lateral resolutioncurves for the fiber and lens-dominated numericalaperture regions.
The numerical aperture region NAfiber = NAcolimatoroccurs when the 5 a lens is used as a collimator.Although this configuration is not truly confocal(vp 2), it is important, because matching the colli-mator and fiber numerical apertures results in a highsignal at the detector while maintaining some degreeof confocality, and marks the transition region be-tween lens and fiber-dominated numerical apertures.In calculating the experimental points for Figs. 2 and3, we took the simplistic view that the effectivenumerical aperture of the collimating and focusinglenses was 0.097, the same as that of the fiber.However, if an effective numerical aperture could beidentified, one would intuitively expect it to be lessthan this value because of the apodizing effect of thetruncated Gaussian illumination and the acceptancecharacteristics of the fiber, which would place theexperimental points closer to the theoretical curves.
Kino and Xiao'5 recently presented theoretical pre-dictions of axial and lateral resolution that coveredthe case of finite-sized source-detector pinholes andeffectively underfilled numerical apertures. Unfor-tunately, the predictions are for much higher numer-ical apertures than those used here, and in any case,the emission and acceptance characteristics of opticalfiber pinholes are quite different from those of conven-tional pinholes. To account properly for the approx-imately Gaussian nature of the illumination andcollection characteristics of the single-mode fiberpinhole, we would have to start with the theorydescribing the characteristics of the light emitted andcollected by a single-mode optical fiber, apply it to thecharacteristics of a confocal microscope, and therebydetermine the relevant theoretical half widths. Wehave made no attempt to carry out this analysis here.
Another assumption made in the calculations forFigs. 2 and 3 was that the detector pinhole size wasequal to the nominal core size of the optical fiber.Because changes in the effective pinhole size merelytranslate the points in Figs. 2 and 3 along the vp axis,the selection of the effective pinhole size as beingequal to the core size of the fiber is adequate. Tech-nically, however, the effective pinhole size would belarger than the size of the core. For example, if wewere to take the pinhole size r' as the radius to the1/e2 mode-field intensity point within the single-mode fiber, we would find that the Gaussian approxi-mation for a circular fiber with a step core-claddingrefractive index profile'8 shows that
rp' = p((nV) 112 , (5)
where p is the fiber core radius, and the fiber parame-ter V 2 for typical single-mode fibers. On thisbasis we find the pinhole size to be 20% larger thanthe core size. Notice also that the fiber parameter isgiven by'8
V = 2 PNAfiber/X, (6)
where the fiber numerical aperture, NAfiber, is afunction of the fiber core diameter and the core-cladding refractive index profile. Substituting theseresults into Eq. (1) gives
Up 2 NAcolimator/NAfibr, (7)
so that lens-dominated systems, where NAfiber >NAcoffimator, have vp < 2 and are therefore always fullyconfocal in the axial direction.6,19
Turning now to the scanning characteristics ofFOCON, we see that Figure 5(a) shows that thecombination of the 1.5x collimator with the 5xfocuser produces an almost linear relationship be-tween the axial position of the fiber and the spot.Note that in this case the axial movement of thefocused spot is much smaller than the correspondingfiber-tip axial movement; quantitatively a 0.09 timesaxial optical lever. An axial magnification such asthis can be used advantageously. For example, acheap positioner with relatively low resolution (e.g.,0.01 mm) could be used to scan the fiber to locate thespot accurately (1 m in this case). In contrast, theend of the fiber has to be moved ten times therequired spot movement, so rapid axial spot move-ment with a reasonable amplitude would be difficult.
A smaller axial optical lever ( 0.25 times) resultedfrom the combination of the 5 a collimating lenswith the MSPlan 10x focusing lens, as shown inFigure 5(b). In this graph the nonlinear relation-ship between the axial position of the fiber and thespot is apparent. Such nonlinearities, which arepredictable,'9 generally become more severe as thefocal lengths of the collimating and focusing lensesshorten. The axial magnification varies to the firstorder as the squared ratio of focuser to collimatorfocal lengths.
The optical characteristics that result from scan-ning the fiber laterally are quite different from thosecaused by axial scanning. Provided the lateral trans-lation is not so large that aberrations become signifi-cant, the relationship between laterally offset fiberand spot positions is linear. The size of the opticallever for lateral fiber-to-spot movement is given bythe ratio of the focal lengths of the collimating andfocusing lenses. The light-throughput characteris-tics and the change in effective numerical aperturemay be significant for large-scan amplitudes in practi-cal systems due to lens aperture stops.
Several advantages have been noted when conven-tional pinholes are replaced by single-mode fibercores.'6 Misalignment of the laser with respect tothe fiber at the input end results in a simple reduction
in the source intensity without affecting the geometryof the ouput beam, and thus without introducingaberrations or loss of resolution. In addition, dustaccumulation in the aperture of the pinhole is less of aproblem than in conventional systems, and in anyevent optical fiber faces are easily cleaned. The useof optical fiber-based pinholes also simplifies thelayout of the microscope, because the laser, detector,and associated electronics can be remote from themicroscope itself. In addition, other optical hard-ware, such as a polarizer, can be incorporated in theoptical fiber circuit without increasing the alignmentcomplexity of the microscope.
Because the portion of the fiber that has to bemoved is extremely light and because cyclic fatigue isnot a problem in glass,2 0 we can scan the spot veryrapidly through fiber movement. In conventionalconfocal microscope designs rapid scanning in the xand y directions is also possible, if relatively compli-cated optics are used to maintain constant lightthroughput and microscope numerical aperture,' butaxial scanning is slow because of mass constraints.Thus it is the rapid axial scanning ability of FOCONthat sets it apart from conventional confocal micro-scope designs.
FOCON is simpler and more robust than conven-tional confocal microscopes, and because it cannot beoptically misaligned, is therefore insensitive to vibra-tion. The combination of fewer components and themuch simpler mechanical construction not only pro-vides a more reliable, compact microscope, it alsoprovides a theoretically less expensive one. In addi-tion, because of the substitution of single-mode fibercores for conventional pinholes, FOCON can operatemore reliably in a dirty environment. Finally, byjoining a long fiber to port 2 of the coupler in Fig. 1,we can place the electronics associated with thesource and detector far from the microscope head,thus allowing the microscope to operate in electricallynoisy or hazardous locations. These advantagesshould make FOCON better suited than conventionalmicroscopes to many industrial applications.
Conclusions
A new design for a fiber-optic confocal microscope,FOCON, has been presented together with someexperimental results. We have shown that the lens-dominated FOCON design has the same resolutioncharacteristics as a conventional confocal microscope,although it requires fewer optical components, sim-pler mechanical construction, and is more robust.The microscope also needs only rough alignment andcan be rapidly scanned in the x, y, and z directionsthrough the movement of the end of an optical fiber.The combination of all of these features in the one
instrument makes FOCON an attractive design for aconfocal microscope, particularly for industrial appli-cations.
References1. T. Wilson and C. J. R. Sheppard, Theory and Practice of
Scanning Optical Microscopy (Academic, London, 1984).2. T. Wilson and A. R. Carlini, "Effect of detector displacement in
3. G. J. Brakenhoff, P. Blom, and C. Bakker, "Confocal scanning
light microscopy with high aperture optics," in Proceedings ofthe Eleventh Congress of the International Commission forOptics (Insiuto de Optica "Daza de Valdes," C.S.I.C. SociedadEspanolade Optica, Serrano, Spain, 1978), pp. 215-218.
4. T. Wilson and A. R. Carlini, "Size of the detector in confocal
imaging systems," Opt. Lett. 12, 227-229 (1987).5. M. Glass and T. P. Dabbs, "The experimental effect of detector
size on confocal lateral resolution," J. Microsc. 164, 153-158
(1991).6. T. Wilson and A. R. Carlini, "Three-dimensional imaging in
confocal imaging systems with finite sized detectors." J.Microsc. 149, 51-66 (1988).
7. K. Carlsson and N. Aslund, "Confocal imaging for 3-D digitalmicroscopy," Appl. Opt. 26, 3232-3238 (1987).
8. W. B. Amos, J. G. White, and M. Fordham, "Use of confocal
imaging in the study of biological structures," Appl. Opt. 26,3239-3243 (1987).
9. D. K. Hamilton and T. Wilson, "Three-dimensional surface
measurement using the confocal scanning microscope," Appl.Phys. B. 27, 211-213 (1982).
10. D. K. Hamilton and T. Wilson, "Surface profile measurementusing the confocal microscope," J. Appl. Phys. 53, 5320-5322(1982).
11. M. Minsky, U.S. Patent 3013467 (19 December 1961).
12. M. Petran, M. Hadravsky, M. D. Egger, and R. Galambos,"Tandem-scanning reflected-light microscope," J. Opt. Soc.Am. 58, 661-664 (1968).
13. M. Petran, M. Hadravsky, and A. Boyde, "The tandem scan-ning reflected light microscope," Scanning 7, 97-108 (1985).
14. G. Q. Xiao and G. S. Kino, "A real-time confocal scanningoptical microscope," in Scanning Imaging Technology, L.
Balk, and T. Wilson, eds., Proc. Soc. Photo-Opt. Instrum. Eng.809, 107-113 (1987).
15. G. S. Kino and G. Q. Xiao, "Real-time scanning optical
microscopes," in Confocal Microscopy, T. Wilson, ed. (Perga-mon, London, 1990), pp. 361-387.
16. T. P. Dabbs and M. Glass, "Single mode fibers used as confocal
microscope pinholes," Appl. Opt. (to be published).17. T. P. Dabbs, Australian Provisional Patent PI 9587/88 (1
August 1988).18. A. W. Snyder and J. D. Love, Optical Waveguide Theory
(Chapman & Hall, London, 1983)19. M. Glass, "Axial scanning in the fiber optic confocal
microscope," Lab. Note SN/128 (Commonwealth Scientificand Industrial Research Organization Division of Wool Tech-nology, Sydney, 1991).
20. T. P. Dabbs and B. R. Lawn, "Strength and fatigue properties
of optical glass fibers containing microindentation flaws," J.