+ All Categories
Home > Documents > fibonacci_genius_2008

fibonacci_genius_2008

Date post: 08-Apr-2018
Category:
Upload: stormin64
View: 218 times
Download: 0 times
Share this document with a friend
16
Fibonacci Genius http://www.bonaccigenius.com Copyright 2008 Mark Deaton This material is protected by international copy - right. This material is for educational purposes only, and is for your personal use only. Protected by copyscape for rapid and immediate prosecution of plagiarism.
Transcript

8/7/2019 fibonacci_genius_2008

http://slidepdf.com/reader/full/fibonaccigenius2008 1/16

Fibonacci Geniushttp://www.bonaccigenius.com

Copyright 2008 Mark Deaton

This material is protected by international copy-

right. This material is for educational purposes

only, and is for your personal use only.

Protected by copyscape for rapid and immediate

prosecution of plagiarism.

8/7/2019 fibonacci_genius_2008

http://slidepdf.com/reader/full/fibonaccigenius2008 2/16

Who was Fibonacci?

Leonardo Pisano, was Italian mathematician born in Pisa during the The middle Ages. He was renowned as one of 

the most talented mathematicians of his day. . The name Fibonacci itself was a nickname given to Leonardo. It was

derived from his grandfather’s name and means son of Bonaccio.

While most attribute the Fibonacci Sequence to Leonardo, he was not responsible for discovering the sequence. In

1202 Leonardo published a book called, Liber Abaci. In it he derived a method for calculating the growth of the rabbit

population.

Suppose a newly-born pair of rabbits, one male, one female, are put in a eld. Rabbits are able to mate at the age

of one month so that at the end of its second month a female can produce another pair of rabbits. Suppose that our 

rabbits never die and that the female always produces one new pair (one male, one female) every month from the

second month on. The puzzle that Fibonacci posed was...

How many pairs will there be in one year?

At the end of the rst month, they mate, but there is still one only 1 pair.

At the end of the second month the female produces a new pair, so now there are 2 pairs of rabbits in the eld.

At the end of the third month, the original female produces a second pair, making 3 pairs in all in the eld.

At the end of the fourth month, the original female has produced yet another new pair, the female born two months

ago produces her rst pair also, making 5 pairs.

This mathematical progression is now recognized as the Fibonacci Sequence. Starting with zero and adding one,

each new number in the sequence is the sum of the previous two numbers. In our example, 0+1 = 1, 1+1=2, 1+2=3,

2+3=5, and so on.

The sequence of numbers looks like this: 0, 1, 1, 2, 3, 5, 8, 13, 21, 34, 55, 89, 144, 233, to innity. From this sequence

you can easily reason that at the end of one year there would be 233 pairs of rabbits.

This sequence has repeatedly appeared in popular culture from architecture to music to television. While the series

is a powerful tool, the analysis of one number with the number up to four places to the right. The rst three are shown

below. While some are not exact, if you repeat this mathematical analysis through multiple sets of data, you will see

we arrive at some well known and fairly consistent ratios.

21/34 = 0.61764 ~ 0.618 34/21 = 1.61904 ~ 1.61921/55 = 0.38181 ~ 0.382 55/21 = 2.61904 ~ 2.61921/89 = 0.23595 ~ 0.236 89/21 = 4.23809 ~ 4.238

The dimensional properties adhering to the 1.618 ratio occur throughout nature and the ratio is most referred to

as The Golden Ratio. The uncurling of a fern and the patterns found on various mollusk shells are commonly cited

examples of this ratio.

This number, when added to 0.618, equals 1.

These ratios have been used for over a hundred years in the nancial markets by the likes of W.D. Gann andRalph Nelson Elliot. Up until the late 90s the tracking and use of these numbers were a manual process. With the

proliferation of real-time charting and data, software that automatically calculated and displayed these levels brought

Fibonacci into the nancial mainstream.

8/7/2019 fibonacci_genius_2008

http://slidepdf.com/reader/full/fibonaccigenius2008 3/16

Fibonacci as a Technical Analysis Tool

While there have been countless books and articles written on the use of Fibonacci in technical analysis, the basics are

simple.

On the price scale, these ratios, and several others related to the Fibonacci sequence, often indicate levels at which

strong resistance and support will be found. Many times, markets tend to reverse right at levels that coincide with theFibonacci ratios. On the time scale Fibonacci ratios are one method of identifying potential market turning points. When

Fibonacci levels of price and time coincide you have high probability entry points.

In the next few pages I will talk about how I use the two most common applications of Fibonacci:

Price Retracements – A strategy for quality entry points•

Price Extensions – An approach to determining how far price will run•

Then after we have covered the basics we will talk about bringing it all together and using both Fibonacci Retracements

and Fibonacci Extensions at same time and how clustering of these ratios increases the probability of prot.

Fibonacci Retracements:The Fibonacci Retracement is probably the most heavily used Fibonacci tool in the toolset. You will nd Fibonacci

Retracements as a solid tool in identifying key support and resistance areas.

If prices have fallen from a recent swing high down to a swing low, the expectation is that price should retrace distance,

high to low, by a ratio of the Fibonacci sequence. . I have Fibonacci Retracements successfully used on tick charts

through monthly and yearly charts. It is important to note, the larger price move from swing high to swing low, the more

accurate the retracement projections. Identication and selection of the correct swing points are keys to success.

While there are many variations of the ratio set, simple is better, let’s focus on four major retracement levels.

23.6% -- The shallowest of the retracements. In very strong trending markets price typically quickly bounces in•

the area of this ratio.

38.2% --- This is the rst line of defense of the current trend. Breaking this level starts to erode the underlying•

trend.

50% -- the neutral point of any retracement. This is the critical tipping point.•

61.8% -- retracing to this typically signals a breakdown in the trend.•

100% -- matching the move•

In this section we will also show examples of how potential opportunities when price retraces beyond 100% by following

another set of Fibonacci ratios:

138.2%•

161.8%•

200%•

Notice in each case we have simply added 100% to the standard ratio set. I use this set of retracements on a daily

basis, from 23.6% all the way to 200% and sometimes 300% For my style of trading I nd 38.2%, 50% and 61.8% quite

reliable.I use the other primarily as conrmation levels.

So let’s take a look at some examples of Fibonacci Retracements in use.

8/7/2019 fibonacci_genius_2008

http://slidepdf.com/reader/full/fibonaccigenius2008 4/16

Example 1:

Take the example below. The EUR/USD had risen from 1.3360 to 1.4278. The next day the EURUSD failed to make a

new high and the potential swing point was in place. So I using swing points I placed a Fibonacci retracement on my

chart.

Figure 1

The trend was obviously very strong and the rst retracement to the 23.6% level was met with a violent change in

direction. You can see the dip below the 23.6% level and the sudden reversal. While there are multiple entry methods,

the most conservative would be to wait until the level is penetrated and price establishes itself above that level and

enter on the open of the next bar as shown.

Figure 2

8/7/2019 fibonacci_genius_2008

http://slidepdf.com/reader/full/fibonaccigenius2008 5/16

With the right money management, you can see in this example this could have been a serious winner.

Figure 3

Once you understand the method you can nd countless examples. Every market, FOREX, Equities and Futures each

exhibit these patterns to some degree.

Example 2:

Let’s look at another example using the USDCAD. You can see in this example there are multiple entry points for both

trend and countertrend trades.

Figure 4

8/7/2019 fibonacci_genius_2008

http://slidepdf.com/reader/full/fibonaccigenius2008 6/16

Figure 5

Let’s zoom in and look at the area highlighted

in blue.

Fibonacci Ratios work on virtually any size

price swing.

The chart below shows the Fibonacci Retracement applied to the smaller price swing.

Figure 6

The blue ellipses show the high potential entry points. Notice, in each of these cases you could have entered the

market with a relatively tight stop loss with high reward potential.

Ok, we have shown some examples of well behaved price action. What happens if price retraces 100%? How far can it

go beyond this point? Fibonacci ratios provide some clues to answering this question and nding low risk entry points.

8/7/2019 fibonacci_genius_2008

http://slidepdf.com/reader/full/fibonaccigenius2008 7/16

Example 3:

The example below shows the GBPUSD making a bottom and bouncing back. And multiple entry points from the same

set Fibonacci Retracement levels.

Figure 7

Of note are the high potential entry points at 38.2%, 50% and 61.8%. Each of these could have been entry points with

solid prot potential. However, notice after the initial breakout above 100%, there were other opportunities to get in the

trade. Ultimately price jumped to the 138% point before backtracking.

This example shows yet another way to use Fibonacci Retracements. This example shows why it is valuable to identify

potential levels above and beyond the initial 100% retracement.

Retracements are the cornerstone of Fibonacci theory as it applies to the nancial markets. Hopefully these examples

have provided guidance from which to draw your own retracements and expand your trading toolset.

To recap, while there are other retracement values, my defaults Fibonacci Retracements always include:

23.6% 100%38.2% 138.2%50% 161.8%61.8% 200%

You can never tell when price action it going blow well beyond the 100% level.

8/7/2019 fibonacci_genius_2008

http://slidepdf.com/reader/full/fibonaccigenius2008 8/16

Fibonacci Price Extensions:

Picking a high potential entry point is half the battle. How do we know what kind of move price is expected to make?

Projecting price movement beyond the swing points is the answer everyone seeks. Fibonacci

In our rst example we entered a long position on the 23.6% retracement from the swing high. How far can we expect the

position to run? In Example 3, we identied 3 potential entry points. Now it is time to gure out possible exit points.

Fibonacci Extensions take into account three price points. A swing high and swing low, plus the swing point where price

reversed from a retracement.

Like Fibonacci Retracements, I use exactly the same set of Fibonacci levels when using Fibonacci Extensions.

Let’s go back and look at our rst example. We see in gure 3 the trade could have been a big winner, but how would we

gure out potential exit points? Fibonacci Extensions!

Figure 8

I nd Fibonacci Extensions the most useful as a money management tool.

The last thing we want to do is turn a winner into a loser. As price moved above the 23.6% level, I would start to bring my

stop loss up in trail. Accordingly, I would continue to raise my stop as price increased.

8/7/2019 fibonacci_genius_2008

http://slidepdf.com/reader/full/fibonaccigenius2008 9/16

The level of risk is entirely up to your trading plan, but tools like Fibonacci Extensions help identify key levels from which

stops can be placed

You can see in the next chart, Figure 9, that after price penetrated the 100% Fibonacci Extension level, we entered into a

period of consolidation. While during the consolidation there were obvious entry points, however, remaining in the initial

trade would have proven to be frustrating.

Figure 9

In Figure 7 we found the GBPUSD creating a bottom and breaking out to the upside. We also identied 3 potential entry

points. Let’s look at each of the entry points and use Fibonacci Extensions to project prot targets.

In the rst trade we entered the market thinking that a swing low was in place off the 38.2% Fibonacci Retracement level.

You can see in Figure 10, while price did bounce to the 23.6% Fibonacci Extension level. It was enough to make a prot,

but it was not a major winner.

This is a trade that once you did not see a continuation through the 23.8% level, you could have take that as a cue to exit

the position. Or at the very least move you stop up to maintain some level of prot.

8/7/2019 fibonacci_genius_2008

http://slidepdf.com/reader/full/fibonaccigenius2008 10/16

Figure 10

Moving on to the second entry point, we sold short at the 50% Fibonacci Retracement level.

Figure 11

8/7/2019 fibonacci_genius_2008

http://slidepdf.com/reader/full/fibonaccigenius2008 11/16

This was obviously a solid entry point. On the way down you can clearly see opportunity to tighten up your stop loss

values. There are many ways to manage a trade like this without being overly tight with your stops. In fact some would

have taken prot at the 23.6% Fibonacci Extension level. I believe that taking prot at any of the levels would have been a

prudent strategy.

Now let’s look at the nal entry point from our Figure 7 example.

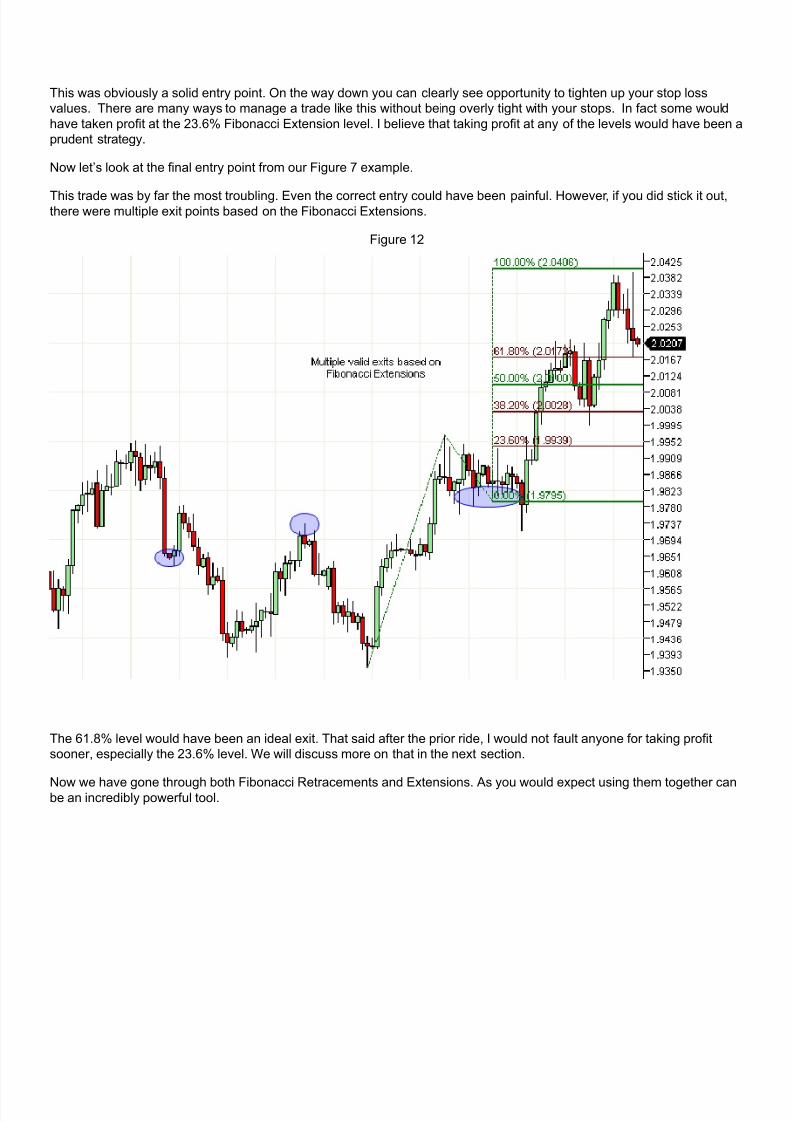
This trade was by far the most troubling. Even the correct entry could have been painful. However, if you did stick it out,there were multiple exit points based on the Fibonacci Extensions.

Figure 12

The 61.8% level would have been an ideal exit. That said after the prior ride, I would not fault anyone for taking prot

sooner, especially the 23.6% level. We will discuss more on that in the next section.

Now we have gone through both Fibonacci Retracements and Extensions. As you would expect using them together canbe an incredibly powerful tool.

8/7/2019 fibonacci_genius_2008

http://slidepdf.com/reader/full/fibonaccigenius2008 12/16

Fibonacci Clustering:

In our previous examples we have seen how both Fibonacci Retracements and Fibonacci Extensions can be powerful

tools on their own. Often, I use multiple Fibonacci Retracements to determine entry and exit points. And then also

combine Fibonacci Extensions.

Let’s look at an example where using multiple Fibonacci Retracements prove very useful. In Figure 13 we see the

dramatic fall of the USDCAD that we looked at from a different perspective in Figures 4, 5 & 6.

Figure 13

In the gure above I have added two Fibonacci Retracements. Take special note to the two areas highlighted. These

areas identify clusters of Fibonacci levels.

The bounce off the bottom blew directly though the rst cluster of 23.6% and 38.2%. In subsequent retracements, this

level became support and you could have safely used it as a very low risk entry point.

Additionally, the 38.2% and 61.8% cluster became resistance. In two of three cases you could have used this information

for low risk short side entry points.

The key to remember in this example: You had all this information immediately after the swing low was established.

Therefore knowing these levels this early in the swing allows these levels to be predictive

8/7/2019 fibonacci_genius_2008

http://slidepdf.com/reader/full/fibonaccigenius2008 13/16

Now let’s add one more Fibonacci Retracement.

Figure 14

In the gure above I have added a third Fibonacci Retracement.

For the patient trader, the third set Fibonacci Retracement levels provides more condence that both Point A and Point B

are high quality and low risk entry points from the long side.

After practicing this method for a while, you will nd it common for you charts to have multiple Fibonacci Retracements.

Learning to create and read Fibonacci Retracement clusters is a powerful and valuable tool for your Fibonacci Toolset.

You can also cluster multiple Fibonacci Extensions. In Figure 15 you see this in action.

Figure 15

8/7/2019 fibonacci_genius_2008

http://slidepdf.com/reader/full/fibonaccigenius2008 14/16

In this chart you see two different sets of Fibonacci Extensions applied. As you can see there are four, two level groups.

Each of these groups represents low risk entry points. Ideally, you would want to initiate the position somewhere between

the two levels. Additionally, with this type of setup, you can almost trade from pair to pair.

As you can see by the previous two examples, it would be very easy to draw countless retracements and extensions onvirtually any chart. It really depends on the chart and the price action.

8/7/2019 fibonacci_genius_2008

http://slidepdf.com/reader/full/fibonaccigenius2008 15/16

In Figure 7 we looked at the Bottoming of the GBPUSD using one basic Fibonacci Retracement. Let’s revisit GBPUSD on

a bigger scale and add to our thesis.

In our next chart I have added a larger Fibonacci Retracement that encapsulates the entire top to bottom move and I have

added a Fibonacci extension from the high and low swing points within the retracement price action. These additions are

shown on our chart below.

Figure 16


Take special notice of the Fibonacci clusters highlighted. Each of these clusters served as either support or resistance

points. And each created a tradable opportunity.

8/7/2019 fibonacci_genius_2008

http://slidepdf.com/reader/full/fibonaccigenius2008 16/16

Summary:

Fibonacci ratios are one of the most commonly used techniques in technical analysis of the nancial markets. If you are

already a successful trader or a trader just starting out, Fibonacci Retracements provide valuable insight and triggers on

where high probability change will happen.

The Fibonacci Retracement is likely the most common of all Fibonacci related tools. While there are many variations of 

the ratio set, I think simple is better.

23.6% -- The shallowest of the retracements. In very strong trending markets price typically quickly bounces•

in the area of this ratio.

38.2% --- This is the rst line of defense of the current trend. Breaking this level starts to erode the•

underlying trend.

50% -- the neutral point of any retracement. This is the critical tipping point.•

61.8% -- retracing to this typically signals a breakdown in the trend.•

100% -- Matching the initial move•

138.2%•

161.8%•

200%•

Within this set, 38.2%, 50% and 61.8% I nd quite reliable. I use the others as more conrmation and as part of clusters.

The Fibonacci Extension is less common but just as powerful when correctly applied. Used as part of a money

management strategy and as prot target projection tool, Fibonacci Extensions provide guidance on where price will

potentially stall or change direction.

Used in combination, these two ratio sets provide very tradable indicators of opportunity. If you then combine Fibonacci

with other indicators like oscillators and moving averages, you can quickly identify high potential risk/reward opportunities.

While not perfect, they are one of the best tools available.

Disclosure:CFTC RULE 4.41 - HYPOTHETICAL OR SIMULATED PERFORMANCE RESULTS HAVE CERTAIN LIMITATIONS.

UNLIKE AN ACTUAL PERFORMANCE RECORD, SIMULATED RESULTS DO NOT REPRESENT ACTUAL

TRADING. ALSO, SINCE THE TRADES HAVE NOT BEEN EXECUTED, THE RESULTS MAY HAVE UNDER-OR-OVER

COMPENSATED FOR THE IMPACT, IF ANY, OF CERTAIN MARKET FACTORS, SUCH AS LACK OF LIQUIDITY.

SIMULATED TRADING PROGRAMS IN GENERAL ARE ALSO SUBJECT TO THE FACT THAT THEY ARE DESIGNED

WITH THE BENEFIT OF HINDSIGHT. NO REPRESENTATION IS BEING MADE THAT ANY ACCOUNT WILL OR ISLIKELY TO ACHIEVE PROFIT OR LOSSES SIMILAR TO THOSE SHOWN.

No representation is being made that any account will or is likely to achieve prots or losses similar to those

shown. In act, there are requently sharp diferences between hypothetical perormance results and the

actual results subsequently achieved by any particular trading program. Hypothetical trading does not

involve nancial risk, and no hypothetical trading record can completely account or the impact o nancial

risk in actual trading.