SSFX KNOWLEDGE CENTER An Education Initiative of Seven Star FX Ltd Seven Star FX Ltd. [email protected]Fibonacci ‘Fibonacci’ is the most Complex but yet effective trading Style used World Over. Its Based on Numbers & Various Mathematical Formula that helps the traders to determine retracement levels for intraday trading.
Transcript
SSFX KNOWLEDGE CENTER An Education Initiative of Seven Star FX Ltd
Leonardo Fibonacci (1170 – 1240) of Pisa, Italy, was a thirteen century mathematician who discovered that there
was a relationship with adding numbers together; from that, the dividing relationship resulted in repetitive percentage
figures. The Fibonacci sequence is the series of numbers: 0, 1, 1, 2, 3, 5, 8, 13, 21, 34 …………..
The next number is found by adding up the two numbers before it. For example i. The 2 is found by adding the two numbers before it (1+1) Ii. The 3 is found by adding the two numbers before it (1+2), iii. The 5 is found by adding the two numbers before it (2+3) iv. And the next number in the sequence above would be 21+34 = 55 Hence Fibonacci sequence can be defined by a mathematical formula i.e.
Here, XN is term number “N” XN-1 is the previous term (N-1) XN-2 is the term before that (N-2)
The Fibonacci sequence is used in many fields including market. Basically to know forex trading, one needs to know only this regarding Fibonacci sequence.
Basically price movement reflects human opinion, expectation, fear, greed and valuation etc. Fibonacci sequence has been successfully used to predict and analyse price trends. This is explained ahead in Golden Ratio, Fibonacci retracement and Fibonacci relationship
1. Golden Ratio
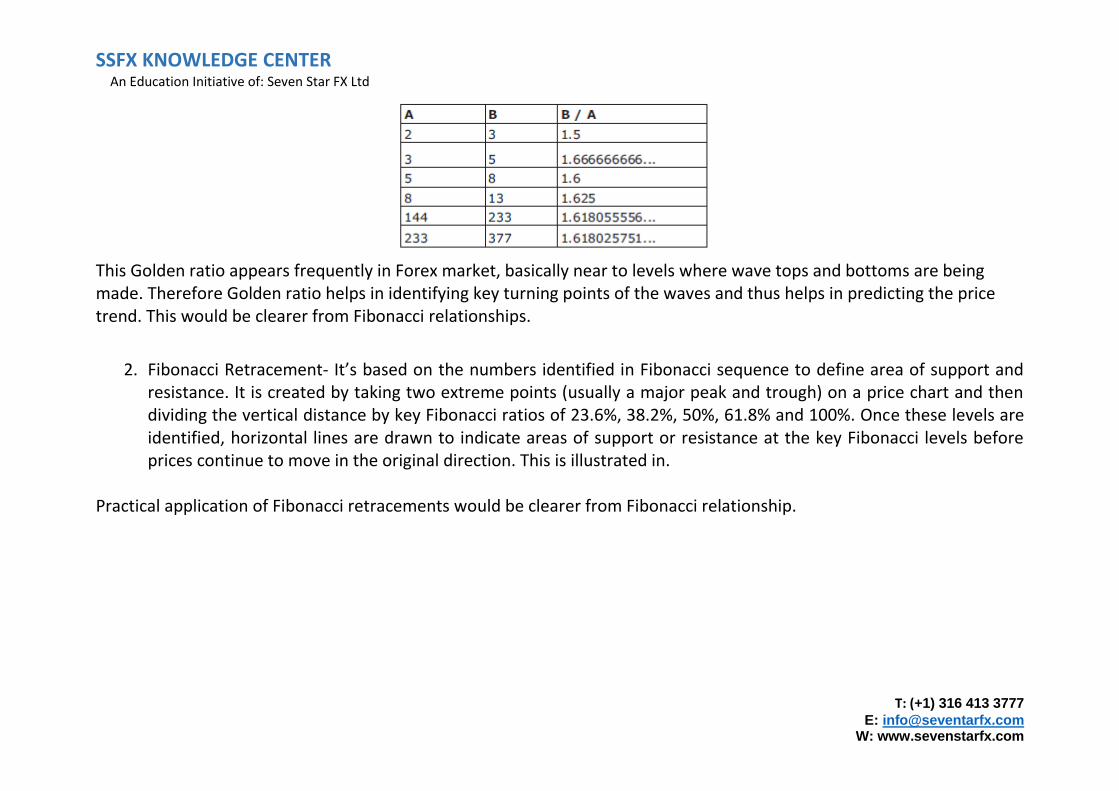
In Mathematics and in arts, ratio is considered Golden, if ratio of the sum of two quantities to the larger quantity is equal to the ratio of the larger quantity to the smaller quantity Let’s understand this with an example. There are two quantities say A and B, where A is larger than B. If (A+B)/A = A/B then answer is Golden Ratio which is 1.6180339887… This Golden ratio is observed, if you take ratio of any two successive Fibonacci numbers. It comes very close to 1.618034…….
This Golden ratio appears frequently in Forex market, basically near to levels where wave tops and bottoms are being made. Therefore Golden ratio helps in identifying key turning points of the waves and thus helps in predicting the price trend. This would be clearer from Fibonacci relationships.
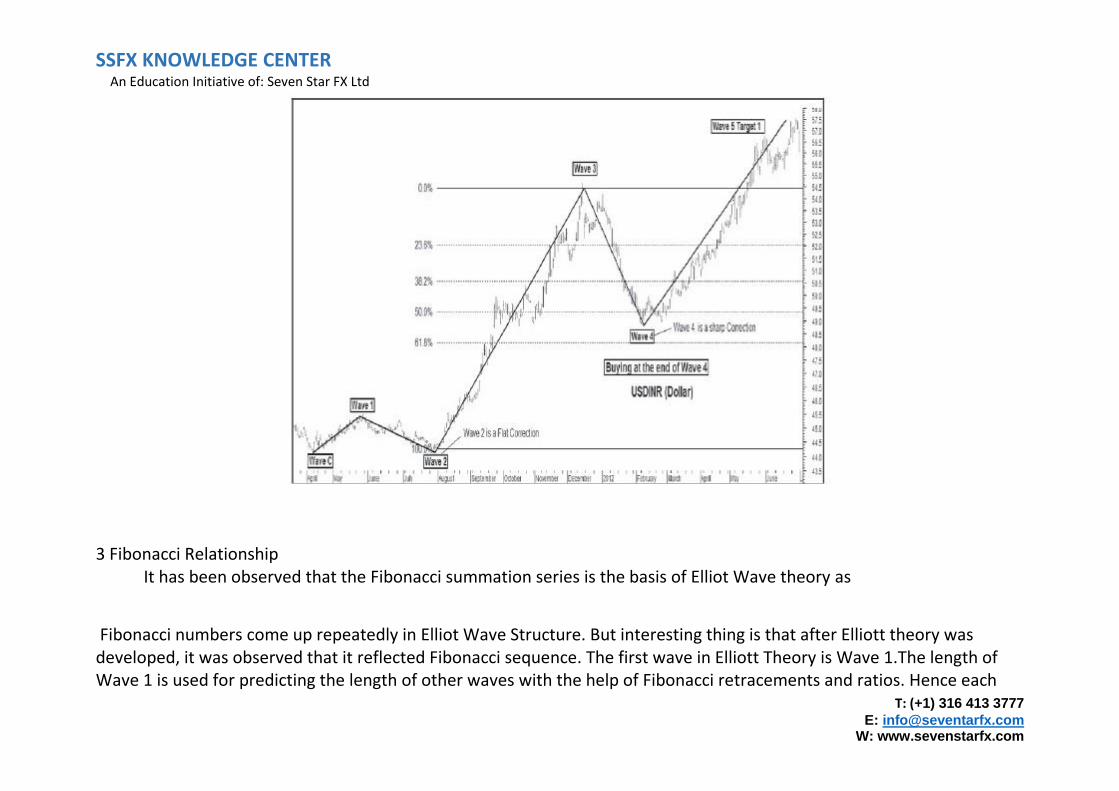
2. Fibonacci Retracement- It’s based on the numbers identified in Fibonacci sequence to define area of support and resistance. It is created by taking two extreme points (usually a major peak and trough) on a price chart and then dividing the vertical distance by key Fibonacci ratios of 23.6%, 38.2%, 50%, 61.8% and 100%. Once these levels are identified, horizontal lines are drawn to indicate areas of support or resistance at the key Fibonacci levels before prices continue to move in the original direction. This is illustrated in.
Practical application of Fibonacci retracements would be clearer from Fibonacci relationship.
3 Fibonacci Relationship It has been observed that the Fibonacci summation series is the basis of Elliot Wave theory as
Fibonacci numbers come up repeatedly in Elliot Wave Structure. But interesting thing is that after Elliott theory was developed, it was observed that it reflected Fibonacci sequence. The first wave in Elliott Theory is Wave 1.The length of Wave 1 is used for predicting the length of other waves with the help of Fibonacci retracements and ratios. Hence each
wave is related to some other wave in terms of Fibonacci ratio or retracement and these relationships are known as Fibonacci relationship. These relationships are not rules but guidelines in estimating length of the other waves and it’s defined as
I. Fibonacci relationship for wave 2: Wave 2 is always related to Wave 1. Wave 2 = either 50 % retracement of Wave 1 or Wave 2 = 61.8 % retracement of Wave 1.
Fibonacci relationship for Wave 3: Wave 3 is always related to Wave 1. Wave 3 = either 1.618 times the length of Wave 1 or Wave 3 = 2.618 times the length of Wave 1 or Wave 3 = 4.23 times the length of Wave 1 II. Fibonacci Relationship for Wave 4: Wave 4 is always related to Wave 3. Wave 4= either 23.6% retracement of Wave 3 or Wave 4= 38.2% retracement of Wave 3 or Wave 4= either 50 % retracement of Wave 3 In any case Wave 4 is not more than 61.8% retracement of Wave3. III. Fibonacci Relationship for Wave 5: i. Wave 5 is related to Wave 1. If Wave 3 is more than 1.618 times the length of Wave 1 then
Wave 5 = either Wave 1 or Wave 5 = 1.618 times the length of Wave 1 or Wave 5 = 2.618 times the length of Wave 1. ii. Wave 5 is related to entire length from bottom of Wave 1 to the top of Wave 3. If Wave 3 is less than 1.618 times the length of Wave 1 then Wave 5 = either 1.618 times the entire length from bottom of Wave 1 to the top of Wave 3 or Wave 5 = 2.618 times the entire length from bottom of Wave 1 to the top of Wave 3. IV. Fibonacci Relationship for Wave A: Wave A is related to Wave 5. Wave A= either 23.6% retracement of Wave 5 or Wave A= 38.2% retracement of Wave 5. V. Fibonacci Relationship for Wave B: Wave B is related to Wave A. Wave B = either 50 % retracement of Wave A or Wave B = 61.8 % retracement of Wave A. VI. Fibonacci Relationship for Wave C: Wave C is related to Wave A. Wave C = either 1.618 times the length of Wave A or Wave 3 = 2.618 times the length of Wave A.
Fibonacci projections is used to determine a potential price objective and is vital component in Elliot wave theory. It is an excellent confirmation tool to identify potential trend exhaustion turning points. It projects where price will travel upwards to hit resistance (in an uptrend) rather than find where price will find support via retracements.
The traders often use Fibonacci ratios 38.2%, 50.0%, and 61.8% for retracements, it is quite common to use 61.8%, 100.0%, 132.8%, and 161.8% for Price Projections and Extensions.
What exactly does this mean?
To draw a Fibonacci Projection grid, we’ll need to identify a swing low, swing high, and price retracement against the swing high (for uptrends – reverse the definition for projecting price in a down-trend). Let’s see an ideal example:
This example is done in the context of an uptrend. The projection grid off a Swing Low and then draw the first line to the next Swing High.
1. In an up-trend, Identify a Swing Low (retracement) 2. Use your Fibonacci Projection Tool to move from the Swing Low to the next Swing High for the ‘base.’ 3. Draw the Second Line from the Swing High to a Retracement (Swing) Low
The first line (from Swing Low to Swing High) serves as the “Measurement Swing” by which we will soon create Fibonacci Projections. The “Retracement” Swing provides the base from which to project Fibonacci relationships of the first swing.
For example, if the original swing is $10 and our retracement is $5 down, we would take the Fibonacci ratios of the $10 swing (61.8%, 100%, etc.) and then add those values to the Retracement Low
This document is issued by SevenStar FX Limited, who is authorised and regulated by the Internal Financial Service Commission (IFSC) with Registration No: IFSC/60/211//TS/15.
The document is prepared and distributed for information and education purposes only. Seven Star FX (SSFX) is a congressionally authorized Forex broking organization of high repute. Its
mission is to provide innovative Forex programs and services that protect investors and ensure market integrity
. SSFX has prepared this article as part of its continuing public education efforts to provide information to potential investors. The booklet provides a necessary overview of the
opportunities & risks in trading Forex by presenting important information that investors need to know before they invest