Fidalgo Bay Sediment Investigation Anacortes, WA Sediment Sampling and Analysis Plan FINAL Prepared for Washington State Department of Ecology Toxics Cleanup Program 300 Desmond Drive Lacey, Washington 98504 Prepared by Science Applications International Corporation 18912 North Creek Parkway, Suite 101 Bothell, WA 98011 September 17, 2007
Transcript
Fidalgo Bay Sediment Investigation
Anacortes, WA
Sediment Sampling and Analysis Plan
FINAL
Prepared for
Washington State Department of Ecology
Toxics Cleanup Program 300 Desmond Drive
Lacey, Washington 98504
Prepared by
Science Applications International Corporation
18912 North Creek Parkway, Suite 101 Bothell, WA 98011
September 17, 2007
gcas461
Text Box
Publication No. 08-09-108
If you need this publication in an alternative format, please contact the Toxics Cleanup Program at (360) 407-7170. Persons with a hearing loss can call 711 for Washington
Relay Service. Persons with a speech disability can call (877) 833-6341.
Download this publication from the Department of Ecology's Web Site at http://www.ecy.wa.gov/biblio/0809108.html
For additional copies of this publication, please contact:
Table of Contents 1.0 INTRODUCTION.........................................................................................................................................1
1.1 SITE DESCRIPTION.......................................................................................................................................1 1.2 PREVIOUS INVESTIGATIONS.........................................................................................................................1
1.2.1 Ecology Survey for Petroleum and Other Contaminants in Fidalgo Bay Sediments (Ecology 1997)..4 1.2.2 Joint Ecology/NOAA Survey for Chemical Contamination, Acute Toxicity, and Benthic Impacts in
Puget Sound Sediments (Ecology and NOAA 2003) ...........................................................................4 1.2.3 Ecology Screening Analysis for Metals and Organic Compounds in Shellfish from Padilla Bay and
Vicinity (Ecology 2000a) .....................................................................................................................5 1.2.4 Sediment Quality on the West Side of Inner Fidalgo Bay (Ecology 2000b) ........................................5 1.2.5 Dredge Material Characterization of Cap Sante Marina (Hart Crowser 2000a)...................................5 1.2.6 April 2000 Dredge Material Characterization for Pier 1, Anacortes, WA (Hart Crowser 2000b,
Report J-7152) ......................................................................................................................................5 1.2.7 Dredge Material Characterization for Dakota Creek Shipyard, Anacortes, WA (Hart Crowser 2000c,
Report J-7152) ......................................................................................................................................6 1.2.8 Supplemental Sediment Characterization for Dakota Creek Shipyard and Pier 1 Redevelopment
Area, Anacortes, WA (Anchor 2004) ...................................................................................................6 1.2.9 Initial Remedial Investigation Sediment Sampling Wood Debris Evaluation Data Report for the
Former Scott Paper Mill Site, Anacortes, WA (Anchor 2004) .............................................................6 1.2.10 Draft Data Report for the Remedial Investigation/Feasibility Study of the Former Scott Paper Mill
Site, Anacortes, WA (Anchor 2005).....................................................................................................6 1.3 PROJECT SCOPE AND WORK PLAN OBJECTIVES ..........................................................................................7 1.4 PROJECT TEAM AND RESPONSIBILITIES .......................................................................................................8
1.4.1 Project Planning and Coordination.......................................................................................................8 1.4.2 Sample Collection.................................................................................................................................8 1.4.3 Laboratory Sample Preparation and Analysis.......................................................................................8 1.4.4 QA/QC Management............................................................................................................................8 1.4.5 Health and Safety Manager ..................................................................................................................9 1.4.6 Subcontractor Support ..........................................................................................................................9
1.5 SCHEDULE.................................................................................................................................................10 2.0 STUDY DESIGN.........................................................................................................................................11
5.1 MEASUREMENTS OF DATA QUALITY.........................................................................................................53 5.2 QUALITY ASSURANCE AND QUALITY CONTROL FOR CHEMISTRY SEDIMENT SAMPLES ............................54
5.2.1 Field QA/QC for Chemistry Sediment Samples.................................................................................54 5.2.2 Laboratory QA/QC for Chemical Sediment Sample ..........................................................................54
5.3 BIOLOGICAL TESTING QA/QC FOR SEDIMENT SAMPLES...........................................................................55 5.3.1 Negative Control ................................................................................................................................55 5.3.2 Positive Control ..................................................................................................................................55 5.3.3 Reference Sediment............................................................................................................................55 5.3.4 Laboratory Replication .......................................................................................................................56 5.3.5 Bioassay Water Quality ......................................................................................................................56
5.4 DATA VALIDATION ...................................................................................................................................57 6.0 DATA ANALYSIS AND REPORTING....................................................................................................58
6.1 ANALYSIS OF SEDIMENT PROFILE IMAGING DATA ....................................................................................58 6.1.1 Benthic Macroinvertebrate Community .............................................................................................58 6.1.2 Apparent Redox Potential Discontinuity ............................................................................................59 6.1.3 Physical Parameters............................................................................................................................59
6.2 ANALYSIS OF SEDIMENT CHEMISTRY DATA..............................................................................................60 6.3 ANALYSIS OF BIOLOGICAL DATA..............................................................................................................60
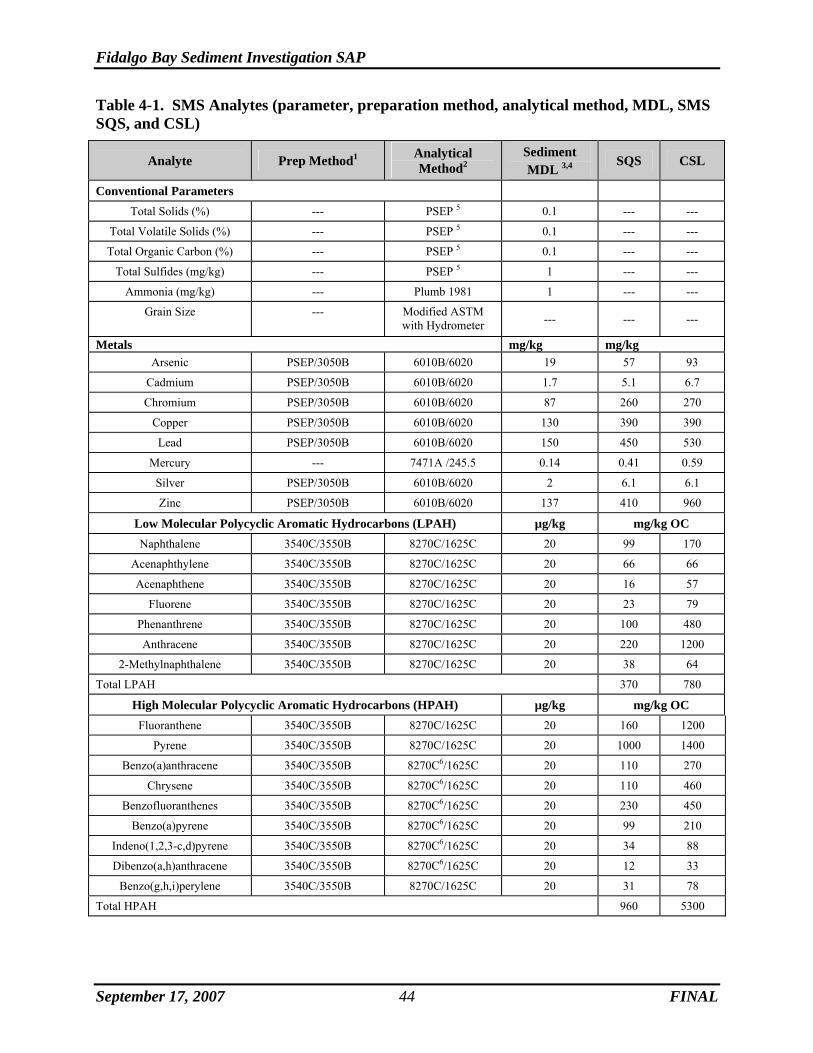
List of Tables Table 2-1. Data Type to be Collected at each Target Location1.................................................. 21 Table 3-1. Target Sample Locations............................................................................................ 26 Table 3-2. Surface Sediment Sample Types to be Collected....................................................... 41 Table 4-1. SMS Analytes (parameter, preparation method, analytical method, MDL, SMS SQS,
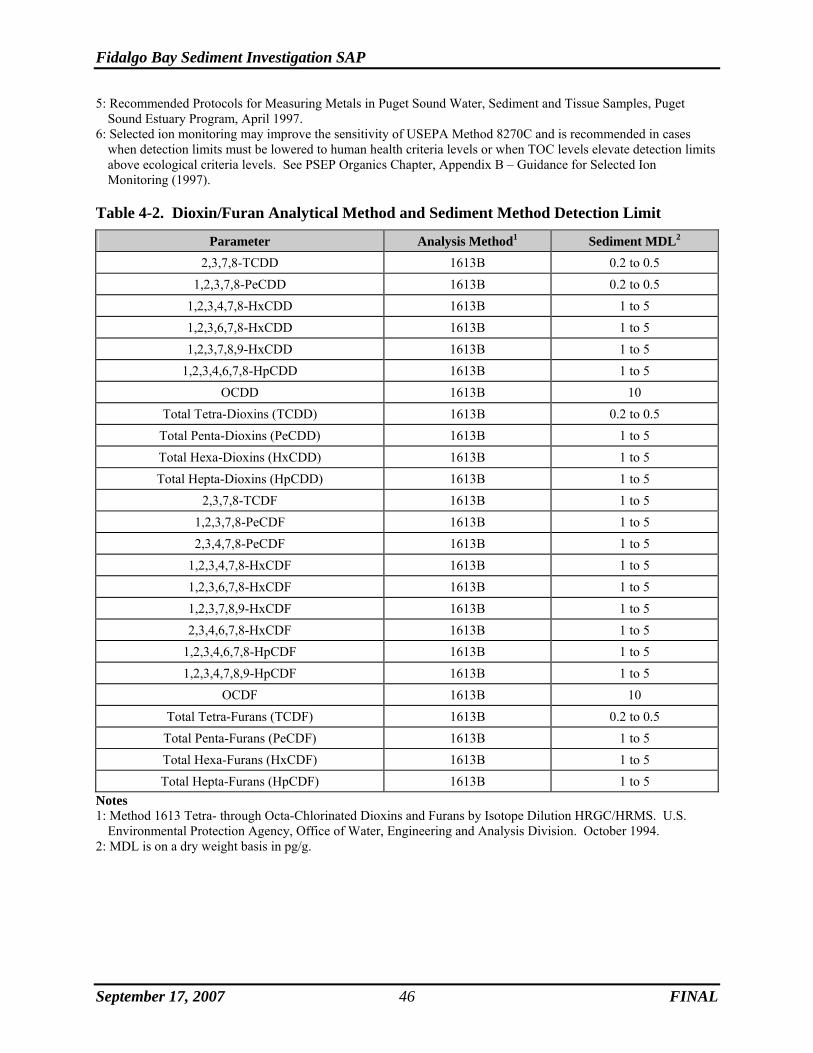
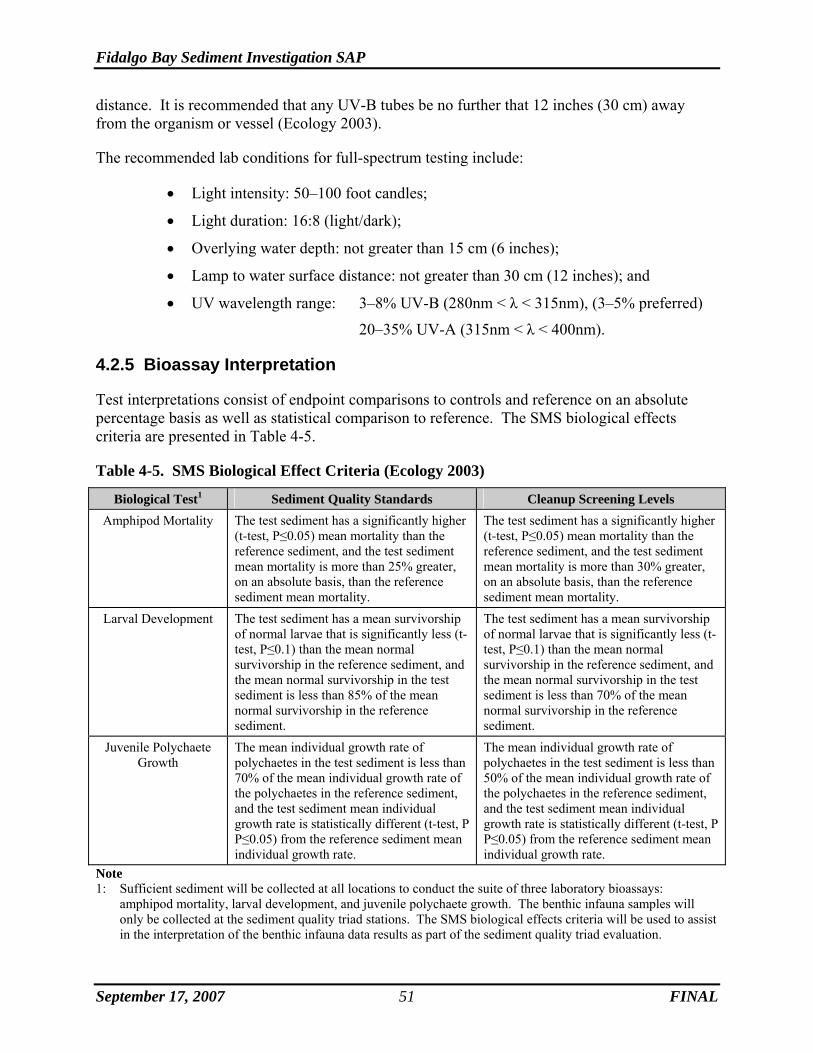
and CSL) ............................................................................................................................... 44 Table 4-2. Dioxin/Furan Analytical Method and Sediment Method Detection Limit................. 46 Table 4-3. Bioassay Suite for the March Point RI/FS Sediment Investigation ........................... 48 Table 4-4. Photo-activated Polycyclic Aromatic Hydrocarbons ................................................. 50 Table 4-5. SMS Biological Effect Criteria (Ecology 2003) ........................................................ 51 Table 5-1. Water Quality Control Limits (Ecology 2003)........................................................... 56 Table 6-1 Calculation of the Organism-Sediment Index .............................................................. 60
List of Figures Figure 1-1. Fidalgo Bay Study Area .............................................................................................. 2 Figure 1-2. Fidalgo Bay Area Historical Sampling Sites .............................................................. 3 Figure 2-1. Proposed Sampling Locations in Area 1................................................................... 15 Figure 2-2. Proposed Sampling Locations in Area 2................................................................... 16 Figure 2-3. Proposed Sampling Locations in Area 3................................................................... 17 Figure 2-4. Proposed Sampling Locations in Area 4................................................................... 18 Figure 2-5. Proposed Bottom Trawling Locations ...................................................................... 19 Figure 2-6. Fidalgo Bay Candidate Reference Sediment Sites.................................................... 20
Appendices Appendix A Health and Safety Plan Appendix B Sample Forms
Fidalgo Bay Sediment Investigation SAP
September 17, 2007 iv FINAL
List of Acronyms
CRI Color Rendering Index CSL Contaminant Screening Level DGPS Differential Global Positioning System DMMP Dredged Material Management Program DMMU dredged material management unit DUA Decision Unit Area ECOLOGY Washington State Department of Ecology ERM Effects Range Median GPC gel permeation chromatography HASP Health and Safety Plan HPAH high molecular weight polynuclear aromatic hydrocarbon LAET lowest apparent effects threshold LCS/LCSD laboratory control sample/laboratory control sample duplicate LPAH low molecular weight polynuclear aromatic hydrocarbon MDL method detection limit MS/MSD matrix spike/matrix spike duplicate OC organic carbon OHWM ordinary high water mark OSI Organism-Sediment Index PAH polynuclear aromatic hydrocarbon PARCC precision, accuracy, representativeness, completeness, and comparability PCB polychlorinated biphenyl PPE personal protective clothing PSEP Puget Sound Estuary Program QA/QC quality assurance/quality control QAPP Quality Assurance Project Plan REMOTS® Remote Ecological Monitoring of the Seafloor RI/FS Remedial Investigation/Feasibility Study RPD redox potential discontinuity SA Selective Availability SAIC Science Applications International Corporation SAP Sampling and Analysis Plan SEDQUAL sediment quality (database) SMARM Sediment Management Annual Review Meeting SMS Sediment Management Standards SOP standard operating procedures SPI Sediment Profile Imaging SQS Sediment Quality Standard SVOC semi-volatile organic compound TBT tributyltin TCP Toxics Cleanup Program TDL target detection limit
Fidalgo Bay Sediment Investigation SAP
September 17, 2007 v FINAL
TEF toxic equivalent factors TEQ toxic equivalent quotation TOC total organic carbon TPH total petroleum hydrocarbons TS total solids TVS total volatile solids USCS Unified Soil Classification System USEPA U.S. Environmental Protection Agency UV ultraviolet WDNR Washington State Department of Natural Resources WHO World Health Organization
Fidalgo Bay Sediment Investigation SAP
September 17, 2007 1 FINAL
1.0 Introduction
Fidalgo Bay has been identified by the Washington State Department of Ecology (Ecology) under the Toxics Cleanup Program’s (TCP) Puget Sound Initiative for focused sediment cleanup and source control. Previous sediment quality investigations have indicated that contaminants have exceeded the Washington State Sediment Management Standards (SMS) Chapter 173-204 WAC (Ecology 1995). The purpose of this combined Sampling and Analysis Plan (SAP) and Quality Assurance Project Plan (QAPP) is to conduct a sediment investigation to characterize the sediment quality of Fidalgo Bay, Anacortes, WA. This work plan includes the components of the SAP and QAPP requirements per WAC 173-340-820. The plan also specifies analytical procedures in accordance with WAC 173-340-830.
1.1 Site Description
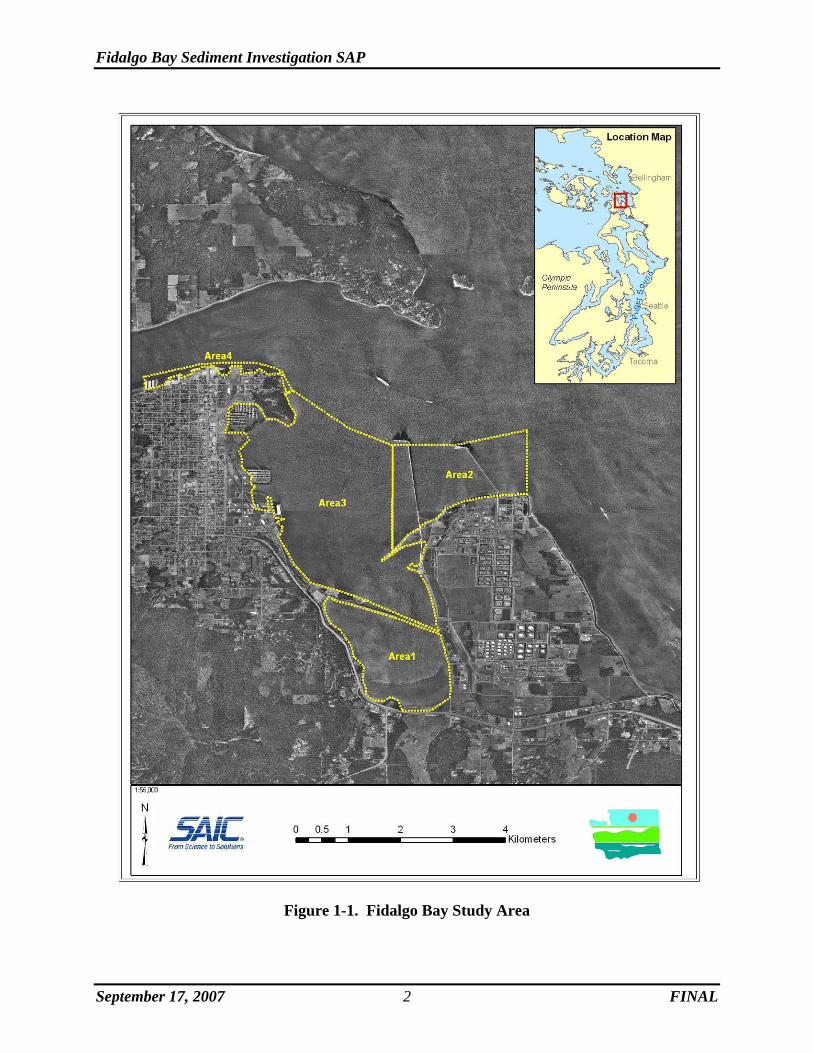
Fidalgo Bay is a generally shallow embayment, bounded to the west by the City of Anacortes and to the east by March Point (Figure 1-1). Tideland filling, shoreline armoring, and over-water structures are present throughout the bay. A railroad trestle, owned by the City of Anacortes, runs across the southern part of the bay. Southern Fidalgo Bay has been proposed as an Aquatic Reserve to be managed by the Washington State Department of Natural Resources (WDNR 2007). It contains expanses of eelgrass and extensive tide flats that support spawning and rearing of forage fish (e.g., Pacific herring, surf smelt, and sand lance) and juvenile salmonid migration. Other species that use the bay include bald eagles, peregrine falcons, migratory waterfowl, wading birds (e.g., great blue heron and least sandpiper), and abundant marine life. Water quality monitoring indicates the bay is generally well mixed vertically and has levels of dissolved oxygen, fecal coliform, and nutrients within state guidelines (WDNR 2007).
Fidalgo Bay has been utilized by a number of industries including saw mills and plywood manufacturing, paper production, oil refining, and boat building. Across the bay from Anacortes are two oil refineries that produce gasoline, diesel fuel, and propane. There have been a number of accidental releases from these sites as well as a multi-year release from the Cap Sante Marina fueling station. The bay has been included in a nationwide monitoring program for the antifouling agent tributyltin (TBT) due to the presence of the marina, boat yards, and oil tankers (Ecology 1997).
1.2 Previous Investigations
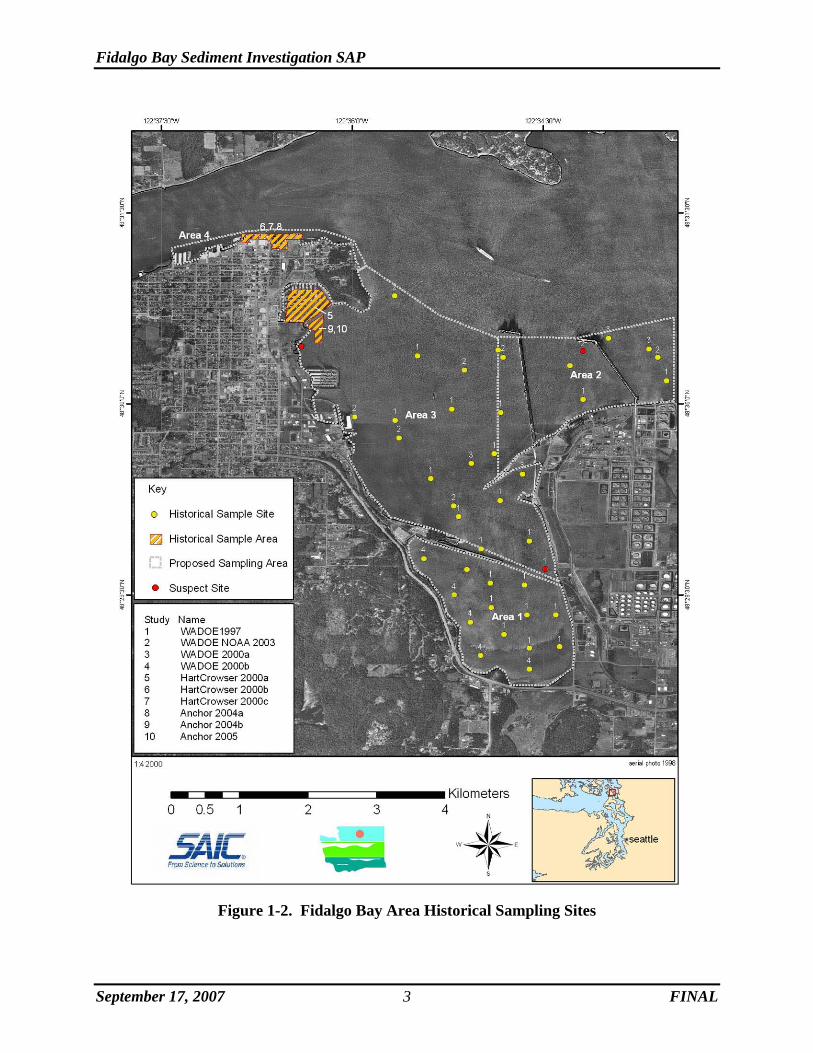
The following sections summarize previous environmental investigations that have been conducted in Fidalgo Bay over the past 10 years. The studies are discussed in chronological order based on when the associated sampling activities occurred. Ecology’s Environmental Information Management (EIM) online database was used for the historical data search. Sampling locations from the previous investigations are shown in Figure 1-2.
Fidalgo Bay Sediment Investigation SAP
September 17, 2007 2 FINAL
Figure 1-1. Fidalgo Bay Study Area
Fidalgo Bay Sediment Investigation SAP
September 17, 2007 3 FINAL
Figure 1-2. Fidalgo Bay Area Historical Sampling Sites
Fidalgo Bay Sediment Investigation SAP
September 17, 2007 4 FINAL
1.2.1 Ecology Survey for Petroleum and Other Contaminants in Fidalgo Bay Sediments (Ecology 1997)
Ecology conducted a sediment survey in April 1997, 6 years after approximately 20,000 gallons of North Slope crude spilled in Fidalgo Bay in February 1991. The survey attempted to determine how widespread the oil contamination was and if sediments met chemical criteria. A total of 27 locations were sampled from the head of Fidalgo Bay and the east side of March Point. Three background sites were sampled in Padilla Bay. Each sample collected for analysis was a composite of three individual surface sediment (0–10 cm) grabs. All samples were analyzed for total petroleum hydrocarbons (TPH). A subset of 14 samples were analyzed for metals (zinc, chromium, copper, arsenic, lead, cadmium, silver, and mercury), semivolatile organic compounds (SVOCs), polychlorinated biphenyls (PCBs), and sediment conventionals (grain size and total organic carbon). Five locations in the outer bay were analyzed for organotins.
No oil or sheens were observed on the samples during field sampling. TPH analysis did not match crude oil. Motor oil was detected from a site close to the western shore of March Point near a culvert running under March Point Road. This site (#3) exceeded sediment quality standards (SQS) for total high molecular weight polycyclic aromatic hydrocarbons (HPAHs) and for the individual compounds chrysene and fluoranthene but did not exceed cleanup screening levels (CSLs). Zinc and chromium concentrations were significantly higher in the inner bay sediments than in the outer bay. Metals and other organics were below their respective SQS criteria. Polynuclear aromatic hydrocarbon (PAH) concentrations in the bay were generally two to four times higher than concentrations measured in reference areas. PCBs were detected at only two inner bay sites at concentrations of 9 and 10 μg/kg total PCBs. Tributyltin was detected at 0.1 – 1.9 μg/kg at three of five outer bay sites tested. The report concluded that the chemical quality of Fidalgo Bay sediments was generally good. PAHs were moderately elevated (10 -100 µg/kg) through much of the bay with combustion (which produces pyrogenic PAHs) indicated as the primary source.
1.2.2 Joint Ecology/NOAA Survey for Chemical Contamination, Acute Toxicity, and Benthic Impacts in Puget Sound Sediments (Ecology and NOAA 2003)
Surficial sediments were collected from 300 randomly chosen locations throughout Puget Sound, including 12 within Fidalgo Bay or just to the north in Padilla Bay. Based on sediment quality triad, eight of the sites were rated as high quality; sites 51, 54, and 56 were rated intermediate-high quality; and site 48 was rated intermediate-degraded. Site 48 was located off the northern shore of March Point and is a site of interest for further investigation. Three of the locations demonstrated some indication of statistically significant toxicity in larval development or cytochrome P450 induction test. Benthic infaunal index for evenness was in the lower quartile for one location and total abundance was in the lower quartile for one location. Seven locations exceeded the SQS for benzoic acid, 4-methyphenol and phenol. Two sites exceeded the SQS for at least one contaminant besides benzoic acid, 4-methylphenol and phenol. No sites exceeded CSL standards.
Fidalgo Bay Sediment Investigation SAP
September 17, 2007 5 FINAL
1.2.3 Ecology Screening Analysis for Metals and Organic Compounds in Shellfish from Padilla Bay and Vicinity (Ecology 2000a)
Shellfish were sampled in May and June 1999 from two sites in Fidalgo Bay (crabs and clams) and two sites north of March Point (crabs and mussels). Analytes included metals (arsenic, lead, cadmium, selenium, mercury, tributyltin), PAHs, PCBs, bioaccumulative pesticides, and polychlorinated dioxins and furans. Mussels and crabs off of March Point were only analyzed for PAHs. Results indicated a low level of contamination relative to other parts of Puget Sound. Site-specific human health screening values, reflecting a daily intake value not likely to result in negative impacts over a lifetime of exposure, were calculated using U.S. Environmental Protection Agency (USEPA) methods (USEPA 1995). Shellfish consumption values derived for the Tulalip Tribe were used, and a diet consisting of a high shellfish consumption rate was assumed. Only arsenic exceeded human health screening criteria. Arsenic concentrations in Fidalgo Bay crab muscle were lower than those collected at the Samish Island reference site (5,230 μg/kg vs. 5700 μg/kg) while those at March Point were somewhat higher (7,350 μg/kg).
1.2.4 Sediment Quality on the West Side of Inner Fidalgo Bay (Ecology 2000b)
Five sediment samples on the western side of inner Fidalgo Bay were collected in October 1999 and analyzed for metals and organic compounds. Most chemicals detected were at concentrations similar to or only slightly higher than those in reference sediments from Samish Bay, 9 miles to the north. Combustion sources were indicated as the sources of PAHs. No petroleum was found in TPH samples. No PCBs or pesticides were detected. All chemical concentrations of detected compounds were below the SQS criteria.
1.2.5 Dredge Material Characterization of Cap Sante Marina (Hart Crowser 2000a)
Sediment samples were collected from 47 stations within Cap Sante Marina. Sediment toxicity tests were conducted for one dredged material management unit (DMMU C8) that had PAHs (phenanthrene, chrysene, fluoranthene, pyrene, and total high molecular weight PAHs) exceeding the screening levels. Bioaccumulation testing was performed on composite samples from nine DMMUs that exceeded the Dredged Material Management Program (DMMP) bioaccumulation trigger for TBT. Testing results indicated the proposed dredge materials met the chemical, toxicological, and bioaccumulation suitability criteria for open-water disposal. Toxicity testing results indicated that the CSL exceedance in DMMU C8 did not result in significant toxicity to marine test organisms. Bioaccumulation testing indicated that significant uptake and potential adverse effects were unlikely to result from exposure to tributyltin in the dredged materials.
1.2.6 April 2000 Dredge Material Characterization for Pier 1, Anacortes, WA (Hart Crowser 2000b, Report J-7152)
Sediment samples were collected from eight locations offshore of Pier 1. Ten metals were detected in two composite sediment samples. Tributyltin was detected in the pore water of two composite sediment samples. Phenanthrene was detected in one composite sample. High
Fidalgo Bay Sediment Investigation SAP
September 17, 2007 6 FINAL
molecular weight PAHs were detected in two of the composite sediment samples. None of the analyte detections exceeded their respective screening values and the proposed dredged materials met the criteria for open-water disposal. The dredging of the Pier 1 redevelopment area has not yet been completed.
1.2.7 Dredge Material Characterization for Dakota Creek Shipyard, Anacortes, WA (Hart Crowser 2000c, Report J-7152)
Sediment samples were collected from eight locations offshore of the Dakota Creek Shipyard between Piers 1 and 2. Several SVOCs exceeded their respective screening limits in a composite sample taken from DMMU D2. Sediments from DMMU 1 met the suitability criteria for open-water disposal. Tributyltin was detected in pore water of the two composite samples analyzed and was reported at the screening level due to significant figure rounding. Eight of ten high molecular weight PAHs detected exceeded their screening levels in DMMU 2. The report indicates that the DMMU 2 surface sediments would not meet the disposal criteria without additional testing.
1.2.8 Supplemental Sediment Characterization for Dakota Creek Shipyard and Pier 1 Redevelopment Area, Anacortes, WA (Anchor 2004)
Sediment samples were collected from five locations offshore of the Dakota Creek Shipyard and Pier 1 and analyzed for dioxins and furans. The report specifically addressed collection and analysis of cores from DMMUs that had been previously established in the Hart Crowser studies conducted in 2000. Bulk sediments did not exceed the DMMP criterion for 2,3,7,8-TCDD (5 ng/g) or the calculated 2,3,7,8-TCDD toxicity equivalent concentration (15 ng/g). The previously issued open-water disposal suitability determination was confirmed for all DMMUs.
1.2.9 Initial Remedial Investigation Sediment Sampling Wood Debris Evaluation Data Report for the Former Scott Paper Mill Site, Anacortes, WA (Anchor 2004)
A total of 19 sediment grab samples were collected in Fidalgo Bay offshore of the former Scott Mill Paper Site and analyzed for total organic carbon (TOC), total solids (TS), and total volatile solids (TVS). Higher amounts of wood debris were generally observed in samples collected nearest to the shoreline while those samples collected more than 300 feet off shore generally had a lower quantity of wood debris. TOC and TVS percentages were also highest nearer the shoreline, particularly in the middle of the study area and north of the pier. None of the samples exceeded 25 percent TVS, 10 percent TOC. Several samples contained wood debris densities at or above 50 percent.
1.2.10 Draft Data Report for the Remedial Investigation/Feasibility Study of the Former Scott Paper Mill Site, Anacortes, WA (Anchor 2005)
Sediment samples were collected from eight locations offshore of the former Scott Mill Paper Site and analyzed for metals, PCBs, SVOCs, dioxins, and furans. Of 24 core samples analyzed, only one exceeded SMS criteria for 4-methylphenol (680 mg/kg dry weight).
Fidalgo Bay Sediment Investigation SAP
September 17, 2007 7 FINAL
1.3 Project Scope and Work Plan Objectives
The scope of this Sediment Investigation SAP is limited geographically to the aquatic areas of Fidalgo Bay in water depths of five fathoms or less, except for the area immediately north of the March Point refinery fuel piers. The study area has been divided into four Decision Unit Areas (DUAs) as shown in Figure 1-1. Area 1 consists of the southern portion of Fidalgo Bay south of the railroad dyke and trestle. Area 2 comprises the area eastward from the northeastern tip of March Point to Buoy 2. Area 3 encompasses the remainder of the proper embayment of Fidalgo Bay. Area 4 is the nearshore areas from Cap Sante, west along the Anacortes waterfront to the westernmost extent of the cable crossing between Fidalgo and Guemes Islands.
The purpose of this workplan is to describe the manner and methods for which data collection efforts will be performed to characterize the sediment quality of Fidalgo Bay. The results of the sediment characterization will be used to determine whether potential cleanup action(s) are warranted to minimize the potential for adverse impacts to the biotic community.
The objectives of the workplan will be to conduct a multi-faceted, tiered sediment characterization of the site designed to define the nature and extent of potential sediment contamination. The specific objectives of the sediment investigation will include the following:
• Conduct a more intensive sampling and analysis effort to characterize the overall nature and extent of sediment contamination in Fidalgo Bay.
• Collect, process, and analyze representative sediment data to characterize the site in accordance with protocols, timing, and quality assurance/quality control (QA/QC) requirements outlined by Washington State SMS protocols, Puget Sound Estuary Program (PSEP) protocols, and subsequent Sediment Management Annual Review Meetings (SMARM) updates.
• Compare the sediment chemistry results to Washington State SMS, SQS, and CSL. • Analyze for dioxins/furans in Fidalgo Bay sediments so that Ecology can evaluate the
dioxin/furan concentrations relative to human health and ecological health concerns. Analysis of dioxins/furans will follow USEPA Method 1613B for 2,3,7,8-substituted chlorinated dioxins and furans. Tissue collection and analysis may also be conducted to assess the uptake of dioxins/furans in ecological receptors, if warranted.
• Conduct a suite of sediment toxicity tests on synoptic surface sediment samples that exceed the SQS chemical criteria. The suite of toxicity tests will include a larval development bioassay, an amphipod mortality bioassay, and a juvenile polychaete growth bioassay. In addition, due to the intertidal nature of portions of the site, bioassays will be conducted utilizing full-spectrum lighting if the presence of PAHs is observed in intertidal areas (Ecology 2003).
• Collect subsurface sediment cores to determine the vertical extent of potential contamination through chemical analysis and the sedimentation rate and surface mixed layer via radioisotope dating.
• Conduct a sediment profile imaging survey to determine the physical conditions of the bottom substrate and benthic habitat types.
• Collect fish and shellfish for archival and potential tissue residue analysis for bioaccumulative compounds measured in sediments.
Fidalgo Bay Sediment Investigation SAP
September 17, 2007 8 FINAL
1.4 Project Team and Responsibilities
The implementation of this workplan will be conducted by Science Applications International Corporation (SAIC) and its subcontractors at the discretion of Ecology. The following sections describe the key roles and responsibilities of the project team.
1.4.1 Project Planning and Coordination
Ted Benson, from Ecology, will serve as the Government Project Manager and will oversee the overall project coordination, supply government-furnished data and services, provide review comments on the report, and coordinate with the contractor selected to perform the Remedial Investigation/Feasibility Study (RI/FS) tasks. Tim Hammermeister will serve as the SAIC project manager and will be responsible for executing the approved SAP/QAPP, ensuring the proper collection and analysis of field samples, and reporting analytical results.
SAIC Tim Hammermeister 18912 North Creek Parkway Suite 101 Bothell, WA Phone: (425) 482-3306 Fax: (425) 487-1491 mailto:[email protected]
1.4.2 Sample Collection
Brion Dolan of SAIC will also serve as field manager and will be responsible for the collection and processing of samples in accordance with the SAP/QAPP, and transport of samples to the analytical and biological laboratory for analysis and testing. The field manager will ensure accurate station positioning and reporting.
1.4.3 Laboratory Sample Preparation and Analysis
Will Hafner of SAIC will serve as laboratory coordinator and will be responsible for subcontracting state-certified laboratories, delivery of samples to the analytical and biological laboratories, and ensuring that established protocols for decontamination, sample preservation, holding times, chain-of-custody documentation, and laboratory reporting will be observed.
1.4.4 QA/QC Management
John Nakayama will serve as the SAIC QA/QC manager and will perform quality assurance oversight for the laboratory programs. He will ensure that the laboratory analytical and QA/QC data are considered valid and procedures meet the required analytical quality control limits.
Fidalgo Bay Sediment Investigation SAP
September 17, 2007 9 FINAL
1.4.5 Health and Safety Manager
John Nakayama will serve as the designated SAIC Health and Safety Manager. He will ensure that all personnel are properly trained, are fully aware of potential site hazards, conduct all work in a safe manner, wear appropriate personal protective clothing (PPE), and abide by the conditions set forth in the site-specific Health and Safety Plan (HASP).
1.4.6 Subcontractor Support
The SAIC project team will also consist of the following subcontractors to support the data collection activities and laboratory analytical services:
1) Data Collection and Biological Testing
NewFields Jack Word P.O. Box 216 4729 NE View Drive Port Gamble, WA 98364 Phone: (360) 297-6060 Fax: (360) 297-7268 mailto:[email protected]
2) Analytical Chemistry
Columbia Analytical Services, Inc. Harvey Jacky 1317 South 13th Ave. Kelso, WA 98626 Phone: (360)577-7222 mailto:[email protected]
3) Sampling Vessel for Sediment Collection Activities
Marine Sampling Systems R/V Nancy Anne Bill Jaworski Phone: (253) 208-1515 Fax: (253) 857-3336 mailto:[email protected]
Fidalgo Bay Sediment Investigation SAP
September 17, 2007 10 FINAL
4) Sampling Vessel for Sediment Profile Imaging and Bottom Trawling
Bio-Marine Enterprise R/V Kittiwake Charles Eaton 2717 3rd Ave. N Seattle, WA 98109 Phone (206) 282-4945 [email protected]
Battelle Marine Sciences Laboratory Linda S. Bingler 1529 West Sequim Bay Rd. Sequim, WA 98382 Phone: (360) 681-3627 Fax: (360) 681-3699 mailto:[email protected]
1.5 Schedule
The tentative schedule for the proposed field activities is for a 3-week period from August 20 through September 7, 2007. The draft data report will be submitted to Ecology on November 30, 2007, and the final data report will be completed by January 11, 2008.
Fidalgo Bay Sediment Investigation SAP
September 17, 2007 11 FINAL
2.0 Study Design
This section describes the study design for each data type to be collected for the Fidalgo Bay Sediment Investigation. Proposed sampling locations for each data type are presented in Figures 2-1, 2-2, 2-3, 2-4, and 2-5. The data collection methods are described in Section 3.0.
2.1 Sediment Profile Imaging
The initial component of the investigation will be to conduct an area-wide survey using a Sediment Profile Imaging (SPI) camera. Information from the SPI survey will be used to refine the sampling locations for the other data types (Sections 2.2 and 2.3). A total of 120 locations will be surveyed using the SPI camera, including 40 locations in Area 2, 50 locations in Area 3, and 30 locations in Area 4 (Figures 2-2 to 2-4). The SPI camera will not be utilized in Area 1 due to the shallow conditions that will prohibit its deployment. A Benthos digital SPI camera will be used to survey the benthic habitat conditions in Fidalgo Bay. SPI photography provides a cross-sectional photograph of the sediment/water interface (in profile) and near-surface sediment.
The SPI survey will be used to assess the condition of the benthic habitat and the physical characteristics of the surface sediment. Parameters assessed using the images include:
• Infaunal successional stage, • Calculation of the organism-sediment index, • Depth of apparent redox potential discontinuity, • Presence and thickness of depositional layers, • Grain size mode and range, and • Evidence of erosional and depositional events to identify high- and low-energy layers.
A preliminary review of the SPI photography will be used to identify specific grab sampling locations of interest for analysis of chemistry and conventional parameters. Surface sediment samples co-located at selected SPI stations will also be used to ground truth observations made from the images.
2.2 Surface Sediment Samples
The major component of this study is to conduct an investigation utilizing the SMS interpretive criteria for chemistry and biological effects to characterize the nature and extent of potential contamination and any related adverse impacts to biota in the bay.
Surface sediment (0 to 10 cm) samples will be collected at a total of 130 sampling locations (Figures 2-1 to 2-4). Approximately sixty of the surface sediment samples (Up to 15 from each area of interest) will be submitted for chemical analysis. The remaining sediment samples will be archived. Additional sediment from the locations sampled for chemistry will be collected for potential toxicity testing, pending the outcome of the chemical analysis. A subset of the samples archived for potential toxicity testing will be submitted for confirmatory biological testing. Sampling locations were placed to provide spatial coverage throughout the study areas. Surface
Fidalgo Bay Sediment Investigation SAP
September 17, 2007 12 FINAL
sediment will be collected from reference locations (areas with similar environmental conditions that are free of any known contaminants) to aid in the interpretation of the toxicity test results. Each of these data types is discussed in further detail below.
2.2.1 Chemistry
The chemical analysis of the surface sediment samples collected in Fidalgo Bay will include the SMS analyte list, sediment conventionals, and dioxin/furan congeners.
The chemical results will be compared to the SMS SQS and CSL numeric criteria. The SMS provides a regulatory basis, management goal, and decision process for the characterization and cleanup of contaminated sediments (Ecology). The SMS chemical numeric criteria and biological effects interpretive criteria provide the means for evaluating the chemistry and toxicity test results. These criteria will be used to determine whether anthropogenic contaminants in sediments are a source of adverse effects to biological resources. In addition to the analytes on the SMS list, dioxin/furan congeners and organotins will also be analyzed in a subset of samples. Sediment chemistry is evaluated to determine whether further evaluation is needed due to elevated concentrations of contaminants.
The concentration of dioxin/furan compounds will be normalized to the toxicity of 2,3,7,8-TCDD using toxic equivalent factors (TEFs) updated by the World Health Organization (WHO) in 2005 (Van den Berg et al. 2006). The toxic equivalent quotient (TEQ) is equivalent to the sum of the concentrations of individual congeners multiplied by their TEF (potency relative to 2,3,7,8-TCDD). Non-detected values will be assessed as half of the method detection limit for data evaluation purposes. The chemical analyte list, analytical methods, target detection limits, and comparative criteria are discussed in Section 4.1.
2.2.2 Toxicity Testing
Toxicity testing involves the exposure of sensitive test organisms to contaminants found in the sediments. Chronic and acute toxicity endpoints are measured to determine the incidence and relative extent of adverse biological effects. Samples from locations with chemistry exceeding the SQS will be submitted for toxicological testing. Toxicity tests to be conducted on Fidalgo Bay sediments include amphipod mortality, juvenile polychaete growth, and larval development bioassays. Testing parameters will utilize full-spectrum ultraviolet (UV) lighting as recommended by Ecology if site conditions include elevated PAHs in shallow water sediments (Ecology 2003). Details on the toxicity testing methodology are provided in Section 4.2.
2.3 Subsurface Sediment Cores
The vertical extent of potential contamination will be evaluated by the collection of subsurface sediment cores. The core collection and evaluation will include a physical description of the stratigraphy, as well as the collection of sediment composites for potential chemical analysis. The cores will be advanced to 4 feet below the surface in Area 1 using a hand corer, and up to 8 feet, or refusal, in Areas 2, 3, and 4 (Figures 2-1 to 2-4). The subsurface sediment cores will be individually composted over 1-foot intervals (i.e., 0 to 1, 1 to 2, … 7 to 8 feet). The subsurface sediment samples will be archived pending the results of the surface chemical analysis and
Fidalgo Bay Sediment Investigation SAP
September 17, 2007 13 FINAL
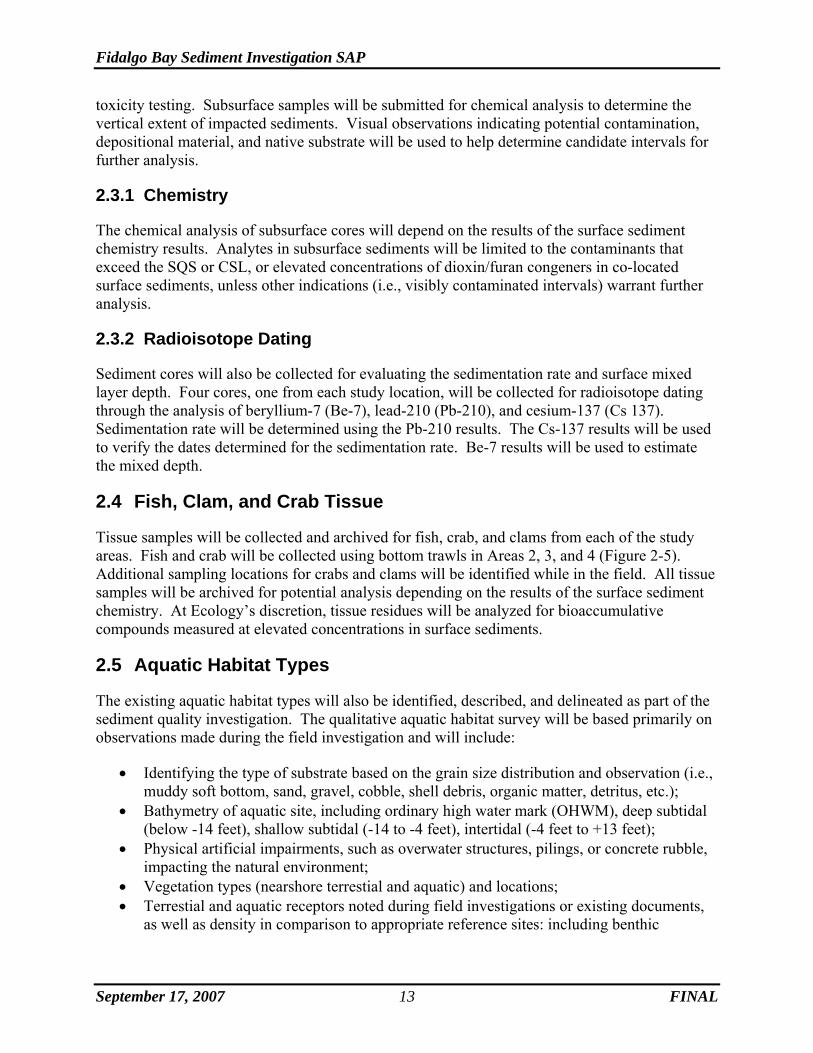
toxicity testing. Subsurface samples will be submitted for chemical analysis to determine the vertical extent of impacted sediments. Visual observations indicating potential contamination, depositional material, and native substrate will be used to help determine candidate intervals for further analysis.
2.3.1 Chemistry
The chemical analysis of subsurface cores will depend on the results of the surface sediment chemistry results. Analytes in subsurface sediments will be limited to the contaminants that exceed the SQS or CSL, or elevated concentrations of dioxin/furan congeners in co-located surface sediments, unless other indications (i.e., visibly contaminated intervals) warrant further analysis.
2.3.2 Radioisotope Dating
Sediment cores will also be collected for evaluating the sedimentation rate and surface mixed layer depth. Four cores, one from each study location, will be collected for radioisotope dating through the analysis of beryllium-7 (Be-7), lead-210 (Pb-210), and cesium-137 (Cs 137). Sedimentation rate will be determined using the Pb-210 results. The Cs-137 results will be used to verify the dates determined for the sedimentation rate. Be-7 results will be used to estimate the mixed depth.
2.4 Fish, Clam, and Crab Tissue
Tissue samples will be collected and archived for fish, crab, and clams from each of the study areas. Fish and crab will be collected using bottom trawls in Areas 2, 3, and 4 (Figure 2-5). Additional sampling locations for crabs and clams will be identified while in the field. All tissue samples will be archived for potential analysis depending on the results of the surface sediment chemistry. At Ecology’s discretion, tissue residues will be analyzed for bioaccumulative compounds measured at elevated concentrations in surface sediments.
2.5 Aquatic Habitat Types
The existing aquatic habitat types will also be identified, described, and delineated as part of the sediment quality investigation. The qualitative aquatic habitat survey will be based primarily on observations made during the field investigation and will include:
• Identifying the type of substrate based on the grain size distribution and observation (i.e., muddy soft bottom, sand, gravel, cobble, shell debris, organic matter, detritus, etc.);
• Bathymetry of aquatic site, including ordinary high water mark (OHWM), deep subtidal (below -14 feet), shallow subtidal (-14 to -4 feet), intertidal (-4 feet to +13 feet);
• Physical artificial impairments, such as overwater structures, pilings, or concrete rubble, impacting the natural environment;
• Vegetation types (nearshore terrestial and aquatic) and locations; • Terrestial and aquatic receptors noted during field investigations or existing documents,
as well as density in comparison to appropriate reference sites: including benthic
Fidalgo Bay Sediment Investigation SAP
September 17, 2007 14 FINAL
community types, seagrasses, types of fish, rookeries, sensitive species, or critical habitat, etc.;
• Types, concentrations, and areal extent of contamination; and • Presence and depth of fill material.
Fidalgo Bay Sediment Investigation SAP
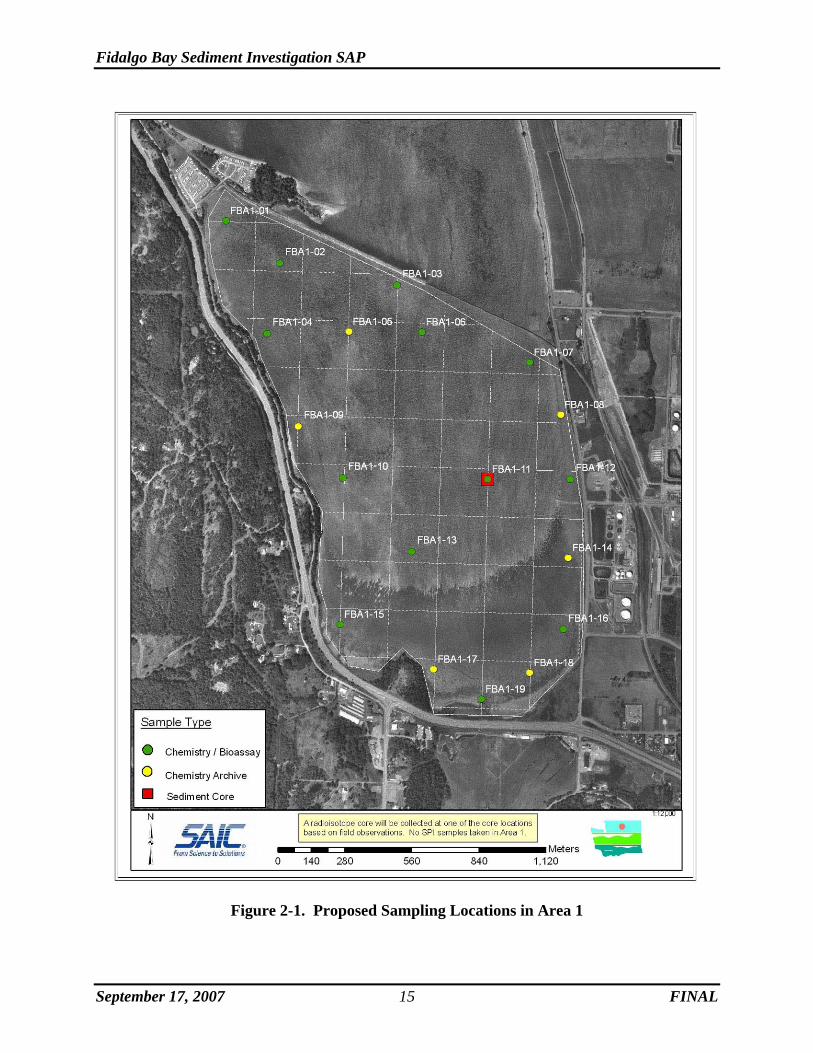
September 17, 2007 15 FINAL
Figure 2-1. Proposed Sampling Locations in Area 1
Fidalgo Bay Sediment Investigation SAP
September 17, 2007 16 FINAL
Figure 2-2. Proposed Sampling Locations in Area 2
Fidalgo Bay Sediment Investigation SAP
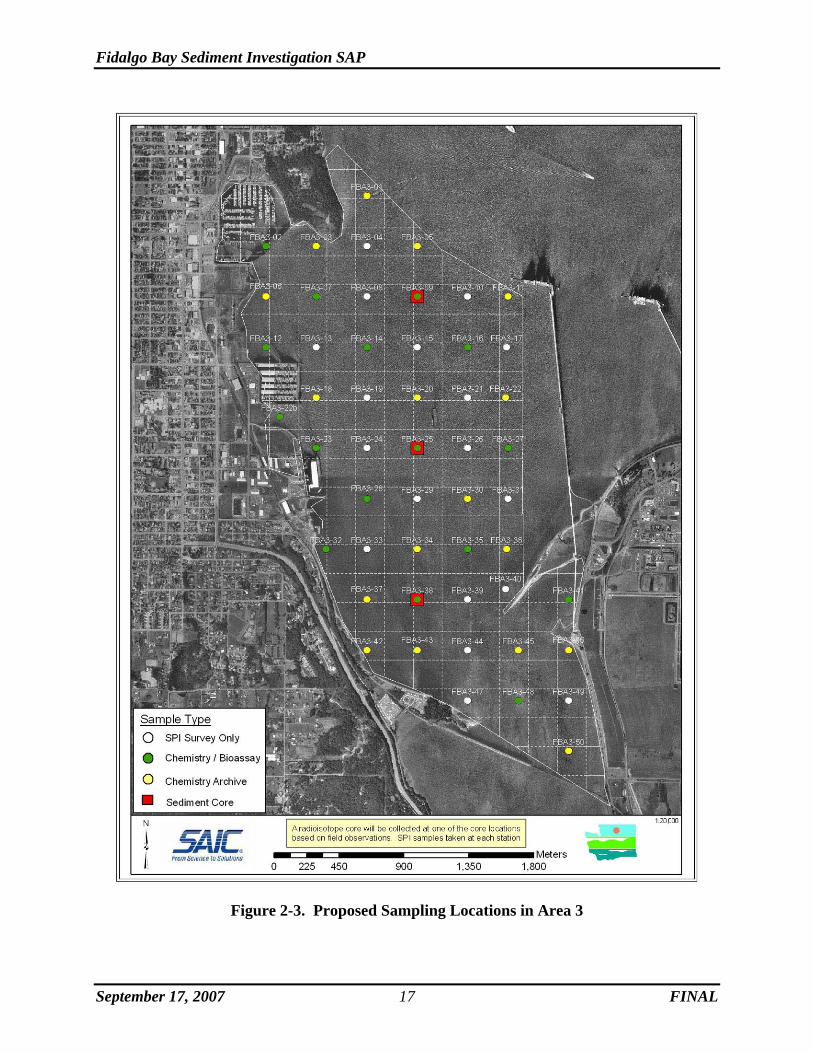
September 17, 2007 17 FINAL
Figure 2-3. Proposed Sampling Locations in Area 3
Fidalgo Bay Sediment Investigation SAP
August 27, 2007 18 FINAL
Figure 2-4. Proposed Sampling Locations in Area 4
Fidalgo Bay Sediment Investigation SAP
September 17, 2007 19 FINAL
Figure 2-5. Proposed Bottom Trawling Locations
Fidalgo Bay Sediment Investigation SAP
September 17, 2007 20 FINAL
Figure 2-6. Fidalgo Bay Candidate Reference Sediment Sites
Fidalgo Bay Sediment Investigation SAP
September 17, 2007 21 FINAL
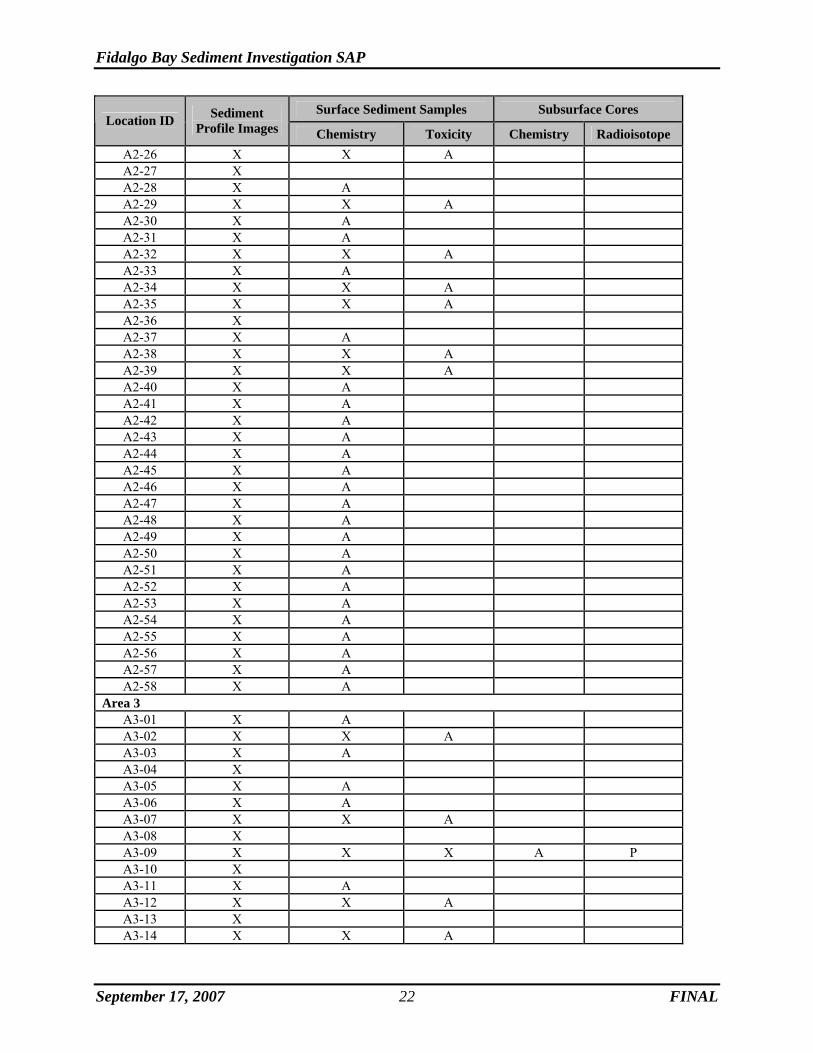
Table 2-1. Data Type to be Collected at each Target Location1
Surface Sediment Samples Subsurface Cores Location ID Sediment
Profile Images Chemistry Toxicity Chemistry Radioisotope Area 1
A1-01 X A A1-02 X A A1-03 X A A1-04 X A A1-05 A A1-06 X A A1-07 X A A1-08 A A1-09 A A1-10 X A A1-11 X X A P A1-12 X A A1-13 X A A1-14 A A1-15 X A A1-16 X A A1-17 A A1-18 A A1-19 X A
Area 2 A2-01 X X A A2-02 X A2-03 X X X A P A2-04 X A A2-05 X X A A2-06 X X A A2-07 X A2-08 X A A2-09 X A A2-10 X A2-11 X A A2-12 X X X A P A2-13 X A A2-14 X X X A P A2-15 X A A2-16 X A2-17 X X A A2-18 X A A2-19 X A2-20 X A A2-21 X A A2-22 X A2-23 X X A A2-24 X A2-25 X
Fidalgo Bay Sediment Investigation SAP
September 17, 2007 22 FINAL
Surface Sediment Samples Subsurface Cores Location ID Sediment
Profile Images Chemistry Toxicity Chemistry Radioisotope A2-26 X X A A2-27 X A2-28 X A A2-29 X X A A2-30 X A A2-31 X A A2-32 X X A A2-33 X A A2-34 X X A A2-35 X X A A2-36 X A2-37 X A A2-38 X X A A2-39 X X A A2-40 X A A2-41 X A A2-42 X A A2-43 X A A2-44 X A A2-45 X A A2-46 X A A2-47 X A A2-48 X A A2-49 X A A2-50 X A A2-51 X A A2-52 X A A2-53 X A A2-54 X A A2-55 X A A2-56 X A A2-57 X A A2-58 X A
Area 3 A3-01 X A A3-02 X X A A3-03 X A A3-04 X A3-05 X A A3-06 X A A3-07 X X A A3-08 X A3-09 X X X A P A3-10 X A3-11 X A A3-12 X X A A3-13 X A3-14 X X A
Fidalgo Bay Sediment Investigation SAP
September 17, 2007 23 FINAL
Surface Sediment Samples Subsurface Cores Location ID Sediment
Profile Images Chemistry Toxicity Chemistry Radioisotope A3-15 X A3-16 X X A A3-17 X A3-18 X A A3-19 X A3-20 X A A3-21 X A3-22 X A
A3-22b X X A A3-23 X X A A3-24 X A3-25 X X X A P A3-26 X A3-27 X X A A3-28 X X A A3-29 X A3-30 X A A3-31 X A3-32 X X A A3-33 X A3-34 X A A3-35 X X A A3-36 X A A3-37 X A A3-38 X X X A P A3-39 X A3-40 X A3-41 X X A A3-42 X A A3-43 X A A3-44 X A3-45 X A A3-46 X A A3-47 X A3-48 X X A A3-49 X A3-50 X A
Area 4 A4-01 X A A4-02 X X A A4-03 X A A4-04 X X A A4-05 X X X A P A4-06 X A A4-07 X X A A4-08 X A A4-09 X X A A4-10 X X X A P
Fidalgo Bay Sediment Investigation SAP
September 17, 2007 24 FINAL
Surface Sediment Samples Subsurface Cores Location ID Sediment
Profile Images Chemistry Toxicity Chemistry Radioisotope A4-11 X A A4-12 X X A A4-13 X X A A4-14 X A A4-15 X X A A4-16 X A A4-17 X X A A4-18 X A A4-19 X X A A4-20 X X X A P A4-21 X X A A4-22 X A A4-23 X A A4-24 X A A4-25 X A A4-26 X X A A4-27 X A A4-28 X A A4-29 X X A A4-30 X A
Candidate Reference Sites2 RF-01 A A A RF-02 A A A RF-03 A A A
Notes
1: Fish, clam, and crab tissue samples will be collected from each area, if available. 2: Actual reference locations will be determined in the field based on the physical characteristics of the site and the
wet-sieving results. Reference locations will be used for comparison of toxicity test results and habitat types (i.e., native vegetation and organisms) for evaluating potential restoration actions.
A: Sample to be collected and archived P: Potential sample location for data type X: Sample to be collected and analyzed
Fidalgo Bay Sediment Investigation SAP
September 17, 2007 25 FINAL
3.0 Sampling and Handling Methods
This section describes the methodology for positioning, sample collection, processing, identification, documentation, equipment decontamination, and waste handling for the proposed field investigation. Samples will be collected for sediment profile images, sediment chemistry, toxicity, tissue residues, and radioisotope dating. The laboratory methods for chemical analysis, toxicity testing, and radioisotope analysis are presented in Section 4.0.
3.1 Sampling Platforms
Several sampling vessels will be used as needed to meet the multiple data collection objectives. The R/V Kittiwake, owned and operated by Mr. Charles Eaton of Bio-Marine Enterprises, will be used for the SPI survey and bottom trawling. The R/V Nancy Anne, owned and operated by Mr. Bill Jaworski of Marine Sampling Systems, will be used for the surface and subsurface sediment collection in Areas 2, 3, and 4. The R/V Growler and R/V Schooner, owned and operated by SAIC, will be used to sample shallow water locations including Area 1, as well as assist in the collection of crab and clam tissue.
3.2 Station Positioning and Navigation
The positioning and recording of sampling locations will be accomplished using differential Global Positioning System (DGPS). The DGPS employs a receiver that tracks and times signals emitted by satellites orbiting the earth, a Coast Guard reference beacon located in the vicinity of the survey area, and a differential receiver. The receiver deployed at the Coast Guard reference beacon (horizontal control point) is used to correct for Selective Availability (SA) (satellites emit an encrypted signal designed to degrade the accuracy for non-military users by dithering the time code embedded in the signal). This receiver calculates position based on the satellite signals and compares the calculated position to the known position at the horizontal control point. A positional offset of correction factor is calculated and transmitted to the GPS receiver, which applies the correction factor to calculate the corrected position. All station coordinates will be recorded by latitude and longitude to the decimal minute and State Plane Coordinates (NAD 83).
Vertical position (i.e., water depth) will be determined using a fathometer (when feasible) or a lead-line (weighted measuring tape) or measuring stick to measure to the nearest 0.1 foot from the water surface to the mudline.
The target sample coordinates are provided in Table 3-1, sampling locations are displayed in Figures 2-1, 2-2, 2-3, and 2-4, and candidate reference locations are displayed in Figure 2-6.
Fidalgo Bay Sediment Investigation SAP
September 17, 2007 26 FINAL
Table 3-1. Target Sample Locations
State Plane (NAD 83) Location ID Latitude (N) Longitude (W) Northing Easting
Note 1: Actual reference locations will be determined in the field based on the physical characteristics of the site and the
wet-sieving results. Reference locations will be used for comparison of toxicity test results to SMS interpretive criteria.
Fidalgo Bay Sediment Investigation SAP
September 17, 2007 30 FINAL
3.3 SPI Survey Data Collection
SPI photography provides a cross-sectional photograph of surface and sediment near the surface. An area 20 cm high by 14 cm wide is captured in this “profile” and recorded as a digital image. Images are collected using a Benthos model 3731 sediment profile digital camera. The sediment profile camera consists of a wedge-shaped prism with a Plexiglas faceplate and a back mirror mounted at a 45° angle. Light is provided by an internal strobe. The mirror reflects the image of the profile of the sediment/water interface to a digital camera mounted horizontally on top of the prism. Three replicate images will be collected from each SPI sampling location.
3.4 Sediment Sample Collection
Surface sediment samples will be collected at a total of 123 sampling locations, including references. Surface sediment samples will be collected for chemical analysis, toxicity testing, and benthic community characterization. Table 3-2 lists the various surface sediment samples to be collected; the analytical and biological testing methods; and sample container, volume, and preservation requirements. The following sections describe the collection and processing of surface sediment samples.
3.4.1 Surface Sediment Samples
Surface sediment collected for chemical and toxicological analysis will be collected from a small boat using a stainless-steel Ekman, ponar, or similar grab sampling device in Area 1, and using a hydraulic grab sampler in Areas 2, 3, and 4. If accessible during low tide events, surface sediment samples from intertidal areas may be collected directly with stainless-steel spoons. The grab sampler will be deployed from the sampling platform using a manually triggered handle (for the Ekman in shallow water less than 3 feet deep) or using a davit/a-frame, winch, and cable (grab samplers in water greater than 3 feet deep). Multiple grab samples will be collected and composited for each sampling location to provide sufficient volume for chemical analysis and potential toxicity testing. An additional five replicates will be collected from sediment quality triad stations for benthic community analysis. The general procedure for collecting sediment using a grab sampler is as follows:
1) Make logbook and field form entries as necessary throughout the sampling process to ensure accurate and thorough record-keeping. Field documentation is described in Section 3.7.
2) Position the sampling vessel at the targeted sampling location. 3) Set the sampler jaws in the open position, place the sampler over the edge of the boat,
and lower the sampler to the bottom. 4) Trip the sampler manually if using the Ekman sampler with a handle (< 3 feet deep). 5) Record the location using the DGPS; measure and record the water depth. 6) Retrieve the sampler and place it securely in the sampling vessel. 7) Examine the sample for the following sample acceptance criteria:
Fidalgo Bay Sediment Investigation SAP
September 17, 2007 31 FINAL
• The sampler is not overfilled with sample so that the sediment surface is pressing against the top of the sampler.
• The sample does not contain large foreign objects (i.e., trash or debris). A sample that is rock/gravel fill will be rejected in favor of depositional material (i.e., sand/silt/clay).
• Overlying water is present indicating minimal leakage. • Overlying water is not excessively turbid indicating minimal sample disturbance. • Sediment surface is relatively flat and/or intact without any indications of
disturbance or winnowing. • A penetration depth has been achieved that allows the collection of the upper 10
cm of sediment.
If sample acceptance criteria are not achieved, the sample will be rejected and another sample collection attempt will be made.
8) Siphon off any overlying surface water. 9) Collect samples for total sulfides analysis directly from the grab sampler and place the
sediment aliquots in appropriate, pre-cleaned, labeled sample containers (Table 3-2). 10) Measure and collect the top 10 cm with a stainless steel spoon, avoiding any sediment
that is in contact with the inside surface of the grab sampler, then place the sediment into a stainless steel bowl and cover with aluminum foil.
11) Record the following observations of sediment sample characteristics on the field form (Appendix B); if more sample volume is required, repeat steps 4 through 11.
• Texture • Color • Biological organisms or structures (i.e., shells) • Presence of debris (i.e., natural or anthropogenic objects) • Presence of oily sheen or obvious contamination • Odor (e.g., hydrogen sulfide, petroleum)
12) Wash excess sediment back into the water away from any areas remaining to be sampled. 13) Once sufficient sediment volume has been collected, samples should be placed in the
appropriate, pre-cleaned, labeled sample containers as described in Section 3.3, placed in a cooler maintained at 4ºC, and prepared for shipment to the analytical or biological laboratory as described in Section 3.4.
14) Confirm all relevant documentation has been completed, entries are accurate, and paperwork has been signed.
15) Decontaminate all sampling equipment as described in Section 3.6 before proceeding to the next sampling location.
A single replicate for each required analysis will be collected from each target sampling location, with the exception of field duplicate and matrix spike/matrix spike duplicate (MS/MSD) samples to be collected randomly at the field supervisor’s discretion. Aliquots of homogenized sediment will also be collected for toxicity testing at designated locations. The sample types collected from each location are presented in Table 3-2.
Fidalgo Bay Sediment Investigation SAP
September 17, 2007 32 FINAL
A 4 oz sample will also be retained from the homogenate of each location in a given area of interest. Once surface sediment sampling is completed in a given area, the individual aliquots will be combined and homogenized to produce an area-wide composite representative of all locations sampled. Samples from the area-wide composite will be submitted for analysis of selected conventionals (TOC and grain size), SMS analytes, and dioxin/furan congeners.
3.4.2 Wet-sieving
For locations designated for potential toxicity testing, an aliquot of sediment will be wet-sieved in the field. The purpose for wet-sieving an aliquot of homogenized sample is to separate the coarse and fine-grained material comprising a sediment sample in order to match appropriate test and reference locations for toxicological testing. The method utilizes a 63-micron sieve to separate the silt and clay (fines) from the sand and gravel portion of the sediment sample. The grain size distribution of a given sediment sample is an important physical parameter when conducting bioassays in order to determine an appropriate reference sample (Section 4.2.3) for comparison with test sediments. The wet-sieving of surface sediment samples is conducted in the field at the time of collection, so that a reference sample(s) with similar grain size distribution (as percent fines) can be targeted for the bioassays. The procedure for wet-sieving is as follows:
1) Measure and record the exact volume of a small (100 ml) flat-topped beaker. (Note: the 100 ml gradation is generally located slightly below the rim of the beaker; hence, the actual beaker volume is greater than 100 ml).
2) Completely fill the beaker to the rim with an aliquot of homogenized sediment. Lightly tap the beaker on a hard surface to remove any air bubbles, and level the surface.
3) Rinse the entire contents of the beaker through a 63-micron (#230, 4 phi) sieve. Aggregates of material should be gently broken to facilitate sieving. Continue sieving until clear rinsewater passes through the sieve.
4) Carefully transfer the coarse-grained material from the sieve into a 250 ml graduated cylinder.
5) Divide the amount of material measured in the bottom of the graduated cylinder by the capacity of the beaker to determine the decimal percentage of coarse-grained material. Subtract the decimal percentage of coarse-grained material from 1 to determine the decimal percentage of fines (silt and clay).
6) Record the percentages of coarse and fine-grained material in the logbook containing the surface sediment field collection forms (Appendix B).
3.4.3 Subsurface Sediment Collection
Subsurface sediment samples will be collected at a total of 12 locations, co-located with the benthic triad sampling stations. Core samples will be collected using a 48-inch Wildco hand-corer in Area 1, and a 10-foot vibracorer in Areas 2, 3, and 4. The cores will be advanced to a depth of 4 feet or refusal, for the hand corer, and 8 feet or refusal for the vibracorer. Each core will be sampled at 1-foot intervals: 0 to 1, 1 to 2,… 3 to 4 for hand-corer (7 to 8 feet for vibracorer), depending upon limitations of the equipment to reach targeted depth horizons.
Fidalgo Bay Sediment Investigation SAP
September 17, 2007 33 FINAL
The general procedure for collecting sediment cores is as follows:
1) Make logbook and field form entries as necessary throughout the sampling process to ensure accurate and thorough record-keeping. Field documentation is described in Section 3.8.
2) Position the sampling vessel at the targeted sampling location.
3) Record the location using the DGPS; measure and record the water depth.
4) Insert pre-cleaned Lexan or aluminum core tubes equipped with a “eggshell” core catcher to retain material in the core barrel for deployment.
5) The core-sampler is positioned vertically on the bottom and advanced to a sampling depth of approximately 4 feet for the hand corer, 8 feet for the vibracorer to include all targeted sampling intervals or until refusal.
6) Once sampling is complete, the sampler is extracted and the core liner is removed from the core barrel, or core tube is detached from the vibracorer. The core sample will be examined at each end to verify that sufficient sediment was retained. The condition and quantity of material within the core will then be inspected to determine acceptability. If sample acceptance criteria are not achieved, the sample will be rejected and another sample collection attempt will be made.
• To verify whether an acceptable core sample has been collected, the following criteria must be met:
a) Target penetration depth (i.e., 4 feet or 8 feet) or refusal was achieved;
b) Sediment recovery of at least 65% of the penetration depth is targeted to deem the core acceptable;
c) Sample appears undisturbed and intact without any evidence of obstruction or blocking within the core tube or core catcher.
• The percent sediment recovery will be determined by dividing the length of material recovered in the core tube by the depth of core penetration below mudline. If the sample is deemed acceptable, overlying water will be siphoned from the top of the core tube, and each end of the tube will be capped and sealed with duct tape for storage until processing. The cores will be stored on ice until they are processed. The station number, station coordinates, date and time of collection, sediment description, field crew, and weather conditions will be recorded in the sediment coring log (Appendix B).
7) Record observations of sediment sample characteristics on the field form (Appendix B); if more sample volume is required, repeat steps 4 through 11.
8) Sediment cores will be labeled, capped, and stored in an upright vertical position in a container packed with ice until processed. Cores will be processed on the same day they are collected.
9) Confirm all relevant documentation has been completed, entries are accurate, and paperwork has been signed.
Fidalgo Bay Sediment Investigation SAP
September 17, 2007 34 FINAL
10) Wash excess sediment back into the water away from any areas remaining to be sampled.
11) Decontaminate all sampling equipment as described in Section 3.9 before proceeding to the next sampling location.
A single acceptable sample for each subsurface interval will be collected and archived pending the results of the surface sediment chemistry and toxicity testing results. SAIC will process all sediment cores on site at a designated processing location (extrusion, documentation, and sample collection for analysis). Disposable nitrile gloves will be worn for all handwork such as sectioning and extruding the core, sub-sampling, mixing samples, and filling sample containers. The gloves will be disposed of between sample composites in order to prevent cross contamination between samples. Sampling implements and processing equipment will be decontaminated prior to processing the sediment cores. Sediment cores will be processed in the same order as collected to minimize holding time. Each section comprising a core sample will be extruded onto a stainless steel tray using a core sample removal tool (a plunger style device that pushes the sample through the core tube). Care will be taken to preserve the integrity of the core section stratums by extruding in order from top (e.g., mudline) to bottom (native material). Once the sediment has been extruded, a visual characterization of the sample material will be immediately conducted. The core will then be visually described in the core log including the following information and characteristics:
• Station number
• Date and time of collection
• Station coordinates
• Weather conditions
• Names of persons collecting and logging the sample
• Penetration depth
• Percent sediment recovery
• Physical soil description in accordance with the Unified Soil Classification System (USCS)
• Color
• Odor (e.g., hydrogen sulfide, petroleum)
• Visual stratifications and lenses
• Vegetation and/or woody debris
• Biological Activity (e.g., detritus, shells, tubes, bioturbation, live or dead organisms)
• Presence of oil sheen or obvious contamination
• Any other distinguishing characteristics or features
Fidalgo Bay Sediment Investigation SAP
September 17, 2007 35 FINAL
Representative aliquots of sediment will be collected from the 1-foot intervals using decontaminated stainless steel spoons, to generate the composite sample that will be used to evaluate the project’s technical objectives. Up to eight samples (four in Area 1) will be collected from each core representing a 1-foot vertical horizon (i.e., 0 to 1, 1 to 2,…7 to 8 feet). Sediment will be collected from the center of the core that has not been smeared by, or in contact with, the core tube. The volumes removed will be placed in a decontaminated stainless steel bowl or pan, and mixed until homogenous in texture and color. After all sediment for a composite sample is collected and homogenized, representative aliquots will be placed in the appropriate, pre-cleaned, labeled sample containers and prepared for shipment to the analytical laboratory for archiving.
3.4.4 Radioisotope Cores
Four subsurface cores will be submitted for sedimentation rate and surface mixed layer depth. Each core will be approximately 4 to 8 feet in length, and SAIC will subsample each core based on the following directions provided by Battelle:
• Section the core in 2 cm increments to 50 cm, 5 cm increments to 120 cm, and 10 cm increments for the remainder of the core.
• A full 125 ml container of wet sediment will be collected for each sample section, which should provide 100 grams of dry sediment.
3.5 Tissue Samples
Fish, crab, and clam tissue samples will be collected and archived from each of the areas of interest. Analysis of the samples will depend on the outcome of the surface sediment chemistry. The methods for collecting and processing the samples are discussed below.
3.5.1 Trawl Sampling
A 7.6-meter otter trawl will be used to collect Dungeness crab (Cancer magister) and English sole (Parophrys vetulus) in Areas 2, 3, and 4 of Fidalgo Bay. English sole will be the targeted species; however, if they are not present in abundance, alternate species may include starry flounder (Platichthys stellatus) or flathead sole (Hippoglossoides elassodon). Likewise, if Dungeness crab are not in abundance, red rock crab (Cancer productus) may be used as a surrogate species.
The otter trawl will be towed approximately 370 meters (1/5 nautical mile) at a ground speed of 4.2 to 5.0 kilometers/hour (2.3 to 2.7 knots), which covers an area swept by the net (opening = 6 meters) of approximately 2,220 square meters. Trawl sampling will be conducted in three areas in Fidalgo Bay, but with no particular attention to hitting specific stations (e.g., onsite, transect, perimeter). Approximately three trawls per area will be performed.
Triplicate English sole and Dungeness crab samples will be collected for each area of interest. English sole with a minimum length of 20 cm will be targeted for collection. Each English sole sample will consist of five fish. The whole bodies of each fish will be homogenized separately.
Fidalgo Bay Sediment Investigation SAP
September 17, 2007 36 FINAL
Equal volumes from each fish homogenate will be combined to make a final composite sample for analysis. The laboratory will archive the remaining tissue from each fish as separate samples.
Male Dungeness crabs with a minimum length of 9 cm will be targeted for collection. If males are not in abundance, females will be taken. Each Dungeness crab sample will consist of five crabs. The crabs in each sample will be dissected for crab meat and hepatopancreas tissue samples.
All fish will be immediately collected from the bag upon net retrieval and transferred to a holding tank where they will be identified and enumerated. Non-target species will be promptly and carefully released to the water.
Fish processing shall include identification, measurements for length and weight, and a check for obvious external abnormalities or parasites. All fish will be euthanized humanely following collection.
3.5.2 Shellfish Collection
Small shovels and trowels will be used to collect littleneck clams (Protothaca staminea) and Manila clams (Ruditapes philippinarum) at low tide from publicly accessible beaches in the vicinity of Fidalgo Bay. Clams collected during surface sediment sampling will also be retained for inclusion in the composite samples collected from the respective Area of Interest.
Crab pots may also be utilized to supplement the collection of crabs if insufficient numbers are obtained via bottom trawling.
3.5.3 Tissue Samples
Organisms collected for tissue residue analysis (English sole, littleneck and/or Manila clams, Dungeness crab) will be rinsed with site water following collection. Fish will be individually wrapped with heavy duty aluminum foil and placed in pre-labeled polyethylene bags. Crabs will be placed directly in pre-labeled polyethylene bags. All organisms collected for a composite sample will be included in the same polyethylene bag. All clams for a composite sample will be placed directly into pre-cleaned sample jars (one per species). Sample preparations (i.e., whole fish compositing, and clam shucking) will be conducted by the analytical laboratory. Tissue samples will be immediately placed on ice in coolers in the field. If not submitted immediately (within 24 hours) to the analytical laboratory, the tissue samples will be frozen at -18°C.
Bivalve, Dungeness crab, and English sole tissue samples will be immediately placed on ice in coolers in the field and archived at -18°C at the SAIC warehouse until a decision is made for analysis.
English sole samples will include five organisms per composite. The composite sample identification number and the total length of each fish included in a composite sample will be recorded on data sheets included as part of the biological sampling log. The whole body (skin on) from each individual fish will be homogenized separately, and equal volumes from each fish homogenate will be combined to create a final composite sample for analysis. The laboratory will archive the remaining tissue from each fish as separate samples.
Fidalgo Bay Sediment Investigation SAP
September 17, 2007 37 FINAL
Dungeness crab samples will include five organisms per composite. The carapace width and sex of each crab retained for analysis will be recorded on data sheets in the biological sampling log. Upon receipt by the analytical laboratory, the crabs will be dissected to collect edible meat and hepatopancreas tissue samples. The edible meat and hepatopancreas samples will be homogenized separately and archived for potential future analysis.
Triplicate tissue samples of littleneck and/or Manila clams will be collected at three beach locations in Fidalgo Bay. However, a minimum of five clams will be collected per composite. The shell length and weight for each clam retained for analysis will be recorded in the biological sampling log. Upon receipt by the analytical laboratory, the clams will be shucked to collect the edible tissues. The tissue from each sample will be homogenized and analyzed.
3.6 Sample Identification, Containers, and Labels
Samples will be identified based on the project, sampling area, location, and sample type. All samples collected during the investigation will be labeled clearly and legibly. Each sample will be labeled with a unique alphanumeric sample identification number that identifies characteristics of the sample as follows:
Project Sampling Area Location Number Sample Type
FB- A1- 01- S
Where:
Project consists of two characters describing the project (FB = Fidalgo Bay).
Sampling Area consists of two characters describing the sampling area (A1 = Area 1; A2 = Area2; A3 = Area 3; and A4 = Area 4).
Location Number consists of two characters identifying the station location number (Figures 2-1, 2-2, 2-3, and 2-4). Tissue samples will be identified by species (ES = English sole; SF = starry flounder; DC = Dungeness crab; RC = red rock crab; LC = littleneck clam; MC = Manila clam.
Sample Type consists of one to two characters indicating the sample type. Sample type is indicated for QA/QC samples, toxicity testing, or benthic community analysis with R=rinseate, D=duplicate, T = triplicate, RB= rinseate blank, TX=toxicity, and S0-1, S1-2, S2-3, ….etc., for the subsurface sediment intervals 0 to 1, 1 to 2, 2 to 3 feet, …etc., respectively.
Sample aliquots submitted to the analytical and biological laboratories will be placed in pre-cleaned sample containers and preserved as identified in Table 3-2. The procedure for sample storage and shipping is provided in Section 3.7.
Sample labels will be self-adhering, waterproof material. An indelible pen will be used to fill out each label. Each sample label will contain the project name (Fidalgo Bay Sediment Characterization), sample identification, date and time of collection, analyses, preservative (as applicable), and the initials of the person preparing the sample. In addition, a unique, sequentially numbered jar tag will be placed on each sample container for tracking purposes. Jar
Fidalgo Bay Sediment Investigation SAP
September 17, 2007 38 FINAL
tag numbers will be recorded in a Sample Container Logbook (Appendix B). Sample labels and jar tags will be protected by packaging tape wrapped around the entire jar to prevent loss or damage of the labels during handling and storage.
3.7 Sample Storage and Delivery
All samples will be stored in insulated coolers and preserved by cooling to a temperature of 4ºC and as required by analytical method. Maximum sample holding and extraction times will be strictly adhered to by field personnel and the analytical and testing laboratories.
Preparation of bottles for shipment will be performed in the following manner:
1) Wipe or decontaminate the outside of filled, capped sample bottles to ensure there is no sample residual on the outside of the container. Secure sample lid jars with electrical tape to prevent leakage.
2) Label jars with prepared labels. 3) Each set of samples will have a unique sample ID and jar tag number. 4) Secure labels with clear packaging tape. 5) Record the samples in Sample Container Logbook (see Appendix B) and the chain-of-
custody forms (Section 3.8.2). 6) Place sample containers in plastic zip-loc bubble-pack bags, or wrap in bubble pack and
secure with packaging tape. 7) Prepare an empty insulated cooler by placing three to four ice packs in a garbage bag at
the bottom of the cooler. Place sample containers in a garbage bag and fill with the sample bottles. Add additional bags of ice as needed to surround the bag containing the samples.
8) Seal the cooler with strapping tape and a custody seal. Samples for chemical analyses will be shipped via overnight courier to the analytical laboratory once per day or whenever a cooler is filled, and accompanied by the chain-of-custody record, which identifies the shipment contents. The chain-of-custody will be signed by the individual relinquishing samples to the onsite laboratory representative. The field personnel will be responsible for the following:
• Packaging the samples; • Signing the chain-of-custody before placing inside the cooler to be sealed; • Ensuring sufficient ice or re-usable ice packs to maintain samples at 4º, during
storage and shipping; • Applying a shipping label, an air bill, a custody seal, and strapping tape to the
cooler; and • Shipping the samples in accordance with the maximum holding time allowed for
the analyses to be performed.
Samples for toxicological testing and benthic analysis will be shipped to the appropriate biological laboratory at the completion of the sample collection effort for archiving. They will be properly labeled, packaged, and preserved with ice in a cooler as described above and temporarily stored under contractor custody. A separate chain-of-custody form will be filled out
Fidalgo Bay Sediment Investigation SAP
September 17, 2007 39 FINAL
for the chemistry, toxicological, and benthic community samples. The chain-of-custody will be signed by the individuals relinquishing the samples and will be placed inside the cooler before it is sealed.
All sediment samples will be retained for a minimum of 6 months from the time they were received using standard laboratory handling procedures. They may be removed from the laboratory prior to the end of the 6-month period only at the direction of the contractor project manager in consultation with Ecology.
3.8 Field Documentation
A complete record of field activities will be maintained. Documentation necessary to meet QA objectives for this project include: field notes and field forms (Appendix B), sample container labels, and chain-of-custody forms. The field documentation will provide descriptions of all sampling activities, sampling personnel, and weather conditions, and will record all modifications, decisions, and/or corrective actions to the study design and procedures identified in this workplan.
3.8.1 Field Notebooks
All handwritten documentation must be legible and completed in permanent waterproof ink. Corrections must be marked with a single line, dated, and initialed. All documentation, including voided entries, must be maintained within project files.
Field logbook(s) will be kept on site during field operations by the field manager. Daily activities will be recorded in a bound field logbook of water-resistant paper. Separate logbooks consisting of bound, paginated field forms will be kept for surface sediment grab descriptions, and an inventory of sample containers (separate from chain-of-custody documentation). Examples of the various field forms to be used are presented in Appendix B. All entries will be made legibly, in indelible ink, and will be signed and dated. Information recorded will include the following:
• Date, time, place, and location of sampling;
• Onsite personnel and visitors;
• Daily safety discussion and any safety issues;
• Quality control samples (i.e., duplicate samples, field blanks, etc.);
• Calibration of field equipment (including make and model of equipment);
• Field measurements and their units;
• Observations about site, location, and samples (weather, current, odors, appearance, etc.); and
• Equipment decontamination verification.
Field logbooks are intended to provide sufficient data and observations to enable participants to reconstruct events that occur during project field activities. Entries should be factual, detailed, and objective. Unless restricted by weather conditions, all original data recorded in field
Fidalgo Bay Sediment Investigation SAP
September 17, 2007 40 FINAL
logbooks and on sample identification tags, chain-of-custody records, and field forms will be written in waterproof ink. If an error is made, the individual responsible may make corrections simply by crossing out the error and entering the correct information. The erroneous information should not be obliterated. All corrections must be initialed and dated.
3.8.2 Chain-of-Custody Procedures
Samples will be retained at all times in the field crew’s custody until samples are delivered to the appropriate laboratory by contractor personnel. All samples will be held and transported in coolers with ice or frozen gel-packs at approximately 4ºC.
Chain-of-custody forms will be initiated at the time of sample collection to ensure that all collected samples are properly documented and traceable through storage, transport, and analysis. When all line items on the form are completed or when the samples are relinquished, the sample collection custodian will sign and date the form, list the time, and confirm the completeness of all descriptive information contained on the form. Each individual who subsequently assumes responsibility for the sample will sign the chain-of-custody form and provide the reason for assuming custody. The field chain-of-custody terminates when the laboratory receives the samples. The field manager should retain a copy of the completed, signed, chain-of-custody form(s) for project files.
3.9 Equipment Decontamination Procedures
Sample processing equipment (i.e., spoons, bowls, and reusable containers from which samples are transferred to sample jars) will be washed with a laboratory-grade detergent (e.g., Alconox) and water solution, rinsed with deionized water, and a final distilled water rinse prior to field operations. Decontaminated equipment will be wrapped or covered with aluminum foil. Sub-sampling and processing equipment will be decontaminated before use at each station in order to prevent cross contamination of samples. Any deviations from these procedures will be documented in the field notebook.
Personal non-disposable field equipment (i.e., boots and waterproof gloves and garments) will be rinsed with water and brushed clean prior to leaving the immediate vicinity of the sample collection area. Special attention will be given to removing mud and sediments that may adhere to boot treads.
3.10 Waste Disposal
During the field investigation, field personnel will be responsible for securing appropriate waste containers, and placing wastes in labeled storage containers, performing appropriate testing, preparing wastes for disposal, and proper disposition of wastes.
Two types of waste will be generated during the activities described in this workplan:
• Excess sediment sample core not submitted to the laboratories; and
• Disposable protective clothing, sampling equipment, and packaging.
Fidalgo Bay Sediment Investigation SAP
September 17, 2007 41 FINAL
3.10.1 Sediment Sample/Sediment Core
Small quantities of excess sediment and rinseate water generated during sample processing will be returned to the site. Care will be taken to not dispose of sediment and/or rinseate at locations targeted for subsequent sampling.
3.10.2 Disposable Protective Clothing and Sampling Equipment
Used PPE, such as protective Tyvek suits or gloves, and sampling equipment, such as aluminum foil and paper towels, and any packaging material that cannot be recycled will be placed in plastic storage bags and disposed of as municipal waste.
Table 3-2. Surface Sediment Sample Types to be Collected
Notes X: sample to be collected and submitted for analysis/testing; A: sample to be collected and archived; P: potential
location for sample -: no sample will be collected at this location 1: Sediment conventional parameters include grain size distribution, total solids, total volatile solids, total organic
carbon, and ammonia. 2: Samples for grain size distribution and ammonia analysis should be stored at 4°C only. 3: Holding time for ammonia analysis is 7 days at 4°C; holding time for grain size distribution is 6 months at 4°C. 4: References: chemistry, toxicity testing, and potential benthic community analysis will be conducted at these
locations. 5: Three candidate reference locations have been identified for the purposes of this workplan. Actual reference
locations will be determined in the field based on physical attributes of the site and the results of the wet-sieving. Up to three reference locations will be sampled for chemistry and toxicity to match grain size distribution with site sediments.
6: Frequency of analysis is one per twenty samples (5%). 7: Triplicate analysis for sediment conventional parameters only. 8: MS/MSDs, equipment rinseate, and rinseate blanks conducted for organics and metals only. 9: The total number of samples to be tested is dependant on the sediment chemistry results. 10: Samples submitted for PCB congeners and bulk TBT will be taken from archived samples.
Fidalgo Bay Sediment Investigation SAP
September 17, 2007 43 FINAL
4.0 Laboratory Methods
All of the chemical analytical and biological testing procedures used in this program will be performed in accordance with the PSEP guidelines. The laboratory analysis will be consistent with PSEP guidelines (PSEP 1997a, 1997b, 1997c, 1997d), and any recent modifications proposed during the SMARM. Each laboratory participating in this program will institute internal QA/QC plans. Analyses will be required to conform to accepted standard methods and internal QA/QC checks prior to final approval.
4.1 Chemical Analyses
Chemical analysis will be conducted by laboratories subcontracted to the Ecology contractor. The specific analyses and conventional parameters to be measured, sample preparation methods, analytical methods, target detection limits (TDLs), and SMS numeric criteria (SQS and CSL) are presented in Table 4-1. The TDLs listed may be subject to modification due to elevated sample concentrations, heterogeneous samples (sediment), and potential matrix interferences that may preclude obtaining the desired quantification limit. In the event the laboratory is unable to meet the TDLs, the reasons for the deviation will also be reported. SMS guidance will be used to compare chemistry data results to determine whether further biological testing is warranted.
In addition to the analytes on the SMS list, dioxin/furan congeners and organotins will also be analyzed in a subset of samples. Analysis of dioxins/furans will follow USEPA Method 1613B for 2,3,7,8-substituted chlorinated dioxins and furans (Table 4-2). The concentration of dioxin/furan compounds will be normalized to the toxicity of 2,3,7,8-TCDD using TEFs updated by the WHO in 2005 (Van den Berg et al. 2006). The TEQ is equivalent to the sum of the concentrations of individual congeners multiplied by their TEF (potency relative to 2,3,7,8-TCDD). Non-detected values will be assessed as half of the method detection limit for data evaluation purposes.
carbon 1: Recommended sample preparation methods are: PSEP (1997a,b) and USEPA Method 3050B and 3500 series
(sample preparation methods from SW-846 [USEPA 1986] and subject to changes by USEPA updates). 2: Recommended sample cleanup methods are: Sample extracts subjected to gel permeation chromatography (GPC)
cleanup follow the procedures specified by USEPA SW-846 Method 3640A. Special care should be used during GPC to minimize loss of analytes. If sulfur is present in the samples (as is common in most marine sediments), cleanup procedures specified by USEPA SW-846 Method 3660B should be used. All PCB extracts should be subjected to sulfuric acid/permanganate cleanup as specified by USEPA SW-846 Method 3665A. Additional cleanup procedures may be necessary on a sample-by-sample basis. Alternative cleanup procedures are described in PSEP (1997a,b) and USEPA (1986).
3: MDL, SQS, and CSL are on a dry weight basis. 4: The recommended MDL is based on a value equal to one third of the 1988 dry weight lowest apparent effects
threshold (LAET) value (Barrick et al. 1988) except for the following chemicals: 1,2-dichlorobenzene, 1,2,4-trichlorobenzene, hexachlorobenzene, hexachlorabutadiene, n-nitrosodiphenylamine, 2-methylphenol, 2,4-dimethylphenol, and benzyl alcohol, for which the recommended MDL is equal to the full value of the 1988 dry weight LAET.
Fidalgo Bay Sediment Investigation SAP
September 17, 2007 46 FINAL
5: Recommended Protocols for Measuring Metals in Puget Sound Water, Sediment and Tissue Samples, Puget Sound Estuary Program, April 1997.
6: Selected ion monitoring may improve the sensitivity of USEPA Method 8270C and is recommended in cases when detection limits must be lowered to human health criteria levels or when TOC levels elevate detection limits above ecological criteria levels. See PSEP Organics Chapter, Appendix B – Guidance for Selected Ion Monitoring (1997).
Table 4-2. Dioxin/Furan Analytical Method and Sediment Method Detection Limit
Parameter Analysis Method1 Sediment MDL2 2,3,7,8-TCDD 1613B 0.2 to 0.5
1,2,3,7,8-PeCDD 1613B 0.2 to 0.5 1,2,3,4,7,8-HxCDD 1613B 1 to 5 1,2,3,6,7,8-HxCDD 1613B 1 to 5 1,2,3,7,8,9-HxCDD 1613B 1 to 5
1,2,3,4,6,7,8-HpCDD 1613B 1 to 5 OCDD 1613B 10
Total Tetra-Dioxins (TCDD) 1613B 0.2 to 0.5 Total Penta-Dioxins (PeCDD) 1613B 1 to 5 Total Hexa-Dioxins (HxCDD) 1613B 1 to 5 Total Hepta-Dioxins (HpCDD) 1613B 1 to 5
2,3,7,8-TCDF 1613B 1 to 5 1,2,3,7,8-PeCDF 1613B 1 to 5 2,3,4,7,8-PeCDF 1613B 1 to 5
1,2,3,4,7,8-HxCDF 1613B 1 to 5 1,2,3,6,7,8-HxCDF 1613B 1 to 5 1,2,3,7,8,9-HxCDF 1613B 1 to 5 2,3,4,6,7,8-HxCDF 1613B 1 to 5
1,2,3,4,6,7,8-HpCDF 1613B 1 to 5 1,2,3,4,7,8,9-HpCDF 1613B 1 to 5
OCDF 1613B 10 Total Tetra-Furans (TCDF) 1613B 0.2 to 0.5
Total Penta-Furans (PeCDF) 1613B 1 to 5 Total Hexa-Furans (HxCDF) 1613B 1 to 5 Total Hepta-Furans (HpCDF) 1613B 1 to 5
Notes 1: Method 1613 Tetra- through Octa-Chlorinated Dioxins and Furans by Isotope Dilution HRGC/HRMS. U.S.
Environmental Protection Agency, Office of Water, Engineering and Analysis Division. October 1994. 2: MDL is on a dry weight basis in pg/g.
Fidalgo Bay Sediment Investigation SAP
September 17, 2007 47 FINAL
4.1.1 Analytical Laboratory Reporting
Analytical laboratory reports will be accompanied by sufficient backup data and QC results to enable independent reviewers to evaluate the quality of the data results. Analytical data will be reported in the units specified by the MDLs listed in Tables 4-1 and 4-2.
The analytical laboratory deliverables will include the following:
• Case narrative (including any problems encountered, protocol modifications, and/or corrective actions taken);
• Sample analytical and QA/QC results with units;
• All protocols used during analyses;
• Any protocol deviations from the approved sampling plan;
• Surrogate recovery results;
• Matrix spike/matrix spike duplicate results;
• Laboratory duplicate/triplicate results;
• Blank results;
• Sample custody records (including original chain-of-custody forms); and
• Analytical results in SEDQUAL (sediment quality database) electronic format.
4.2 Biological Analyses
This section describes specific procedures for the suite of bioassays used for SMS biological analysis. The decision to conduct confirmatory biological testing will be contingent on the chemistry results for a given location. To the maximum extent practicable, chemical results will be provided for bioassay decisions within 28 days of sample collection. The remaining 4-week (28-day) period of the holding time will allow time for bioassay preparation as well as time for retests if necessary.
Bioassay testing requires that test sediments be matched and run with appropriate reference sediment to factor out background conditions and sediment grain-size effects on bioassay organisms. The contractor will collect the identified reference sediments at the same time that other samples are collected. Wet-sieving in the field, however, is essential in finding an adequate match. Wet-sieving results should be recorded and submitted with the sample analysis results. The location of the reference sediment sampling location will be recorded to the nearest 0.1 second (NAD 83).
All sediment samples for potential bioassays will be stored at 4°C, with no headspace or under a nitrogen atmosphere (i.e., nitrogen-purged headspace) pending completion of chemical analyses and initiation of any required biological testing. All bioassays, including retests, will commence within 56 days from collection of the first grab sample in the sediment composite to be tested. The laboratory will maintain chain-of-custody procedures throughout biological testing.
Fidalgo Bay Sediment Investigation SAP
September 17, 2007 48 FINAL
Bioassay testing will be initiated as soon as possible after the first chemical results become available and the decision is made to conduct bioassays. This includes obtaining test organisms and control and reference sediments in a timely manner. This approach will support the opportunity for any second-round (additional) biological testing within the allowable 56-day holding period, if such need arises. As initial chemistry data become available, the project manager and the bioassay laboratory representative will maintain close coordination with Ecology to expedite biological testing decisions.
Three bioassays (Table 4-3) including amphipod mortality, larval development, and juvenile polychaete growth will be conducted on each sample identified for biological testing. All biological testing will be in strict compliance with Recommended Guidelines for Conducting Laboratory Bioassays on Puget Sound Sediments (PSEP 1995), with appropriate modifications as specified in the annual review process. General biological testing procedures and specific procedures for each sediment bioassay are summarized in the following sections.
Table 4-3. Bioassay Suite for the March Point RI/FS Sediment Investigation
Bioassay Test Test Organism
10-day Amphipod Mortality Test Eohaustorius estuarius; Rhepoxynius abronius
48-hour Larval Development Test1 (echinoderm or bivalve)
Mytilus galloprovincialis; Dendraster excentricus
20-day Juvenile Polychaete Growth Test Neanthes arenaceodentata Note 1: Actual test length may vary based on larval development stage.
The specific QA/QC measures employed as part of the biological analyses are discussed in detail in Section 5.0.
4.2.1 Amphipod Mortality Bioassay
This test involves exposing Rhepoxynius abronius, Ampelisca abdita, or Eohaustorius estuarius to test sediment for 10 days and counting the surviving animals at the end of the exposure period. Daily emergence data and the number of amphipods failing to rebury at the end of the test will be recorded as well. The control sediment has a performance standard of 10% mortality. The reference sediment has a performance standard of 25% mean mortality.
E. estuarius is the preferred test organism for sediments with percent fines >60%. R. abronius is the preferred amphipod species for coarser-grained sediments (<60% fines), and if sediment clay content exceeds 20%, testing with A. abdita is recommended.
Ammonia and sulfides toxicity may interfere with test results for this bioassay. If elevated levels of these analytes are suspected, aeration may need to be conducted throughout the test. This action will be coordinated with Ecology. Ammonia reference toxicant tests may be conducted if elevated ammonia concentration is suspected in test sediments.
Fidalgo Bay Sediment Investigation SAP
September 17, 2007 49 FINAL
4.2.2 Larval Development Bioassay
This test monitors larval development of a suitable echinoderm or molluscan species (e.g., Dendraster excentricus or Mytilus galloprovincialus) in the presence of test sediment. D. excentricus is the preferred species, followed by M. galloprovincialis. The sediment larval bioassay has a variable endpoint (not necessarily 48 hours) that is determined by the developmental stage of organisms in a sacrificial seawater control (PSEP 1995). At the end of the test, larvae from each test sediment exposure are examined to quantify abnormality and mortality. The seawater control has a performance standard of 70% mean normal survivorship. Initial counts will be made for a minimum of five 10 mL aliquots. Final counts for seawater control, reference sediment, and test sediment will be made on 10 mL aliquots.
Ammonia and sulfides toxicity may interfere with test results for this bioassay. If elevated levels of these analytes are suspected, aeration may need to be conducted throughout the test. This action will be coordinated with Ecology. Ammonia reference toxicant tests may be conducted if elevated ammonia concentration is suspected in test sediments.
4.2.3 Juvenile Polychaete Growth Bioassay
This sublethal, static-renewal toxicity test can be used to determine the relative toxicity of marine sediments using the juvenile polychaete, Neanthes arenaceodentata. The test is conducted in accordance with the methods described by PSEP (1995) and modifications to the test approved by the DMMP agencies.
The toxicity test involves a 20-day exposure to sediments and the response of the organisms to test sediments as compared to their response in control (clean) and reference sediment. The test endpoint is mean individual growth (expressed as mg/individual/day).
The control sediment has a performance standard of 10% mortality. The reference sediment has a performance standard of 80% of the control growth. The DMMP agencies have established a target control growth performance guideline of ≥0.72 mg/individual/day. The N. arenaceodentata negative control performance guideline is a target growth rate of ≥0.72 mg/individual/day; the negative control performance standard is >0.38 mg/individual/day (below which the test is considered a QA/QC failure). Use of worms smaller than 0.25 mg (dry weight) at the beginning of the test will also be considered a QA/QC failure.
4.2.4 Full-Spectrum Lighting
Under certain conditions, when PAHs are exposed to UV radiation of sufficient quality and quantity, photo-activation may occur (Kosian 1998). Photo-activation has been demonstrated to result in increased acute and chronic toxicity (Arfsten 1996). Benthic and aquatic organisms exposed to selected PAHs and simultaneously to specific wavelengths and intensities of UV radiation may be at significantly greater risk to toxic effects than organisms exposed to the same PAHs absent the UV radiation (Ahrens 2002). When the following site conditions are encountered, bioassays should be performed in the presence of full-spectrum lighting that includes UV wavelengths of sufficient intensity to mimic conditions at the site (Ecology 2003):
Fidalgo Bay Sediment Investigation SAP
September 17, 2007 50 FINAL
1) Sediment Depth: For marine or estuarine sites, if either >25% of the surface sediments, or 1/2 acre of the surface sediments, are 4 meters (12 feet) or less, including intertidal and subtidal zones.
2) Presence or presumed presence of any of the photo-activated PAHs listed in Table 4-4 (Nagpal 1993).
Since these conditions may be encountered in Fidalgo Bay, bioassays should be conducted using full-spectrum lighting, if warranted.
Standard fluorescent laboratory lighting fixtures are not full spectrum and do not produce “natural” wavelengths and intensity of light. Therefore, the laboratory must use two light sources with different radiation characteristics. The full-spectrum fluorescent lamp needed must include the following (Ecology 2003):
2) UV-A output (315 nm < λ < 400 nm); this may have an effect upon burial and feeding behavior.
3) Correct Color temperature: “warm” red to “cold” blue expressed in degrees Kelvin. Daylight at noon is typically estimated at 5,500°K.
4) High Color Rendering Index (CRI): Color rendering is the degree to which a light source shows the true color of objects it illuminates. This is measured on a color rendering index rated from 0–100. A normal fluorescent lamp rates 54 on the CRI scale. High quality fluorescent lamps will rate 90–98 on the same scale.
In addition to the quality of the lamp, its proximity to the animal, its output intensity, and duration of use are also critical. It is absolutely critical that nothing is placed between the envelope of the lamp tube and the recipient test organism or vessel. UV-B is greatly attenuated by glass, plastic, and ultra-fine mesh. The amount of UV-B received is also diminished with
Fidalgo Bay Sediment Investigation SAP
September 17, 2007 51 FINAL
distance. It is recommended that any UV-B tubes be no further that 12 inches (30 cm) away from the organism or vessel (Ecology 2003).
The recommended lab conditions for full-spectrum testing include:
• Light intensity: 50–100 foot candles;
• Light duration: 16:8 (light/dark);
• Overlying water depth: not greater than 15 cm (6 inches);
• Lamp to water surface distance: not greater than 30 cm (12 inches); and
Test interpretations consist of endpoint comparisons to controls and reference on an absolute percentage basis as well as statistical comparison to reference. The SMS biological effects criteria are presented in Table 4-5.
Biological Test1 Sediment Quality Standards Cleanup Screening Levels Amphipod Mortality The test sediment has a significantly higher
(t-test, P≤0.05) mean mortality than the reference sediment, and the test sediment mean mortality is more than 25% greater, on an absolute basis, than the reference sediment mean mortality.
The test sediment has a significantly higher (t-test, P≤0.05) mean mortality than the reference sediment, and the test sediment mean mortality is more than 30% greater, on an absolute basis, than the reference sediment mean mortality.
Larval Development The test sediment has a mean survivorship of normal larvae that is significantly less (t-test, P≤0.1) than the mean normal survivorship in the reference sediment, and the mean normal survivorship in the test sediment is less than 85% of the mean normal survivorship in the reference sediment.
The test sediment has a mean survivorship of normal larvae that is significantly less (t-test, P≤0.1) than the mean normal survivorship in the reference sediment, and the mean normal survivorship in the test sediment is less than 70% of the mean normal survivorship in the reference sediment.
Juvenile Polychaete Growth
The mean individual growth rate of polychaetes in the test sediment is less than 70% of the mean individual growth rate of the polychaetes in the reference sediment, and the test sediment mean individual growth rate is statistically different (t-test, P P≤0.05) from the reference sediment mean individual growth rate.
The mean individual growth rate of polychaetes in the test sediment is less than 50% of the mean individual growth rate of the polychaetes in the reference sediment, and the test sediment mean individual growth rate is statistically different (t-test, P P≤0.05) from the reference sediment mean individual growth rate.
Note 1: Sufficient sediment will be collected at all locations to conduct the suite of three laboratory bioassays:
amphipod mortality, larval development, and juvenile polychaete growth. The benthic infauna samples will only be collected at the sediment quality triad stations. The SMS biological effects criteria will be used to assist in the interpretation of the benthic infauna data results as part of the sediment quality triad evaluation.
Fidalgo Bay Sediment Investigation SAP
September 17, 2007 52 FINAL
4.2.6 Biological Laboratory Reporting
The biological laboratory responsible for conducting laboratory bioassays will prepare a written report documenting all the activities associated with toxicity testing. At a minimum, the following will be included in the report:
• Results of the laboratory bioassay analyses and QA/QC results for test and reference sediments; raw data will be legible or typed; illegible data may result in the need for a retest if the agencies cannot interpret the data as a result;
• Results of positive and negative control, including reference toxicant specific laboratory control limits;
• Water quality monitoring results; • All protocols used during analyses, including explanation of any deviation from
the PSEP protocols and the approved sampling plan; • Chain-of-custody procedures, including explanation of any deviation from the
identified protocols; • Location and availability of data, laboratory notebooks, and chain-of-custody
forms; • Source of test organisms; and • Source of control sediment and control seawater.
4.3 Radioisotope Analyses
Laboratory analysis will consist of beryllium-7 (Be-7), lead-210 (Pb-210), and cesium-137 (Cs-137) radioisotope activity measurements. Percent dry weight and Pb-210 in disintegrations per minute per gram (dpm/g), Be-7 in cpm/g and Cs-137 in dpm/g, will be determined for each sample. QA/QC for each core sample will include one duplicate for Be-7, one check sample and one duplicate for Pb-210 and sedimentation rate determination, and one reference material and one duplicate for CS-137.
Analysis strategy should follow the procedures recommended by Battelle:
1. Initially analyze the top five sections (top 10 cm) for Be-7. If Be-7 activity is detected at 10 cm, then analyze more sections until activity is not detected.
2. Analyze the core for Pb-210 and Cs-137. Cs-137 can be analyzed along with Be-7 in the upper portion of the core.
3. Follow a typical strategy for initial analysis of Pb-210: • 0–50 cm Interval: Analyzing every other or every third 2 cm section • 50–120 cm Interval: Analyze every other 5 cm section • 120–360 cm Interval: Analyze every other 10 cm section
A sedimentation rate is calculated from the Pb-210 profile of the core. If there are gaps in the profile, additional samples can be analyzed to fill in the needed information. Once the sedimentation rate has been calculated, analyze sections that correspond to ~1950–1975 for Cs-137 to verify the sedimentation rate.
Fidalgo Bay Sediment Investigation SAP
September 17, 2007 53 FINAL
5.0 Quality Assurance Project Plan
The purpose of the project QA/QC is to provide confidence in the project data results through a system of quality control performance checks with respect to data collection methods, laboratory analysis, data reporting, and appropriate corrective actions to achieve compliance with established performance and data quality criteria. This section presents the QA/QC procedures to ensure that the investigation data results are defensible and usable for their intended purpose.
5.1 Measurements of Data Quality
The tolerable limits for the data reported by the laboratory will be measured through precision, accuracy, representativeness, completeness, and comparability (PARCC).
Precision is a measure of mutual agreement among individual measurements of the same property under prescribed conditions. Precision will be assessed by the analysis of MS/MSDs, field duplicate and triplicates, and laboratory control sample/laboratory control sample duplicates (LCS/LCSD). The calculated relative percent differences for field duplicates and triplicates and MS/MSD pairs will provide information on the precision of sampling and analytical procedures, and the relative percent differences for LCS/LCSD pairs will provide information on precision of the analytical procedures.
Accuracy is the degree to which an observed measurement agrees with an accepted reference or true value. Accuracy is a measure of the bias in the system and is expressed as the percent recoveries (%Rs) of spiked analytes in MS/MSD and LCS/LCSD samples. Accuracy will also be evaluated through the surrogate spikes in each sample. The laboratory control limits for surrogates will be used for the project.
Representativeness expresses the degree to which data accurately and precisely represent an actual condition or characteristic at a particular sampling point. Representativeness is achieved by collecting samples representative of the matrix at the time of collection. Representativeness can be evaluated using replicate samples, additional sampling locations, and blanks.
Completeness refers to the amount of measurement data collected relative to that needed to assess the project’s technical objectives. It is calculated as the number of valid data points achieved divided by the total number of data points requested by virtue of the study design. For this project, completeness objectives have been established at 95 percent.
Comparability is based on the use of established USEPA-approved methods for the analysis of the selected parameters. The quantification of the analytical parameters is based on published methods, supplemented with well-documented procedures used in the laboratory to ensure reproducibility of the data.
Fidalgo Bay Sediment Investigation SAP
September 17, 2007 54 FINAL
5.2 Quality Assurance and Quality Control for Chemistry Sediment Samples
Field and laboratory QA/QC samples will be used to evaluate the data precision, accuracy, representativeness, and comparability of the analytical results. The field QA samples to be collected are described in Section 5.2.1. The laboratory QA samples are discussed in Section 5.2.2.
5.2.1 Field QA/QC for Chemistry Sediment Samples
Field QC samples will be collected during sampling to quantitatively measure and ensure the quality of the sampling effort and the analytical data. Field QC samples include field duplicates, equipment rinseate, and rinseate blanks. QC samples are to be handled in the same manner as the environmental samples collected. Brief descriptions of the field QC samples are provided below.
5.2.1.1 Field Replicates
Field duplicates are collected at the same time as the original sample using identical sampling techniques. Field duplicate sample results (triplicates for sediment conventional parameters) are used to assess the precision of the sample collection process and to help determine the representativeness of the sample. Field replicates will be collected at a 5% frequency. The replicates will be designated for the same analysis as the original samples and submitted to the laboratory blind (no indication of the contents or the associated sample). The field replicates will be collected from the same homogenate as the original sample.
5.2.1.2 Equipment Rinseate and Rinseate Blanks
The equipment rinseate blank and decontamination water (rinseate) blank provide a quality control check on the potential for cross contamination by measuring the effectiveness of the sampling and processing decontamination procedures. The equipment rinseate sample consists of de-ionized water rinsed across sample collection and processing equipment after they have been used to collect a sample and have been decontaminated for use at the next sampling location. The decontamination water blank is an unadulterated sample of the de-ionized water used to create the rinseate blank, analyzed to ensure no contaminants were present in the rinse water. Equipment blank samples will not be required when using disposable sample equipment.
5.2.2 Laboratory QA/QC for Chemical Sediment Sample
One laboratory matrix spike and matrix spike duplicate will be analyzed for every 20 samples submitted or for each analytical batch of samples (if less than 20 submitted) for the analysis of SVOCs, PCBs, metals, and TOC. The combination of these spiked samples will provide information on the accuracy and precision of the chemical analysis, and to verify that the extraction and measured concentrations are acceptable. The matrix spike and matrix spike duplicates will be analyzed in accordance with USEPA methods for each respective analyte.
Fidalgo Bay Sediment Investigation SAP
September 17, 2007 55 FINAL
One laboratory replicate will be analyzed for all constituents (except grain size, TOC, and total solids) for every 20 samples submitted or for each analytical batch of samples (if less than 20 submitted). Laboratory triplicates will be analyzed for grain size, TOC, and total solids. These QA/QC samples will be analyzed in accordance with the respective USEPA method and will be used to evaluate the precision of the analytical method.
One laboratory method blank and LCS will be analyzed for all constituents (except grain size and total solids) for each analytical batch of twenty samples to assess potential laboratory contamination and accuracy. An LCSD will be analyzed if required by the method, or if the laboratory does not have enough sample volume to prepare an MS/MSD.
Laboratory control samples, certified reference material, and surrogate spikes will be used as defined by the analytical methods and equipment calibration requirements.
5.3 Biological Testing QA/QC for Sediment Samples
The detailed standard operating procedures (SOPs) for the bioassay tests proposed for this investigation will be provided by the selected biological laboratory upon request. This section summarizes the toxicity test QA/QC procedures to be implemented to ensure the test results are valid. Standard QA/QC procedures include the use of negative controls, positive controls, reference sediment samples, laboratory replicates, and daily water quality measurements. In addition, close contact with the biological laboratory will be maintained prior to and during the testing period to resolve any QA/QC problems or testing methodology issues in a timely manner.
5.3.1 Negative Control
The negative control consists of clean, inert material tested in parallel with the test sediments under identical test conditions. The biological testing laboratory provides this clean material, which usually consists of sediment collected from the original location from which the test organisms were harvested. The test acceptability criteria are based on the results of the negative control. A test with at least 90% survival (70% mean normal survivorship for larval development) in negative control test chambers is considered acceptable.
5.3.2 Positive Control
A positive control will be run for each bioassay. Positive controls are chemicals known to be toxic to the test organism and which provide an indication of the sensitivity of the particular organisms used in a bioassay. Cadmium chloride or other appropriate reference toxicant will be used for the amphipod mortality, larval development, and juvenile polychaete growth bioassays.
5.3.3 Reference Sediment
Reference sediments, which closely match the grain size characteristics of the test sediments, will be run with each test batch for all three bioassays. The reference sediment is used for test comparisons and interpretations. The collection area will be determined based on sample physical characteristics. Candidate reference sites for this investigation are presented in
Fidalgo Bay Sediment Investigation SAP
September 17, 2007 56 FINAL
Figure 3. All reference sediments will be analyzed for total solids, total and acid volatile solids, total organic carbon, bulk ammonia, bulk sulfides, and grain-size.
All bioassays have performance standards for reference sediments (see Section 4.2). Failure to meet these standards may result in the requirement to retest.
5.3.4 Laboratory Replication
Five laboratory replicates of each test sediment, reference sediment, negative control, and elutriate concentration will be run for each respective bioassay. The replication of tests provides multiple observations of effects to test organisms so that statistical comparisons can be made between test and reference sediments.
5.3.5 Bioassay Water Quality
Water quality monitoring will be conducted for the amphipod, larval development, and juvenile polychaete growth bioassays. This consists of daily measurements of salinity, temperature, pH, and dissolved oxygen (every third day for juvenile polychaete growth bioassay). Ammonia and sulfides will be determined at test initiation and termination and interstitial salinity will be determined prior to the test setup. Monitoring will be conducted for all test and reference sediments and negative controls (including seawater controls). Parameter measurements must be within the limits specified for each bioassay as listed in Table 5-1. Measurements for each treatment will be made on a separate chemistry beaker set up to be identical to the other replicates within the treatment group. In addition, interstitial ammonia measurements at test initiation and test termination will be conducted for the amphipod test.
Table 5-1. Water Quality Control Limits (Ecology 2003)
Test (Test Species)
Temperature Salinity Dissolved Oxygen pH3
Amphipod Mortality (E. estuarius; R. abronius)
15 ± 1 °C Ambient1 NA2 ---
Larval Development (Mytilus sp.)
16 ± 1 °C 28 ± 1 ppt > 60% saturation ---
Larval Development (D. excentricus)
15 ± 1 °C 28 ± 1 ppt > 60% saturation ---
Juvenile Polychaete Growth (N. arenaceodentata)
20 ± 1 °C 28 ± 2 ppt NA2 ---
Notes 1. Same as interstitial salinity of test sediment 2. Continuous aeration is required by the protocol, so the dissolved oxygen should not be a cause of concern. 3. Ph is monitored as a water quality parameter. There are generally no control limits for pH; however,
measurements of pH may be useful in interpreting results (Ecology 2003).
Fidalgo Bay Sediment Investigation SAP
September 17, 2007 57 FINAL
5.4 Data Validation
The data generated as part of this investigation will undergo an independent quality assurance review and data validation. A QA2 chemistry data review will be conducted that examines the complete analytical process from calculation of instrument and method detection limits, practical quantitation limits, final dilution volumes, sample size, and wet-to-dry ratios to quantification of calibration compounds and all analytes detected in blanks and environmental samples (PTI 1989a). A QA1 review of bioassay data will be conducted that evaluates the acceptability of test results for positive controls, negative controls, reference sediments, replicates, and experimental water quality conditions such as temperature, salinity, pH, and dissolved oxygen (PTI 1989b).
Fidalgo Bay Sediment Investigation SAP
September 17, 2007 58 FINAL
6.0 Data Analysis and Reporting
This section describes the data analysis and reporting requirements for the data collection activities described in this workplan.
6.1 Analysis of Sediment Profile Imaging Data
SAIC has developed a standardized and formalized technique known as Remote Ecological Monitoring of the Seafloor (REMOTS®) for SPI image collection, analysis, and interpretation. Physical and biological parameters are measured directly from the SPI transparencies using a video digitizer and computer image analysis system. The image analysis system can measure up to 256 different tonal color scales so subtle features can be accurately digitized and measured. The image analysis software allows the measurement and storage of data with 21 different variables for each image. A representative image from each station will undergo full computer image analysis. In addition, a second image from 20% of the stations will be analyzed for quality assurance.
6.1.1 Benthic Macroinvertebrate Community
SPI imagery, in conjunction with benthic community grab samples, will be used to evaluate the health of the benthic macroinvertebrate community at the deep water disposal site. Depth of the apparent redox potential discontinuity (RPD), infaunal successional stage, and calculation of the Organism-Sediment Index (OSI) are three key REMOTS® image analysis parameters used to assess the health of the benthic infaunal community.
The mapping of infaunal successional stages from SPI images is based on the theory that organism/sediment interactions follow a predictable sequence after a major seafloor disturbance. Infaunal succession following a major seafloor disturbance initially involves pioneering populations (Primary or Stage I succession) of very small organisms that live at or near the sediment/water interface (Pearson and Rosenberg 1978; Rhoads and Germano 1986). In the absence of further disturbance, infaunal deposit feeders eventually replace these early successional assemblages. The start of this “infaunalization” process is designated as Stage II. Large, deep-burrowing infauna (Stage III taxa) represents a high order successional stage typically found in areas of low disturbance. The presence of Stage III feeding voids indicate the presence of Stage III organisms.
The OSI provides a measure of benthic habitat quality based on dissolved oxygen conditions, depth of the apparent RPD, infaunal successional stage, and presence or absence of sedimentary methane measured during REMOTS® image analysis (Rhoads and Germano 1986). The OSI is a numerical index ranging from -10 to +11. The lowest value is given to bottom sediments with low or no dissolved oxygen in the overlying bottom water, no apparent macrofaunal life, and methane gas present in the sediment. High OSI values are given to aerobic bottom sediments with a deep apparent RPD, mature macrofaunal community, and no methane gas. The numerical values and ranges used in calculating the OSI are provided in Table 6-1. Previous SPI surveys conducted in various coastal regions by SAIC (e.g., Puget Sound, Long Island Sound,
Fidalgo Bay Sediment Investigation SAP
September 17, 2007 59 FINAL
Chesapeake Bay, and the Florida and Louisiana coasts) have shown that OSI values less than 7 indicate a stressed or disturbed benthic environment.
6.1.2 Apparent Redox Potential Discontinuity
The depth of the apparent RPD, which is the change from oxidized to reduced sediment, will be measured using SPI photography and REMOTS® image analysis. The apparent RPD is a sensitive indicator of infaunal succession, sediment bioturbation activity, and sediment oxygen demand. In fine grain coastal areas where there is oxygen in the overlying water column, sediment near the surface will have a higher reflectance value relative to underlying hypoxic or anoxic sediment. This is because the oxidized surface sediment contains ferric hydroxide (an olive color when associated with organic particles) while the hydrogen sulfide sediments below this oxygenated layer are gray to black. The boundary between the colored ferric hydroxide surface sediment and underlying gray to black sediment is called the apparent RPD. In general, the depth of the actual RPD is shallower than the depth of the apparent RPD because bioturbating organisms mix ferric hydroxide-coated particles downward in the sediment column. As a result, the apparent RPD depth provides an estimate of the degree of biogenic sediment mixing. The area of the aerobic sediment is determined from SPI images by density slicing its unique reflectance value. This oxidized area can then be digitized, measured to scale, and divided by the prism window width to obtain a mean depth for the apparent RPD.
6.1.3 Physical Parameters
Physical parameters that will be measured include grain size, TOC, and total sulfides. In addition, we will also be using SPI photography to evaluate the grain size mode and range, sediment-bearing capacity, the presence and thickness of depositional layers, and any evidence of erosional or depositional events. The distribution of grain size major mode in phi (Φ) sizes will be determined from SPI photography using REMOTS® image analysis. The grain size mode and distribution will provide a direct measurement of the granular characteristics of dredged material disposed at the site. The camera prism penetration depth will provide a measure of sediment-bearing capacity. The presence and thickness of depositional layers will provide an important baseline for future determinations regarding the actual placement of dredged material. Evidence of erosional and depositional events will be useful for determining the relative energy at a given location, thus providing evidence whether dredged material will stay on site or eventually migrate elsewhere.
Fidalgo Bay Sediment Investigation SAP
September 17, 2007 60 FINAL
Table 6-1 Calculation of the Organism-Sediment Index
Choose One Value: Mean RPD Depth Classes
Index Value
0.00 cm 0 > 0 - 0.75 cm 1 0.76 - 1.50 cm 2 1.51 - 2.25 cm 3 2.26 - 3.00 cm 4 3.01 - 3.75 cm 5 > 3.75 cm 6
Choose One Value: Successional Stage Index Value Azoic - 4 Stage I 1 Stage I – II 2 Stage II 3 Stage II – III 4 Stage III 5 Stage I on III 5 Stage II on III 5
Choose One or Both if Appropriate:
Chemical Parameters Index Value
Methane Present - 2 No/Low Dissolved
Oxygen - 4
Organism-Sediment Index = Range: - 10 + 11
6.2 Analysis of Sediment Chemistry Data
The analysis of chemistry data will include the comparison of the results to the SMS numeric criteria and as a line of evidence using the sediment quality triad index. The sediment chemistry data will be summarized and presented in tables indicating sediment locations and detected contaminants and any detection limits that exceed SQS and/or CSL numeric criteria, along with any data qualifiers assigned by the laboratory or during the data validation efforts. The locations with chemistry exceeding numeric criteria will be mapped to delineate any areas that may require cleanup or other remedial action.
6.3 Analysis of Biological Data
The analysis of biological data will include comparison to SMS biological effects criteria, providing two lines of evidence in the sediment quality triad approach, and as described in the sections below.
Fidalgo Bay Sediment Investigation SAP
September 17, 2007 61 FINAL
6.3.1 Toxicity Testing
The toxicity test data results will be summarized and presented in tables indicating sediment locations and test results that exceed SQS and/or CSL biological effects interpretive criteria, along with the results of statistical comparisons to reference sediment test results. The sampling locations with sediment toxicity exceeding the SMS criteria will be mapped to delineate any areas that may require cleanup or other remedial action.
6.4 Radioisotope Dating
Sedimentation rate information including sediment age in years, year of deposition, sediment accumulation rate (cm/yr), and sedimentation rate (g/cm2/yr) will be determined and reported. The sedimentation rate is normally derived from Pb-210 results; however, in some cases the Cs-137 data may be used to determine the sedimentation rate and sediment ages. Cs-137 results are normally used to verify dates determined with sedimentation rates. Be-7 results will be used to estimate the mixed depth.
6.5 Subsurface Sediment Chemistry
The potential analysis of subsurface sediment intervals is dependant on the results of the surface sediment chemistry analysis, toxicity testing, and at the discretion of Ecology. If subsurface sediment samples are submitted for chemical analysis, the data results will be reported as an addendum to the sediment quality investigation.
6.6 Tissue Residue Chemistry
The potential analysis of tissue residue is dependant on the results of the surface sediment chemistry analysis and at the discretion of Ecology. If tissue samples are submitted for residue analysis, the data results will be reported as an addendum to the sediment quality investigation.
6.7 Data Report
A written data report documenting all activities associated with collection, transportation, chemical analyses, and biological testing of sediment samples will be prepared. The report will include recommendations for further action or investigation based on the data results of this investigation. The chemical, biological, and QA/QC reports will be included as appendices. At a minimum, the following will be included in the Final Report:
• Description of sampling and analysis activities;
• Protocols used during sampling and testing and an explanation of any deviations from the sampling plan protocols or the approved workplan;
• Physical descriptions of samples and site habitat;
• Methods used for station positioning, sample collection locations reported in latitude and longitude to the nearest tenth of a second (NAD 83);
Fidalgo Bay Sediment Investigation SAP
September 17, 2007 62 FINAL
• Map showing actual locations of sampling stations and results of data comparisons to SMS criteria and Sediment Quality Triad Index;
• Chain-of-custody records;
• Chemistry and biological testing results and laboratory reports;
• Comparison of data results to interpretive criteria;
• Radioisotope results and interpretation; and
• QA/QC summary and data validation reports.
Fidalgo Bay Sediment Investigation SAP
September 17, 2007 63 FINAL
7.0 References
Ahrens, M.J. and C. Hickey. 2002. UV-photoactivation of polycyclic aromatic hydrocarbons and the sensitivity of sediment-dwelling estuarine organisms. National Institute of Water & Atmospheric Research Conference: UV Radiation and its Effects: an update. 26-28 March 2002. Antarctic Centre, Christchurch, New Zealand.
Aller, R.C. 1982. The effects of macrobenthos on chemical properties of marine sediments and overlying waters. In: P.L. McCall & M.J.S. Tevesz (eds.), Animal-Sediment Relations. Plenum Publishing, NY. Pp: 53-102.
Anchor Environmental. 2004. Sampling and Analysis Data Report. Supplemental Sediment Characterization Dakota Creek Industries Shipyard Facility/Pier1 Redevelopment Area, Anacortes, WA. Prepared for Seattle District U.S. Army Corps of Engineers on behalf of Kimberly Clark Corporation and Port of Anacortes by Anchor Environmental, L.L.C. October 2004.
Anchor Environmental. 2005. Draft Data Report. Remedial Investigation/Feasibility Study of the Former Scott Paper Mill Site, Anacortes, WA. Prepared for Kimberly-Clark Corporation and Port of Anacortes by Anchor Environmental, L.L.C. November 2005.
Arfsten, D.P., Schaeffer, D.J., and Mulveny, D.C. 1996. The effects of near ultraviolet radiation on the toxic effects of polycyclic aromatic hydrocarbons in animals and plants: A review. Ecotoxicol. Environ. Saf. 33, 1-24.
Barrick, R.C., D.S. Becker, L.B. Brown, H. Beller, and R. Pastorak. 1988. Sediment Quality Values Refinement: 1988 Update and Evaluation of Puget Sound AET. Volume I. Final Report. Prepared for tetra tech, Inc., Bellevue, WA, and the U.S. Environmental Protection Agency, Region 10, Seattle, WA. Prepared by PTI Environmental Services, Bellevue, WA.
Ecology. 1995. Sediment Management Standards, Chapter 173-204 WAC. Prepared by the Washington State Department of Ecology, Olympia, WA. Ecology Publication No. 96-252. Revised December 1995.
Ecology. 1997. Survey for Petroleum and other Chemical Contaminants in the Sediments of Fidalgo Bay. Washington State Department of Ecology. Publication No. 97-338. November 1997.
Ecology. 2000a. Results of Screening Analysis for Metals and Organic Compounds in Shellfish from Padilla Bay and Vicinity. Washington State Department of Ecology. Publication No. 00-03-008. May 2000.
Ecology. 2000b. Sediment Quality on the West Side of Fidalgo Bay. Washington State Department of Ecology. Publication No. 00-03-007. January 2000.
Fidalgo Bay Sediment Investigation SAP
September 17, 2007 64 FINAL
Ecology and NOAA. 2003. Chemical Contamination, Acute Toxicity in Laboratory Tests, and Benthic Impacts in Sediments of Puget Sound. A Summary of Results of the Joint 1997-1999 Ecology/NOAA Survey. Washington State Department of Ecology and National Oceanic and Atmospheric Administration National Ocean Service. Ecology Publication No. 03-03-049. NOAA Technical Memorandum NOS NCCOS CCMA 163. October 2003.
Ecology. 2003. Sediment Sampling and Analysis Plan Appendix; Guidance on the Development of Sediment Sampling and Analysis Plans Meeting the Requirements of the Sediment Management Standards (Chapter 173-204 WAC). Prepared for the Washington State Department of Ecology, Sediment Management Unit, Lacey, WA. Prepared by PTI Environmental Service, Bellevue, WA. Ecology Publication No. 03-09-043. Revised April 2003.
Ecology. 2004. Sediment Quality Triad Index in Puget Sound. Prepared by the Washington State Department of Ecology, Lacey, WA. Ecology Publication No. 04-03-008. March 2004.
Hart Crowser. 2000a. Dredge Material Characterization - Cape Sante Marina, Anacortes, WA. Prepared for Cap Sante Marina by Hart Crowser. June 2000.
Hart Crowser. 2000b. Dredge Material Characterization - Pier 1, Anacortes, WA. Prepared for Port of Anacortes by Hart Crowser. July 2000.
Hart Crowser. 2000c. Dredge Material Characterization - Dakota Creek Shipyards, Anacortes, WA. Prepared for Port of Anacortes by Hart Crowser. August 2000.
Kosian, P.A., E.A. Makynen, P.D. Monson, D.R. Mount, A. Spacie, O.G. Mekenyan, and G.T. Ankley. 1998. Application of toxicity-based fractionation techniques and structure-activity relationship models for the identification of phototoxic polycyclic aromatic hydrocarbons in sediment pore water. Environ. Tox. Chem. 17:1021-1033.
Nagpal, N.K. 1993. Ambient Water Quality Criteria for Polycyclic Aromatic hydrocarbons (PAHs), Ministry of Environment, Lands and Parks Province of British Columbia, Water Quality Branch, Water Management Division, Vancouver, B.C.
Pearson, T.H. and R. Rosenberg. 1978. Macrobenthic Succession in Relation to Organic Enrichment and Pollution of the Marine Environment. Oceanogr. Mar. Biol. Ann. Rev. 16: 229-311.
Puget Sound Estuary Program (PSEP). 1986. Recommended Guidelines for Measuring Conventional Sediment Variables in Puget Sound. Prepared for U.S. Environmental Protection Agency, Region 10, and Seattle, WA. Tetra Tech, Inc., Bellevue, WA.
PSEP. 1986. Recommended protocols for measuring conventional sediment variables in Puget Sound. Puget Sound Estuary Program. Prepared for the U.S. Environmental Protection Agency, Region 10 and Puget Sound Water Quality Action Team, Olympia, WA. http://www.wa.gov/puget_sound/Publications/protocols/protocol.html
Fidalgo Bay Sediment Investigation SAP
September 17, 2007 65 FINAL
PSEP. 1987. Recommended protocols for sampling and analyzing subtidal macroinvertebrate assemblages in Puget Sound. Prepared for U.S. Environmental Protection Agency Region 10, Office of Puget Sound, Seattle, WA and Puget Sound Water Quality Authority, Olympia, WA. Prepared by TetraTech, Inc., Bellevue, WA.
PSEP. 1995. Recommended Guidelines for Conducting Laboratory Bioassays on Puget Sound Sediments. Final Report. Prepared for U.S. Environmental Protection Agency, Region 10, Office of Puget Sound, Seattle, WA. Washington State Department of Ecology, Olympia, WA.
PSEP. 1997a. Recommended Guidelines for Sampling Marine Sediment, Water Column, and Tissue in Puget Sound. U.S. Environmental Protection Agency, Region 10, Seattle, WA, for Puget Sound Estuary Program. April 1997.
PSEP. 1997b. Recommended Guidelines for Measuring Metals in Puget Sound Water, Sediment, and Tissue Samples. U.S. Environmental Protection Agency, Region 10, Seattle, WA, for Puget Sound Estuary Program. April 1997.
PSEP. 1997c. Recommended Guidelines for Measuring Organic Compounds in Puget Sound Sediment and Tissue Samples. U.S. Environmental Protection Agency, Region 10, Seattle, WA, for Puget Sound Estuary Program. April 1997.
PSEP. 1997d. Recommended Quality Assurance and Quality Control Guidelines for the Collection of Environmental Data in Puget Sound. U.S. Environmental Protection Agency, Region 10, Seattle, WA, for Puget Sound Estuary Program. April 1997.
PTI. 1989a. Data validation guidance manual for selected sediment variable. Prepared for the Washington State Department of Ecology, Olympia, WA. PTI Environmental Services, Bellevue, WA.
PTI. 1989b. Puget Sound Dredged Disposal Analysis guidance manual: data quality evaluation for proposed dredged material disposal projects. Prepared for the Washington State Department of Ecology, Olympia, WA. PTI Environmental Services, Bellevue, WA.
Rhoads, D.C., McCall, P.L., Yingst, J.Y. 1978. Production and disturbance on the estuarine seafloor. American Scientist 66: 577-586.
Swartz, R.C. 1978. Techniques for sampling and analyzing the marine macrobenthos. EPA 600/3-78-030. U.S. Environmental Protection Agency, Corvallis, OR. 27pp.
Rhoads, D.C. and J.D. Germano. 1986. Interpreting long-term changes in benthic community structure: a new protocol. Hydrobiology 142: 291-308.
USEPA. 1995. Guidance for assessing chemical contaminant data for use in fish advisories. Volume 1. Fish sampling and analysis. Prepared by U.S. Environmental Protection Agency. Second Edition. EPA--823/R-95/007.
Fidalgo Bay Sediment Investigation SAP
September 17, 2007 66 FINAL
USEPA. 1986. Test Procedures for Solid Waste. 3rd Edition. SW-846. U.S. Environmental protection Agency, Office of Solid Waste and Emergency Response, Washington, D.C.
Van den Berg, M., L.S. Bimbaum, M. Denison, M. De Vito, W. Farland, M. Feeley, H. Fiedler, H. Hakansson, A. Hanberg, L. Haws, M. Rose, S. Safe, D. Schrenk, C. Tohyama, A. Tritscher, J. Tuomisto, M. Tysklind, N. Walker, and R. Peterson. The 2005 World Health Organization Re-Evaluation of Human and Mammalian Toxic Equivalency Factors for Dioxins and Dioxin-like Compounds. Prepared for the World Health Organization (WHO). ToxSci Advance Access published July 7, 2006. Published by Oxford University Press on behalf of the Society of Toxicology.
Warwick, R.M. 1986. A new way for detecting pollution effects on marine macrobenthic communities. Marine Biology 92:557-562.
Appendix A
Health and Safety Plan
Appendix B
Sample Forms
2007 Fidalgo Bay Sediment Investigation
Project Number: Time Collected:
Crew: Date: Comments:
Sample Container
Tag Number Sample ID Analysis Laboratory
Notes
Project: Fidalgo Bay Sediment Quality Investigation Station:____________________________ Sampling Event:____________________ Date:______________________________