20
Fiduciary Man Fiduciary Man Fees Survey March 2014 nagement Insights nagement Insights

Fiduciary ManFiduciary ManFees Survey
March 2014
nagement Insightsnagement Insights


© Ernst & Young LLP 2014
Executive summary 1
Introduction 4
Components of fees in a fiduciary management mandate 5
Context for survey 6
Base fiduciary management fees 7
Investment management fees 10
Base fiduciary management fees plus investment management fees 12
Other fees 13
Getting help 14
Appendix: how to read a box plot 15
Contents
Fiduciary Management Insights – Fees Survey
© Ernst & Young LLP 2014
Fiduciary management is a service, not a product. As pension scheme trustees often require different services from their fiduciary managers (FMs) it is difficult to make apples-to-apples comparisons of fees. That being said, in this survey, we have tried to do just that – we have compared the relative fees of FMs providing a specific array of services and managing to a specific investment policy for three hypothetical pension schemes with £50m, £250m and £750m in assets.
The results of this survey are based on responses from 11 FMs who, collectively, manage the significant majority of assets in the UK fiduciary management market. The highlights of our findings are as follows:
Base fiduciary management fees
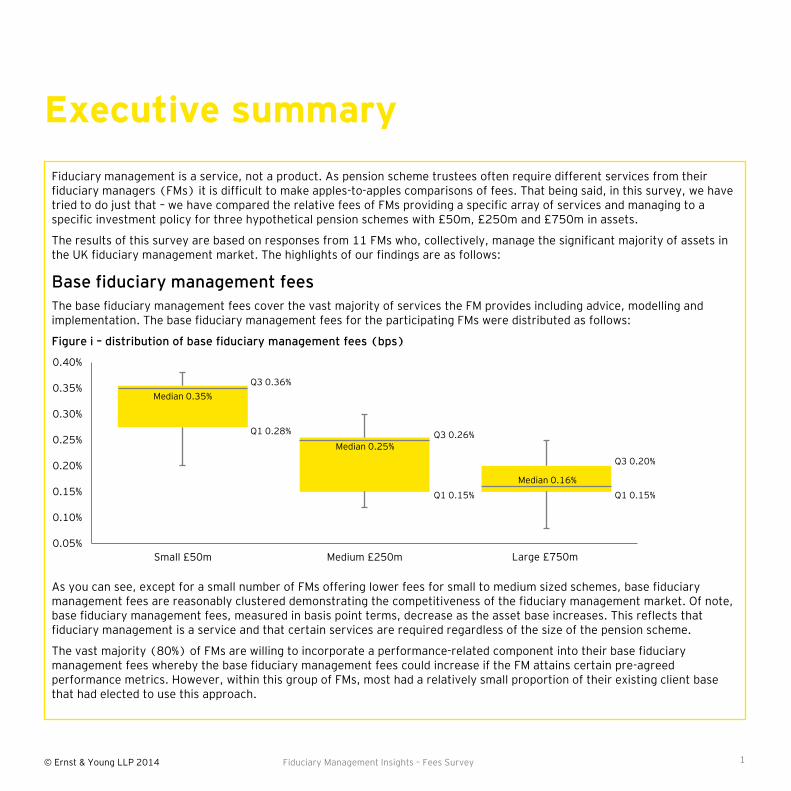
The base fiduciary management fees cover the vast majority of services the FM provides including advice, modelling and implementation. The base fiduciary management fees for the participating FMs were distributed as follows:
Figure i – distribution of base fiduciary management fees (bps)
As you can see, except for a small number of FMs offering lower fees for small to medium sized schemes, base fiduciary management fees are reasonably clustered demonstrating the competitiveness of the fiduciary management market. Of note, base fiduciary management fees, measured in basis point terms, decrease as the asset base increases. This reflects that fiduciary management is a service and that certain services are required regardless of the size of the pension scheme.
The vast majority (80%) of FMs are willing to incorporate a performance-related component into their base fiduciary management fees whereby the base fiduciary management fees could increase if the FM attains certain pre-agreed performance metrics. However, within this group of FMs, most had a relatively small proportion of their existing client base that had elected to use this approach.
Executive summary
Fiduciary Management Insights – Fees Survey
0.05%
0.10%
0.15%
0.20%
0.25%
0.30%
0.35%
0.40%
Small £50m Medium £250m Large £ 750m
Median 0.35%
Q3 0.36%
Q1 0.28%
Median 0.25% Q3 0.26%
Q1 0.15%
Median 0.16%
Q3 0.20%
Q1 0.15%
1
Large £750m

© Ernst & Young LLP 2014
Combined base fiduciary management fees plus investment management fees
In a fiduciary management mandate, in addition to the base fiduciary management fees the trustees will also need to pay the investment management fees for the underlying investment fund managers selected by the FM (in some cases the FM is the underlying investment manager). Indeed, one can view the ‘required’ ongoing cost of a fiduciary management mandate as the base fiduciary management fees plus the underlying investment management fees. In our survey these combined fees were as follows:
Figure ii – combined base fiduciary management fees plus investment management fees (bps)
Interestingly, for our three hypothetical pension schemes, the FMs with the lowest base fiduciary management fees had higher investment management fees for the model portfolios that we specified and vice versa – we see a more even distribution of results with dispersion increasing as asset size increases.
As the fiduciary management market grows, we expect that competitive pressures will put downward pressure on overall fiduciary management fees.
Using these survey results
The survey results within this document represent a like-for-like comparison for a specific set of services for three hypothetical pension schemes. We encourage trustees and sponsors who have existing fiduciary manager appointments not to draw direct comparisons to their own pension schemes as the comparison may not be like-for-like. For the same reasons, we would caution parties interested in moving to a fiduciary management approach against using these figures as benchmarks for their expected fees.
Executive summary (cont’d)
Fiduciary Management Insights – Fees Survey
0.40%
0.45%
0.50%
0.55%
0.60%
0.65%
0.70%
0.75%
0.80%
0.85%
0.90%
Small £50m Medium £250m Large £ 750m
Median 0.71%
Q3 0.77%
Q1 0.69%
Median 0.63%
Q3 0.69%
Q1 0.56%
Median 0.57%
Q3 0.67%
Q1 0.50%
2
Large £750m

© Ernst & Young LLP 2014 Fiduciary Management Insights – Fees Survey 3

© Ernst & Young LLP 2014
Introduction
Fiduciary Management Insights – Fees Survey
One of the questions we are frequently asked by parties interested in fiduciary management is how much will it cost.
The answer to this question is not necessarily straightforward. Fiduciary management is a service as opposed to a product and, as with most service provision, the cost will depend on exactly what services are provided. In our experience, whilst the fiduciary management mandates we have seen have many traits in common, there are often significant differences from scheme to scheme and these differences typically have cost implications.
That being said, the cost question is entirely sensible and one we feel deserves investigation. Accordingly, to give interested parties a greater understanding of what the cost of fiduciary management could be, EY have conducted this fiduciary management fees survey.
The information in this survey is based on responses received in the third quarter of 2013 from 11 fiduciary managers who serve the UK fiduciary management market (listed below). Collectively, these 11 firms manage the significant majority of assets in the UK fiduciary management market. We would like to extend our gratitude to these firms for participating in this survey.
We hope that you find this survey useful.
Iain Brown Matthew Mignault
Partner and Head of Fiduciary Head of Fiduciary Manager Research
Management Advisory Services
March 2014
Alliance Bernstein BlackRock MN SEI
Allianz Global Investors Goldman Sachs Asset Management P-Solve Towers Watson
Aon Hewitt Mercer Russell Investments
4
© Ernst & Young LLP 2014
Components of fees
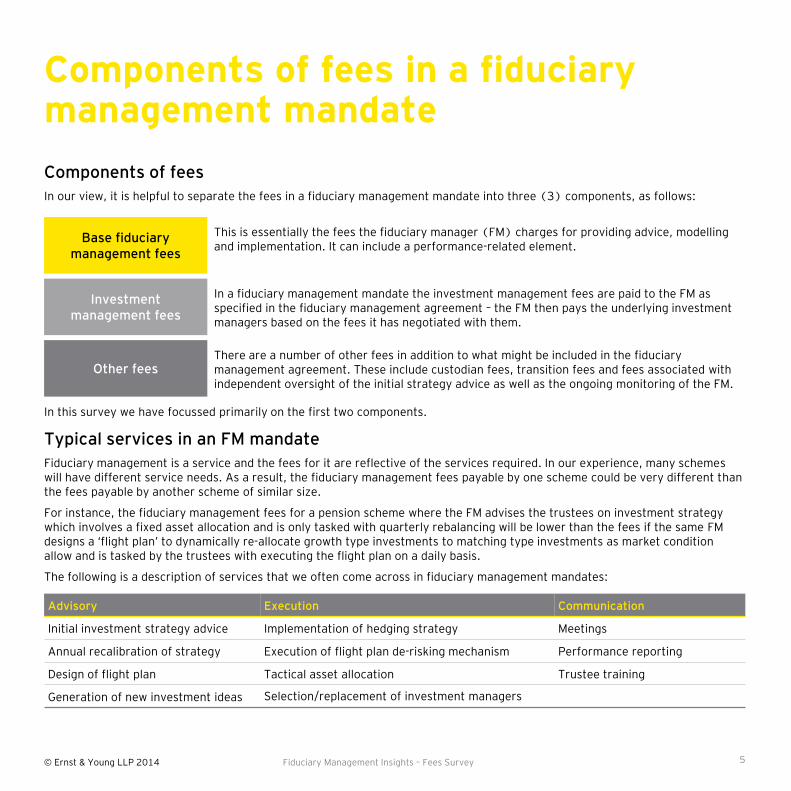
In our view, it is helpful to separate the fees in a fiduciary management mandate into three (3) components, as follows:
In this survey we have focussed primarily on the first two components.
Typical services in an FM mandate
Fiduciary management is a service and the fees for it are reflective of the services required. In our experience, many schemes will have different service needs. As a result, the fiduciary management fees payable by one scheme could be very different than the fees payable by another scheme of similar size.
For instance, the fiduciary management fees for a pension scheme where the FM advises the trustees on investment strategy which involves a fixed asset allocation and is only tasked with quarterly rebalancing will be lower than the fees if the same FM designs a ‘flight plan’ to dynamically reallocate growth type investments to matching type investments as market condition allow and is tasked by the trustees with executing the flight plan on a daily basis.
The following is a description of services that we often come across in fiduciary management mandates:
Components of fees in a fiduciary management mandate
Fiduciary Management Insights – Fees Survey
Advisory Execution Communication
Initial investment strategy advice Implementation of hedging strategy Meetings
Annual recalibration of strategy Execution of flight plan de-risking mechanism Performance reporting
Design of flight plan Tactical asset allocation Trustee training
Generation of new investment ideas Selection/replacement of investment managers
Base fiduciary management fees
Investment management fees
Other fees
This is essentially the fees the fiduciary manager (FM) charges for providing advice, modelling and implementation. It can include a performance-related element.
In a fiduciary management mandate the investment management fees are paid to the FM as specified in the fiduciary management agreement – the FM then pays the underlying investment managers based on the fees it has negotiated with them.
There are a number of other fees in addition to what might be included in the fiduciary management agreement. These include custodian fees, transition fees and fees associated with independent oversight of the initial strategy advice as well as the ongoing monitoring of the FM.
5

© Ernst & Young LLP 2014
Context for survey
Hypothetical pension schemes
To ensure the survey responses we received from the participating FMs were comparable we created 3 hypothetical pension schemes – which we have called Small (£50m), Medium (£250m) and Large (£750m) where, in all cases, the trustees require the following services from their FM:
Investment strategy – Initial investment strategy advice
Flight plan – Advice on design of a flight plan which involves gradually decreasing the scheme’s asset allocation from the current 60% growth/40% matching allocation to a target allocation of 100% to the matching portfolio as the scheme’s financial position improves
Delegated execution of investment strategy – Execution of the above flight plan with de-risking from the growth portfolio to the matching portfolio based on daily testing of the funded ratio against flight plan parameters, making tactical asset allocation decisions to over/underweight certain asset classes based on the FM’s short to mid-term views of the relative attractiveness of various asset classes and selection and replacement of underlying investment managers
Meetings – Quarterly meetings and reporting to the trustees with periodic trustee training on relevant investment issues
In our experience, this service specification would be fairly common.
Model investment portfolio
Furthermore, to ensure comparability of the fees, we specified the following initial asset mix (model portfolio) which, initially, the trustees would want to maintain:
Fiduciary Management Insights – Fees Survey
Asset class Benchmark weighting
Growth portfolio 60%
Developed market equity (active) 30%
Emerging market equity 5%
High yield debt 5%
Emerging market debt 5%
UK property 5%
Hedge funds 10%
Matching portfolio 40%
Fixed interest gilts 15%
Inflation linked gilts 15%
Investment grade corporate bonds 10%
Total 100%
Initially the trustees would not be interested in hedging the scheme’s interest rate or inflation exposures beyond physical holdings of fixed interest and inflation linked gilts.
6

© Ernst & Young LLP 2014
0.00%
0.05%
0.10%
0.15%
0.20%
0.25%
0.30%
0.35%
0.40%
Small £50m Medium £250m Large £ 750m
The base fiduciary management fees cover most of the services the FM provides. Generally, this includes the advisory services the FM provides to the trustees in connection with the investment strategy plus the execution of that investment strategy. It also includes the meetings and reports associated with the advice and execution.
Base fiduciary management fees
Fiduciary Management Insights – Fees Survey
How are the base fiduciary management fees actually charged?
The base fiduciary management fees are typically charged on a percentage of assets basis. The implication of this is that, as/if a scheme’s assets increase, the FM will receive a larger base fee (in monetary terms) and vice versa.
Figure 1 – distribution of base fiduciary management fees (bps) 1, 2
1 We note one FM who participated in our survey was excluded from the above results because the standard expression of their base fiduciary management fees was a base fee plus a performance-related fee. This meant their response was not directly comparable to the other FMs’ responses. 2 Please see the Appendix for details on interpreting box plots.
One can see from figure 1 that base fiduciary management fees, measured in basis points (bps), reduce as scheme size increases. For instance, the median fee for the Small scheme is 35bps whilst the median fee for the Large scheme is 16bps. This is what one would expect if you view fiduciary management as a service since a lot of the services required are very similar regardless of scheme size.
The distribution in figure 1 is quite interesting and highlights just how competitive the fiduciary management business is. For the Small and Medium sized schemes there were a number of FMs whose base fiduciary management fees were concentrated around the median fee – this is why the Median and 3rd quartiles (Q3) are so close together in figure 1. One can also see that for the Large scheme the distribution of fees is around a very tight range with most FMs’ base fees within 5 bps of each other.
In our experience, different FMs are focused on different segments of the market with some FMs specialising in smaller to mid-size schemes and others in the larger end of the market. This is evident in our survey results as some survey respondents indicated they would not be quote for a certain sized pension fund.
For smaller pension schemes, a number of FMs have minimum base fees (for instance, one FM has minimum base fiduciary management fees of £100,000 p.a.). However, for the smaller pension scheme that is interested in fiduciary management all is not lost – there are FMs that focus on this market segment.
Median 0.35%
Q3 0.36%
Q1 0.28%
Median 0.25%
Q3 0.26%
Q1 0.15%
Median 0.16%
Q3 0.20%
Q1 0.15%
Investment management fees
Other fees
Base fiduciary management fees
7
Large £750m
© Ernst & Young LLP 2014 Fiduciary Management Insights – Fees Survey
Performance-related fees
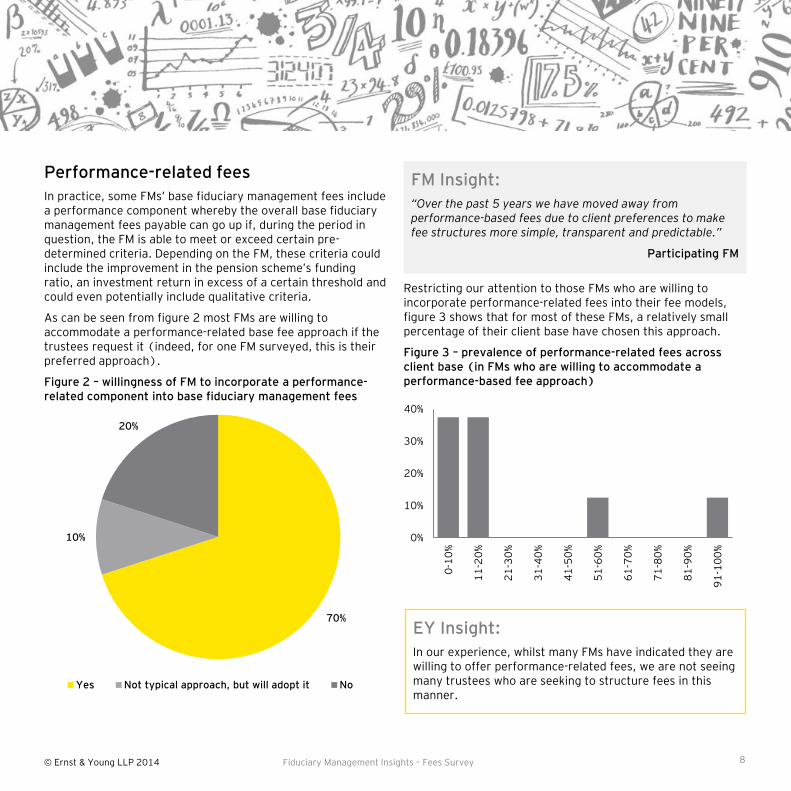
In practice, some FMs’ base fiduciary management fees include a performance component whereby the overall base fiduciary management fees payable can go up if, during the period in question, the FM is able to meet or exceed certain pre-determined criteria. Depending on the FM, these criteria could include the improvement in the pension scheme’s funding ratio, an investment return in excess of a certain threshold and could even potentially include qualitative criteria.
As can be seen from figure 2 most FMs are willing to accommodate a performance-related base fee approach if the trustees request it (indeed, for one FM surveyed, this is their preferred approach).
Figure 2 – willingness of FM to incorporate a performance-related component into base fiduciary management fees
70%
10%
20%
Yes Not typical approach, but will adopt it No
Restricting our attention to those FMs who are willing to incorporate performance-related fees into their fee models, figure 3 shows that for most of these FMs, a relatively small percentage of their client base have chosen this approach.
Figure 3 – prevalence of performance-related fees across client base (in FMs who are willing to accommodate a performance-based fee approach)
0%
10%
20%
30%
40%
0-1
0%
11
-20
%
21
-30
%
31
-40
%
41
-50
%
51
-60
%
61
-70
%
71
-80
%
81
-90
%
91
-10
0%
EY Insight:
In our experience, whilst many FMs have indicated they are willing to offer performance-related fees, we are not seeing many trustees who are seeking to structure fees in this manner.
FM Insight:
“Over the past 5 years we have moved away from performance-based fees due to client preferences to make fee structures more simple, transparent and predictable.”
Participating FM
8

© Ernst & Young LLP 2014
Base fiduciary management fees (cont’d)
Fees for interest rate/inflation hedging
Part of the standard services provided by a FM would be advice to the trustees around (partially) hedging the pension scheme’s interest rate and inflation exposures. The FMs surveyed had differing solutions to execute the resulting hedging policy.
In some cases, FMs execute hedging policies via investment in leveraged pooled LDI type funds whilst in others FMs use derivative instruments (for example: interest and inflation swaps). In the former case, the fees for this would simply be the investment management fees associated with the pooled LDI funds whilst in the latter case the FM would charge explicit fees to set up and manage these derivative instruments.
Other fiduciary management fees (not covered in the base fee)
For most pension schemes, the base fiduciary management fees include almost all of the services the trustees will require (for example: strategy advice, asset/liability studies, execution of investment strategy and reporting). This means that, apart from investment management fees, for an agreed upon level of investment delegation, trustees should not expect to incur any additional fees. As shown in figure 4, the main exception to this is at the outset of the fiduciary management relationship where some FMs will charge transition management fees to transition the assets from existing arrangements. In some cases, the transition management fee only applies when an external transition management firm is used.
Figure 4 – does the base fiduciary management fee include:
Whilst we have not explicitly considered custodial fees in this survey we note that most FMs will have custodial fees associated with their funds (although many FMs are willing to work with a trustees’ preferred custodian).
Fiduciary Management Insights – Fees Survey
0%
10%
20%
30%
40%
50%
60%
70%
80%
90%
100%
Initial advice Regular asset/liability
studies
Transition manager fees
Yes No n/a
Investment management fees
Other fees
Base fiduciary management fees
9
© Ernst & Young LLP 2014
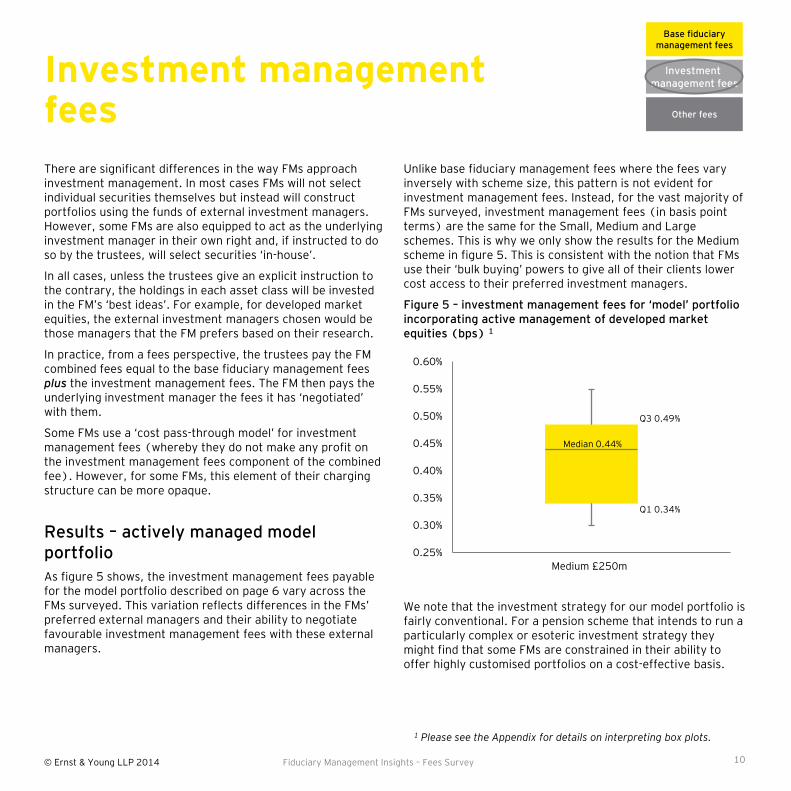
Unlike base fiduciary management fees where the fees vary inversely with scheme size, this pattern is not evident for investment management fees. Instead, for the vast majority of FMs surveyed, investment management fees (in basis point terms) are the same for the Small, Medium and Large schemes. This is why we only show the results for the Medium scheme in figure 5. This is consistent with the notion that FMs use their ‘bulk buying’ powers to give all of their clients lower cost access to their preferred investment managers.
Figure 5 – investment management fees for ‘model’ portfolio incorporating active management of developed market equities (bps) 1
We note that the investment strategy for our model portfolio is fairly conventional. For a pension scheme that intends to run a particularly complex or esoteric investment strategy they might find that some FMs are constrained in their ability to offer highly customised portfolios on a cost-effective basis.
0.25%
0.30%
0.35%
0.40%
0.45%
0.50%
0.55%
0.60%
Scheme A (N=8) Medium £250m
Investment management fees
There are significant differences in the way FMs approach investment management. In most cases FMs will not select individual securities themselves but instead will construct portfolios using the funds of external investment managers. However, some FMs are also equipped to act as the underlying investment manager in their own right and, if instructed to do so by the trustees, will select securities ‘in-house’.
In all cases, unless the trustees give an explicit instruction to the contrary, the holdings in each asset class will be invested in the FM’s ‘best ideas’. For example, for developed market equities, the external investment managers chosen would be those managers that the FM prefers based on their research.
In practice, from a fees perspective, the trustees pay the FM combined fees equal to the base fiduciary management fees plus the investment management fees. The FM then pays the underlying investment manager the fees it has ‘negotiated’ with them.
Some FMs use a ‘cost pass-through model’ for investment management fees (whereby they do not make any profit on the investment management fees component of the combined fee). However, for some FMs, this element of their charging structure can be more opaque.
Results – actively managed model portfolio
As figure 5 shows, the investment management fees payable for the model portfolio described on page 6 vary across the FMs surveyed. This variation reflects differences in the FMs’ preferred external managers and their ability to negotiate favourable investment management fees with these external managers.
Fiduciary Management Insights – Fees Survey
Median 0.44%
Q3 0.49%
Q1 0.34%
Investment management fees
Other fees
Base fiduciary management fees
10
1 Please see the Appendix for details on interpreting box plots.
© Ernst & Young LLP 2014
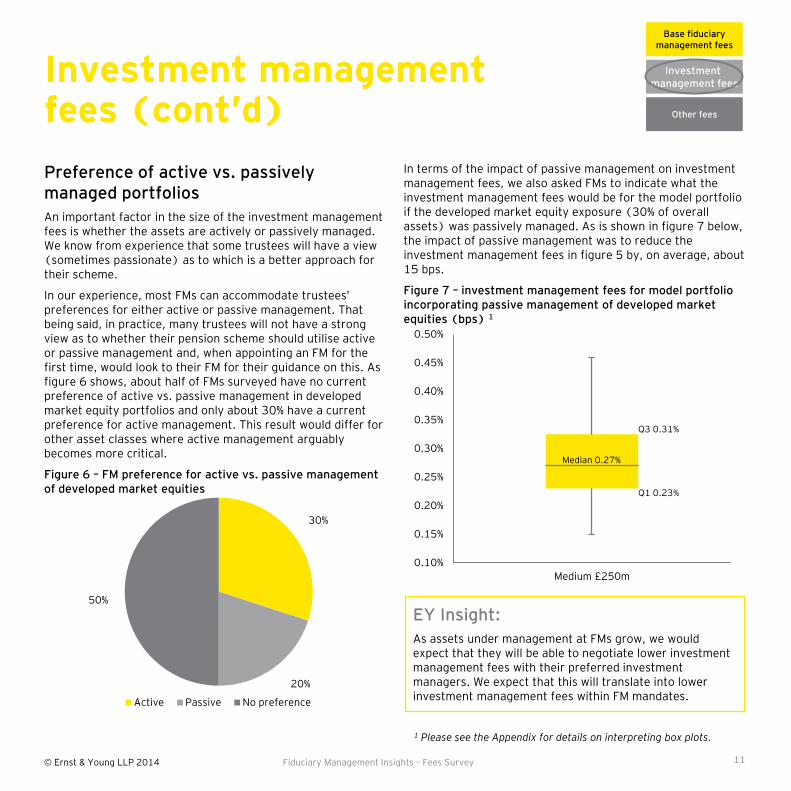
In terms of the impact of passive management on investment management fees, we also asked FMs to indicate what the investment management fees would be for the model portfolio if the developed market equity exposure (30% of overall assets) was passively managed. As is shown in figure 7 below, the impact of passive management was to reduce the investment management fees in figure 5 by, on average, about 15 bps.
Figure 7 – investment management fees for model portfolio incorporating passive management of developed market equities (bps) 1
0.10%
0.15%
0.20%
0.25%
0.30%
0.35%
0.40%
0.45%
0.50%
Medium £250m
30%
20%
50%
Active Passive No preference
Investment management fees (cont’d)
Preference of active vs. passively managed portfolios
An important factor in the size of the investment management fees is whether the assets are actively or passively managed. We know from experience that some trustees will have a view (sometimes passionate) as to which is a better approach for their scheme.
In our experience, most FMs can accommodate trustees’ preferences for either active or passive management. That being said, in practice, many trustees will not have a strong view as to whether their pension scheme should utilise active or passive management and, when appointing an FM for the first time, would look to their FM for their guidance on this. As figure 6 shows, about half of FMs surveyed have no current preference of active vs. passive management in developed market equity portfolios and only about 30% have a current preference for active management. This result would differ for other asset classes where active management arguably becomes more critical.
Figure 6 – FM preference for active vs. passive management of developed market equities
Fiduciary Management Insights – Fees Survey
Median 0.27%
Q3 0.31%
Q1 0.23%
EY Insight:
As assets under management at FMs grow, we would expect that they will be able to negotiate lower investment management fees with their preferred investment managers. We expect that this will translate into lower investment management fees within FM mandates.
Investment management fees
Other fees
Base fiduciary management fees
11
1 Please see the Appendix for details on interpreting box plots.
© Ernst & Young LLP 2014
0.20%
0.25%
0.30%
0.35%
0.40%
0.45%
0.50%
0.55%
0.60%
0.65%
0.70%
Small £50m Medium £250m Large £ 750m
Base fiduciary management fees plus investment management fees
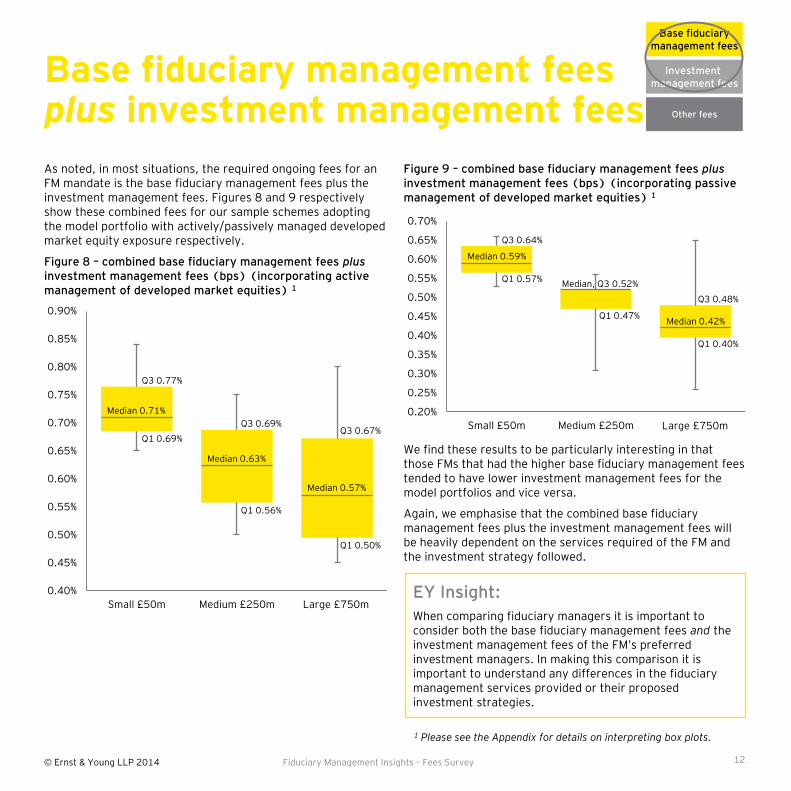
As noted, in most situations, the required ongoing fees for an FM mandate is the base fiduciary management fees plus the investment management fees. Figures 8 and 9 respectively show these combined fees for our sample schemes adopting the model portfolio with actively/passively managed developed market equity exposure respectively.
Figure 8 – combined base fiduciary management fees plus investment management fees (bps) (incorporating active management of developed market equities) 1
Figure 9 – combined base fiduciary management fees plus investment management fees (bps) (incorporating passive management of developed market equities) 1
Fiduciary Management Insights – Fees Survey
Median 0.59%
Q3 0.64%
Q1 0.57% Median, Q3 0.52%
Q1 0.47% Median 0.42%
Q3 0.48%
Q1 0.40%
We find these results to be particularly interesting in that those FMs that had the higher base fiduciary management fees tended to have lower investment management fees for the model portfolios and vice versa.
Again, we emphasise that the combined base fiduciary management fees plus the investment management fees will be heavily dependent on the services required of the FM and the investment strategy followed.
EY Insight:
When comparing fiduciary managers it is important to consider both the base fiduciary management fees and the investment management fees of the FM’s preferred investment managers. In making this comparison it is important to understand any differences in the fiduciary management services provided or their proposed investment strategies.
Investment management fees
Other fees
Base fiduciary management fees
0.40%
0.45%
0.50%
0.55%
0.60%
0.65%
0.70%
0.75%
0.80%
0.85%
0.90%
Small £50m Medium £250m Large £ 750m
Median 0.71%
Q3 0.77%
Q1 0.69%
Median 0.63%
Q3 0.69%
Q1 0.56%
Median 0.57%
Q3 0.67%
Q1 0.50%
12
Large £750m
Large £750m
1 Please see the Appendix for details on interpreting box plots.
© Ernst & Young LLP 2014
Other fees
In a fiduciary management mandate, the trustees may require the support from a third party advisor in certain areas. This support is entirely optional but, especially in relation to reviews of an FM’s performance, is becoming ‘best practice’.
Independent oversight of the FM’s initial strategy advice
When an FM is first appointed, one of the earliest activities is typically a wholesale review of the existing investment strategy. This is a critical phase in the relationship as it will heavily influence the results that follow. In our experience, in some cases, trustees will seek advice from an independent third party to give them greater comfort that the FM’s initial strategy advice is both practical and robust, fits with the trustees’ objectives and is accurately reflected in the fiduciary management agreement.
Independent third party monitoring of the FM’s performance
In a fiduciary management mandate the FM will have the delegated authority to make a number of investment decisions. For instance, it is common for trustees to delegate authority to the FM to make decisions in the following areas:
► Selection and replacement of external investment managers
► Tactical asset allocation
► Tactical decisions in connection with hedging of interest/inflation exposures
The decisions the FM makes in the above areas will have an impact on the scheme’s funded position and risk levels.
Many trustees are turning to an independent third party advisor to help them monitor the FM’s performance in these areas – ultimately to help them form a view as to whether the
FM is providing value for money. Other quantitative metrics such as control of risk and competitiveness of fees are also considered as part of these reviews. Increasingly, we are finding that reviews of an FM’s performance also take into account qualitative criteria (for example: service levels, quality of reporting).
These performance reviews are analogous to the investment performance reviews that are established best practice in traditional investment structures.
Fiduciary Management Insights – Fees Survey
EY Insight:
Periodic reviews of the FM’s performance, whilst optional, are quickly becoming recognised as a ‘best practice’ governance activity. The exact form and content of these reviews will vary but the central theme is that they help trustees form a considered view of whether the FM is providing value for money and not taking undue risks from either an investment or operational perspective.
Investment management fees
Other fees
Base fiduciary management fees
13

© Ernst & Young LLP 2014
Matthew Mignault Senior Manager
Tel: +44 20 7951 7630 Mobile: +44 7827 257 370 Email: [email protected]
Vicky Paramour Senior Manager
Tel: +44 20 7951 1458 Mobile: +44 7789 030 921 Email: [email protected]
Against the backdrop of an ever-developing fiduciary management market and varied solutions, obtaining independent help can be very beneficial. EY is able to help trustees and sponsors in:
► Identifying the right investment governance solution
► Running a fiduciary management selection exercise
For further information, please visit www.ey.com/fiduciarymanagement or contact:
Getting help
Fiduciary Management Insights – Fees Survey
Sean Bottomley Director
Tel: +44 113 298 2327 Mobile: +44 7740 923 265 Email: [email protected]
Christopher Bown Director
Tel: +44 20 7951 3231 Mobile: +44 7730 733 861 Email: [email protected]
Iain Brown Partner
Tel: +44 20 7951 7546 Mobile: +44 7977 023 389 Email: [email protected]
Adam Poulson Senior Manager
Tel: +44 113 298 2424 Mobile: +44 7876 397 927 Email: [email protected]
Philip Wheeler Senior Manager
Tel: +44 141 226 9557 Mobile: +44 7786 313 701 Email: [email protected]
Tony Martinez Manager
Tel: +44 20 7951 2241 Mobile: +44 7920 822 527 Email: [email protected]
► Assisting with the initial appointment of a fiduciary manager
► Monitoring a fiduciary manager’s performance
Rob Heaton Senior Manager
Tel: +44 113 298 2519 Mobile: +44 7767 494 887 Email: [email protected]
14

© Ernst & Young LLP 2014
We have used several box plots throughout this document to illustrate the spread of survey responses. In particular, the box plots show at a glance the range of the middle 50% of responses. The example below explains how to interpret the graphs.
Example – investment management fees for ‘model’ portfolio incorporating active management of developed market equities (bps)
Appendix: how to read a box plot
Fiduciary Management Insights – Fees Survey 15
0.25%
0.30%
0.35%
0.40%
0.45%
0.50%
0.55%
0.60%
Scheme A (N=8) Medium £250m
Median 0.44%
Q3 0.49%
Q1 0.34%
This line represents the 75th percentile and is labelled ‘Q3”
This line represents the median, i.e. the 50th percentile
This line represents the 25th percentile and is labelled ‘Q1”
This is the minimum value observed
The highest 25% of values are above 0.49% pa
The middle 50% of values are between 0.34% pa and 0.49% pa, i.e. between Q1 and Q3
The lowest 25% of values are below 0.34% pa
This is the maximum value observed

© Ernst & Young LLP 2014
Notes
Fiduciary Management Insights – Fees Survey 16

EY | Assurance | Tax | Transactions | Advisory
About EY EY is a global leader in assurance, tax, transaction and advisory services. The insights and quality services we deliver help build trust and confidence in the capital markets and in economies the world over. We develop outstanding leaders who team to deliver on our promises to all of our stakeholders. In so doing, we play a critical role in building a better working world for our people, for our clients and for our communities.
EY refers to the global organization and may refer to one or more of the member firms of Ernst & Young Global Limited, each of which is a separate legal entity. Ernst & Young Global Limited, a UK company limited by guarantee, does not provide services to clients. For more information about our organization, please visit ey.com.
Ernst & Young LLP
The UK firm Ernst & Young LLP is a limited liability partnership registered in England and Wales with registered number OC300001 and is a member firm of Ernst & Young Global Limited.
Ernst & Young LLP, 1 More London Place, London, SE1 2AF.
© 2014 Ernst & Young LLP. Published in the UK. All Rights Reserved.
ED None
1480667(UK) 03/14. Creative Services Group.
In line with EY’s commitment to minimise its impact on the environment, this document has been printed on paper with a high recycled content.
ey.com/uk


